5.2. Ablation Study of ARV-MOBWO
ARV-MOBWO augments MOBWO with multi-operator candidate generation and reference vector-based selection mechanisms. To quantify the contribution of each component, variants were created by removing one mechanism at a time under identical experimental settings. HV, IGD, GD, and spacing were compared, as summarized in
Table 6. AOS denotes adaptive operator selection,
pDE denotes current-to-
pbest differential evolution, ARR denotes archive-reference recombination, RVAT denotes reference vector archive truncation, and RVES denotes reference vector environmental selection.
Removing ARR decreased HV by 0.306% and worsened IGD and GD by 26.473% and 84.35%, respectively, with degradation across all four metrics. ARR is therefore the key mechanism for improving front approximation. Removing AOS increased GD by 44.96%, indicating that fixed operator proportions cannot adapt effectively to different task categories and search stages. Removing reference vector archive truncation or environmental selection improved spacing but worsened GD by 40.09% and 27.30%, respectively, revealing a trade-off between geometric uniformity and front-approximation accuracy.
The mechanisms make distinct contributions to ARV-MOBWO. ARR has the strongest effect on overall performance because its removal degrades HV, IGD, GD, and spacing simultaneously. AOS mainly improves adaptability and search stability. Although pDE does not increase HV in isolation, it improves IGD, GD, and spacing, thereby supporting local exploitation and solution-set regularity. RVAT and RVES expose a trade-off between distribution uniformity and front proximity: their removal yields smaller spacing but substantially poorer GD. Thus, uniform distribution alone does not guarantee accurate approximation of the Pareto front. Because all ablation variants use the same surrogate models, population size, evaluation budget, and experimental tasks, this analysis isolates the incremental effects of the mechanisms added to the underlying MOBWO framework. The results indicate that ARR, AOS, pDE, RVAT, and RVES contribute differently to front approximation, convergence, and distribution quality under the present fixed-surrogate setting. These ablation results, rather than the cross-algorithm comparison alone, provide the primary evidence for the algorithmic contribution of ARV-MOBWO relative to standard MOBWO.
5.3. Comparison with Multi-Objective Optimizers
ARV-MOBWO, standard MOBWO [
27], NSGA-II [
22], and MOPSO [
23] were compared on the 20 blind-test tasks under identical surrogate models and evaluation budgets. Each algorithm was independently executed using five random seeds, giving 100 matched task–seed observations per algorithm. The mean performance values are summarized in
Table 7, while
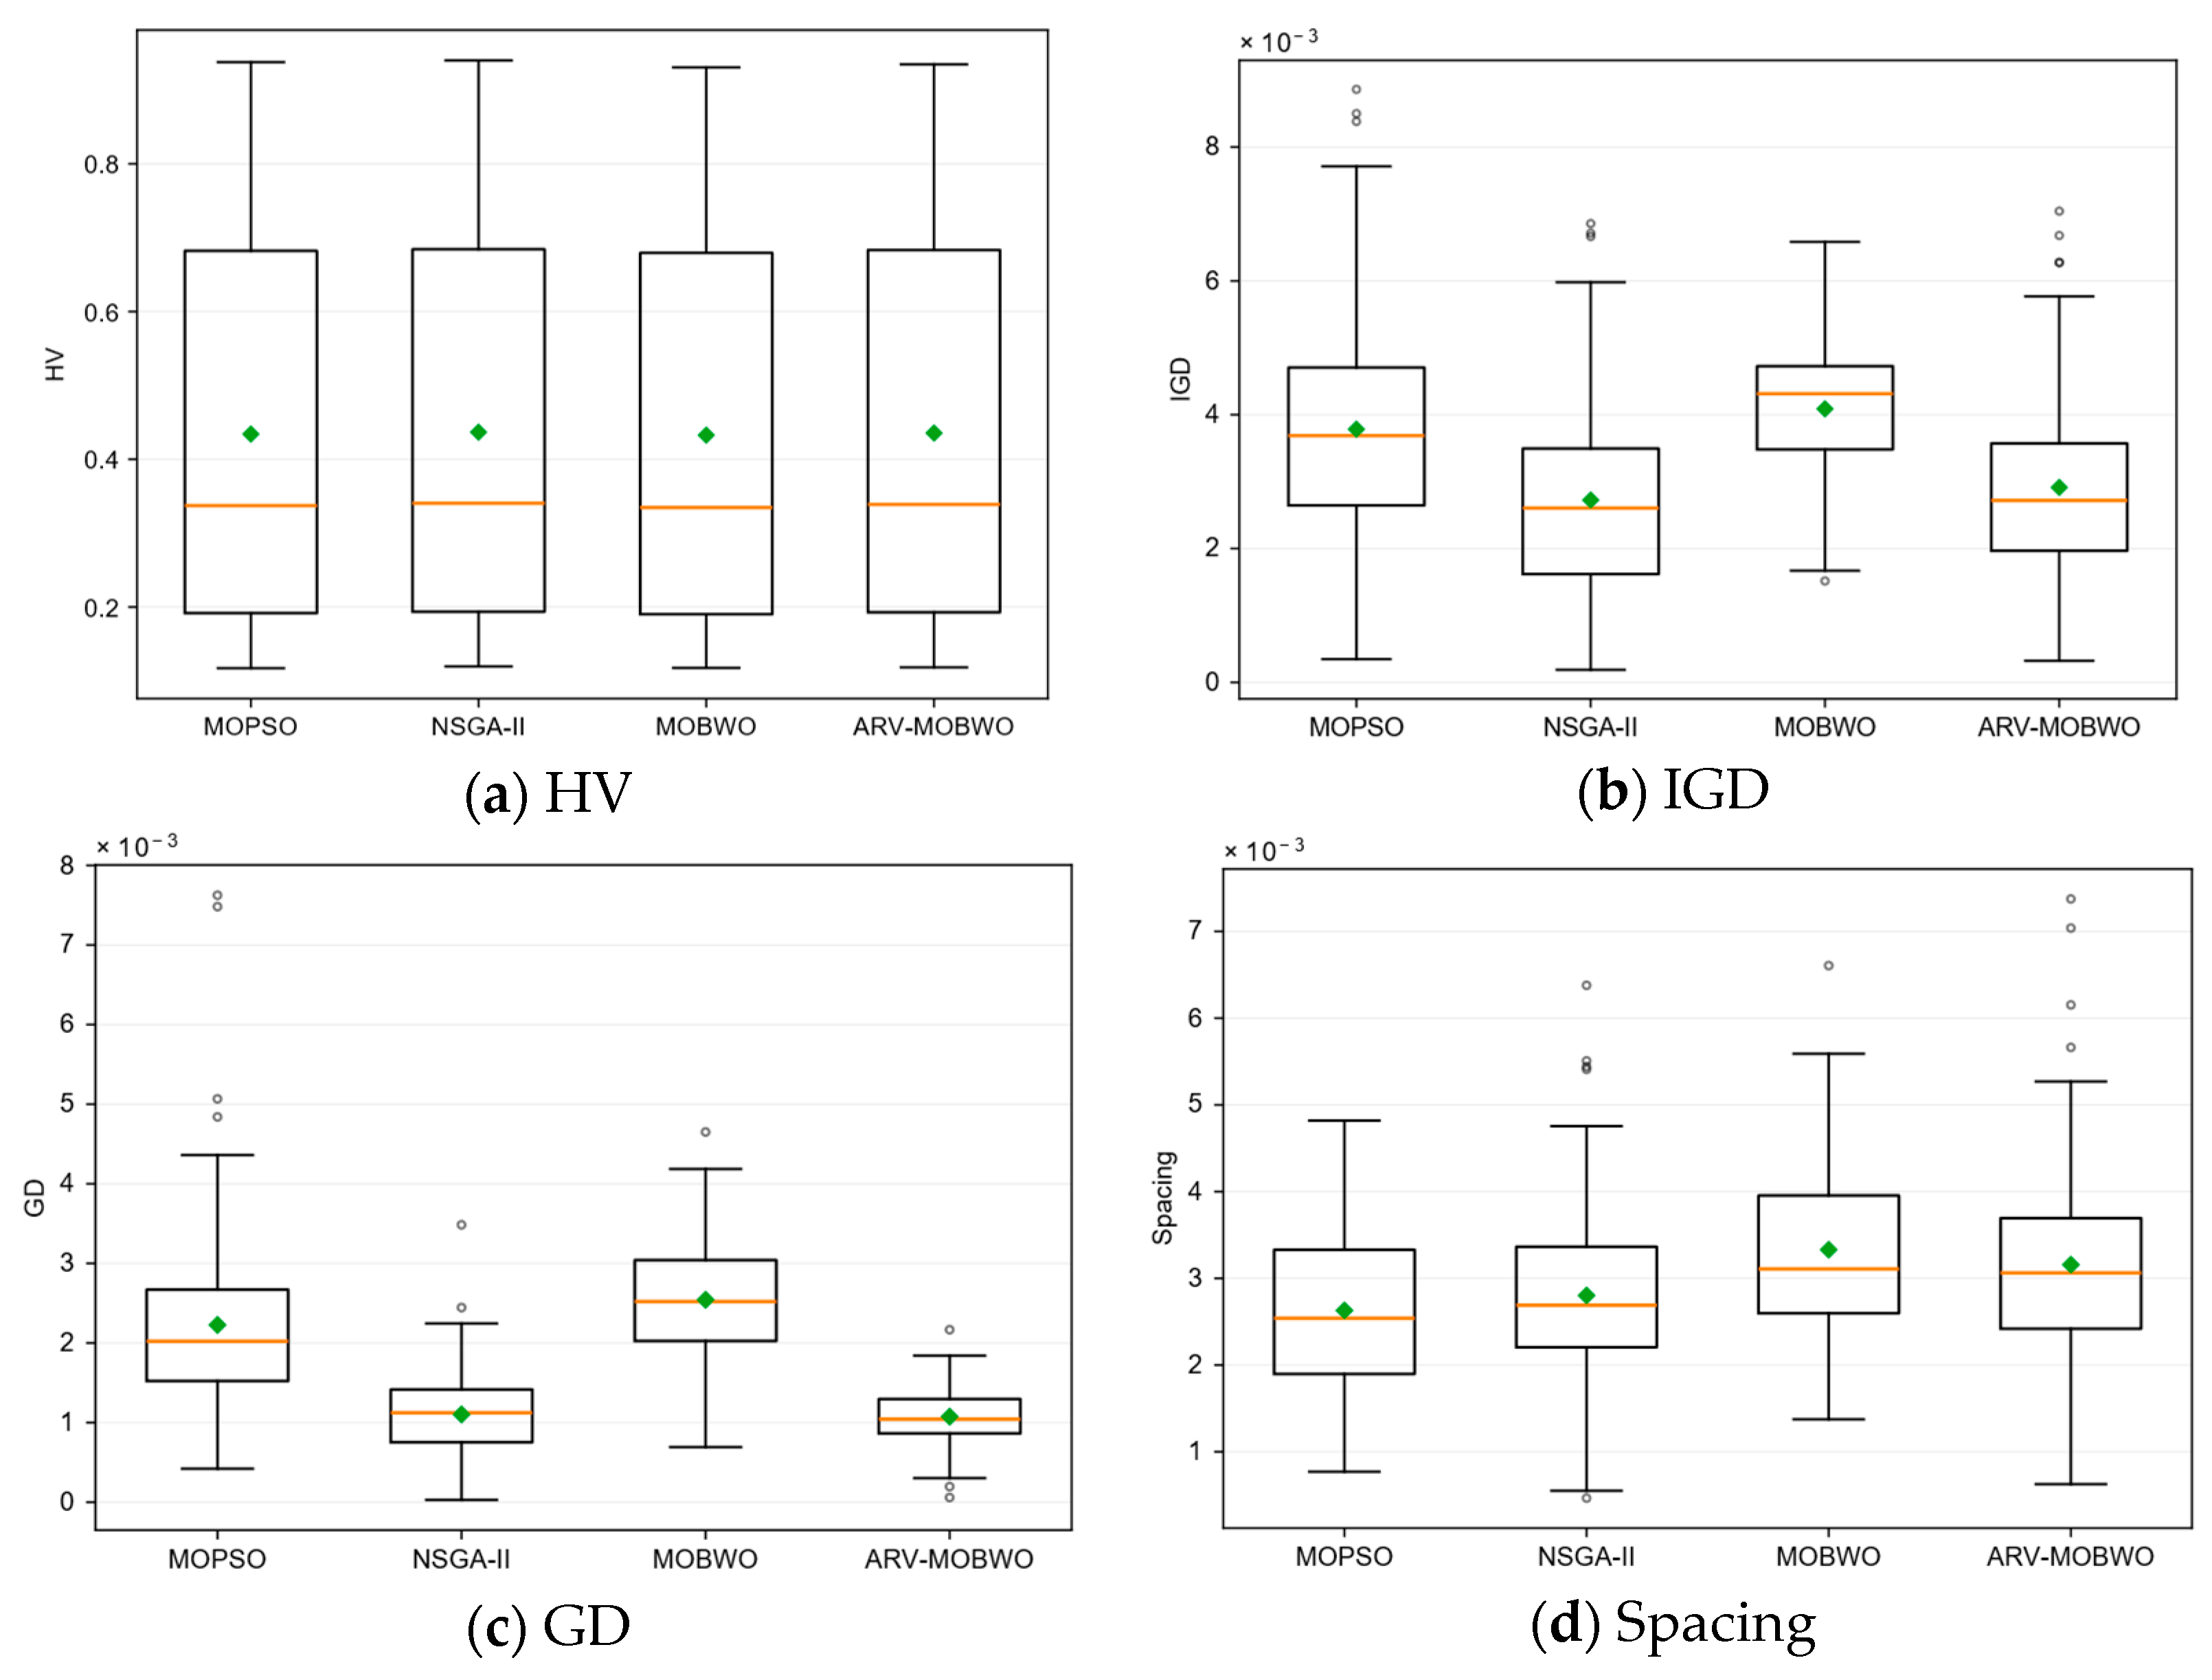
Figure 6 presents the corresponding distributions using boxplots. As described in
Section 5.1, statistical conclusions are based on paired Wilcoxon signed-rank tests with Holm correction rather than on the mean values alone.
Under the common fixed-surrogate setting, ARV-MOBWO obtained better mean HV, IGD, and GD values than MOPSO. Relative to MOPSO, its mean HV increased by 0.310%, while its mean IGD and GD decreased by 22.99% and 51.78%, respectively. The paired Wilcoxon signed-rank tests with Holm correction confirmed statistically significant differences for HV (), IGD (), and GD (). In contrast, MOPSO achieved a smaller spacing value, and the corresponding difference also favored MOPSO significantly (). The comparison therefore indicates different strengths in convergence and distribution quality rather than uniform superiority of ARV-MOBWO across all indicators.
Compared with standard MOBWO, ARV-MOBWO achieved better mean values for HV, IGD, GD, and spacing, and a substantially better mean overall rank (2.359 versus 3.974). These descriptive results are consistent with the ablation study in
Section 5.2, which more directly isolates the incremental contributions of the mechanisms introduced into the underlying MOBWO framework. Accordingly, the improvement over standard MOBWO is interpreted primarily through the controlled ablation evidence rather than through the cross-algorithm mean comparison alone.
ARV-MOBWO did not outperform NSGA-II overall in the surrogate objective space. NSGA-II achieved a larger mean HV (0.436677 versus 0.435418), a smaller mean IGD (0.002724 versus 0.002914), a smaller mean spacing (0.002803 versus 0.003157), and the best mean overall rank of 1.821. The Holm-adjusted pairwise tests favored NSGA-II for HV (), IGD (), and spacing (). ARV-MOBWO obtained a slightly smaller mean GD than NSGA-II (0.001074 versus 0.001102), but this difference was not statistically significant (). Therefore, the small numerical difference in GD should not be interpreted as a practically or statistically meaningful superiority over NSGA-II.
The distributional information in
Figure 6 further complements the mean values in
Table 7. The boxes and whiskers show that the quality metrics vary across blind tasks and random seeds, making it inappropriate to infer algorithmic superiority from small differences between the reported means alone. The boxplots are therefore interpreted together with the paired statistical tests. In particular, the overlap between algorithm distributions reinforces the need to distinguish statistically supported differences from descriptive mean trends.
Taken together, NSGA-II provides the strongest overall surrogate-space performance among the four algorithms, particularly in front coverage and distribution quality, whereas ARV-MOBWO ranks second overall and shows competitive convergence behavior. The purpose of the comparison is therefore not to establish ARV-MOBWO as a universally superior multi-objective optimizer. Rather, it evaluates the behavior of different outer-search algorithms on the same offline-trained and frozen surrogate landscape. The incremental algorithmic contribution of ARV-MOBWO relative to standard MOBWO is supported mainly by the ablation study, while the ability of surrogate-generated candidates to transfer to the high-fidelity trajectory space is evaluated separately in
Section 5.4.
Moreover, because the surrogate models remain fixed throughout the search for all four algorithms, the present experiment compares outer multi-objective optimizers under identical approximate objective information; it does not constitute a benchmark against complete adaptive surrogate-assisted evolutionary algorithms that iteratively acquire new high-fidelity samples and update their surrogate models during optimization.
5.4. High-Fidelity Trajectory Verification and Verification-Budget Analysis
To determine whether surrogate candidates can be converted into physically feasible coordinated mechanism–trajectory solutions, the median-HV run was selected for each task and algorithm. Five representative candidates were then sampled from each nondominated archive. The initial and goal IK configurations were recomputed, the internal B-spline control points and trajectory duration were re-optimized using SLSQP, and all constraints were verified. In total, 400 high-fidelity trajectory verifications were performed, of which 392 candidates were feasible, giving an overall feasibility rate of 98%. The feasibility rates of ARV-MOBWO, MOPSO, NSGA-II, and standard MOBWO were 98%, 100%, 96%, and 98%, respectively. Most failures occurred in box obstacle tasks.
Because the high-fidelity verification records retain both the surrogate-predicted objective values and the corresponding values obtained after renewed trajectory optimization, they also provide a direct assessment of surrogate-to-high-fidelity transfer error on the blind-task candidate set. The aggregate prediction errors obtained from the archived verification records are summarized in
Table 8. These errors are distinct from the sample-level cross-validation errors in
Section 3.2 because they are evaluated on candidates generated during the downstream blind-task optimization experiments and subsequently recomputed using the full trajectory optimizer.
The blind-task verification errors follow the same qualitative pattern as the cross-validation results: Cartesian path length is the most stable objective, whereas jerk is more difficult to predict because it is highly sensitive to local trajectory shape and high-order derivatives. The minimum-clearance MAE is approximately 4.8 mm in the high-fidelity verification records. Although this is slightly smaller than the 5.3 mm sample-level cross-validation MAE, it remains substantial relative to the 20 mm hard clearance requirement. Consequently, neither value is interpreted as sufficient for direct safety certification. The surrogate provides an inexpensive approximate ranking of candidate mechanisms, while the renewed trajectory optimization and geometric collision verification determine final feasibility.
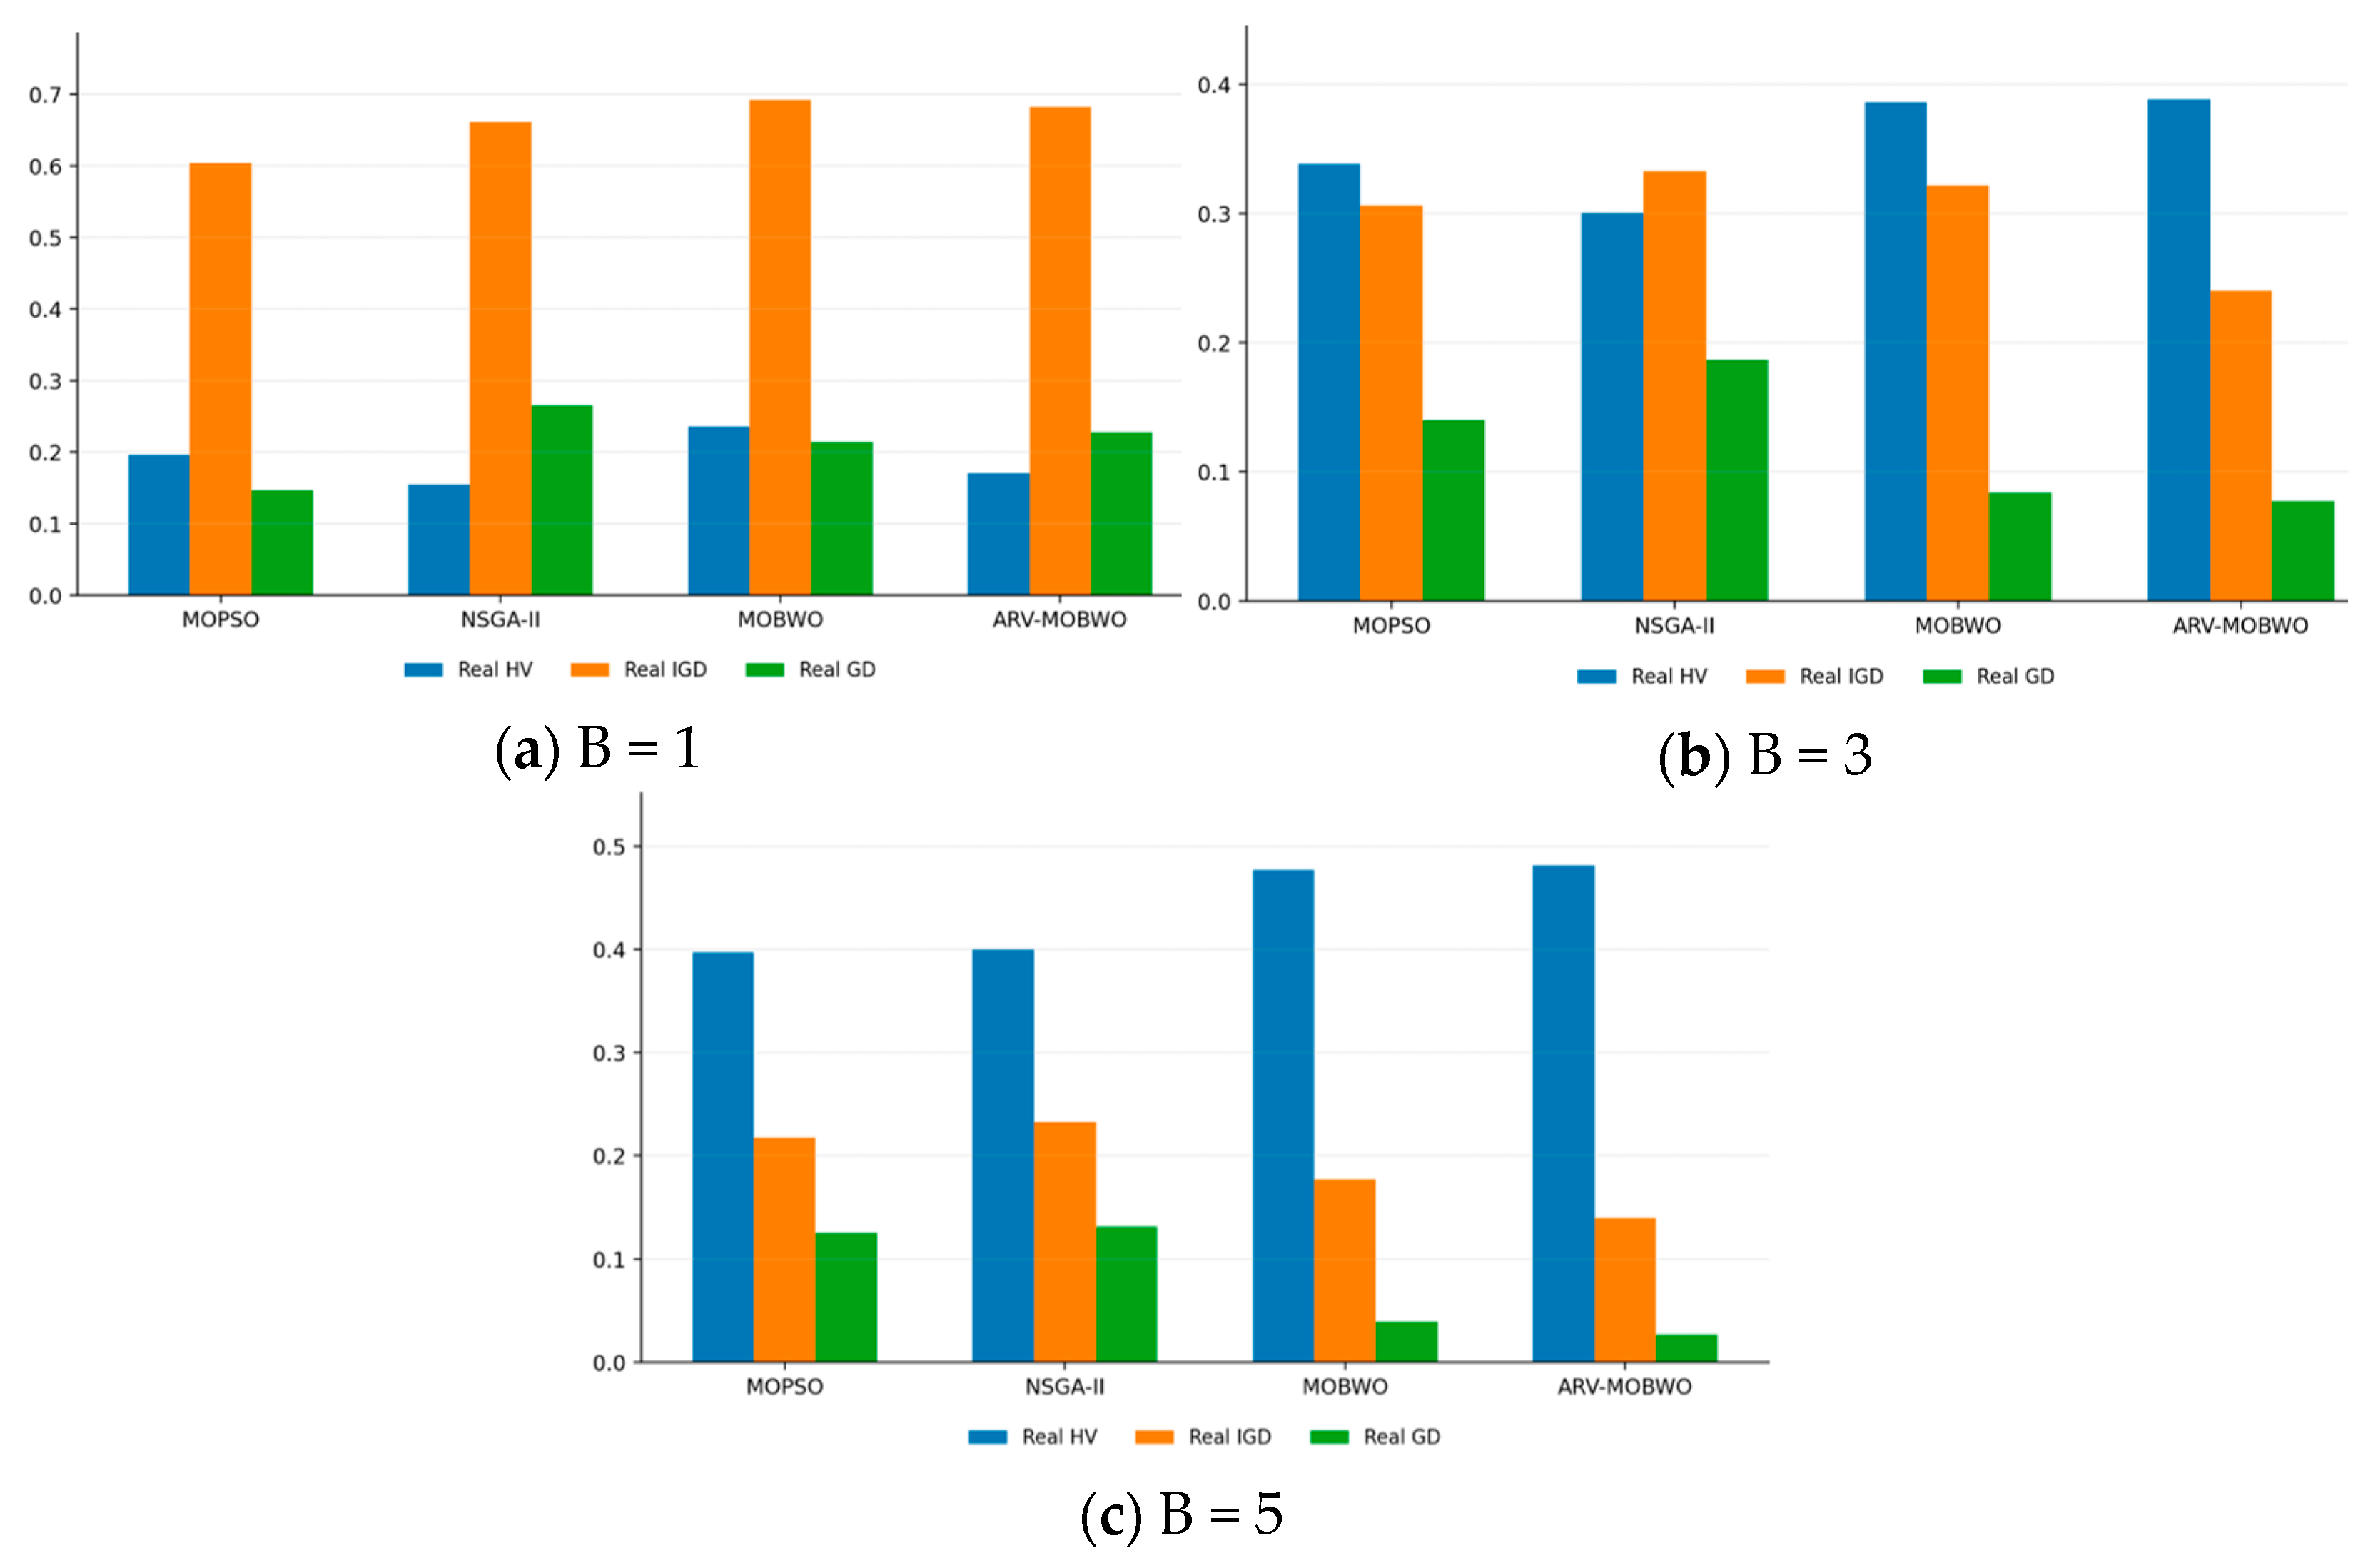
The high-fidelity front quality under different verification budgets is presented in
Table 9 and
Figure 7.
To assess whether the differences observed in the high-fidelity objective space were statistically supported, the matched blind-task results were further analyzed using the nonparametric procedure defined in
Section 5.1. The results are summarized in
Table 10.
The Friedman tests did not detect statistically significant overall differences among the four algorithms for any of the high-fidelity quality metrics. Likewise, none of the pairwise comparisons involving ARV-MOBWO remained significant after Holm correction. Notably, although the uncorrected ARV-MOBWO–MOPSO HV comparison yielded p = 0.0441, the Holm-adjusted value increased to . The high-fidelity differences reported below are therefore interpreted as descriptive mean trends rather than statistically demonstrated superiority.
As the number of high-fidelity candidates verified per task and algorithm increased from B = 1 to B = 5, the real-objective HV generally increased, whereas the real-objective IGD and GD generally decreased for all four algorithms. Verifying more candidates expands the high-fidelity feasible nondominated set, covers a larger number of objective trade-off directions, and improves both proximity to and coverage of the empirical reference Pareto front.
At B = 1, only the top-ranked candidate from each task-algorithm combination was re-optimized and verified. The result therefore reflects the high-fidelity transferability of a single preferred surrogate candidate and is sensitive to ranking error and surrogate bias. Standard MOBWO achieved the largest real-objective HV, whereas MOPSO achieved the smallest real-objective IGD and GD. ARV-MOBWO was not the best on any of the three metrics, indicating that its archive-level advantage cannot be observed reliably when only one candidate is verified.
At B = 3, ARV-MOBWO obtained the largest mean real-objective HV and the smallest mean real-objective IGD and GD among the four algorithms under the present verification protocol. Its mean HV was close to that of standard MOBWO, whereas its mean IGD and GD were lower than those of MOPSO and NSGA-II. These results indicate a favorable mean high-fidelity transfer trend when three candidates per task are verified; they are not interpreted as evidence of statistically established superiority over the other algorithms.
At B = 5, ARV-MOBWO again obtained the largest mean real-objective HV and the smallest mean real-objective IGD and GD under the present protocol, with standard MOBWO showing the next closest mean performance. This result suggests that the ARV-MOBWO surrogate archive contains multiple candidates with favorable high-fidelity transfer characteristics. However, the observed differences are descriptive mean trends for the present test set and verification budget and should not be generalized as statistical or universal superiority.
Overall, ARV-MOBWO showed no clear advantage under the extremely small verification budget B = 1. At B = 3 and B = 5, it exhibited favorable mean HV, IGD, and GD values after high-fidelity re-optimization. These observations indicate that, for the present test set, the surrogate archive generated by ARV-MOBWO contains several candidates that transfer effectively to the high-fidelity trajectory space when a moderate verification budget is available. They should be interpreted as problem-specific transferability evidence rather than as proof that ARV-MOBWO is generally superior to NSGA-II, MOPSO, MOBWO, or established surrogate-assisted expensive optimization algorithms.
This high-fidelity result should be distinguished from the surrogate-space comparison in
Section 5.3. It does not imply that ARV-MOBWO is generally superior to NSGA-II as a multi-objective optimizer; rather, it indicates that the candidate set generated by ARV-MOBWO exhibited favorable high-fidelity transferability under the specific verification protocol and budgets considered in this study.
5.5. Coordinated Optimization for a Cylindrical Obstacle Handling Task
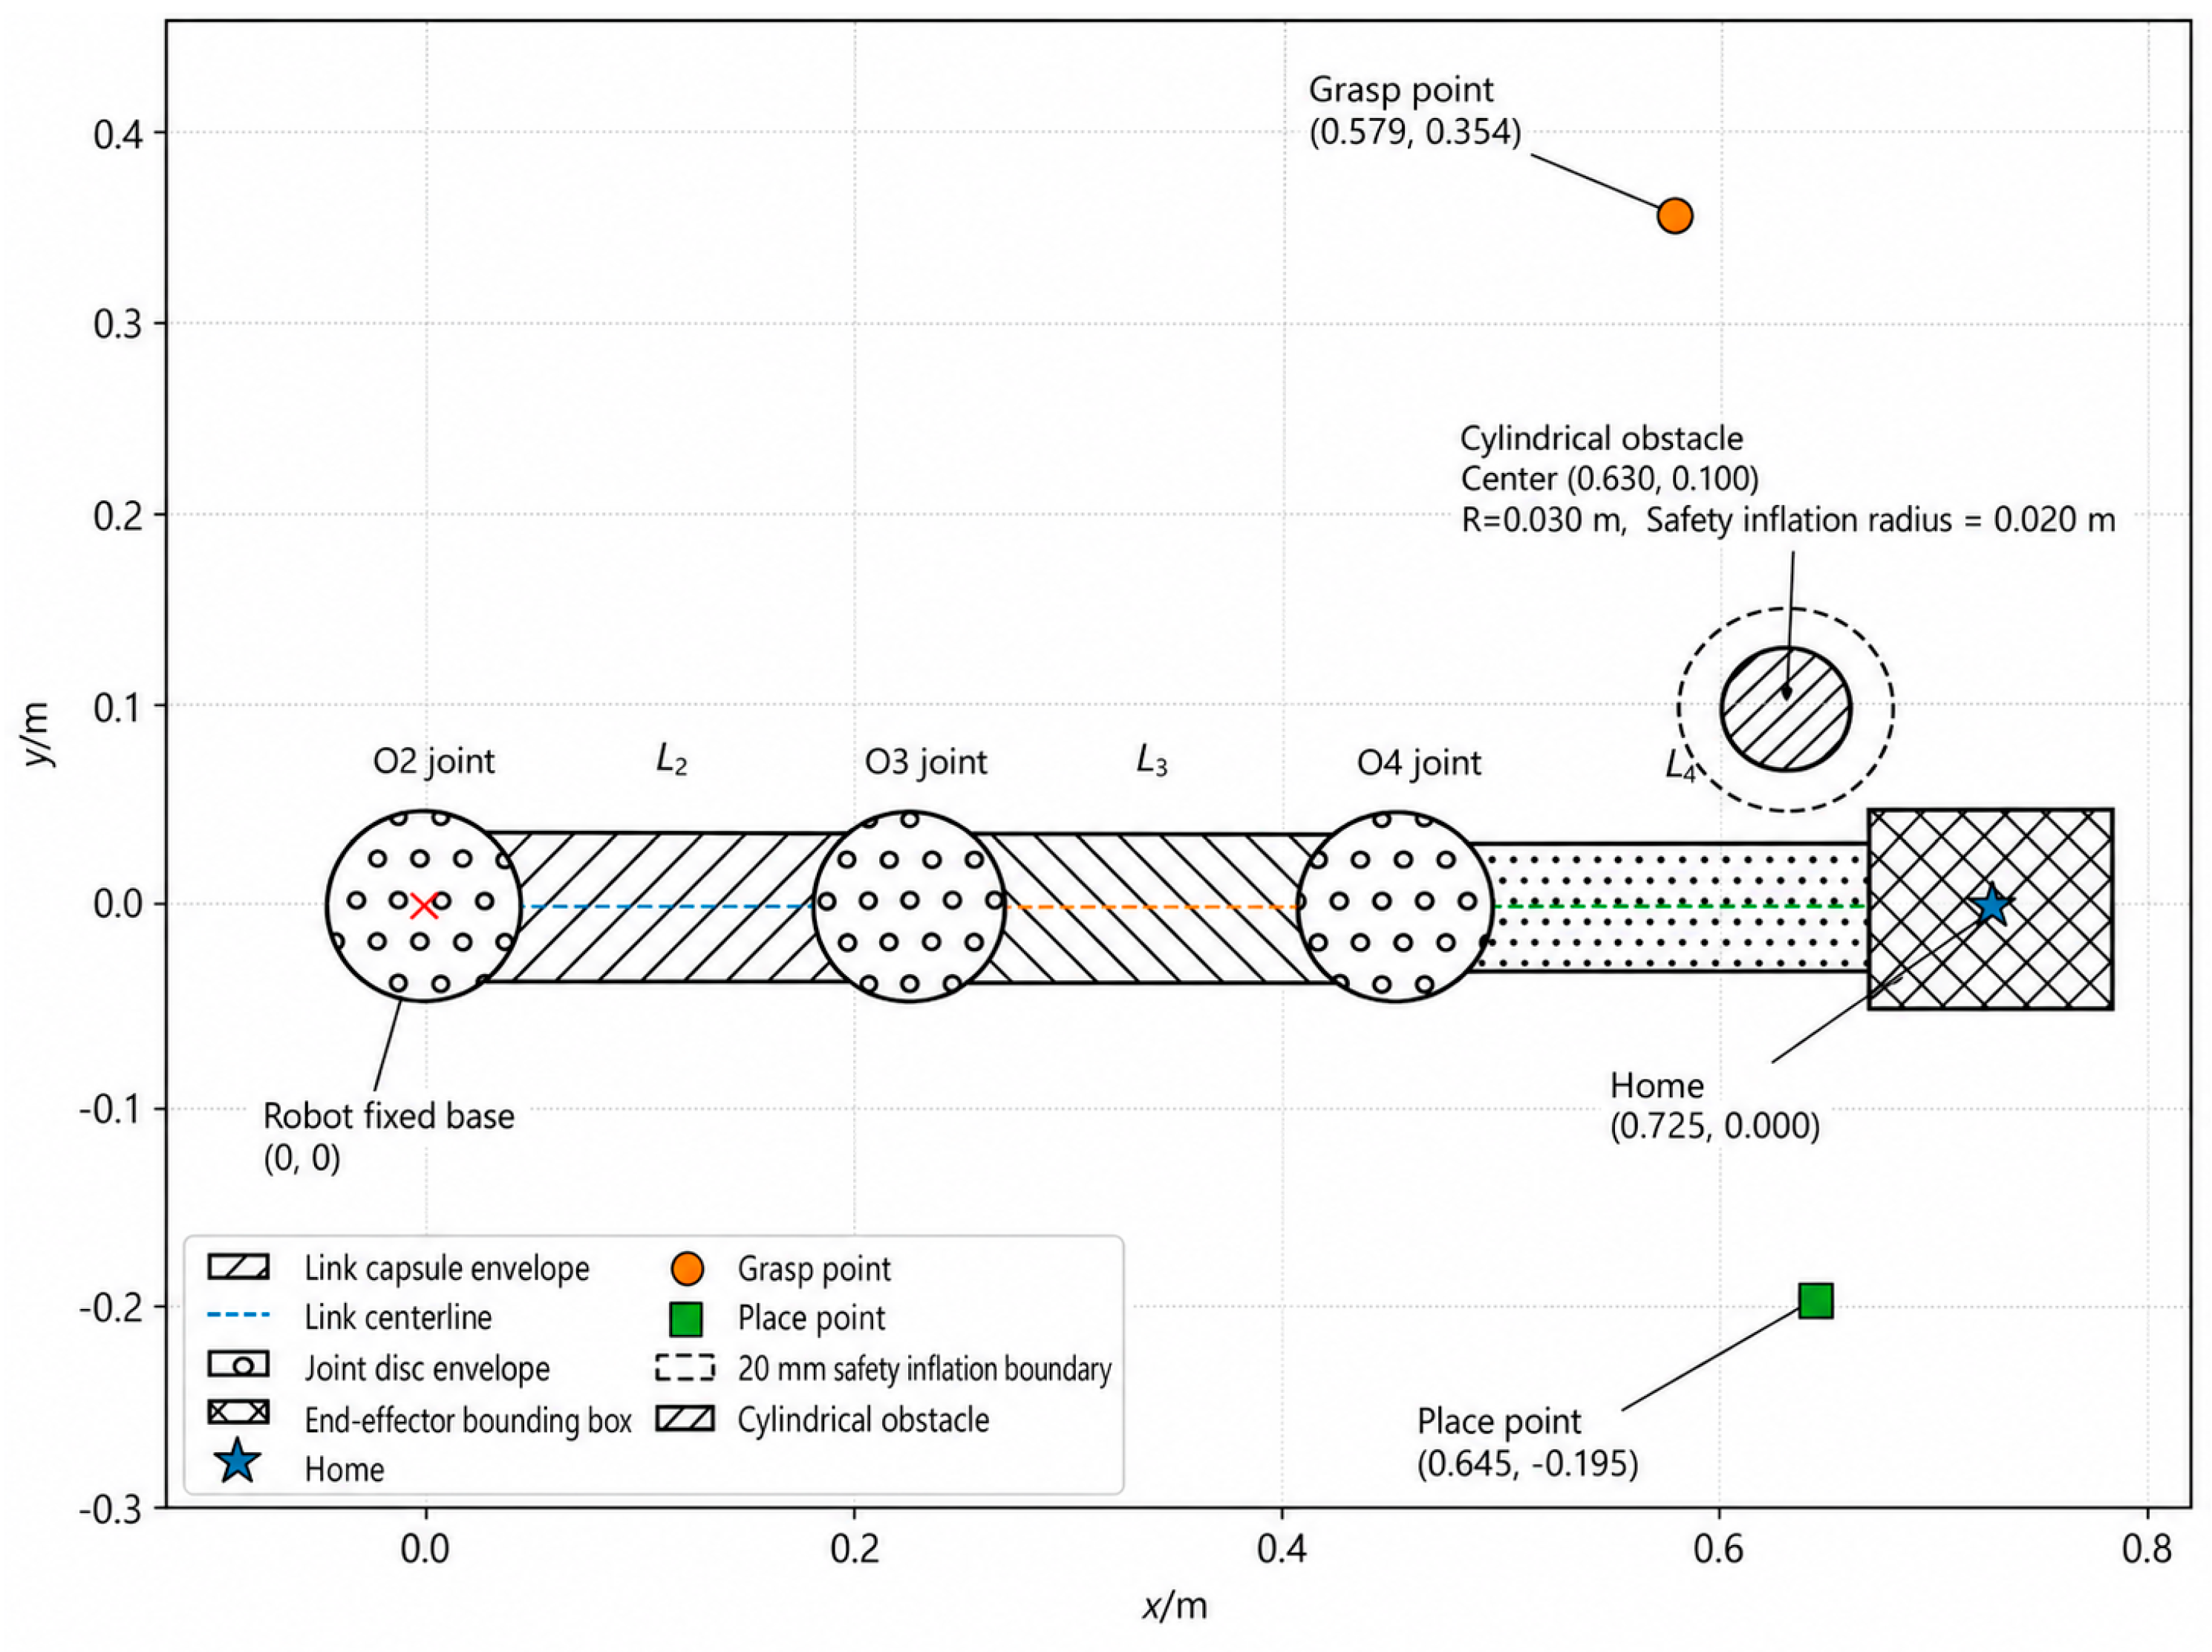
A pick–transport–place task was designed to further investigate the coupling between mechanism parameters and trajectories. The key task poses are listed in
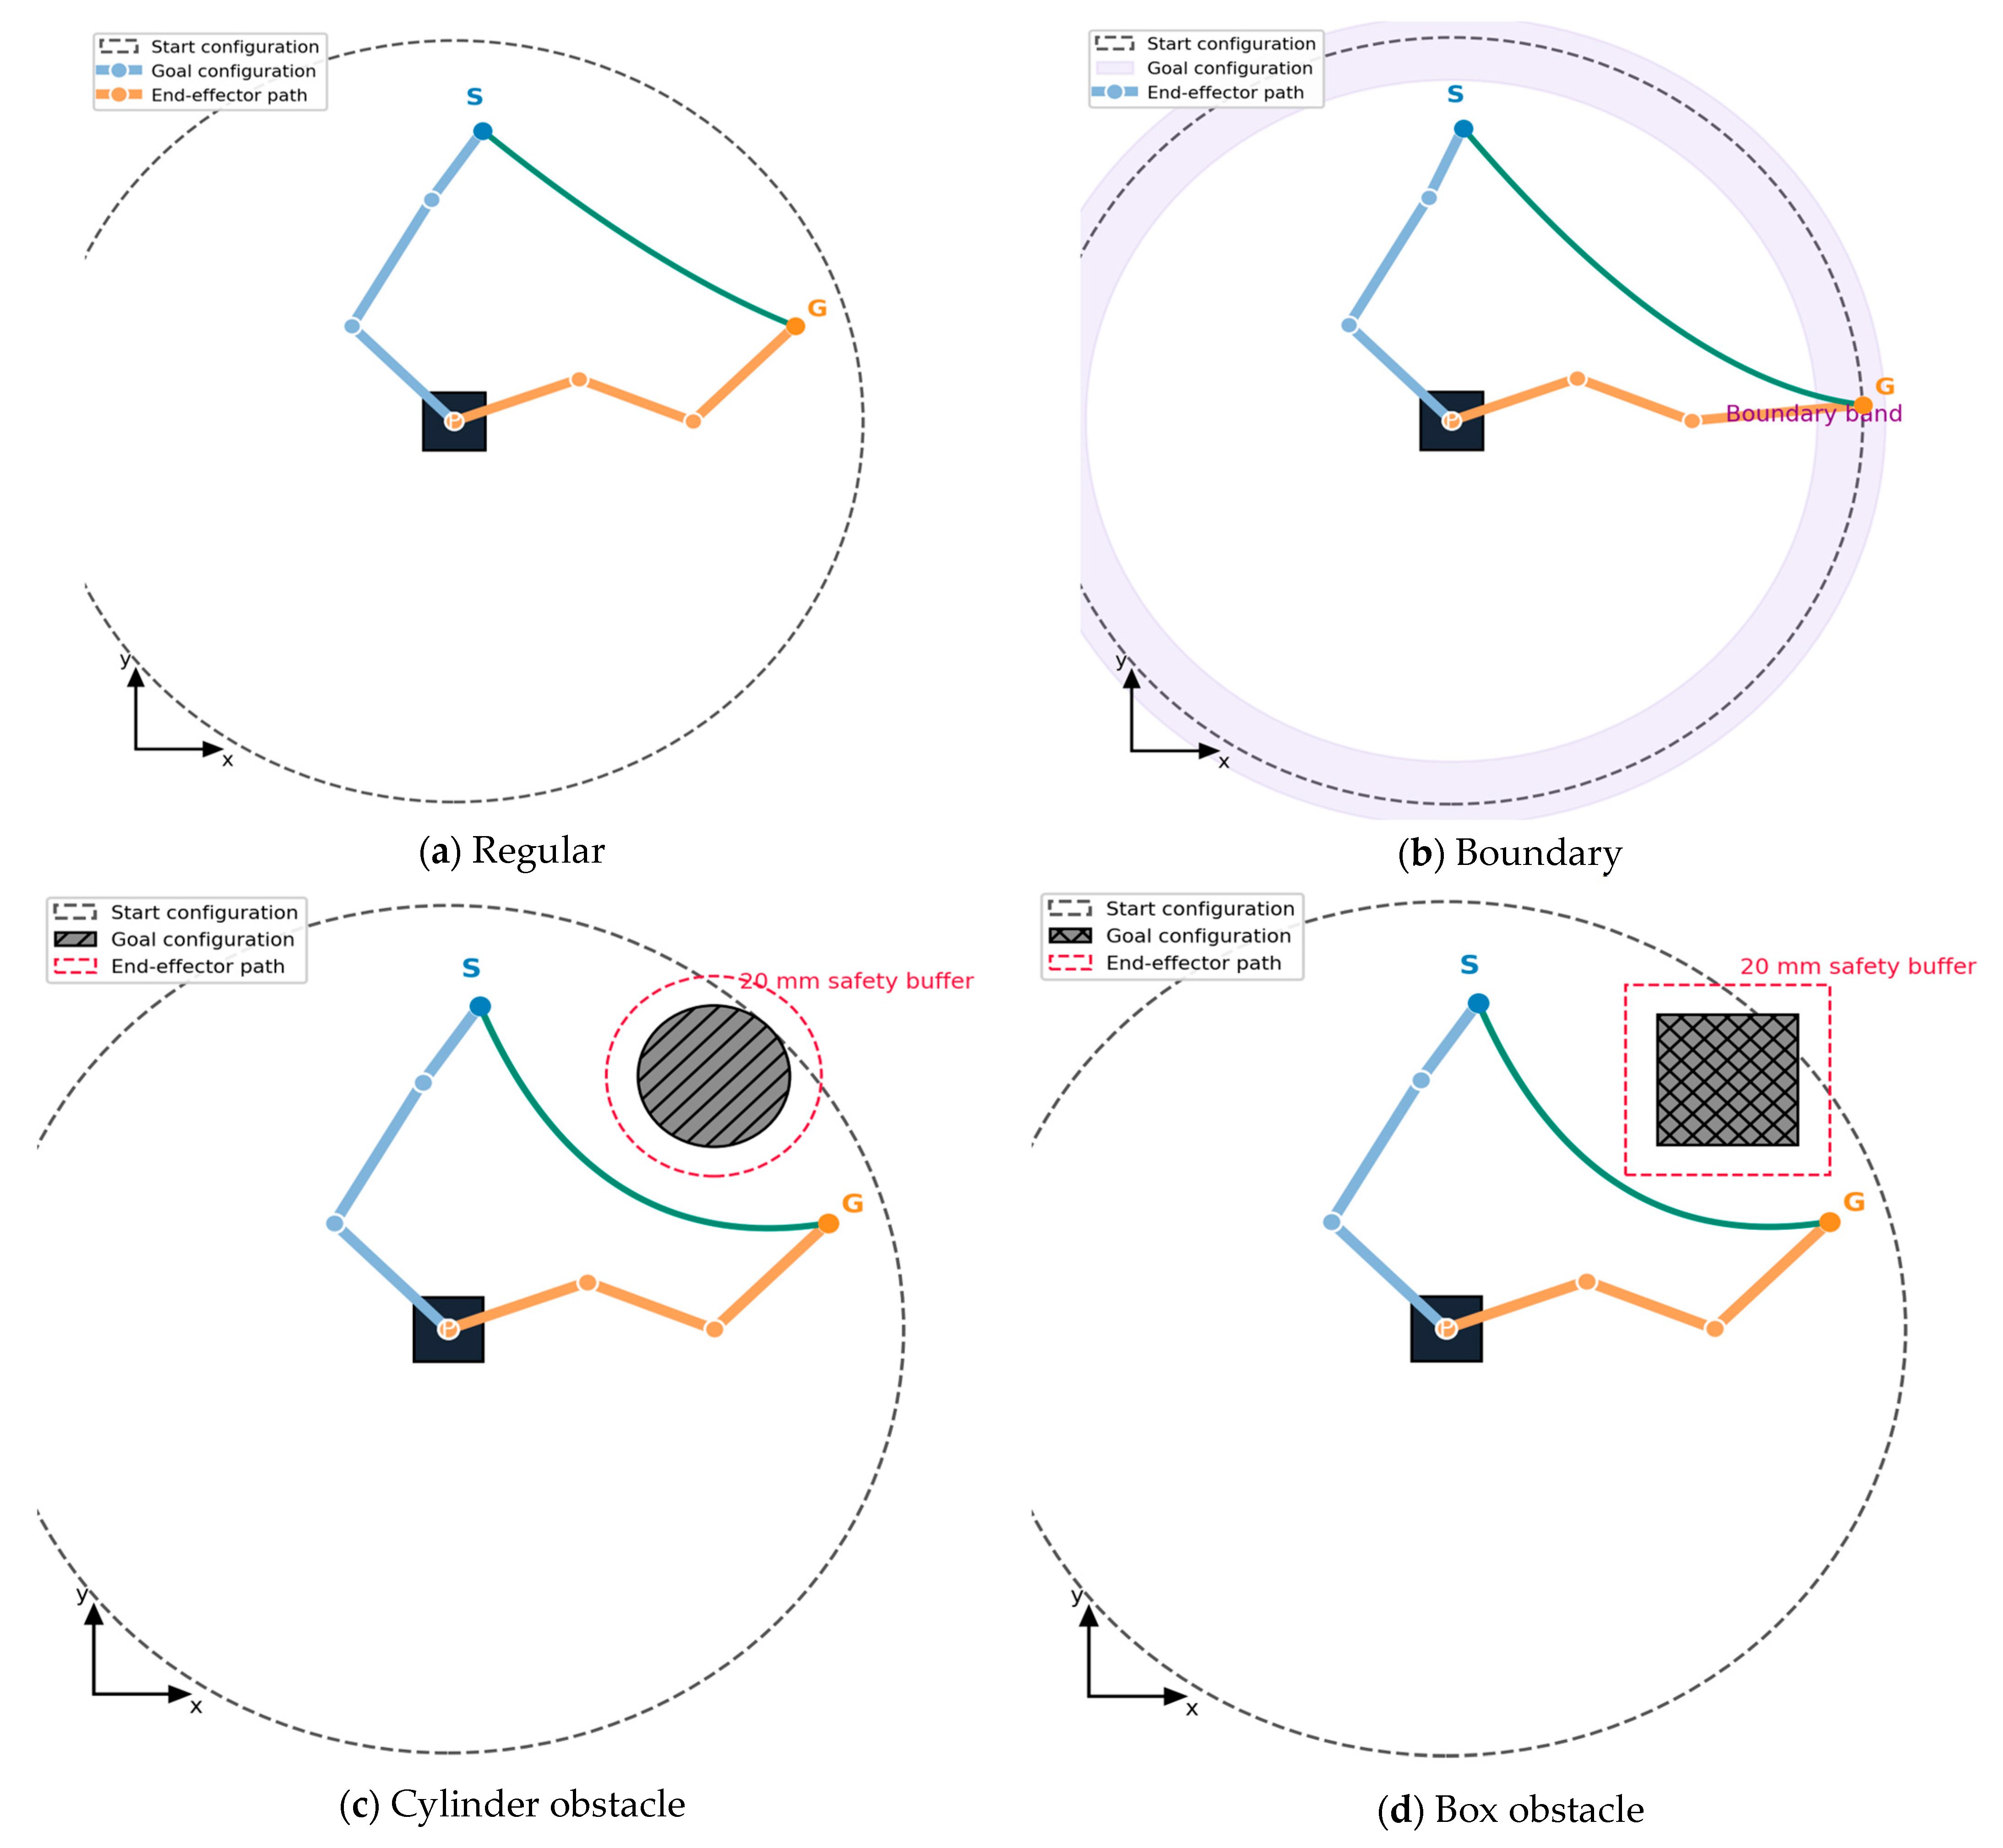
Table 11. The median-link and optimized mechanisms used identical home, pick, place, and obstacle coordinates; only the three link lengths were changed, after which the IK configurations and trajectories were recomputed. The cylindrical obstacle was centered at (0.630, 0.100) m with a radius of 0.030 m. A required clearance of 0.020 m was imposed. The obstacle was placed near the direct path between home and the pick region to create a meaningful avoidance constraint, as shown in
Figure 8.
After surrogate search, the top 15 candidates in the ARV-MOBWO archive were subjected to high-fidelity trajectory re-optimization and obstacle-clearance verification. The selected representative link lengths were L2 = 0.245657 m, L3 = 0.230277 m, and L4 = 0.275626 m. The results are listed in
Table 12. Relative to the median-link mechanism under the same optimized trajectory condition, the selected mechanism reduced path length by 0.71%, jerk cost by 18.89%, joint motion by 4.08%, and acceleration cost by 14.72%, while increasing duration by 4.15% and reducing minimum clearance by 0.44%. These changes represent a typical multi-objective trade-off.
A 2 × 2 mechanism–trajectory factor-combination experiment was constructed to examine the individual and interactive effects of mechanism adaptation and trajectory optimization. S0T0 denotes the median-link mechanism with the baseline trajectory, S0T1 the median-link mechanism with the optimized trajectory, S1T0 the optimized mechanism with the baseline trajectory, and S1T1 the optimized mechanism with the optimized trajectory. The inner trajectory optimization was repeated using random seeds 11, 23, 37, 51, and 73. All four combinations achieved 100% high-fidelity feasibility. The observed responses of the four factor combinations are summarized in
Table 13.
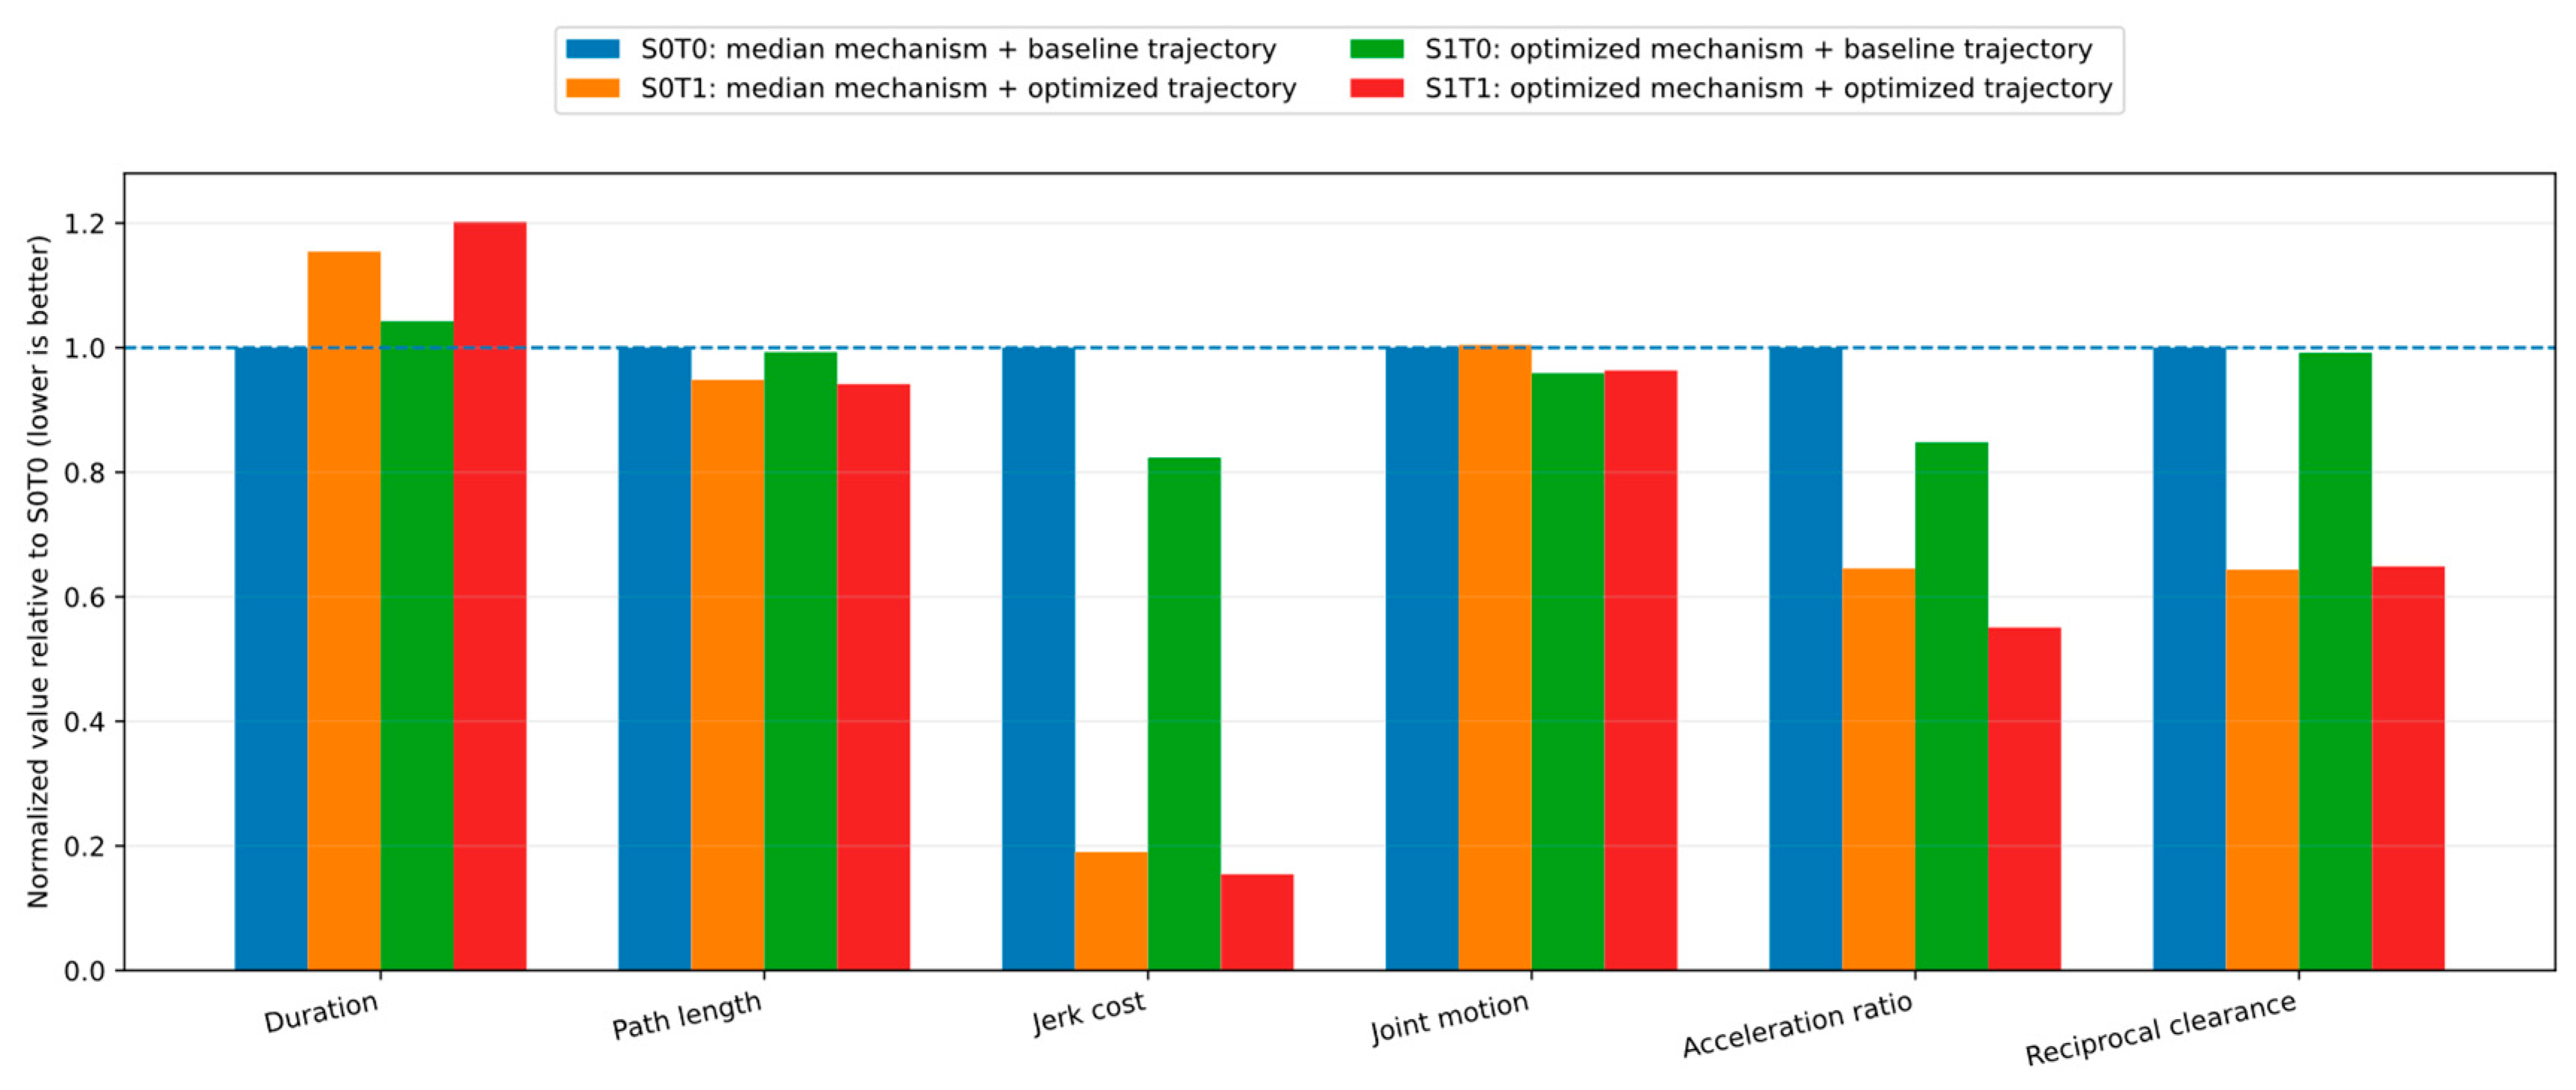
To visualize the observed responses of the four cells in the 2 × 2 design, the mean metrics of S0T0, S0T1, S1T0, and S1T1 were normalized relative to S0T0, as shown in
Figure 9. Trajectory duration, end-effector path length, jerk cost, normalized joint motion, and the maximum acceleration-to-limit ratio are cost-type metrics; lower normalized values indicate better performance. Minimum clearance is a benefit-type metric. To retain a common lower-is-better direction in the figure, it is normalized using the following reciprocal form:
A lower reciprocal clearance bar therefore corresponds to a larger physical clearance and a higher collision-avoidance margin. The dashed line (y = 1) represents the S0T0 baseline.
Figure 9 is used as a descriptive comparison of the four observed factor combinations, whereas the baseline-referenced factor effects and their interaction are quantified separately below.
The four mechanism–trajectory combinations exhibit distinct performance patterns in
Figure 9. For S0T1 and S1T1, both of which use optimized trajectories, normalized duration is greater than one, whereas path length, jerk cost, maximum acceleration-to-limit ratio, and reciprocal minimum clearance are all substantially lower than one. The inner optimizer therefore does more than time scaling: by jointly adjusting the B-spline control points and segment durations, it reshapes the end-effector avoidance path, suppresses abrupt motion and acceleration-limit utilization, and increases the actual separation between the composite manipulator envelope and the cylindrical obstacle.
At the baseline-trajectory level T0, comparing S0T0 with S1T0 shows that mechanism adaptation reduces path length, jerk cost, and joint motion, while requiring a longer trajectory duration. Even without inner-level trajectory optimization, changing the link lengths modifies the IK configurations and the allocation of motion among the joints during obstacle avoidance. However, the changes produced by mechanism adaptation alone are smaller than the smoothness and clearance improvements obtained when trajectory optimization is introduced. This result indicates that trajectory optimization is the dominant source of jerk reduction and collision-clearance enhancement in the present cylindrical obstacle task, whereas mechanism adaptation provides a complementary, metric-dependent contribution.
Both S0T1 and S1T1 maintain substantial obstacle clearance, but S1T1 further reduces end-effector path length, jerk cost, joint motion, and acceleration cost. Its trajectory duration is nevertheless longer than that of S0T1, and its actual minimum clearance is slightly smaller. Therefore, the S0T1–S1T1 comparison represents the conditional effect of mechanism adaptation when the trajectory factor is fixed at the optimized level T1. It should not be interpreted as the baseline-referenced mechanism effect used in the additive factor decomposition below. The resulting S1T1 solution reflects a multi-objective compromise among motion smoothness, joint-motion burden, safety margin, and execution time.
The error bars in
Figure 9 are generally short, indicating concentrated results for S0T1 and S1T1 across the five random seeds. Although the minimum-clearance variability of S1T1 is slightly larger than that of the other metrics, its worst-case value remains well above the safety threshold. The dispersion is therefore attributable to small variations in local avoidance geometry rather than instability of trajectory feasibility.
To quantify the factor effects without mixing comparisons evaluated under different reference conditions, the four responses were further decomposed using S0T0 as a common reference. This formulation corresponds to reference-cell coding of a two-factor design, in which the trajectory effect, mechanism effect, and interaction contrast are all defined relative to the same baseline [
31]. Let
,
,
, and
denote the mean value of a given performance metric for S0T0, S0T1, S1T0, and S1T1, respectively.
For cost-type metrics, for which a smaller value indicates better performance, the baseline-referenced trajectory effect is defined as
the baseline-referenced mechanism effect as
and the complete coordinated improvement as
The interaction effect is then defined by the two-factor interaction contrast:
For minimum clearance, which is a benefit-type metric, the improvement direction is reversed:
With these definitions, the complete coordinated improvement is exactly decomposed as
Thus, all three terms are evaluated using a consistent reference. A positive value denotes improvement, whereas a negative value denotes deterioration relative to S0T0. Under this sign convention, a negative interaction indicates that the combined improvement is smaller than the sum of the two baseline-referenced individual effects, whereas a positive interaction indicates an additional synergistic gain.
The resulting baseline-referenced factor effects are summarized in
Table 14.
Different performance metrics show distinct baseline-referenced factor effects, as summarized in
Table 14. Relative to S0T0, introducing trajectory optimization while retaining the median-link mechanism produces improvements of 5.17%, 80.98%, 35.45%, and 55.36% in path length, jerk cost, acceleration cost, and minimum clearance, respectively. Inner-level trajectory optimization is therefore the dominant source of path reshaping, smoothness improvement, and collision-avoidance margin in the present cylindrical obstacle task. Its particularly strong effects on jerk and clearance result from changing the local trajectory geometry, B-spline control-point locations, and temporal allocation to avoid abrupt directional changes and excessive proximity to the obstacle.
The baseline-referenced mechanism effect is evaluated independently from S0T0 to S1T0. Mechanism adaptation reduces path length by 0.72%, jerk cost by 17.64%, joint motion by 4.08%, and acceleration cost by 15.18%, while slightly increasing minimum clearance by 0.81%. It also increases trajectory duration by 4.25%. These results indicate that changing the link lengths modifies the IK configurations and the allocation of motion among joints even before optimized trajectory reshaping is introduced. The mechanism factor therefore provides a meaningful but generally smaller contribution than the trajectory factor for the present obstacle-constrained task.
For completeness, the comparison between S0T1 and S1T1 can still be used to quantify the conditional effect of mechanism adaptation at the optimized trajectory level T1. This conditional comparison is not used as the mechanism term in the additive decomposition of
Table 11. Under T1, mechanism adaptation further reduces path length by 0.71%, jerk cost by 18.76%, joint motion by 4.08%, and acceleration cost by 14.67%, while increasing trajectory duration by 4.13% and slightly reducing minimum clearance by 0.80%. These conditional changes show that the influence of link-length adaptation depends on the trajectory-optimization state and therefore provide an additional indication of mechanism–trajectory coupling.
For trajectory duration, the baseline-referenced trajectory effect is −15.42% and the baseline-referenced mechanism effect is −4.25%. Together with the −0.52% interaction effect, they yield the complete coordinated change of −20.19%. Neither factor minimizes execution time alone in this task. Instead, both accept a longer duration while improving other objectives, particularly jerk, acceleration, path length, and clearance. The increase in duration is therefore a multi-objective trade-off rather than evidence of optimization failure.
For joint motion, the baseline-referenced trajectory effect is −0.44%, whereas the mechanism effect is 4.08%. With an interaction effect of only 0.02%, the complete coordinated improvement is 3.66%. The near-zero interaction indicates that the effects are approximately additive for this metric. Trajectory optimization has little influence on cumulative joint excursion, whereas link-length adaptation changes the share of motion assigned to individual joints and is therefore the primary source of the reduction in joint motion.
The interaction effects for path length and joint motion are −0.04% and 0.02%, respectively, both close to zero. Thus, the effects of mechanism adaptation and trajectory optimization are approximately additive for these two metrics. The interaction effect for trajectory duration is also small (−0.52%), indicating that mechanism variation only weakly alters the time penalty associated with trajectory optimization.
In contrast, the interaction effects for jerk cost and acceleration cost are −14.07% and −5.71%, respectively. Under the present improvement-oriented sign convention, a negative interaction means that the complete coordinated gain is smaller than the sum of the two baseline-referenced individual gains. This result indicates overlapping rather than independent effects. Trajectory optimization already removes a large proportion of abrupt motion and high acceleration from the baseline trajectory, thereby reducing the remaining improvement available from mechanism adaptation. Nevertheless, the complete S1T1 solution still reduces jerk cost and acceleration cost by 84.55% and 44.92%, respectively, relative to S0T0.
Minimum clearance provides a particularly clear example of the interaction between the two factors. The baseline-referenced trajectory effect is 55.36%, and the baseline-referenced mechanism effect is 0.81%, whereas the interaction effect is −2.05%, yielding a complete coordinated improvement of 54.12%. Thus, changing the mechanism alone from S0T0 to S1T0 slightly increases the minimum clearance. However, after trajectory optimization has already established a substantially larger safety margin, the conditional S0T1–S1T1 comparison gives a −0.80% change, indicating that the optimized mechanism slightly reduces the already enlarged clearance. The change in the conditional mechanism response between T0 and T1 demonstrates that the effects of the mechanism and trajectory factors on obstacle clearance are not strictly independent.
For S1T1, the mean minimum clearance is 0.054204 m with a standard deviation of 0.000484 m. The worst value across the five seeds is 0.053338 m, leaving approximately 33.34 mm above the required 0.020 m clearance. Therefore, although the interaction redistributes part of the trajectory-derived safety margin, the final coordinated solution remains well within the prescribed collision-clearance constraint.
Taken together,
Figure 9 and
Table 14 show a clear but unequal division of roles between mechanism adaptation and trajectory optimization. In the present cylindrical obstacle task, trajectory optimization is the primary source of avoidance-path reshaping, jerk reduction, acceleration reduction, and clearance improvement. Mechanism adaptation provides a smaller and metric-dependent complementary effect by changing the IK configurations and joint-motion allocation; it further reduces path length, jerk cost, joint motion, and acceleration cost under the optimized trajectory condition. The nonzero interaction effects further indicate that the performance consequences of changing the mechanism depend on the trajectory-optimization state. Accordingly, the coordinated framework should not be interpreted as requiring comparable contributions from the two optimization levels. Rather, it allows trajectory optimization to operate on a task-adapted kinematic configuration and evaluates whether changing that configuration provides additional benefit for the specific task. For tasks in which the baseline mechanism already provides favorable reachability and joint configurations, the additional benefit of link-length adaptation may be modest. The mechanism layer is expected to become more relevant when task location, workspace-boundary effects, or obstacle geometry make the baseline configuration kinematically unfavorable.
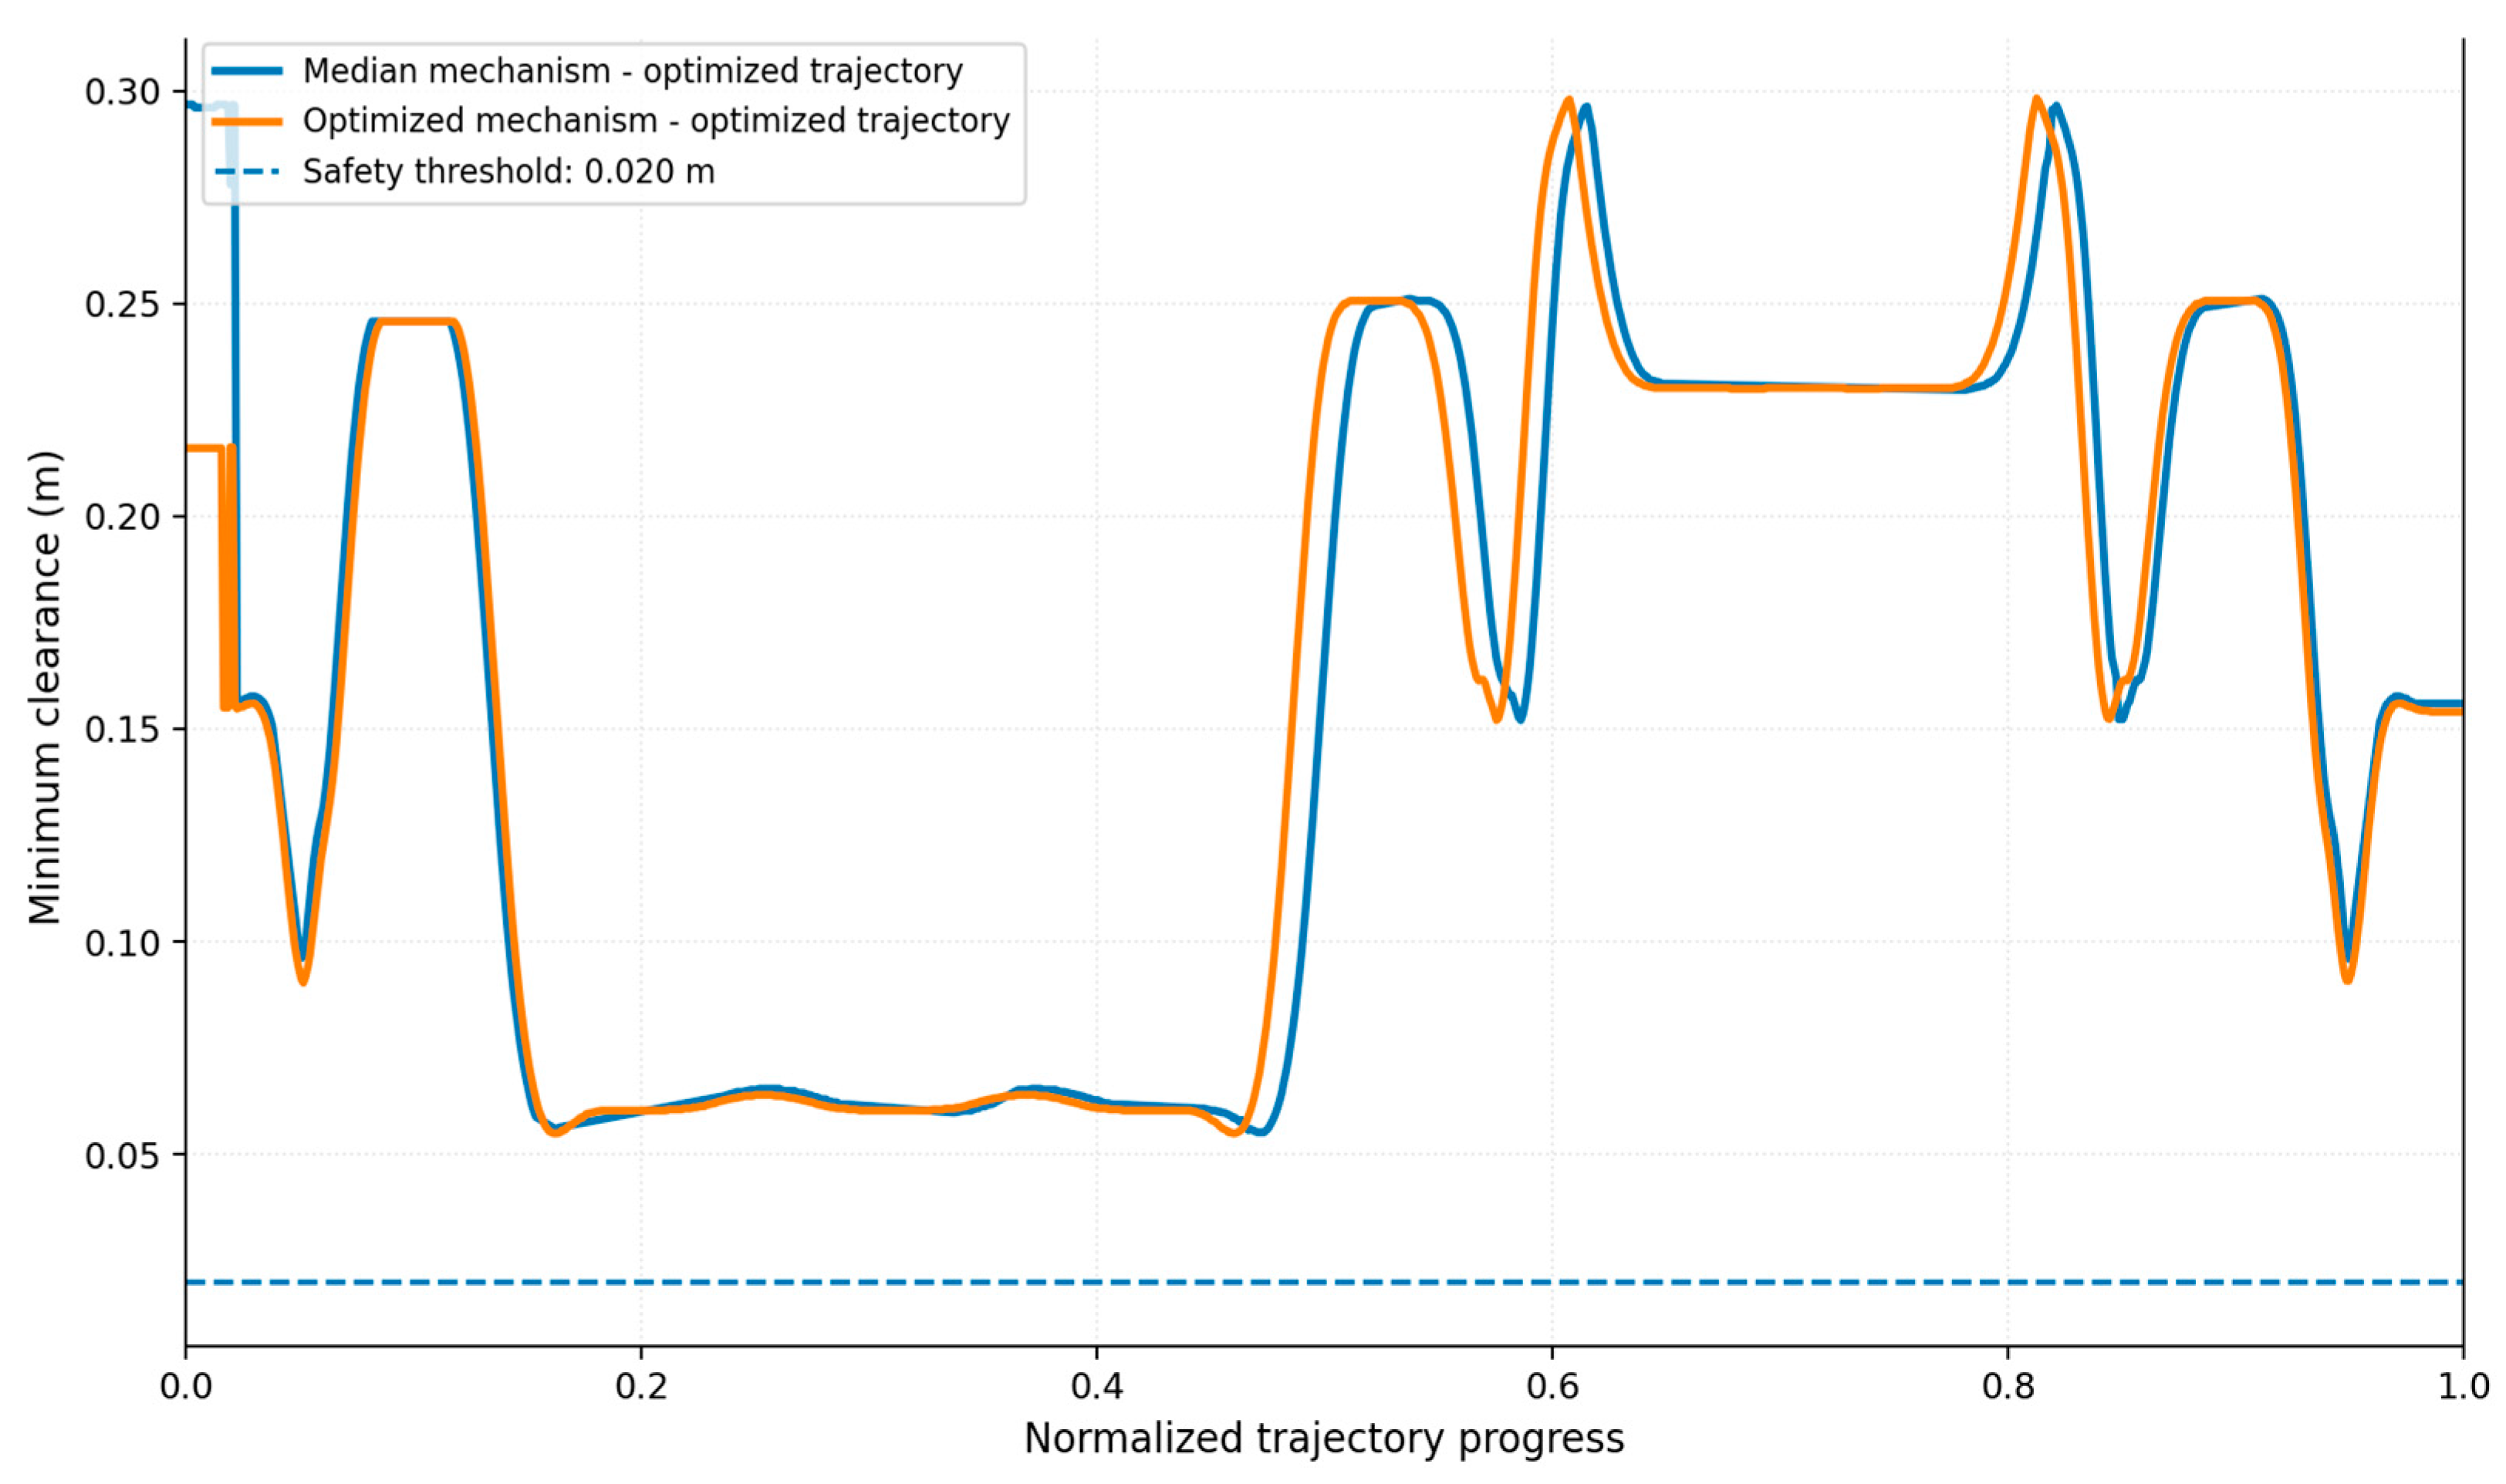
Figure 10 shows the model-based geometric minimum clearance of S0T1 and S1T1 over normalized trajectory progress, calculated from the high-fidelity trajectory and the calibrated composite manipulator–obstacle geometry. These values are not direct physical clearance measurements obtained from an external sensor. Both high-fidelity clearance curves remain above the 0.020 m safety threshold over the entire trajectory. The low-clearance region occurs mainly during the avoidance segment between the home and pick region, whereas the pick descent, placement, and return motions have substantially larger calculated clearance. Although the local minimum of S1T1 is slightly lower than that of S0T1, the high-fidelity geometric model retains more than 33 mm of margin above the prescribed clearance threshold.
5.6. Physical Experiments
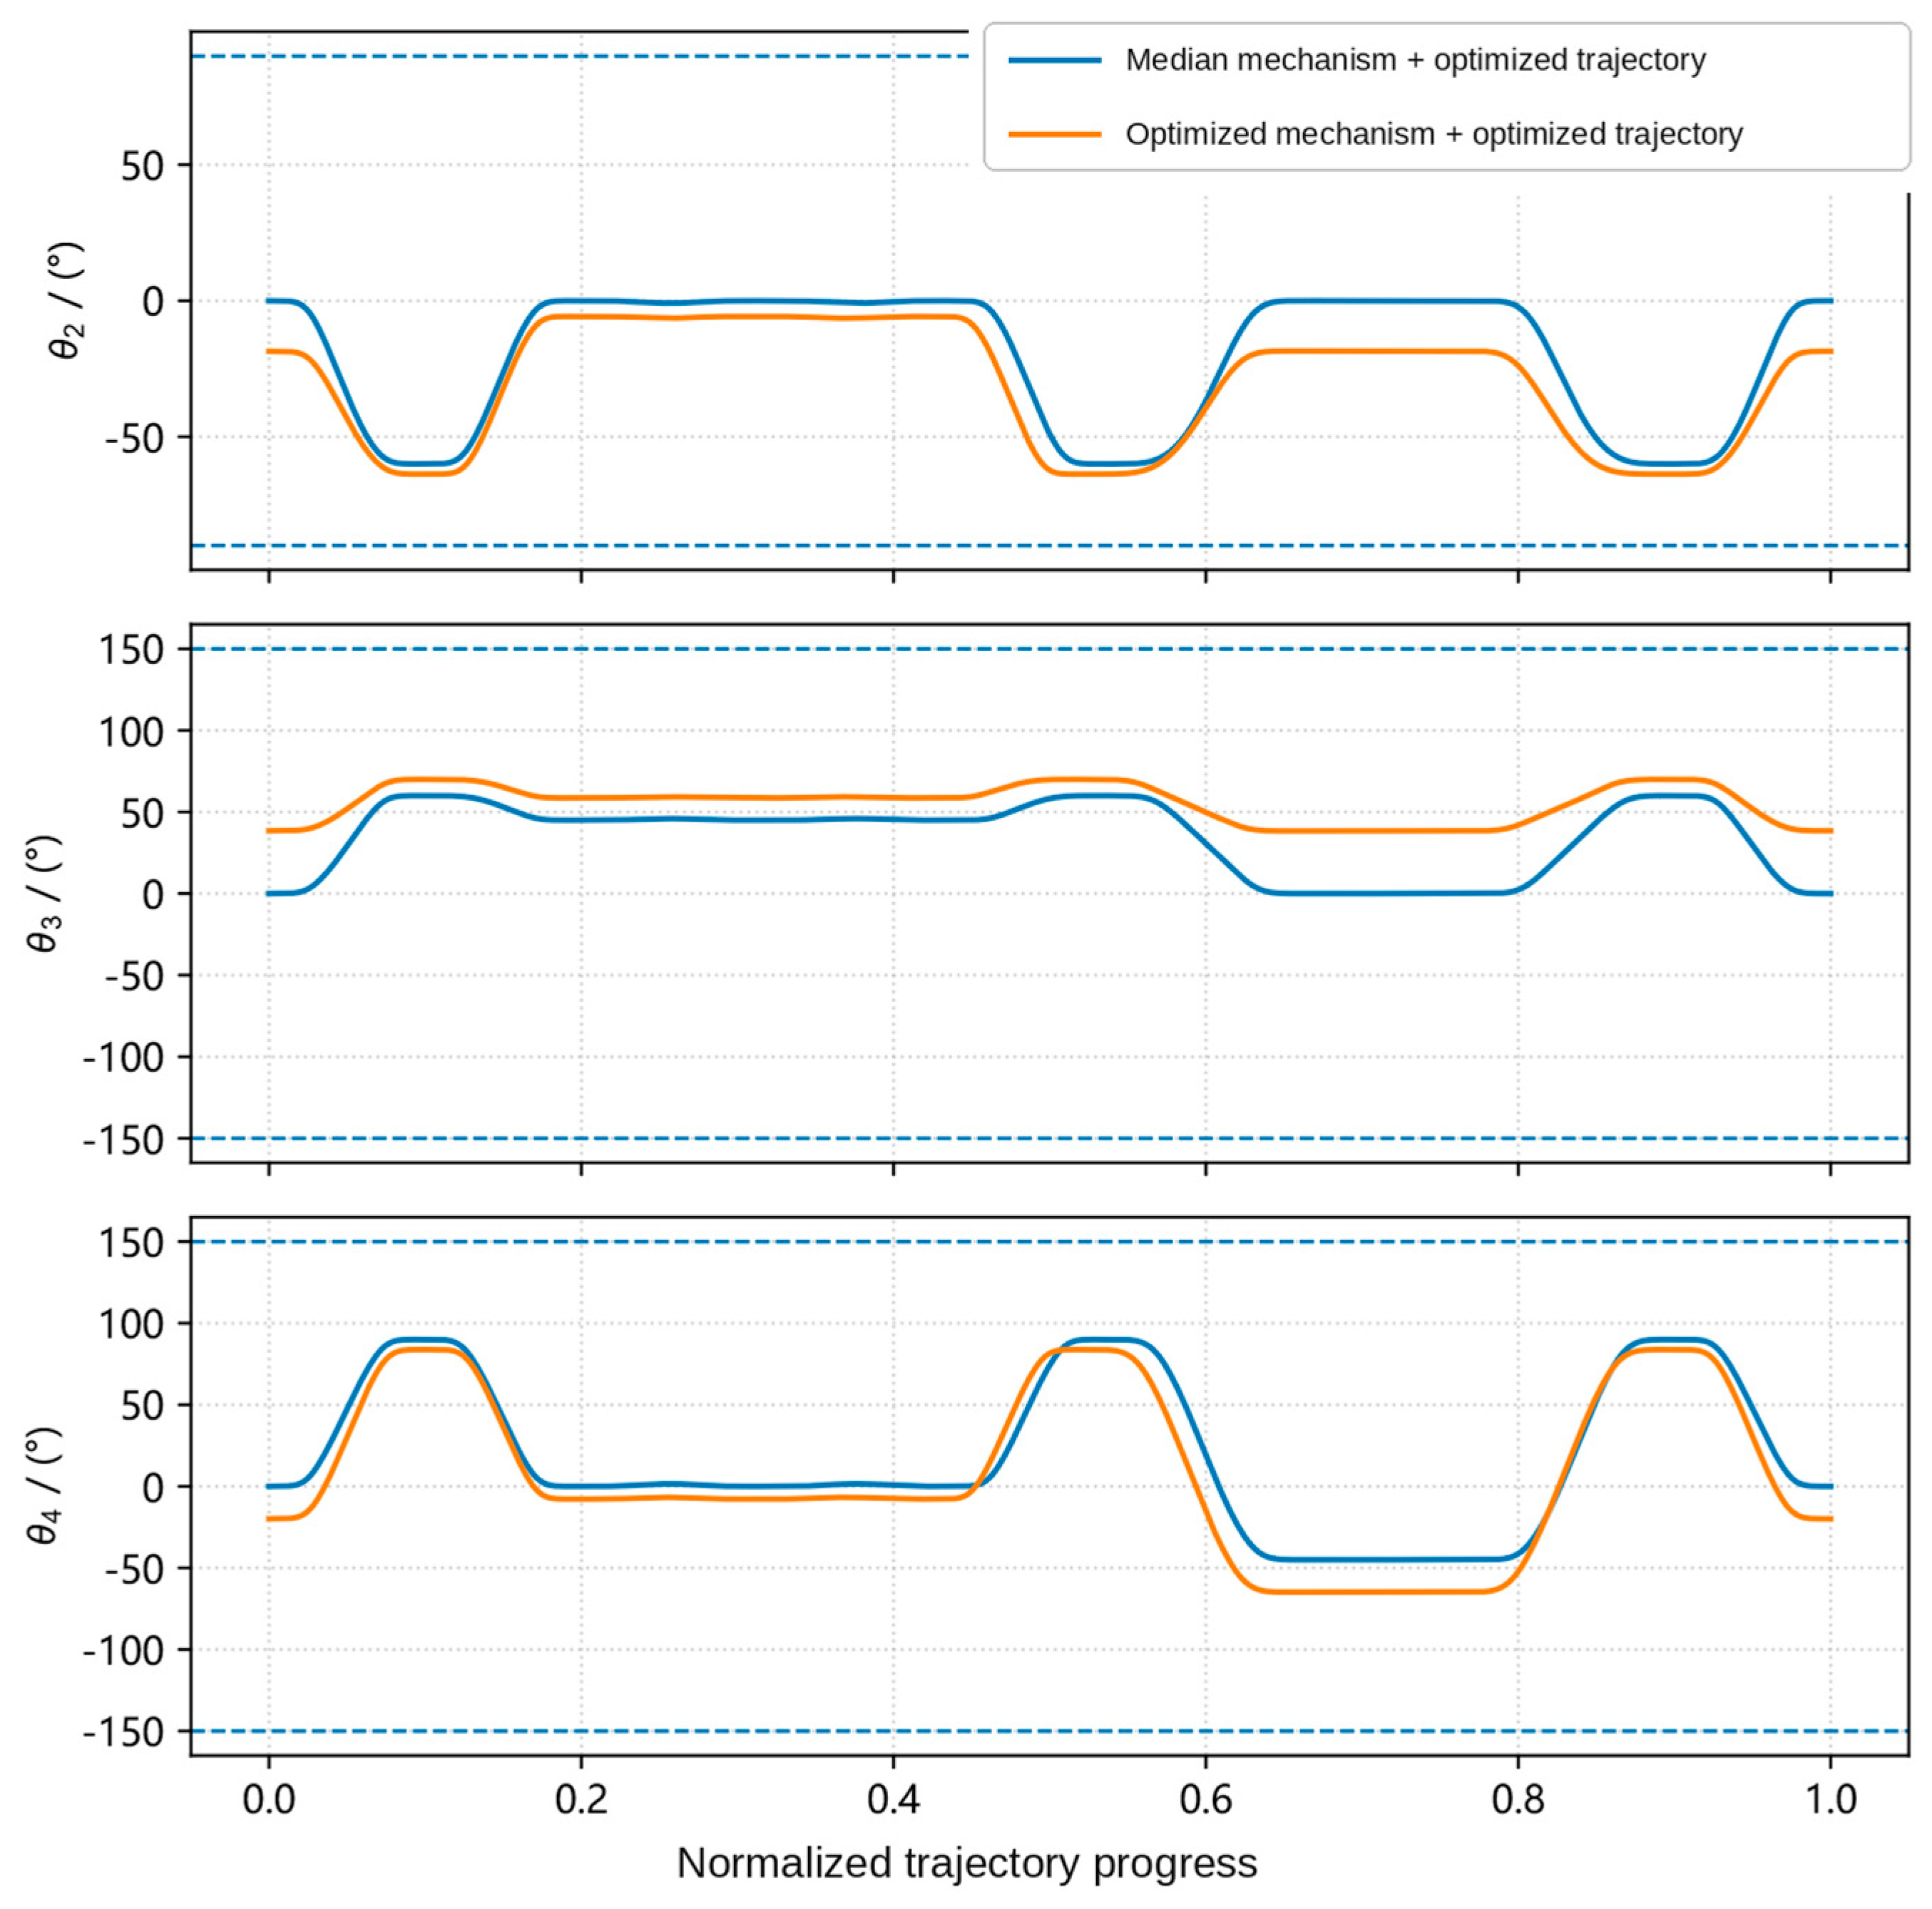
Figure 11 compares the absolute joint angles of S0T1 and S1T1 in the cylindrical obstacle handling task. For S1T1, θ2 is in [−63.77 degrees, −5.78 degrees], θ3 in [38.32 degrees, 69.97 degrees], and θ4 in [−64.96 degrees, 83.80 degrees]. All values satisfy the ±90 degrees limit of θ2 and the ±150 degrees limits of θ3 and θ4. The minimum joint-limit margin is 26.23 degrees. Although smaller than the 30.00 degrees margin of the median-link mechanism, it remains sufficient for execution.
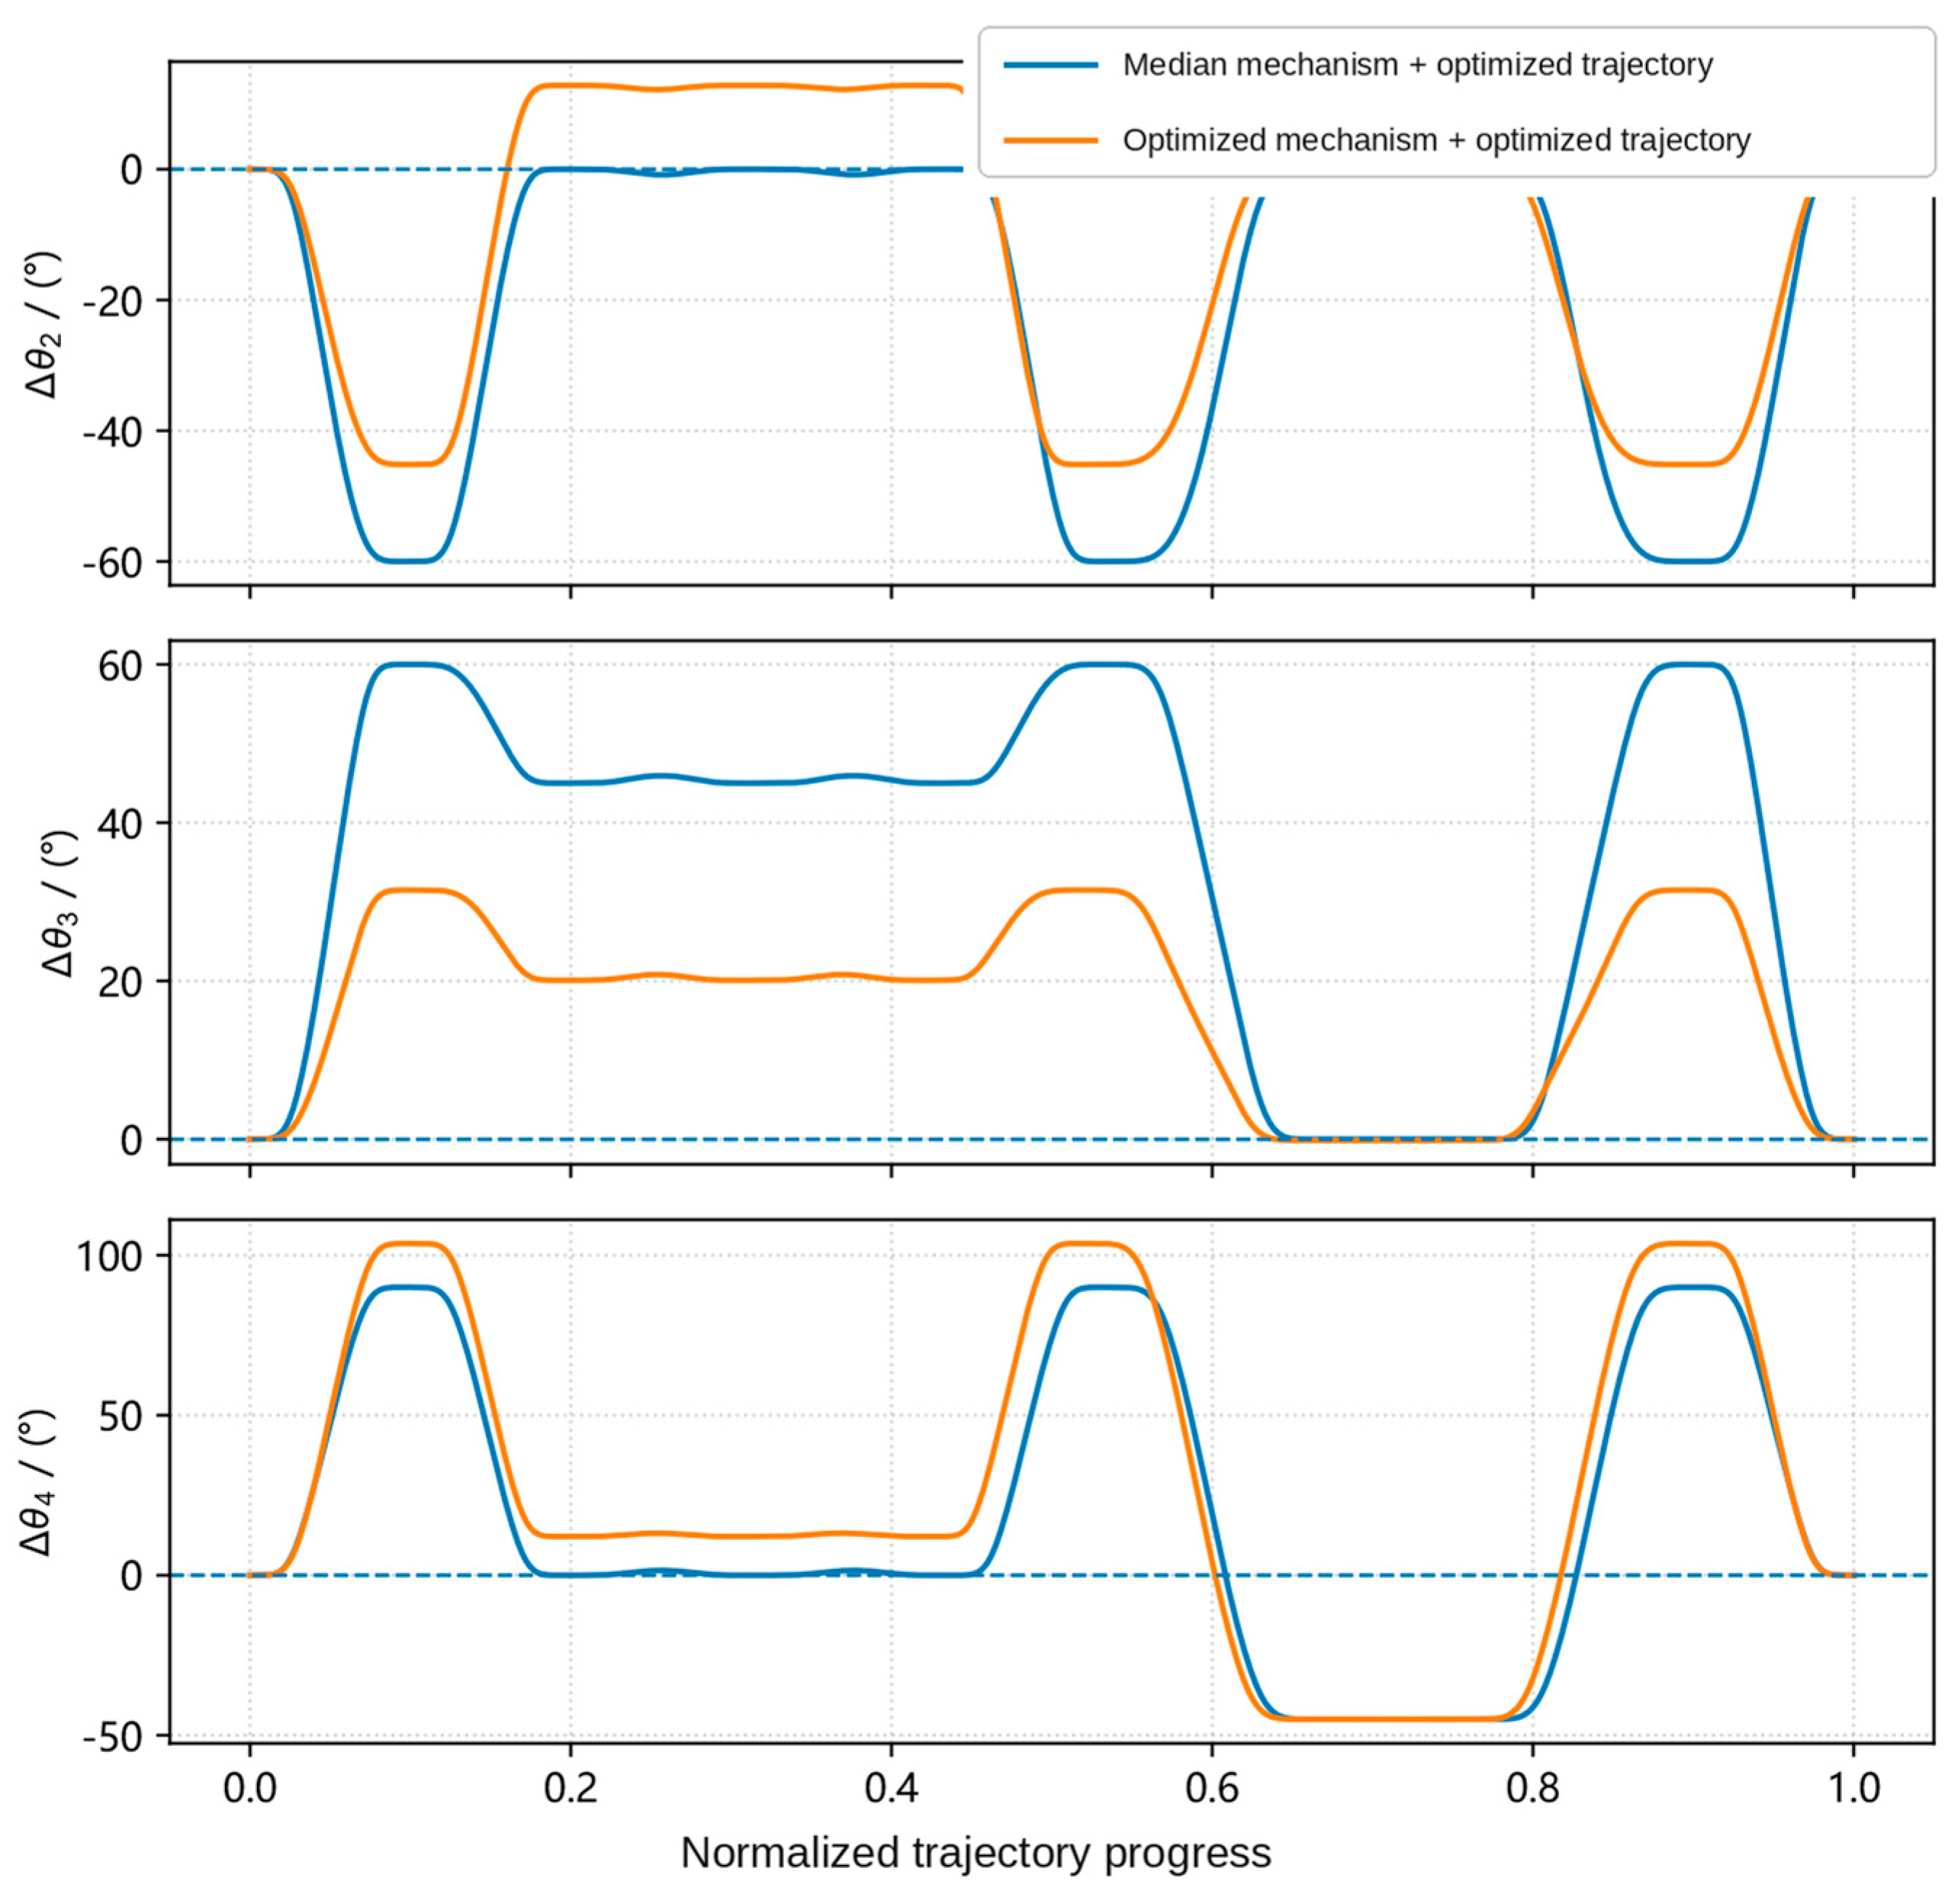
The relative joint-angle curves in
Figure 12 further show that both solutions return to their respective initial task configurations at the end of the motion. The optimized mechanism reduces several large joint excursions and redistributes the coordinated changes among θ2, θ3, and θ4, resulting in lower jerk and acceleration cost. Mechanism adaptation therefore changes not only the static workspace but also the division of motion among the joints for the same physical task.
The joint profiles in
Figure 11 and
Figure 12 are the high-fidelity reference trajectories used to construct the physical command sequences; they should not be interpreted as encoder-measured joint-tracking trajectories. Joint-level tracking errors were not independently logged during the present proof-of-concept experiments.
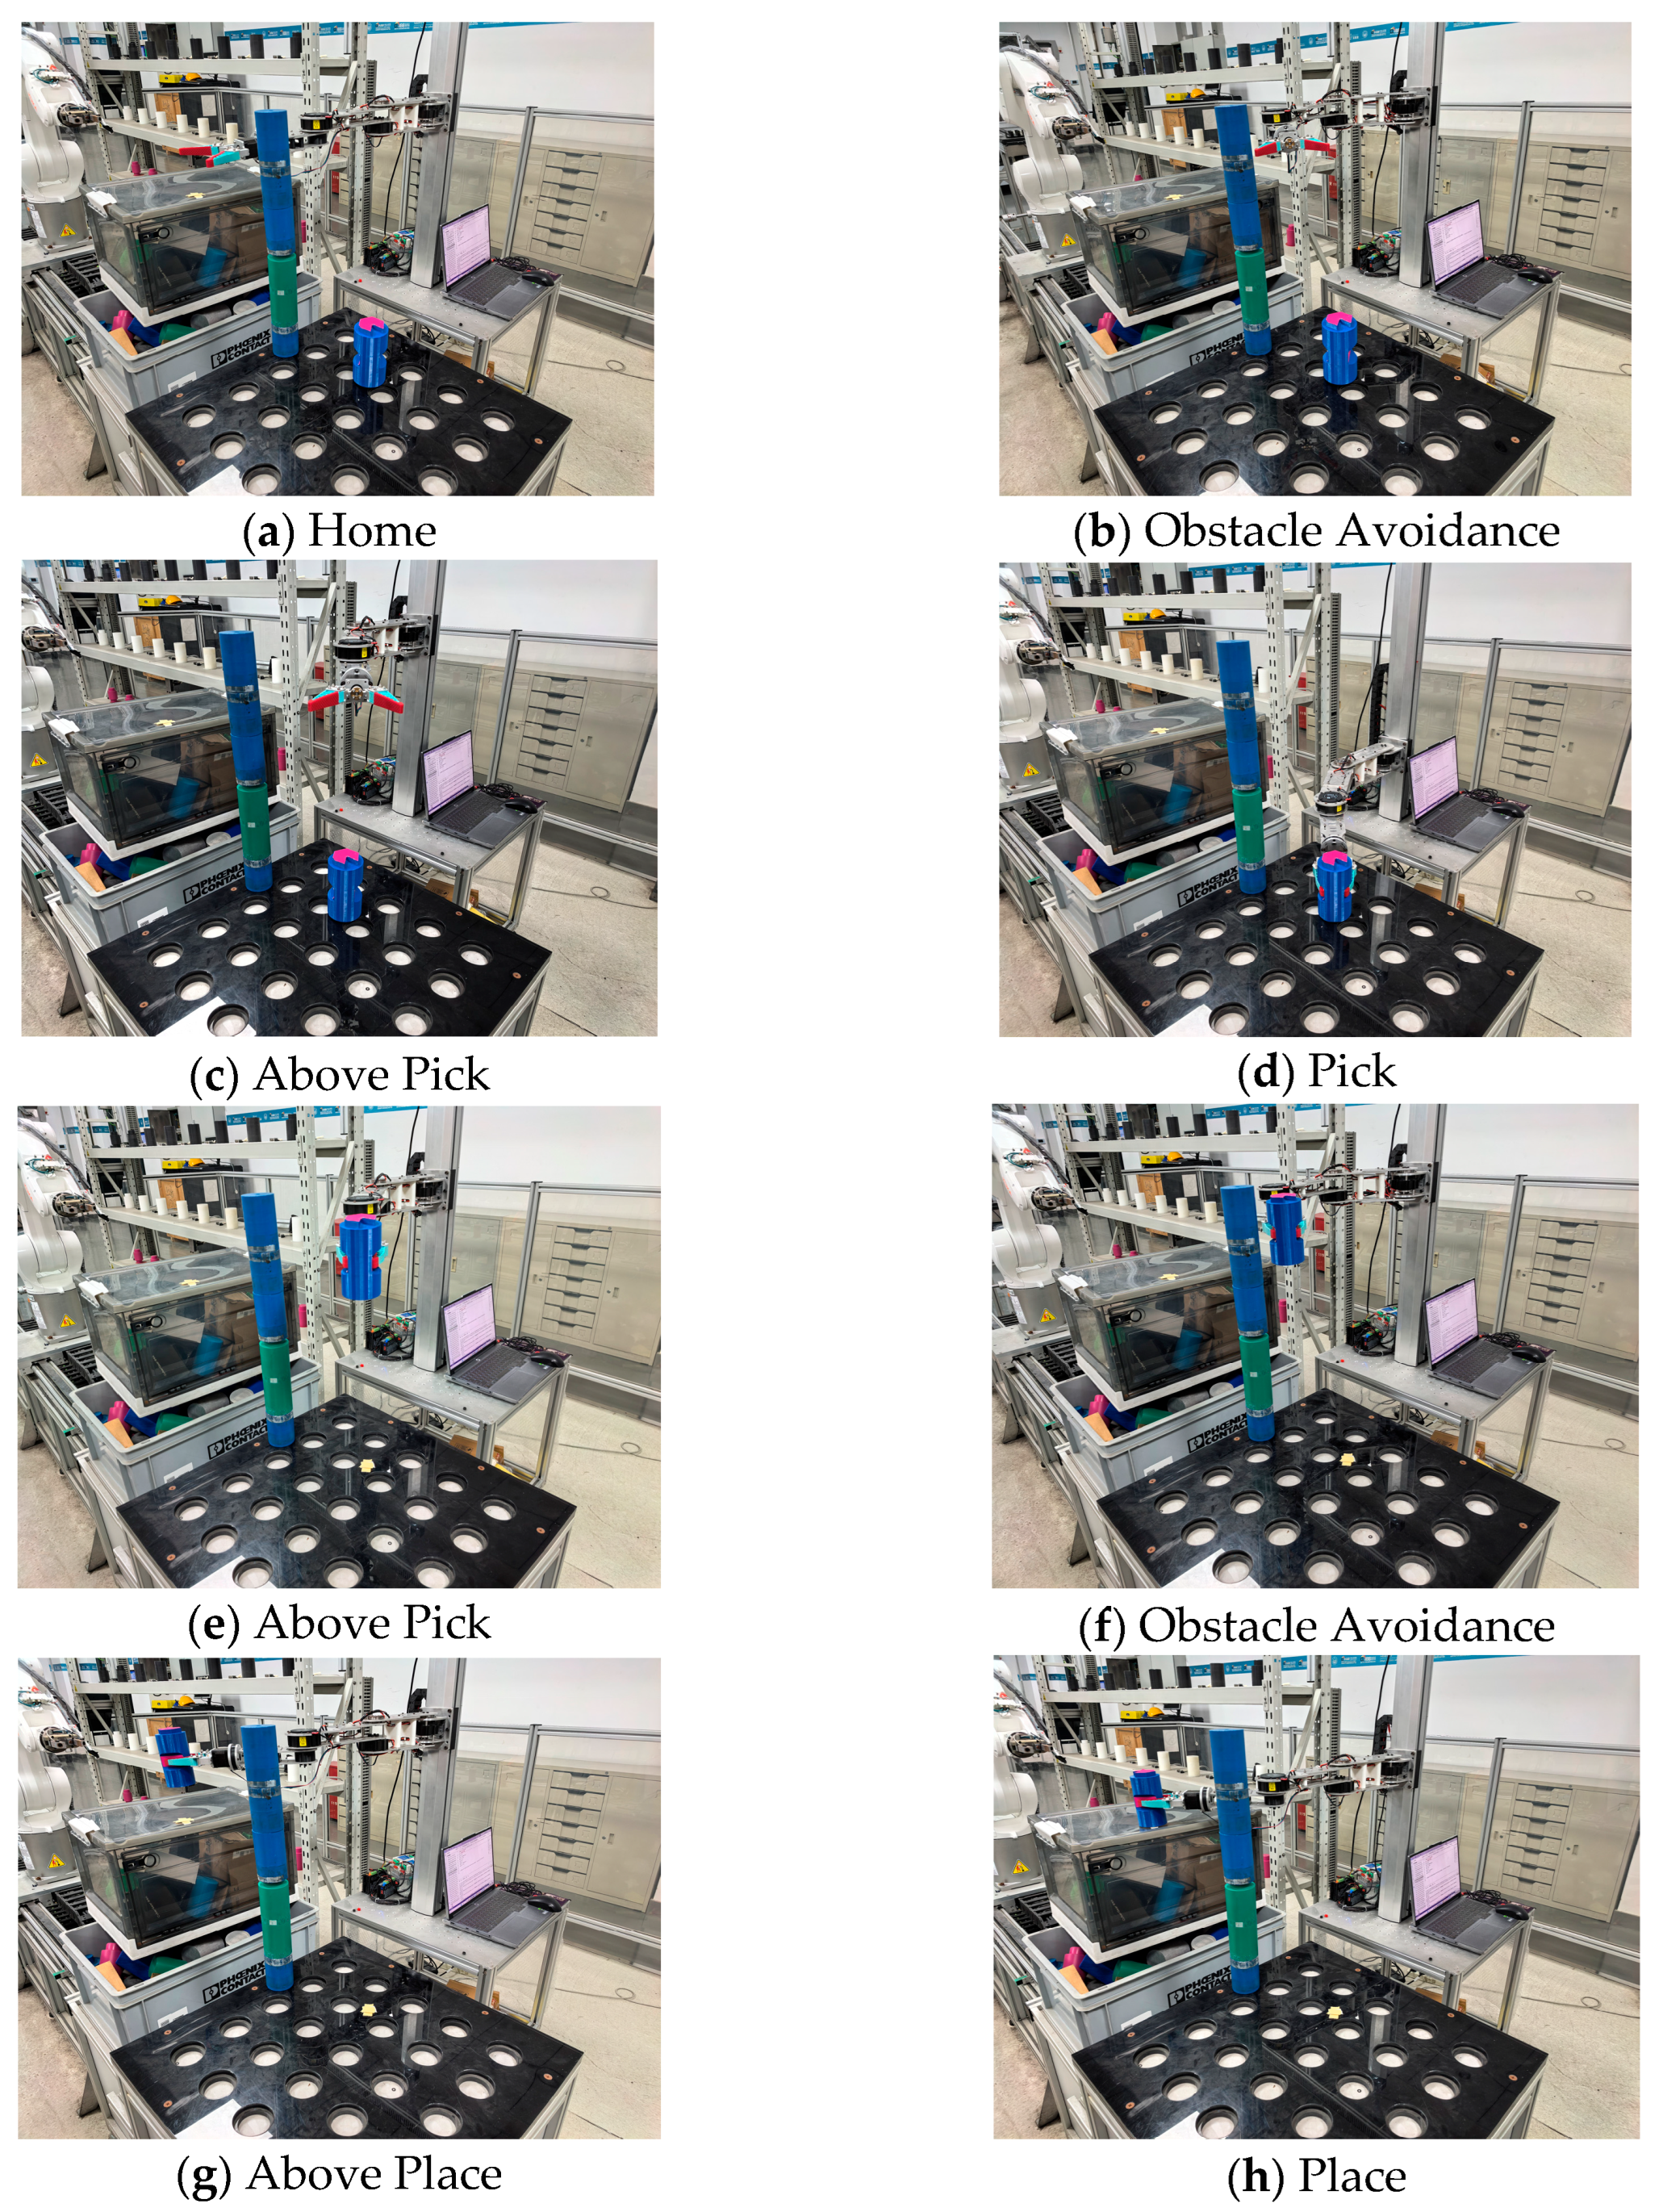
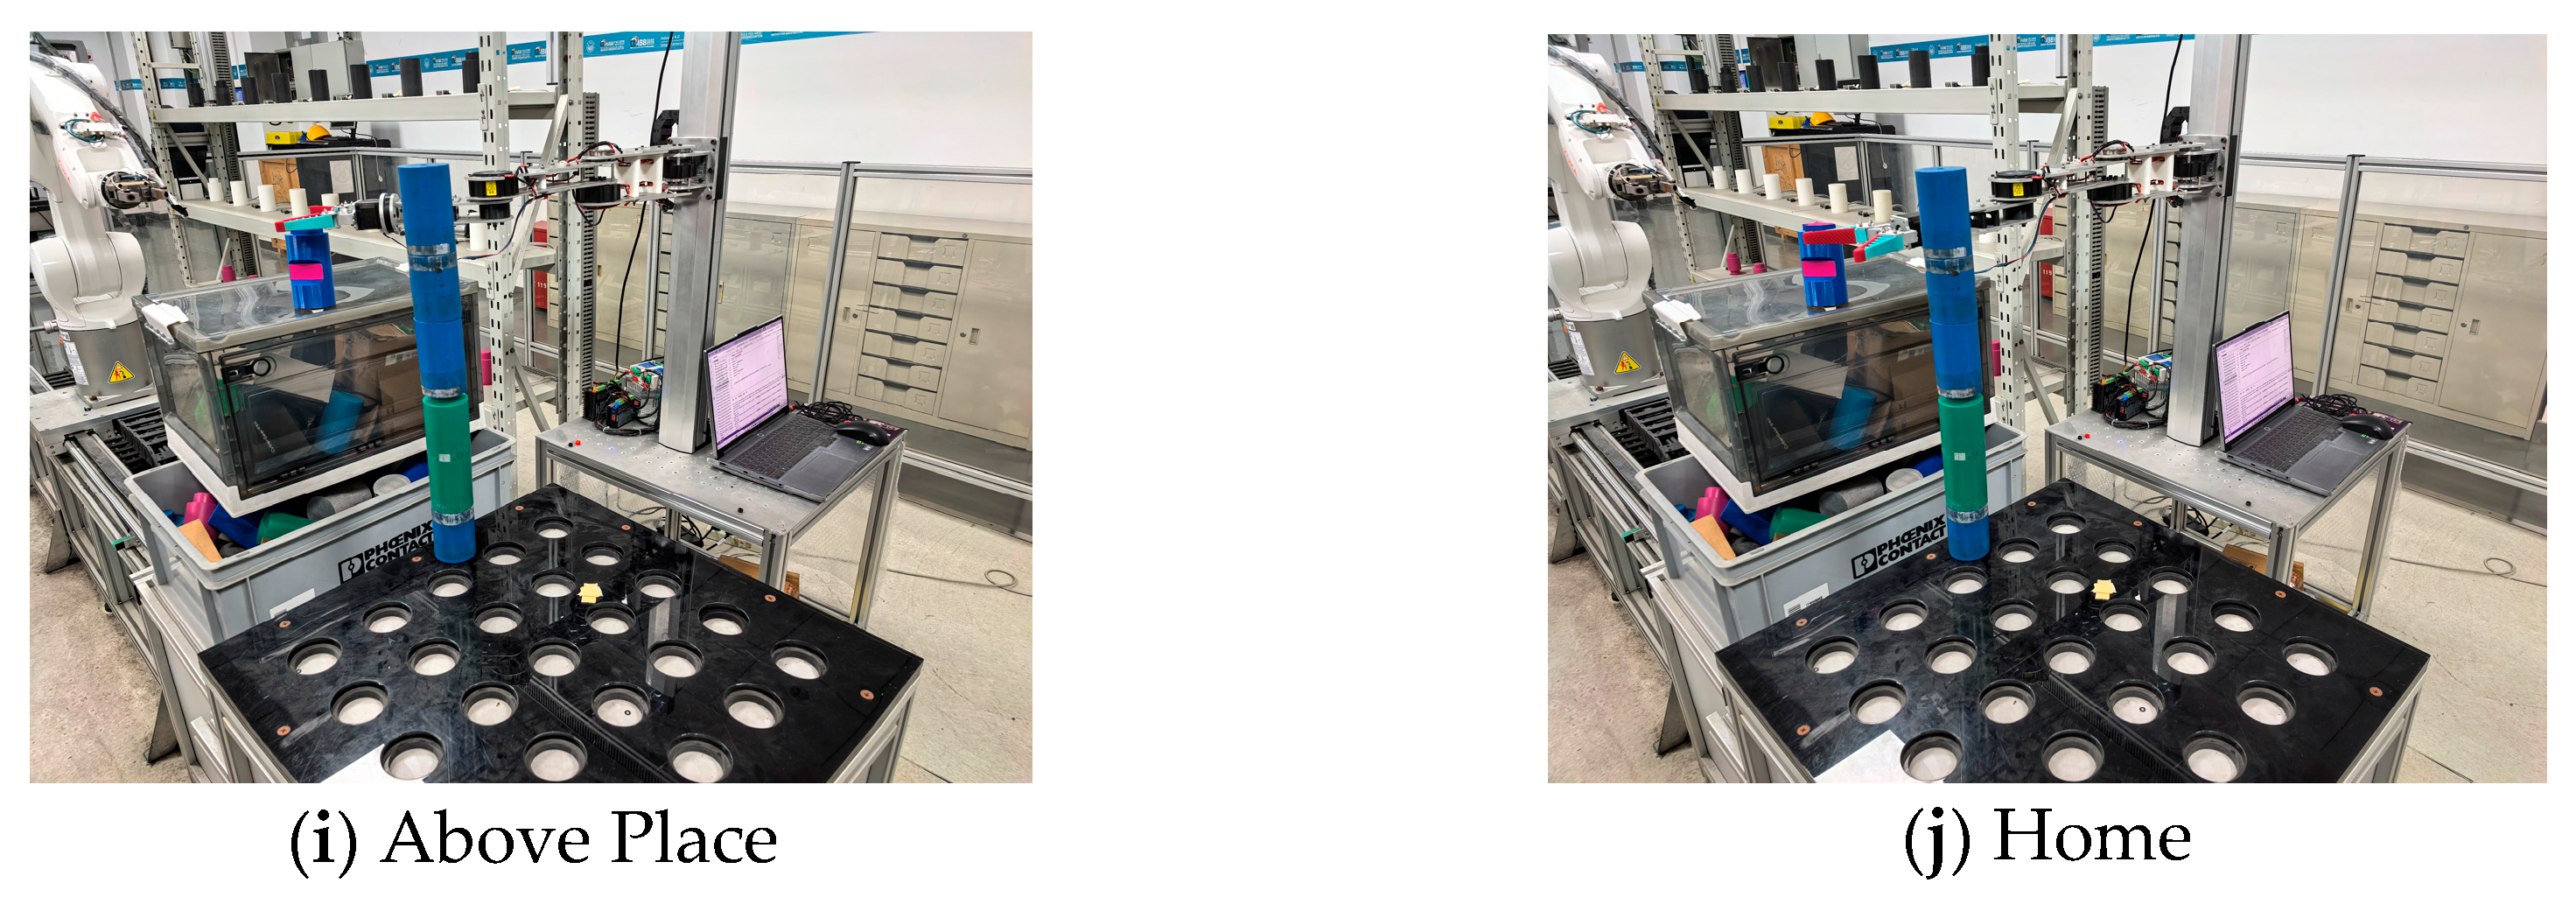
A fixed staged safety-validation protocol was used for the physical obstacle-constrained task. First, unloaded motion was executed without the cylinder and without grasping an object. Second, the cylinder was installed, and an unloaded obstacle-avoidance run was completed. Finally, the complete loaded pick–avoid–transport–place task was executed. This order was selected conservatively for laboratory safety and was kept fixed rather than randomized across conditions. Consequently, the physical experiment should be interpreted as a staged executability and safety demonstration rather than as a randomized comparative performance trial. The repeated loaded-task results are summarized in
Table 15.
The two physical conditions correspond to the optimized trajectory cases used in the high-fidelity comparison: the median-link condition is S0T1, i.e., the median-link mechanism with its re-optimized trajectory, whereas the optimized condition is S1T1, i.e., the selected mechanism with its corresponding re-optimized trajectory. S0T0 was not used as the physical comparison baseline in
Table 15. Both physical command sequences were derived from the corresponding high-fidelity collision-checked trajectories and converted into staged executable commands.
The total physical times of 434.2 and 434.0 s in
Table 15 are wall-clock durations for the complete staged command sequences and are fundamentally different from the optimized trajectory durations reported in
Table 12. The exported physical sequences contain explicit safety dwell periods, gripper opening and closing actions, vertical pick/place motions, command transmission, acknowledgement synchronization, and actuator execution time. In the archived command sequences, the prescribed dwell/wait periods alone total 388 s for each condition. Therefore, the approximately 434 s wall-clock values are not expected to reproduce the 28–29 s high-fidelity trajectory duration objective and are not used as evidence of trajectory-time improvement.
The observed grasping and placement success rates were 70% for S0T1 and 90% for S1T1. With only ten loaded trials per condition, this difference is treated only as a descriptive observation and is not used to claim a statistically significant improvement in physical task performance. The archived physical records distinguish success or failure at the grasping and placement outcome level, but they do not provide an instrumented post hoc classification of individual failure mechanisms, such as grasp misalignment, object slip, tracking-induced deviation, or other execution disturbances. Accordingly, no unsupported failure-mode percentages are introduced retrospectively.
The real-arm control program was configured with a nominal 20 Hz control-loop setting; however, execution of the present staged task was command- and acknowledgement-driven and included explicit dwell intervals, so this nominal value should not be interpreted as the effective constant trajectory-sampling rate of the physical experiment. A unified command-level speed-scaling factor, quantitative payload characterization, joint-tracking-error history, and directly instrumented physical clearance were not recorded as independent experimental variables for these proof-of-concept trials. The clearance values reported in
Figure 10 are therefore high-fidelity geometric calculations rather than physical sensor measurements. For these reasons, the physical experiment is used primarily to demonstrate executable command conversion and the absence of observed cylinder collision or joint-limit activation in the tested trials, whereas quantitative trajectory-performance conclusions are based on the high-fidelity optimization and factor analysis.
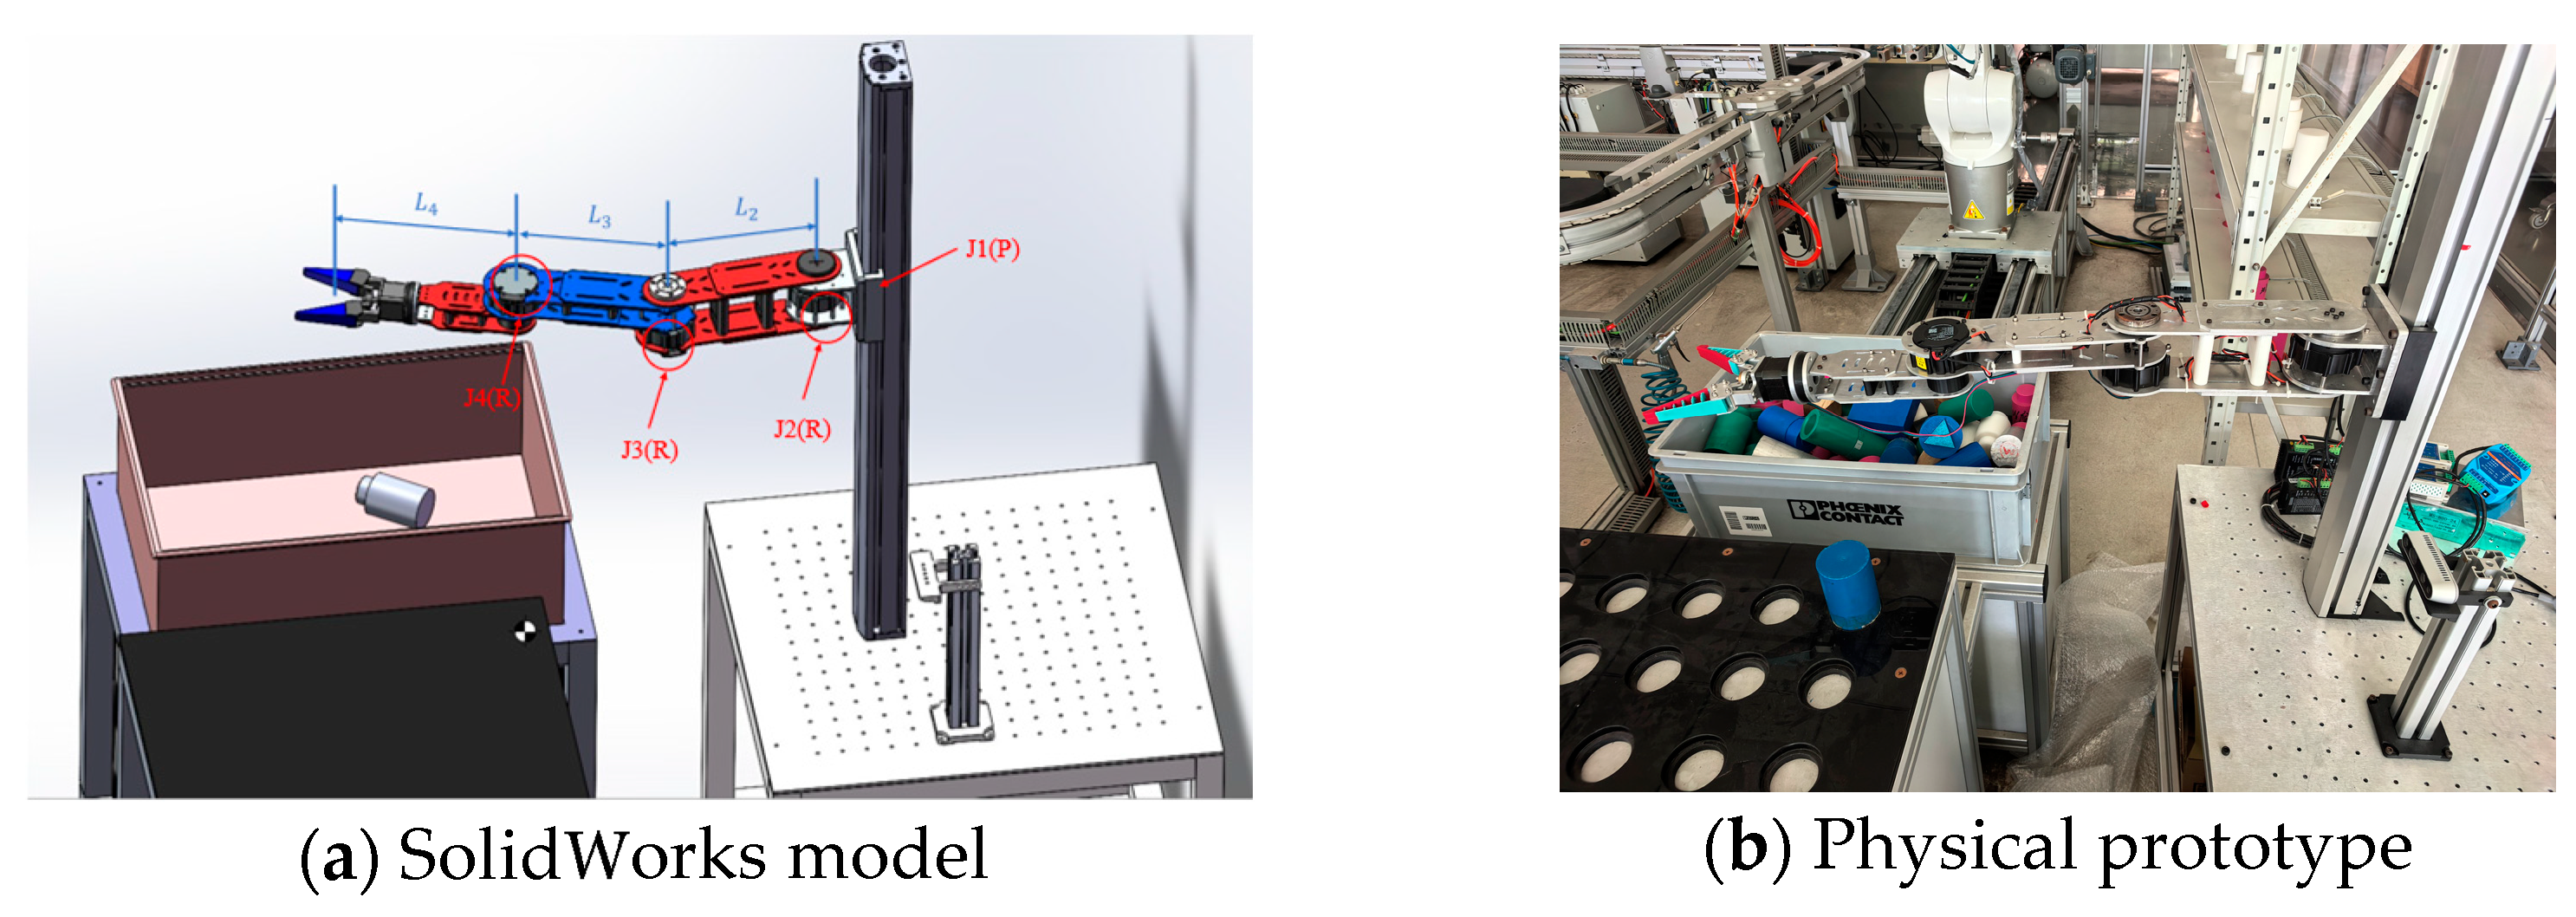
Figure 13 presents representative stages of the physical cylindrical obstacle handling experiment and demonstrates that the optimized avoidance trajectory can be converted into executable manipulator commands.