Article

A Constraint-Based Safety Evaluation Model for Low-Impact Separation of Combined UAVs

National Key Laboratory of Aerospace Mechanism, Nanjing University of Aeronautics and Astronautics, Nanjing 210016, China
*
Author to whom correspondence should be addressed.
Machines 2026, 14(9), 1074; https://doi.org/10.3390/machines14091074 (registering DOI)
Submission received: 16 August 2026 / Revised: 8 September 2026 / Accepted: 16 September 2026 / Published: 18 September 2026
(This article belongs to the Section Vehicle Engineering)

Abstract

For the wingtip-connected combined UAV considered here, the proposed constraint-based assessment demonstrates that the clearance margin changes sign between the sampled 5° and 6° angles of attack, thereby bracketing the clearance transition within this interval. This study presents a deterministic, constraint-based assessment framework for the separation of wingtip-connected combined unmanned aerial vehicles (UAVs). The previously developed torque-driven compliant interface is treated as the existing physical platform rather than as a new mechanism contribution. Structural-strength, roll-control, and collision-clearance requirements are formulated as individual limit-state margins and linked by a non-compensatory minimum operator, so that failure of one quantified constraint cannot be offset by favorable performance in another. Previously reported aerodynamic, finite-element, multibody-dynamics, and ground-test records are reanalyzed as case-study inputs; they are not presented as independent validation of the complete classifier. The verified stress contours show that parametric refinement reduces the maximum equivalent von Mises stress from 17.2 MPa to 10.4 MPa (39.5%). Ground measurements acquired at 1000 Hz yield R2 = 0.96 for a descriptive sinusoidal fit, supporting response smoothness but not proving the complete low-impact safety hypothesis. The framework therefore provides a traceable requirement-checking route; with the presently retained records, its demonstrated implementation is a clearance-decision template rather than a numerically complete three-channel safety index.

1. Introduction

Wingtip-connected aircraft can cruise as a high-aspect-ratio assembly and later recover independent flight capability through controlled separation [1,2,3,4,5,6,7,8,9,10]. The safety problem is therefore not limited to whether a connector unlocks. During the short transition from a constrained multibody configuration to two free bodies, structural capacity, release-induced rolling moment, and local collision clearance must remain acceptable at the same time. A mechanism may exhibit smooth motion while still producing an unsafe trajectory, whereas a collision-free trajectory does not by itself demonstrate adequate structural or control margin.
Previous studies have addressed multibody flight dynamics, wingtip docking, aeroelastic coupling, and separation devices [11,12,13,14,15,16,17,18,19,20]. Recent work has also examined UAV operational-risk modelling, sense-and-avoid performance, safety spacing, and collision-risk assessment [21,22,23,24,25]. In structural and system reliability, limit-state functions distinguish safe and failed domains, while a series system fails when any required component limit state is violated [26,27,28]. Formal aerospace safety assessment additionally uses functional-hazard and failure-mode analyses to relate failure conditions, severity classes, and probability objectives [29,30]. Those certification-oriented processes require traceable failure data, uncertainty models, and system evidence. The present work does not replace them, propose a new general theory of limit states, or estimate a probability of failure. Instead, it adapts non-compensatory series-system logic to a specific coupled-UAV separation problem and organizes heterogeneous structural, control, and clearance evidence into a deterministic requirement check.
The scope relative to Ref. [26] is as follows: The interface configuration, working principle, sinusoidal groove law, multibody response, and original ground-test records originate from Ref. [26]. Their reuse and the derived clearance margins in the present paper are explicitly treated as reprocessing or reinterpretation. The present contribution is limited to defining the three application-specific limit states, establishing the non-compensatory decision logic, tracing a failed decision to the violated constraint, and evaluating threshold sensitivity and evidential limitations. The mechanism and its original dynamic characteristics are not reclaimed as new contributions.
The principal contribution Is an application-specific assessment workflow rather than the minimum operator itself. It defines normalized limit-state margins for structural strength, roll-control authority, and geometric clearance and combines them non-compensatorily, ensuring that violation of one constraint cannot be offset by favorable performance in another. The normalization scales affect margin magnitudes and the identification of the active constraint but not the sign of each margin. The stationary-pin refinement is included only as a structural-channel case result.
Section 2 describes the existing platform and assessment inputs. Section 3 formulates and applies the deterministic limit states, evaluates clearance-threshold sensitivity, and distinguishes calculation verification from independent physical validation. Section 4 summarizes the findings and limitations.

2. Existing Separation Platform and Assessment Inputs

2.1. Previously Developed Mechanism and Scope Boundary

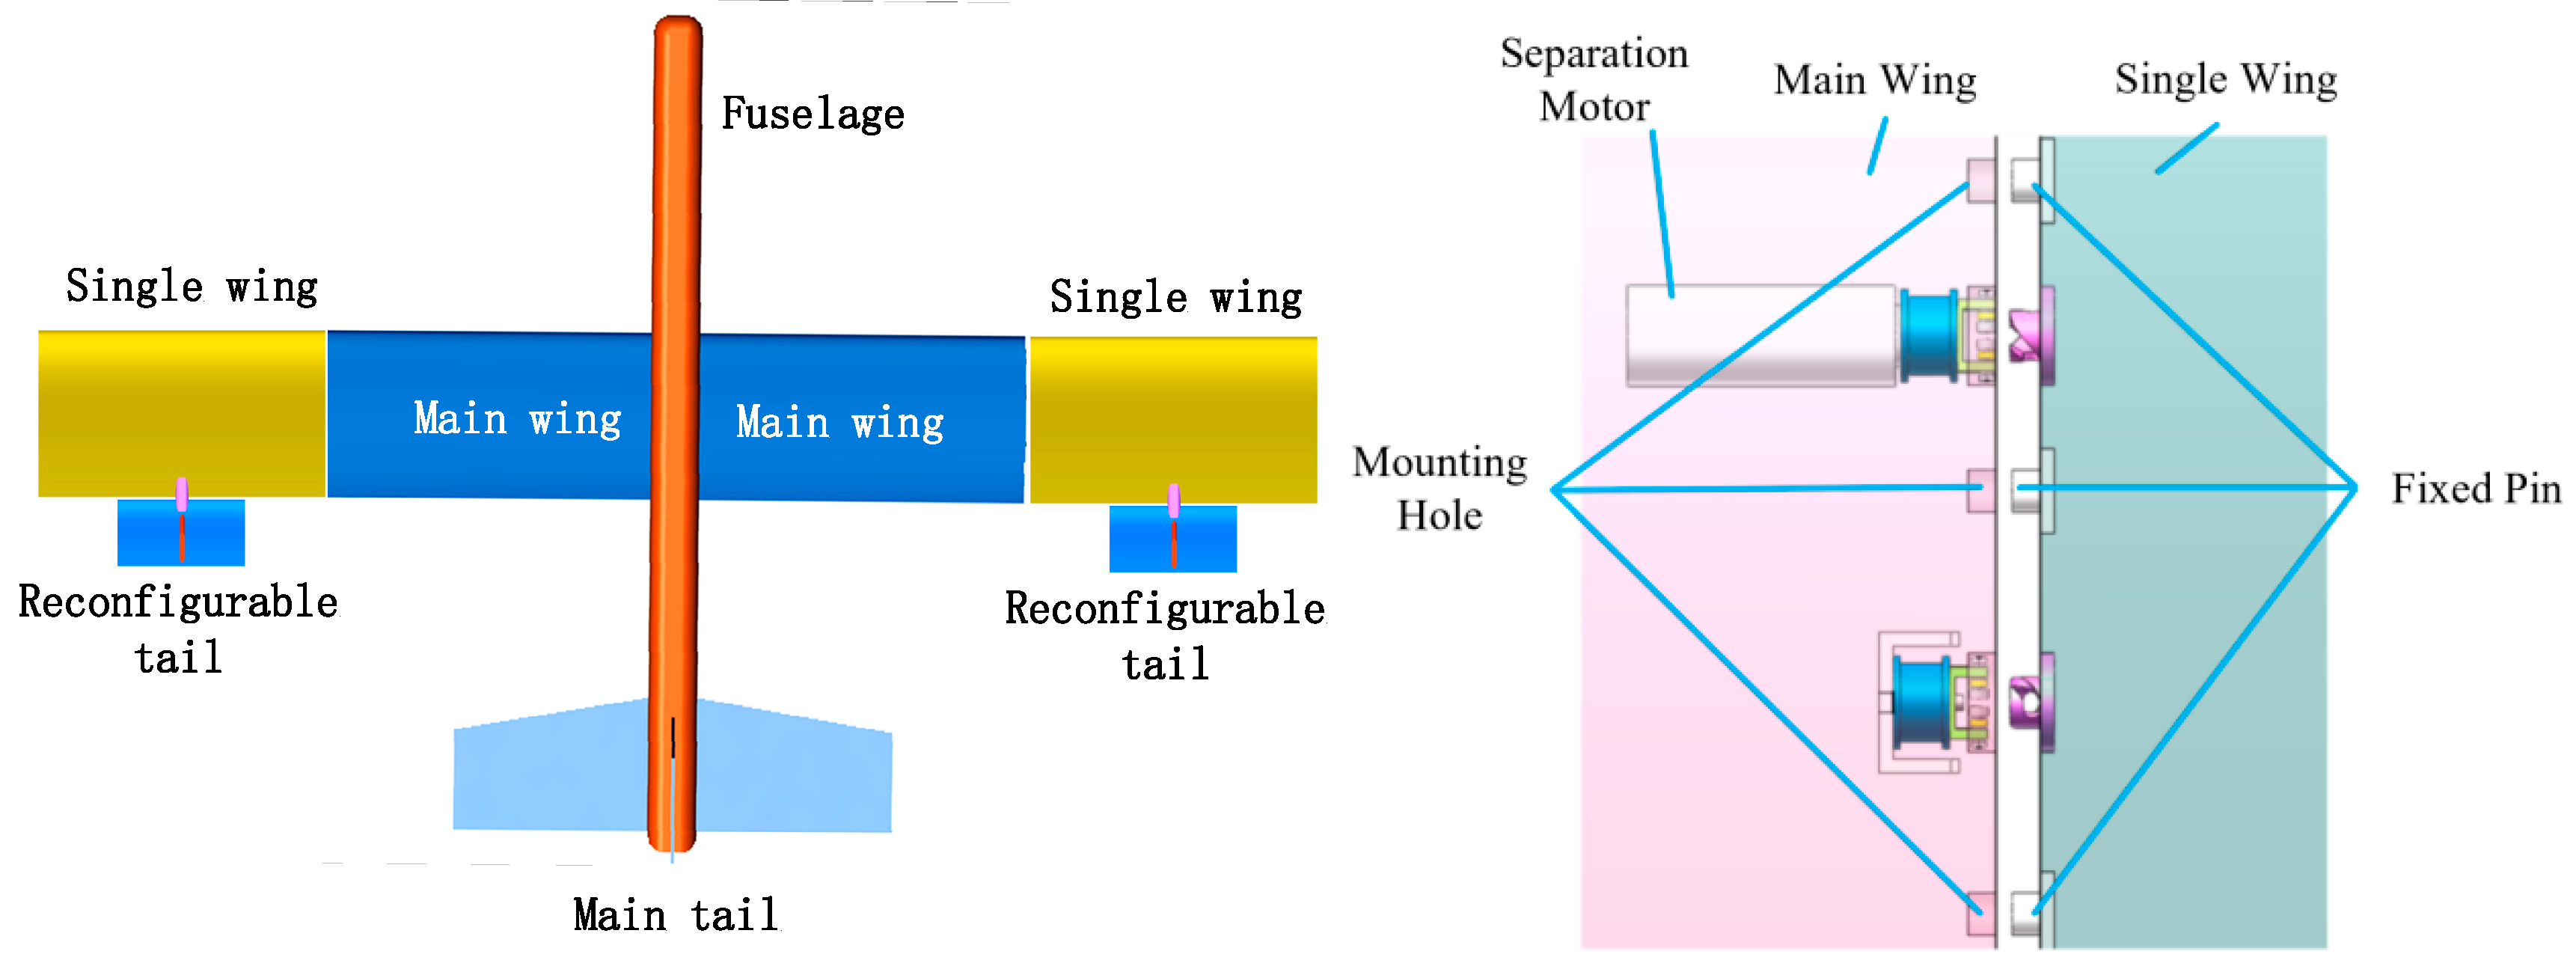
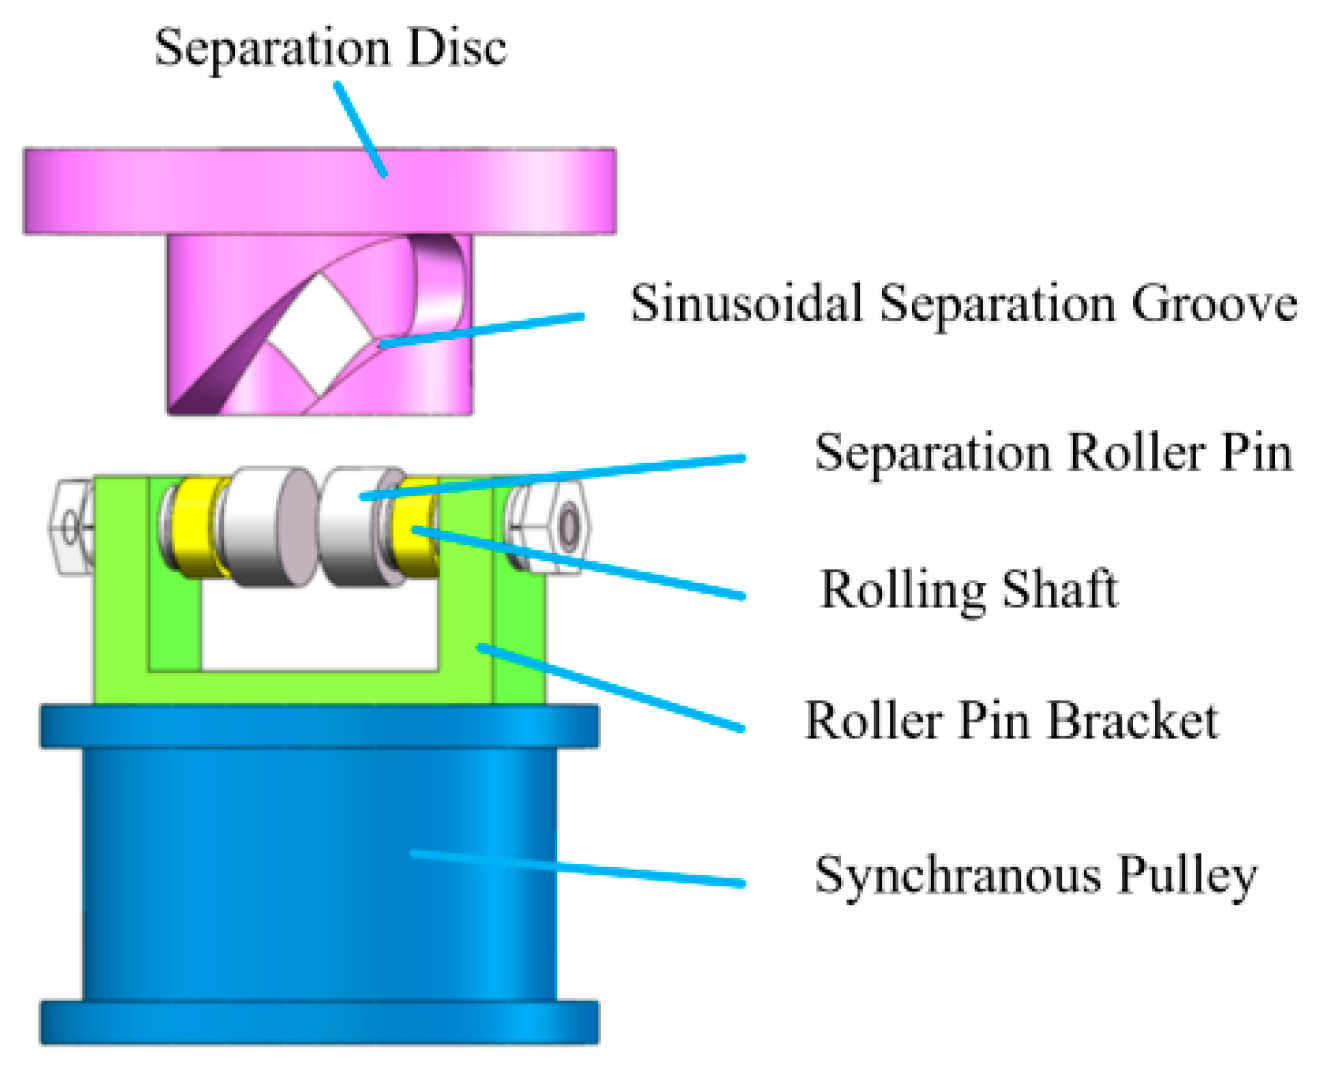
The assessment object is the torque-driven wingtip interface developed in the authors’ earlier work [26]. It comprises a synchronized drive, a rotary separation disk, rolling elements, and stationary pins. Rotation of the disk converts the prescribed groove path into an outward release stroke while the stationary pins successively leave their locating holes. Figure 1 shows the existing combined-UAV platform and docking layout used as the assessment object. Figure 2 shows the existing compliant interface adopted as the physical evaluation platform. Only the geometry, loading path, and response variables required by the new safety model are summarized here; the detailed synthesis and original verification of the mechanism are available in [26].
In the present paper, the sinusoidal groove is not reintroduced as a new design. Its role is limited to defining a smooth reference input for the dynamic-response channel. This separation of prior hardware development from current model development reduces duplication and makes the incremental contribution explicit.

2.2. Aero-Frictional Loading Inputs

The assessment model requires aerodynamic loads, interface friction, and the resulting unlocking resistance as input quantities. Table 1 lists the geometric, material, and environmental parameters retained for this purpose. Unlike the previous mechanism-centered analysis [26], the present use of these quantities is to calculate constraint margins and identify the limiting safety channel.
The retained aerodynamic input was generated using a CFD model with approximately five million polyhedral cells, wall-resolution values of Y+ below 1, and the SST k–ω turbulence model. The archived record does not include a mesh-convergence sequence or a separate CFD validation dataset; these settings therefore document the adopted input model rather than establish mesh independence. The resulting aerodynamic load is coupled with friction at the stationary pins. The resisting friction torque is
Tf = Σi=1n μi Ni ri
where μi, Ni, and ri are the friction coefficient, normal contact force, and equivalent moment arm of the i-th contact pair, respectively. The required unlocking torque is then written as
Treq = Tf + Ta + Ts
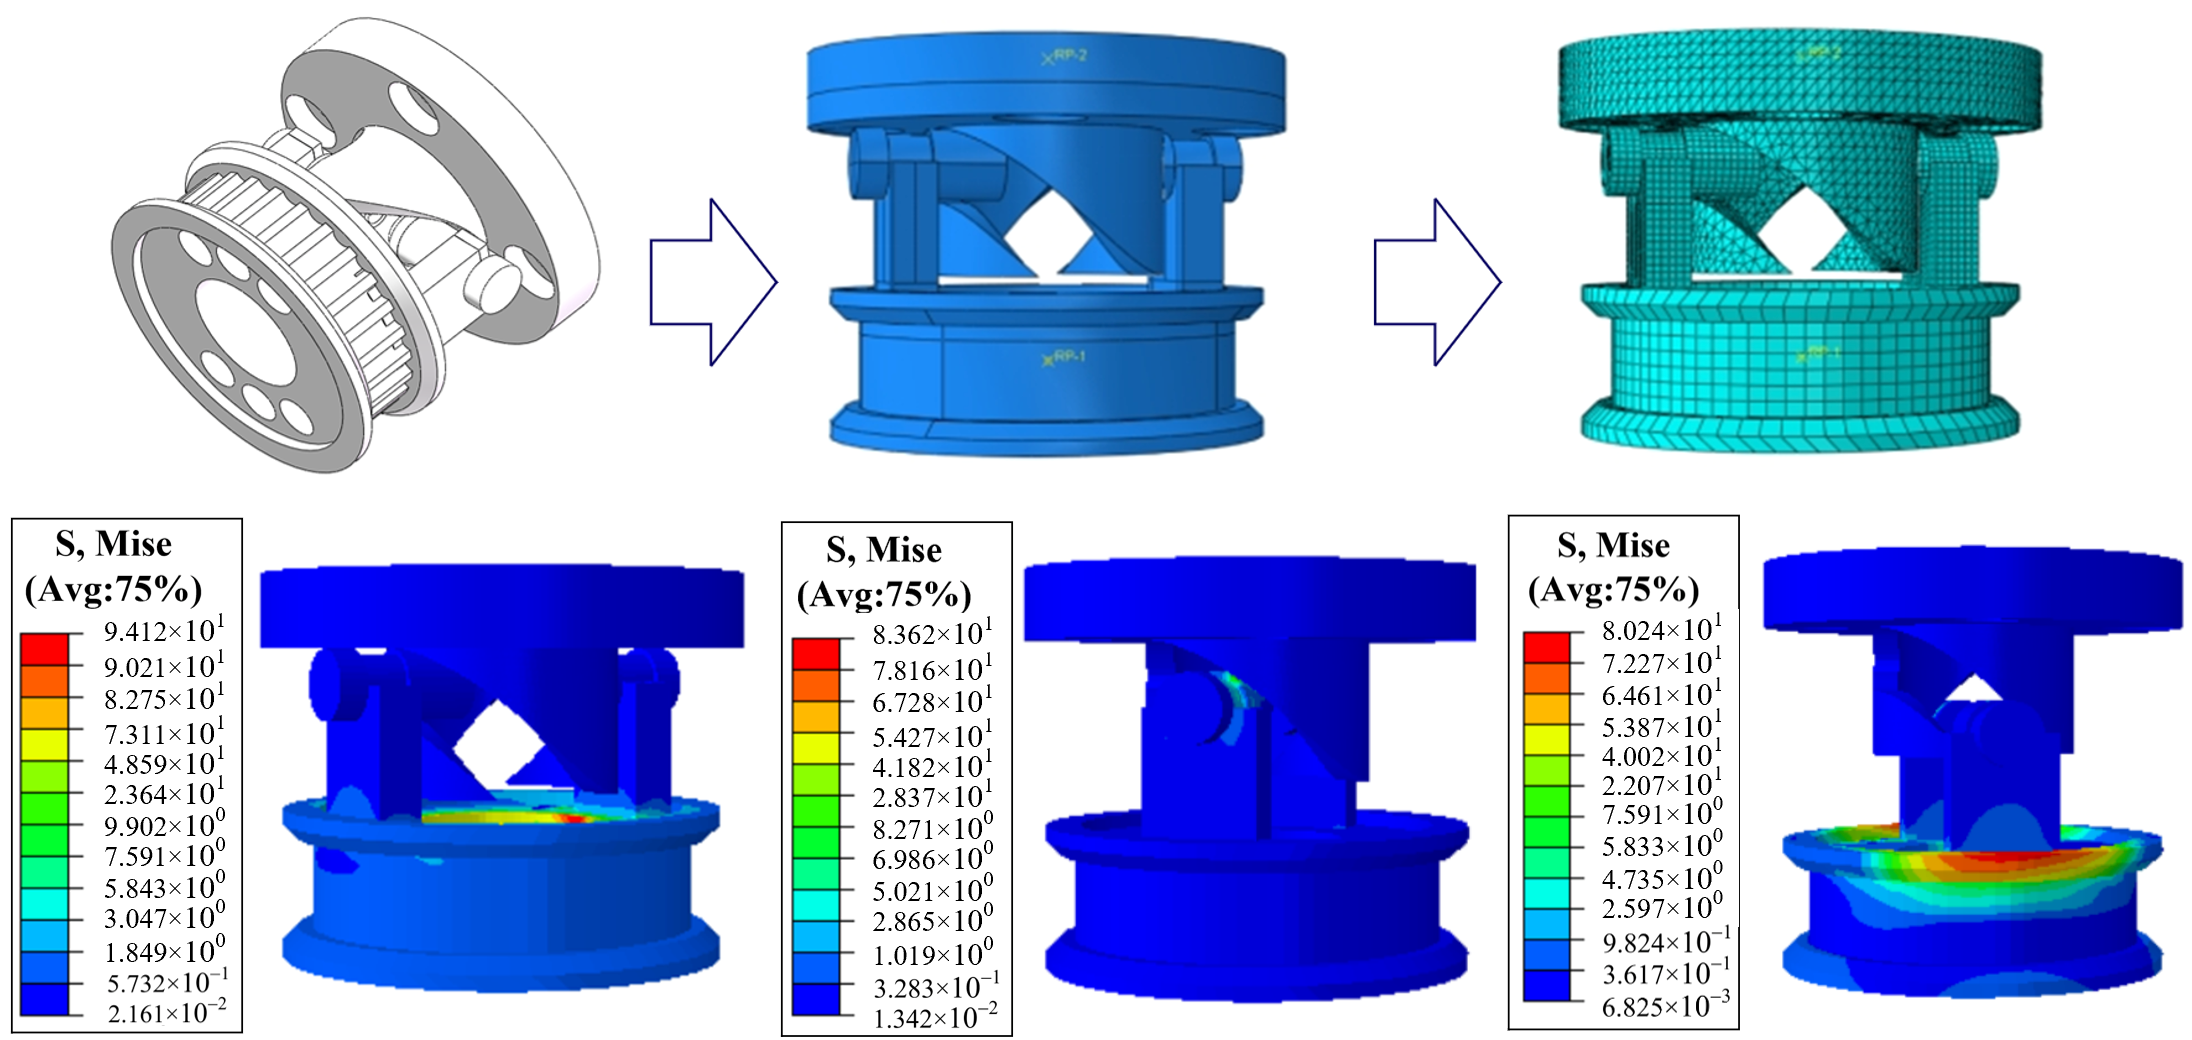
where Ta is the aerodynamic-load-induced torque and Ts is the resistance associated with local elastic deformation of the interface. Equation (2) adopts a conservative worst-case superposition in which Tf, Ta, and Ts are taken at their maximum adverse values and assumed to act simultaneously about the unlocking axis; therefore, Treq represents a design-envelope torque rather than a time-synchronized instantaneous value. The unlocking process of the separation mechanism is shown in Figure 3.

2.3. Incremental Structural Optimization and Strength Margin

A parametric finite-element model is used to improve the strength margin of the stationary-pin region before the assessment is performed. The wing root is constrained and the retained CFD pressure field is mapped to the load-bearing interface. The optimization minimizes the maximum equivalent von Mises stress subject to the original geometric envelope and functional stroke constraints. The archived record does not include a separate finite-element mesh-convergence sequence; consequently, the stress result is treated as a retained structural-channel case input and not as independent validation of the complete separation classifier.
Minx σeq,max(x),       subject to xLxxU
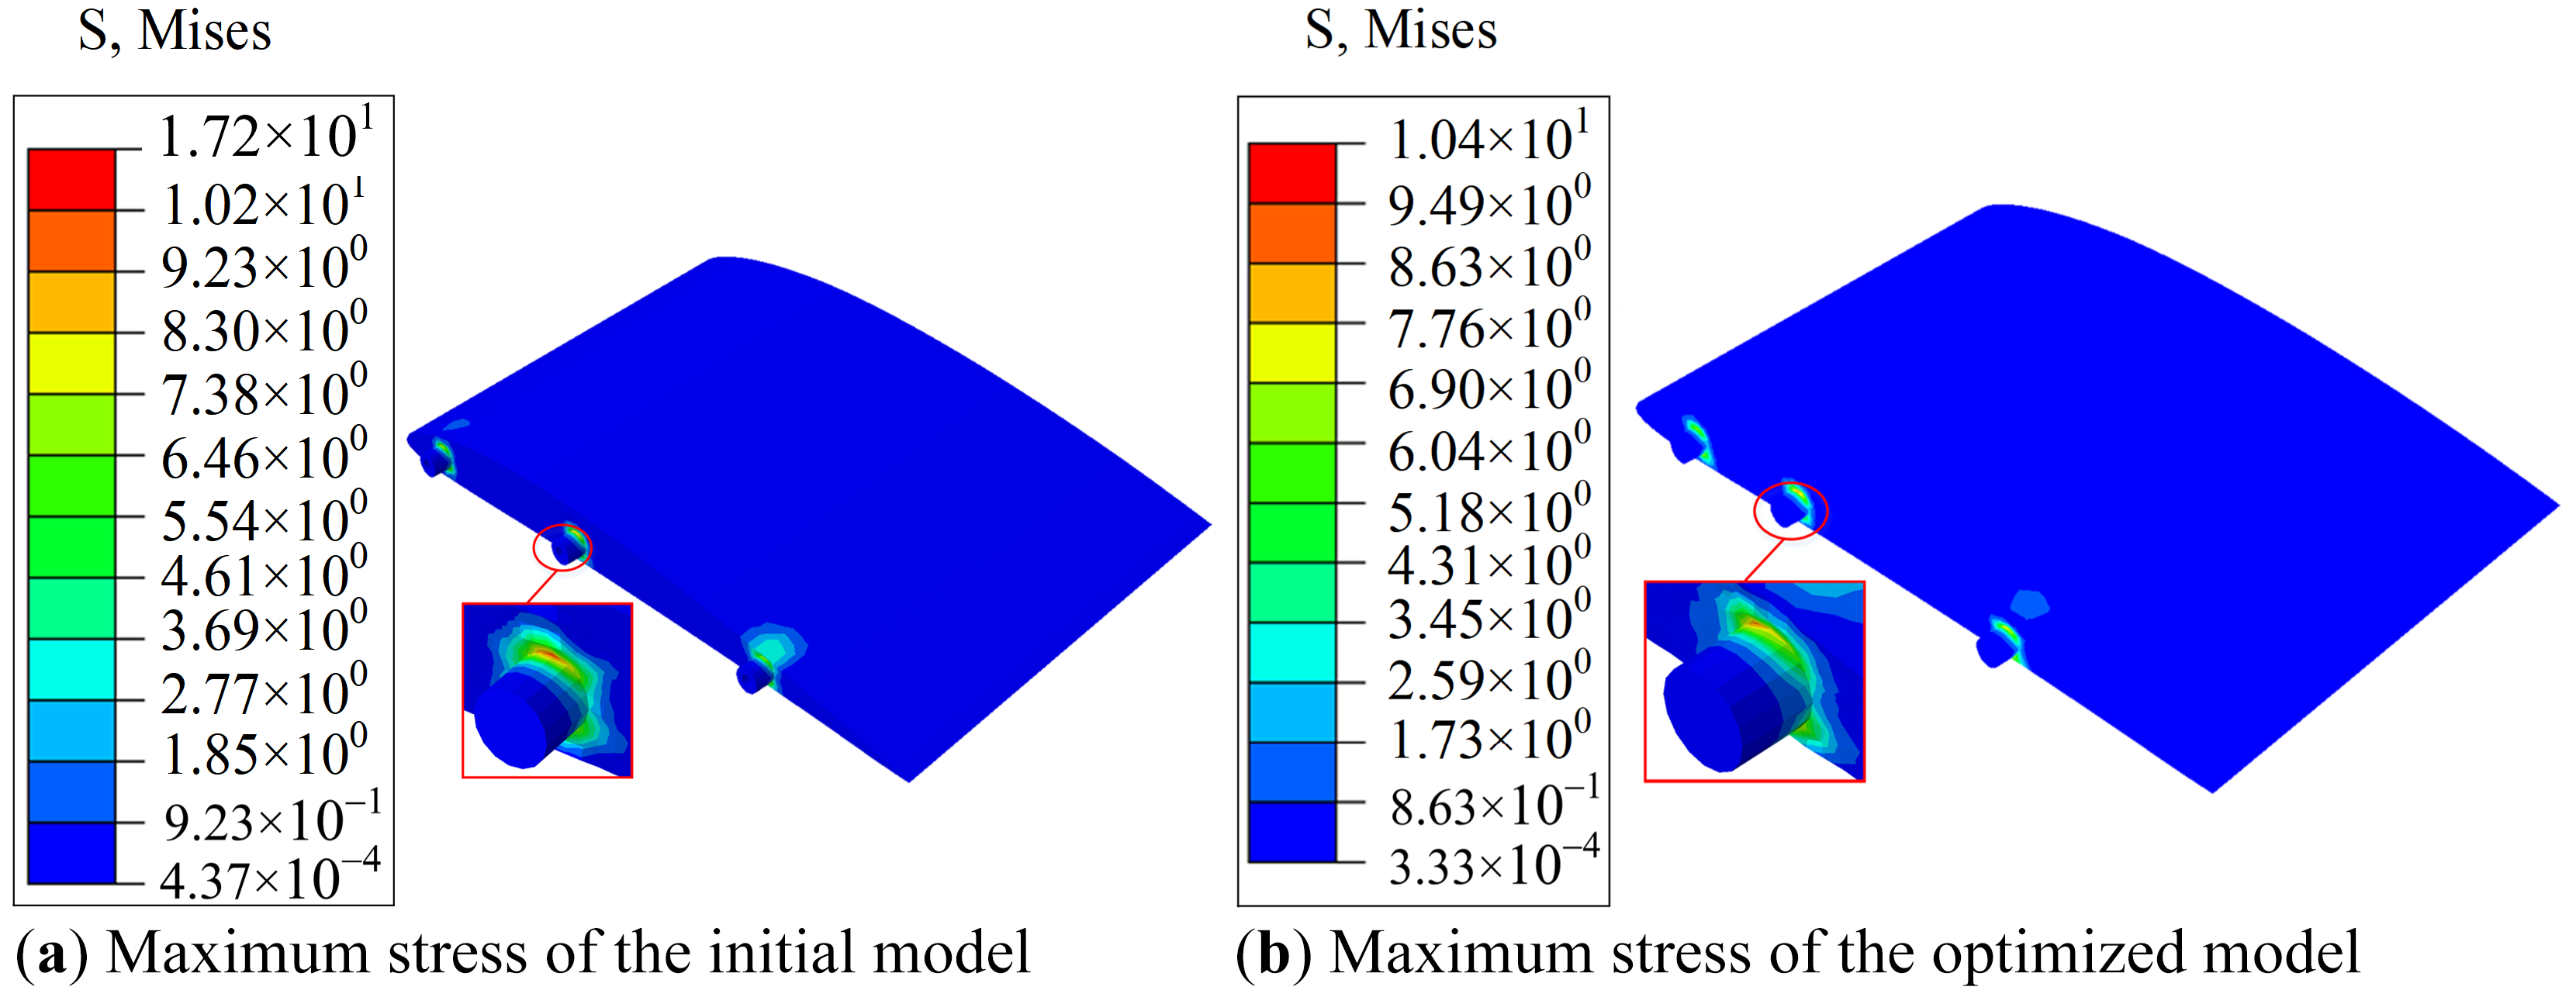
The gradient-based interior-point procedure converged after 45 iterations. Consistent with the verified contour maxima in Figure 4 and the values in Table 2, the maximum equivalent von Mises stress decreases from 17.2 Mpa to 10.4 Mpa, corresponding to a 39.5% reduction. These changes are interpreted as improvements in component-level structural performance rather than as independent validation of the complete three-channel assessment.
The stress contours in Figure 4 show that the refined geometry redistributes the local load away from the pin roots. The corresponding peak stress is subsequently used in the strength limit state of the safety evaluation model.

3. Constraint-Based Separation Safety Evaluation and Case Application

3.1. Dynamic Response as an Evaluation Input

The optimized interface is simulated using a multibody contact model to obtain the displacement, velocity, and acceleration histories required by the low-impact response assessment. Hertzian normal contact with stiffness and damping terms represents the roller–groove interaction. The model is retained as an input generator; the safety decision itself is made by the limit-state formulation in Section 3.3.
Fn = k δ 3 2 + c δ ˙
where Fn is the normal contact force, k is the equivalent contact stiffness, c is the damping coefficient, δ is the local contact deformation, and δ ˙ is the deformation rate.
For an equivalent linearized contact mode, the characteristic period is Tc = 2π√(meff/k). With k = 2.5 × 10⁶ N/m and Δt = 0.001 s, the corresponding temporal resolution is Tct = 3.97√(meff) steps per period, with meff expressed in kilograms.The specific parameters are listed in Table 3. Because the retained model record does not specify meff, a numerical resolution ratio cannot be reconstructed independently. Accordingly, Δt is reported as a reused model setting, while the response-smoothness assessment is supported by the 1000 Hz ground-test records rather than by the timestep selection alone.
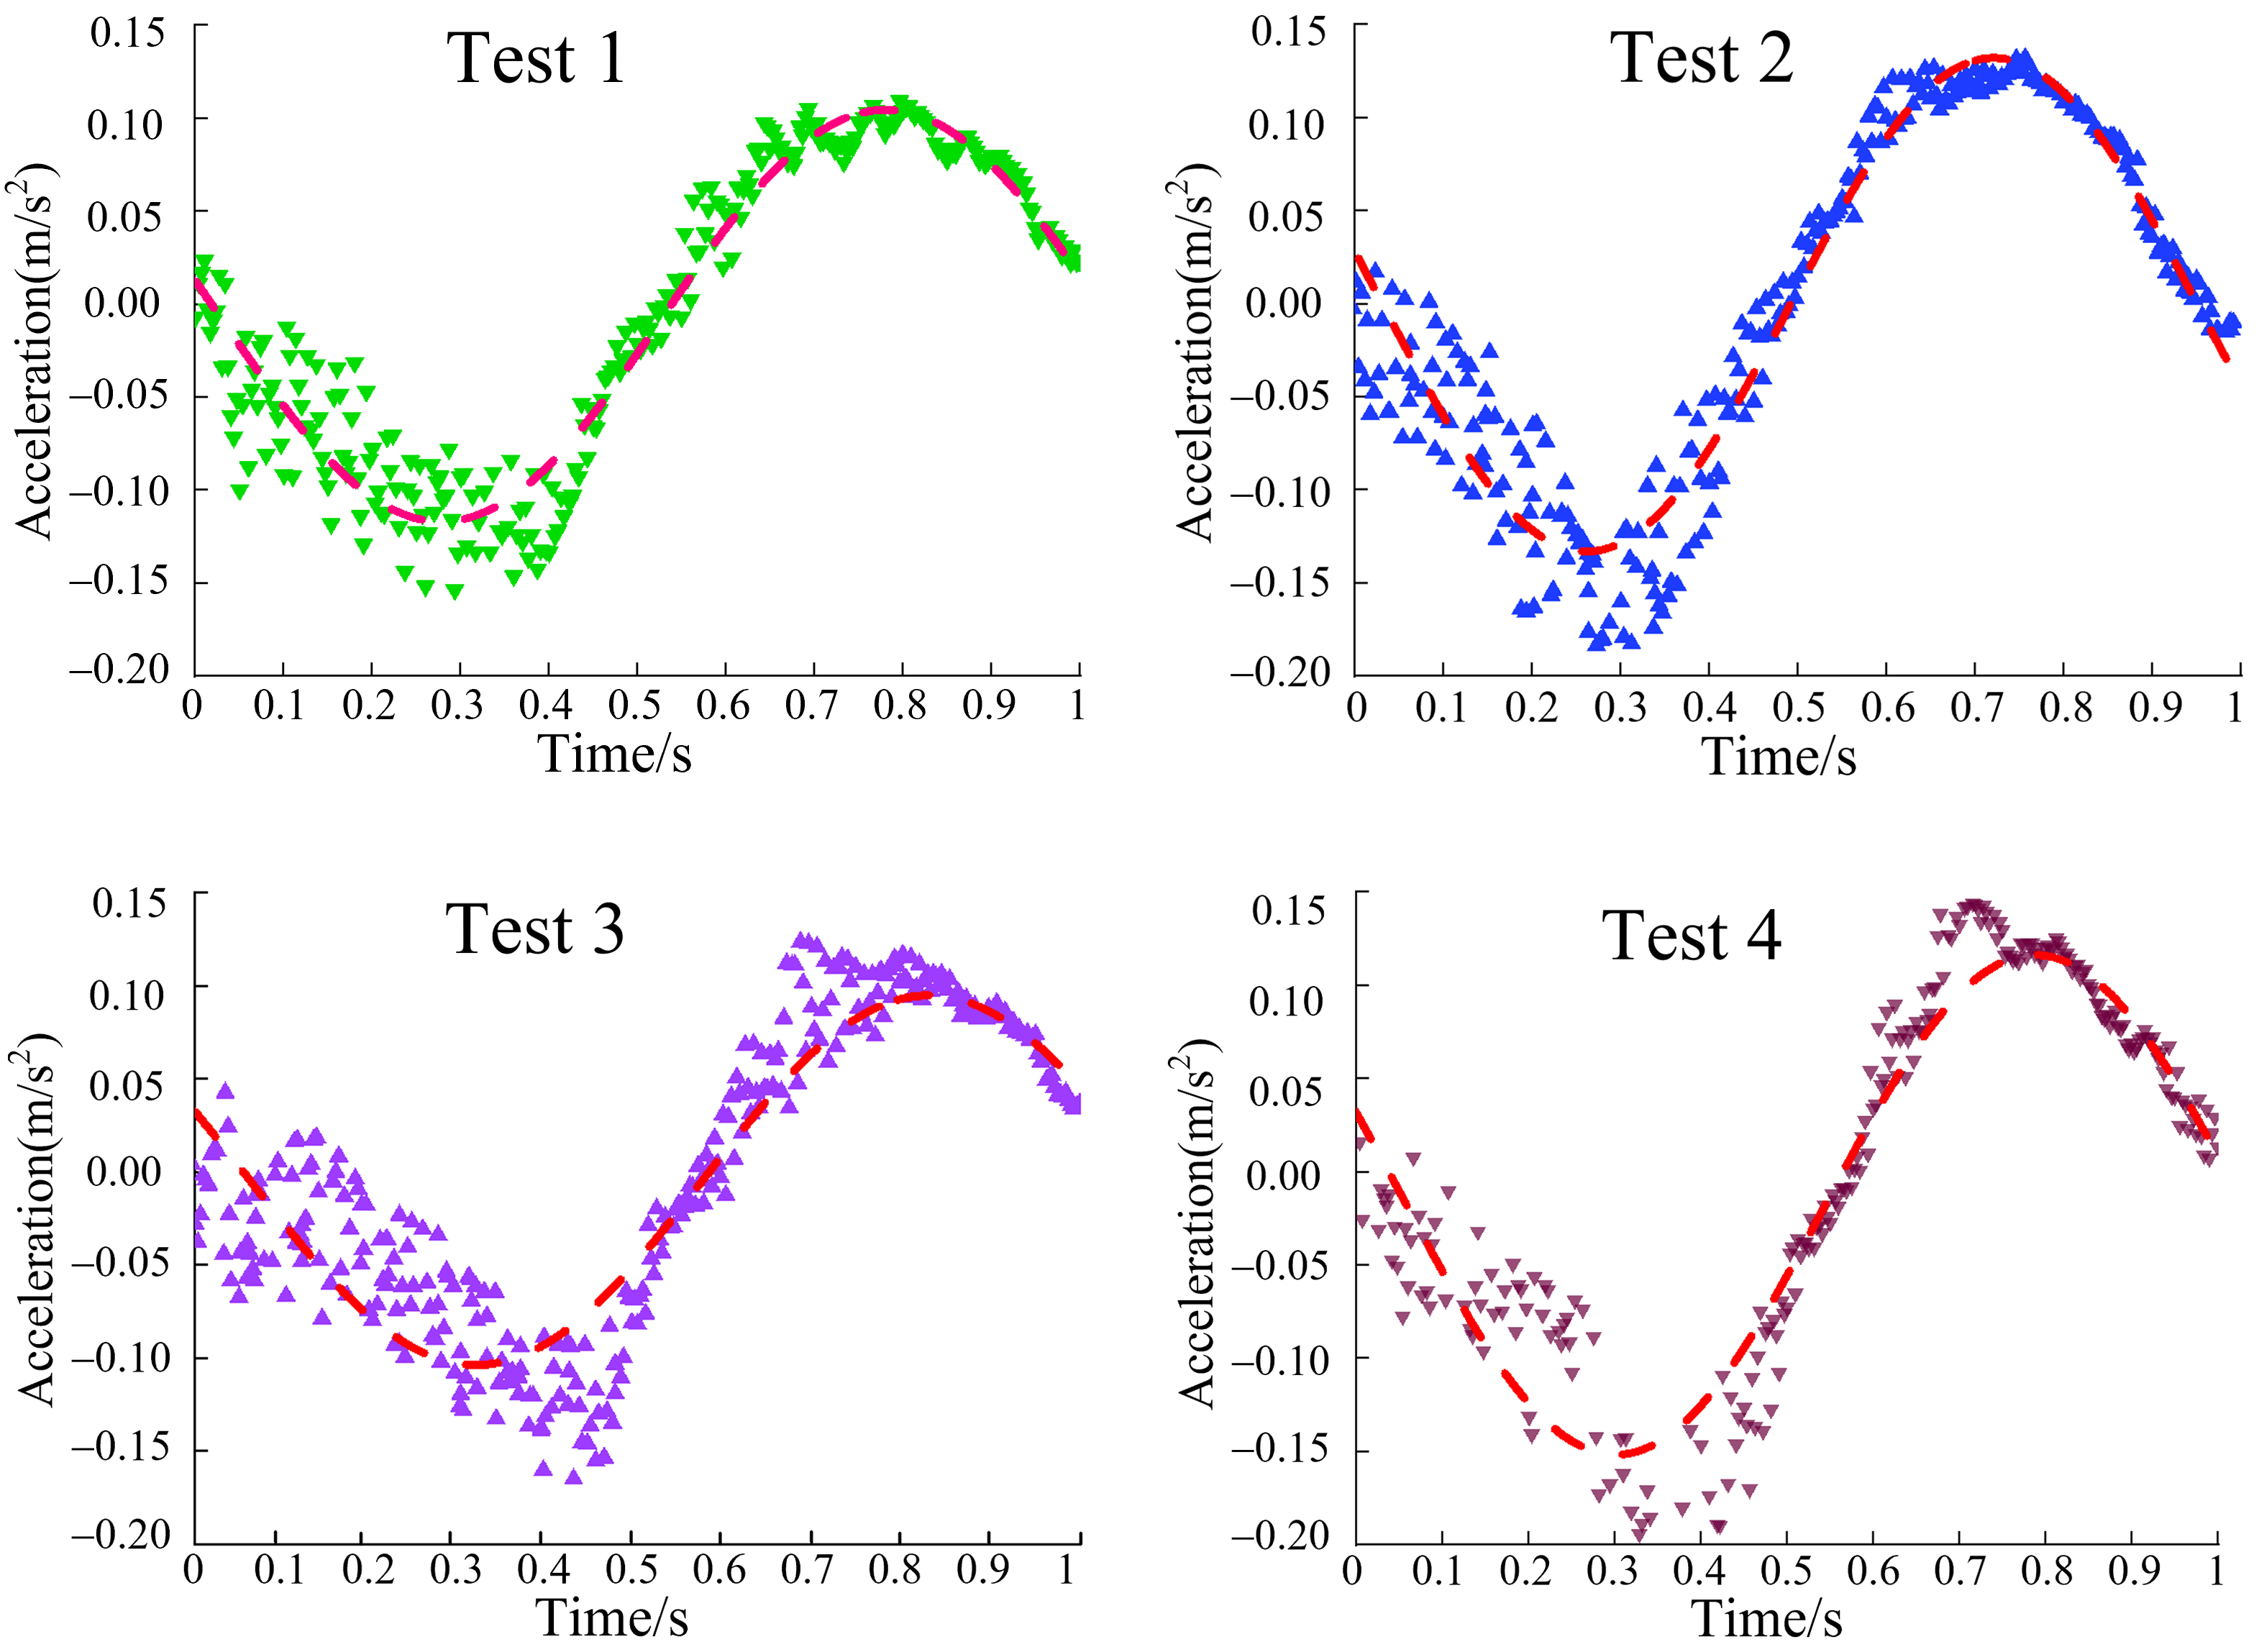
Figure 5 shows four recorded runs in the existing response dataset. Tests 1–4 identify the individual runs; the markers denote sampled acceleration values and the dashed curves denote the corresponding descriptive fits. These records illustrate the repeatability and smoothness of the measured response, but they are not used as independent evidence of collision clearance or roll-control sufficiency.

3.2. Roll-Control Constraint

Release of one wing changes the lateral lift distribution and produces a transient rolling moment. The relevant safety question is whether this disturbance remains within the available control authority, not simply whether the rolling moment is small in absolute terms.
Mroll = ΔL · y
Here, ΔL denotes the separation-induced change in the resultant aerodynamic lift represented by the adopted load model. The moment arm y is the shortest lateral distance from the aircraft longitudinal roll axis (centerline) to the line of action of that resultant load; it is not automatically equal to the wingtip distance or semispan. Both quantities must be extracted in the same body-fixed coordinate system. The calculated disturbance moment is then compared with a separately specified available roll-control moment in the normalized control margin.
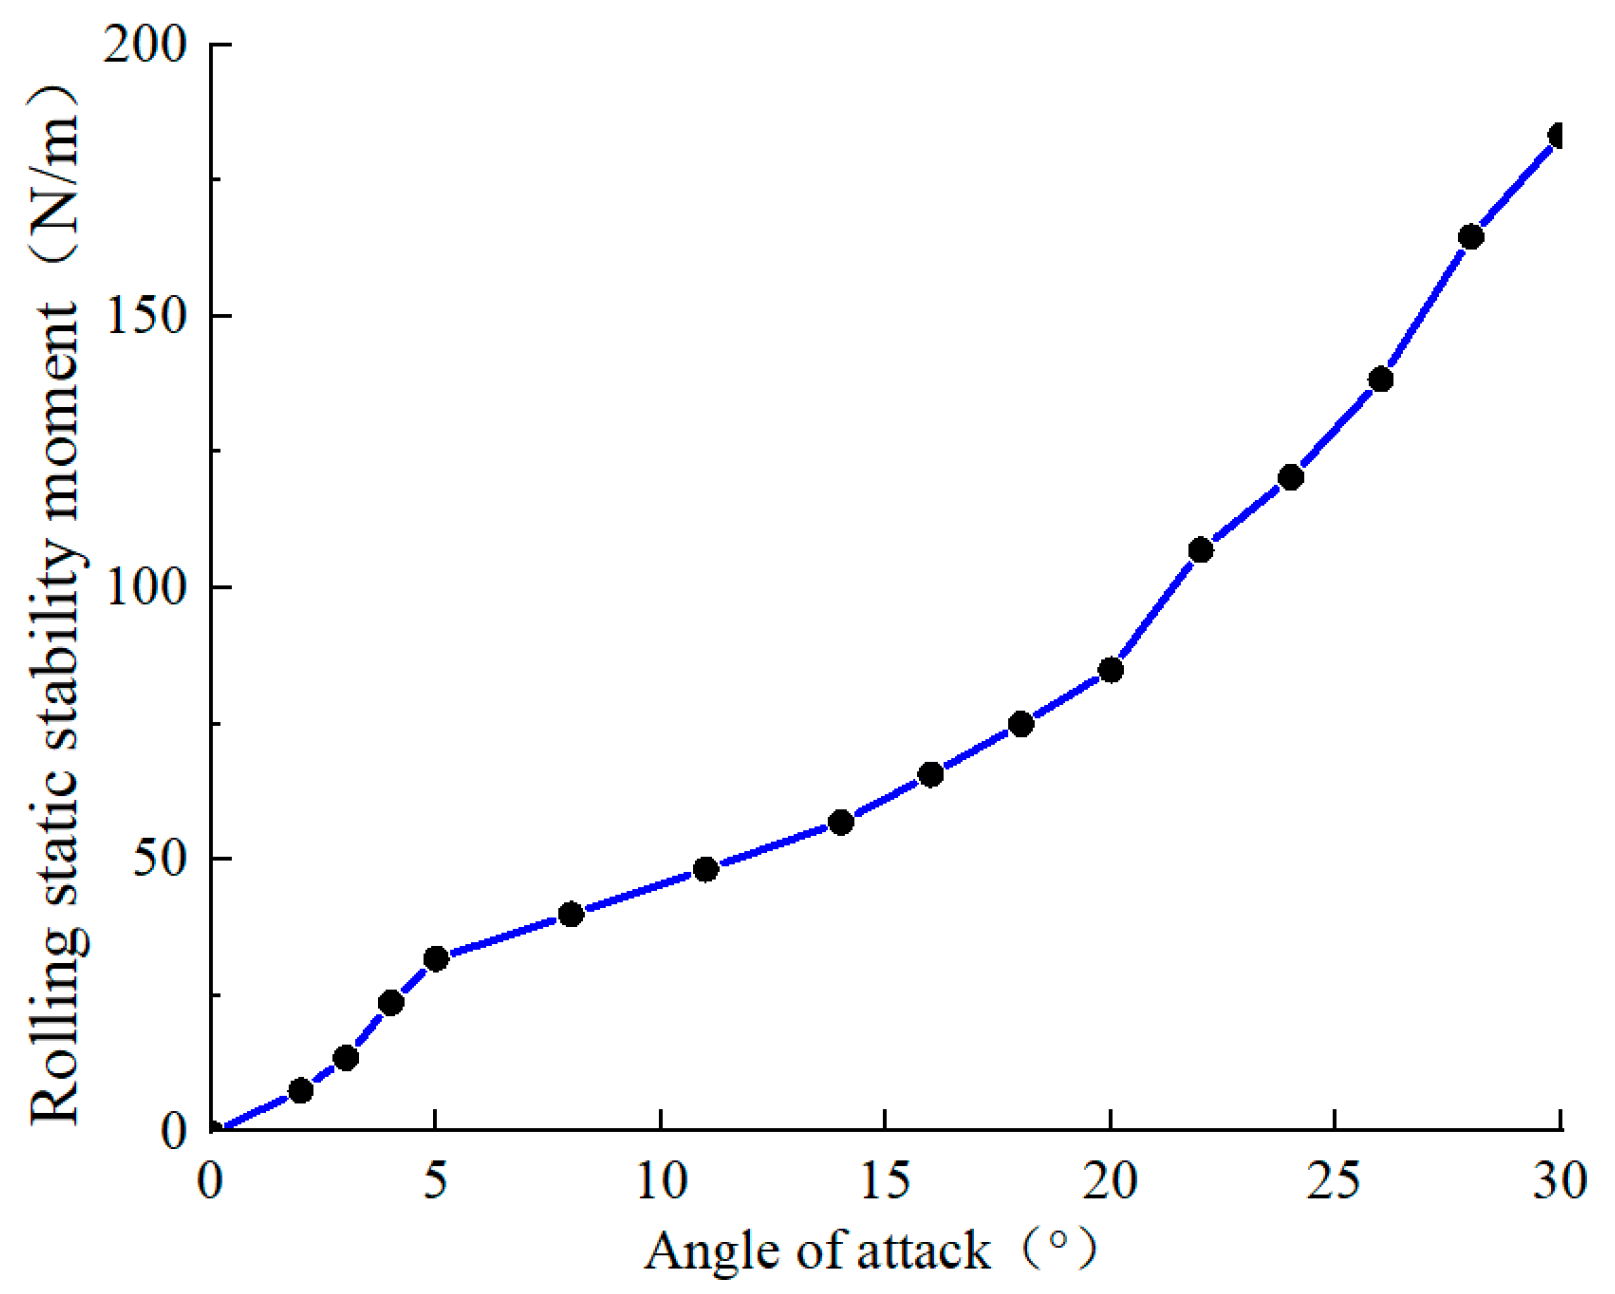
Figure 6 provides the existing disturbance-moment trend used by the control channel. Here, Mctrl is defined as the maximum corrective roll moment available about the body-fixed longitudinal axis at the specified flight condition, after accounting for trim demand, actuator limits, control allocation, and any required control reserve. It must be evaluated over the same transient and sign convention as Mroll. Because the retained record does not provide the control-effectiveness and actuator-limit data needed to reconstruct Mctrl for every Table 4 case, the revised paper neither infers missing values nor claims independent numerical validation of the positive control margin.

3.3. Constraint-Normalized Framework and Clearance-Decision Template

Three limit-state functions are defined for strength, roll control, and collision clearance. A positive value indicates compliance with the corresponding requirement, zero denotes the boundary, and a negative value indicates failure:
gσ = σallow − σeq,max,       gM = Mctrl − |Mroll|, gd = dmin − dreq
Because the three responses have different physical units, direct addition would be arbitrary. The margins are therefore normalized by their governing capacity or by a characteristic geometric length:
ησ = gσ/σallow,      ηM = gM/Mctrl,       ηd = gd/dref
For a fully parameterized application, the composite separation-safety function is defined by the least favorable normalized margin:
Ssep = min(ησ, ηM, ηd)
This minimum-margin function represents a deterministic series requirement: every quantified constraint must be satisfied. It removes the need to select empirical coefficients for a weighted average, but it does not remove all modeling choices because the normalization scales influence the relative magnitudes of positive margins and the reported active constraint. The safe/unsafe sign decision is invariant to a positive rescaling of an individual margin, whereas cross-channel ranking is scale-dependent. The decision rule is
Ssep > 0: safe;      Ssep = 0: boundary;       Ssep < 0: unsafe
In Equation (6a–d), σallow is a material- and design-specific allowable stress, σeq,max is the calculated peak equivalent stress, Mctrl is the available corrective roll moment defined in Section 3.2, Mroll is the release-induced rolling moment, dmin is the minimum body-to-body clearance, and dreq is the required engineering clearance. In the present case application, σeq,max refers to the refined value of 10.4 MPa, whereas the baseline value of 17.2 MPa is used only for comparison in Section 2.3 and Table 2. The framework does not generate σallow, Mctrl, or dreq. In an engineering application, dreq should be specified from the clearance budget, including manufacturing and assembly tolerances, unmodelled elastic deformation, trajectory or state-estimation uncertainty, and any mandated operational buffer. The present case adopts dreq = 0 only as a first-contact criterion; it is not a conservative certification allowance. The groove height H = 40 mm is used as dref because it is the documented local release-stroke scale available in the retained geometry, not because it is a physical safety threshold. Changing a positive dref changes ηd and may change ranking among positive margins, but it cannot change the sign of gd or the clearance pass/fail decision.
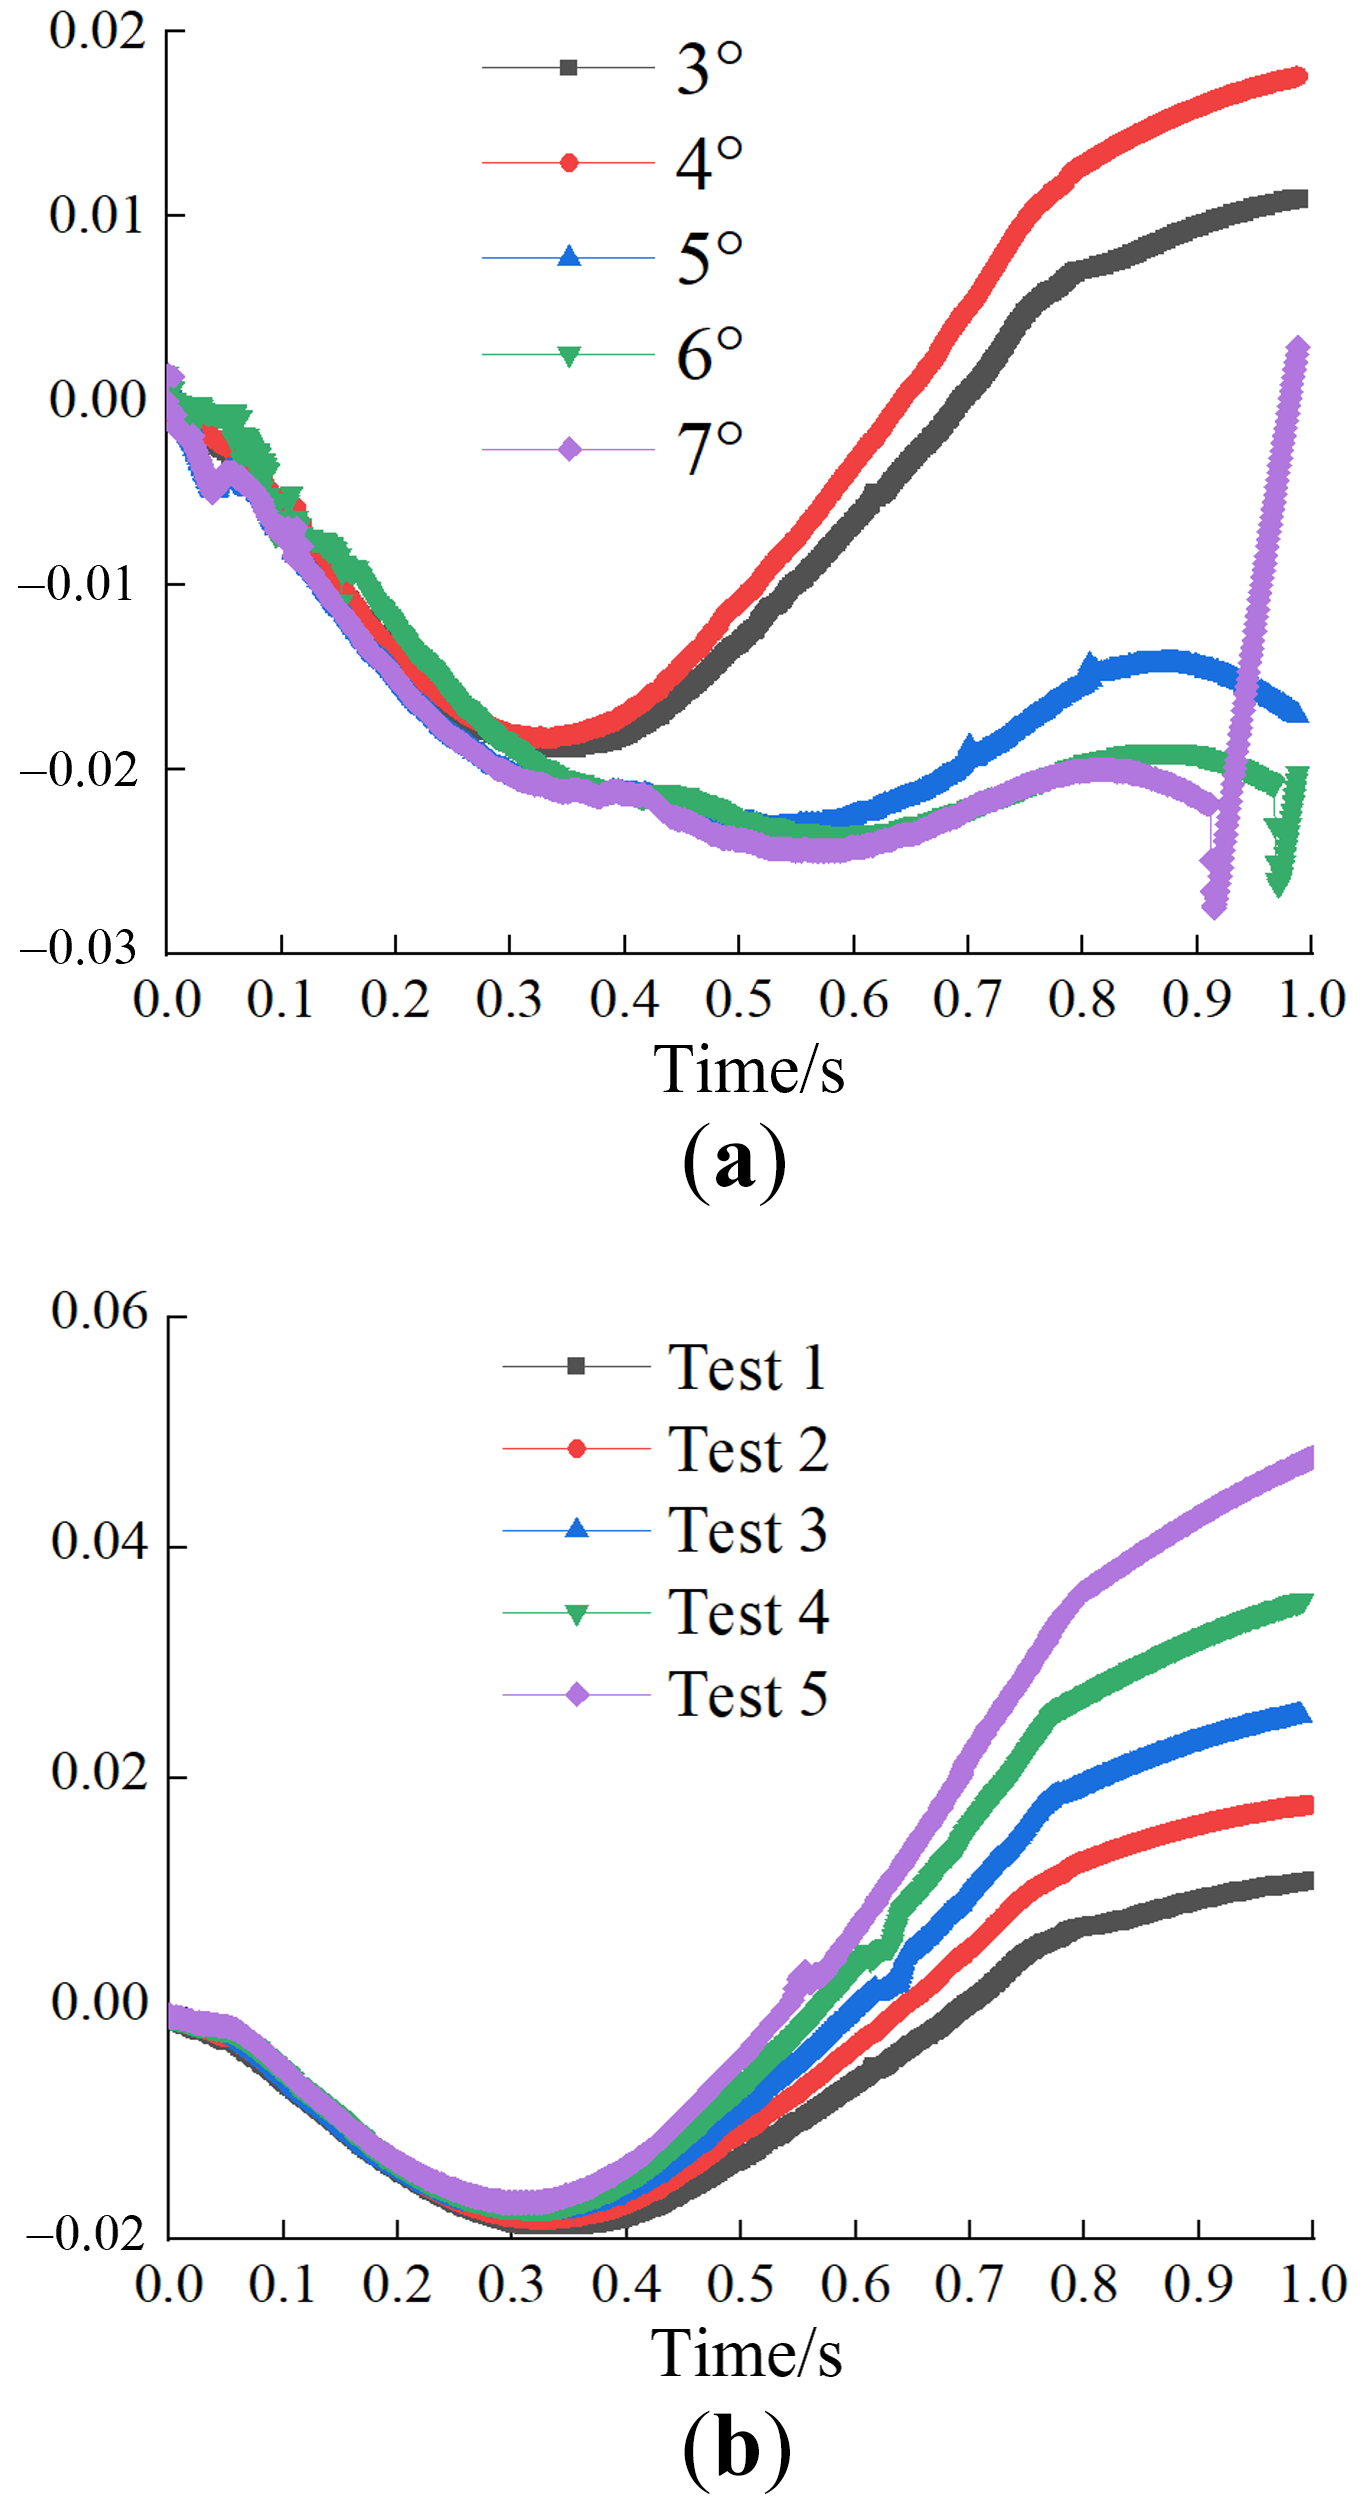
Table 4 and Figure 7 are reinterpreted through the trajectory component. With dreq = 0 and dref = 40 mm, ηd at 3°, 4°, 5°, 6°, and 7° is 0.310, 0.370, 0.130, −0.038, and −0.053, respectively. The sampled results therefore show a sign change between 5° and 6°; they do not resolve a unique critical angle inside this interval. Because only ηd is numerically reconstructable for all five cases, the retained-data implementation is reported as a clearance-decision template rather than a numerically complete unified safety index. Table 5 records the decision sign and identifies clearance where it necessarily governs. For the 3–5° passing cases, the exact value of Ssep and the active constraint remain undefined until numerical σallow and Mctrl are supplied externally.
Two post-processing sensitivity checks were performed using only the reported dmin values. First, Table 6 summarizes the required-clearance sensitivity. For dreq = 5 mm, ηd becomes 0.185, 0.245, 0.005, −0.163, and −0.178 for 3–7°, respectively; the 5° case retains only 0.2 mm of absolute clearance above the requirement. For dreq = 6 mm, the 5° margin becomes −0.020 and the sampled pass/fail transition shifts to the 4–5° interval. Second, dref was varied from 20 to 80 mm while dreq remained zero. As summarized in Table 7, this rescaling changes the numerical ηd values but leaves their signs unchanged; therefore, clearance remains the necessarily active failed constraint at 6° and 7°. For the positive-margin 3–5° cases, the active constraint remains unresolved because numerical ησ and ηM are unavailable. These scenarios are sensitivity illustrations, not proposed certification values.

3.4. Experimental Evidence for the Low-Impact Response Channel

Ground experiments provide component-level evidence for the dynamic-response channel. A six-degree-of-freedom force/torque sensor and laser displacement measurement record the release transient at 1000 Hz. The present analysis examines response smoothness and consistency with the prescribed mechanism motion. A ground test at one aerodynamic-equivalent condition does not independently validate the complete airborne safe/unsafe classification.
For compact description, the stacked-mean acceleration is represented by the sinusoidal regression in Equation (7). The form is motivated qualitatively by the prescribed smooth periodic groove motion, but the fitted time history is not treated as a causal dynamic model. Its goodness of fit is reported only as a descriptive response indicator:
afit(t) = A sin(ωt + φ) + b
The parameters A, ω, φ, and b denote fitted amplitude, angular frequency, phase, and bias. The coefficient R2 = 0.96 indicates that the stacked mean is represented closely by this empirical form over the measured record. No acceptance threshold is assigned to this R2 value, and it is not used as a safety criterion. It does not establish a physical impact threshold or prove structural, control, or clearance safety. Because averaging can attenuate isolated run-specific peaks, the individual Tests 1–4 remain visible in Figure 5. The final constraint decision must be based on the separately defined limit states and independently specified requirement values.
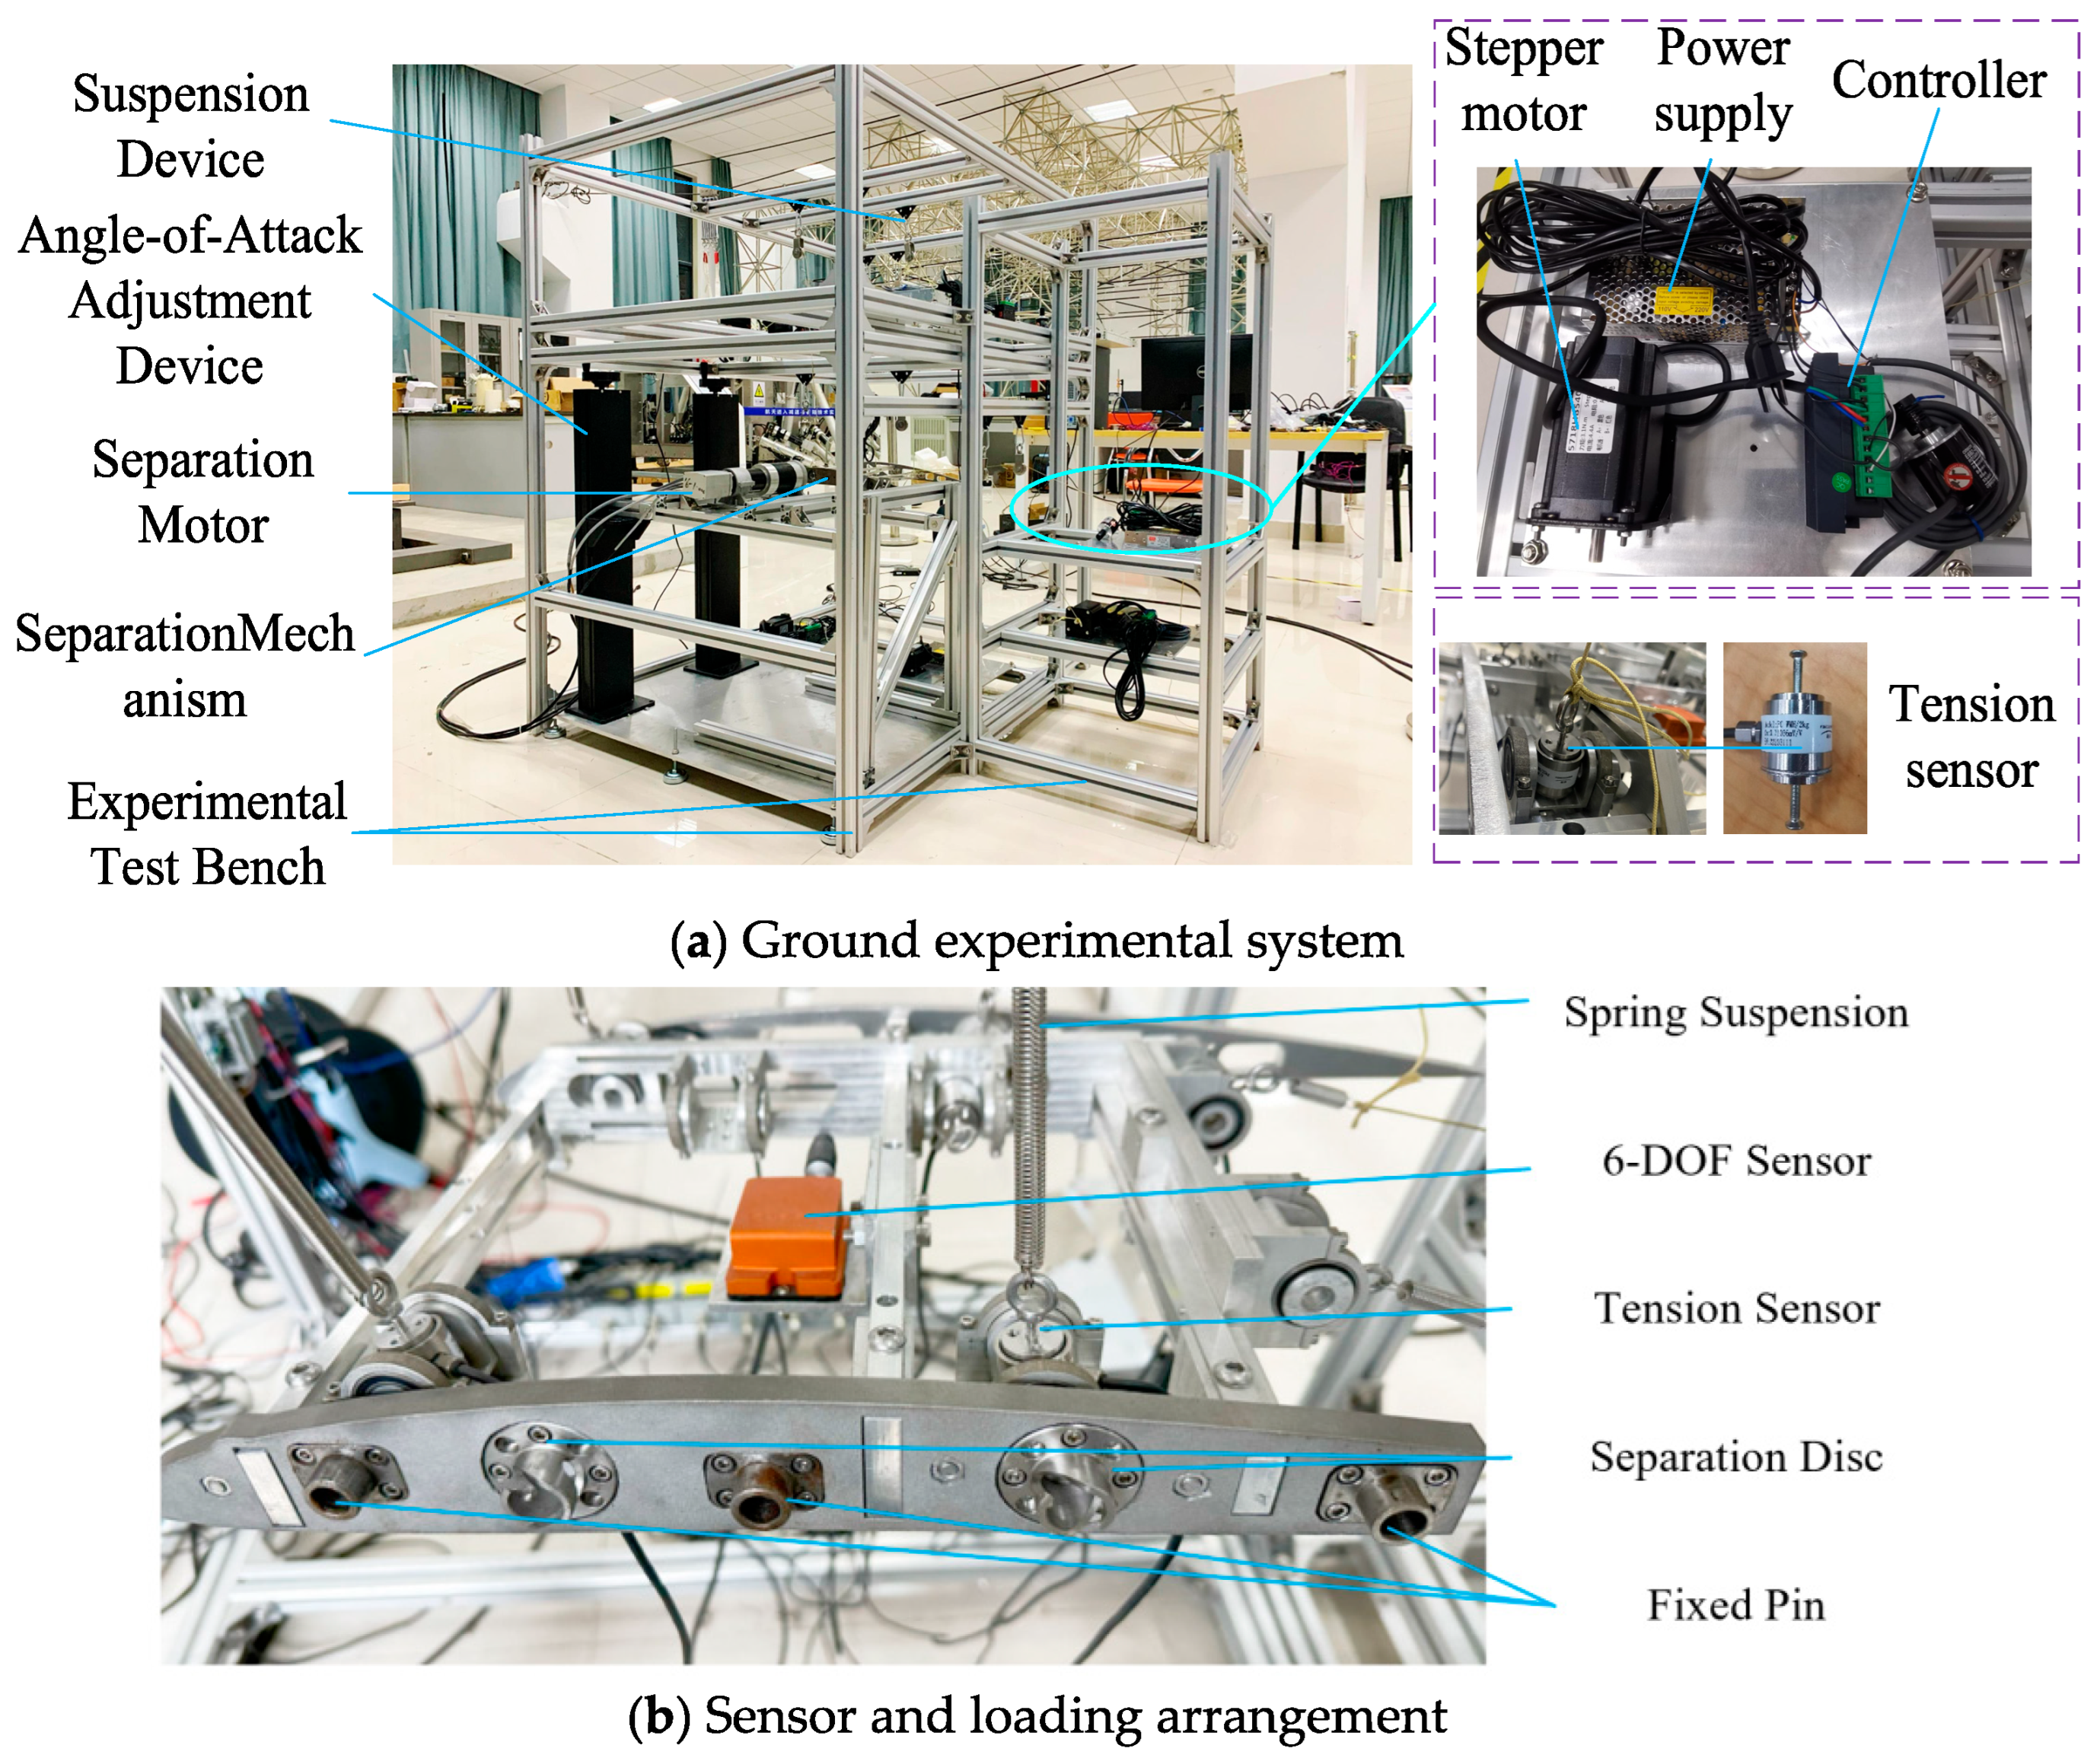
The experimental setup described in this work is shown in Figure 8. The experiment therefore supports only the observed response-smoothness component. It is not presented as independent validation of Ssep or of the airborne operational boundary.

3.5. Verification Scope, Uncertainty, and Limitations

Calculation verification was performed by direct substitution of the reported dmin values into ηd = (dmindreq)/dref and by checking the logical equivalence between Ssep > 0 and simultaneous satisfaction of all three individual limit states. This verifies the algebraic implementation and reproduces the reported contact-risk labels at 6° and 7°. It does not constitute independent physical validation of the aerodynamic, structural, or control models.
The complete safe/unsafe classifier has not been independently validated with a separate full-state airborne dataset. The ground experiment addresses response smoothness only, while the trajectory record is reused both to calculate and to interpret clearance. The present results should therefore be read as a retrospective deterministic case application rather than a validated certification envelope.
Aerodynamic loads, friction, contact parameters, material properties, control authority, geometric tolerances, and measurement error may all perturb the margins, particularly near Ssep = 0. For example, with dreq = 5 mm, the reported 5° case has only 0.2 mm of absolute excess clearance. The archived record provides neither validated probability distributions nor error bounds for these inputs, and it also lacks CFD and finite-element mesh-convergence series. A Monte Carlo or first-order reliability calculation would therefore be driven by unverified assumed distributions and is not introduced in this revision. No robustness probability or confidence interval is claimed; probabilistic uncertainty propagation and independent full-state validation remain future work.

4. Conclusions

A deterministic, constraint-based assessment framework has been applied to the existing low-impact separation platform of a combined UAV. Its contribution is an application-specific, traceable organization of structural, control, and clearance requirements; it is not a new general theory of series-system reliability and it does not repeat the mechanism design reported in Ref. [26]. With the retained records, the demonstrated implementation is specifically a clearance-decision template because numerical structural and control capacities are unavailable for complete cross-channel ranking.
The main findings are as follows:
(1) Strength, roll-control authority, and collision clearance are written as separate limit-state margins and linked using a non-compensatory minimum function. This eliminates empirical weighted averaging but does not eliminate the influence of selected normalization scales on positive-margin ranking. A numerically complete three-channel index and active-constraint ranking require externally specified σallow, Mctrl, and dreq.
(2) Consistent with Figure 4 and Table 2, parametric refinement reduces the maximum equivalent von Mises stress from 17.2 MPa to 10.4 MPa, corresponding to a 39.5% decrease. This is a component-level structural result.
(3) Reanalysis gives clearance margins of 0.310, 0.370, 0.130, −0.038, and −0.053 from the sampled 3–7° cases at dreq = 0 and dref = 40 mm. The sign change brackets the contact transition between 5° and 6° but does not determine a more precise critical angle. Table 6 shows that increasing dreq to 5 mm makes the 5° case marginal, whereas dreq = 6 mm shifts the sampled transition to 4–5°. Table 7 shows that changing dref from 20 to 80 mm rescales ηd without changing the clearance decision.
(4) The ground-test stacked mean yields R2 = 0.96 for a descriptive sinusoidal regression. This indicates a smooth fitted trend, but it is neither a causal proof of low impact nor independent validation of the complete classifier.
The formulation can be reused as a numerically complete three-channel assessment when traceable allowable stress, control authority, and clearance requirements are supplied. Until then, the present retained-data implementation should be interpreted as a clearance-decision template. The evidence is deterministic and partly reanalyzes Ref. [26]; therefore, full independent validation and probabilistic robustness are outside the demonstrated scope. Future work should quantify input uncertainties and estimate P(Ssep > 0) using independent full-state observations.

Author Contributions

Q.Z.: conceptualization, methodology, validation, data curation, writing—original draft, and funding acquisition. S.L.: methodology, validation, data curation, and writing—original draft. J.C.: supervision, project administration, funding acquisition, and writing—review and editing. All authors have read and agreed to the published version of the manuscript.

Funding

This work was supported by the National Natural Science Foundation of China under Grant No. 52605154; the Shanghai Aerospace Science and Technology Innovation Fund (SAST2025-019); the National Key Laboratory Fund of Aerospace Agency (2025ASM-ZY03); the Funding for Outstanding Doctoral Dissertation in NUAA (BCXJ25-20); and the NUAA Fundamental Research Funds Research Project (NT2026019).

Data Availability Statement

The data, models, and code supporting the findings are available from the corresponding author upon reasonable request. The data are not publicly available due to privacy or ethical restrictions.

Conflicts of Interest

The authors declare no conflicts of interest.

References

  1. Cooper, J.R.; Rothhaar, P.M. Dynamics and control of in-flight wing tip docking. J. Guid. Control Dyn. 2018, 41, 2327–2337. [Google Scholar] [CrossRef] [Scilit] [PubMed]
  2. Yang, Y.H.; Xiong, X.Z.; Yan, Y.H. UAV formation trajectory planning algorithms: A review. Drones 2023, 7, 62. [Google Scholar] [CrossRef] [Scilit]
  3. Patil, M.J.; Hodges, D.H.; Cesnik, C.E.S. Nonlinear aeroelasticity and flight dynamics of high-altitude long-endurance aircraft. J. Aircr. 2001, 38, 88–94. [Google Scholar] [CrossRef] [Scilit] [PubMed]
  4. Patil, M.J.; Hodges, D.H. On the importance of aerodynamic and structural geometrical nonlinearities in aeroelastic behavior of high-aspect-ratio wings. J. Fluids Struct. 2004, 19, 905–915. [Google Scholar] [CrossRef] [Scilit]
  5. An, C.; Yang, C.; Xie, C.; Yang, L. Flutter and gust response analysis of a wing model including geometric nonlinearities based on a modified structural ROM. Chin. J. Aeronaut. 2020, 33, 48–63. [Google Scholar] [CrossRef] [Scilit]
  6. Cea, A.; Palacios, R. A non-intrusive geometrically nonlinear augmentation to generic linear aeroelastic models. J. Fluids Struct. 2021, 101, 103222. [Google Scholar] [CrossRef] [Scilit]
  7. Robinson, B.; da Costa, L.; Poirel, D.; Pettit, C.L.; Khalil, M.; Sarkar, A. Aeroelastic oscillations of a pitching flexible wing with structural geometric nonlinearities: Theory and numerical simulation. J. Sound Vib. 2020, 484, 115389. [Google Scholar] [CrossRef] [Scilit]
  8. An, C.; Xie, C.; Meng, Y.; Liu, D.; Yang, C. Flight dynamics and stable control analyses of multibody aircraft. Eng. Mech. 2021, 38, 248–256. [Google Scholar] [CrossRef]
  9. Montalvo, C.; Costello, M. Meta aircraft flight dynamics. J. Aircr. 2015, 52, 107–115. [Google Scholar] [CrossRef] [Scilit]
  10. Magill, S.A.; Schetz, J.A.; Mason, W.H. Compound aircraft transport: A comparison of wingtip-docked and close-formation flight. In Proceedings of the 41st Aerospace Sciences Meeting and Exhibit, Reno, NV, USA, 6–9 January 2003; AIAA Paper: Reston, VA, USA, 2003. [Google Scholar] [CrossRef] [Scilit]
  11. Köthe, A.; Luckner, R. Applying eigenstructure assignment to inner-loop flight control laws for a multibody aircraft. CEAS Aeronaut. J. 2022, 13, 33–43. [Google Scholar] [CrossRef] [Scilit]
  12. Liu, L.; Kim, T.; Lai, K.L. Efficient analysis of HALE aircraft structure for static aeroelastic behavior. J. Aerosp. Eng. 2017, 30, 04016075. [Google Scholar] [CrossRef] [Scilit]
  13. Patterson, M.D.; Quinlan, J.; Fredericks, W.J.; Tse, E.; Bakhle, I. A modular unmanned aerial system for missions requiring distributed aerial presence or payload delivery. In Proceedings of the 55th AIAA Aerospace Sciences Meeting, Grapevine, TX, USA, 9–13 January 2017; AIAA Paper: Reston, VA, USA, 2017. [Google Scholar] [CrossRef] [Scilit]
  14. Zhou, W.; Ma, P.; Guo, Z.; Wang, D.; Zhou, R. Research of combined fixed-wing UAV based on wingtip chained. Acta Aeronaut. Astronaut. Sin. 2022, 43, 325946. [Google Scholar] [CrossRef]
  15. Meng, Y.; An, C.; Xie, C.; Yang, C. Conceptual design and flight test of two wingtip-docked multi-body aircraft. Chin. J. Aeronaut. 2022, 35, 144–155. [Google Scholar] [CrossRef] [Scilit]
  16. An, C.; Wang, L.; Xie, C.; Yang, C. Aerodynamics characteristics and flight dynamics analysis of multi-body aircraft. In Proceedings of the 2021 Asia-Pacific International Symposium on Aerospace Technology (APISAT 2021), Volume 1; Lee, S., Han, C., Choi, J.-Y., Kim, S., Kim, J.H., Eds.; Lecture Notes in Electrical Engineering; Springer Nature: Singapore, 2023; Volume 912, pp. 375–384. [Google Scholar] [CrossRef] [Scilit]
  17. Liu, D.; Xie, C.; Hong, G.; An, C. Modeling, simulation, and cruise characteristics of wingtip-jointed composite aircraft. Appl. Sci. 2020, 10, 8763. [Google Scholar] [CrossRef] [Scilit]
  18. Etkin, B. Dynamics of Atmospheric Flight; Dover Publications: Mineola, NY, USA, 2005. [Google Scholar]
  19. Stevens, B.L.; Lewis, F.L.; Johnson, E.N. Aircraft Control and Simulation: Dynamics, Controls Design, and Autonomous Systems, 3rd ed.; John Wiley & Sons: Hoboken, NJ, USA, 2015. [Google Scholar] [CrossRef] [Scilit]
  20. Grauer, J.A.; Morelli, E.A. Generic global aerodynamic model for aircraft. J. Aircr. 2015, 52, 13–20. [Google Scholar] [CrossRef] [Scilit]
  21. Chan, J.; Papaioannou, I.; Straub, D. An adaptive subset simulation algorithm for system reliability analysis with discontinuous limit states. Reliab. Eng. Syst. Saf. 2022, 225, 108607. [Google Scholar] [CrossRef] [Scilit]
  22. Du, S.; Zhong, G.; Wang, F.; Pang, B.; Zhang, H.; Jiao, Q. Safety risk modelling and assessment of civil unmanned aircraft system operations: A comprehensive review. Drones 2024, 8, 354. [Google Scholar] [CrossRef] [Scilit]
  23. Fitrikananda, B.P.; Jenie, Y.I.; Sasongko, R.A.; Muhammad, H. Risk assessment method for UAV’s sense and avoid system based on multi-parameter quantification and Monte Carlo simulation. Aerospace 2023, 10, 781. [Google Scholar] [CrossRef] [Scilit]
  24. Huang, L.; Huang, C.; Zhou, C.; Xie, C.; Zhao, Z.; Huang, T. Research on the collision risk of fusion operation of manned aircraft and unmanned aircraft at Zigong Airport. Sensors 2024, 24, 4842. [Google Scholar] [CrossRef] [Scilit] [PubMed]
  25. Zhu, R.; Yang, Z.; Chen, J. Conflict risk assessment between non-cooperative drones and manned aircraft in airport terminal areas. Appl. Sci. 2022, 12, 10377. [Google Scholar] [CrossRef] [Scilit]
  26. Zhang, Q.; Jia, S.; Chen, J.; Zhang, J. Compliant mechanism design of combined aircraft wing for stable separation. Aeronaut. J. 2024, 128, 1665–1680. [Google Scholar] [CrossRef] [Scilit]
  27. Moustapha, M.; Marelli, S.; Sudret, B. Active learning for structural reliability: Survey, general framework and benchmark. Struct. Saf. 2022, 96, 102174. [Google Scholar] [CrossRef] [Scilit]
  28. Moustapha, M.; Parisi, P.; Marelli, S.; Sudret, B. Reliability analysis of arbitrary systems based on active learning and global sensitivity analysis. Reliab. Eng. Syst. Saf. 2024, 248, 110150. [Google Scholar] [CrossRef] [Scilit]
  29. SAE International. Guidelines for Conducting the Safety Assessment Process on Civil Aircraft, Systems, and Equipment; SAE Standard ARP4761A; SAE International: Warrendale, PA, USA, 2023. [Google Scholar] [CrossRef] [Scilit]
  30. Federal Aviation Administration. System Design and Analysis; Advisory Circular AC 25.1309-1B; Federal Aviation Administration: Washington, DC, USA, 2024. Available online: https://www.faa.gov/regulations_policies/advisory_circulars/index.cfm/go/document.information/documentID/1043037 (accessed on 2 September 2026).
Figure 1. Existing combined-UAV platform and docking layout used as the assessment object; configuration previously reported in [26].
Machines 14 01074 g001
Figure 2. Existing compliant interface adopted as the physical evaluation platform; mechanism details were originally reported in [26].
Machines 14 01074 g002
Figure 3. Load-transfer model used to obtain structural and actuation inputs for the proposed safety assessment.
Machines 14 01074 g003
Figure 4. Equivalent-stress fields used to quantify the structural-margin improvement produced by stationary-pin refinement.
Machines 14 01074 g004
Figure 5. Existing acceleration records originally reported in [26] and retained for response-channel assessment. Tests 1–4 denote the four recorded runs; markers show sampled acceleration and dashed lines show the corresponding descriptive fits.
Machines 14 01074 g005
Figure 6. Existing rolling-stability result reinterpreted as the roll-control constraint of the proposed evaluation model [26].
Machines 14 01074 g006
Figure 7. Constraint-based reinterpretation of the angle-of-attack and speed sensitivity records reported in [26]. (a) Effect of angle of attack on separation velocity and trajectory safety; (b) Effect of flight speed on separation clearance margin.
Machines 14 01074 g007
Figure 8. Ground-test system and measurement arrangement originally reported in [26], used here only for descriptive assessment of the response-smoothness channel.
Machines 14 01074 g008
Table 1. Key design and environmental parameters for separation analysis.
CategoryParameterSymbolValueUnit
GeometricTotal Length of Guide GrooveL150mm
Total Height of Guide GrooveH40mm
MaterialMaterial GradeAl-7075--
Young’s ModulusE71.7GPa
AerodynamicCruise SpeedV60m/s
Air Densityρ1.225kg/m3
Table 2. Quantitative comparison of load-bearing performance before and after geometric optimization.
Performance IndicatorBaseline ConfigurationRefined ConfigurationRelative Variation
Maximum Equivalent von Mises Stress
σeq,max
17.2 MPa10.4 MPa39.5%
Torque Ripple Rate12.50%8.20%34.40%
Table 3. Summary of dynamics simulation parameters for the separation mechanism.
ParameterSymbolValueUnit
Contact Stiffnessk2.5 × 106N/m
Damping Coefficientc450N·s/m
Friction Coefficient (Rolling)μr0.005-
Simulation Time StepΔt0.001s
Table 4. Existing flight-condition results interpreted using the trajectory limit state of the proposed evaluation model.
AOA (α)Speed (V)Min. Clearance (dmin)Safety Status
60 m/s12.4 mmClearance pass
60 m/s14.8 mmClearance pass
60 m/s5.2 mmClearance pass
60 m/s−1.5 mmCollision Risk
60 m/s−2.1 mmCollision Risk
Table 5. Clearance-decision application of the constraint-normalized framework using the retained deterministic records (dreq = 0; dref = 40 mm).
AOAησηMηdSsepActive ConstraintStatus
>0 †>0 †0.310>0 †Not resolved †Nominal pass †
>0 †>0 †0.370>0 †Not resolved †Nominal pass †
>0 †>0 †0.130>0 †Not resolved †Nominal pass †
>0 †>0 †−0.038−0.038ClearanceCollision risk
>0 †>0 †−0.053−0.053ClearanceCollision risk
† The retained record establishes only the positive sign reported for the structural and control checks in the nominal cases; it does not contain independently reproducible numerical σallow and Mctrl values for every trajectory case. Accordingly, no numerical ησ or ηM is fabricated, and the active constraint among positive margins is not assigned. For 6° and 7°, the negative ηd necessarily governs because the other two reported checks remain positive.
Table 6. Required-clearance sensitivity of ηd using the retained clearance values (dref = 40 mm).
dreq (mm)ηd at 3°ηd at 4°ηd at 5°ηd at 6°ηd at 7°Sampled Transition Interval
00.3100.3700.130−0.038−0.0535–6°
50.1850.2450.005−0.163−0.1785–6° (5° marginal)
60.1600.220−0.020−0.188−0.2034–5°
Table 7. Normalization-scale sensitivity of ηd using the retained clearance values (dreq = 0).
dref (mm)ηd at 3°ηd at 4°ηd at 5°ηd at 6°ηd at 7°
200.6200.7400.260−0.075−0.105
400.3100.3700.130−0.038−0.053
800.1550.1850.065−0.019−0.026
Disclaimer/Publisher’s Note: The statements, opinions and data contained in all publications are solely those of the individual author(s) and contributor(s) and not of MDPI and/or the editor(s). MDPI and/or the editor(s) disclaim responsibility for any injury to people or property resulting from any ideas, methods, instructions or products referred to in the content.