Article

Dynamic Modelling and Parameter Optimisation of Friction-Induced Panhead Pitching and Dual-Strip Load Redistribution in a Metro Pantograph–Rigid Overhead Contact Line System


School of Electrical Engineering, Southwest Jiaotong University, Chengdu 611756, China
*
Author to whom correspondence should be addressed.
Machines 2026, 14(9), 1064; https://doi.org/10.3390/machines14091064 (registering DOI)
Submission received: 1 August 2026 / Revised: 11 September 2026 / Accepted: 14 September 2026 / Published: 17 September 2026
(This article belongs to the Section Friction and Tribology)

Abstract

Unequal load sharing between collector strips causes local contact deterioration in metro rigid overhead contact line (ROCL) systems, whereas conventional equivalent-strip models cannot resolve independent strip contact or friction-induced panhead pitching. This study develops a coupled pantograph–ROCL model with independent vertical degrees of freedom for the two strips and a panhead pitch degree of freedom. The ROCL is represented by planar Euler–Bernoulli beam elements with Hermite interpolation and coupled to the pantograph through two moving unilateral contacts. The baseline model is validated against measured contact-force statistics from a Guangzhou Metro line. A representative low-temperature, low-humidity, snow-free scenario is then introduced through test-informed friction variation, modified support stiffness and small support-height deviations. The scenario has little effect on mean contact force but increases force fluctuation, impact peaks, panhead pitching and local poor-contact risk. Sensitivity-guided derivative-free optimisation of local panhead parameters reduces the maximum pitch angle, total-contact-force standard deviation and dual-strip load-imbalance index by 38.24%, 23.09% and 44.43%, respectively. The model provides a mechanical framework for evaluating friction-induced pitch vibration and improving dual-strip load sharing in rigid current-collection systems.

1. Introduction

Pantograph–overhead contact line interaction is a moving-contact problem coupling multibody dynamics, structural vibration, friction and local contact mechanics. Its dynamic behaviour governs current-collection stability, collector-strip and contact-wire wear, and maintenance reliability [1]. Metro tunnels commonly use rigid overhead contact lines (ROCLs), whose compact arrangement, high stiffness and limited vertical compliance make the strip–wire interface particularly sensitive to local geometry, support conditions and concentrated masses [2,3,4,5,6].
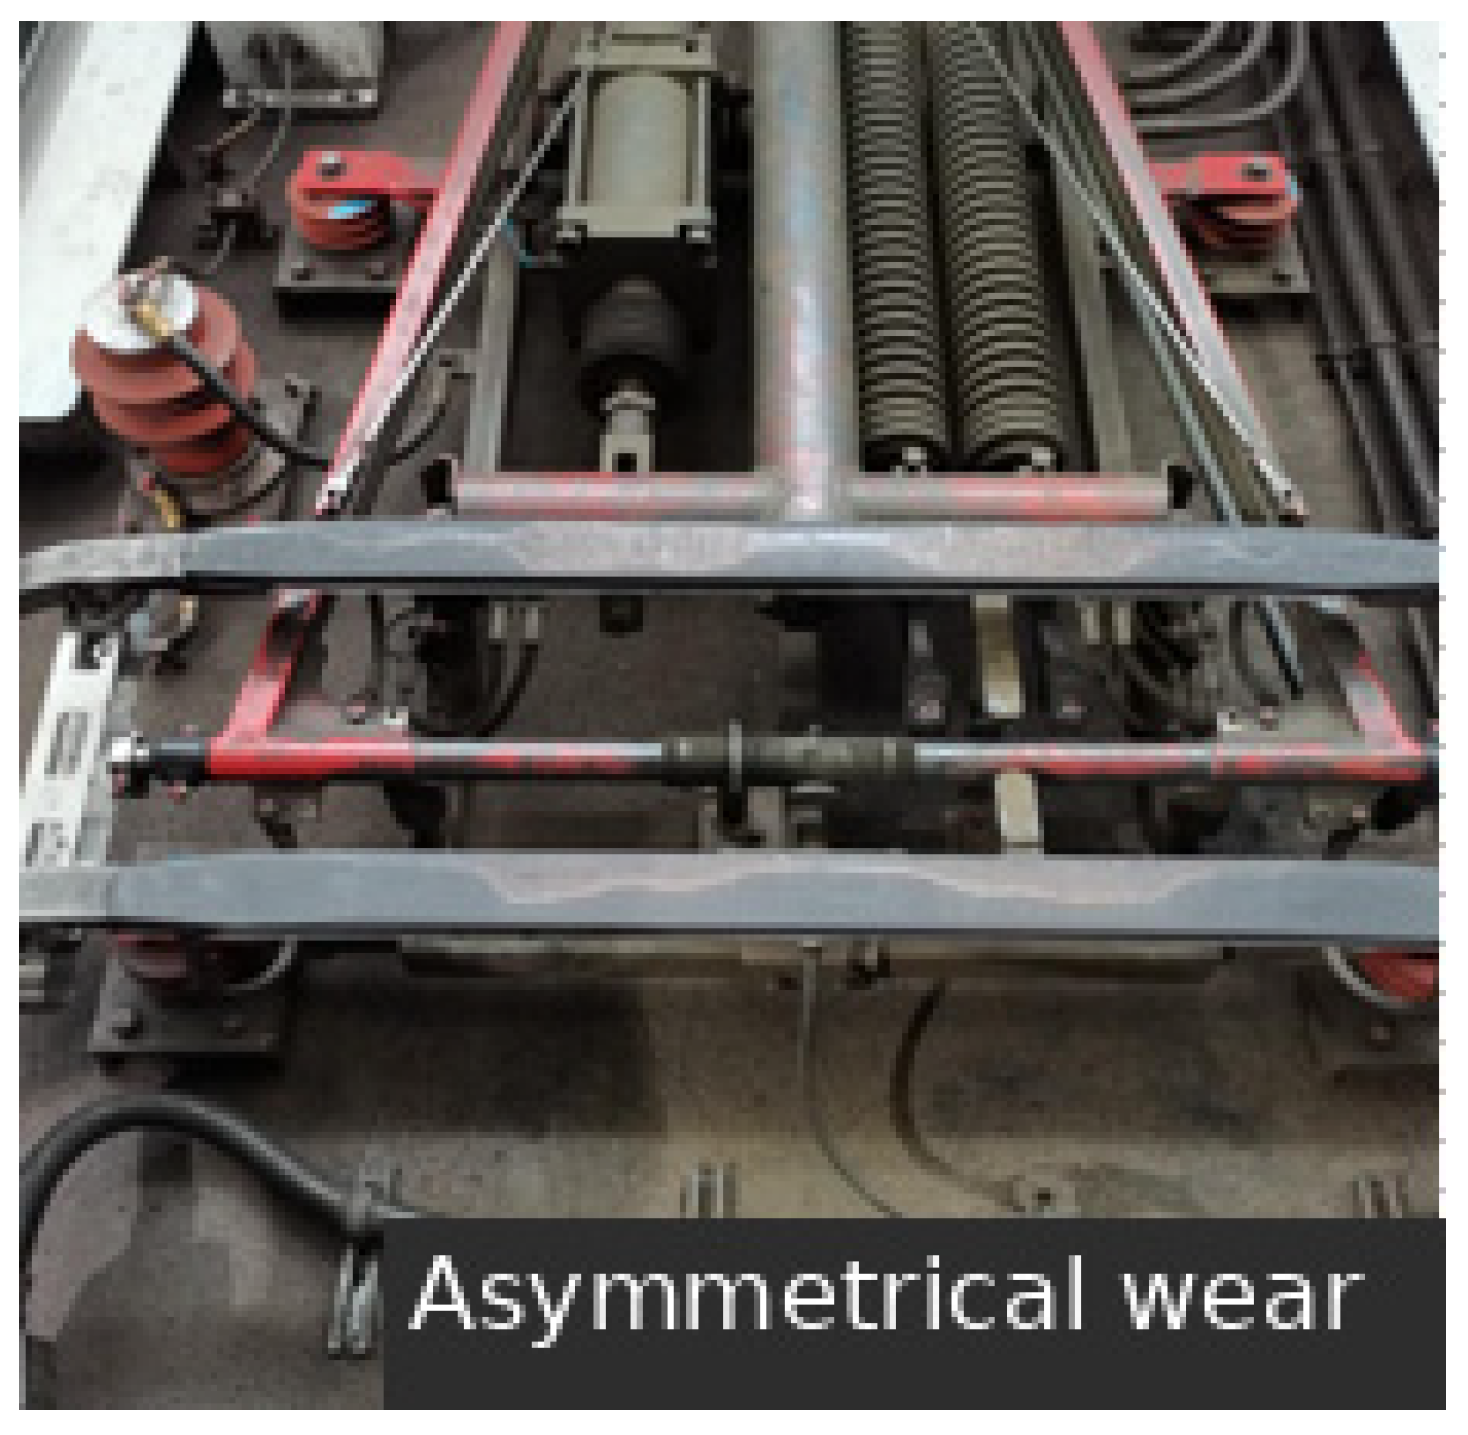
Local contact deterioration in metro ROCL systems results from coupled mechanical, electrical, tribological and environmental effects [7,8,9]. Low temperature and low humidity alter the friction coefficient, contact resistance and damage mechanisms of current-carrying C/Cu pairs [10,11]. Because tunnel temperature and humidity are also controlled by train heat, surrounding-rock heat storage, ventilation and external climate [12,13], a mechanically representative winter scenario should reproduce changes in interfacial friction and support boundaries rather than impose open-line snow or icing loads. Figure 1 illustrates the observed uneven wear of the collector strips.
Field observations of asymmetric collector-strip wear and contact-wire grooving indicate that an acceptable total contact force does not necessarily imply uniform loading of the two strips. One strip may be repeatedly unloaded while the other carries concentrated impact load, a local state that is concealed by the mean and standard deviation of the total contact force. Independent strip–wire contact, unequal spring-box compression and longitudinal friction forces generate a pitching moment on the panhead; the resulting attitude change redistributes the normal contact forces and forms a feedback loop among frictional excitation, panhead pitching and dual-strip load sharing.
Accordingly, the mechanical problem addressed in this study is the prediction and mitigation of friction-induced panhead pitching and dual-strip load redistribution under non-uniform contact conditions. A coupled pantograph–ROCL model must resolve the two strip contacts separately and transfer spring-box forces and longitudinal friction-induced moments to the panhead pitch degree of freedom. Such a model can evaluate local poor-contact risk that is not apparent from conventional total-force indicators.
Pantograph models have progressed from computationally efficient lumped-mass formulations for low-frequency vertical dynamics [14,15] to finite-element, multi-rigid-body, rigid-flexible, and absolute nodal coordinate models [16,17,18,19,20,21,22]. ANCF models are suited to large displacement, rotation, and moving contact of the contact wire, while multibody and rigid-flexible models describe linkage constraints, flexibility, and higher-order responses. Conventional three-mass models nevertheless provide limited representation of dual-strip pitch, roll, and local contact. Dual-strip modes and the selected panhead degrees of freedom can materially affect medium- and high-frequency contact-force assessment [23].
Rigid-flexible models capture panhead structural modes and resonance, and nonlinear-suspension studies show that inclined preloaded springs, dry friction, and nonlinear load transfer affect pantograph response and require experimental identification or optimisation [22,24]. These findings establish the panhead suspension as a governing dynamic subsystem. However, separate strip-wire contacts, independent spring-box compression, and transfer of friction-induced moments to panhead pitch remain insufficiently represented.
Longitudinal strip-wire friction also affects stability and wear. Coulomb friction is non-conservative and can shift stability boundaries or induce self-excited vibration; its effects depend on catenary periodicity, friction coefficient, normal force, and pantograph compliance [25,26,27,28,29,30]. In a dual-strip panhead, each friction force acts through a moment arm and produces a pitching moment. Asynchronous strip forces, friction coefficients, or displacements therefore excite panhead attitude and load imbalance.
Sliding-contact wear depends on normal load and speed as well as current density, arcing, temperature, humidity, contact-wire damage, and surface condition [7,8,9,10,11]. Low humidity and damaged wire surfaces intensify wear, while lower temperature increases the friction coefficient and changes contact-resistance fluctuations and wear mechanisms. Because metro tunnels have thermal–hygrometric boundaries distinct from open lines [12,13], winter modelling should represent low-temperature, low-humidity, snow-free changes in friction, ROCL support boundaries, and local geometry rather than impose snow or icing loads.
Sensitivity analysis and optimisation are widely used to reduce pantograph–overhead contact line force fluctuations through surrogate models, robust design, neural networks and multi-objective methods [31,32,33,34,35,36,37,38]. Most objectives, however, emphasise the mean or standard deviation of total contact force. Panhead pitch, independent strip-force redistribution and poor-contact risk of the lower-loaded strip are rarely considered jointly, leaving a gap between system-level current-collection assessment and local panhead mechanical design.
Control-oriented studies provide a complementary route to improve current collection. Active and semi-active railway suspension studies have demonstrated that controllable suspension elements can be introduced with constrained actuation [39,40]. These studies motivate control-aware mechanical design, but they do not resolve the strip-specific load-transfer mechanism addressed here. The present work therefore remains a passive-parameter optimisation of the dual-strip panhead, with active or semi-active actuation considered only as a future extension.
This study develops a coupled multibody pantograph–planar Euler–Bernoulli ROCL model for mechanical analysis and parameter optimisation of a dual-strip current-collection system. The model resolves independent strip–wire contacts, separate strip vertical degrees of freedom and a panhead pitch degree of freedom, and transfers spring-box forces and longitudinal friction-induced moments to the panhead frame so that both strip forces, the total contact force and the pitch angle can be calculated separately. A representative low-temperature, low-humidity and snow-free operating scenario is formulated using test-informed friction variation, modified ROCL support stiffness and small support-height deviations, without introducing inappropriate snow or icing loads. The model is then used to identify the mechanical transmission chain from non-uniform interface and support conditions to friction-induced pitching, strip-force redistribution, impact amplification and local poor-contact risk. Finally, a sensitivity-guided, derivative-free optimisation is performed using maximum pitch angle, total-contact-force standard deviation and dual-strip load imbalance, together with engineering contact-force constraints. The model does not directly calculate material-removal depth or long-term wear evolution; therefore, uneven-wear risk is interpreted through mechanically measurable indicators, including impact force, poor-contact duration, panhead pitch and dual-strip load redistribution.

2. Materials and Methods

2.1. Pantograph Model with Independent Dual-Strip Contact

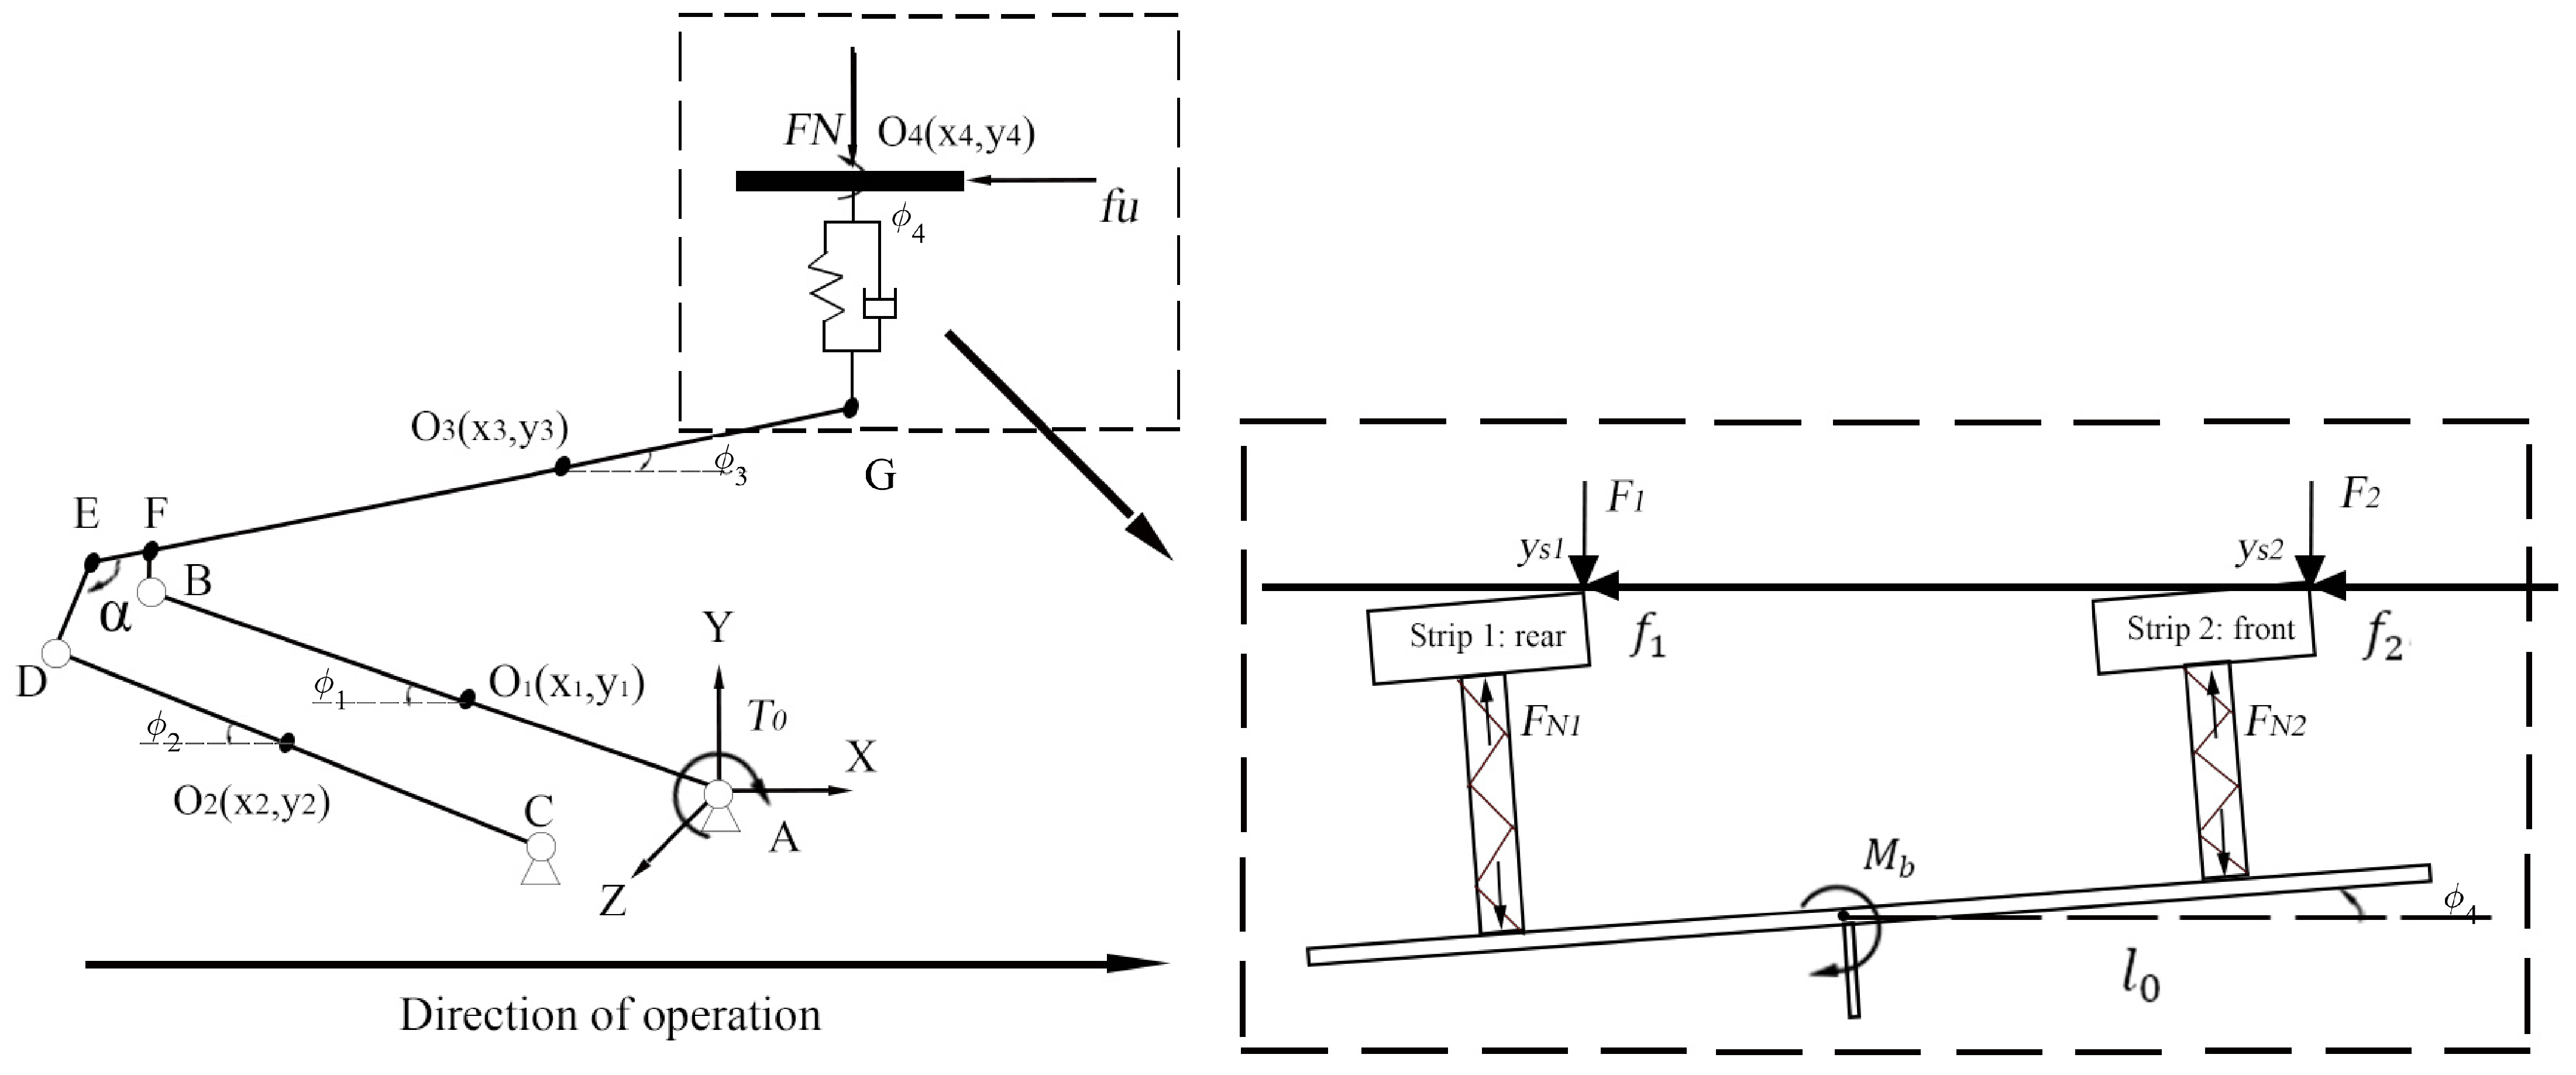
To relate dual-strip load imbalance and poor contact to panhead pitching, the two collector strips are separated from the equivalent panhead and assigned independent vertical degrees of freedom. The main pantograph comprises the lower arm, lower rod, upper arm, and panhead frame connected by revolute and translational constraints (Figure 2). The numerical calculations were performed in MATLAB R2022a (The MathWorks, Inc., Natick, MA, USA).
Let the centre-of-mass coordinates and rotation angle of the j th rigid body be x j , y j , and φ j , respectively, where j = 1 , 2 , 3 , 4 denote the lower arm, lower rod, upper arm, and panhead frame. Before introducing the independent strip motions, the generalised coordinates of the main pantograph mechanism are as follows:
q b = x 1 , y 1 , φ 1 , x 2 , y 2 , φ 2 , x 3 , y 3 , φ 3 , x 4 , y 4 , φ 4 T
where q b is the generalised-coordinate vector of the main pantograph mechanism. To describe the local vertical motions of the two strips relative to the panhead frame, the vertical coordinates y s 1 and y s 2 of strip 1 (rear) and strip 2 (front) are introduced. The positive longitudinal direction is the direction of operation shown in Figure 2. The extended pantograph generalised-coordinate vector is therefore as follows:
q p = q b T , y s 1 , y s 2 T
where q p is the complete pantograph coordinate vector, and y s 1 and y s 2 are the vertical coordinates of the two strip contact points. The strips are supported by spring boxes symmetrically placed at longitudinal half-spacing l 0 from the panhead reference point. For pitch angle φ 4 , their mounting-point coordinates and velocities are as follows:
y b 1 = y 4 l 0 sin φ 4 y b 1 = y 4 ˙ l 0 cos φ 4 φ 4 ˙ y b 2 = y 4 + l 0 sin φ 4 y b 2 = y 4 ˙ + l 0 cos φ 4 φ 4 ˙
Let the nominal spring-box length be l k and the strip thickness be b s . The equivalent compression and compression velocity of the two spring boxes are as follows:
Δ 1 = y b 1 + l k + b s y s 1 Δ 1 ˙ = y b 1 ˙ y s 1 ˙ Δ 2 = y b 2 + l k + b s y s 2 Δ 2 ˙ = y b 2 ˙ y s 2 ˙
Let the equivalent stiffness, damping, and preload of the spring box associated with one strip be k b , c b , and F 0 s , respectively. The support force exerted by each spring box on its strip is as follows:
F N i = F 0 s + k b Δ i + c b Δ ˙ i i = 1 , 2
where F N i is the spring-box support force acting on strip i . Let the vertical coordinate and velocity of the contact wire at the position of strip i be y c i and y ˙ c i , respectively. The normal penetration and relative velocity are then as follows:
δ i = y s i y c i δ ˙ i = y ˙ s i y ˙ c i i = 1 , 2
where δ i > 0 denotes compressive strip-wire contact in the penalty formulation, whereas δ i 0 denotes separation or contact loss. The normal contact force is as follows:
F i = K j m a x ( δ i , 0 ) i = 1 , 2
where F i is the normal contact force on strip i ; K j is the penalty contact stiffness; and δ i is the normal penetration. Considering longitudinal sliding friction between the collector strip and contact wire, let the local coefficient of friction at strip i be μ i . The longitudinal friction force f i acting on strip i is as follows:
f i = μ i F i i = 1 , 2
From the vertical force balance of the collector strips, their equations of motion are as follows:
m s y ¨ s 1 = F N 1 F 1 m s g m s y ¨ s 2 = F N 2 F 2 m s g
where m s is the equivalent mass of one collector strip and g is gravitational acceleration. The vertical generalised force on the panhead frame is as follows:
Q y 4 = m 4 f g F N 1 F N 2
In the original independent dual-strip model, the generalised moment in the panhead pitch direction is as follows:
Q φ 4 = M N + M f M r M f = f 1 ( y s 1 y 4 ) + f 2 ( y s 2 y 4 ) M N = l 0 cos φ 4 ( F N 1 F N 2 ) M r = k r ( φ 4 φ 40 ) + c φ ˙ φ 4
where M f is the friction-induced pitching moment, M N is the moment caused by unequal spring-box forces, and M r is the restoring and damping moment of the balance linkage; k r and c φ are the equivalent torsional stiffness and damping.
Accordingly, with the extended coordinate order q p = x 1 , y 1 , φ 1 , x 2 , y 2 , φ 2 , x 3 , y 3 , φ 3 , x 4 , y 4 , φ 4 , y s 1 , y s 2 T , the pantograph-side generalised-force vector used in the coupled calculation is as follows:
Q p = [ 0 , m 1 g , 0 , m 2 g , 0 , m 3 g , M r , 0 , m 4 g F N 1 F N 2 , M N + M f M r , F N 1 F 1 m s g , F N 2 F 2 m s g ] T
where T 0 is the prescribed uplift moment and m 4 f is the panhead-frame mass after separating the two strip masses. The component Q x 4 = 0 indicates that the longitudinal friction resultant is not introduced as a separate horizontal translational load on the panhead frame; its effect is represented by the pitching moment M f . The terms Q φ 3 = M r and Q φ 4 = M N + M f M r describe the action of the balance-linkage restoring/damping moment on the upper-arm and panhead-frame rotational coordinates.
In the present model, the longitudinal motion of the pantograph is prescribed by the vehicle speed. The resultant longitudinal friction force is therefore introduced only through the equivalent pitching moment M f , and no free horizontal translational degree of freedom is considered.
The constrained pantograph dynamics are as follows:
M p Φ q T Φ q 0 q ¨ p λ = Q p γ
where M p is the pantograph mass matrix, Q p is the generalised-force vector, Φ q is the constraint Jacobian, λ is the Lagrange-multiplier vector, and γ is the acceleration-constraint right-hand side. The original kinematic constraints are retained, while the generalised forces include both strip contact forces, spring-box forces, and the friction-induced pitching moment.

2.2. Planar Euler–Bernoulli Beam Model of the Rigid Overhead Contact Line

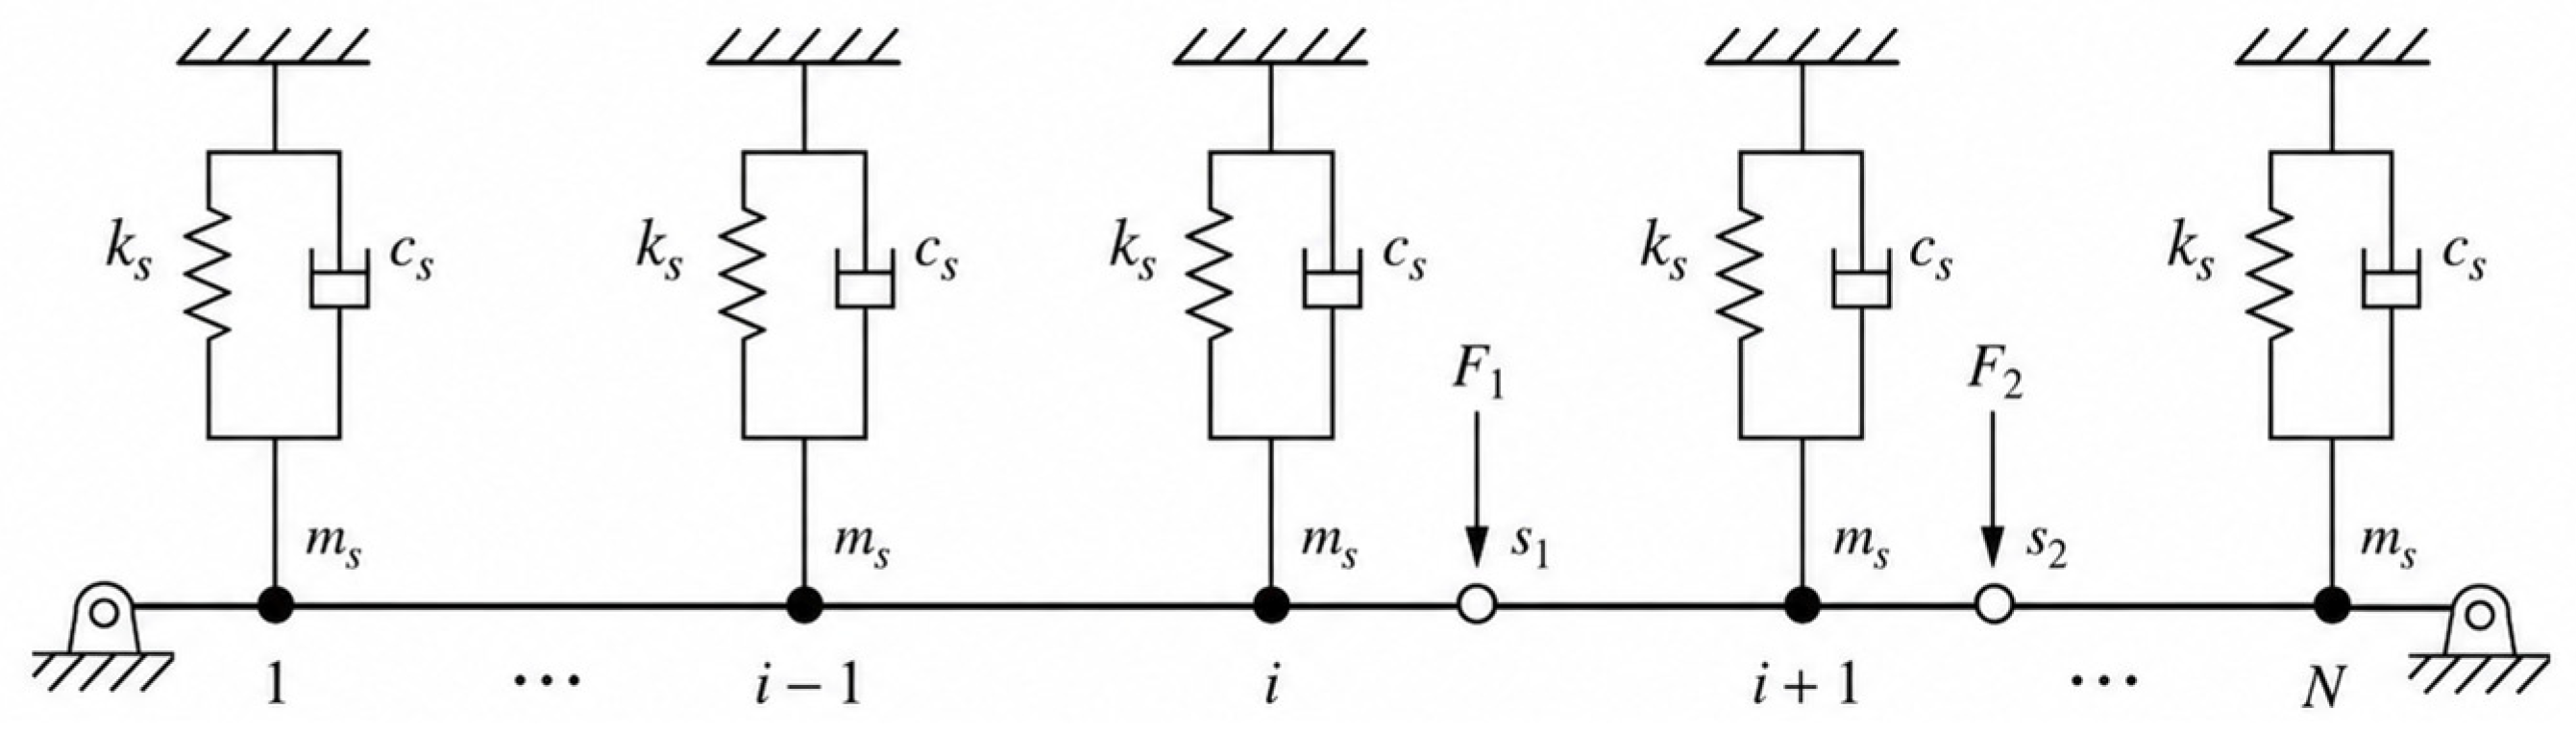
To describe the local vertical response of the ROCL under moving strip contact, the ROCL is represented by a planar Euler–Bernoulli beam model with Hermite interpolation, as shown in Figure 3.
Because the present study focuses on vertical current collection in a metro ROCL, the longitudinal coordinate x is prescribed as a geometric coordinate, and the nodal vertical displacement y and vertical slope θ are selected as the beam-element degrees of freedom. For beam element e , the nodal-coordinate vector is as follows:
q e = y 1 θ 1 y 2 θ 2 T
where y 1 and y 2 are the vertical displacements of the two end nodes, and θ 1 and θ 2 are the corresponding vertical slopes. Let the element length be L e and the local coordinate be ξ . The vertical displacement of the contact wire is expressed using Hermite shape functions as follows:
y c x , t = N ξ q e t
where N ξ is the shape-function matrix of the vertical Euler–Bernoulli beam submodel, and q e t is the nodal-coordinate vector of the beam element containing the contact point. Assembly of the element kinetic energy, bending strain energy, and equivalent potential energy of the suspension supports yields the global ROCL dynamic equation below.
Since the longitudinal coordinate is prescribed and the element includes only nodal vertical displacements and slopes, the present ROCL formulation is a planar Euler–Bernoulli beam model with Hermite interpolation. It does not include axial displacement, large rotation, or axial stretching.
M c q ¨ c + C c q ˙ c + K c q c q c 0 = Q c
where q c is the generalised-coordinate vector of the free ROCL nodes; M c , C c , and K c are the ROCL mass, damping, and stiffness matrices, respectively; q c 0 is the initial equilibrium configuration; and Q c is the ROCL generalised-force vector due to the external contact forces.

2.3. Moving-Contact Coupling and Numerical Formulation

The pantograph and ROCL are coupled through the moving contacts of the two collector strips. Let the longitudinal position of strip i on the contact-wire beam after the pantograph begins to run s i t . The longitudinal spacing between the two strips is 2 l 0 , the vehicle speed is v , and the initial contact position is s 0 . The moving contact positions are therefore as follows:
s 1 ( t ) = s 0 + v ( t t r ) l 0 s 2 ( t ) = s 0 + v ( t t r ) + l 0 , t t r
where t r is the starting time of the moving current-collection stage and l 0 is the half-spacing between the two strips. If s i t lies in beam element e , with the corresponding local coordinate ξ i , the vertical displacement and velocity of the contact wire at contact point i are as shown in the equation below.
Equation (17) uses the same convention: strip 1 is the rear contact point and strip 2 is the front contact point. This convention is retained in the spring-box and pitching-moment expressions.
y c i t = N i ξ i q e , i t y ˙ c i t = N i ξ i q ˙ e , i t + v L e N i ξ i q e , i t
where N i ξ i is the shape-function matrix at contact point i , and q e , i t is the nodal vector of the containing element. Because the contact point moves, its vertical velocity contains both nodal-velocity and convective terms. Virtual work gives the contact-force contribution to the ROCL generalised force as follows:
Q c = i = 1 2 N i T F i
where F i is the normal contact force on strip i , and Q c is the generalised force applied to the contact-wire beam elements by the normal forces of the two strips. The pantograph receives feedback from the ROCL through F 1 and F 2 , while the ROCL is loaded by the strips through Q c ; together, these interactions form a two-way coupled system.
To suppress drift during integration of the multibody constraints, Baumgarte stabilisation is applied on the pantograph side. The right-hand side of the acceleration-level constraint equations is modified as follows:
γ = Φ ˙ q q ˙ p 2 α Φ ˙ β 2 Φ
where Φ denotes the constraint equations, Φ ˙ is their first time derivative, Φ q is the constraint Jacobian, and α and β are the stabilisation coefficients. The pantograph-side constrained dynamic equations and the dynamic equations of the free ROCL nodes are then assembled into the coupled pantograph-ROCL equations used in this study.
M p q ¨ p + Φ q T λ = Q p q p , q ˙ p , q c , q ˙ c , t Φ q p , t = 0 M c q ¨ c + C c q ˙ c + K c q c q c 0 = Q c q p , q c , t
where M p is the pantograph mass matrix, q p is the pantograph generalised-coordinate vector, and λ is the vector of Lagrange multipliers. The generalised-force vector Q p includes gravity, uplift force, spring-box forces, normal contact forces on the two strips, and the panhead pitching moment induced by longitudinal friction. The matrices M c , C c , and K c are the mass, damping, and stiffness matrices of the free ROCL nodes, respectively.

3. Model Validation and Representative Adverse Operating Conditions

3.1. Baseline Model Validation

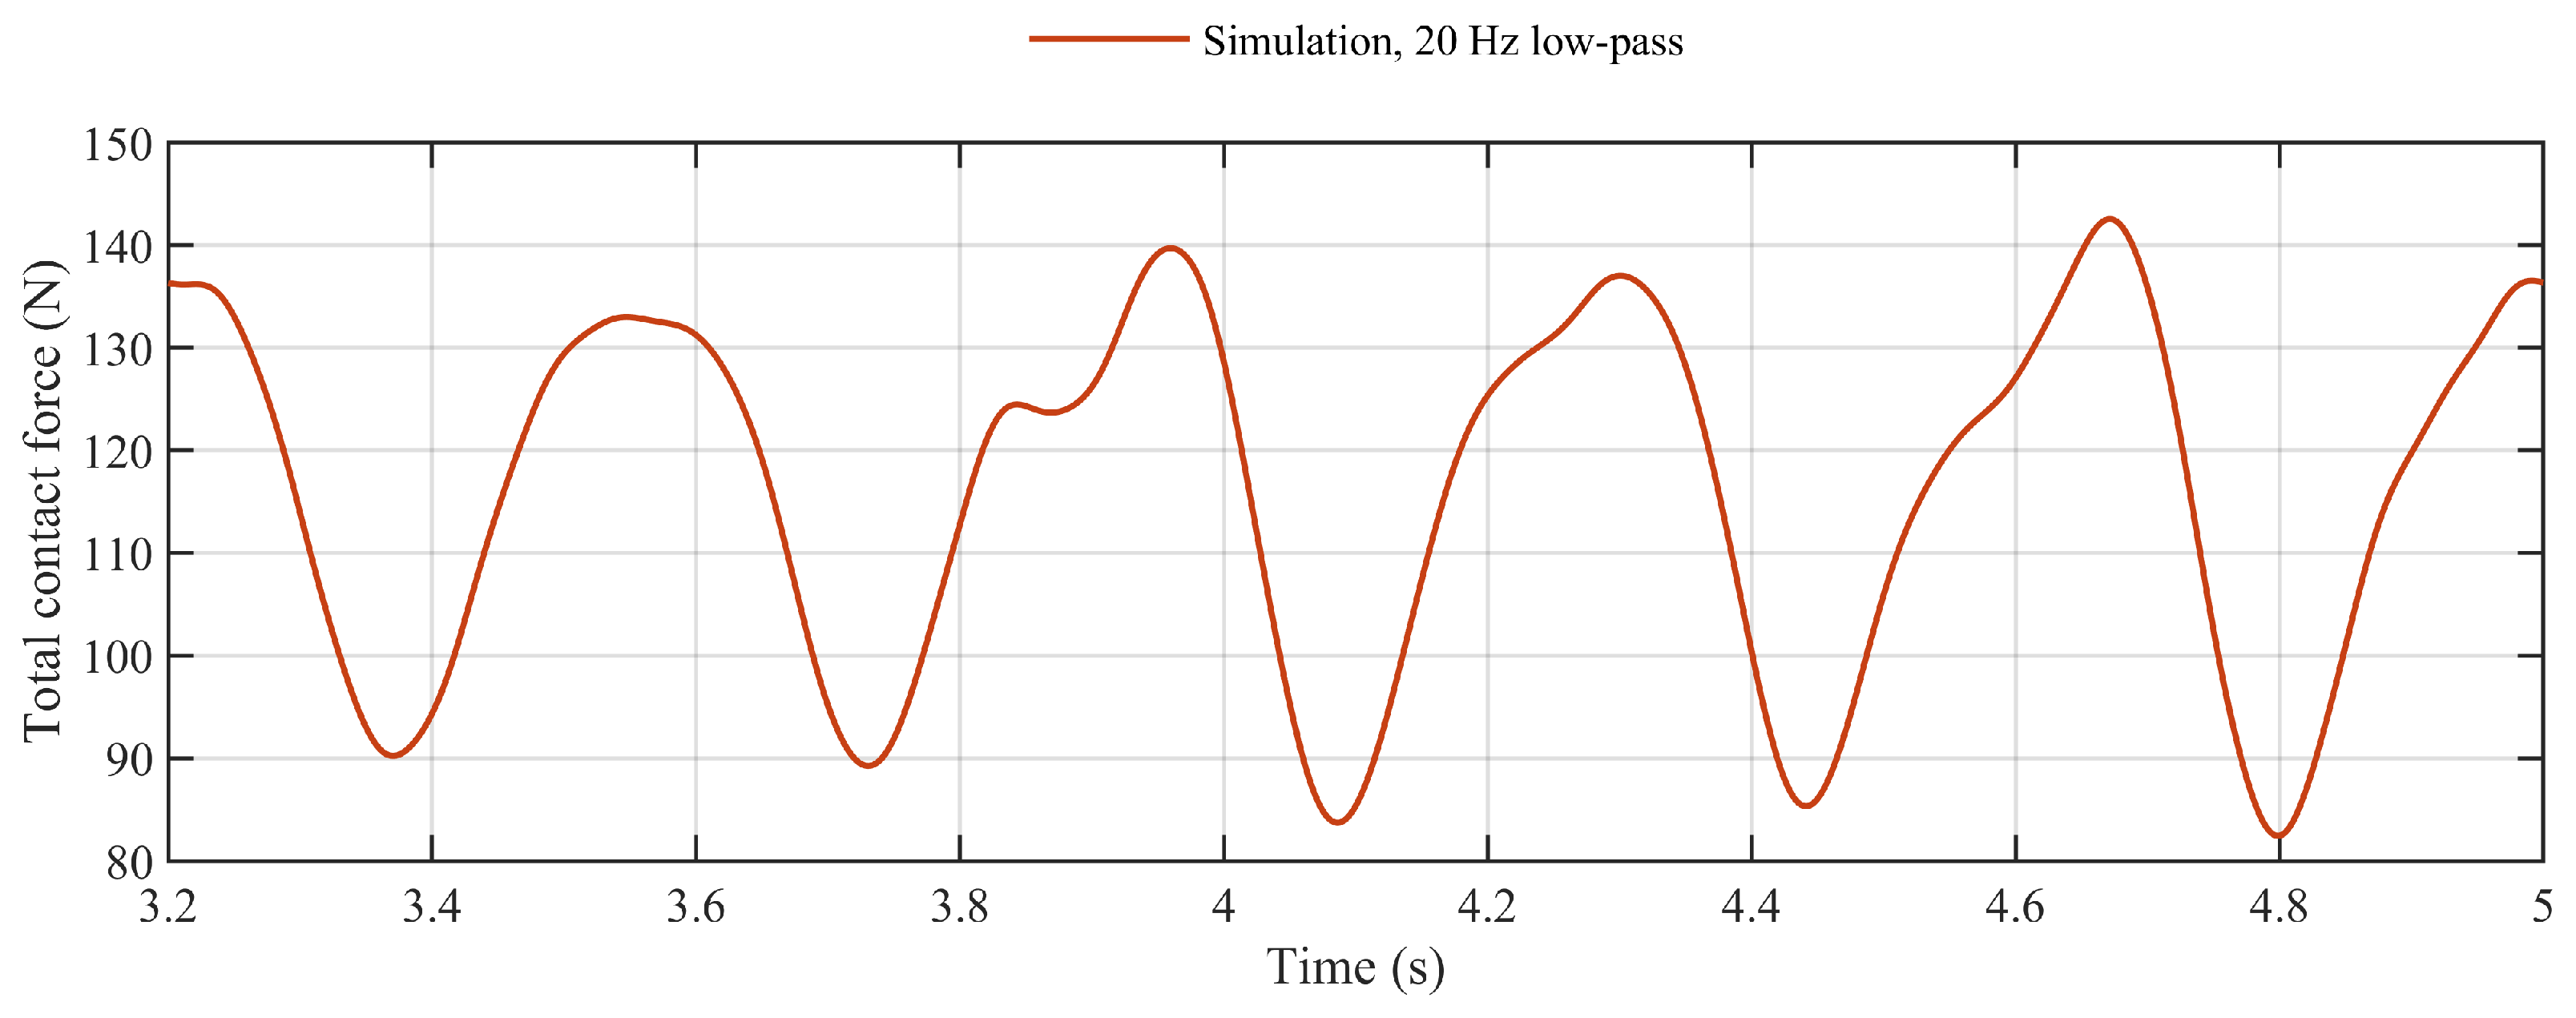
To ensure that the subsequent winter-condition modelling and panhead-parameter optimisation are based on a credible coupled model, the baseline pantograph-ROCL model is validated against line operating conditions. The validation case follows a Guangzhou Metro ROCL test [41]. The parameters of the standard rigid-suspension section are consistent with those used for that line-validation case, while the pantograph retains the independent vertical degrees of freedom of the two strips developed in this study. The validation speed is 80 km/h. The pantograph is raised and establishes stable contact for 0–3 s, after which moving current collection begins. To exclude the initial transient from the statistics, the evaluation window starts at 3.2 s and continues to the end of the simulation. The results are shown in Figure 4.
Following established validation procedures for pantograph-ROCL models, the minimum, maximum, mean, and standard deviation of the total contact force are selected as validation indices and compared with the corresponding line-test statistics [42,43,44,45], as listed in Table 1.
Table 1 shows that the simulated minimum, maximum, mean and standard deviation reproduce the measured contact-force level with relative deviations below 20%. The baseline validation therefore supports comparative analysis of the coupled mechanical response. It does not constitute direct validation of individual-strip forces, low-temperature wear evolution or long-term material removal, which are interpreted through comparative response indicators in the following sections. The largest deviation is associated with the minimum contact force (18.37%), which is sensitive to brief separation events and to the idealised penalty-contact representation; it is therefore interpreted as a comparative validation statistic.

3.2. Representative Low-Temperature and Low-Humidity Scenario

A representative adverse operating scenario is introduced into the validated pantograph–ROCL model to examine how low temperature and low humidity can affect dual-strip current collection and panhead pitching. The scenario is not intended as a universal description of all metro winter environments. For a standard tunnel ROCL section, no icing mass, snow load or ice-layer geometry is imposed; environmental effects are represented by deterioration of interfacial friction and changes in the external support boundaries.
First, the frictional state of the collector strip-contact wire interface is modified. Tests on current-carrying C/Cu sliding pairs show that ambient temperature changes the state of the current-carrying interface and that the coefficient of friction increases as temperature decreases under both current-carrying and non-current conditions. The mean coefficient under current-carrying conditions nevertheless remains below that of the extreme dry-friction condition without current [11]. Experiments under extreme temperature and humidity further show that decreasing temperature significantly increases the coefficient of friction, carbon wear, and copper-surface roughness of C/Cu contact pairs. A dry environment makes the carbon material more susceptible to oxidation and cracking, whereas excessive humidity may intensify abrasive wear and arcing [10]. Accordingly, the constant coefficient of friction in the baseline case is replaced by a slowly varying random low-temperature and low-humidity friction profile along the line. The low-humidity boundary is also consistent with the 20–25% RH low-humidity test condition adopted for a pantograph strip-contact wire pair in [8].
μ s = m i n μ m a x , m a x μ m i n , μ 0 1 + a μ η s
where μ s is the local coefficient of friction at contact position s ; μ 0 is the mean coefficient of friction under the low-temperature, low-humidity, snow-free winter condition; η s is a spatially correlated random disturbance; a μ is its amplitude; and μ m i n and μ m a x are the lower and upper bounds of the coefficient of friction. The model uses an ambient temperature of 0 °C and a relative humidity of 20 % ; the random fluctuation amplitude is 25 % , and the spatial correlation length is 1.5 m . In the present scenario, the ambient temperature and relative humidity are set to 0 °C and 20% RH, respectively, and the mean friction coefficient, relative random fluctuation amplitude, and correlation length are set to μ 0 = 0.60, 25%, and 1.5 m, respectively. The 0 °C boundary was included in the C/Cu tests in [10,11], while 20–25% RH was used as a low-humidity condition in [8]. The mean value is selected between the normal current-carrying range of about 0.30–0.38 reported for rigid overhead contact systems [5] and high-friction states approaching 0.8 reported in friction-induced-vibration experiments [27,28]. The random field represents spatial variation in the strip-wire interface. μ m a x is limited to 0.78 . The lower clipping bound is 0.38. For the implemented normalised field, the 25% modulation about μ0 = 0.60 gives a nominal unclipped interval of 0.45–0.75; hence, 0.38–0.78 is a bounded modelling envelope rather than the range necessarily reached by every realisation.
Second, the ROCL support system is modified. A rigid overhead contact line relies primarily on fixed supports, registration clamps, and the conductor-rail/contact-wire assembly to maintain the spatial position of the contact wire. Its high stiffness, short support spacing, and low clearance make current-collection quality sensitive to local irregularities, component condition, and geometric deviations during high-speed sliding contact [3]. Low-temperature thermal contraction, changes in connector condition, and support-state deviations are therefore represented by a small increase in support stiffness and deviations in the reference heights of support points. The equivalent support stiffness in winter is modified as follows:
k s , w = α s k s , 0
where k s , 0 is the suspension support stiffness in the baseline case, k s , w is the equivalent support stiffness under the adverse winter condition, and α s is the support-stiffness amplification factor. The reference-height deviation of a support point is expressed as follows:
Δ h i = A h s i n 2 π x i λ h + ε i
where Δ h i is the reference-height deviation of support point i ; x i is its longitudinal coordinate; A h is the amplitude of the deterministic low-frequency height deviation; ε i is the local random height deviation; and λ h is the wavelength of the low-frequency thermal deformation. These quantities are equivalent support-boundary parameters. The support-stiffness factor is set to k s , w = 1.10 k s , 0 , corresponding to a 10 % increase in equivalent support stiffness. The support-point height deviation is the superposition of a deterministic low-frequency component of 1.5 m m and a local random component of 0.5 m m . The low-frequency wavelength is 20 m (2.5 spans). These numerical perturbations represent thermal- and installation-related local geometry changes at the external support boundaries; they are modelling assumptions, whereas the physical sensitivity of ROCL geometry and dynamics to the support condition is supported by [3].
The parameter set is used for comparative mechanism analysis and is not presented as a line-specific environmental calibration.
The representative scenario uses an environmental boundary of 0 °C and 20% RH. The friction coefficient is prescribed as a bounded spatially correlated profile, while the ROCL support stiffness and support-point reference heights are modified within small ranges. These inputs isolate two mechanical pathways: the variation in tangential frictional excitation and variation in the contact-wire support boundary. They are used for comparative mechanism analysis rather than line-specific prediction.

3.3. Dynamic Response Under the Representative Adverse Condition

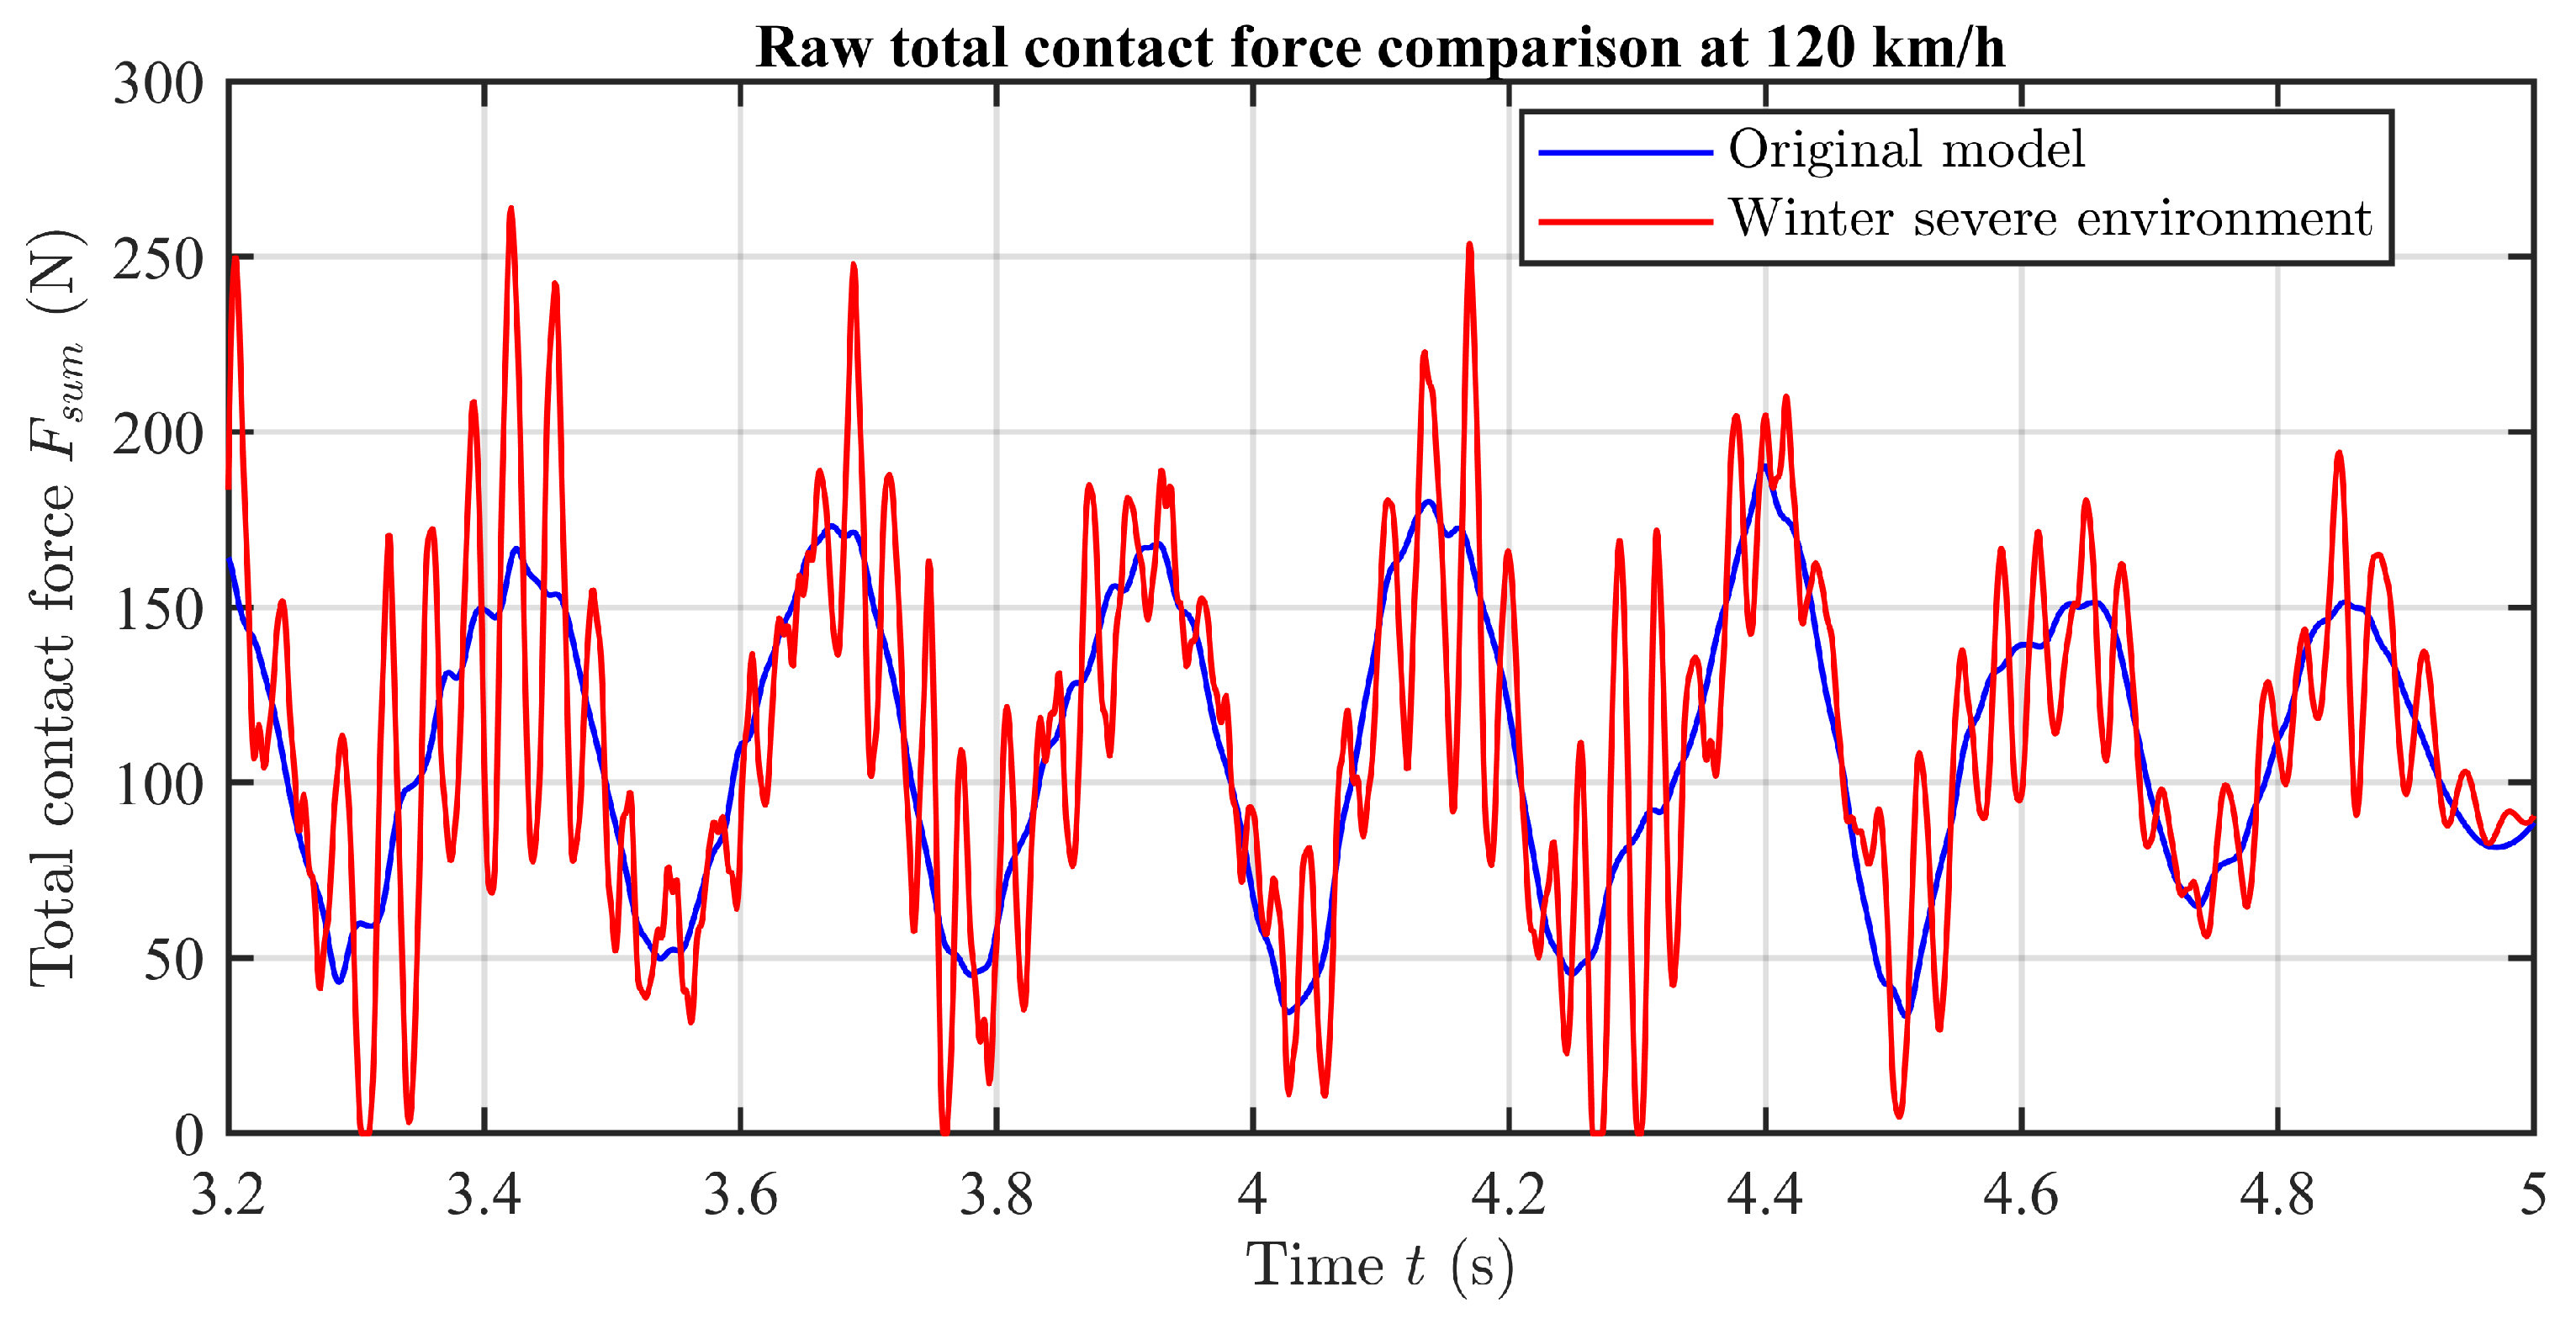
After baseline validation and definition of the representative adverse scenario, the operating speed is increased to 120 km/h to represent the upper range of metro operation. Dynamic responses of the baseline and representative adverse cases are compared. Figure 5 presents the total contact-force histories, and Table 2 lists the maximum, minimum, mean and standard deviation. Before comparing the physical response at this speed, numerical convergence was checked by increasing the ROCL discretisation from four to eight Euler–Bernoulli beam elements per span and halving the maximum integration step from 0.2 ms to 0.1 ms; the three primary indices are reported in Table 3.
Table 3 shows that, relative to the eight-elements-per-span and 0.1 ms reference calculation, the baseline differences in maximum pitch angle, contact-force standard deviation and dual-strip load imbalance are 0.07%, 0.13% and 1.15%, respectively. With eight elements per span, halving the maximum integration step produces no change in the three reported indices. The 120 km/h results are therefore numerically insensitive to the tested spatial and temporal refinement. Accordingly, within the tested discretisation and integration settings, the coupled model provides a numerically reliable basis for the subsequent comparative analyses under the representative adverse condition at 120 km/h.
Figure 5 shows that the representative adverse condition changes the mean contact force only slightly but markedly increases dynamic fluctuation and short-duration impact. The mean increases from 110.69 to 112.44 N (1.58%), whereas the standard deviation increases from 40.57 to 50.98 N (25.66%) and the maximum rises from 190.40 to 263.92 N (38.61%). The minimum decreases from 33.42 to 0 N, indicating momentary contact loss. Thus, mean total contact force alone cannot characterise local current-collection deterioration.
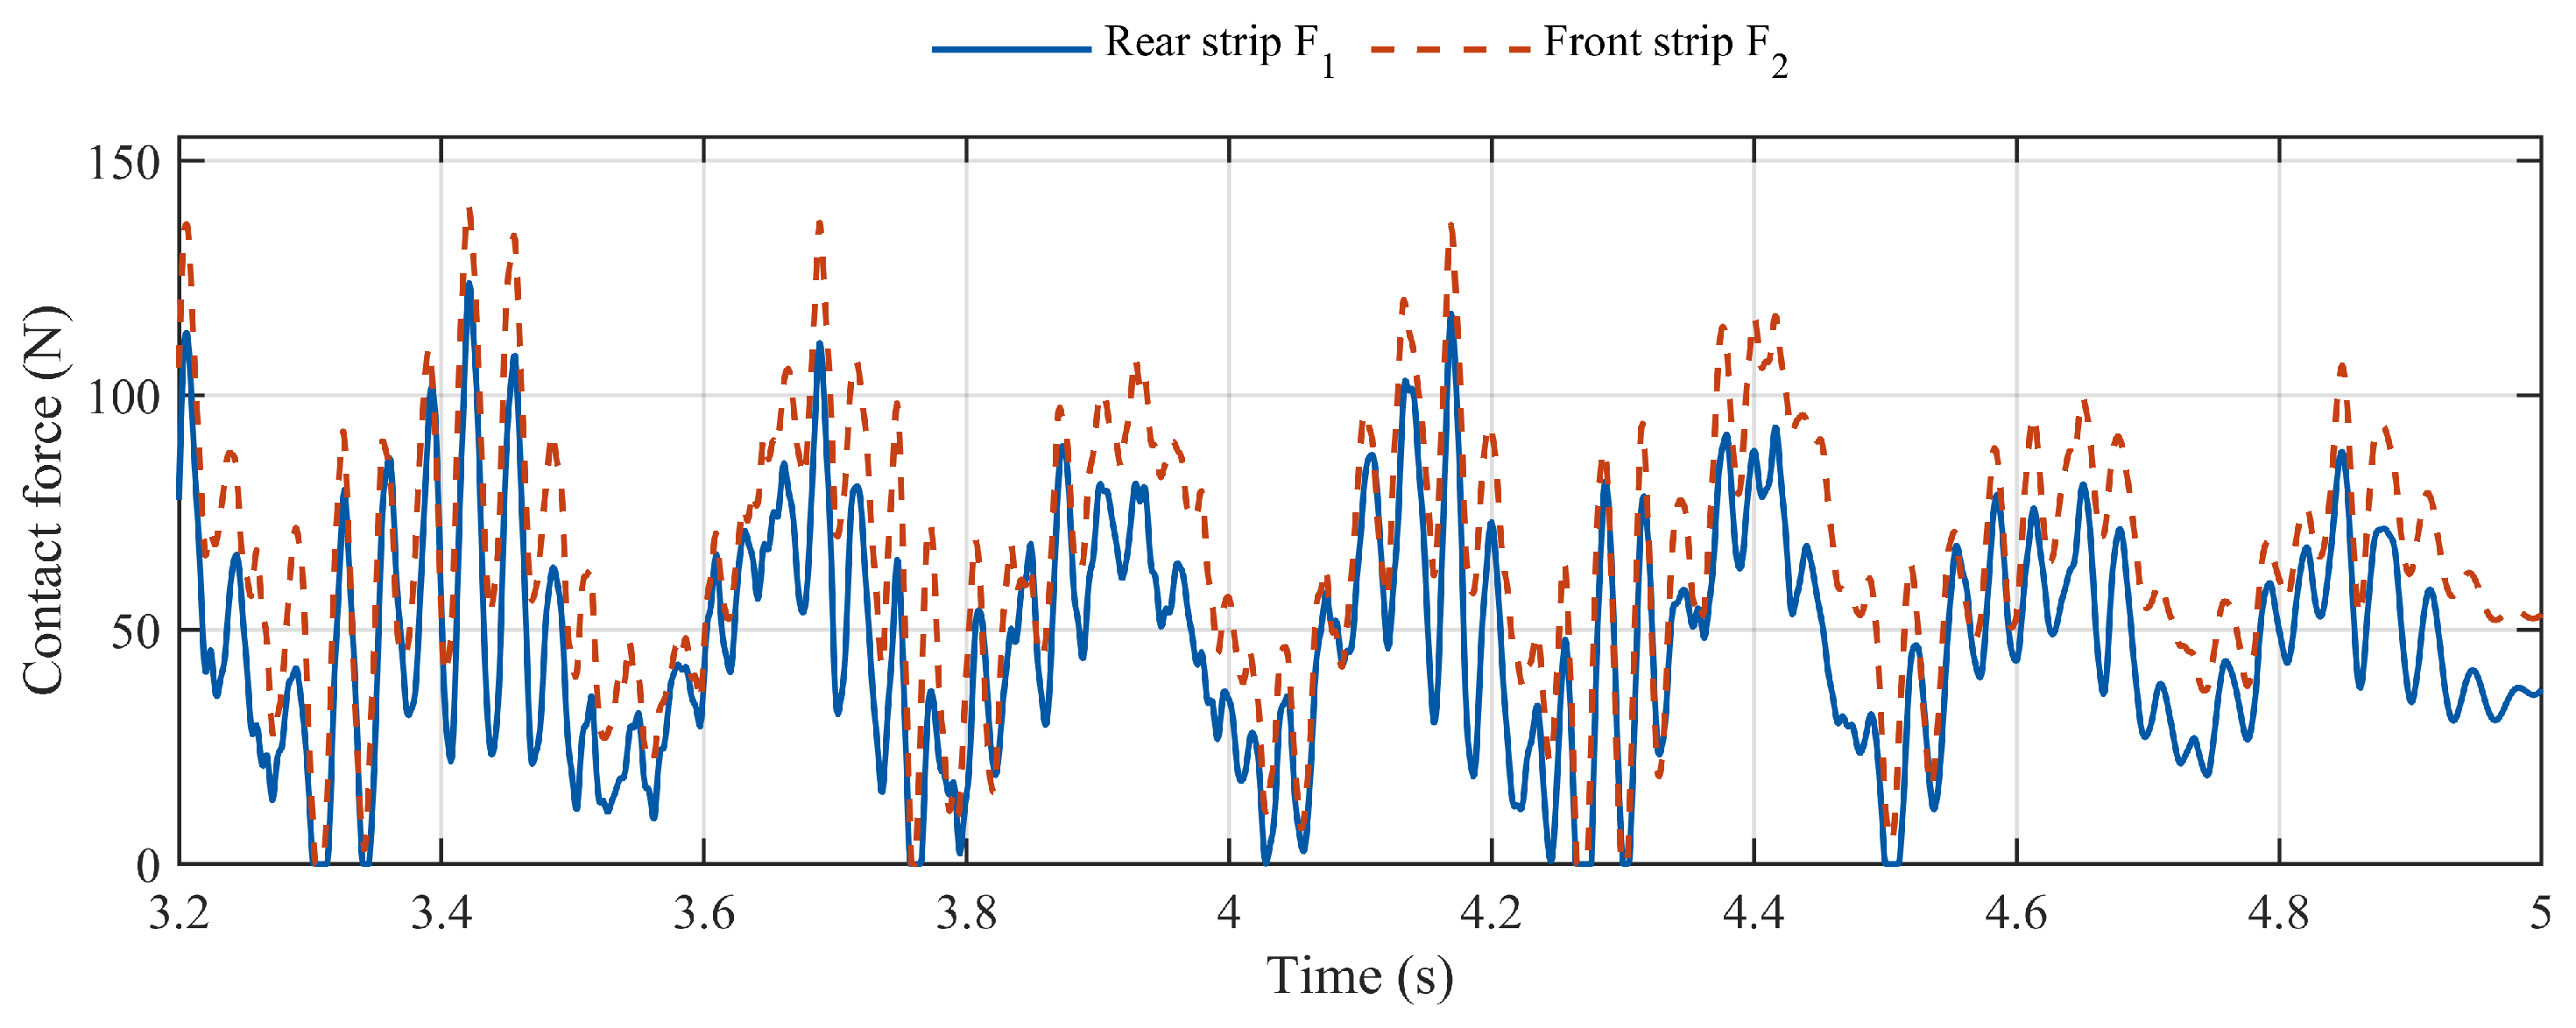
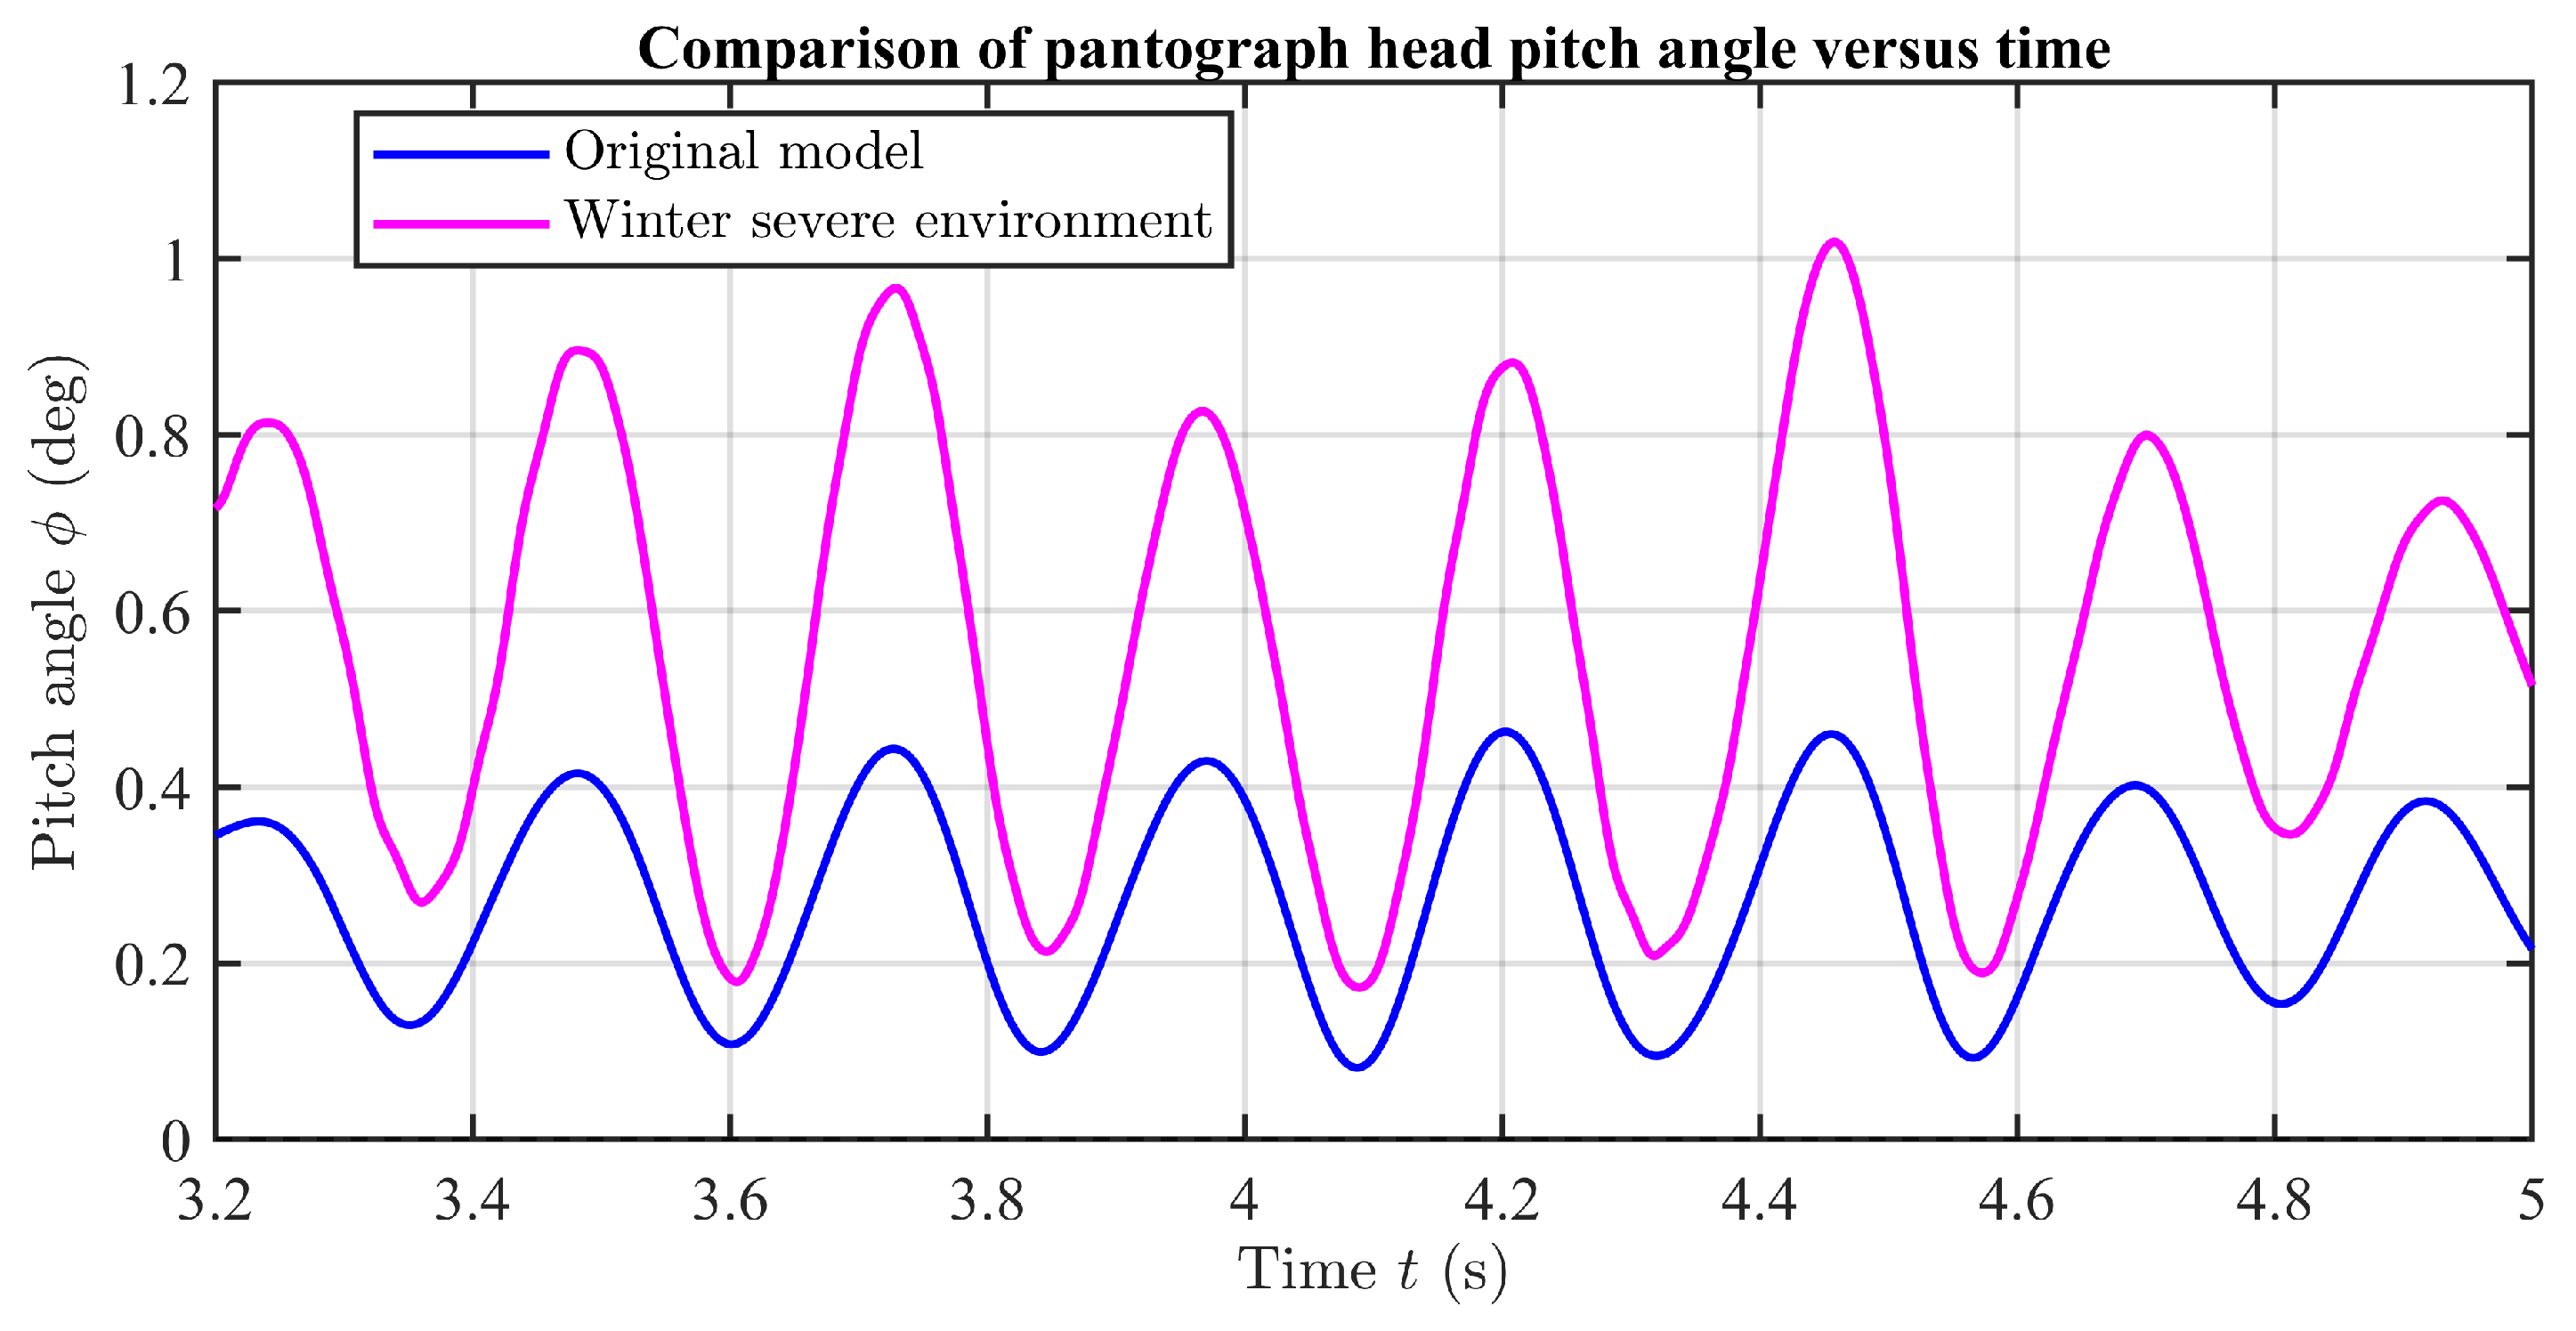
The independent dual-strip model shows that the two strips do not always share the total contact force uniformly. The strip with the lower instantaneous contact force due to panhead pitching is hereafter termed the lower-loaded strip. Figure 6 and Figure 7 show that, when the panhead pitches, compression of one spring box increases while that of the other decreases, causing simultaneous differences in the normal penetration and contact force of the two strips. At several instants, the contact force of the lower-loaded strip approaches 0 N, indicating poor contact or even momentary contact loss. The higher winter coefficient of friction increases the pitching moment generated by longitudinal friction through the contact-point moment arms, thereby intensifying this load imbalance.
From the moment–transmission relationship, the influence of longitudinal friction on panhead pitching can be expressed as follows:
M μ t = μ 1 s 1 F 1 t l z 1 + μ 2 s 2 F 2 t l z 2 .
where M μ t is the friction-induced panhead pitching moment; μ 1 s 1 and μ 2 s 2 are the local coefficients of friction at the contact positions of the two strips; and l z 1 and l z 2 are the equivalent moment arms from the contact points to the panhead reference point. Equation (25) shows that, for similar normal contact forces, an increase in the coefficient of friction directly amplifies the pitching moment. Once the two strip forces become unbalanced, the friction-induced moment further intensifies panhead attitude deviation.
The representative adverse scenario mainly increases force fluctuation, impact force, panhead pitching and local poor-contact risk rather than mean force. Friction-induced moments and support-height deviations jointly redistribute the two strip forces. Optimisation should therefore target panhead attitude, total-force fluctuation and dual-strip load sharing rather than static uplift or mean force alone.

4. Results and Discussion

4.1. Sensitivity Analysis of Panhead Parameters

The response results in Section 3.3 show that the representative adverse condition intensifies panhead pitching, total-contact-force fluctuation and unequal load sharing between the two strips. To identify the governing mechanical design variables, a local sensitivity analysis is conducted using the coupled independent dual-strip pantograph–planar Euler–Bernoulli ROCL model.
Only local panhead parameters are varied; the main pantograph linkage and the strip-wire contact principle remain unchanged. The selected parameters are l 0 , l k , k b , and c b . Parameter l 0 determines the moment arm of each strip relative to the panhead reference point and therefore directly affects transmission of the strip-force difference and friction force into panhead pitching moment. Parameter l k governs the initial geometric relationship between the strips and panhead frame and the spring-box compression state. Parameter k b determines the local vertical support capacity of the strips and the intensity of contact-force transmission. Parameter c b governs local vibration-energy dissipation and attenuation of high-frequency contact-force fluctuations. These are all locally designable panhead parameters that are directly related to dual-strip load sharing and pitch suppression and can be adjusted in engineering design. Each parameter is varied within ±30% of its baseline value. The sensitivity-parameter vector p is as follows:
p = l 0 l k k b c b T .
Three performance indices are selected: maximum panhead pitch angle η φ , standard deviation of total contact force η σ , and dual-strip load-imbalance index η U . Index η φ evaluates panhead attitude stability; a larger value indicates a stronger pitch response to friction-induced moments and ROCL geometric disturbances. Index η σ evaluates overall current-collection stability and reflects peak-to-valley contact-force fluctuations and intensified local impacts. Index η U evaluates load distribution between the two strips; a larger value indicates more uneven loading and a greater risk of poor contact or momentary contact loss by the lower-loaded strip. The indices are defined as follows:
η φ = m a x t t 1 , t 2 φ t η σ = 1 T s t 1 t 2 F Σ t F ¯ Σ 2 d t η U = 1 T s t 1 t 2 F 1 t F 2 t 2 d t F ¯ Σ × 100 %
where t 1 , t 2 , and T s are the start time, end time, and duration of the statistical window, respectively; φ t is the panhead pitch angle; F Σ t is the sum of the normal contact forces on the two strips; and F ¯ Σ is the mean total contact force over the statistical window. The index η U is the dual-strip load imbalance, and F 1 t and F 2 t are the normal contact forces of the two strips. Unlike conventional assessment based only on total contact-force statistics, these three indices jointly represent the coupled relationship among panhead attitude, total contact-force fluctuation, and dual-strip load sharing.
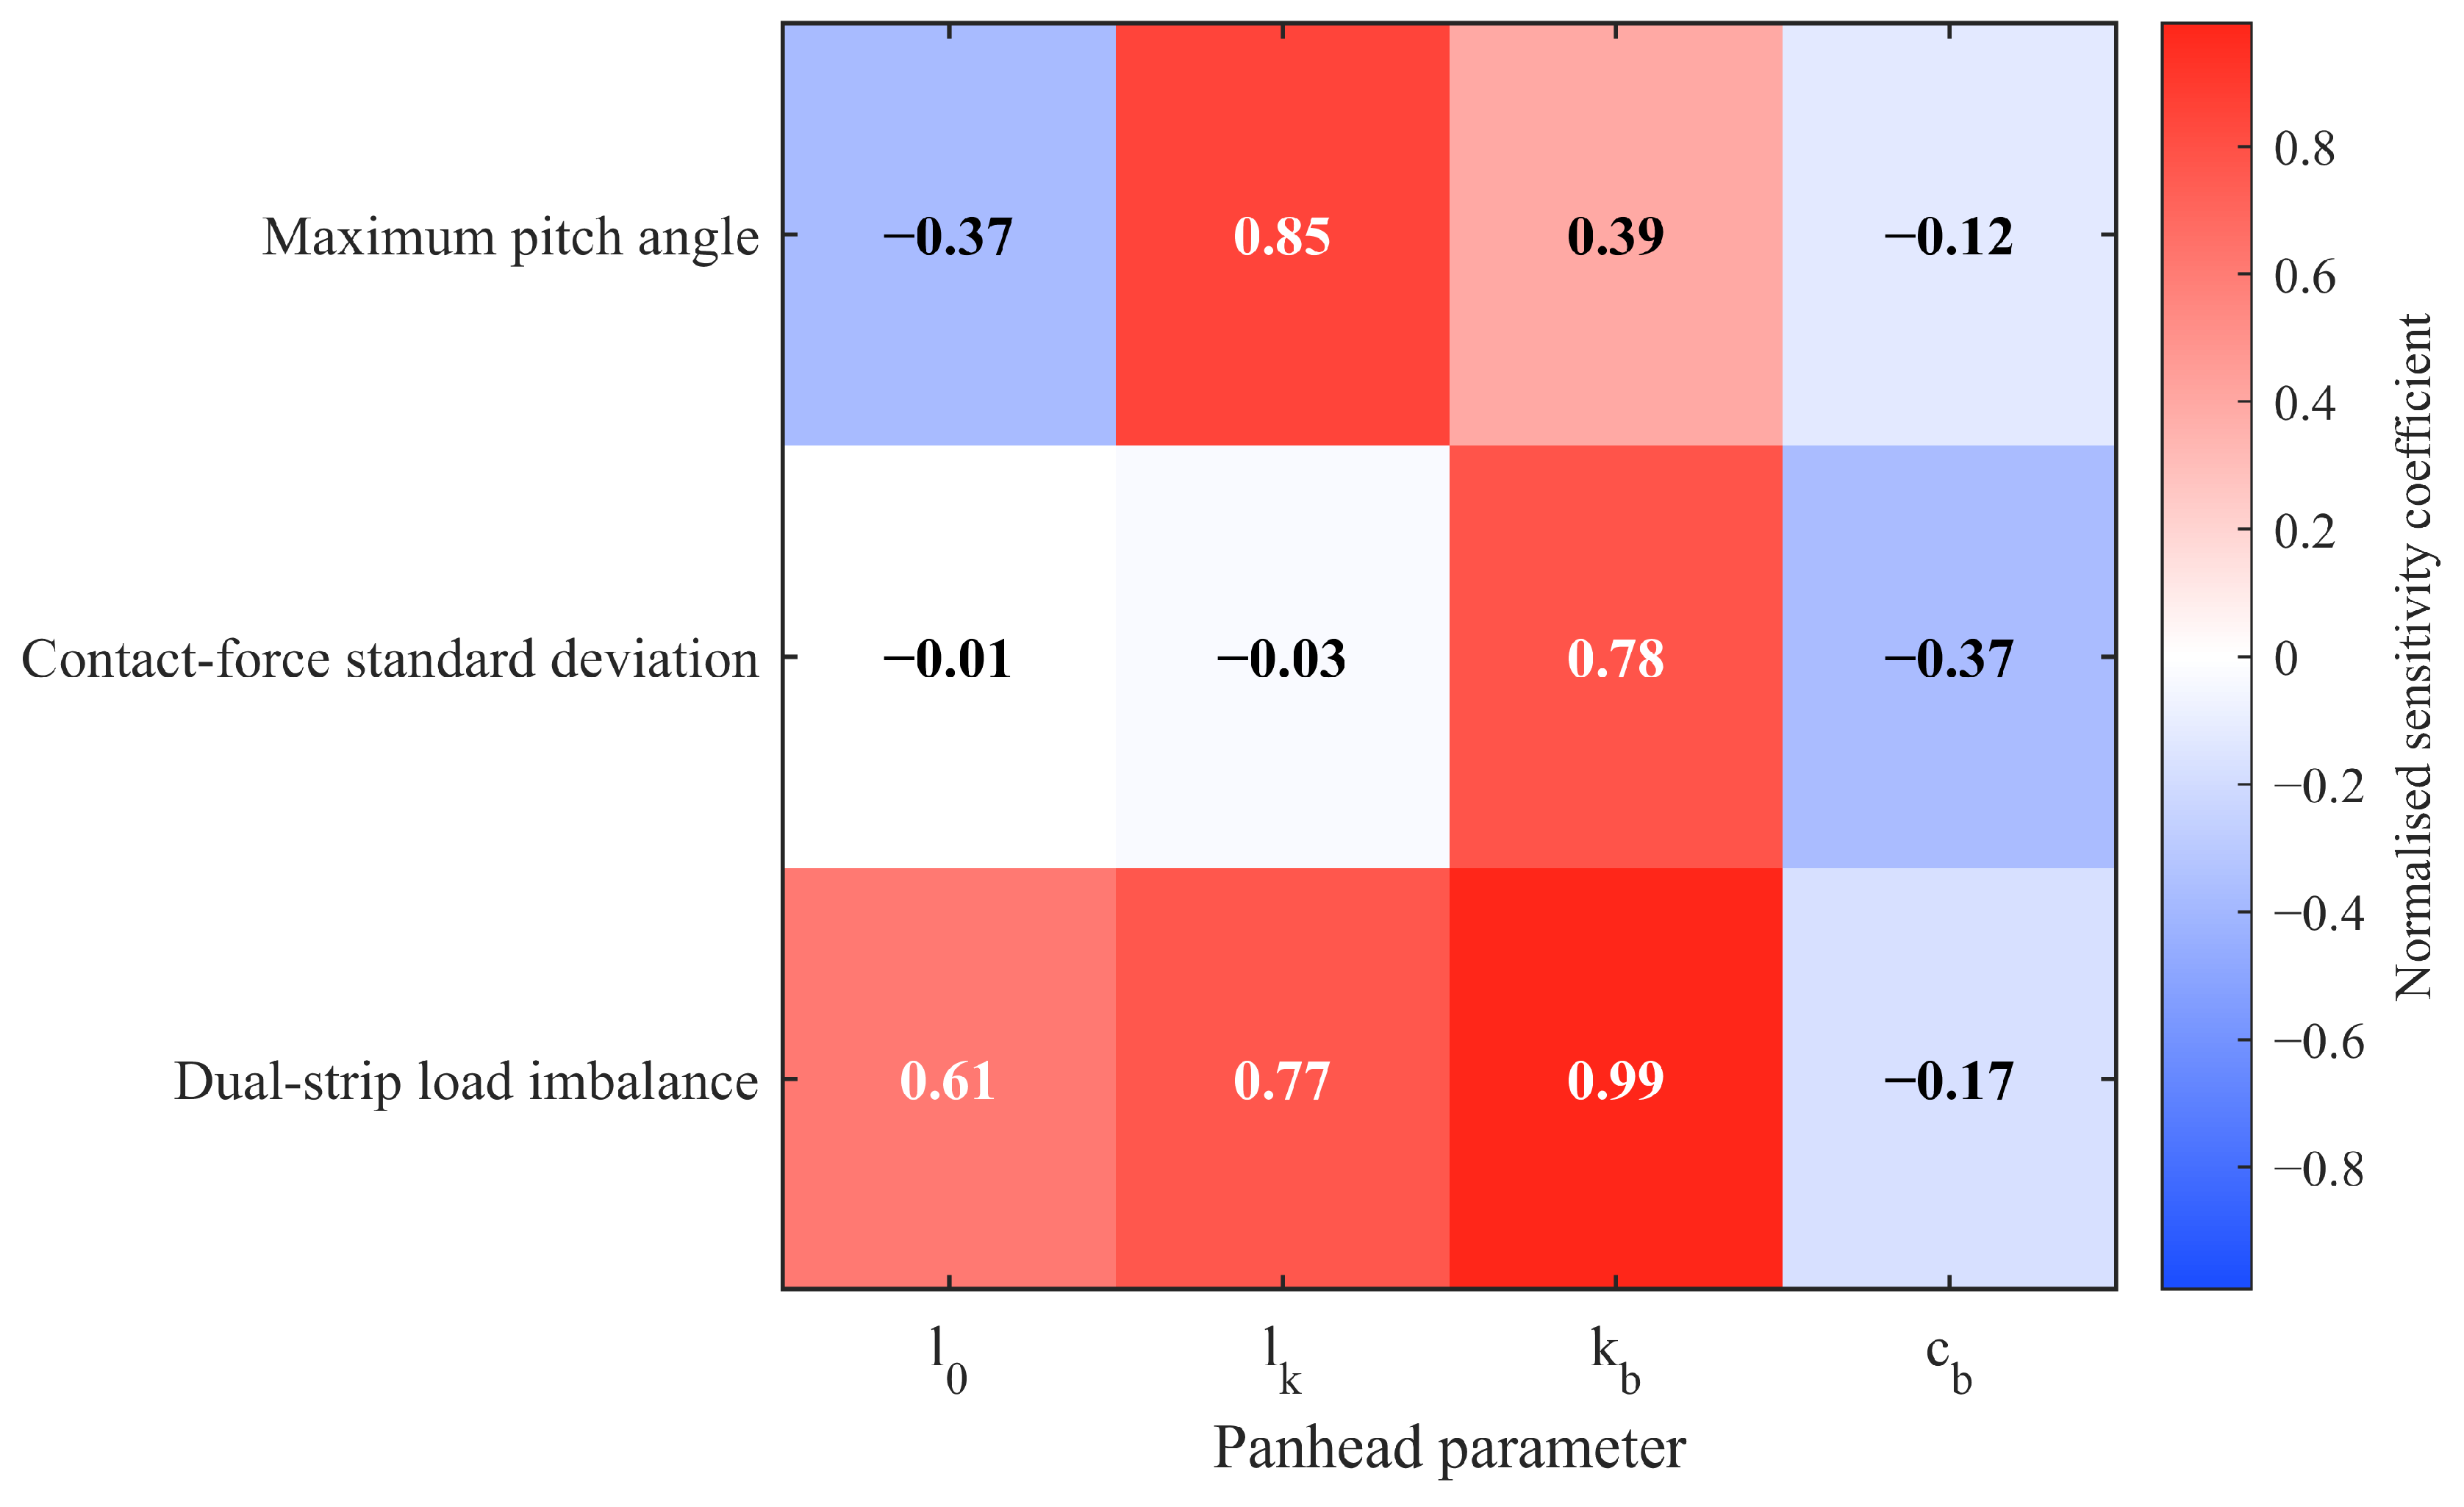
A one-factor-at-a-time local sensitivity method is used. The panhead parameters in the adverse winter case are taken as the baseline, and only one parameter is changed in each simulation while the others remain fixed. Parameter variation is increased in 10% increments. For every perturbation, the three performance indices are calculated under the same winter environment and operating speed. Sensitivity curves are then plotted using the percentage changes relative to the baseline, and a comprehensive sensitivity heat map is formed from the mean trend over the full perturbation range, as shown in Figure 8.
The nominal spring-box length represents the geometric assembly length of the spring box. For each tested length, the vertical reference positions of the contact line and the two strips are updated consistently, while the initial spring-box support force on each strip is maintained at its static equilibrium value.
An independent one-factor-at-a-time preload F0 check was also conducted over the same ±30% range. The maximum absolute changes were 0.40% in maximum pitch angle, 0.04% in total-contact-force standard deviation, and 0.31% in dual-strip load imbalance. Because the reference static equilibrium is re-established, uniform preload variation does not materially alter the relative stiffness or moment-arm mechanisms governing pitch and load redistribution in the present formulation. Accordingly, F0 is not retained as an optimisation variable.
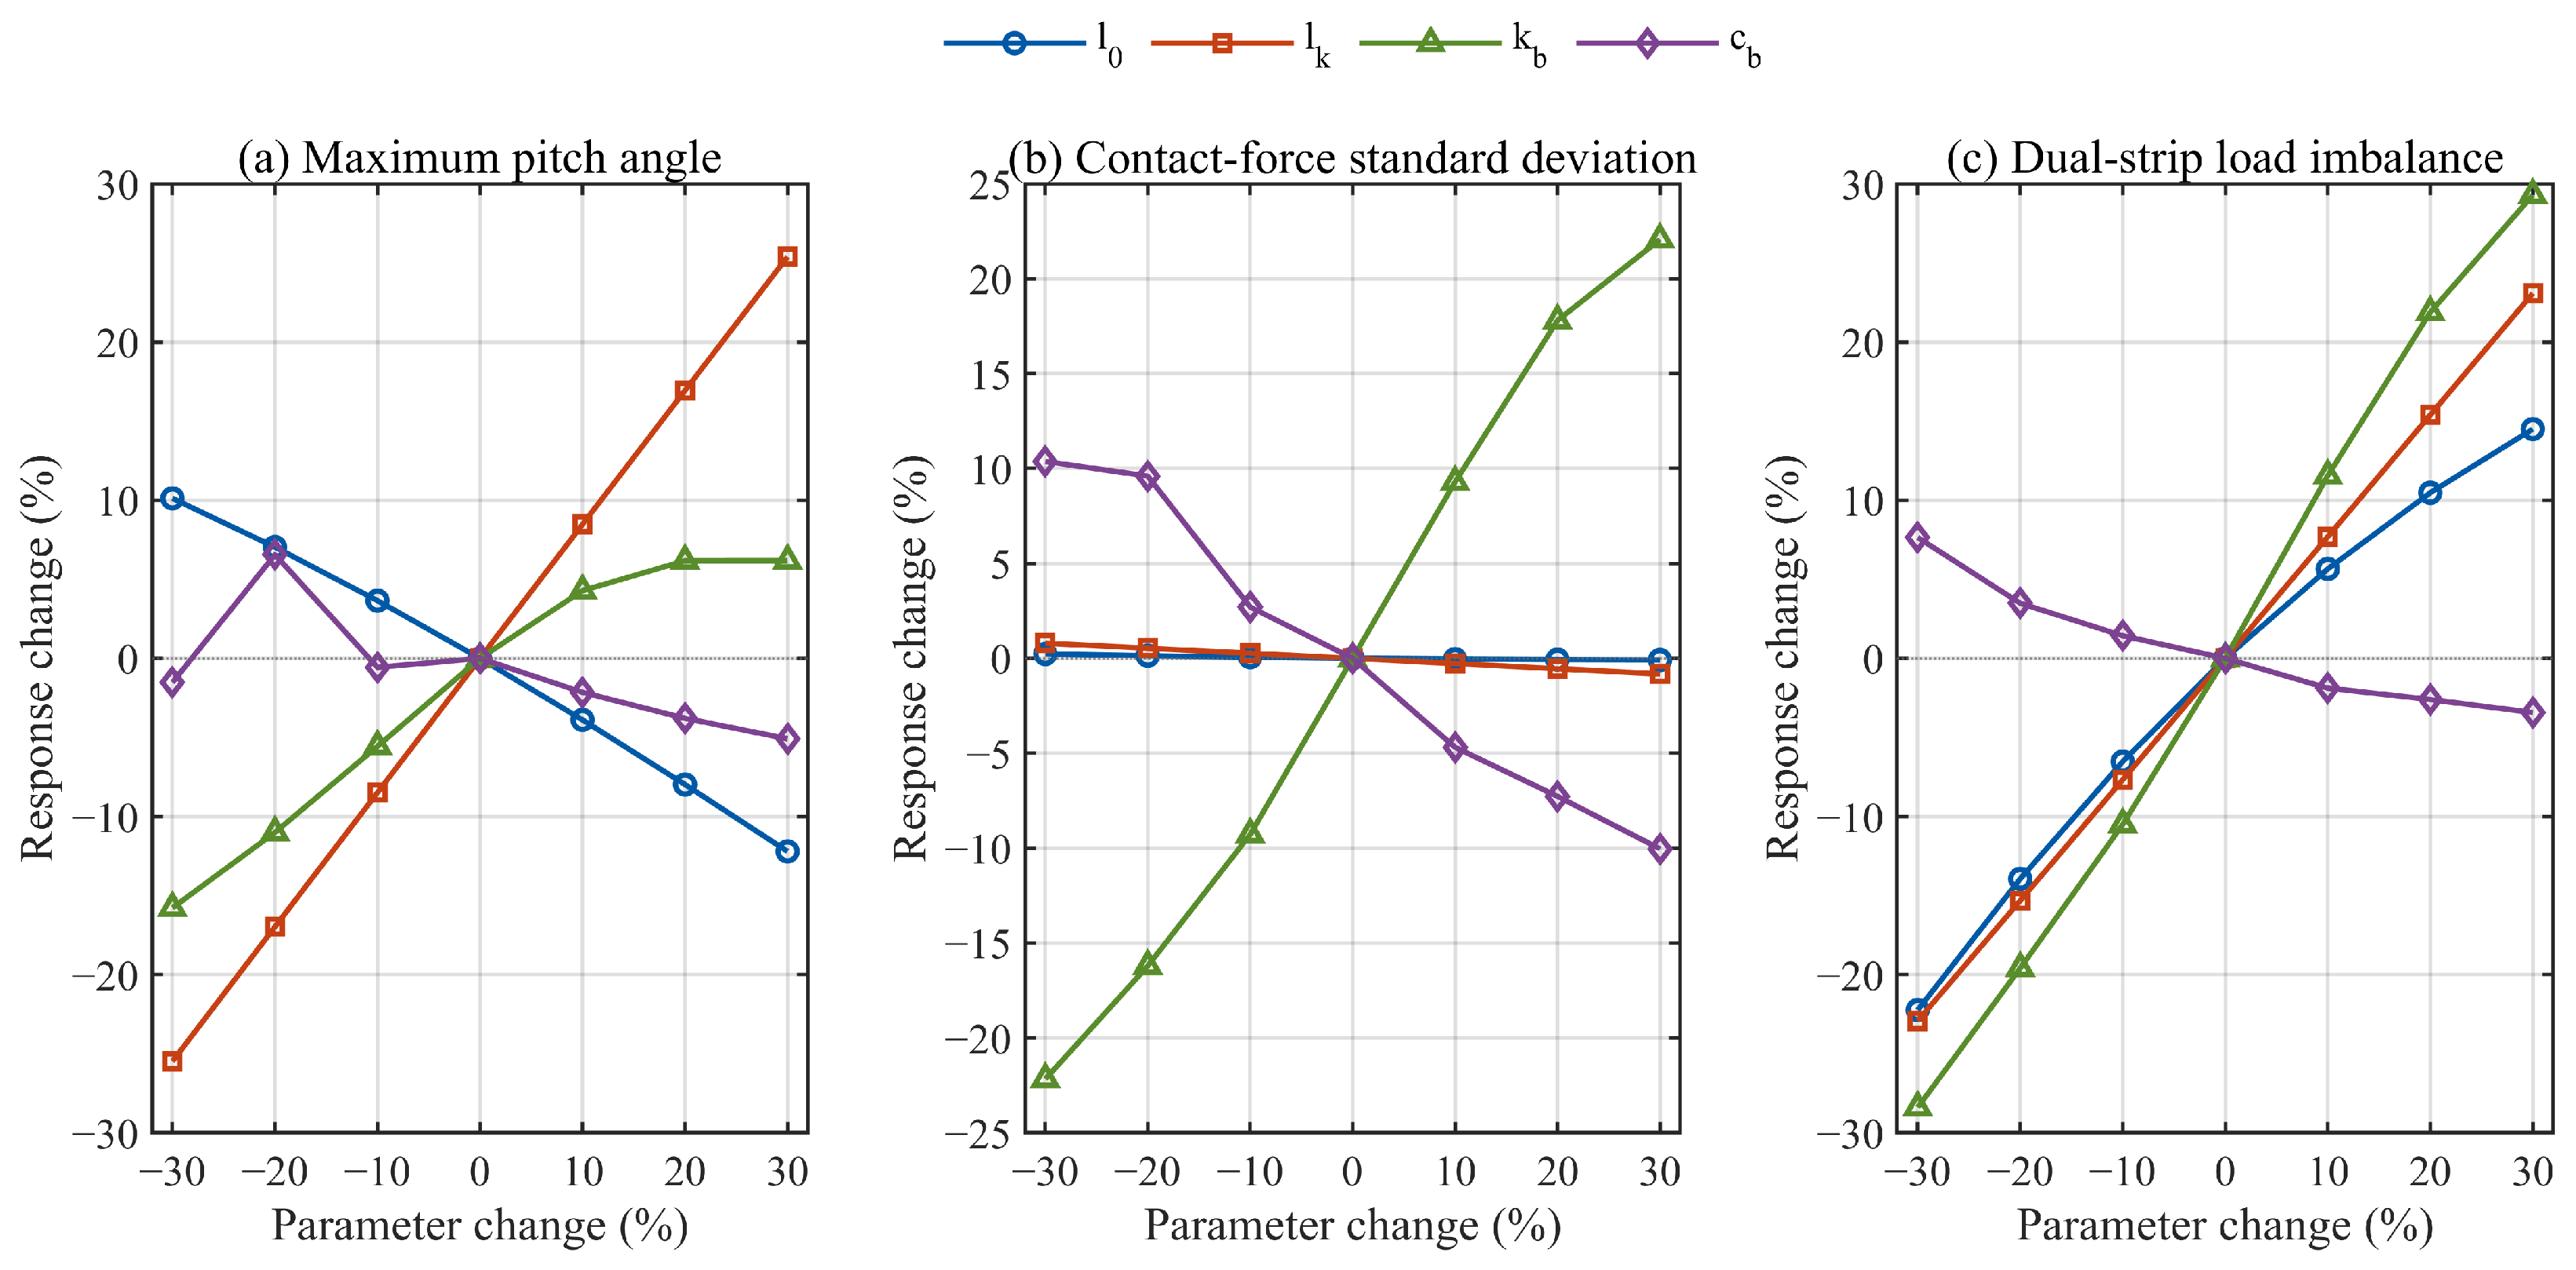
Figure 8 shows clear differences in both the direction and magnitude of the effects of the local panhead parameters. Parameter l 0 has a negative sensitivity with respect to maximum panhead pitch angle, indicating that a moderate increase in half-spacing helps reduce the maximum pitch angle. However, its sensitivity with respect to the dual-strip load imbalance is positive, showing that increasing the half-spacing alone may aggravate the force difference between the two strips. Parameter l k is sensitive to both maximum panhead pitch angle and dual-strip load imbalance because it simultaneously affects the local panhead geometry and strip-support state. Parameter k b strongly affects the standard deviation of contact force and the dual-strip load imbalance and is therefore a key variable governing local force transmission and the risk of contact loss by one strip. Parameter c b is generally negatively sensitive, indicating that greater local energy dissipation suppresses contact-force fluctuation and dual-strip load imbalance. To show the influence of each parameter on each individual index in more detail, the three sensitivity curves are combined in Figure 9. In Figure 8, positive and negative values denote the response changes produced by positive parameter perturbations, and the colour scale permits direct comparison among pitch, contact-force fluctuation, and dual-strip load-imbalance sensitivities.
Figure 9 shows that the four parameters do not affect the three indices in the same manner. Variations in l 0 and l k substantially change the maximum panhead pitch angle, with l k having the more pronounced effect on panhead attitude. The effect of k b is nonlinear, indicating that stiffness changes not only modify local strip support but also alter the transmission path of contact force to the panhead frame. Parameter c b generally suppresses the maximum pitch angle, although its effect is smaller than those of the geometric and stiffness parameters. The horizontal axis gives the parameter variation relative to the baseline, and each panel reports maximum pitch angle, total contact-force standard deviation, or dual-strip load imbalance.
The standard deviation of contact force is governed mainly by k b and c b . Increasing k b strengthens transmission of local strip contact forces to the panhead frame and therefore increases the peak-to-valley fluctuation of total contact force. Increasing c b dissipates local strip-vibration energy and reduces the standard deviation. In comparison, l 0 and l k have weaker effects on the standard deviation, indicating that they primarily alter panhead attitude and dual-strip load distribution.
The dual-strip load-imbalance index is most sensitive to k b , followed by l k and l 0 , whereas c b shows negative sensitivity. Excessive local support stiffness therefore tends to amplify the contact-force difference between the strips and increase the risk of contact loss by one strip, while moderately increasing damping suppresses local vibration and load imbalance. Subsequent optimisation should not simply pursue a larger stiffness but should balance pitch suppression, contact-force fluctuation, and dual-strip load sharing.
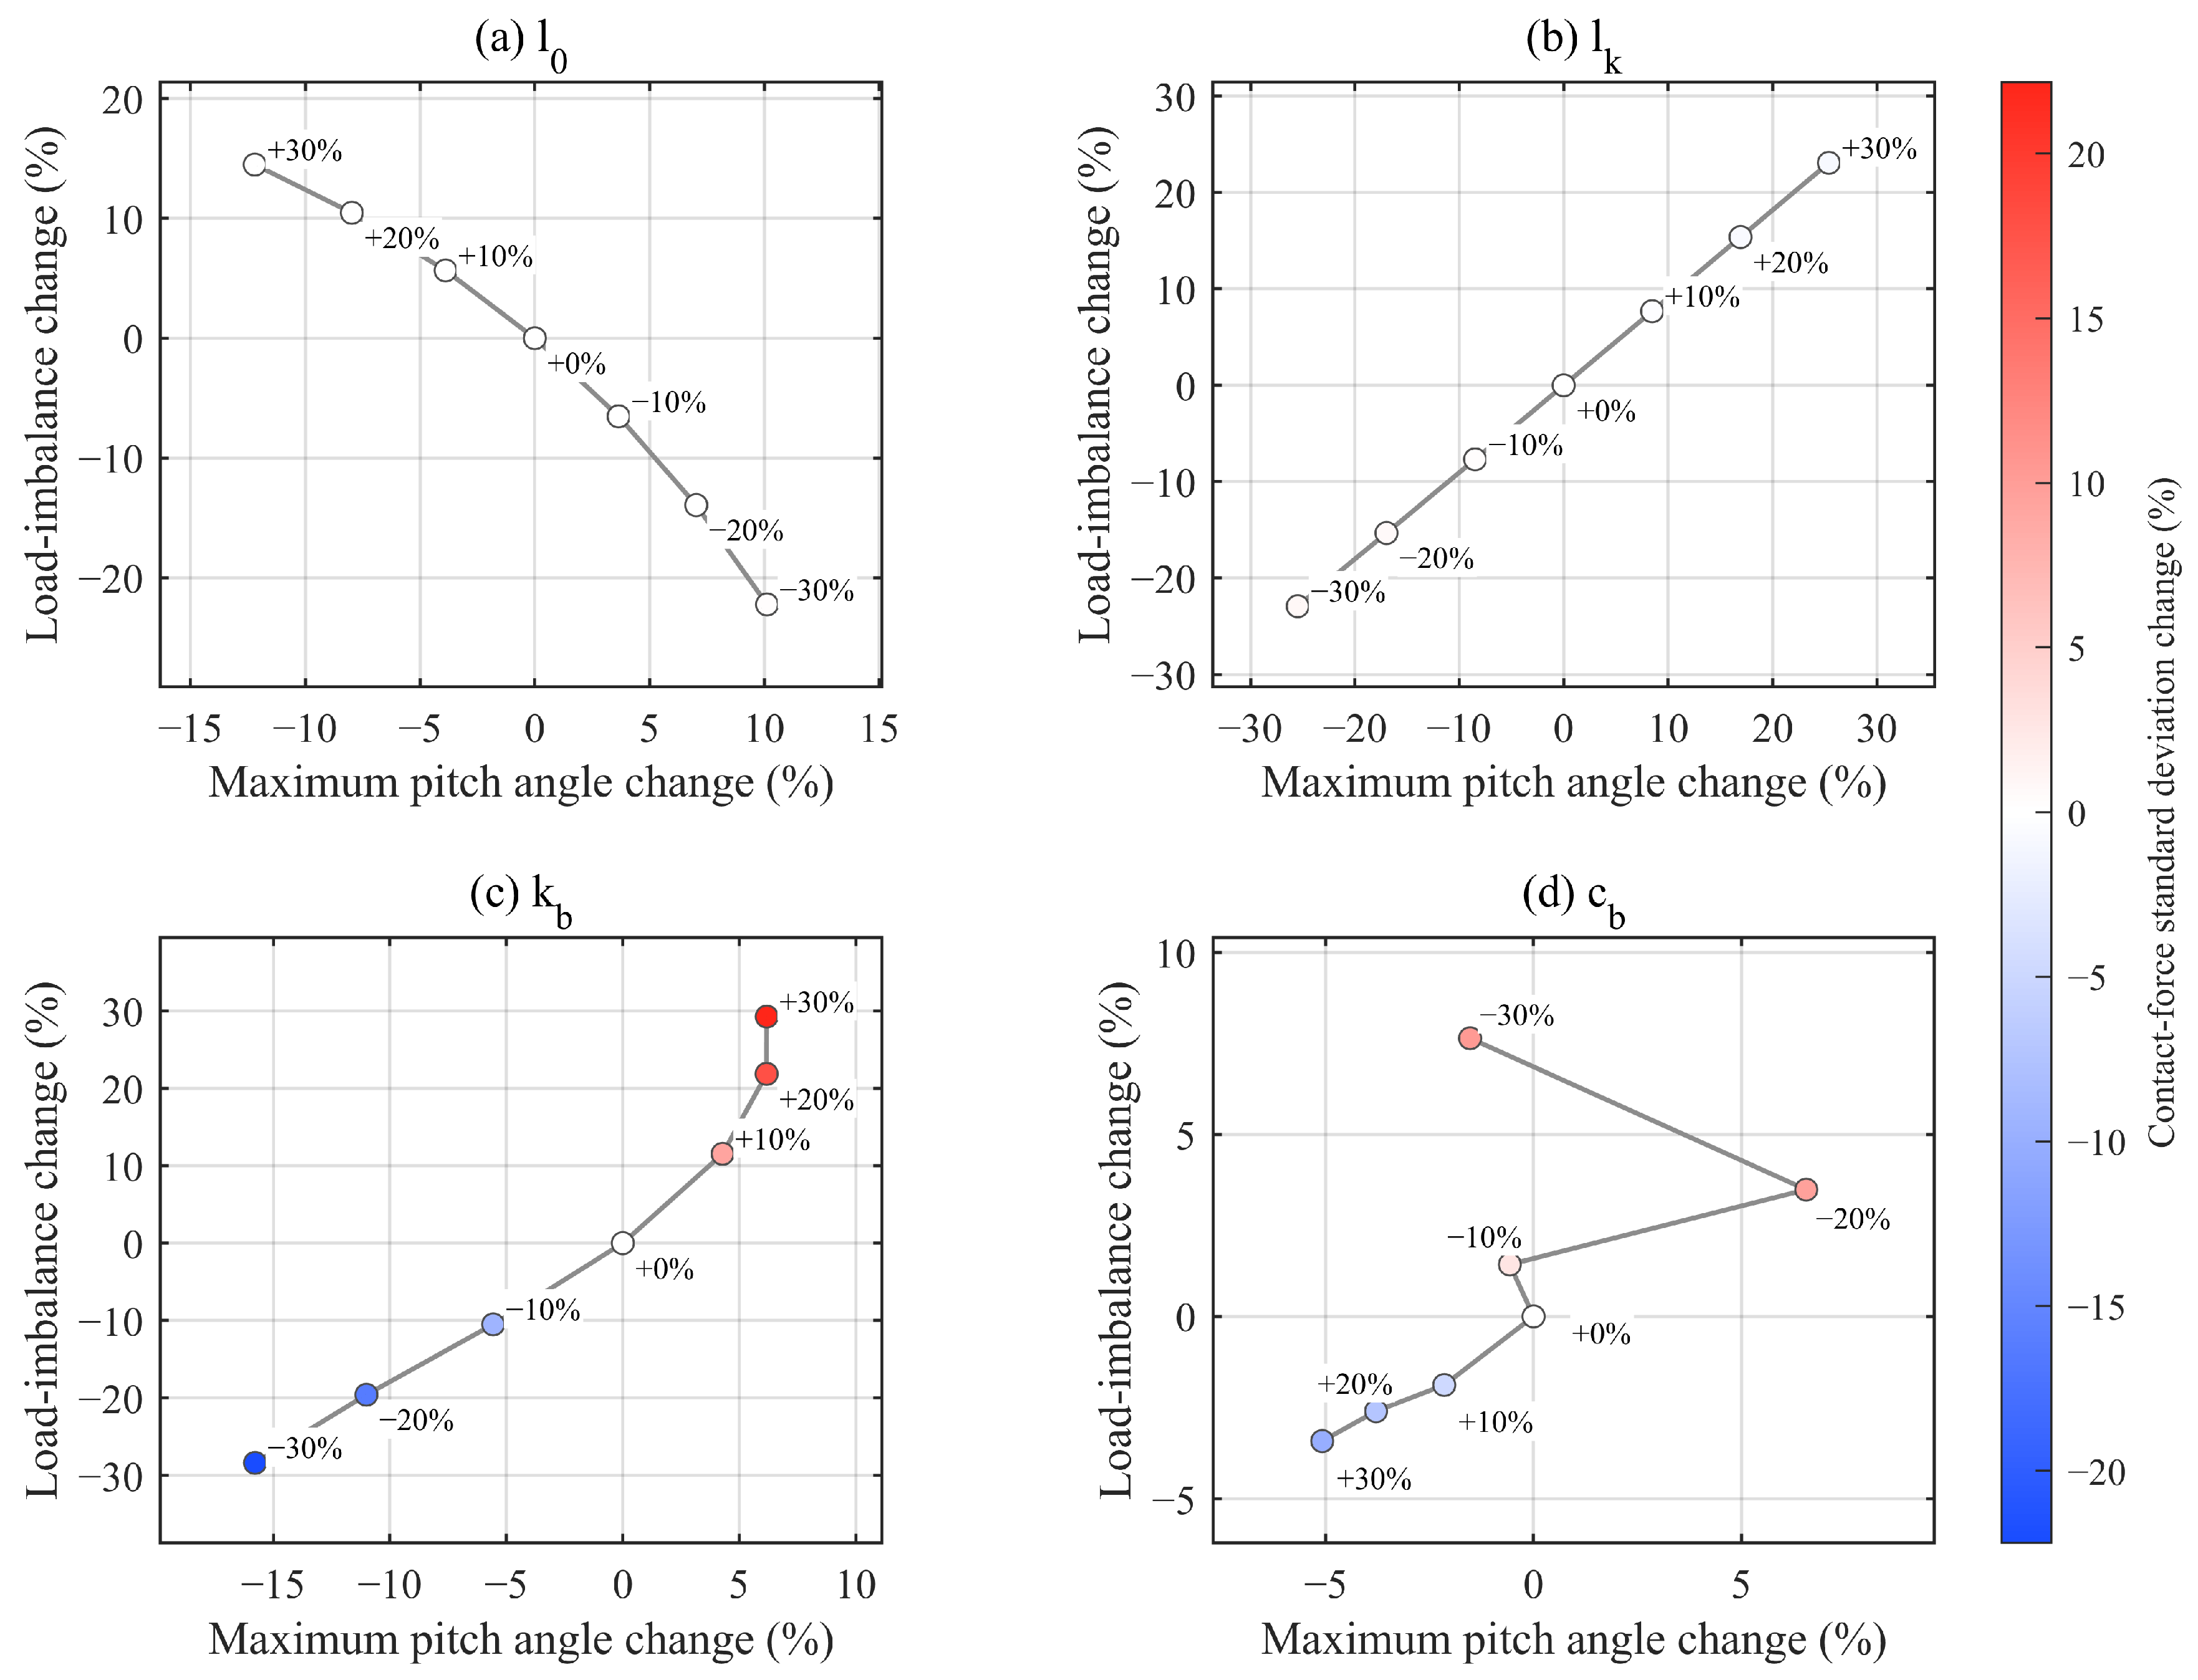
In addition to the conventional heat map and individual sensitivity curves, a coupled response plot is constructed with the percentage change in maximum panhead pitch angle on the horizontal axis, the percentage change in dual-strip load imbalance on the vertical axis, and the percentage change in the standard deviation of total contact force represented by colour. The resulting coupled response of panhead pitching, contact-force fluctuation, and dual-strip load imbalance is shown in Figure 10.
Figure 10 shows different response trajectories for the four parameters in the three-index space. Parameter l 0 mainly produces a trade-off: the dual-strip load imbalance may increase as the maximum pitch angle decreases, so this parameter is unsuitable as an independent optimisation direction. The trajectory of l k is relatively monotonic, and a moderate reduction in l k moves the response towards the low-pitch, low-imbalance region. Parameter k b has the strongest coupled effect. Increasing k b moves the response towards larger pitch, greater imbalance, and a higher contact-force standard deviation, showing that excessive spring-box stiffness deteriorates all three indices. Parameter c b produces a nonlinear response, indicating coupled effects of damping on the different indices. Overall, Figure 10 confirms that panhead parameters should not be optimised using a single index; the selected combination should simultaneously reduce panhead pitching, contact-force fluctuation, and dual-strip load imbalance. Each curve follows one parameter from its negative to positive perturbation range; movement toward the low-value corner indicates simultaneous reduction in pitch, force fluctuation, and load imbalance.
All nominal-length perturbation cases converged and produced a monotonic response trajectory. Therefore, the nominal spring-box length is retained as the geometric assembly variable in the subsequent optimisation.
The sensitivity analysis demonstrates that local panhead parameters affect the maximum panhead pitch angle, standard deviation of contact force, and dual-strip load imbalance in different ways. The geometric parameters primarily govern panhead attitude and contact-point moment arms, k b primarily governs contact-force transmission and load sharing between the strips, and c b primarily provides local energy dissipation. These results guide the multi-index optimisation within the bounded parameter ranges considered in the following section.

4.2. Engineering-Constrained Optimisation of Panhead Parameters

Section 3.3 shows that the principal deterioration under the representative adverse condition is not a substantial shift in mean contact force, but an increase in maximum panhead pitch, total-force fluctuation and dual-strip load imbalance. The locally adjustable panhead parameters are therefore optimised within engineering constraints using the sensitivity results in Section 4.1.
x = l 0 l k k b c b T Ω .
where x is the vector of panhead parameters to be optimised, and Ω is the feasible parameter domain. To keep the solution within the original structural design limits, each parameter is constrained to vary around its baseline value as
x j = x j 0 1 + r j r j 0.30 , 0.30 j = 1 , 2 , 3 , 4 .
where x j 0 is the baseline value of parameter j , and r j is its variation ratio. The optimisation objectives are based on the three sensitivity indices defined in Section 4.1. Because intensified panhead pitching is a principal cause of dual-strip load imbalance and contact loss by the lower-loaded strip under the adverse winter condition, η φ is taken as the primary control index, while η σ and η U are treated as parallel indices. The composite objective function is as follows:
J x = w 1 η φ x η φ x 0 + w 2 η σ x η σ x 0 + w 3 η U x η U x 0 + P x
where x 0 is the baseline parameter vector before optimisation, and w 1 , w 2 , and w 3 are weighting coefficients. According to the dominant chain identified in the Section 3.3—pitch-angle increase, stronger contact-force fluctuation, and contact loss by the lower-loaded strip—the weights are w 1 = 0.40 , w 2 = 0.35 , and w 3 = 0.25 . Panhead pitching is therefore given priority while contact-force fluctuation and dual-strip load sharing are also considered.
Reducing only the three principal indices may yield other unreasonable results, such as a large shift in mean contact force or a higher maximum impact force despite a lower standard deviation. To prevent such ‘false optimisation’, a soft-constraint penalty is added to the composite objective function to restrict deviations in mean contact force, increases in maximum contact force, and decreases in minimum contact force:
P x = ρ m F x F x 0 F x 0 2 + ρ m a x m a x 0 , F m a x x F m a x x 0 F m a x x 0 2 + ρ m i n m a x 0 , F m i n x 0 F m i n x F m i n x 0 2
where F , F m a x , and F m i n are the mean, maximum, and minimum total contact forces, respectively, and ρ m , ρ m a x , and ρ m i n are the penalty coefficients. Equation (31) requires that an optimised parameter set must not achieve improvements by substantially changing the mean uplift load, increasing the impact peak, or reducing the minimum contact force. A parameter combination is not considered practically beneficial if it improves the three principal indices at the expense of these quantities.
Because the coupled model contains strict unilateral contact, a random friction profile, and moving contact, the objective function is not conveniently differentiable. The number of optimisation variables is small, and Section 4.1 identifies the sensitive direction of each variable. A derivative-free constrained coordinate-search method is therefore used. In each iteration, candidate parameter sets are generated by perturbing l 0 , l k , k b , and c b in the positive and negative coordinate directions. A candidate is accepted if it reduces the composite objective; otherwise, the current parameter set is retained and the search step is reduced. The update rule is as follows:
x m + 1 = a r g m i n x C m J x , J x m + 1 < J x m ε J .
where the two parameter vectors represent the combinations before and after one search step. The candidate set is generated by positive and negative trials along each parameter coordinate, and the effective-decrease threshold determines whether a candidate is accepted. The search step is progressively reduced: larger steps determine the principal optimisation direction, whereas smaller steps refine the local trade-off. Table 4 lists the changes in the sensitive panhead parameters, and Table 5 compares the performance indices before and after optimisation. Within the prescribed bounds, this coordinate-wise procedure identifies an improved feasible parameter configuration for the present design task.
The coordinate-search implementation used uniform relative bounds of −30% to +30% for l0, lk, kb, and cb. The relative step sequence was [15%, 10%, 5%, 2.5%], with at most two search passes at each step. A candidate was accepted only when its composite objective decreased by more than 1 × 10⁻⁴. If no candidate met this effective-decrease threshold in a pass, the search proceeded to the next smaller step; the procedure ended after the final 2.5% step or after no further admissible decrease was found.
For each candidate, the coupled equations were integrated over 0–5 s with ode15s using RelTol = 1 × 10⁻⁷, AbsTol = 1 × 10⁻⁹, MaxStep = 2 × 10⁻⁴ s, and InitialStep = 1 × 10⁻⁵ s. The unfiltered contact-force statistics were evaluated from 3.2 s to the end of the simulation after resampling at 1000 Hz. The spatial random friction profile and the random support-height component both used seed 2026 for the reference optimisation, with friction correlation length 1.5 m and spatial increment 0.25 m.
The soft constraints used penalty coefficients of 5, 3, and 2 for mean-force deviation, maximum-force increase, and minimum-force decrease, respectively. The mean-force penalty was activated beyond 10% deviation from the baseline mean, and the maximum-force penalty was activated beyond a 10% increase over the baseline maximum. These settings keep the search from reducing the three primary response indices through an unacceptable change of overall contact-force level or contact-force extrema.
Table 4 shows that l 0 remains at its baseline value. This does not imply that the parameter is insensitive; rather, within the multi-index objective and constraints, neither a positive nor a negative change produced an effective decrease in the overall objective. Parameters l k and k b both decrease, indicating that moderately reducing local geometric preload and support stiffness helps suppress panhead pitching, reduce contact-force peaks, and improve dual-strip load distribution. Parameter c b increases slightly, reflecting the role of local energy dissipation in attenuating high-frequency contact-force fluctuations.
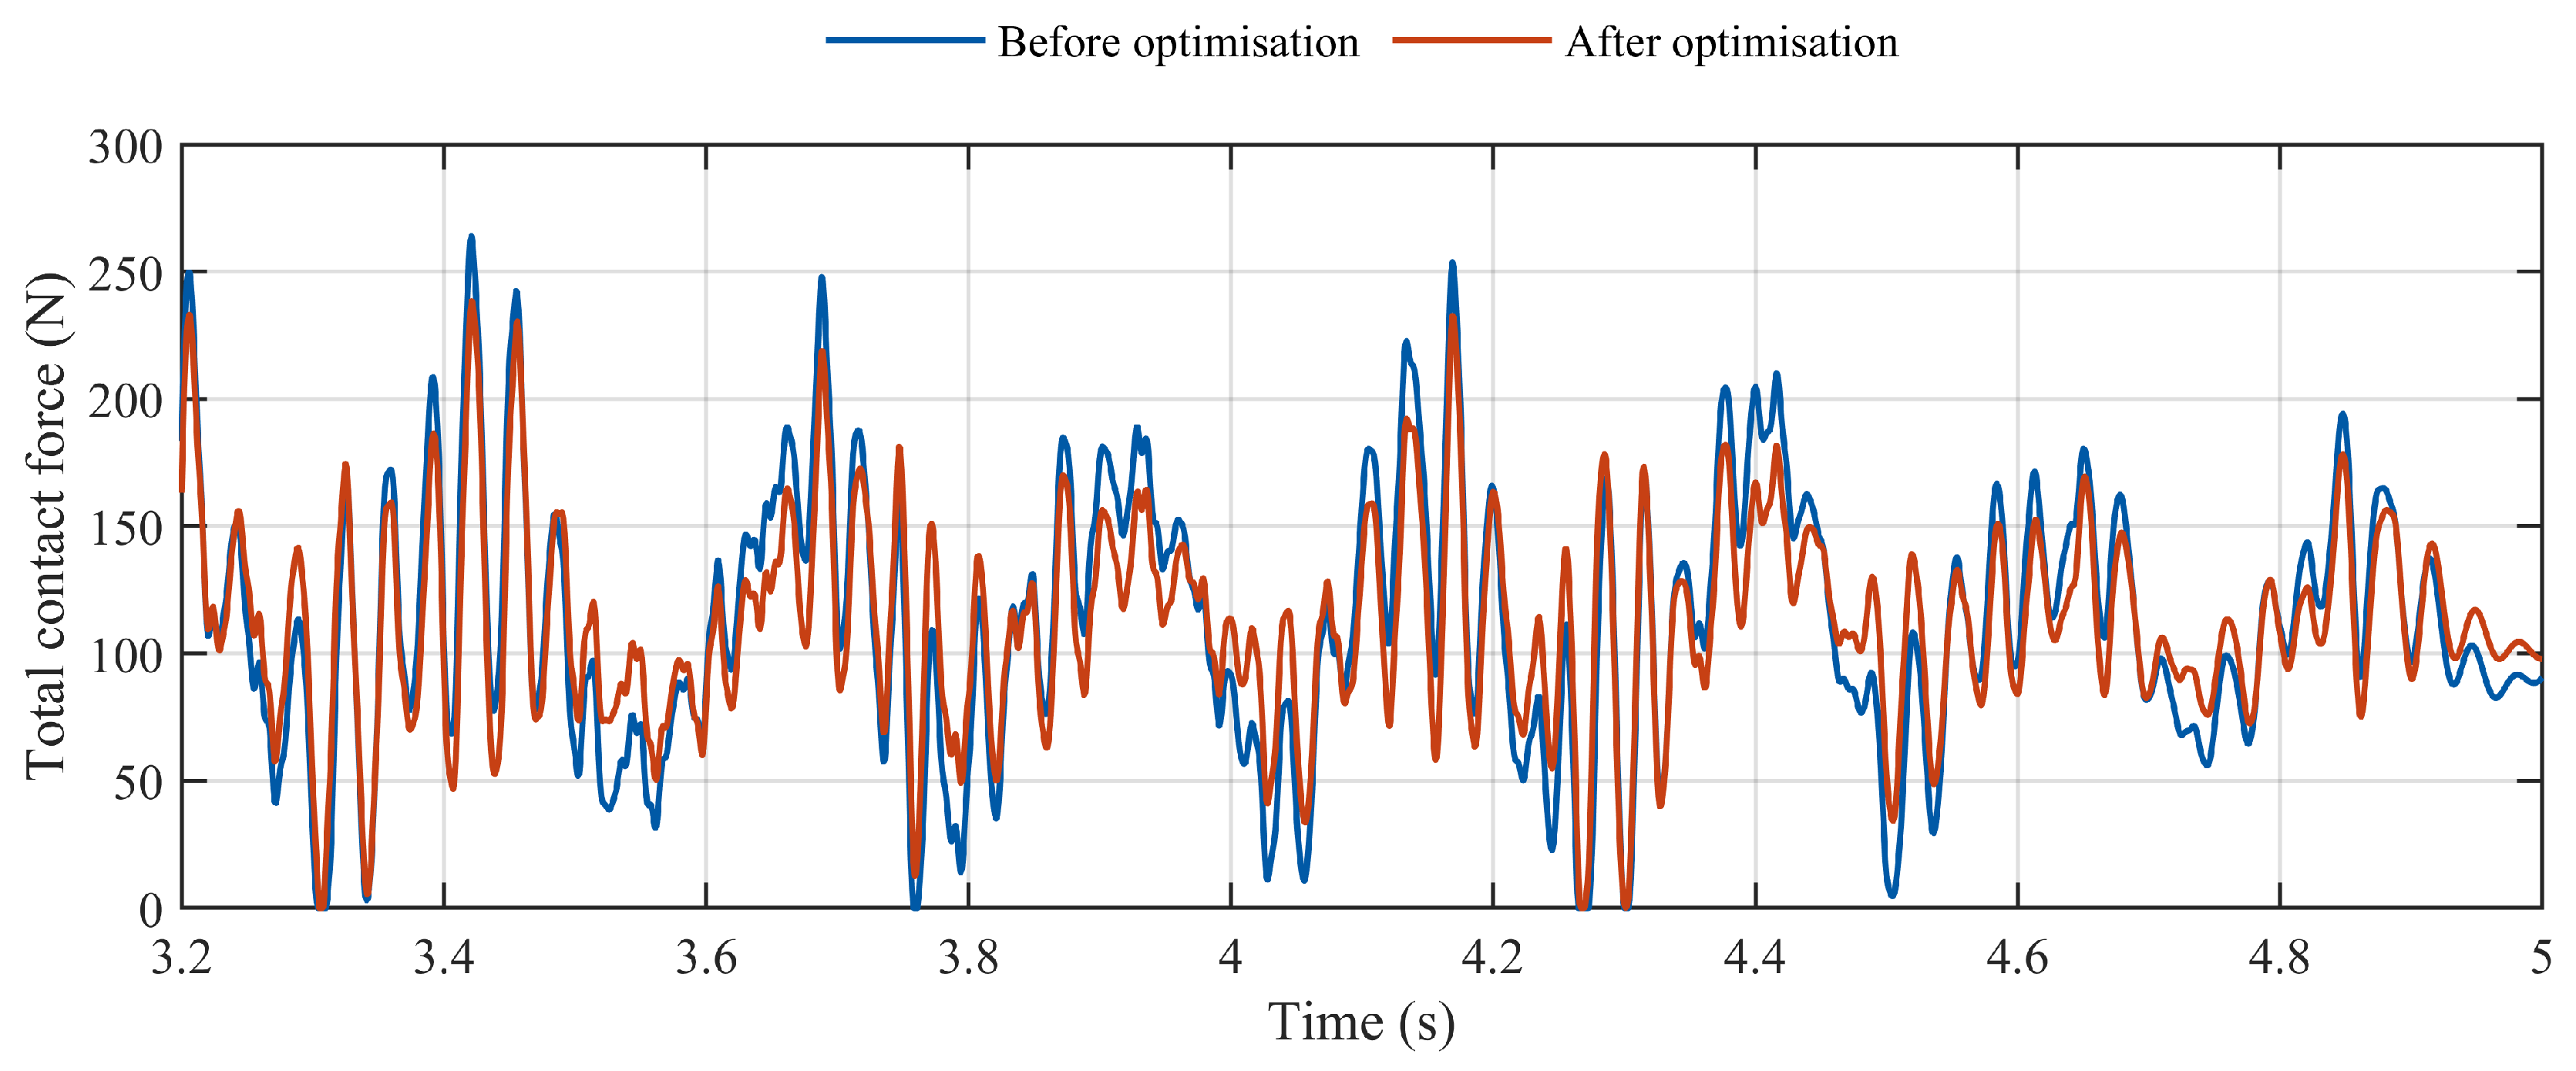
Table 5 shows reductions of 38.24%, 23.09%, and 44.43% in maximum pitch angle, total-force standard deviation, and load imbalance. Thus, attitude stability, current-collection stability, and strip load sharing improve simultaneously. Figure 11 compares the total-force histories.
Figure 11 shows an essentially unchanged mean force but lower impact peaks and high-frequency fluctuation. The improvement therefore results from modified local load transfer rather than altered uplift load.
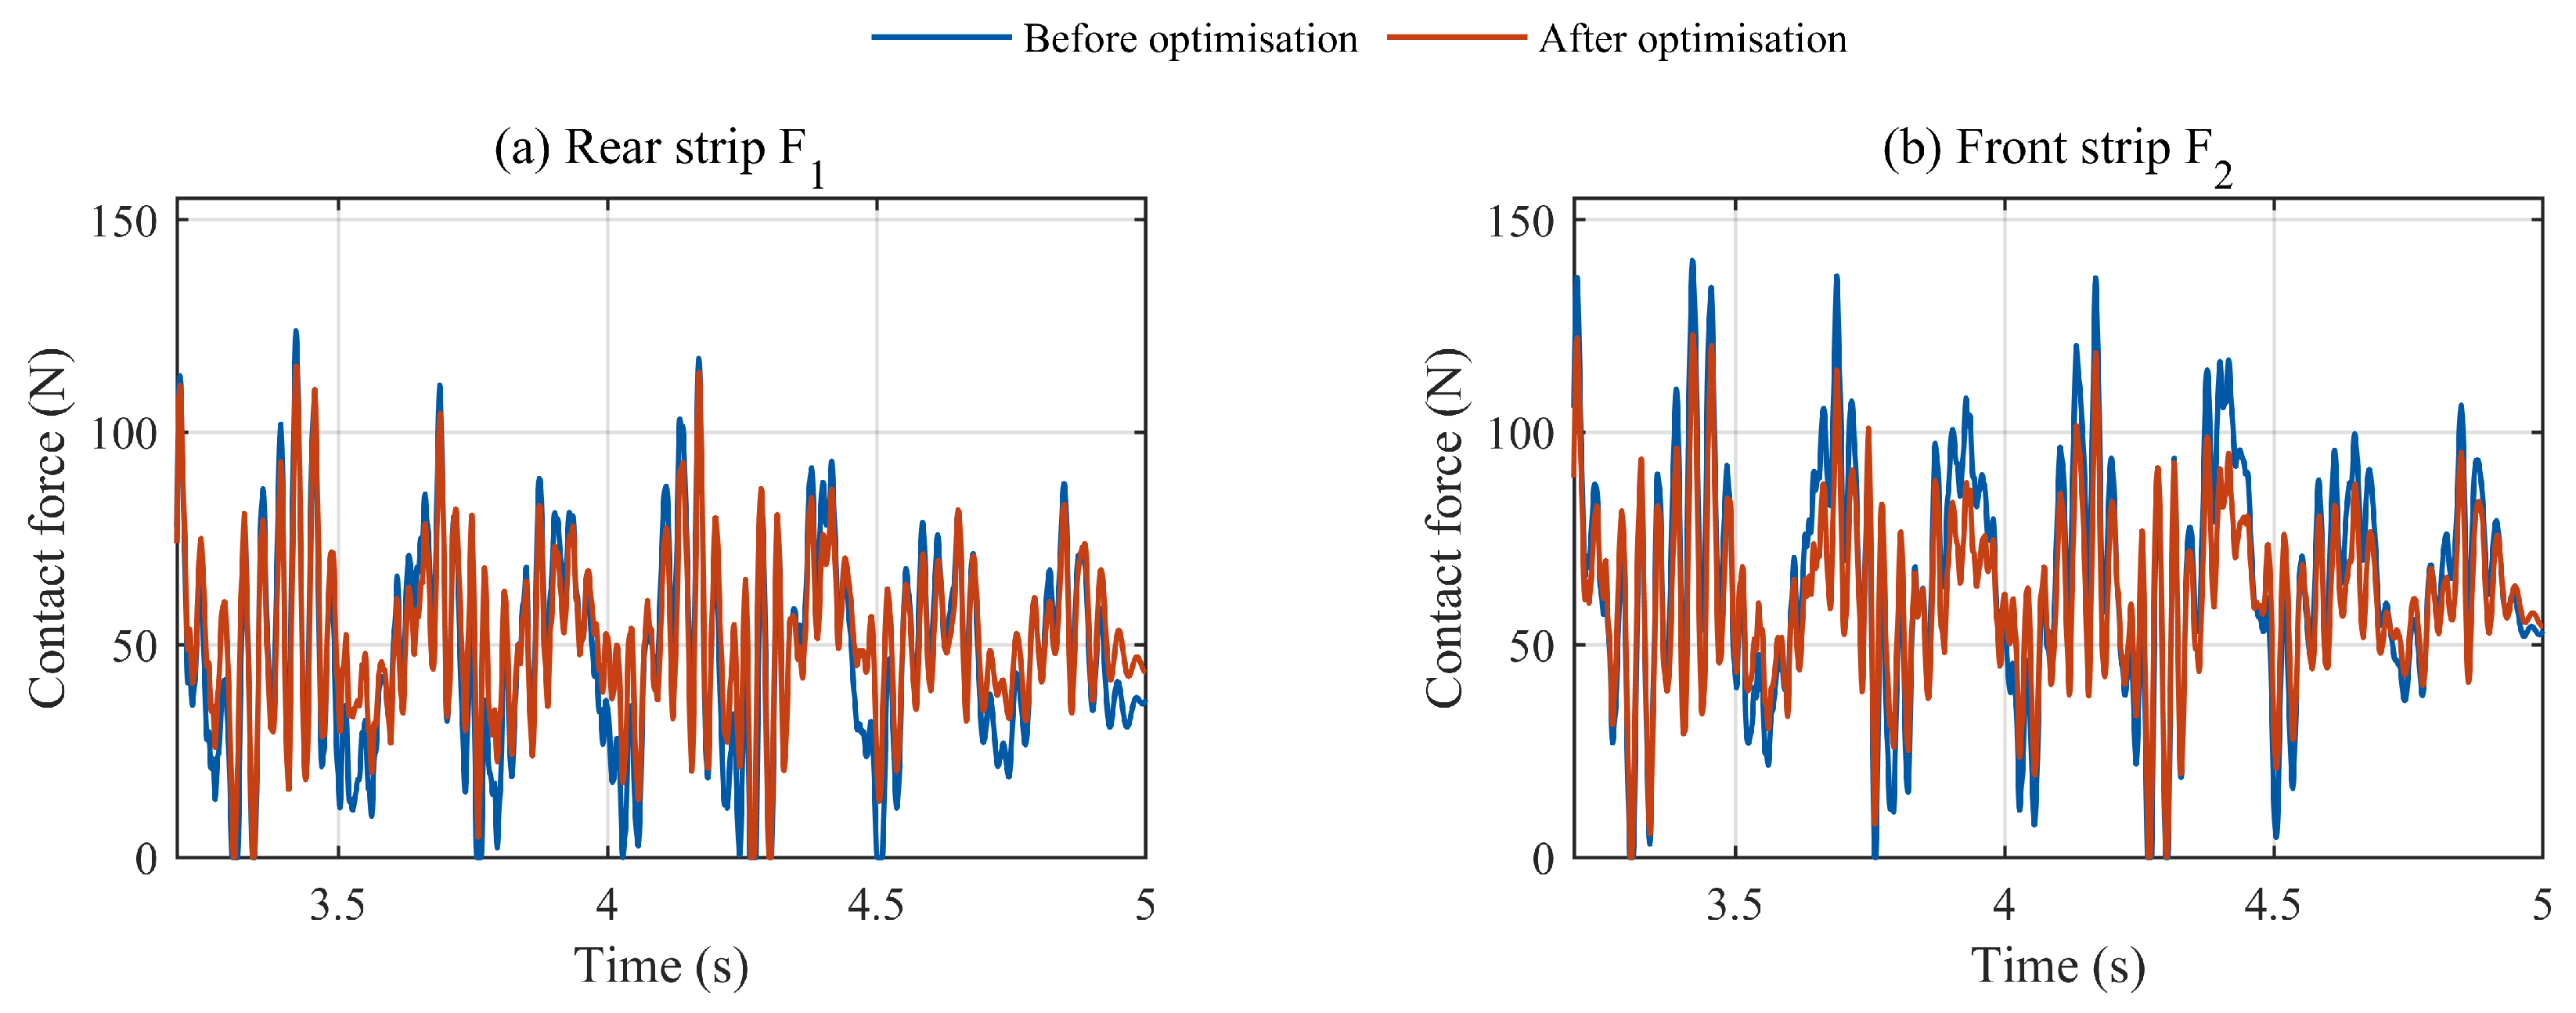
The individual contact-force histories of the two strips are further compared in Figure 12.
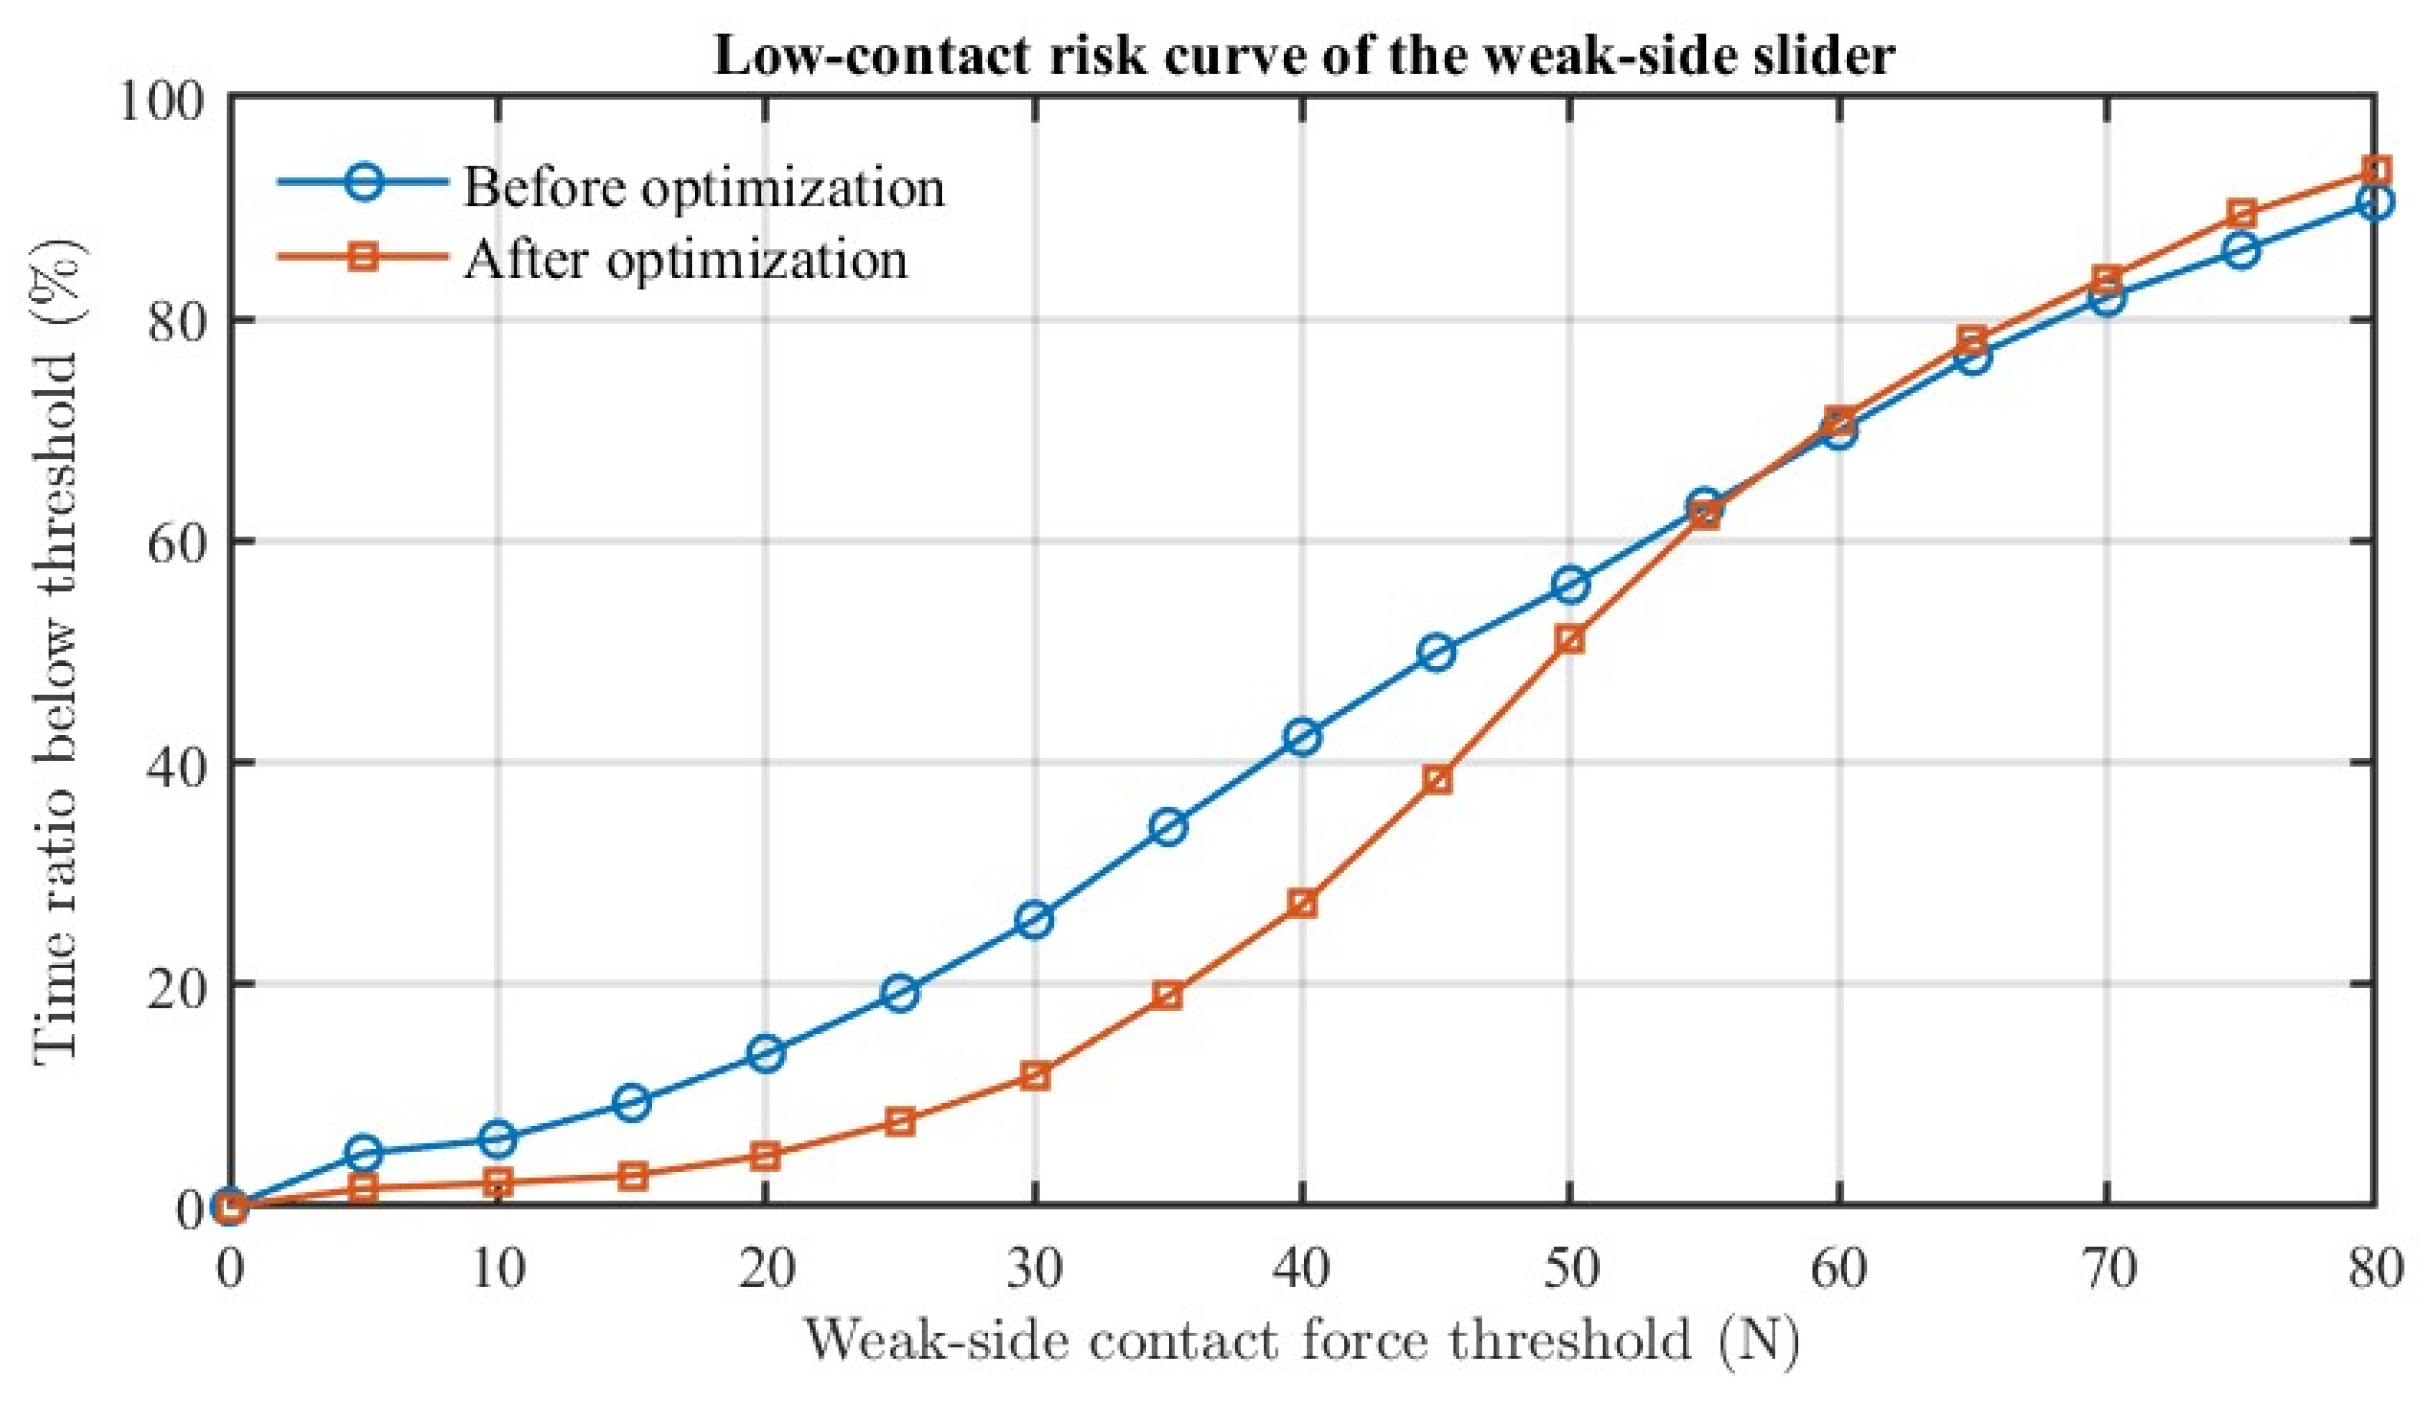
Because the independent dual-strip model outputs the instantaneous contact force of each strip, it can directly determine whether the lower-loaded strip still experiences short-duration poor contact and whether the higher-loaded strip remains subject to excessive impacts after optimisation. Figure 12 shows a smaller force difference between the strips, higher force minima for the lower-loaded strip, and lower impact peaks for the higher-loaded strip, confirming improved local load distribution. The fraction of time for which the contact force of the lower-loaded strip is below different thresholds is also calculated; the resulting poor-contact risk curves are shown in Figure 13.
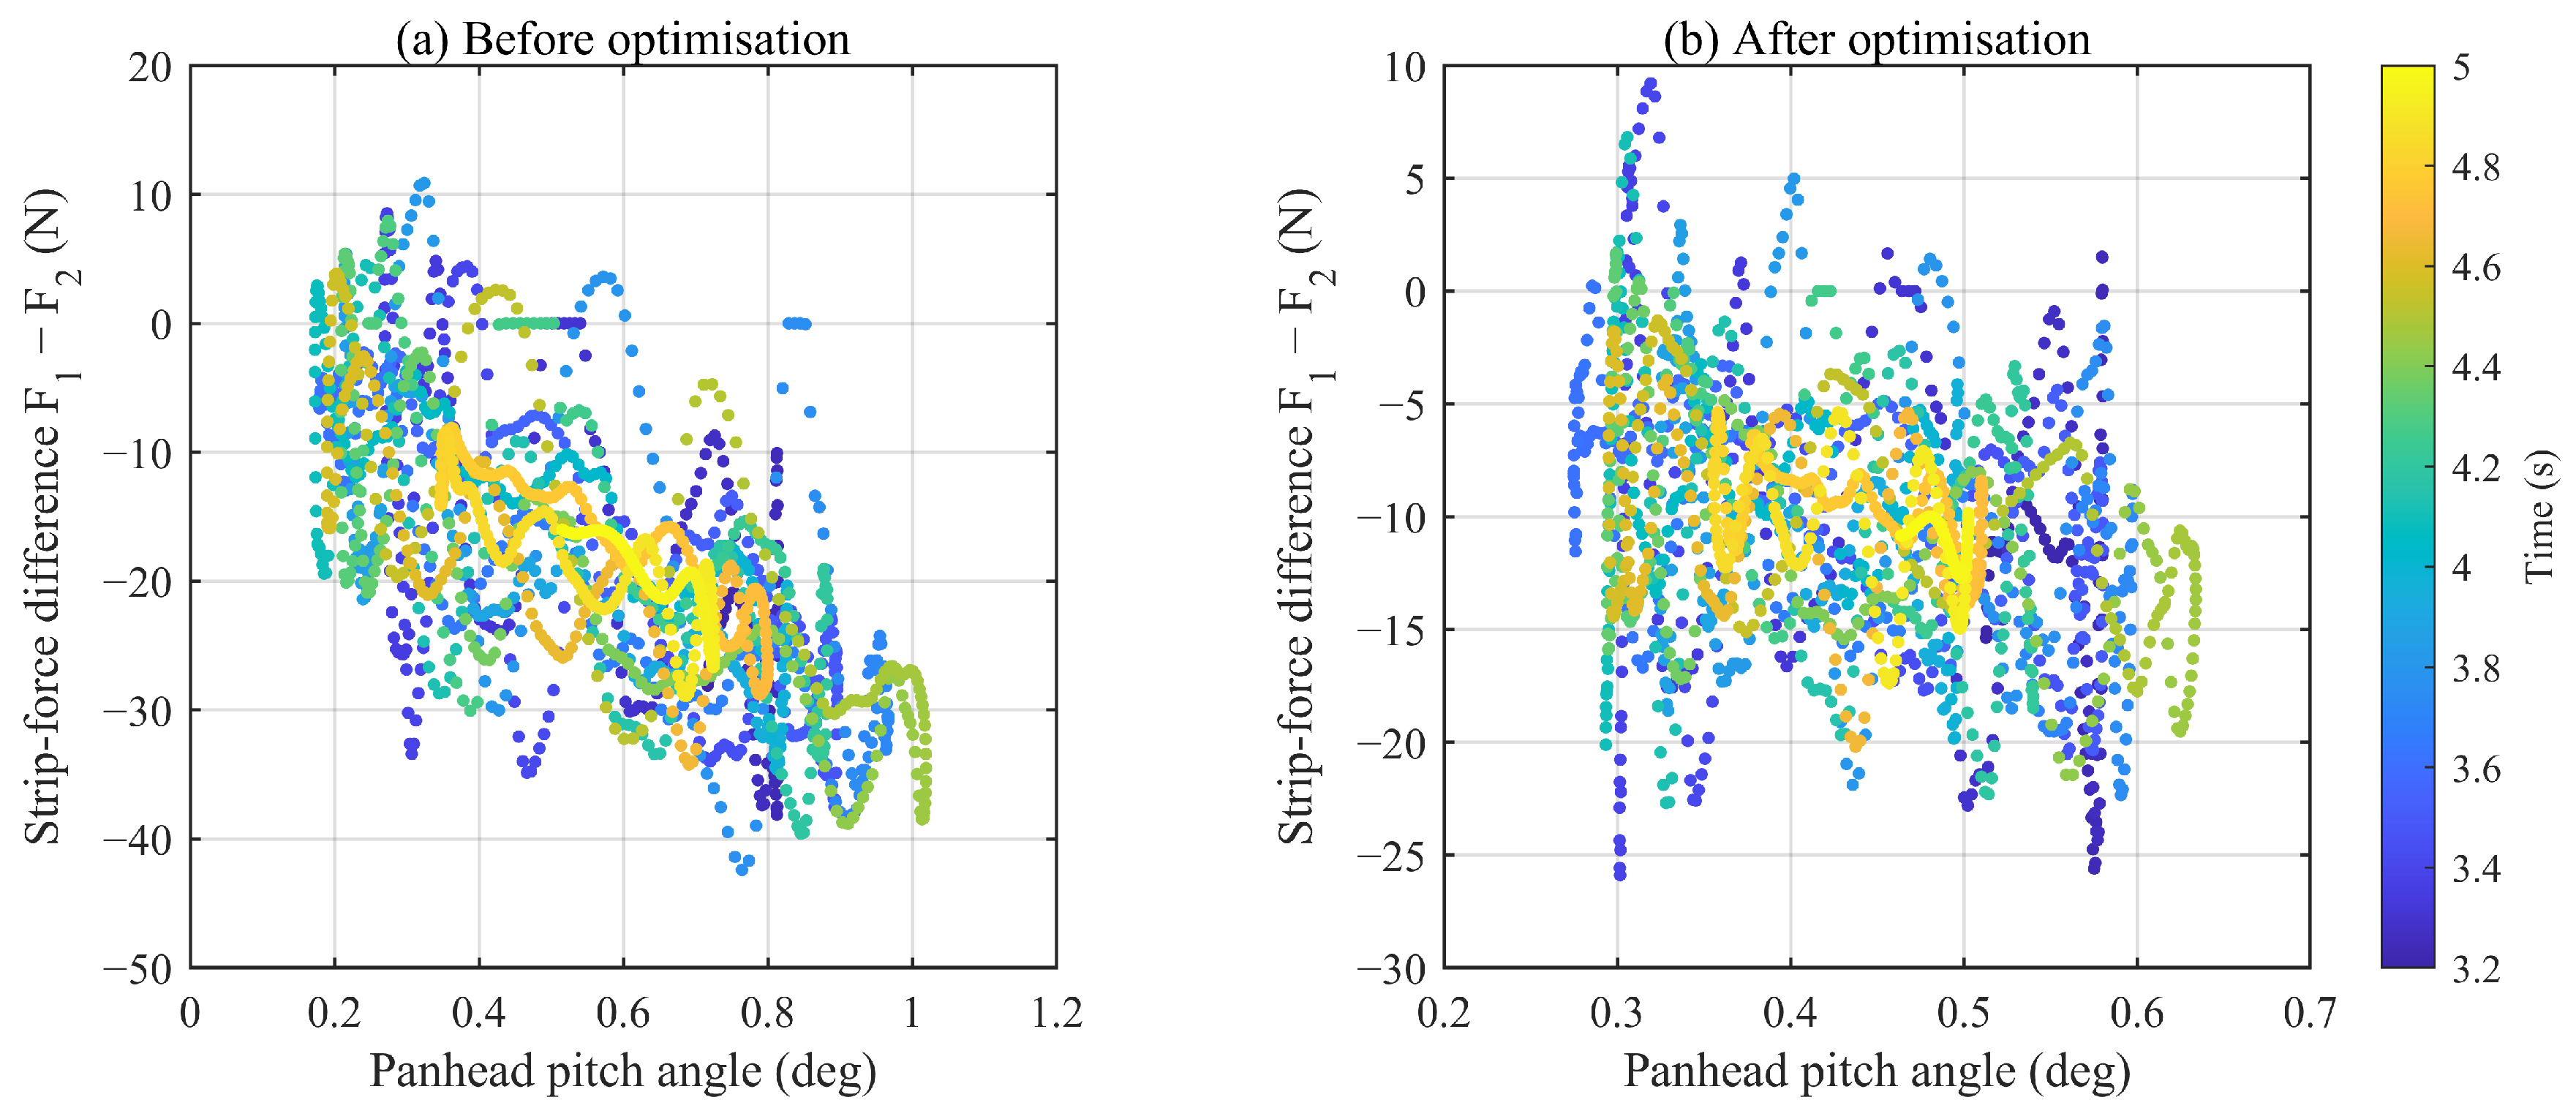
Figure 13 shows that the poor-contact risk curve shifts downward after optimisation. Across multiple contact-force thresholds, the fraction of time for which the lower-loaded strip remains at a low contact-force level is reduced. The ordinate gives the percentage of the statistical window for which the instantaneous lower-strip force is below the specified threshold; a lower curve indicates reduced low-force exposure. The optimisation therefore mitigates excessively low contact force and the tendency towards momentary contact loss by one strip under the adverse winter condition. To further illustrate the coupling between panhead pitch angle and the dual-strip contact-force difference, Figure 14 plots a phase diagram with pitch angle on the horizontal axis and strip-force difference on the vertical axis.
Figure 14 shows a markedly smaller phase-diagram envelope after optimisation, indicating suppression of the coupled oscillation between panhead pitch and the dual-strip contact-force difference. The result confirms that local contact-deterioration risk is governed not only by total contact force but also by panhead attitude and load redistribution. Restricting the pitch range simultaneously reduces the strip-force difference and the poor-contact risk of the lower-loaded strip. The force difference follows the defined rear-strip minus front-strip convention.
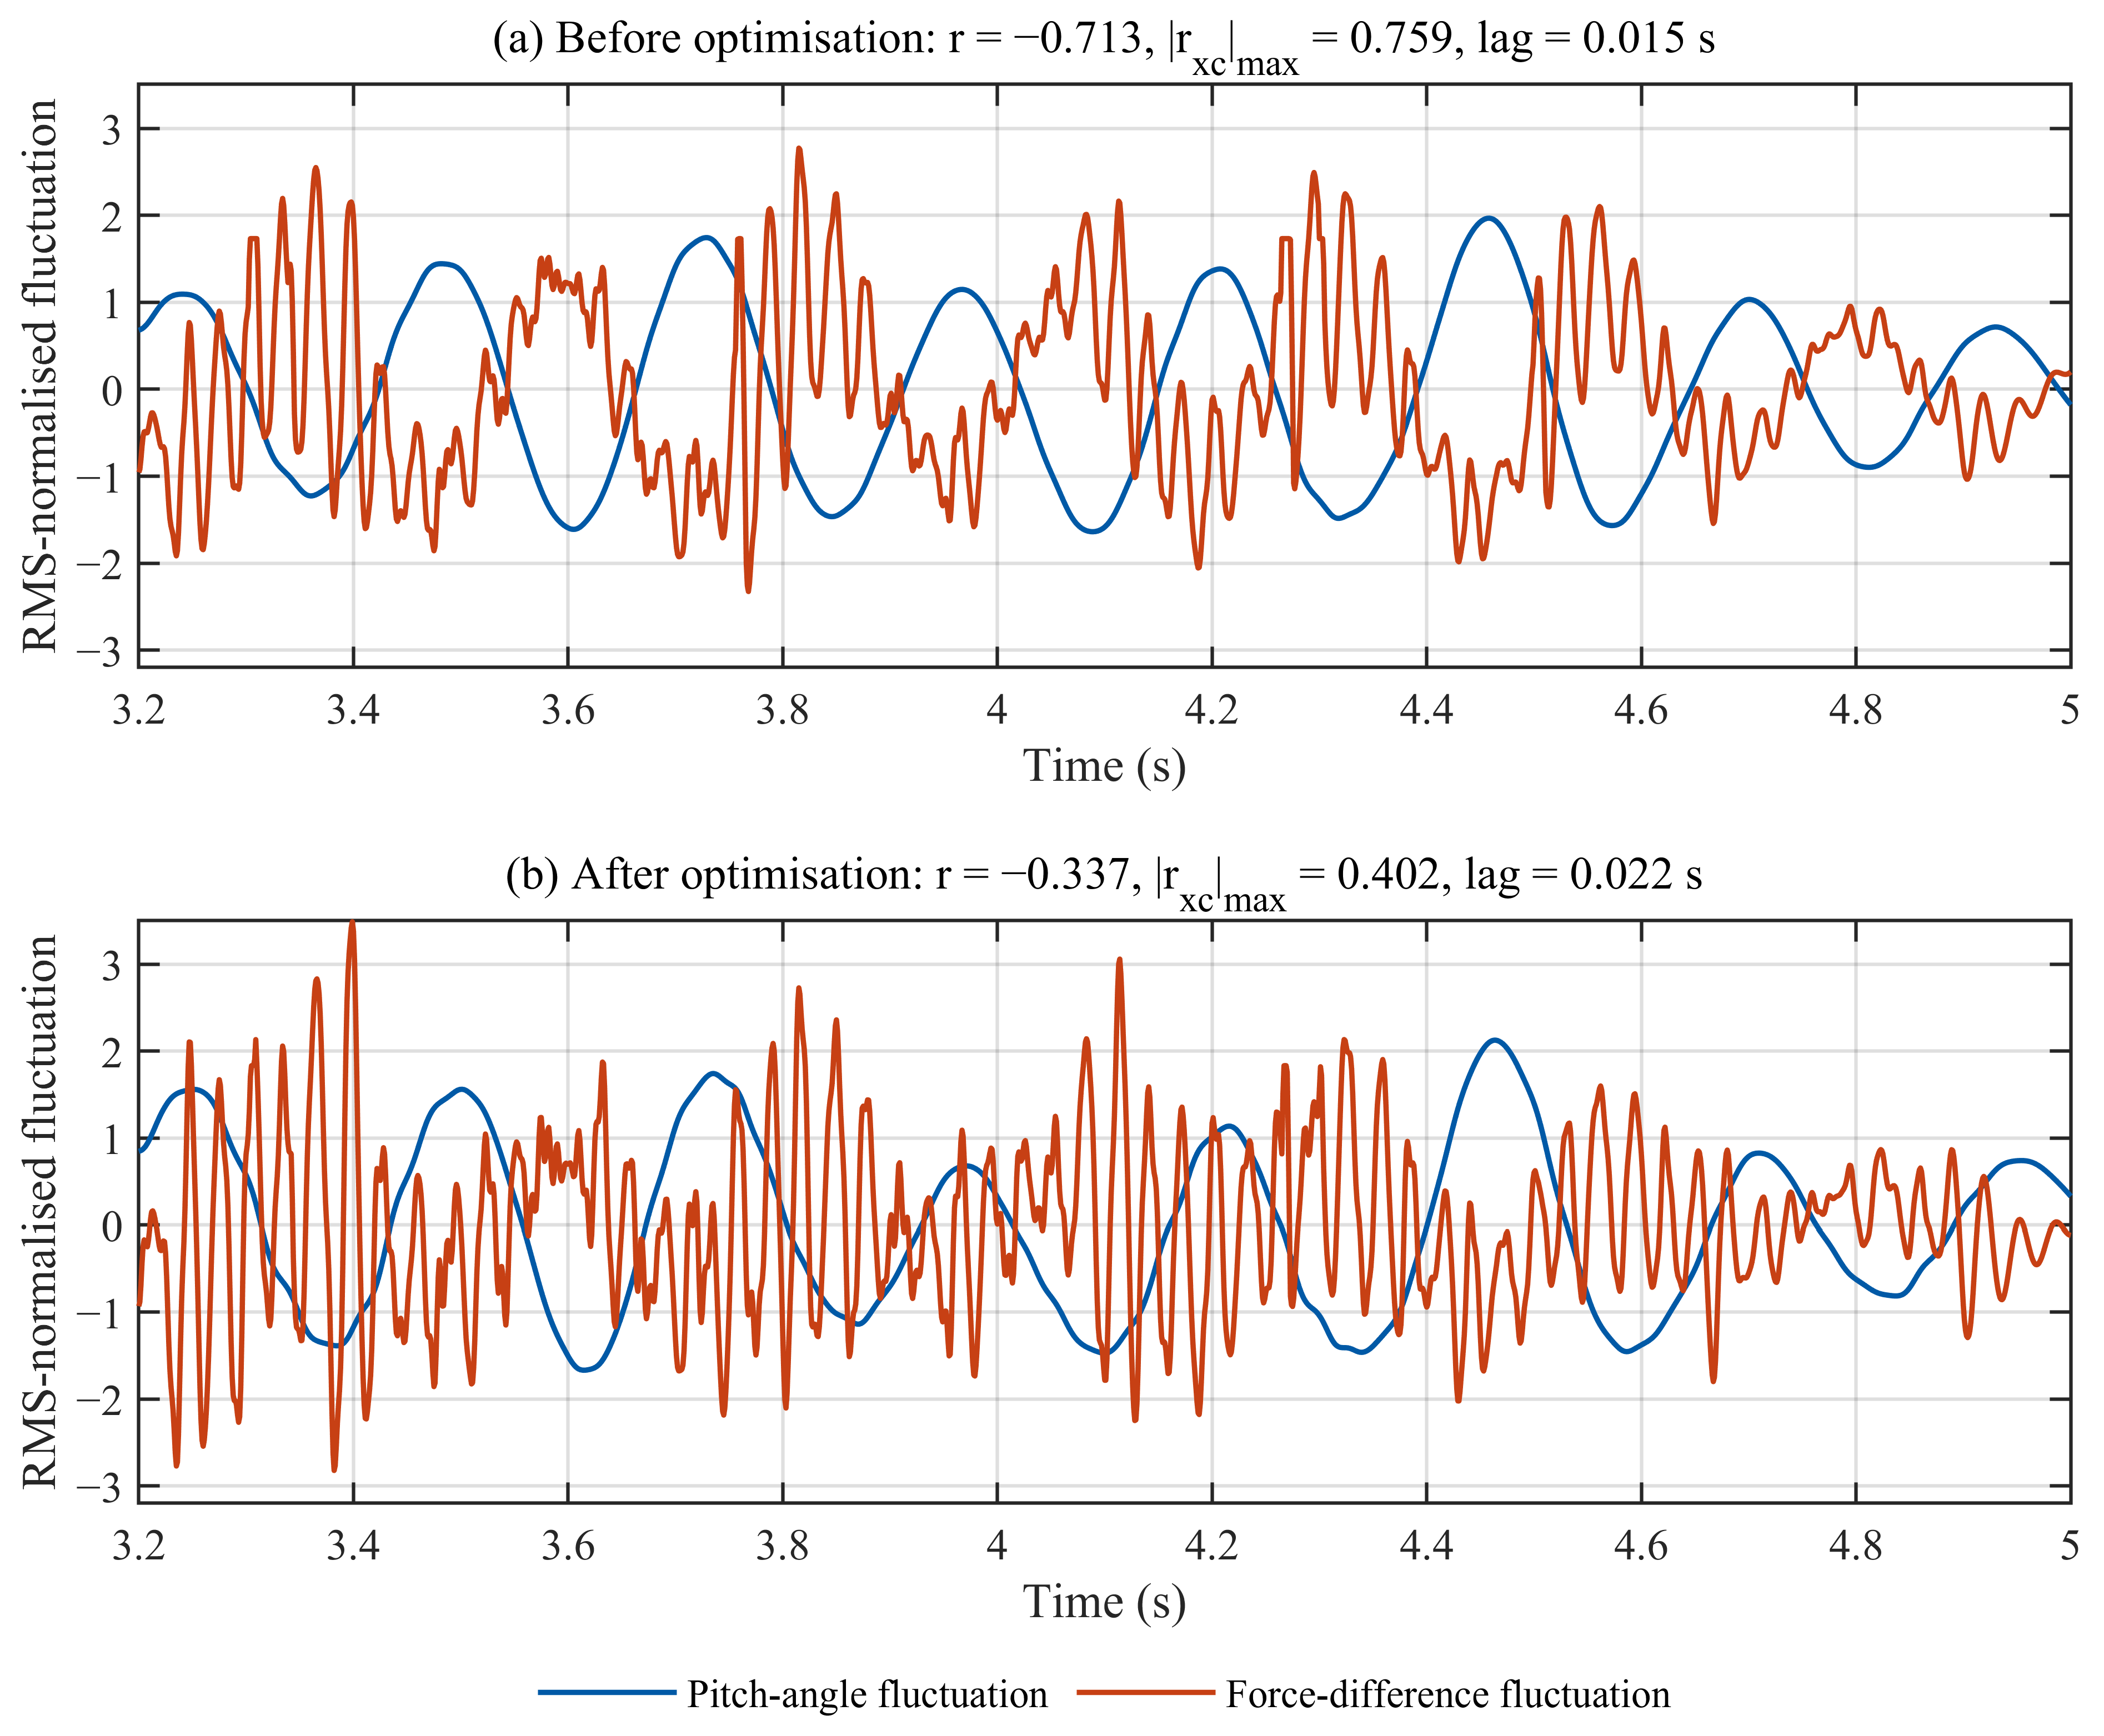
To quantify the timing relation represented by the phase diagram, Figure 15 compares the centred and RMS-normalised pitch-angle and strip-force-difference histories. The ordinate is therefore dimensionless and does not represent pitch angle in degrees; the physical maximum pitch angles are reported in Table 5. With the defined force-difference sign convention F1-F2, the baseline Pearson correlation is −0.713 and the maximum absolute normalised cross-correlation is 0.759 at a lag of 0.015 s. Thus, the dominant coupled fluctuations are opposite in sign under this convention and exhibit a short, non-zero time offset rather than exact instantaneous coincidence. After optimisation, the Pearson correlation decreases in magnitude to −0.337 and the maximum absolute cross-correlation to 0.402 (lag 0.022 s), consistent with the reduced pitch-force coupling shown in Figure 14.
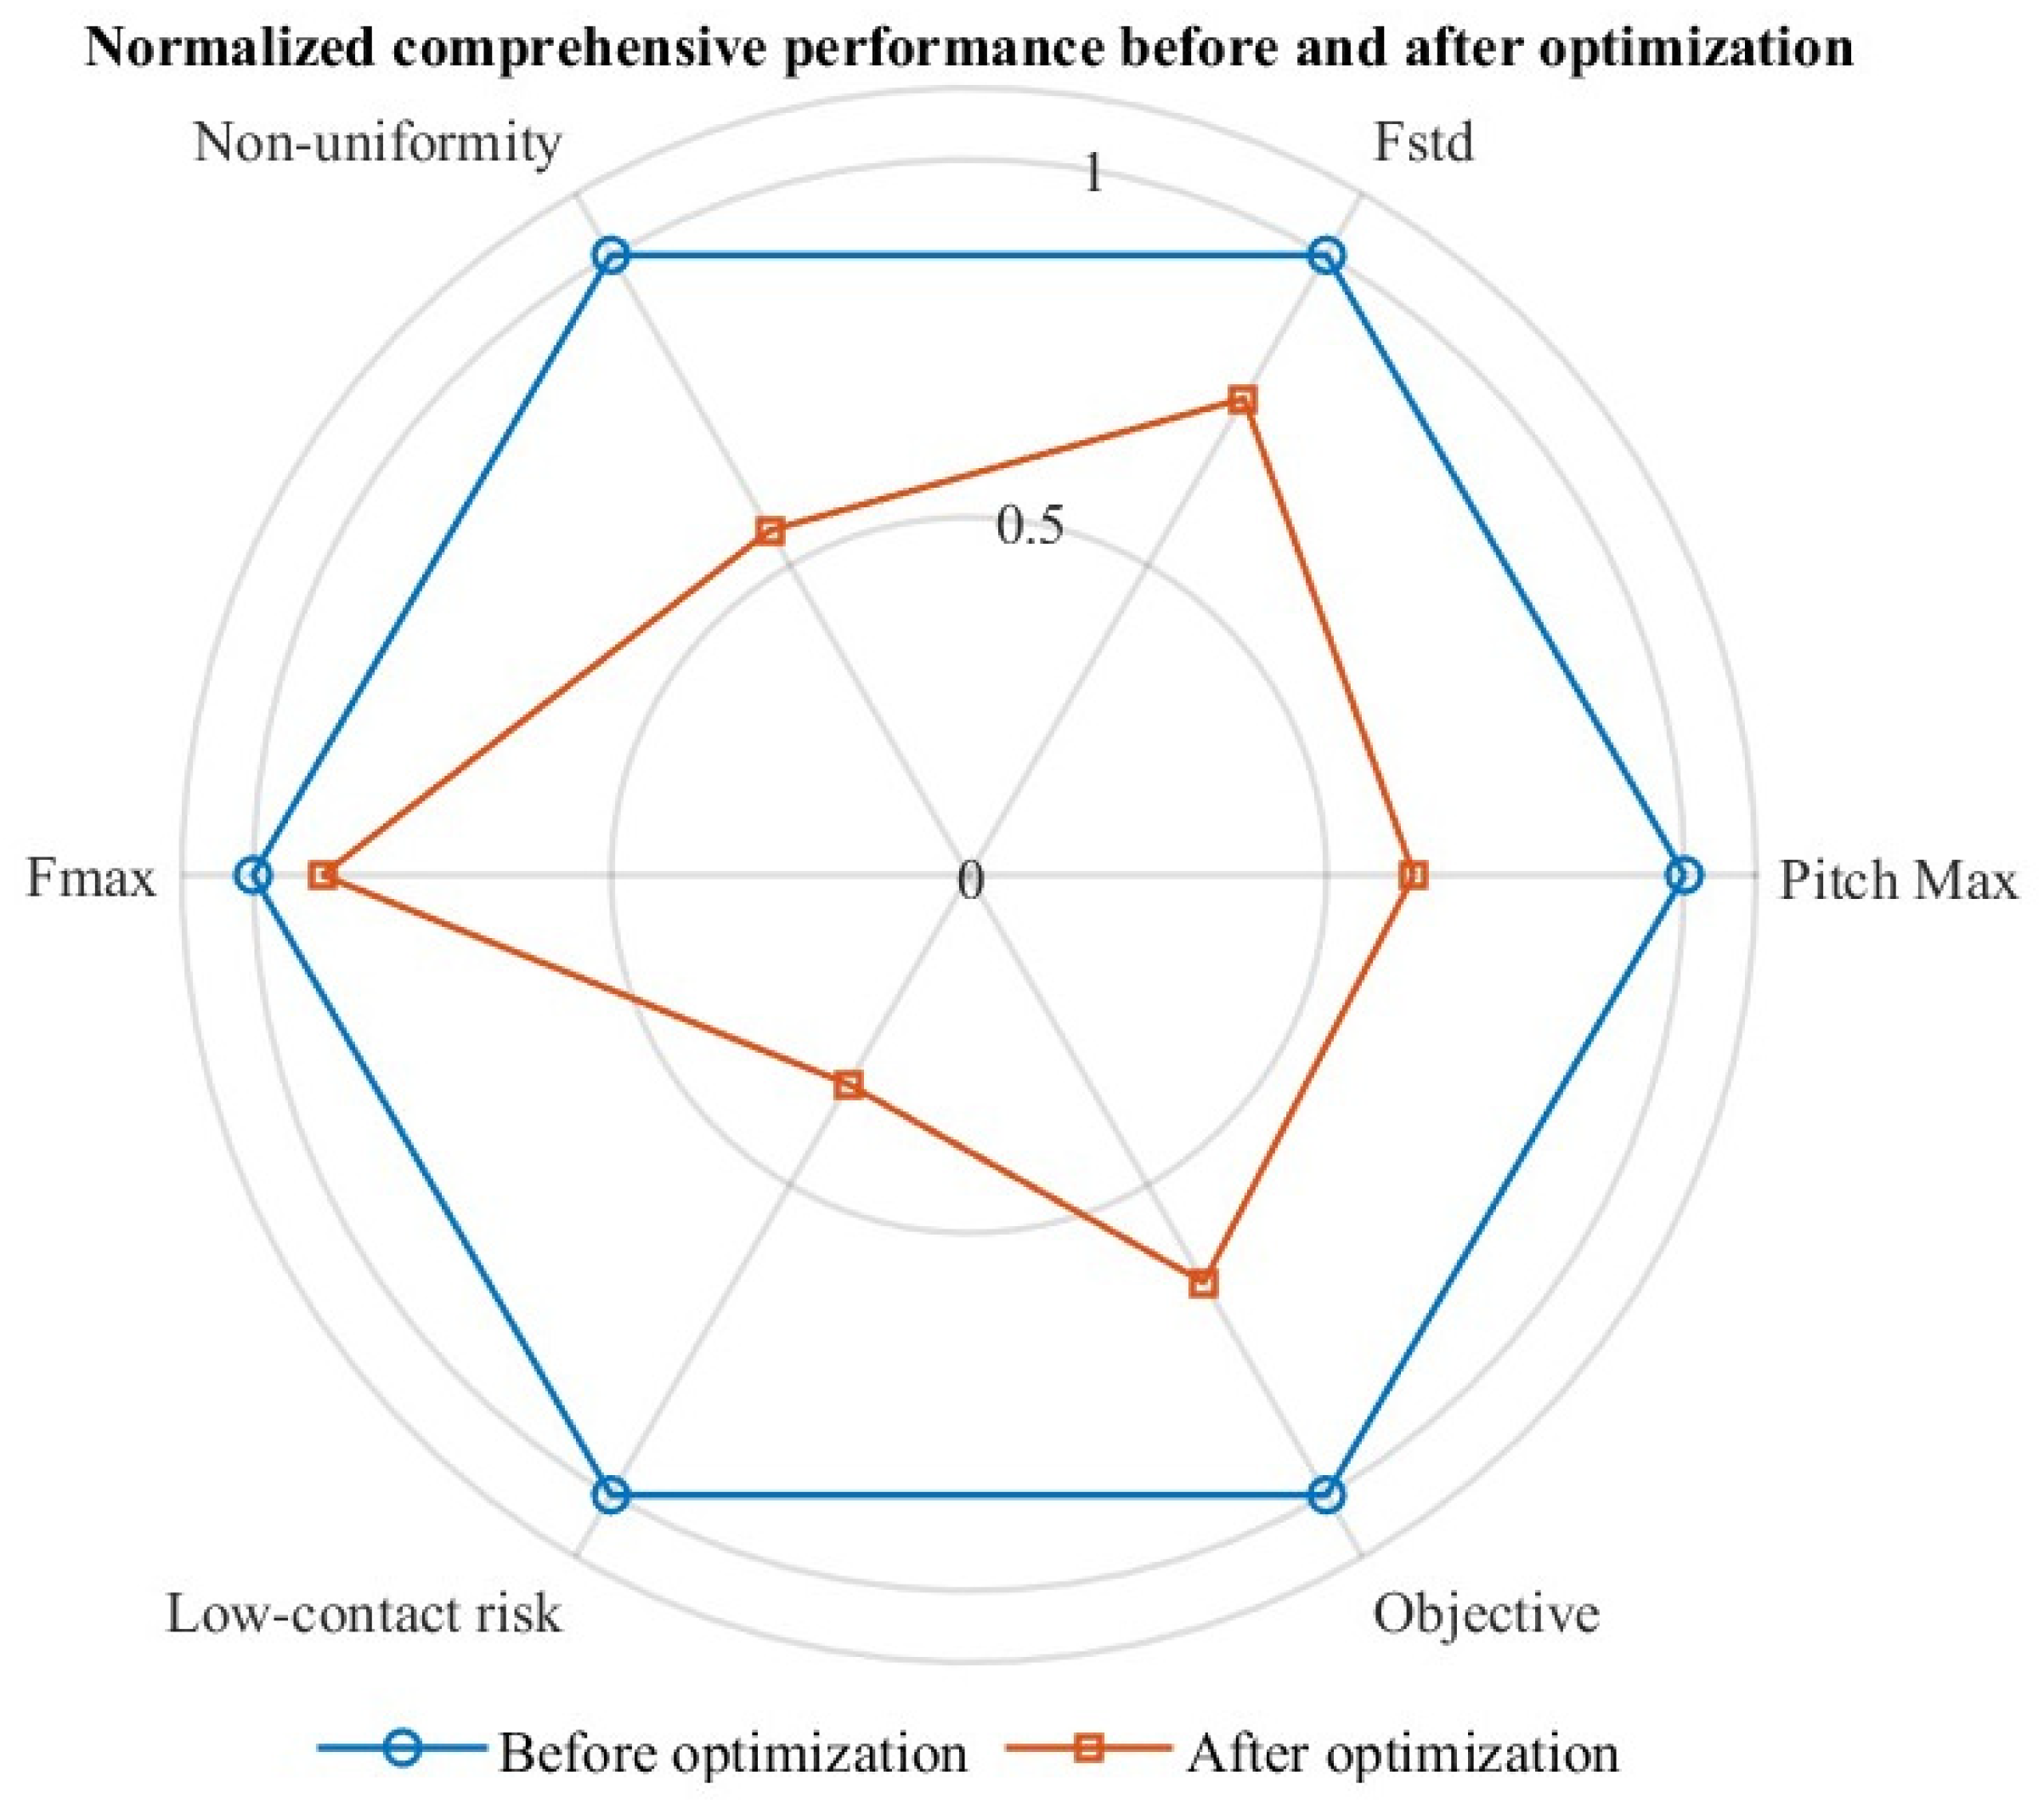
For an overall assessment, the maximum panhead pitch angle, standard deviation of total contact force, dual-strip load imbalance, maximum contact force, poor-contact risk of the lower-loaded strip, and composite objective function are normalised to form the radar chart in Figure 16.
The reduced envelope area in Figure 16 indicates simultaneous improvements in panhead-attitude stability, total-force fluctuation, strip load sharing and poor-contact risk. The optimisation changes local load-transfer characteristics rather than simply increasing the uplift force.

4.3. Robustness and Transferability of the Optimised Design

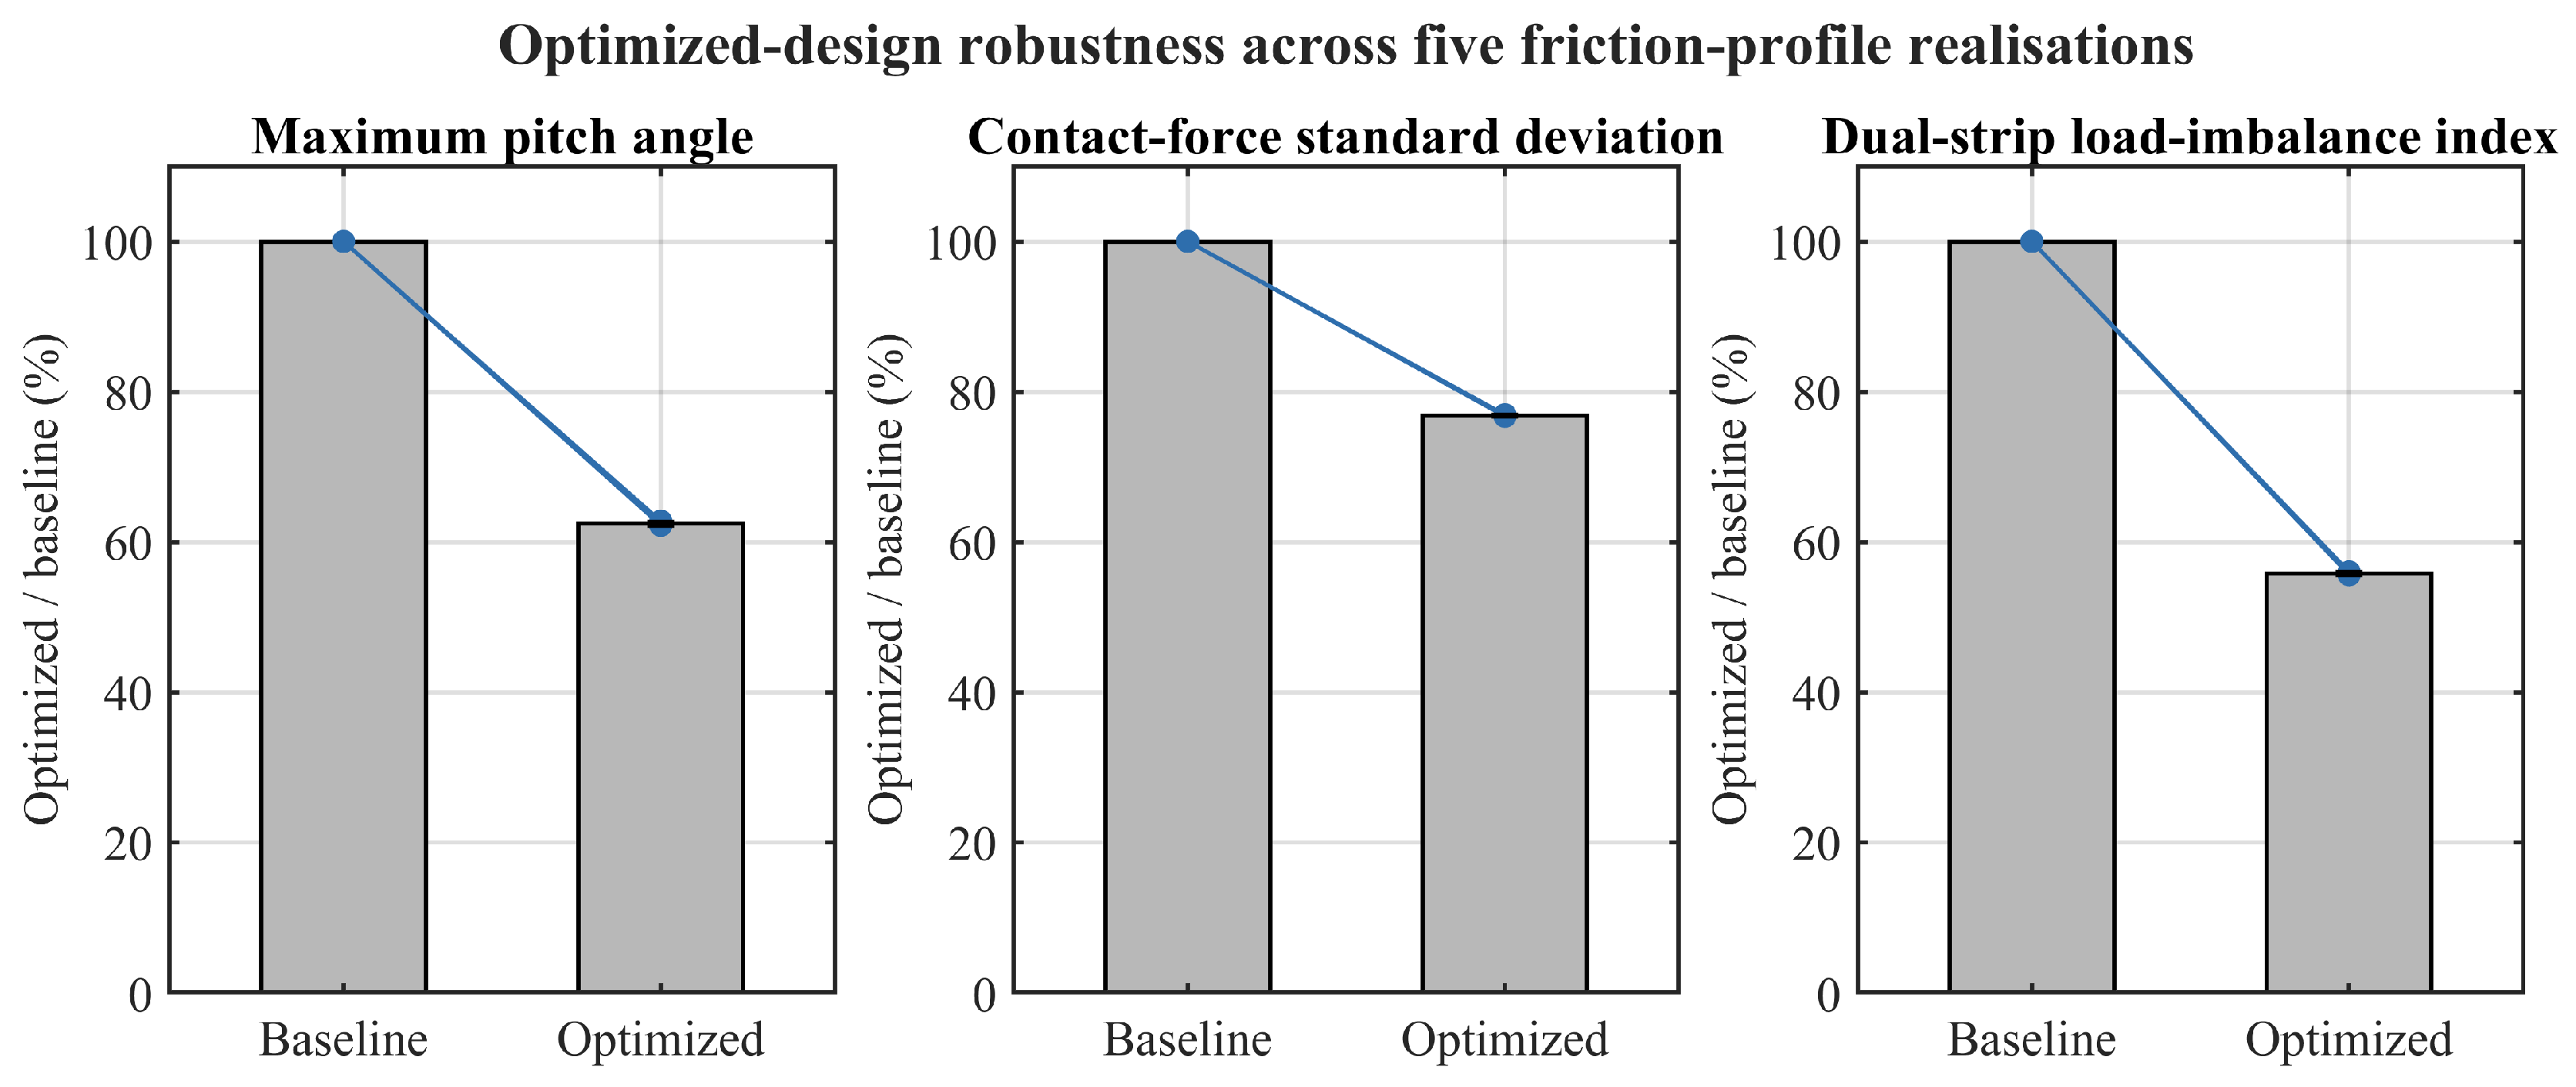
To examine robustness with respect to the spatially correlated random friction field, five friction-profile realisations (seeds 2026, 2117, 2208, 2299, and 2390) were evaluated at 120 km/h. All contact-model settings, the evaluation window, and the random support-height component were held fixed; only the friction profile was regenerated.
Table 6 and Figure 17 show that the optimised parameter set improves maximum pitch angle, contact-force standard deviation, and dual-strip load imbalance in every realisation. The mean improvements are 37.59%, 23.20%, and 44.22%, with ranges of 37.25–37.81%, 23.09–23.30%, and 44.01–44.40%, respectively.
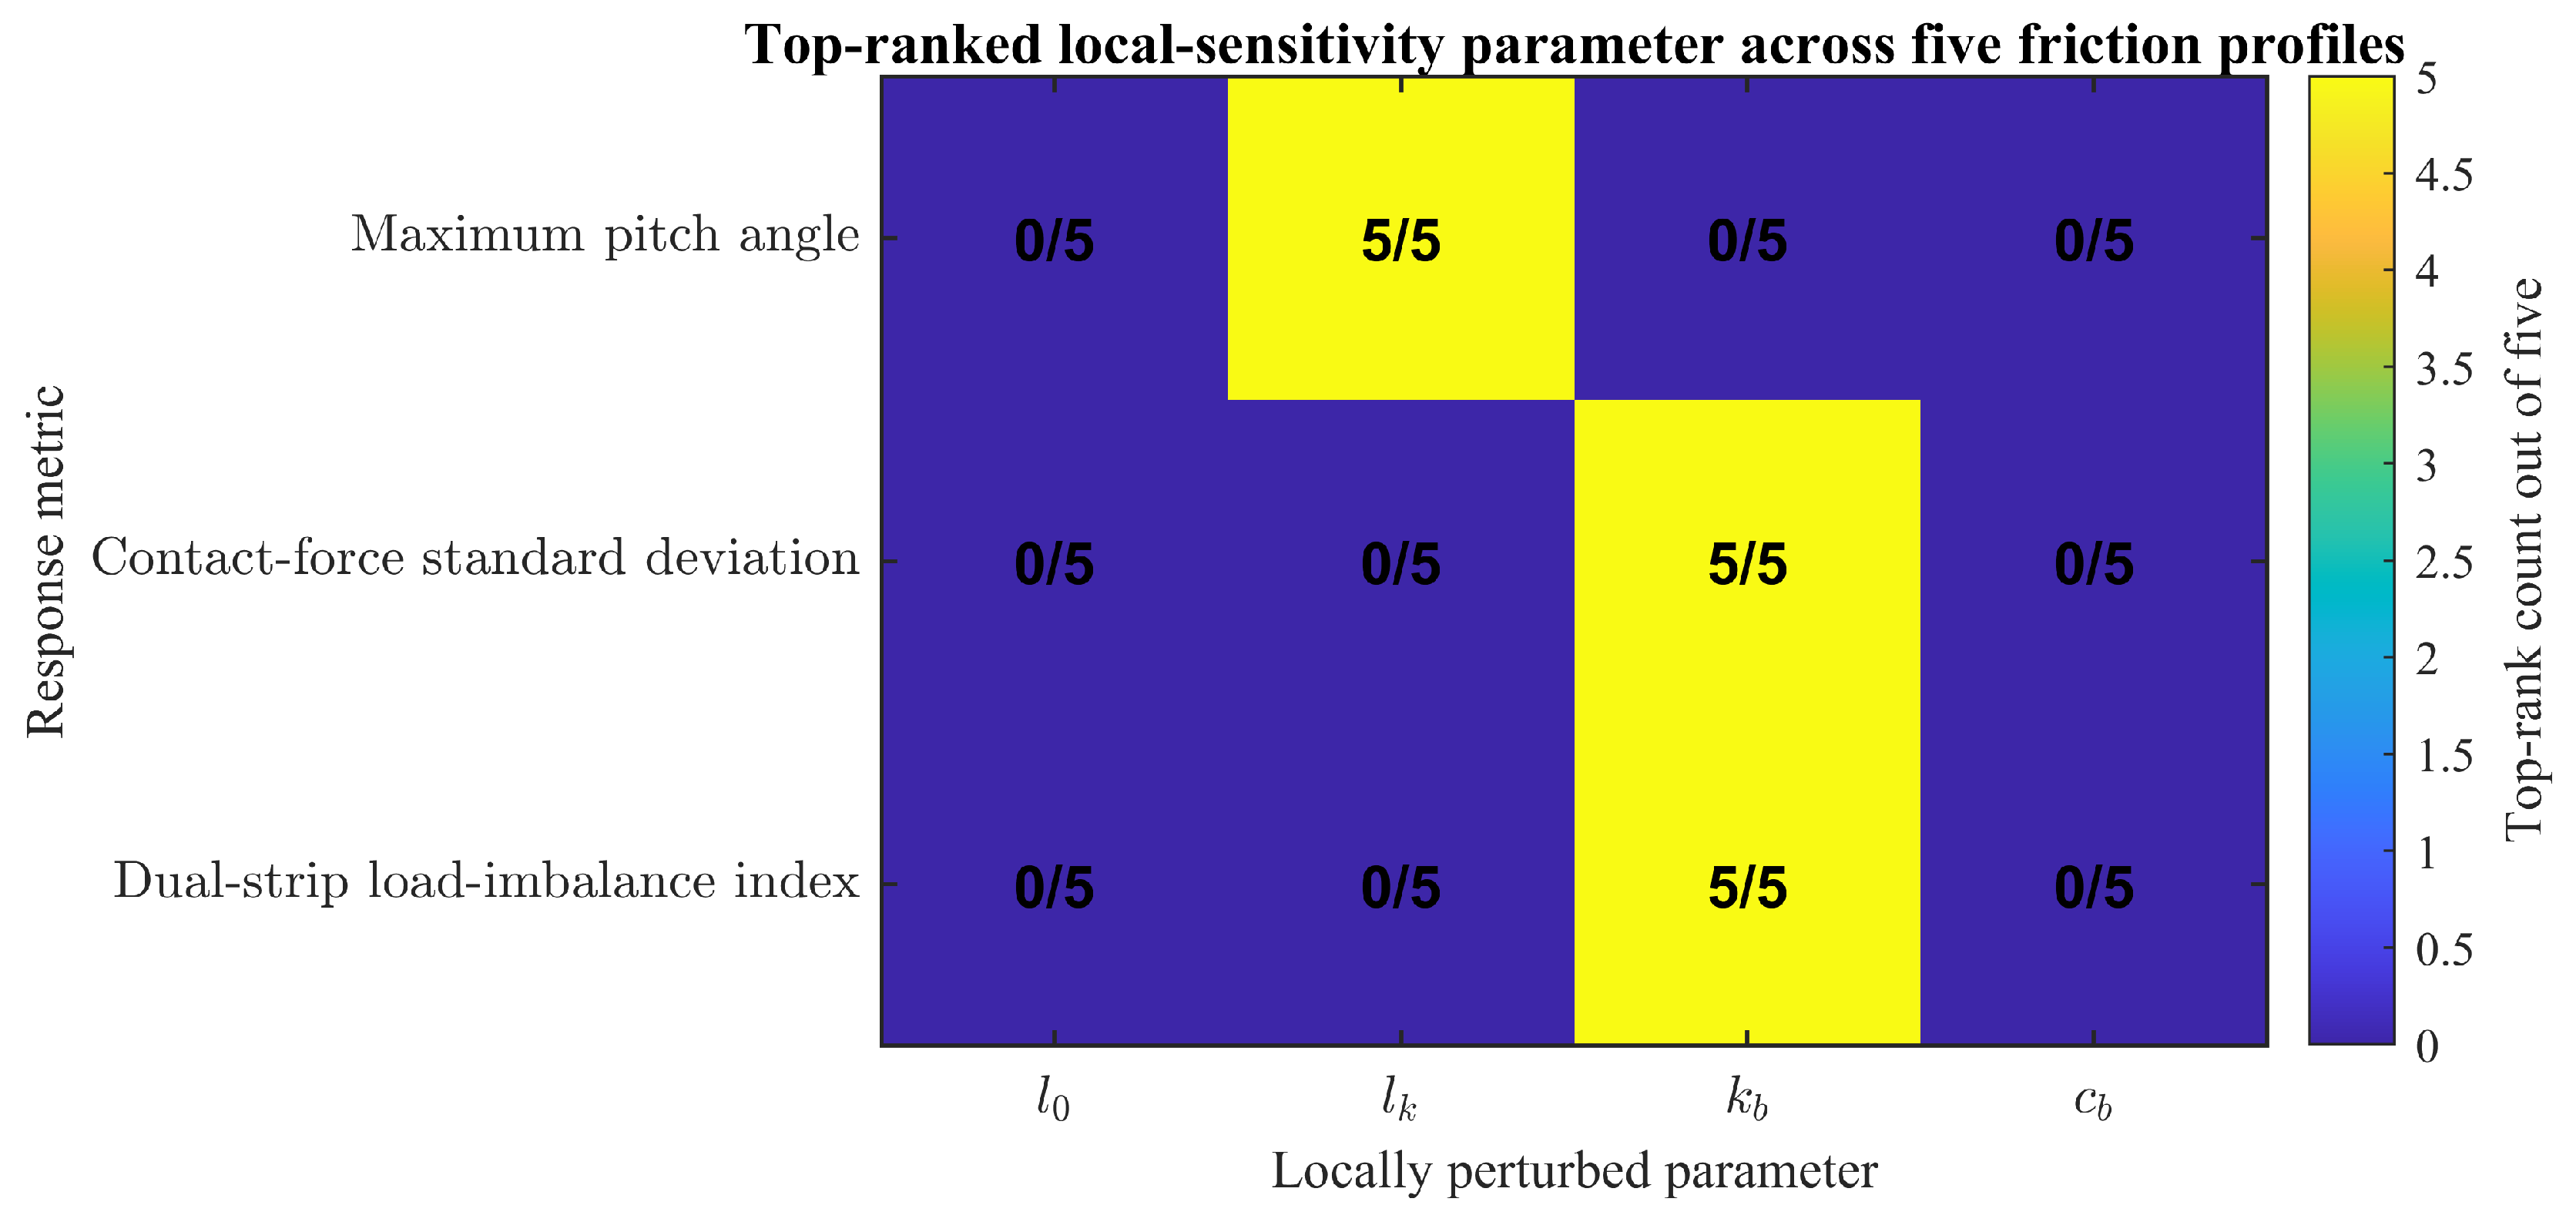
For local ranking verification, a +10% one-at-a-time perturbation of l0, lk, kb, and cb was applied under each friction realisation.
Figure 18 shows the number of realisations ranking each parameter first according to the absolute change in each response index. lk ranks first for maximum pitch angle in all five realisations, while kb ranks first for contact-force standard deviation and dual-strip load imbalance in all five. The complete four-parameter ranking is identical for the latter two indices in all five realisations and for the pitch index in four of five; thus, the main sensitivity directions are robust within the tested friction-profile ensemble.
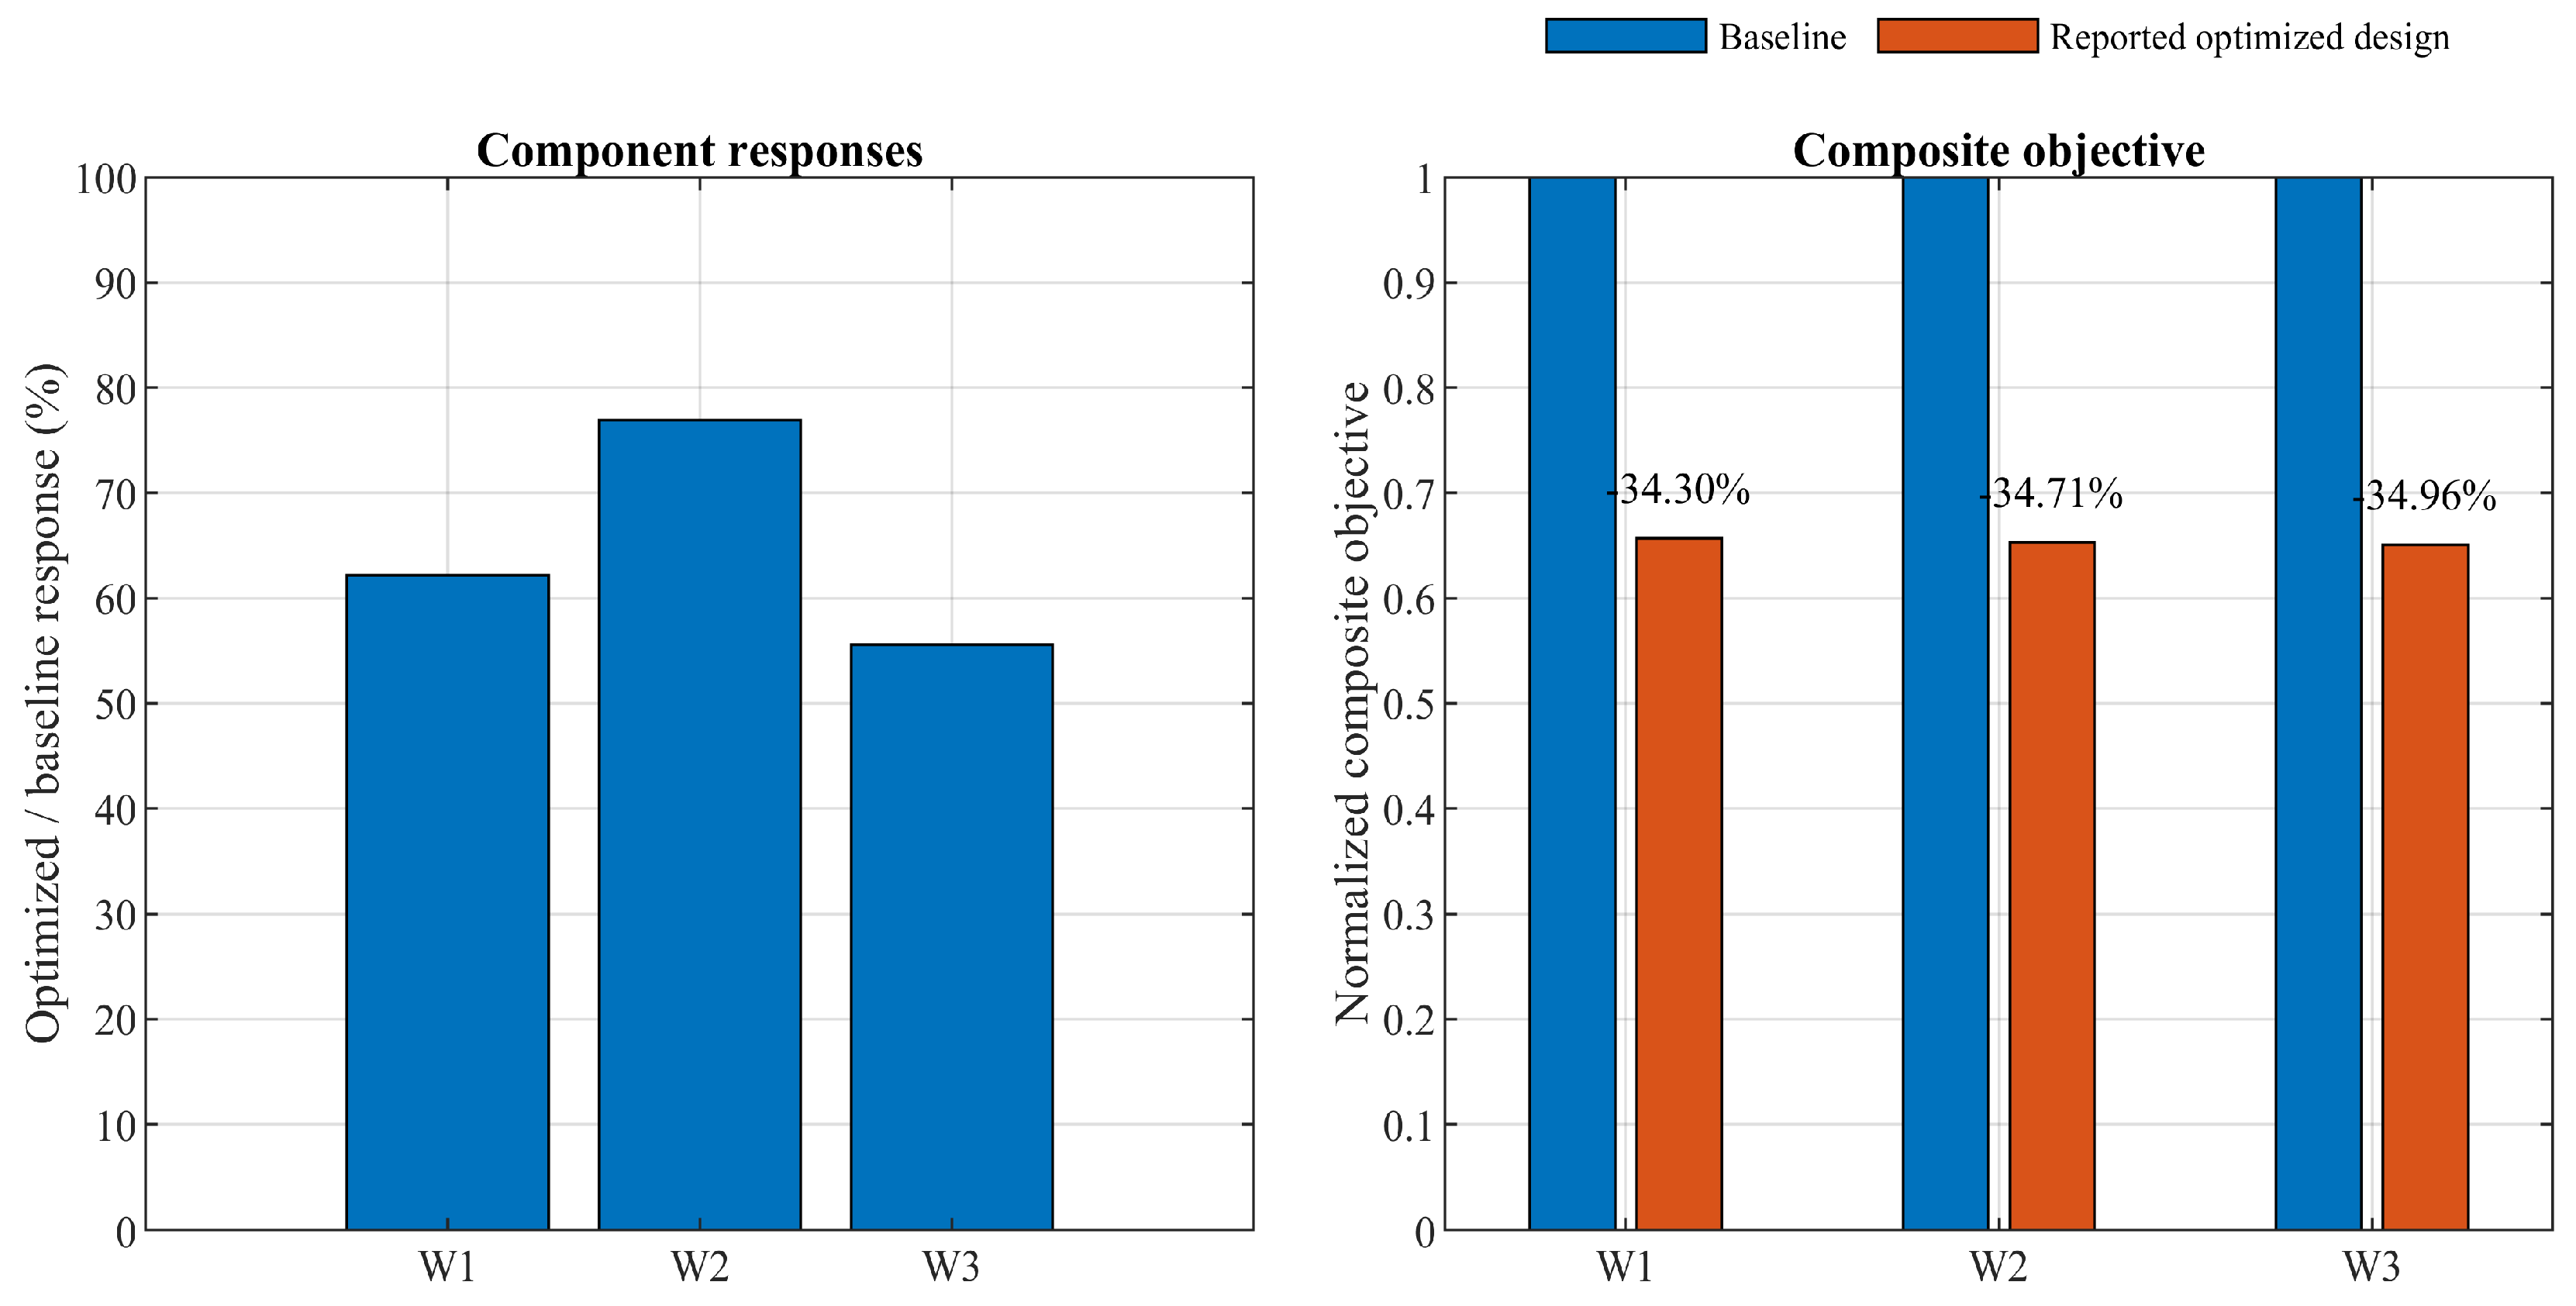
The nominal weights w1 = 0.40, w2 = 0.35, and w3 = 0.25 prioritise the maximum pitch angle while retaining substantial contributions from contact-force fluctuation and dual-strip load imbalance. A limited sensitivity check was conducted for the fixed reported optimised parameter set using W2 = [0.50, 0.30, 0.20] and W3 = [0.30, 0.35, 0.35].
Because the weights enter only the composite evaluation function, the dynamic responses of a fixed parameter set are unchanged. Table 7 and Figure 19 therefore compare the normalised composite objective under the three engineering-priority settings. The optimised design reduces the composite objective by 34.30%, 34.71%, and 34.96% for W1, W2, and W3, respectively, while retaining reductions of 37.81% in maximum pitch angle, 23.09% in contact-force standard deviation, and 44.40% in dual-strip load imbalance. This comparison assesses the performance of the fixed optimised design under alternative evaluation weights; optimisation was not repeated for each weight set. It therefore does not establish the sensitivity of the resulting optimal parameter configuration to the weights.
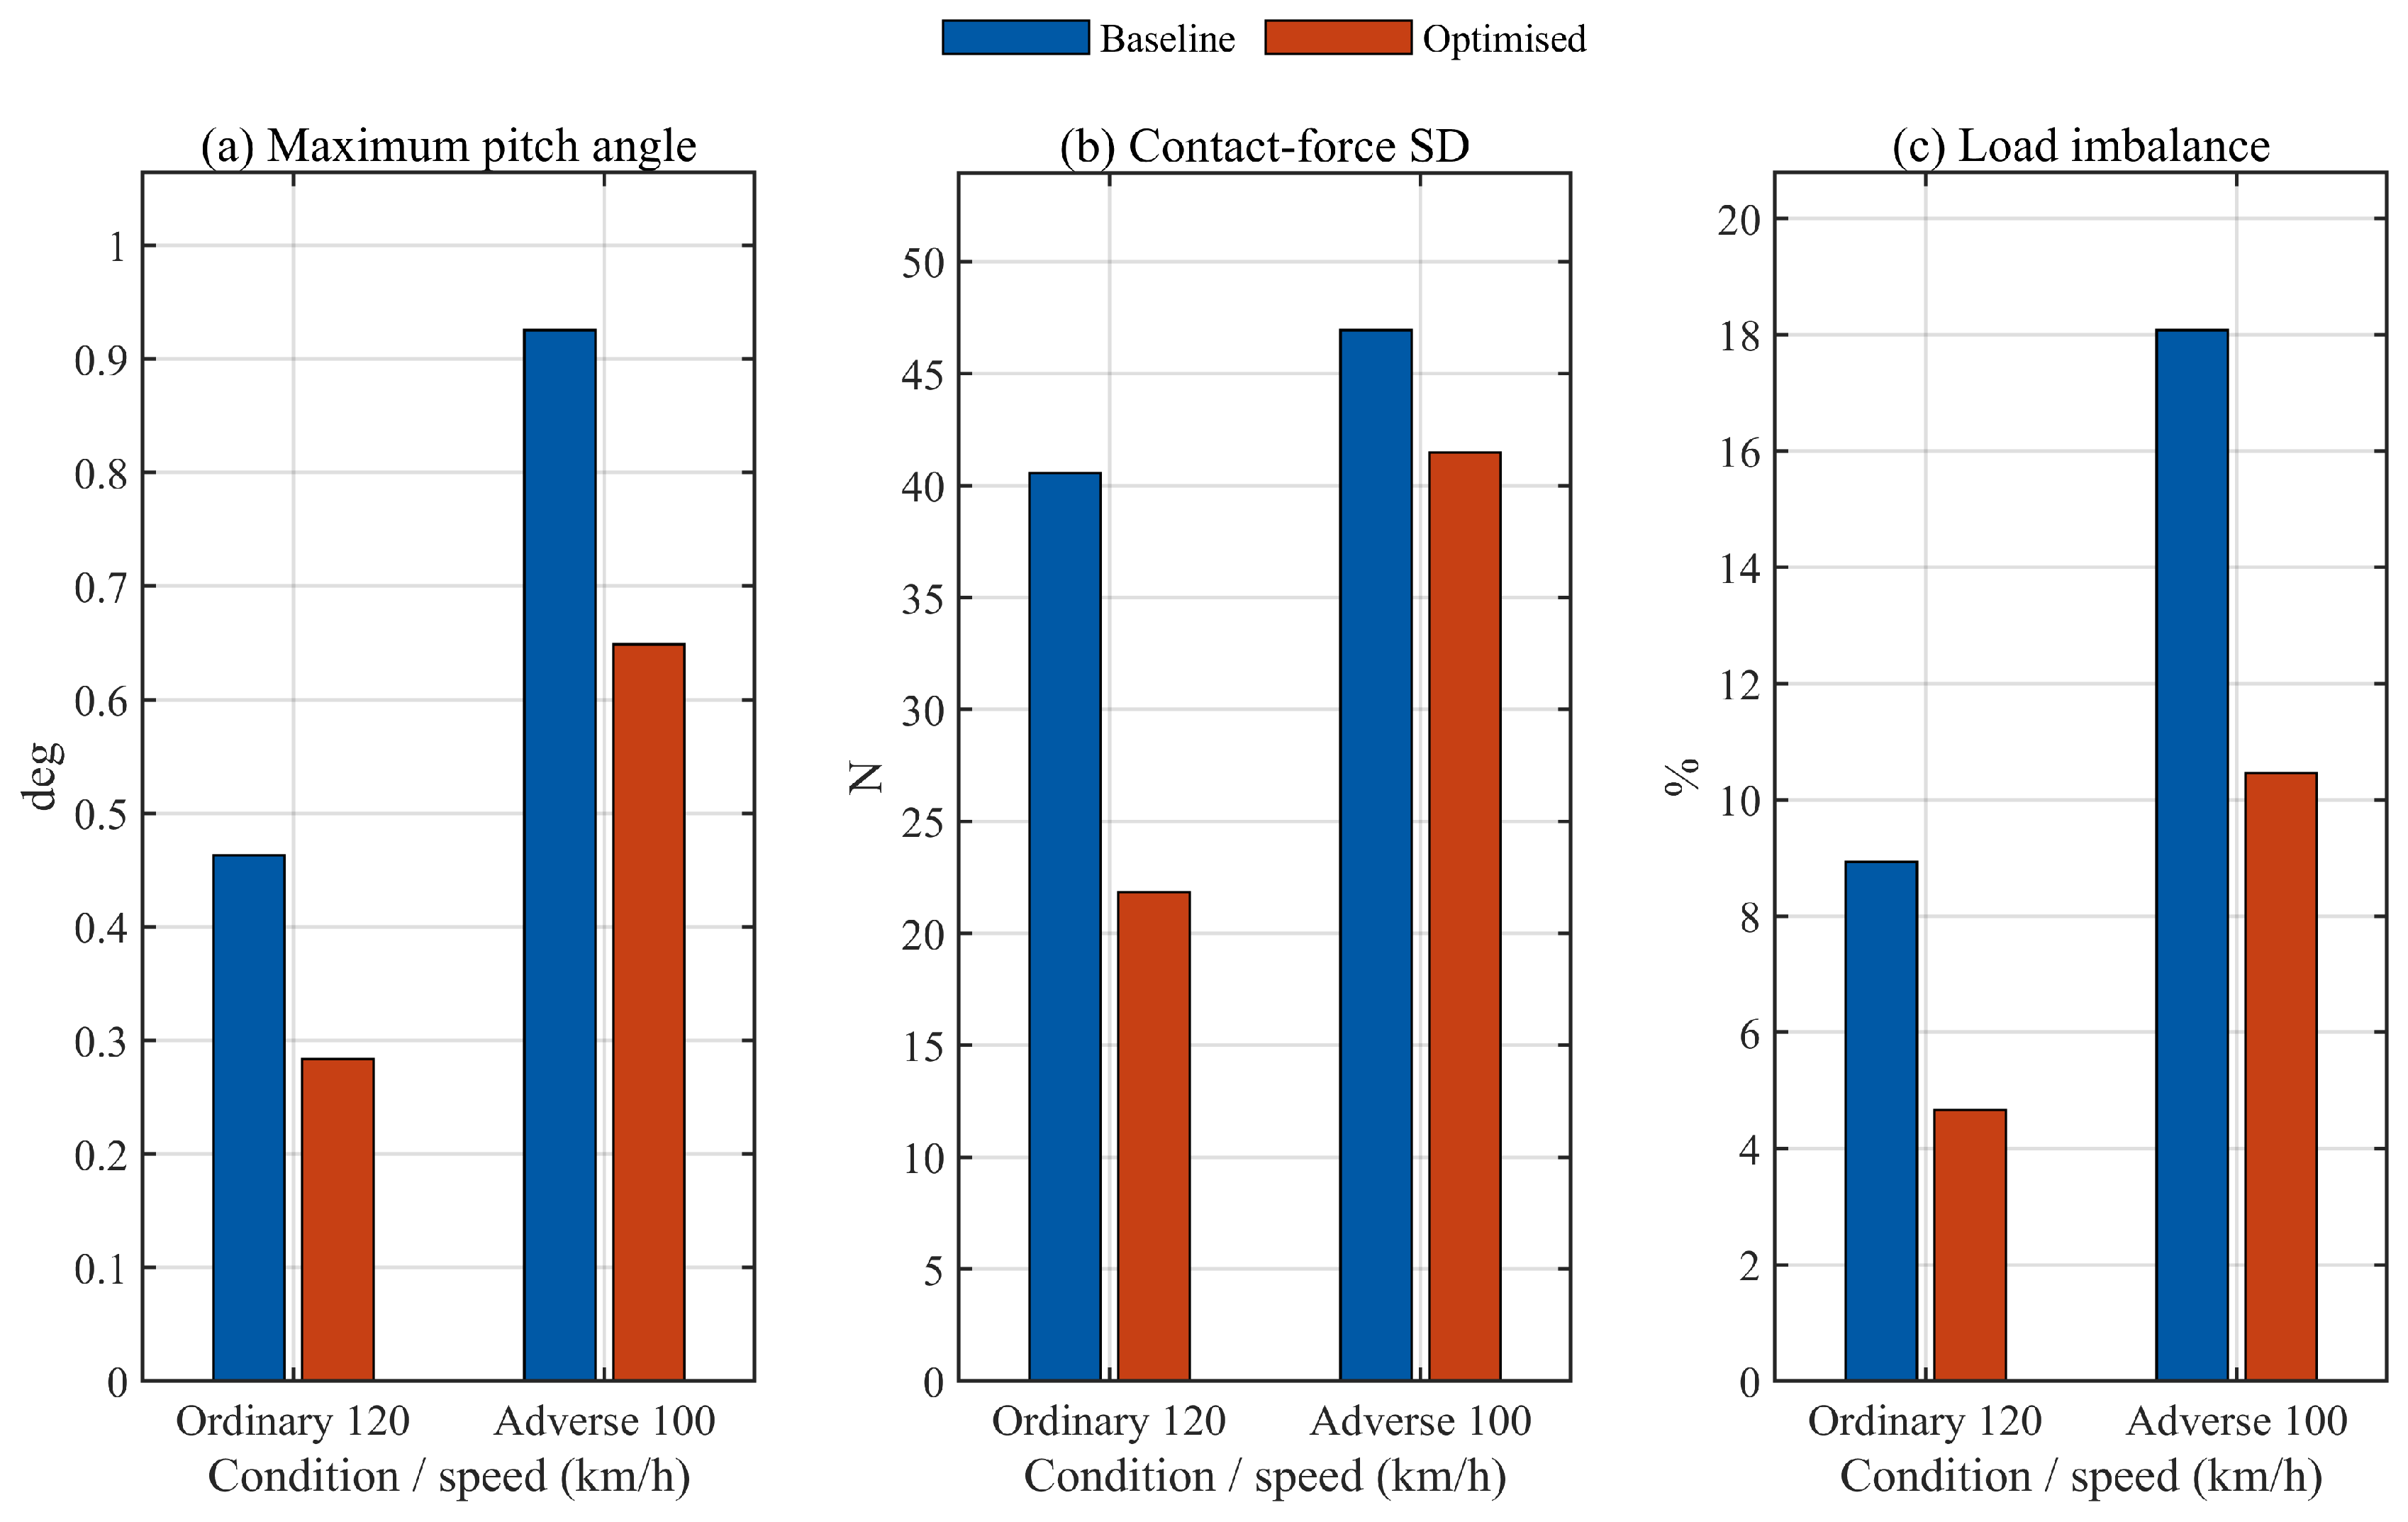
The parameter set optimised for the 120 km/h winter adverse condition was then applied without re-tuning to an ordinary 120 km/h condition and to a winter adverse condition at 100 km/h.
Table 8 and Figure 20 show that the optimised parameter set improves all three indices in both verification conditions. In the ordinary 120 km/h condition, reductions in maximum pitch angle, contact-force standard deviation, and load-imbalance index are 38.79%, 46.19%, and 47.75%; in the 100 km/h winter adverse condition, they are 29.91%, 11.62%, and 42.14%.

5. Conclusions

A coupled pantograph–planar Euler–Bernoulli ROCL model with independent strip degrees of freedom and panhead pitching was developed to analyse friction-induced mechanical response and dual-strip load redistribution. The main conclusions are as follows:
(1)
The proposed model resolves independent strip–wire contacts, local spring-box support, longitudinal friction-induced moments and panhead pitching. Baseline validation at 80 km/h shows that the simulated total-contact-force statistics reproduce the measured level with deviations below 20%, supporting comparative coupled-response analysis.
(2)
The representative low-temperature, low-humidity and snow-free scenario changes the mean contact force by only 1.58%, but increases its standard deviation and maximum by 25.66% and 38.61%, respectively, while the minimum decreases to 0 N. The principal mechanical effects are therefore fluctuation amplification, local impact and poor-contact risk rather than a change in mean uplift load.
(3)
Sensitivity analysis shows that collector-strip half-spacing, nominal spring-box length, equivalent spring-box stiffness and damping influence panhead attitude, force transmission and dual-strip load sharing in different ways. A single-index design cannot resolve these trade-offs.
(4)
The sensitivity-guided coordinate-search optimisation reduces the maximum panhead pitch angle from 1.02° to 0.63°, the total-contact-force standard deviation from 50.98 to 39.21 N, and the dual-strip load-imbalance index from 18.59% to 10.33%, corresponding to improvements of 38.24%, 23.09% and 44.43%. The results provide quantitative guidance for local panhead mechanical design under non-uniform contact conditions.

6. Limitations and Future Work

The present model provides comparative mechanical-design guidance by resolving independent strip forces, panhead pitch angle, and load imbalance, which are masked by total-force statistics. Its scope is the coupled dynamic mechanism and the associated passive design trends. Direct prediction of material-removal depth, long-term wear evolution, or a line-specific calibrated winter profile would require additional simultaneous measurements of strip force, wear, and local infrastructure condition; these extensions do not alter the present comparative conclusions.
Future work may extend the present passive panhead design by replacing the constant local damping element with a controllable semi-active damper and by jointly considering lower-frame mobility and upper-frame compensation. Such an extension would require an actuator model, sensing and control logic, and experimental validation; it is therefore outside the scope of the current passive-model results.

Author Contributions

Conceptualization, J.F. and J.G.; methodology, J.F.; software, J.F. and J.C.; validation, J.F. and J.C.; formal analysis, J.F.; investigation, J.F.; writing—original draft preparation, J.F.; writing—review and editing, J.G.; supervision, J.G.; funding acquisition, J.G. All authors have read and agreed to the published version of the manuscript.

Funding

This research was funded by the Major Science and Technology Special Project of Yunnan Province, grant number 202502AC080004, and the General Program of the National Natural Science Foundation of China, grant number 52472421.

Institutional Review Board Statement

Not applicable.

Informed Consent Statement

Not applicable.

Data Availability Statement

The original numerical simulation data used to generate the result figures are openly available in the Open Science Framework (OSF) at https://doi.org/10.17605/OSF.IO/A79HX. The numerical results reported in the tables were derived from these datasets. The line-test statistics used for model validation were obtained from the previously published sources cited in the manuscript.

Conflicts of Interest

The authors declare no conflicts of interest. The funders had no role in the design of the study; in the collection, analysis or interpretation of data; in the writing of the manuscript; or in the decision to publish the results.

References

  1. Bruni, S.; Bucca, G.; Facchinetti, A.; Gregori, S.; Pombo, J. Recent developments on pantograph–overhead line interaction. Veh. Syst. Dyn. 2025, 63, 1358–1394. [Google Scholar] [CrossRef] [Scilit]
  2. Bruni, S.; Ambrosio, J.; Carnicero, A.; Cho, Y.H.; Finner, L.; Ikeda, M.; Kwon, S.Y.; Massat, J.P.; Stichel, S.; Tur, M.; et al. The results of the pantograph–catenary interaction benchmark. Veh. Syst. Dyn. 2015, 53, 412–435. [Google Scholar] [CrossRef] [Scilit]
  3. Feng, X.H.; Hu, Z.Y.; Gao, S.B.; Duan, F.C.; Chu, W.P.; Song, Y. Modelling and analysis of the effect of expansion joints on the dynamic performance of railway rigid overhead systems. Sensors 2023, 23, 6797. [Google Scholar] [CrossRef] [Scilit] [PubMed]
  4. Wei, X.K.; Meng, H.F.; He, J.H.; Jia, L.M.; Li, Z.G. Wear analysis and prediction of rigid-catenary contact wire and pantograph strip for railway systems. Wear 2020, 442–443, 203118. [Google Scholar] [CrossRef] [Scilit]
  5. Mei, G.M. Tribological performance of rigid overhead lines against pantograph sliders under DC passage. Tribol. Int. 2020, 151, 106538. [Google Scholar] [CrossRef] [Scilit]
  6. Wu, Q.; Gu, X.P.; Ma, Z.; Wang, A. A Study on the Vibration Characteristics and Damage Mechanism of Pantograph Strips in a Railway Electrification System. Machines 2022, 10, 710. [Google Scholar] [CrossRef] [Scilit]
  7. Zhi, X.S.; Zhou, N.; Wei, H.F.; Chen, H.M.; Cheng, Y.; Sun, Y.; Zhao, L.; Huang, G.; Zhang, W. Analysis of abnormal wear of pantograph contact strips through combined experimental and simulation approaches. Sci. Rep. 2025, 15, 45706. [Google Scholar] [CrossRef] [Scilit] [PubMed]
  8. Zhi, X.S.; Zhou, N.; Cheng, Y.; Wei, H.F.; Yao, Y.M.; Zhang, W.H.; Chen, G.X. Study on wear performance and mechanism of pantograph contact strip that contact with damaged contact wire under ambient humidity. Friction 2026, 14, 9441101. [Google Scholar] [CrossRef] [Scilit]
  9. Zhi, X.S.; Zhou, N.; Cheng, Y.; Wang, X.; Wei, H.; Chen, G.; Zhang, W. Effect and behaviors of ambient humidity on the wear of metal-impregnated carbon strip in pantograph-catenary system. Tribol. Int. 2023, 188, 108864. [Google Scholar] [CrossRef] [Scilit]
  10. Shen, M.X.; Ji, D.H.; Hu, Q.; Xiao, L.; Li, Q.P. Current-carrying tribological behaviour of C/Cu contact pairs in extreme temperature and humidity environments for railway catenary systems. Sci. China Technol. Sci. 2024, 67, 2537–2548. [Google Scholar] [CrossRef] [Scilit]
  11. Ji, D.H.; Xiao, L.; Hu, Q.; Chen, S.Y.; Li, Q.P.; Shen, M.X. Effect of temperature on the current-carrying tribological behaviour of C/Cu contact pairs in high-humidity environments. Tribol. Lett. 2024, 72, 63. [Google Scholar] [CrossRef] [Scilit]
  12. Tong, L.; Zhang, M.Z.; Hu, S.T.; Ji, Y.M. Changing patterns in the thermal environment of subway tunnels and comprehensive utilisation of waste heat. Buildings 2024, 14, 2524. [Google Scholar] [CrossRef] [Scilit]
  13. Kimura, K.; Shibata, K.; Sato, M.; Tanita, N.; Yagi, H.; Kondo, Y. Simple estimation formula of air temperature in tunnels: Estimation method for cooling load caused by train wind in an underground station: Part 2. J. Environ. Eng. (Trans. AIJ) 2018, 83, 607–613. [Google Scholar] [CrossRef] [Scilit]
  14. Morris, A.J. Computer evaluation of controlled pantographs for current collection from simple catenary overhead equipment at high speed. J. Dyn. Syst. Meas. Control 1983, 105, 287–294. [Google Scholar] [CrossRef] [Scilit]
  15. Schaub, M.; Simeon, B. Pantograph-Catenary Dynamics: An Analysis of Models and Simulation Techniques. Math. Comput. Model. Dyn. Syst. 2001, 7, 225–238. [Google Scholar] [CrossRef] [Scilit]
  16. Simo, J.C.; Vu-Quoc, L. On the dynamics of flexible beams under large overall motions: The plane case, Part I. J. Appl. Mech. 1986, 53, 849–854. [Google Scholar] [CrossRef] [Scilit]
  17. Shabana, A.A. Absolute nodal coordinate formulation. J. Mech. Des. 1997, 119, 589–595. [Google Scholar] [CrossRef] [Scilit]
  18. Shabana, A.A. Computational Continuum Mechanics; Cambridge University Press: Cambridge, UK, 2012. [Google Scholar]
  19. Seo, J.H.; Kim, S.W.; Jung, I.H.; Park, T.W.; Moon, S.J. Dynamic analysis of a pantograph–catenary system using absolute nodal coordinates. Veh. Syst. Dyn. 2006, 44, 615–630. [Google Scholar] [CrossRef] [Scilit]
  20. Pappalardo, C.M.; Patel, M.D.; Tinsley, B.; Shabana, A.A. Contact force control in multibody pantograph/catenary systems. Proc. Inst. Mech. Eng. Part K J. Multi-Body Dyn. 2016, 230, 307–328. [Google Scholar] [CrossRef] [Scilit]
  21. Kulkarni, S.; Pappalardo, C.M.; Shabana, A.A. Pantograph/Catenary Contact Formulations. J. Vib. Acoust. 2017, 139, 011010. [Google Scholar] [CrossRef] [Scilit]
  22. Qi, W.Y.; Peng, C.B.; Chen, Y.; Mei, G.M.; Zhang, J.W.; Zhang, W.H. Dynamic modelling of railway pantograph with rigid–flexible hybrid model and pantograph–catenary interaction analysis. Veh. Syst. Dyn. 2025. [Google Scholar] [CrossRef] [Scilit]
  23. Zhang, H.C.; Xu, X.H.; Wu, M.Z.; Zhou, R. Effect of coupled vibration modes of a dual-strip panhead on pantograph–catenary interaction. Acta Mech. Sin. 2025, 41, 524164. [Google Scholar] [CrossRef] [Scilit]
  24. Gil, J.; Tur, M.; Gregori, S.; Pedrosa, A.M.; Fuenmayor, F.J. Modelling of a high-speed railway pantograph with a nonlinear head-suspension mechanism and parameter optimisation. Nonlinear Dyn. 2025, 113, 11227–11246. [Google Scholar] [CrossRef] [Scilit]
  25. Chen, G.X. Handbook of Friction–Vibration Interactions; Woodhead Publishing: Oxford, UK, 2014. [Google Scholar]
  26. Qian, W.J.; Chen, G.X.; Zhang, W.H.; Ouyang, H.; Zhou, Z.R. Friction-induced self-excited vibration of a pantograph–catenary system. J. Vib. Acoust. 2015, 137, 051003. [Google Scholar]
  27. Amano, Y.; Kobayashi, S.; Yabuno, H.; Yamashita, Y.; Mori, H. Mechanism and suppression of friction-induced vibration in a catenary–pantograph system. Nonlinear Dyn. 2024, 112, 14959–14980. [Google Scholar] [CrossRef] [Scilit]
  28. Amano, Y.; Kobayashi, S.; Yamashita, Y.; Uji, H.; Yabuno, H. Effects of periodic structures on friction-induced vibrations in catenary–pantograph systems. Tribol. Int. 2025, 203, 110406. [Google Scholar] [CrossRef] [Scilit]
  29. Li, X.H. Friction-Induced Self-Excited Vibration of Pantograph–Rigid Overhead Contact Line Interaction. Ph.D. Thesis, Southwest Jiaotong University, Chengdu, China, 2022. (In Chinese) [Google Scholar]
  30. Feng, X.H.; Chen, G.X.; Mei, G.M.; Dong, B.J.; Zhao, P.P.; Li, X.H. Friction-induced self-excited vibration of the metro pantograph–catenary system. J. Southwest Jiaotong Univ. 2025, 60, 418–424. (In Chinese) [Google Scholar]
  31. Zhou, R.; Xu, X.H. Contact-force surrogate model and its application in pantograph–catenary parameter optimisation. Appl. Sci. 2024, 14, 448. [Google Scholar] [CrossRef] [Scilit]
  32. Chen, K.; Song, Y.; Lu, X.B.; Duan, F.C. Sensitivity analysis and optimisation of key parameters for a railway rigid overhead system and pantograph. Sustainability 2023, 15, 6803. [Google Scholar] [CrossRef] [Scilit]
  33. Wu, M.Z.; Liu, Y.; Xu, X.H. Sensitivity analysis and optimisation of parameters of a high-speed pantograph–catenary system. Chin. J. Theor. Appl. Mech. 2021, 53, 75–83. (In Chinese) [Google Scholar]
  34. Zhang, J.; Liu, W.Z.; Zhang, Z.F. Sensitivity analysis and optimisation methods for design parameters of a high-speed railway catenary. IET Electr. Syst. Transp. 2019, 9, 150–156. [Google Scholar] [CrossRef] [Scilit]
  35. Wang, H.L.; Zheng, D.Y.; Huang, P.; Yan, W.Y. Multi-objective design optimisation of railway pantograph–catenary systems. Veh. Syst. Dyn. 2023, 61, 2953–2975. [Google Scholar] [CrossRef] [Scilit]
  36. Pombo, J.; Ambrosio, J. Influence of pantograph suspension characteristics on contact quality with the catenary for high-speed trains. Comput. Struct. 2012, 110–111, 32–42. [Google Scholar] [CrossRef] [Scilit]
  37. Kim, J.W.; Yu, S.N. Design variable optimization for pantograph system of high-speed train using robust design technique. Int. J. Precis. Eng. Manuf. 2013, 14, 267–273. [Google Scholar] [CrossRef] [Scilit]
  38. Ambrosio, J.; Pombo, J.; Pereira, M. Optimisation of high-speed railway pantographs for improving pantograph–catenary contact. Theor. Appl. Mech. Lett. 2013, 3, 013006. [Google Scholar] [CrossRef] [Scilit]
  39. Allotta, B.; Pugi, L.; Bartolini, F. An active suspension system for railway pantographs: The T2006 prototype. Proc. Inst. Mech. Eng. Part F J. Rail Rapid Transit 2009, 223, 15–29. [Google Scholar] [CrossRef] [Scilit]
  40. Allotta, B.; Pugi, L.; Colla, V.; Bartolini, F.; Cangioli, F. Design and optimisation of a semi-active suspension system for railway applications. J. Mod. Transp. 2011, 19, 223–232. [Google Scholar] [CrossRef] [Scilit]
  41. Yang, Y.; Zhou, N.; Li, R.P.; Zhang, W.H. Finite-element simulation of dynamic performance in a pantograph–catenary transition section. J. Vib. Shock 2016, 35, 71–75, 116. (In Chinese) [Google Scholar]
  42. Qi, W.Y. Pantograph Parameter Optimisation and Active Control under Rigid Overhead Contact Line Operating Conditions. Ph.D. Thesis, Southwest Jiaotong University, Chengdu, China, 2022. (In Chinese) [Google Scholar]
  43. EN 50119:2009; Railway Applications—Fixed Installations—Electric Traction Overhead Contact Lines. European Committee for Electrotechnical Standardization: Brussels, Belgium, 2009.
  44. EN 50367:2012; Railway Applications—Current Collection Systems—Technical Criteria for the Interaction Between Pantograph and Overhead Line. European Committee for Electrotechnical Standardization: Brussels, Belgium, 2012.
  45. EN 50317:2012; Railway Applications—Current Collection Systems—Requirements for and Validation of Measurements of the Dynamic Interaction Between Pantograph and Overhead Contact Line. European Committee for Electrotechnical Standardization: Brussels, Belgium, 2012.
Figure 1. Uneven wear of metro pantograph collector strips.
Machines 14 01064 g001
Figure 2. Panhead model with independent degrees of freedom for the two collector strips.
Machines 14 01064 g002
Figure 3. Equivalent planar Euler–Bernoulli beam model with Hermite interpolation of the rigid overhead contact line.
Machines 14 01064 g003
Figure 4. Simulated contact force for model validation.
Machines 14 01064 g004
Figure 5. Total contact-force histories for the baseline and representative adverse cases.
Machines 14 01064 g005
Figure 6. Contact-force histories of the two collector strips under the representative adverse condition.
Machines 14 01064 g006
Figure 7. Panhead pitch-angle histories for the baseline and representative adverse cases.
Machines 14 01064 g007
Figure 8. Local sensitivity of panhead parameters.
Machines 14 01064 g008
Figure 9. One-at-a-time sensitivity curves of panhead parameters.
Machines 14 01064 g009
Figure 10. Coupled three-index sensitivity trajectories.
Machines 14 01064 g010
Figure 11. Total contact-force histories before and after optimisation.
Machines 14 01064 g011
Figure 12. Contact-force histories of the two collector strips before and after optimisation.
Machines 14 01064 g012
Figure 13. Poor-contact risk of the lower-loaded strip.
Machines 14 01064 g013
Figure 14. Phase portrait of panhead pitch and strip-force difference.
Machines 14 01064 g014
Figure 15. Synchronous pitch-angle and strip-force-difference histories.
Machines 14 01064 g015
Figure 16. Normalised overall performance before and after optimisation.
Machines 14 01064 g016
Figure 17. Robustness across five friction-profile realisations.
Machines 14 01064 g017
Figure 18. Stability of local-sensitivity ranking.
Machines 14 01064 g018
Figure 19. Reweighted evaluation of the fixed optimised design.
Machines 14 01064 g019
Figure 20. Cross-condition verification.
Machines 14 01064 g020
Table 1. Comparison of simulated contact-force statistics with line-test data.
Contact-Force StatisticPresent Simulation/NLine-Test Data/NRelative Error/%
Minimum F m i n 82.4369.6418.37
Maximum F m a x 142.53165.8314.05
Mean F m 116.06104.0311.53
Standard deviation σ 17.2721.0317.88
Table 2. Contact-force statistics for the baseline and representative adverse cases.
Contact-Force StatisticBaseline Case/NRepresentative Adverse Case/NChange/%
Maximum F m a x 190.40263.9238.61
Minimum F m i n 33.420.00−100.00
Mean F m e a n 110.69112.441.58
Standard deviation F s t d 40.5750.9825.66
Table 3. Numerical convergence of the three primary response indices at 120 km/h.
CaseElements
per Span
Max. Step
(ms)
Max. Pitch
(deg)
Fstd
(N)
Load Imbalance
(%)
Baseline40.21.0189950.980418.5873
Mesh refined80.21.0182950.914518.3763
Mesh and step refined80.11.0182950.914518.3763
Table 4. Sensitive panhead parameters before and after optimisation (physical values and change rates).
ParameterUnitBefore OptimisationAfter OptimisationChange/%
Collector-strip half-spacingm0.150000.150000.00
Nominal spring-box lengthm0.150600.10542−30.00
Equivalent spring-box stiffnessN/m35002450−30.00
Equivalent spring-box dampingN s/m8084+5.00
Table 5. Performance indices before and after panhead-parameter optimisation.
IndexBefore
Optimisation
After
Optimisation
Improvement
Maximum panhead pitch angle/ η φ 1.02°0.63°38.24%
Standard deviation of total contact force/ η σ 50.98 N39.21 N23.09%
Dual-strip load-imbalance index/ η U 18.59%10.33%44.43%
Table 6. Five-realisation robustness of the optimised parameter set under spatially random friction.
MetricBaseline Mean ± SDOptimised Mean ± SDImprovement Range
Maximum panhead pitch angle (deg)0.968 ± 0.0310.604 ± 0.01937.25–37.81%
Contact-force standard deviation (N)51.103 ± 0.10339.249 ± 0.03023.09–23.30%
Dual-strip load-imbalance index (%)18.444 ± 0.11410.288 ± 0.04944.01–44.40%
Table 7. Limited sensitivity of the fixed optimised design to composite-objective weights.
Weight Set[w1, w2, w3]J BaselineJ OptimisedReduction
W1 reference[0.40, 0.35, 0.25]1.0000.65734.30%
W2 pitch priority[0.50, 0.30, 0.20]1.0000.65334.71%
W3 load-sharing priority[0.30, 0.35, 0.35]1.0000.65034.96%
Table 8. Cross-condition verification of the fixed optimised parameter set.
ConditionMetricBaselineOptimisedChange
Ordinary 120 km/hMaximum pitch angle (deg)0.4630.283−38.79%
Ordinary 120 km/hContact-force standard deviation (N)40.57321.833−46.19%
Ordinary 120 km/hDual-strip load-imbalance index (%)8.9294.665−47.75%
Winter adverse 100 km/hMaximum pitch angle (deg)0.9250.649−29.91%
Winter adverse 100 km/hContact-force standard deviation (N)46.94241.489−11.62%
Winter adverse 100 km/hDual-strip load-imbalance index (%)18.08010.460−42.14%
Disclaimer/Publisher’s Note: The statements, opinions and data contained in all publications are solely those of the individual author(s) and contributor(s) and not of MDPI and/or the editor(s). MDPI and/or the editor(s) disclaim responsibility for any injury to people or property resulting from any ideas, methods, instructions or products referred to in the content.