1. Introduction
Line-start synchronous motors (LSSMs) have attracted considerable research interest in recent years owing to their high efficiency and power factor, as well as their ability to start directly from the grid without the need for a frequency inverter. This capability is enabled by the squirrel-cage winding incorporated in the rotor, which provides self-starting characteristics similar to those of an induction motor. In contrast, conventional permanent-magnet synchronous motors typically require a frequency inverter for starting and operation. Nevertheless, examples of LSSM applications supplied by frequency converters have also been reported, enabling stable operation without the need for rotor position feedback [
1]. Various LSSM rotor topologies have been proposed, differing in the shape and arrangement of the permanent magnets within the rotor as well as in the configuration of the squirrel-cage winding. Common designs include U-shaped, V-shaped, W-shaped, swastika-shaped, and spoke-type rotor topologies. The operating characteristics of motors employing these rotor configurations and their comparative performance have been extensively investigated in the literature [
2,
3,
4,
5]. Design modifications aimed at improving motor performance characteristics have been reported in [
6,
7,
8,
9,
10,
11,
12,
13]. These studies consider various modifications to the rotor and magnetic circuit. Among the proposed approaches are the use of two sets of permanent magnets positioned on opposite pole pitches on the rotor, forming additional magnetic poles without permanent magnets; extending the permanent magnets beyond the stator stack; employing a modular salient-pole rotor structure with damper windings integrated into the rotor modules to reduce torque pulsations; introducing a rotor configuration with two different designs of rotor bars; and using consequent magnetic poles to reduce the permanent-magnet mass by approximately 25%. Despite the diversity of LSSM rotor topologies, all such machines operate according to the same fundamental principle. During startup, currents induced in the squirrel-cage (SC) winding generate the electromagnetic torque required to accelerate the motor to a speed close to synchronous speed. Throughout this process, the motor must overcome the braking torque produced by the permanent magnets (PMs). Once the rotor approaches synchronous speed, the permanent magnets facilitate synchronization, allowing the motor to operate in steady-state without induced currents in the rotor squirrel-cage winding. Successful synchronization and stable steady-state operation depend on several factors, including proper magnet sizing, motor and load inertia, and load torque. Therefore, a careful design balance must be achieved by selecting permanent magnets that provide sufficient synchronous torque while minimizing braking torque and ensuring that the load torque and inertia remain within acceptable limits [
14]. In addition to the design challenges, the manufacturing process further highlights the complexity of LSSMs. The squirrel-cage winding is typically produced by die-casting aluminum at temperatures that exceed the Curie temperature of the permanent magnets. Consequently, the magnets cannot be placed in the rotor flux barriers prior to the die-casting process, as they would become demagnetized. One of the most common manufacturing approaches is therefore to insert pre-magnetized permanent-magnet segments into the rotor after die casting. However, this method increases manufacturing complexity and consequently the overall motor cost [
15]. Since the SC winding plays a crucial role in the successful starting of an LSSM, its condition should be continuously monitored and potential faults should be detected in a timely manner. A fault detection method based on the analysis of air-gap search-coil measurements is proposed in [
16]. Although this technique is commonly used for detecting short circuits in the field winding of salient-pole LSSMs equipped with excitation windings, the underlying monitoring approach may also be applicable to assessing the condition of the squirrel-cage winding. In salient-pole LSSMs employing permanent magnets, the permanent magnets replace the conventional excitation winding. As a result, the need for a DC excitation source is eliminated, together with the associated excitation losses and the maintenance requirements related to slip rings and brushes. The main drawback of this configuration is the inability to control the power factor, since the excitation provided by the permanent magnets is fixed and cannot be adjusted during operation. Nevertheless, salient-pole permanent-magnet LSSMs are typically designed to operate at or near unity power factor under rated-load conditions. Noise and vibration generated during motor operation can be mitigated through several approaches. One such method, reported in [
17], involves the use of an auxiliary winding placed in the same stator slots as the main winding and short-circuited through capacitors. This configuration has been shown to reduce vibration levels and improve the overall dynamic performance of the motor. On the other hand, motor vibrations may also be induced by voltage subharmonics, highlighting the importance of power-quality monitoring and control, as discussed in [
18]. In addition to the permanent magnets, successful motor synchronization can be facilitated through an appropriate design of the squirrel-cage winding. Various approaches have been reported, including the use of asymmetrical rotor slots and pole-changing windings during startup, both of which contribute to improved synchronization capability [
19,
20,
21,
22]. Equally important is the availability of accurate mathematical models for analyzing the starting performance of large synchronous motors. Based on an equivalent-circuit formulation a modeling approach for the starting performance of large solid-pole synchronous motors is presented in [
23]. In this method, the solid rotor body is represented by two sets of virtual windings and the motor behavior is analyzed using the two-axis (d–q axis) theory. This approach enables an effective representation of the electromagnetic phenomena occurring during the startup process [
23]. In addition to complying with energy-efficiency regulations and achieving the required efficiency classes, the economic design of electrical machines remains a key consideration for manufacturers. Consequently, the optimization of motor designs with the objectives of minimizing production costs while maximizing efficiency and power factor has attracted significant research interest. Various optimization techniques have been applied to the design of LSSMs, including the Bat Algorithm (BA), Genetic Algorithm (GA), and Particle Swarm Optimization (PSO) [
24,
25,
26,
27,
28]. These studies address several aspects of LSSM optimization, including the convergence performance of different optimization techniques; the influence of permanent magnet length on the efficiency and power factor of line-start permanent-magnet-assisted synchronous reluctance motors (LS-PMA-SynRMs); the optimization of damper slot pitch in combination with slot skew to improve the armature winding voltage waveform of synchronous hydrogenerators; the optimization of LSSMs using nine design variables, including magnet thickness, magnet width, the position of W-shaped magnets, air-gap length, and the number of conductors per slot; and the optimization of magnet dimensions and rotor bar geometry to maximize the efficiency of LSSMs with surface-embedded permanent magnets. In [
29], two configurations of a permanent-magnet synchronous generator were optimized using optimetric analysis: one with surface-mounted permanent magnets and another with embedded permanent magnets. The optimization results demonstrated the effectiveness of the applied methodology in improving the generator performance characteristics. A successful optimization of cogging torque in permanent-magnet machines was reported in [
30] using both GA and the Cuckoo Search (CS) algorithm. The comparative analysis showed that the CS algorithm achieved the greatest reduction in cogging torque, outperforming the GA-based optimization approach.
In this paper, a line-start synchronous motor (LSSM) with salient poles and permanent magnets is developed by modifying the rotor of a 2.2 kW three-phase squirrel-cage induction motor of type H5AZ 100L-4 [
31]. According to the reviewed literature, LSSMs with salient poles and permanent magnets have received comparatively limited attention, particularly for low-power applications. The practical application of this motor topology at low power ratings is constrained by the complex rotor construction, which comprises salient poles, damper windings embedded in the pole shoes, and permanent magnets. Nevertheless, this complex rotor structure provides several opportunities for design optimization, including the geometry and dimensions of the rotor bars, the dimensions of the permanent magnets and rotor poles, and the outer rotor diameter, which directly determines the air-gap length. The optimization of this motor topology should be accompanied by an analysis of its transient behavior, including the transient characteristics of speed, current, and torque under rated-load conditions, to assess the capability of the motor to accelerate and achieve synchronization with the supply network. Equally important for LSSMs is the analysis of their transient response to sudden load changes. Therefore, this paper focuses on several key aspects of the operation and optimization of LSSMs with salient poles and permanent magnets. First, the dimensions of the rotor bars are determined to ensure successful acceleration and synchronization with the supply network under both rated-load conditions and sudden load changes. Second, the motor efficiency is improved by optimizing the permanent-magnet thickness, number of conductors per stator slot, outer rotor diameter (i.e., air-gap length), and motor length using parametric analysis and GA optimization. The optimized model is further evaluated through an analysis of its transient behavior under rated-load conditions and sudden load changes to verify its starting and synchronization capabilities. The results demonstrate that LSSMs with salient poles and permanent magnets should be evaluated not only in terms of efficiency improvement but also with respect to their transient performance, particularly under sudden load changes. In this regard, the ability of the optimized model to damp electromechanical oscillations and successfully re-establish synchronous speed is of particular importance. Design modifications that improve efficiency may adversely affect the starting and synchronization capabilities of the motor; therefore, both steady-state and transient performance should be considered during the optimization process. The analysis is initially focused on determining the optimal number of rotor bars located within the salient poles to ensure satisfactory starting and synchronization performance. Based on the obtained results for starting torque and the transient speed characteristics, an initial motor configuration is selected for further optimization. The objective is to identify the combination of design parameters that provides improved efficiency while maintaining reliable starting and synchronization capabilities. The parametric analysis generated 2475 motor models through various combinations of the four design variables. Among the analyzed configurations, the model exhibiting the highest efficiency was selected as the optimized design. In addition to efficiency, several other performance indicators were evaluated, obtained from parametric analysis, including power factor, starting torque, and motor net mass as they are simultaneously presented as output results from the parametric analysis besides the efficiency. This approach provides the designer with the flexibility to select a motor design based not only on one or two objective functions but also on a comprehensive assessment of overall performance and material costs due to the simultaneous presentation of various motor operating characteristics (defined during modeling of parametric model) that can be directly compared. Since the selection of the optimized model based on the highest efficiency depends on the designer choice and may be prone to subjective errors, the optimization was also performed using GA. The same set of design variables and parameter ranges employed in the optimetric analysis was considered in the GA-based optimization. The results obtained using the GA confirmed the selection of the optimized model identified through the optimetric analysis. Furthermore, the influence of each design variable on motor efficiency was evaluated individually. Finally, the synchronization capabilities of the initial and optimized models were compared through an analysis of the transient responses of speed, current, and torque under both constant and variable load conditions. Particular attention was devoted to the rotor’s mechanical oscillations around its equilibrium synchronous position following sudden load changes. LSSMs are generally more complex in construction and more expensive than induction motors. However, their high efficiency and near-unity power factor make them a competitive alternative in constant-speed applications such as pumps, fans, and compressors. This paper provides insight into the design aspects of an LSSM configuration with salient poles and permanent magnets, a topology that has received comparatively less attention in the literature. The study considers two key aspects of motor operation: steady-state performance and transient response behavior. The optimization results highlighted the importance of a careful evaluation of each design parameter, as well as their interactions, in order to obtain an optimal solution with respect to the predefined objectives. The selected optimization variables are relatively simple, allowing the corresponding modifications in the motor construction to be implemented without additional manufacturing costs or specialized tooling. Furthermore, the optimetric analysis indicated that multiple motor configurations—i.e., different combinations of design variables—can yield similar or nearly identical performance characteristics, while differing in material usage and, consequently, production cost. Therefore, a comprehensive assessment of the optimization results is required in order to achieve an appropriate trade-off between motor performance and manufacturing cost.
2. Initial Motor Model
The object of analysis is the 2.2. kW four-pole motor LSSM with salient poles and permanent magnets which was derived from the three-phase asynchronous squirrel cage motor type H5AZ 100LA-4. Firstly, the asynchronous motor (AM) was modeled in Ansys Electronics Desktop and then the obtained operating parameters from the software model of AM are compared with the physical motor H5AZ 100L-4. The comparison is presented in
Table 1.
More details about the AM model can be found in [
32]. The good agreement between the results presented in
Table 1 justifies proceeding with the next modification, i.e., converting the AM model into a line-start synchronous motor (LSSM) with salient poles and permanent magnets. The outer dimensions of the LSSM remain identical to those of the AM model. The main modifications are made to the rotor, which is reconfigured into a salient-pole rotor incorporating permanent magnets and a damper winding. In addition to the magnet thickness, which is the subject of a later optimization, the number of damper bars per rotor pole must also be determined. The exact number of damper bars depends on the physical dimensions of the rotor pole shoe as well as the electrical design requirements. The number of rotor damper bars (N
d) can be approximately determined using the following expression:
More detailed design procedure of rotor bars can be found in [
33]. Another design factor that should be taken into consideration is the pole shoe width [
34]. In addition, the spacing of the damper bars should differ from the stator slot pitch to prevent cogging torque and reduce space harmonics [
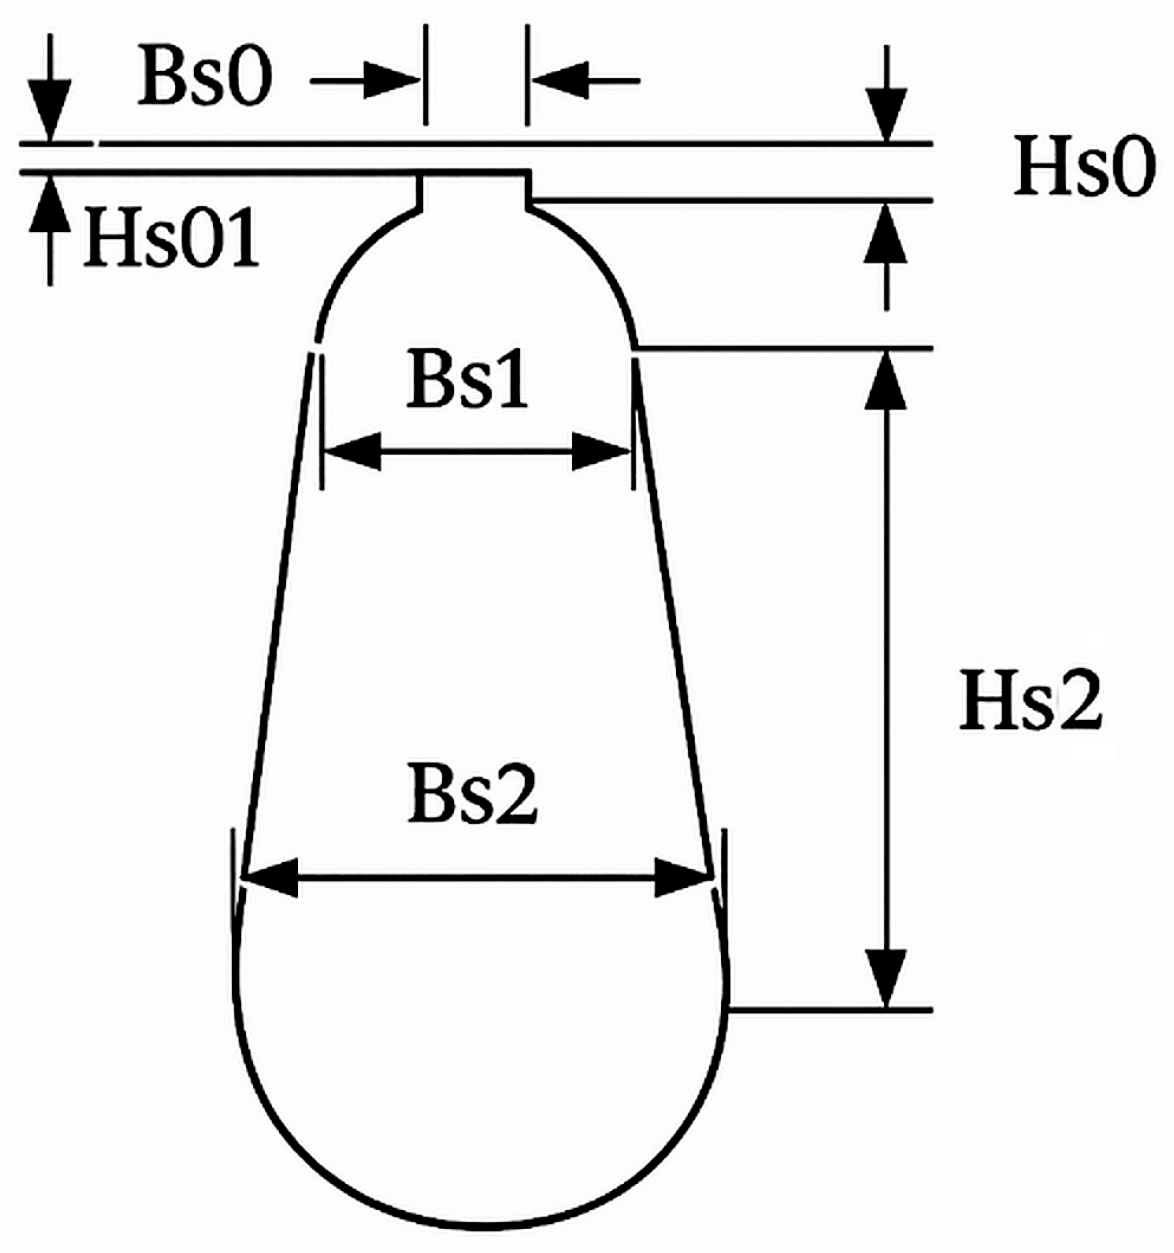
26]. Taking the above-mentioned factors into account, three rotor configurations were analyzed, comprising five, six, and seven damper bars per pole, referred to as IM1, IM2, and IM3, respectively. All three models employ the same rotor bar shape shown in
Figure 1, while only the bar dimensions differ, as presented in
Table 2. A preliminary analysis of different rotor bar shapes showed no significant differences in the motor operating characteristics. In an LSSM with salient poles and permanent magnets, the available space for rotor bar placement is limited, allowing only a small number of rotor bars per pole. Therefore, the rotor slot configuration and dimensions presented in
Table 2 were selected as the simplest and most readily manufacturable solution within the available rotor pole space. After adopting the rotor slot configuration shown in
Figure 1, the effects of varying the rotor bar dimensions according to the parameters listed in
Table 2 on the motor operating characteristics were further investigated.
From the simulation results obtained for models IM1, IM2, and IM3, it can be observed that the number and dimensions of the rotor bars affect the starting torque of the motor. Furthermore, the damper winding must provide sufficient asynchronous (induction) torque to accelerate the rotor as close to the synchronous speed as possible. In the analyzed models, the rotor bars are made of cast aluminum. High resistance yields a high starting torque but increases the slip, whereas lower resistance improves the pull-in capability at the expense of the starting current. Interior permanent magnet motors produce reluctance torque due to the saliency ratio, i.e., the ratio of the d-axis to the q-axis inductance, (L
d/L
q). During motor starting, the permanent magnets create a braking torque that should be overcome by the asynchronous torque and the reluctance torque. The reluctance torque assists motor synchronization, enabling the motor to pull into synchronism more rapidly and under higher inertia loads. The starting torque and transient parameters during the start-up of models IM1, IM2, and IM3 are presented in
Table 3.
The starting and synchronization capabilities of models IM1, IM2, and IM3 are analyzed with respect to the transient speed characteristics of the motor under constant and variable load conditions. In the first case, the motor is loaded with a constant torque of 13.9 Nm and a total inertia of 0.02 kg·m
2, considering that the rotor inertia is 0.01 kg·m
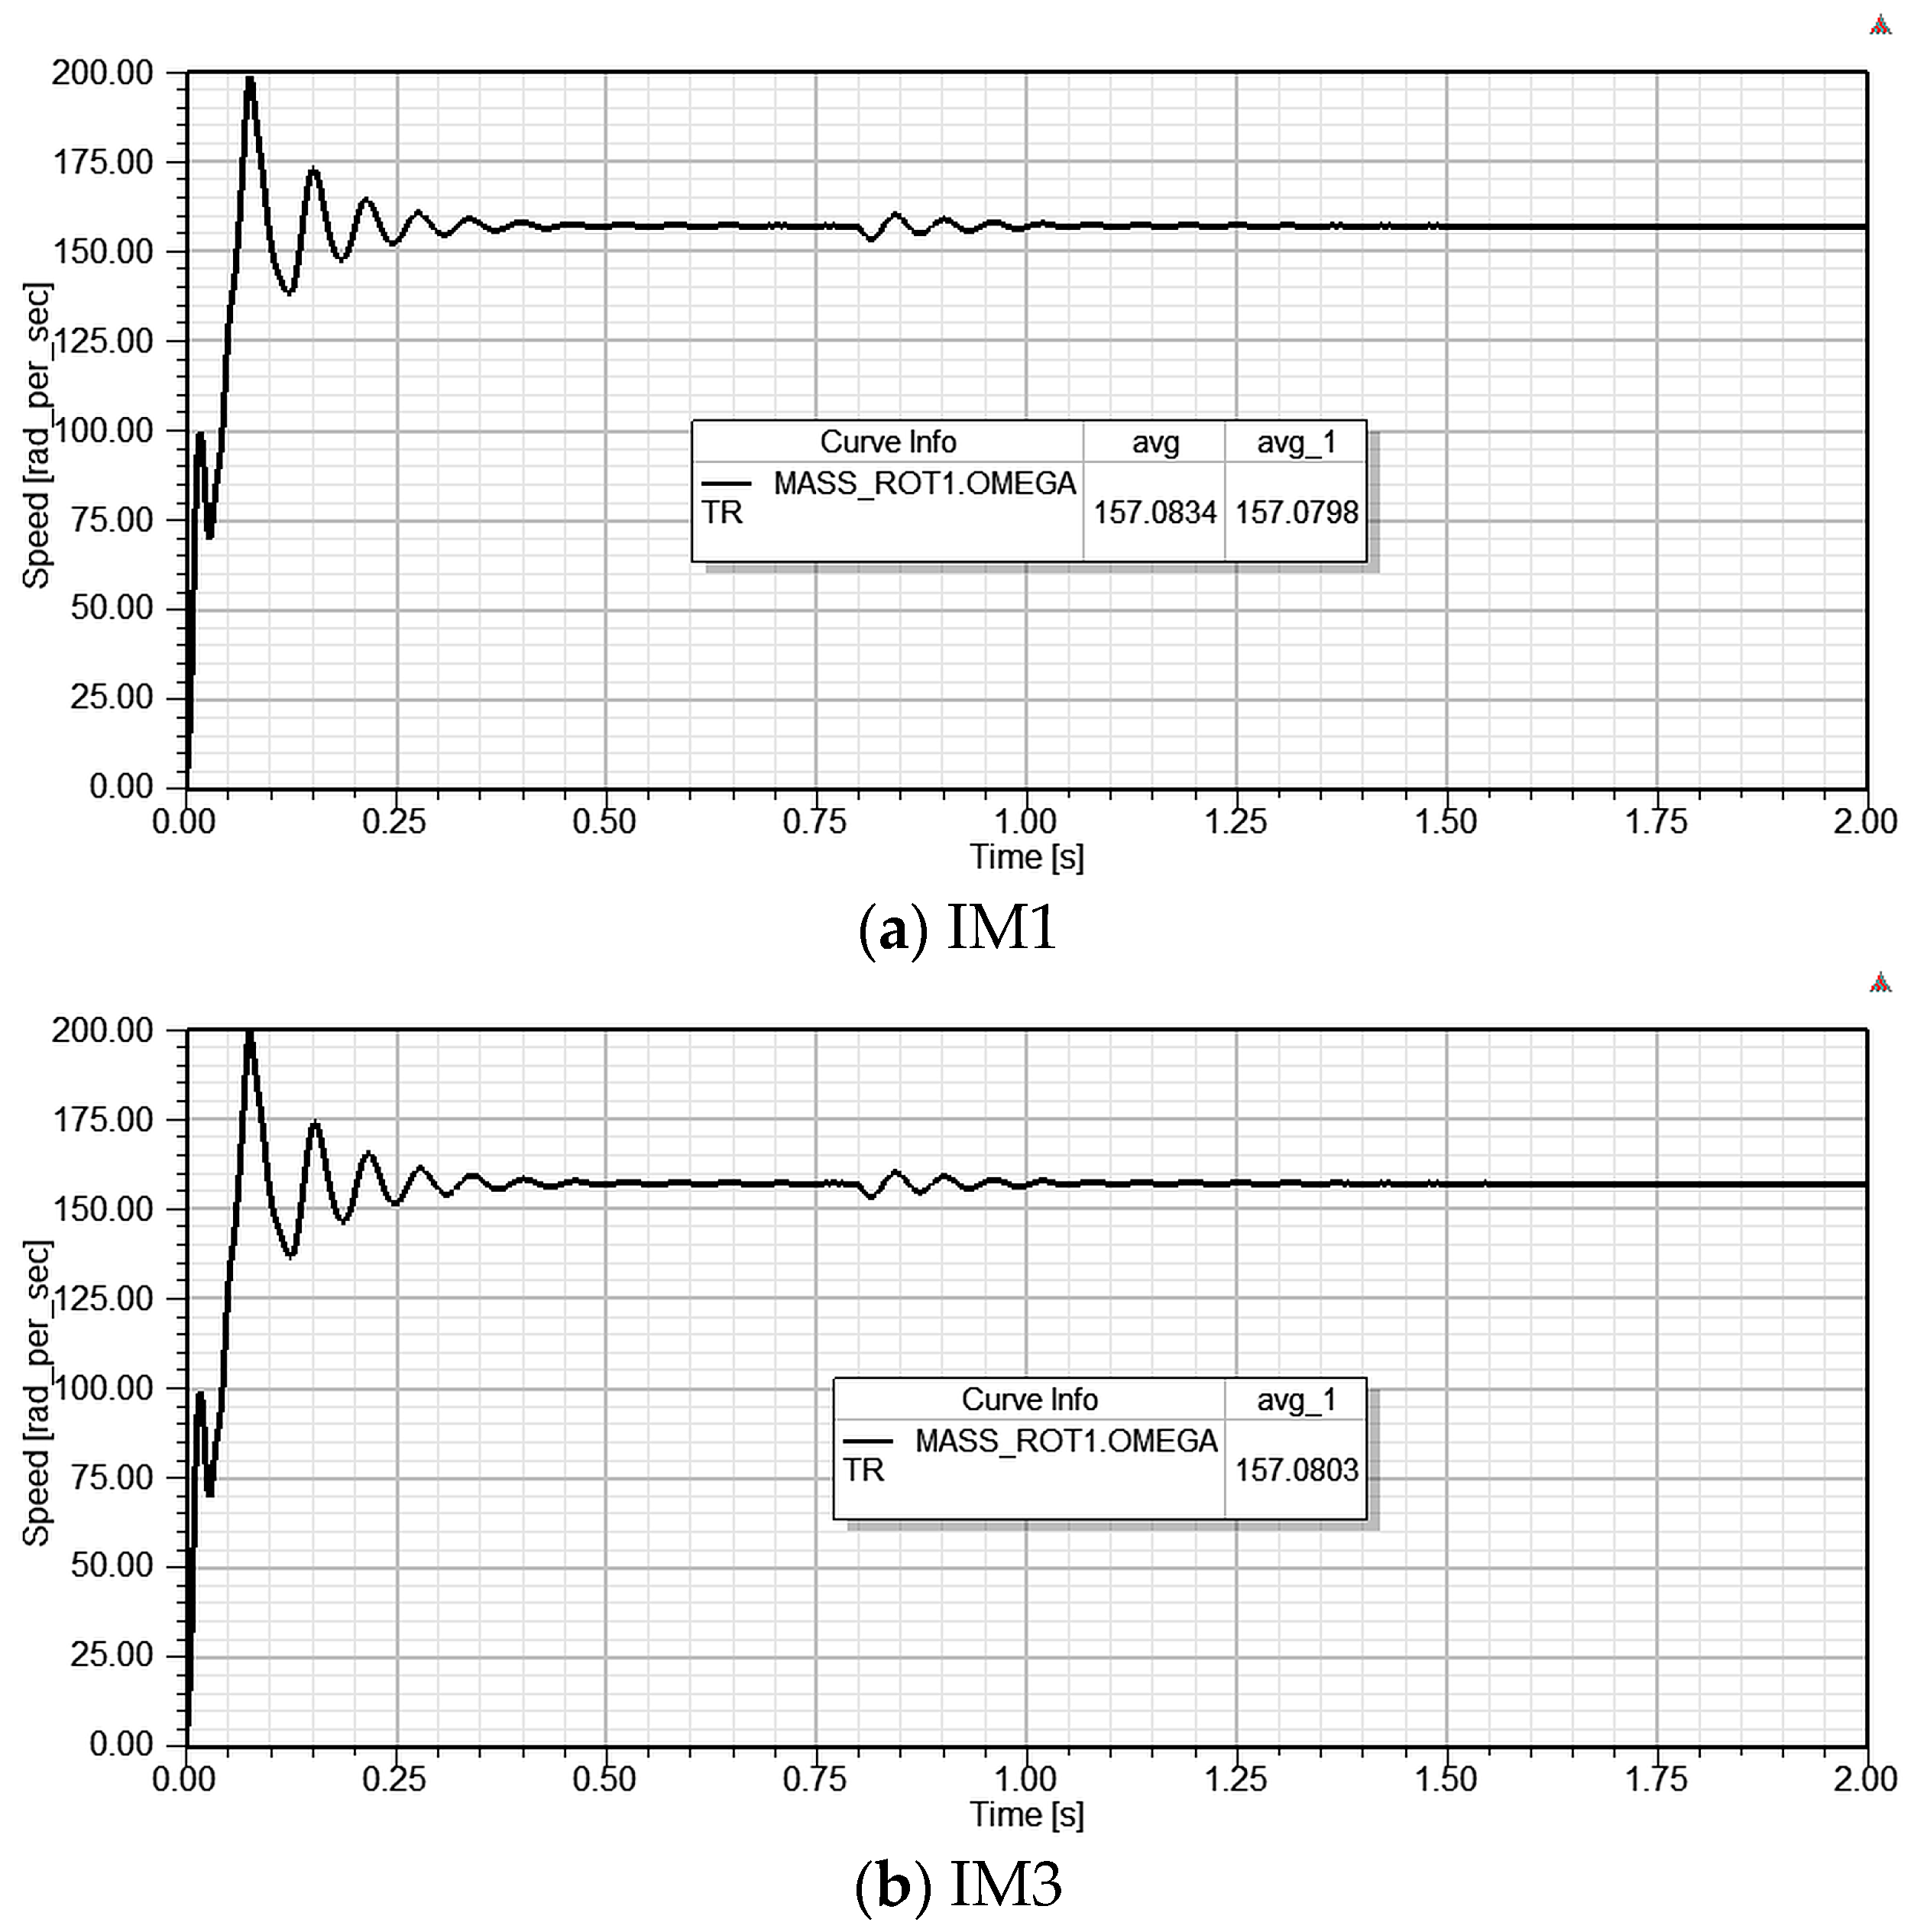
2 and that the motor should be capable of driving twice the rotor inertia. In the second case, the motor is subjected to a variable load, starting with a load torque of 5 Nm, which is increased to 13.9 Nm after 0.8 s. Such sudden load changes can cause mechanical oscillations of the rotor around the synchronous speed, resulting in fluctuations of the load angle. This phenomenon is known as rotor hunting in LSSMs. In addition, instability of the power supply or voltage harmonics can also cause rotor oscillations. The transient speed response characteristics of models IM1, IM2, and IM3 under a constant load torque of 13.9 Nm and a total inertia of 0.02 kg·m
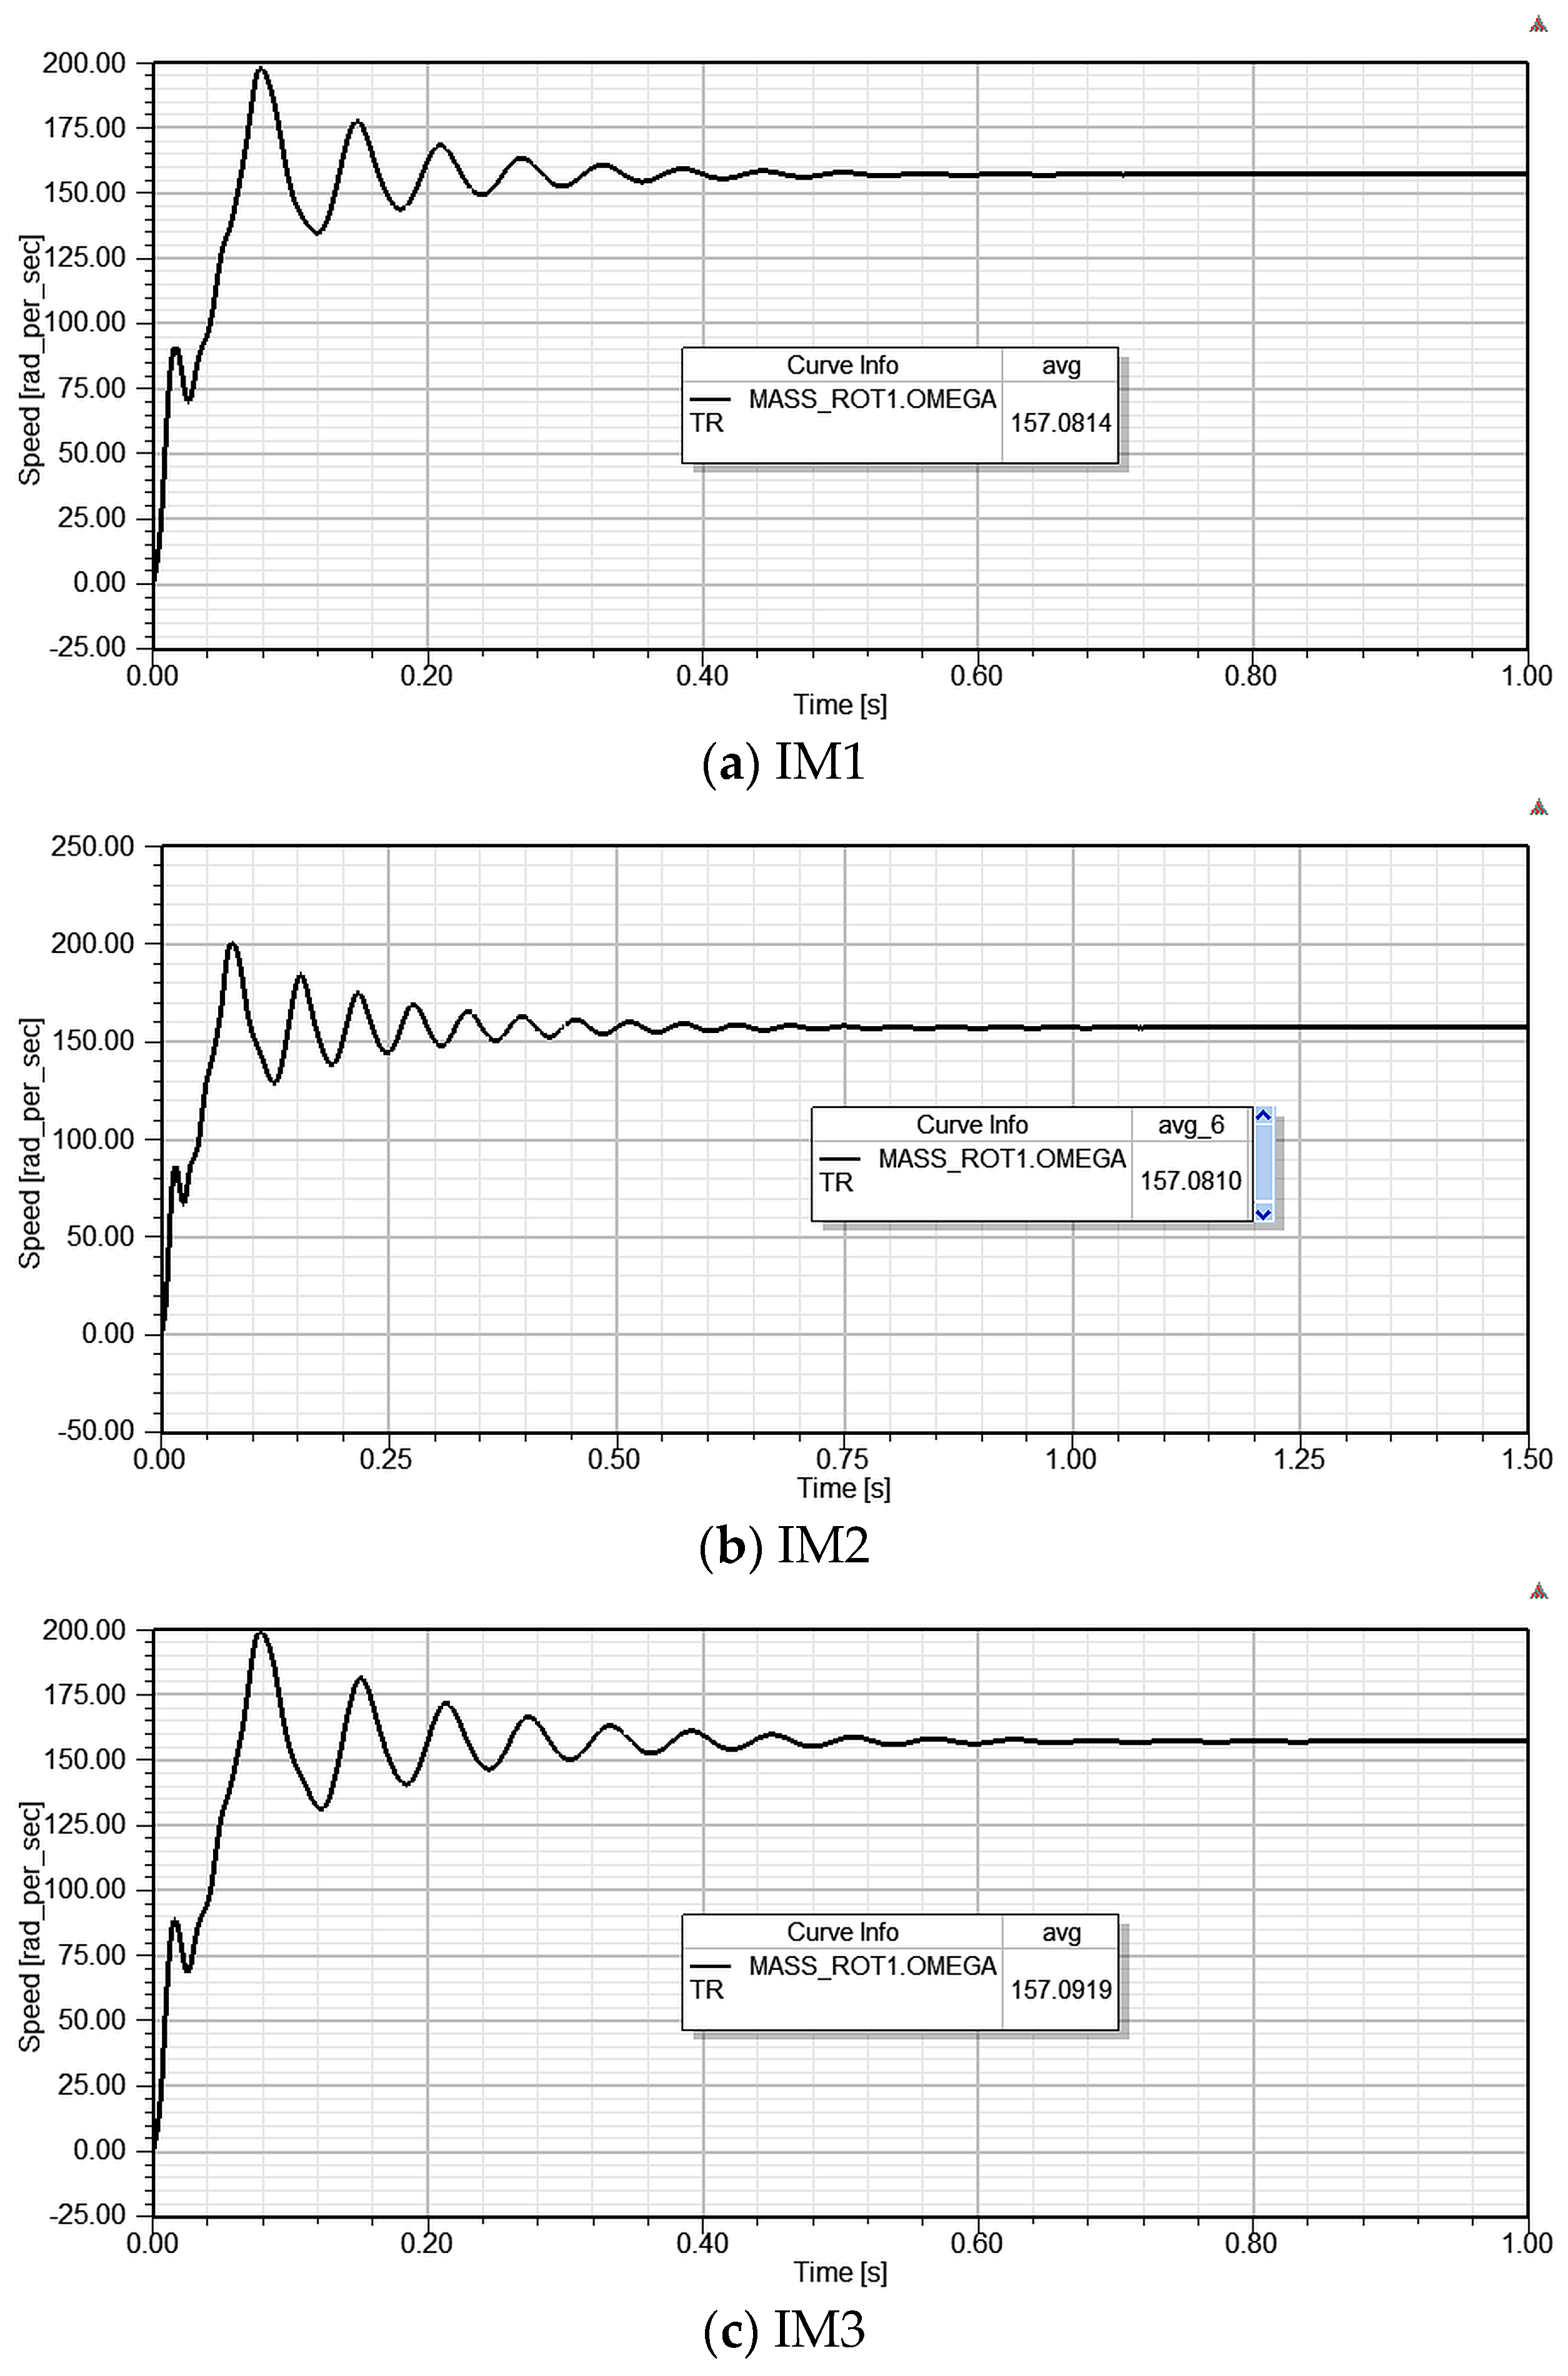
2 are presented in
Figure 2.
From the transient characteristics shown in
Figure 2, it can be concluded that model IM2 requires a longer time to achieve synchronization, i.e., its speed transients are more pronounced. Synchronization is achieved after approximately 1 s. In contrast, models IM1 and IM3 exhibit similar transient responses, i.e., the duration of the transients is shorter and synchronization is achieved more rapidly. Models IM1 and IM3 synchronize with the supply network after approximately 0.8 s. The final synchronous speed is presented in
Figure 2a–c for the final time interval of each model, respectively. Models IM1 and IM3 are selected for the analysis of the transient speed response under variable load conditions due to their better acceleration and synchronization performance under constant load. The transient speed response characteristics of models IM1 and IM3 under a variable load, with a load torque step from 5 Nm to 13.9 Nm at 0.8 s and a total inertia of 0.02 kg·m
2, are presented in
Figure 3.
From
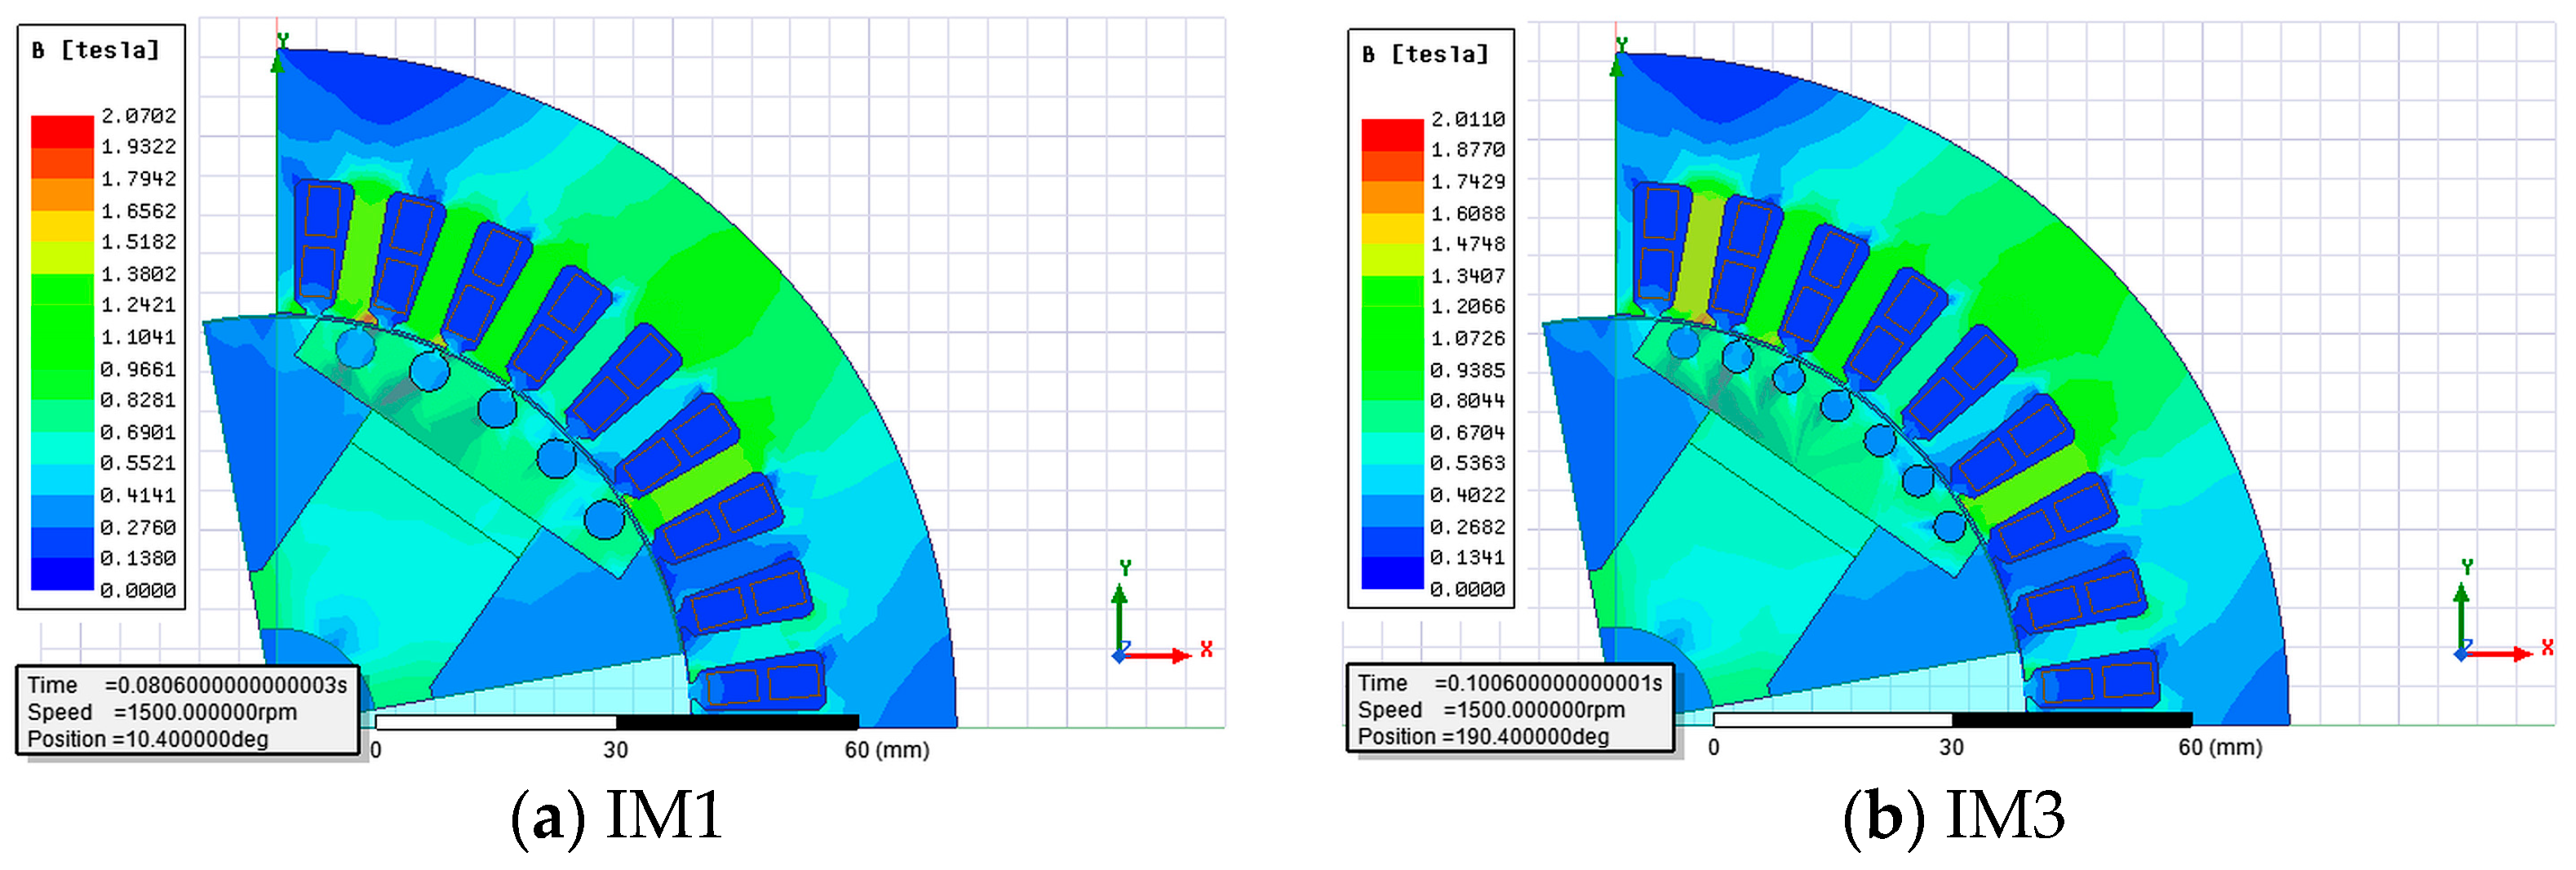
Figure 3, it can be concluded that both models (IM1 and IM3) successfully synchronize with the supply network during starting and acceleration under a load torque of 5 Nm. Following the sudden load change at 0.8 s, when the load torque is increased to 13.9 Nm, both models exhibit oscillations around the synchronous speed. After these oscillations, both models stabilize and regain synchronous operation after approximately 1.1 s. The magnetic flux distribution in the motor cross-section for models IM1 and IM3 is presented in
Figure 4. The flux density distribution is calculated with a mesh of 3868 elements and time step of 0.0002 s, the solver set up is nonlinear residual set to 0.0001, the integration method is Backward Euler and steady-state is set to auto detect with a stop criterion 0.005.
Models IM1 and IM3 exhibit similar transient responses with respect to their synchronization capability.
The starting torque of model IM1 is slightly higher than that of model IM3. Finally, the magnetic flux density distribution is similar in both models, with only small areas of core saturation at the stator teeth. The net motor mass differs only insignificantly among models IM1, IM2, and IM3. Model IM2 exhibits a prolonged synchronization time accompanied by pronounced oscillations around the synchronous speed under constant load operation. Therefore, IM2 is not further analyzed with respect to its transient response under variable load or its magnetic flux density distribution. The foregoing analysis showed that models IM1 and IM3 exhibit similar transient responses and synchronization capabilities. Model IM1 has a slightly higher starting torque than model IM3. Therefore, model IM1 is adopted as the initial model for further optimization using optimetric analysis and the GA to maximize the efficiency. For clarity and ease of interpretation, the parameters and operating characteristics of model IM1 are presented in the next section, where a direct comparison with the optimized model is performed.
3. Optimized Models
Designing electric motors is a challenging task due to the stringent energy efficiency requirements that manufacturers must satisfy. At the same time, motors must remain competitive in terms of both cost and performance. The design process becomes even more complex because numerous design parameters are interdependent, and improving one performance characteristic often leads to the deterioration of another. Consequently, achieving an optimal motor design requires a careful balance between efficiency, performance, manufacturing cost, and other operational characteristics. Motor design software typically incorporates various optimization techniques that enable the development of optimized motor models according to predefined objective functions. In this study, two optimization approaches are applied to the selected motor model, IM1, which was identified as the most suitable candidate for further optimization. The first approach is an optimetric (parametric) analysis, in which four design parameters are varied within predefined limits. Due to the complex rotor construction of an LSSM with salient poles and permanent magnets, several design parameters can be considered for optimization to improve the motor operating characteristics. The effect of the air-gap length is investigated by varying the outer rotor diameter. By varying the outer rotor diameter within the ranges specified in
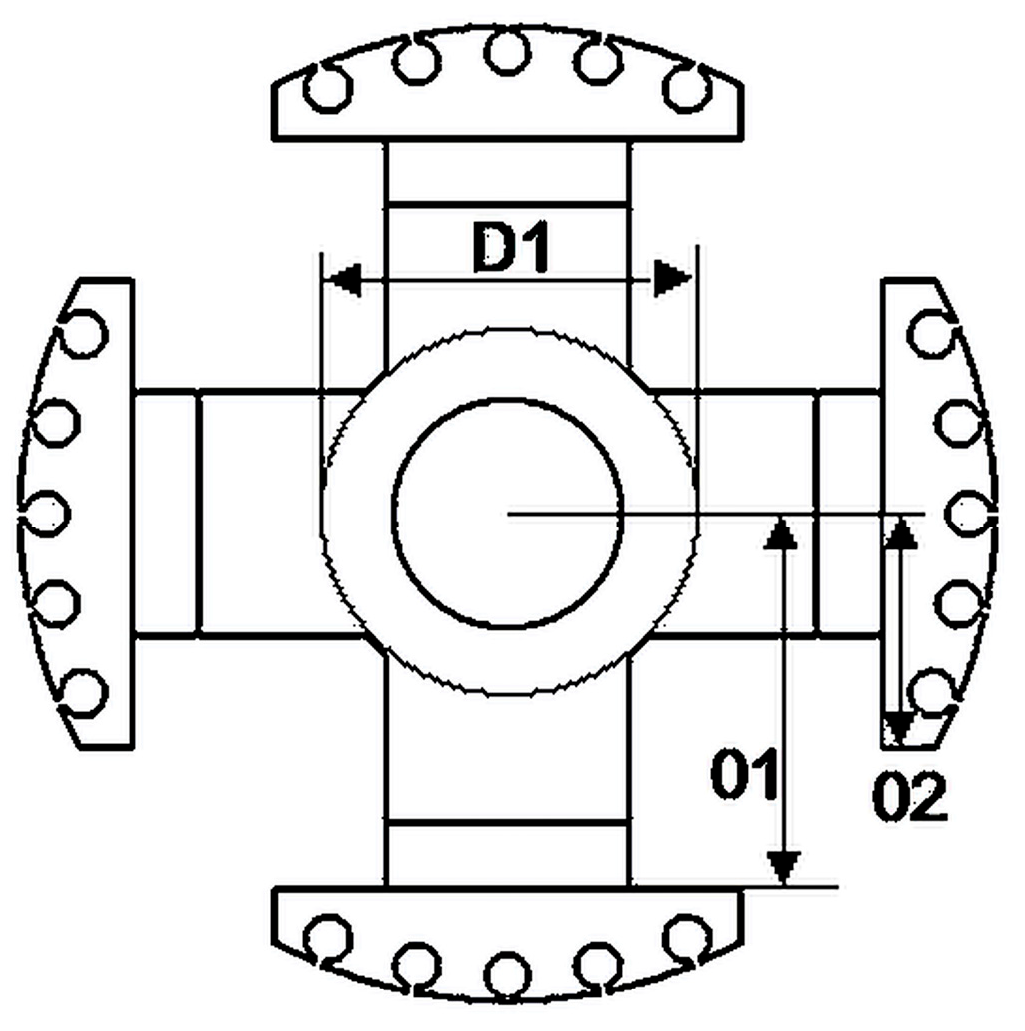
Table 4, the air-gap length is varied from 0.4 to 0.6 mm. Thus, the influence of the air-gap length as an optimization variable is evaluated indirectly through the outer rotor diameter. Permanent magnets play an important role in the starting and synchronization processes of the motor. Therefore, the magnet thickness is selected as an optimization variable. The magnet length is related to the pole width, pole length, and pole-shoe thickness. Moreover, the outer rotor diameter limits the available space for the pole and pole-shoe dimensions, particularly for the O1 dimension shown in
Figure 5. In the IM1 model, which is used as the initial model for optimization, the O1 dimension is set to 40 mm, corresponding to the maximum available space for accommodating the rotor slot depth. Reducing O1 allows the magnet length and pole-shoe thickness to be increased. However, decreasing O1 in the IM1 model does not initially result in a significant improvement in efficiency. The other rotor dimensions shown in
Figure 5 are O2 = 25 mm and D1 = 40 mm.
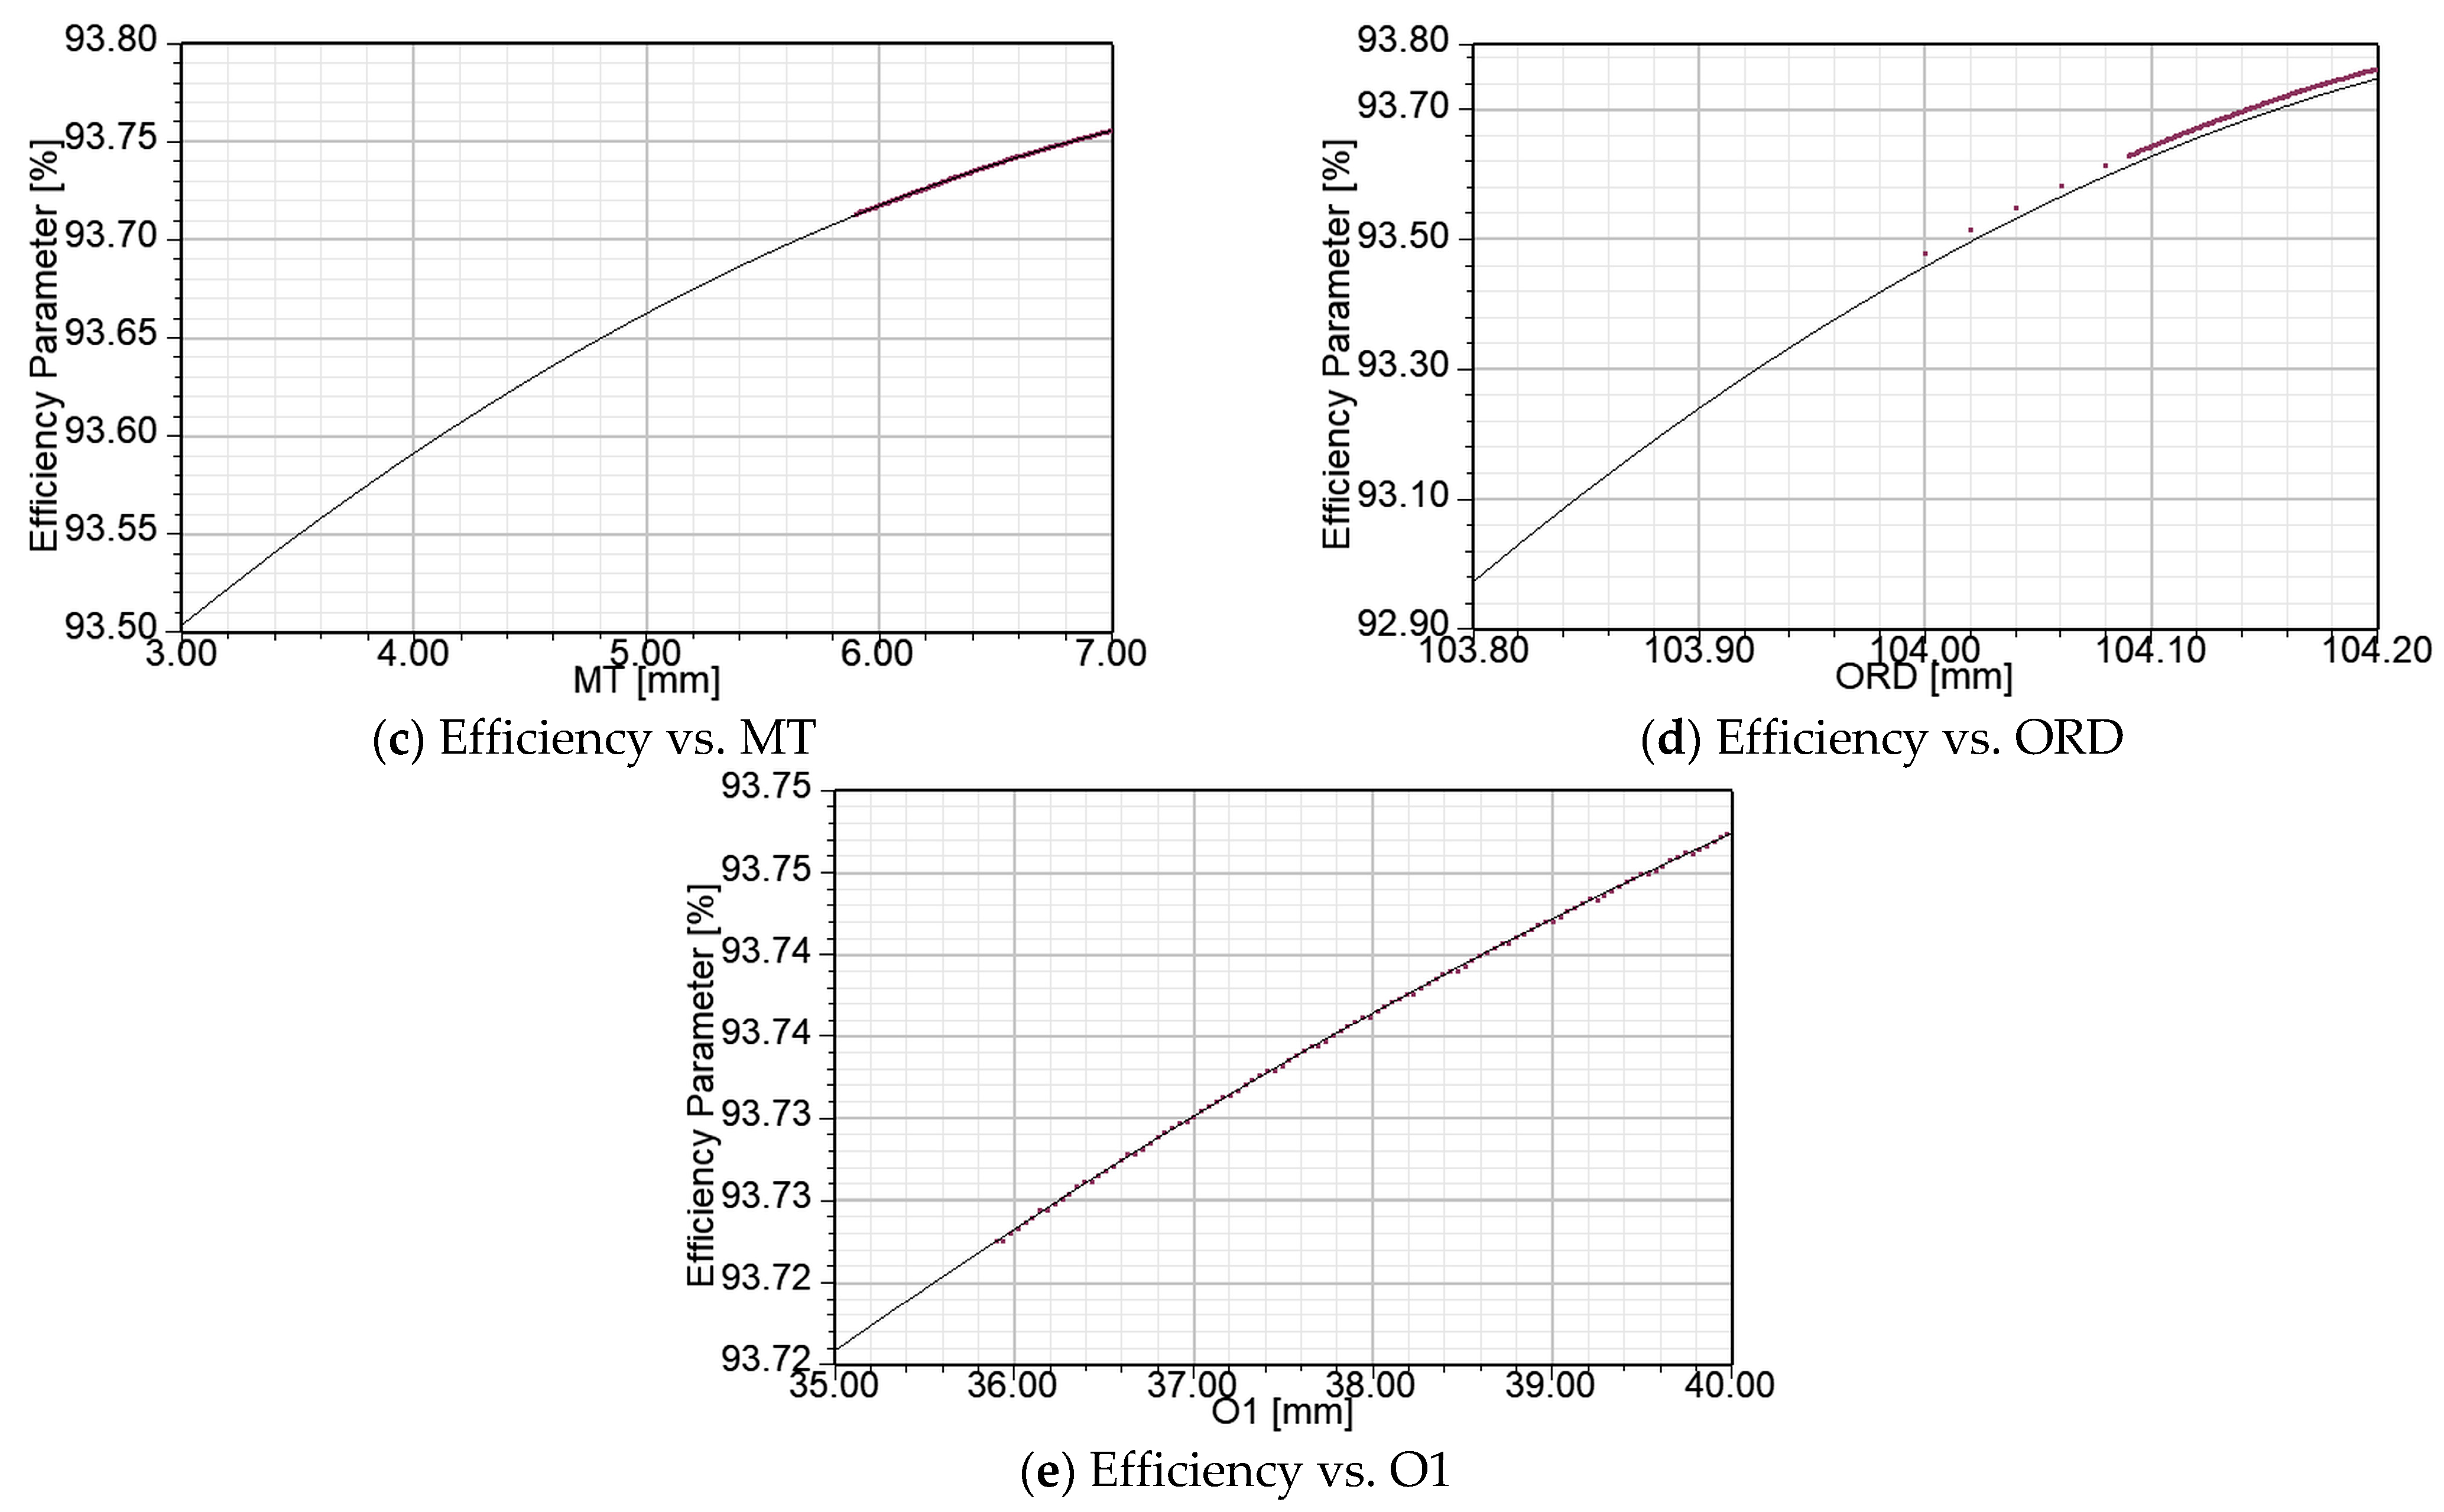
In order to determine the impact of the design parameters on motor efficiency, a sensitivity analysis was performed for five parameters: the number of conductors per slot (CPS), magnet thickness (MT), outer rotor diameter (ORD), machine length (ML), and pole height (O1). The obtained results are presented in
Figure 6. The sensitivity analysis indicates that CPS has the most significant impact on efficiency, followed by ORD, which determines the air-gap length. The O1 parameter, which affects the magnet length, has the smallest impact on efficiency. Therefore, four parameters—CPS, ML, MT, and ORD—were selected for further optimization.
The variation ranges of four parameters selected for optimization are summarized in
Table 4.
The range of variation of MT is selected by considering several operating characteristics of the LSSM with salient poles and permanent magnets, including transient behavior, i.e., motor starting and synchronization with the grid, pole-tip saturation, and the increase in permanent magnet mass and, consequently, manufacturing costs. Although thicker permanent magnets can increase motor efficiency, they also contribute to the braking torque during motor start-up, which may prevent the motor from reaching synchronous speed or maintaining synchronous operation following sudden load changes. Although motor efficiency generally increases with magnet thickness, the risk of unsuccessful starting or synchronization with the grid also increases. Increasing the magnet thickness may lead to saturation of the pole tips; therefore, each optimized design, particularly those with magnet thicknesses near the upper limit of the considered range, should be verified using FEM analysis for magnetic flux density distribution. Finally, the economic implications of using thicker permanent magnets should also be considered, as increased magnet volume directly contributes to higher manufacturing costs. The cost of the permanent magnets can increase the overall motor production cost, although higher magnet thickness may improve motor efficiency. Therefore, an economic assessment should be performed for the optimized model by comparing the energy savings resulting from the efficiency improvement with the increased material cost and the corresponding payback period. Based on the considerations discussed above, the upper limit for MT is set to 7 mm. The upper limit for ORD is set to 104.2 mm, corresponding to an air-gap length of 0.4 mm. Although a reduced air-gap length contributes to increased motor efficiency, manufacturing constraints and the required machining tolerances should also be taken into consideration. During line starting, the rotor cage draws high asynchronous inrush currents, resulting in significant transient mechanical vibrations and thermal stresses. An air-gap length of 0.4 mm provides very limited clearance for rotor dynamic movement during motor start-up and operation. Therefore, high manufacturing precision is required to ensure the specified air-gap length and prevent the risk of rotor–stator contact. Based on these considerations, the upper limit of ORD is set to 104.2 mm. The ranges of variation for CPS should be determined by considering the slot fill factor. As stated in [
35], in typical applications, copper conductors account for approximately 65% of the slot area, while the remaining space is occupied by insulation and air gaps. According to [
35], higher slot fill factors are desirable, particularly in applications where high power density is required. However, increasing the slot fill factor also increases manufacturing complexity and cost and may increase the risk of manufacturing and quality-related issues. Decreasing the number of CPS requires thicker wire to fill the available slot area. This reduces the stator winding resistance and, consequently, the copper losses under load; therefore, motors with a higher slot fill factor tend to achieve higher efficiency. However, increasing the slot fill factor introduces several manufacturing challenges that must be addressed. As the slot fill factor increases, less space is available for insulation, requiring the selection of thinner yet sufficiently durable insulation materials. In addition, the conductor shape may need to be considered. Rectangular or square conductors can be used instead of round wires because they can be packed more efficiently, reducing the gaps between individual conductors and enabling higher slot fill factors. According to [
35], for motors manufactured in large volumes, where production cost and manufacturing speed are critical factors, a slot fill factor of 60–70% is typical. In contrast, for custom-designed motors used in high-performance applications, where performance is prioritized over cost, slot fill factors of 80% or higher may be achievable through advanced manufacturing techniques, such as compression winding and segmented stator construction. Considering the increased manufacturing complexity associated with higher slot fill factors, the CPS variation range is limited to 45–55. The preliminary computational results indicate that the optimized model with CPS = 45 achieves a slot fill factor of approximately 73%, which may require a more complex stator winding manufacturing process. In contrast, the initial model IM1 has a slot fill factor of 65%, which can be more readily achieved using standardized materials and conventional winding tools. Another important aspect to consider when determining the CPS variation range is the effect of the number of conductors on the starting performance of the motor. Reducing the number of stator conductors decreases the stator magnetomotive force and air-gap flux for a given starting current. Consequently, the induced starting and accelerating torque produced by the rotor cage are reduced, resulting in weaker locked-rotor performance. This may impair the motor’s ability to accelerate high-inertia loads from standstill. The range of variation of the core length is set from 105 to 113 mm. Increasing the stack length generally improves the steady-state efficiency. However, a longer stack length also increases the rotor inertia, which can adversely affect asynchronous starting and pull-in synchronization under load. Therefore, the effect of stack length on the transient performance of the motor should also be considered. In addition, the motor mounting frame must be taken into account when defining the feasible range of the core length. For motors rated between 2.2 and 4 kW, the standard mounting frame, according to the IEC frame size reference table, is 100L [
36]. For standard or compact two- and four-pole motor designs, the axial stack length is typically in the range of 110–120 mm for a 100L frame size. Increasing the stack length can increase the core losses, including eddy-current and hysteresis losses, which may offset the efficiency improvement if the core becomes excessively long. Furthermore, an increased core length alters the direct- and quadrature-axis inductances, while the saliency ratio tends to decrease with increasing stack length. This reduces the reluctance torque component and, consequently, the pull-in torque, making synchronization with the supply network more difficult. Considering these factors, the upper limit of the stack length is set to 113 mm. The performance characteristics are calculated for each combination of the four design parameters. According to the designer’s selected objectives, the corresponding performance characteristics are provided as output of the optimization procedure. The optimetric analysis generated a total of 2475 different motor models. The number of generated models depends on the variation ranges of the selected optimization parameters (
Table 4), as each combination of parameter values represents a distinct motor model. The variation ranges were defined based on manufacturing and physical constraints, as well as the feasibility of manufacturing the simulated designs. These constraints include the air-gap length, maximum slot fill factor, transient behavior during motor starting, and the braking torque generated by excessively thick permanent magnets during starting. Extending the variation ranges of the optimization parameters would result in a substantially larger number of motor models, which may not be justified considering the computational effort and the subsequent physical realization of the optimized prototype. Based on the highest efficiency (η), eight models denoted as OM1–OM8 were selected for further analysis. Their performance characteristics, monitored during the optimization procedure, including the power factor (cosφ), starting torque (M
s), motor net mass (m), maximum power (P
max) and line current I
1, are presented in
Table 5. All data reported in
Table 5 correspond to the rated operating conditions.
The optimized models OM1–OM6 exhibit the same efficiency of 93.74%. However, they differ significantly in their other operating characteristics. The starting torque ranges from 36.20 to 38.34 Nm, the power factor varies between 0.977 and 0.990, and the motor net mass ranges from 15.36 to 15.87 kg. The optimized models OM7 and OM8 exhibit the same efficiency of 93.76%, while their remaining performance characteristics, summarized in
Table 5, are also very similar. As can be observed from the optimization results presented in
Table 5, more than one motor model satisfies the objective of maximizing efficiency. This finding indicates that multiple combinations of design parameters can yield nearly identical optimal efficiency. However, the motor net mass, and consequently the estimated production cost, varies more significantly among the optimized models. For example, model OM1 has a net mass of 15.36 kg, whereas model OM7 has a net mass of 15.92 kg. Despite this difference, the efficiency of the two models differs only marginally, with values of 93.74% for OM1 and 93.76% for OM7. Therefore, the optimetric analysis enables a comprehensive assessment of multiple performance characteristics, facilitating the selection of an optimal motor design based on both technical performance and manufacturing considerations. The eight optimized motor models were selected based on their highest efficiency values. The selection was performed by evaluating all 2475 generated motor models and identifying those with the highest efficiency. However, this selection approach may be subject to a degree of subjective bias, as it depends on the designer’s evaluation and decision-making process. The parametric scan provides numerous motor models with their corresponding operating characteristics. The operating characteristics to be presented in the output results for the different motor models are selected during the setup of the parametric analysis. In the present analysis, for each of the 2475 distinct motor models, the efficiency, current, power factor, starting torque, motor net mass, and maximum power were calculated and presented simultaneously with the efficiency. Based on the designer’s experience and application-specific requirements, the most suitable candidate can be selected by considering the relevant operating parameters. In the present analysis, the selection is based on the highest efficiency. However, the output results of the parametric analysis also provide the possibility of evaluating other operating parameters, which are simultaneously calculated and presented together with the efficiency. The evaluation and selection of the generated models as the best candidates from the parametric analysis are performed by the designer. The program does not automatically select the best candidate based on predefined operating parameters. Since this selection process may be prone to subjective errors, GA optimization was performed to verify the accuracy of the model selection presented in
Table 5. Moreover, GA is a stochastic global optimizer. It evaluates a population of designs across multiple generations, providing major advantages over traditional local or gradient-based optimetrics methods (like Sequential Quadratic Programming). By evaluating many points at once, GA maps out multiple regions of the search space simultaneously. Therefore, the optimization was repeated using the same design variables and variation ranges, but with the application of GA to maximize the motor efficiency automatically. The optimized model obtained using the GA is denoted as GA-OM, and its performance characteristics are presented in
Table 6. All data reported in
Table 6 correspond to the rated operating conditions. The optimization results obtained using the GA confirm the findings of the optimetric analysis. The GA-optimized model (GA-OM) achieved an efficiency of 93.757%, which is in close agreement with the efficiency of 93.76% obtained for models OM7 and OM8, which exhibited the highest efficiency among the models evaluated in the optimetric analysis. It should be noted, however, that the optimized design parameters listed in
Table 6 should be rounded to practical manufacturing values before implementation. After rounding the parameters to CPS = 46, MT = 7 mm, ORD = 104.2 mm, and ML = 113 mm, the corresponding motor performance characteristics become: η = 93.72%, cosφ = 0.99, M
s = 35.99 Nm, m = 15.99 kg, P
max = 10.4 kW and I
1 = 6.16 A. The GA optimization results confirm the findings of the parametric analysis, with nearly identical efficiency values obtained for the GA-optimized model (93.757%) and the OM7 and OM8 models identified through the parametric scan (93.76%).
However, the GA optimization yielded the following design parameters: CPS = 45.9, MT = 6.86 mm, ORD = 104.196 mm, and ML = 112.83 mm. Rounding these parameters to feasible manufacturing dimensions may result in a slightly lower efficiency than that obtained from the parametric analysis. In particular, the main difference between the rounded GA-OM model and the OM7 model is the number of CPS, which is 46 for the GA-OM model and 45 for OM7, which resulted in a difference of one watt in copper losses. This difference results in a small reduction in motor efficiency, from 93.76% for OM7 to 93.72% for the rounded GA-OM model. The rounding of optimized variables from GA resulted in a 0.6 W difference in copper losses compared with the GA-OM model with not rounded values of the optimized parameters that decreased the efficiency from 93.757% to 93.72%. These results highlight the importance of carefully evaluating the optimized models obtained using different optimization techniques.
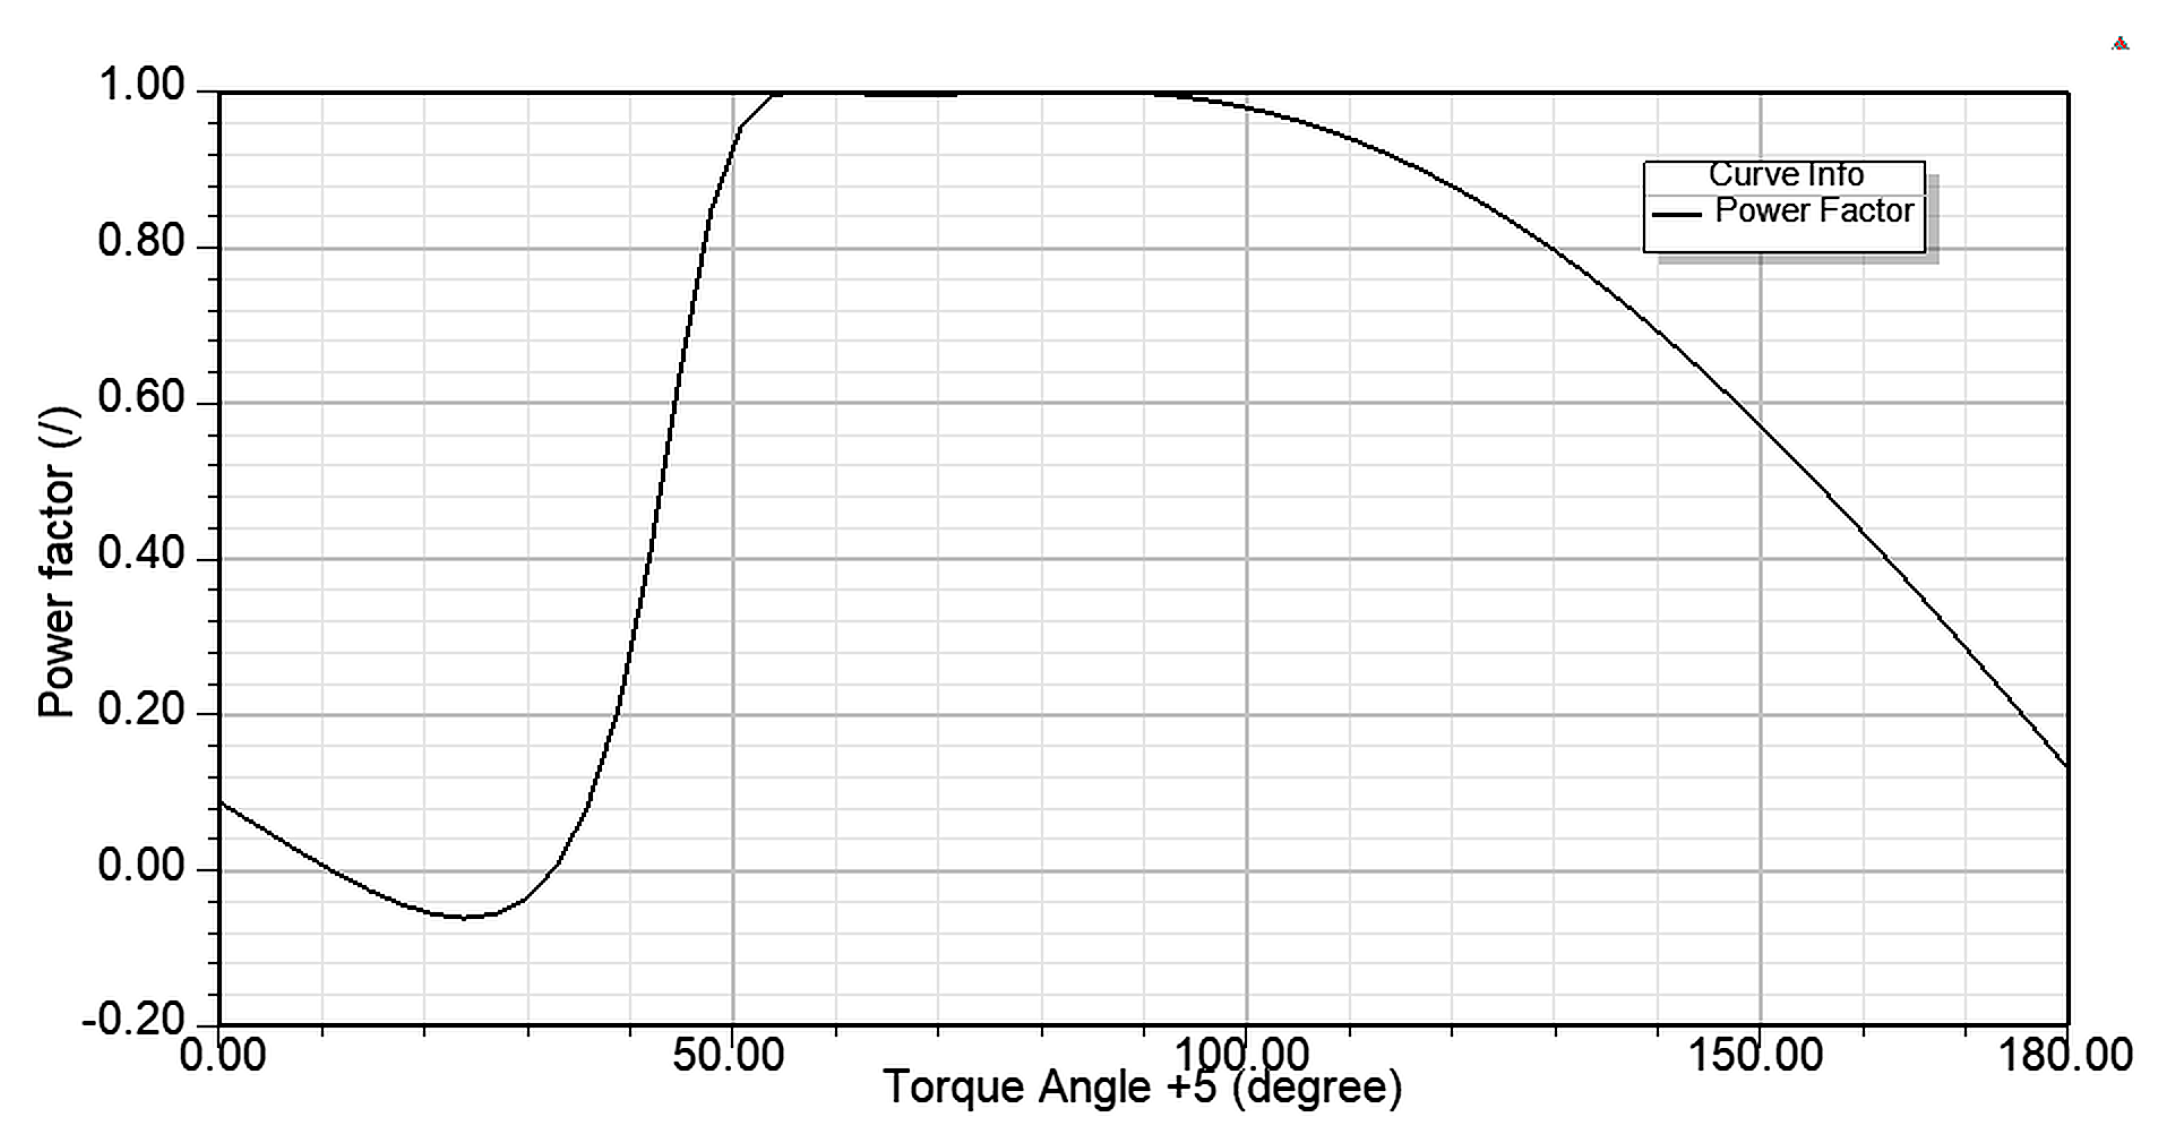
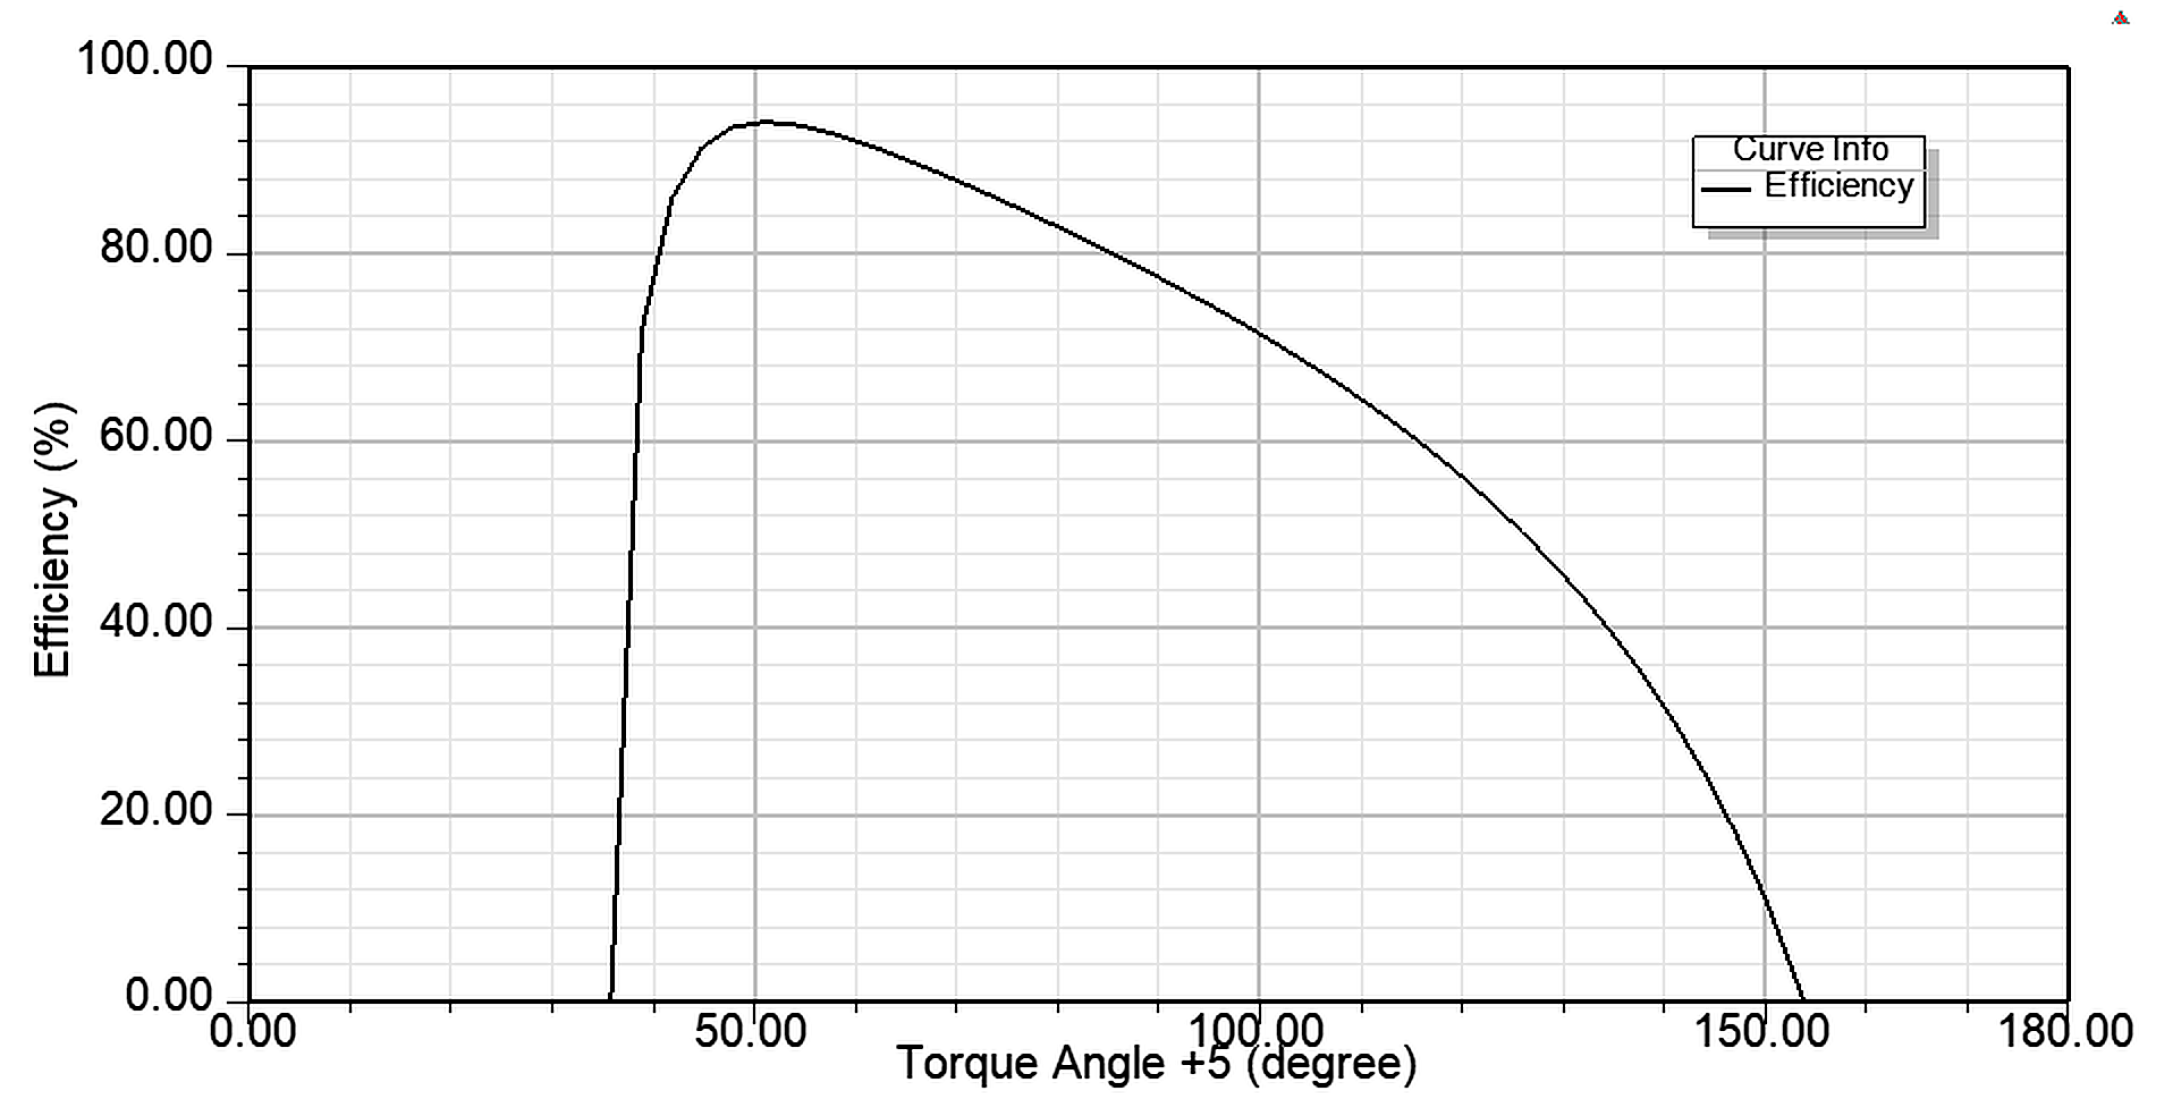
Figure 7 presents the efficiency of the GA-OM model, while
Figure 8 shows its power factor. The results presented in
Figure 7 and
Figure 8 are consistent with the data reported in
Table 6, thereby confirming the performance characteristics of the optimized model by GA. Finally, based on the highest efficiency combined with the best power factor, model OM7 was selected as the optimal design. As discussed previously, a comprehensive evaluation of the overall motor performance, rather than efficiency alone, indicates that model OM1 represents a highly attractive design, combining high efficiency, low net mass, high power factor, and high starting torque (
Table 5). Nevertheless, since the optimization criterion was defined as the maximization of efficiency, model OM7 was selected as the optimal model. Although model OM8 exhibits the same efficiency, model OM7 was preferred because it provides a more favorable overall performance considering the power factor as well.
Figure 7.
Efficiency of GA-OM model.
Figure 7.
Efficiency of GA-OM model.
Figure 8.
Power factor of GA-OM model.
Figure 8.
Power factor of GA-OM model.
A comparison between the initial model (IM1) and the optimized model (OM7) is presented in
Table 7. All models employ the same materials, namely copper for the stator winding, cast aluminum for the damper winding, SmCo28 permanent magnets, and M19-24G electrical steel laminations. As shown in
Table 7, the optimized model exhibits lower copper losses due to the slight reduction in the stator current and the decreased armature resistance. Owing to the increased stack length, the core losses are marginally higher in model OM7.
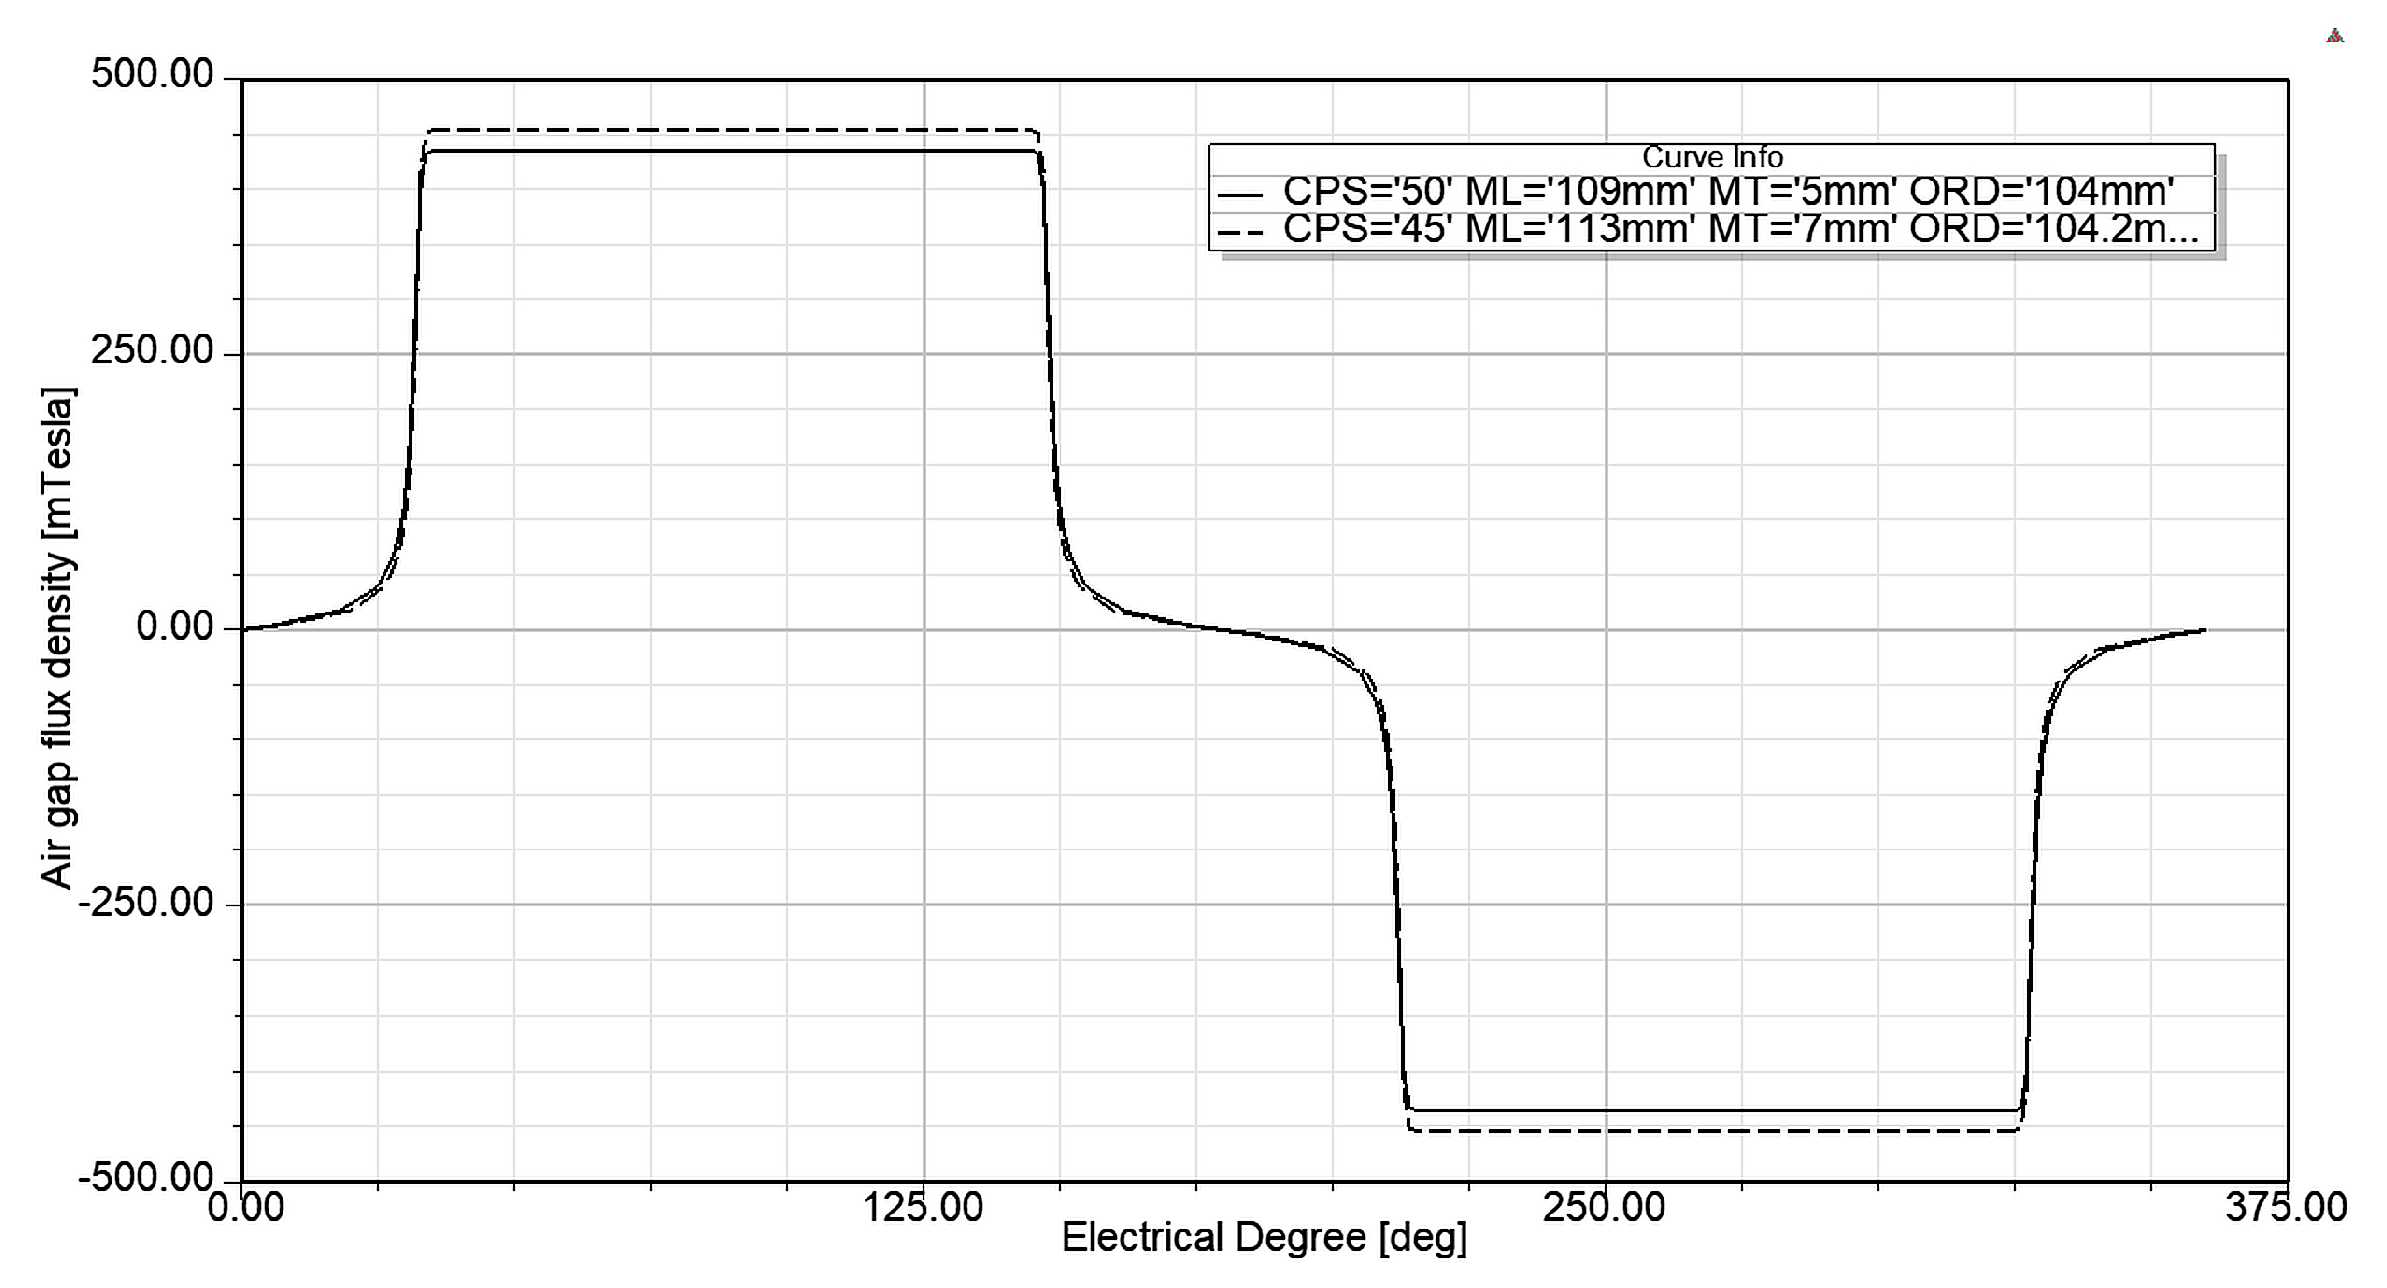
However, it should be noted that model OM7 employs thicker permanent magnets than model IM1. Increasing the magnet thickness strengthens the air-gap magnetic flux density, increases the back electromotive force (back-EMF), reduces the stator current required to produce a given torque, and consequently decreases the copper losses. A comparison of the no-load air-gap flux density distributions for models IM1 and OM7 is presented in
Figure 9.
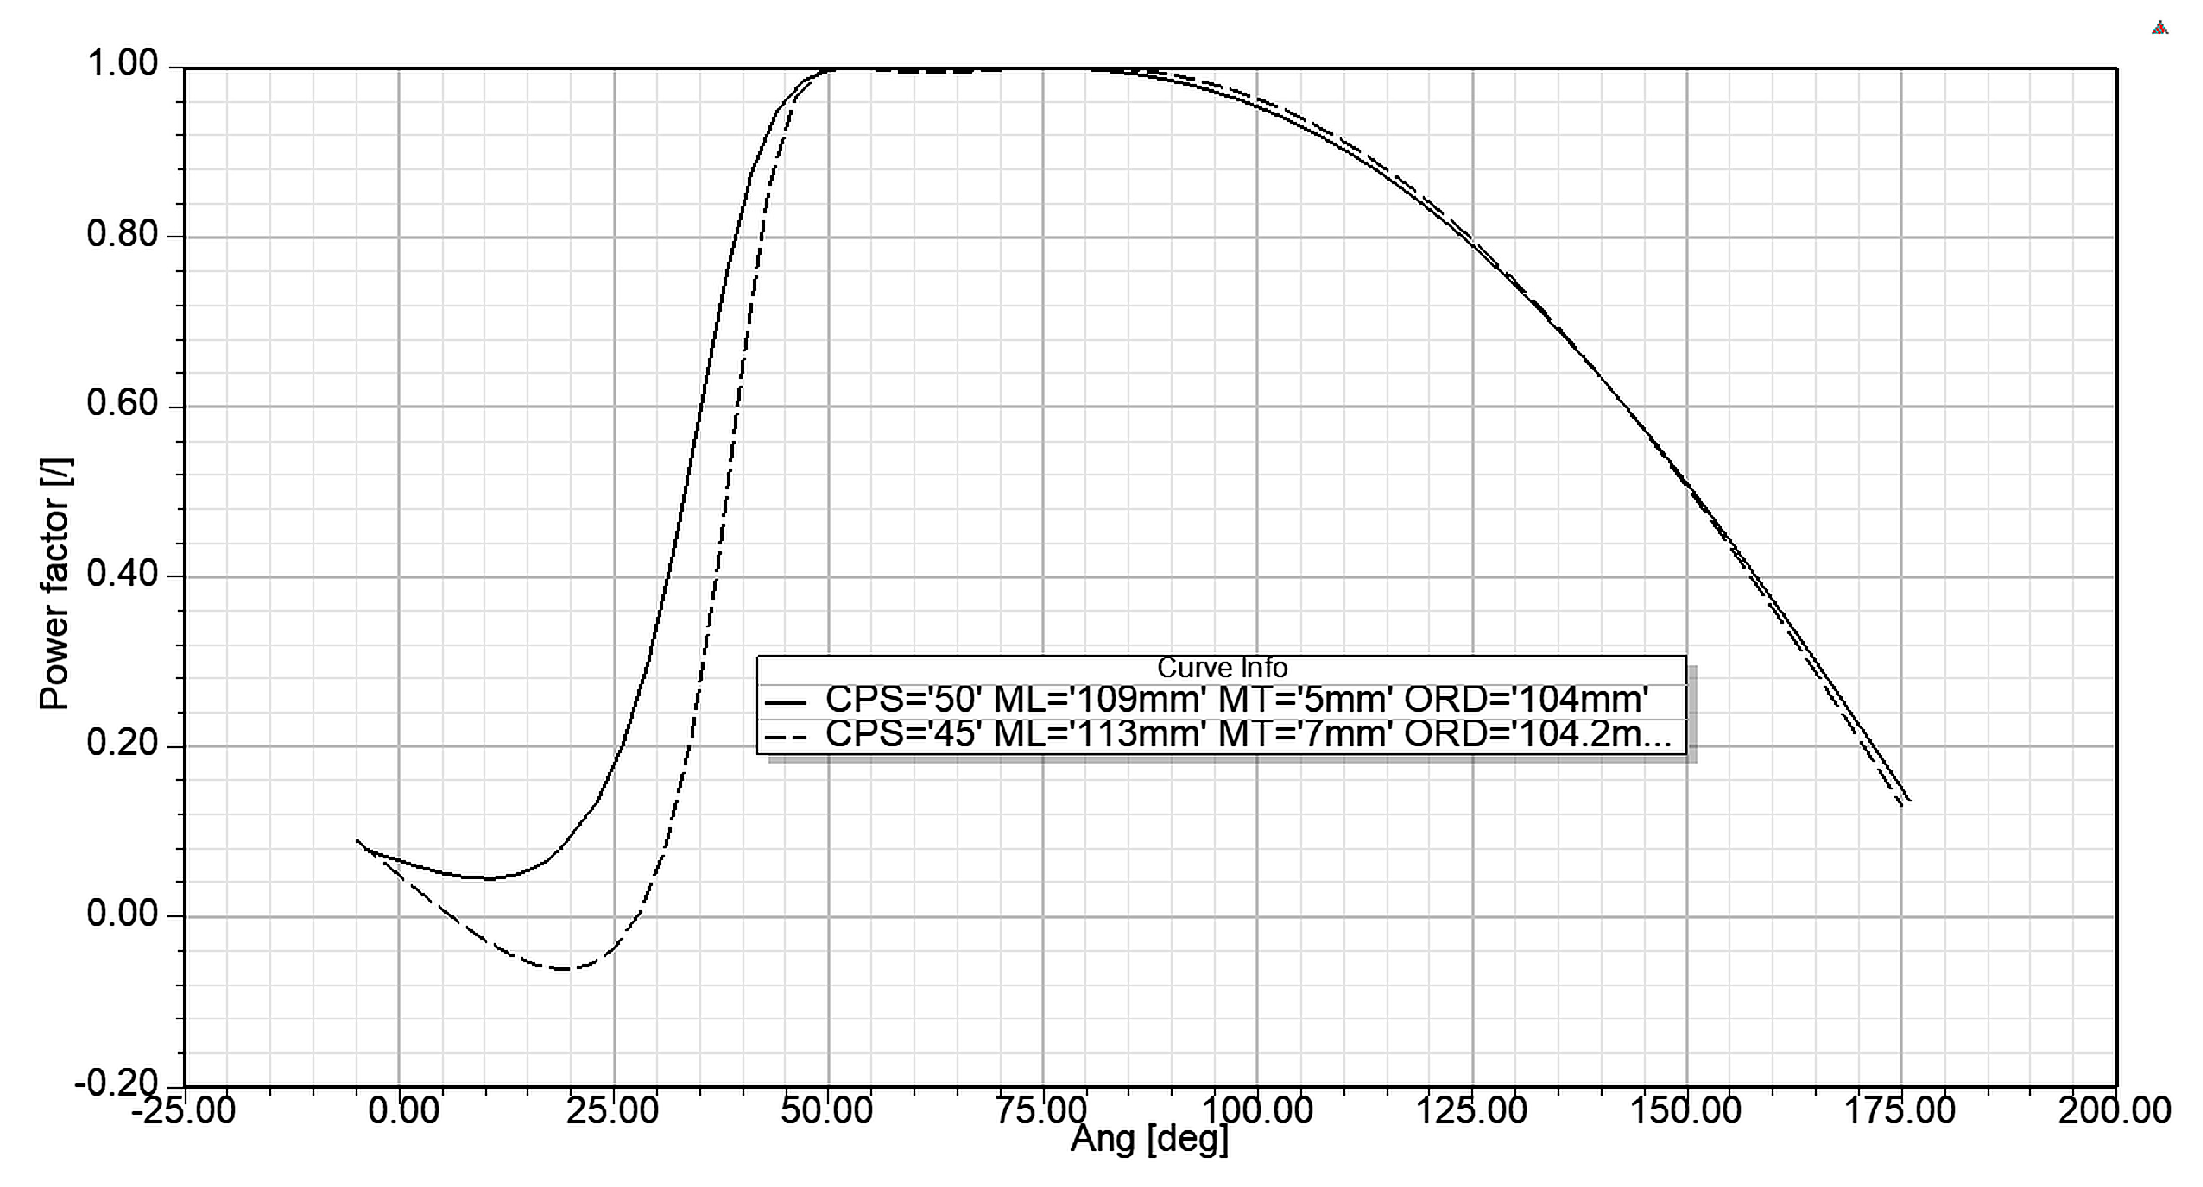
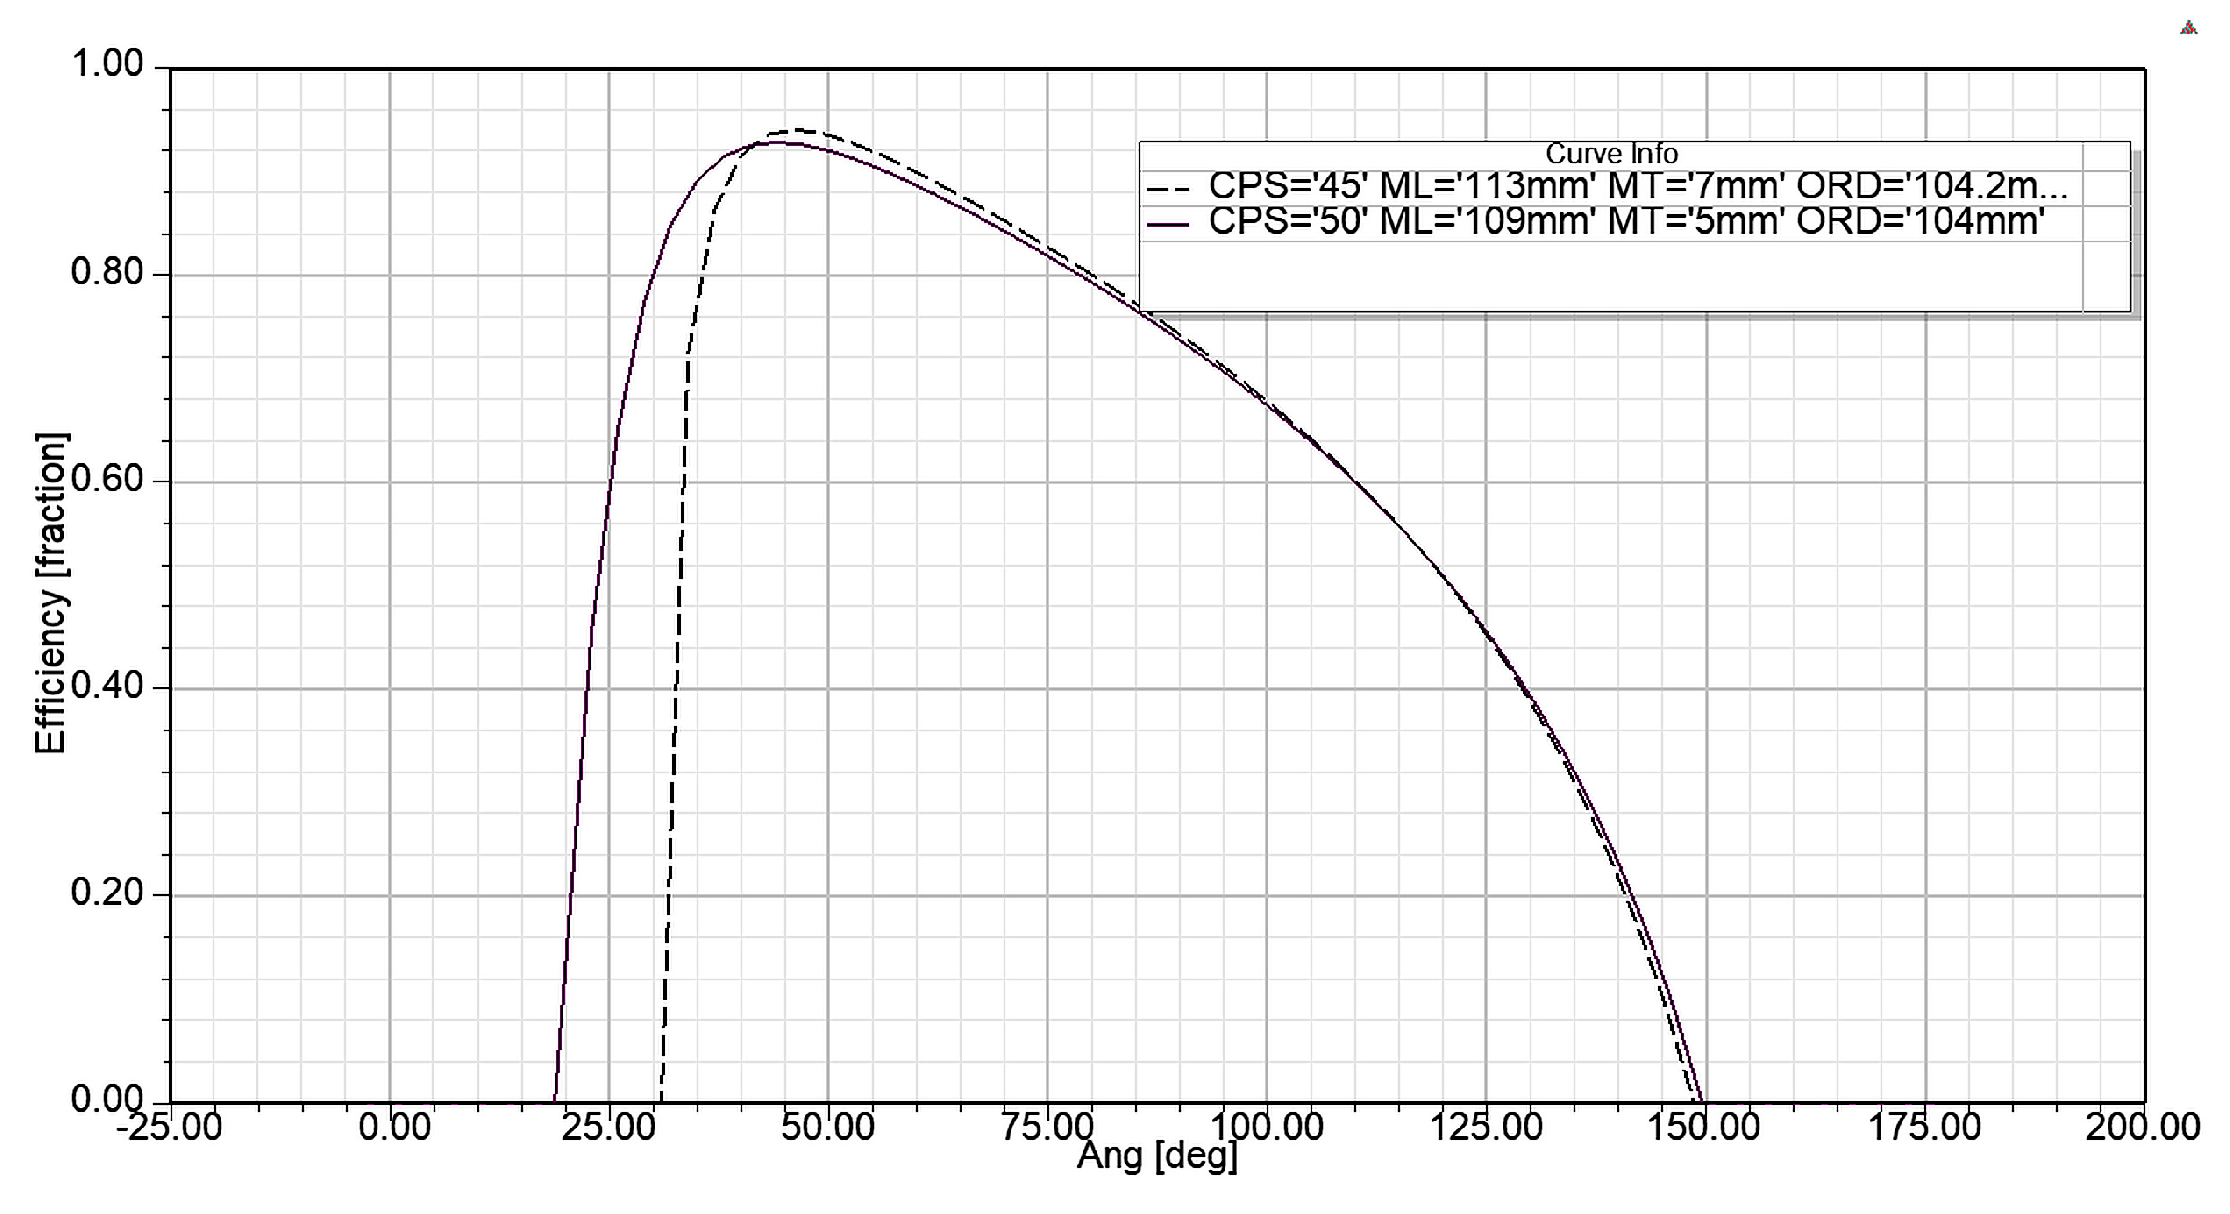
The efficiency and power factor of models IM1 and OM7 are presented in
Figure 10 and
Figure 11, respectively. For each model, the efficiency and power factor can be determined as a function of the torque angle, enabling a direct comparison of their operating performance. The results presented in
Figure 10 and
Figure 11 are consistent with the data reported in
Table 7, thereby validating the performance characteristics of the optimized model.
Figure 10.
Efficiency of models IM1 and OM7.
Figure 10.
Efficiency of models IM1 and OM7.
Figure 11.
Power factor of models IM1 and OM7.
Figure 11.
Power factor of models IM1 and OM7.
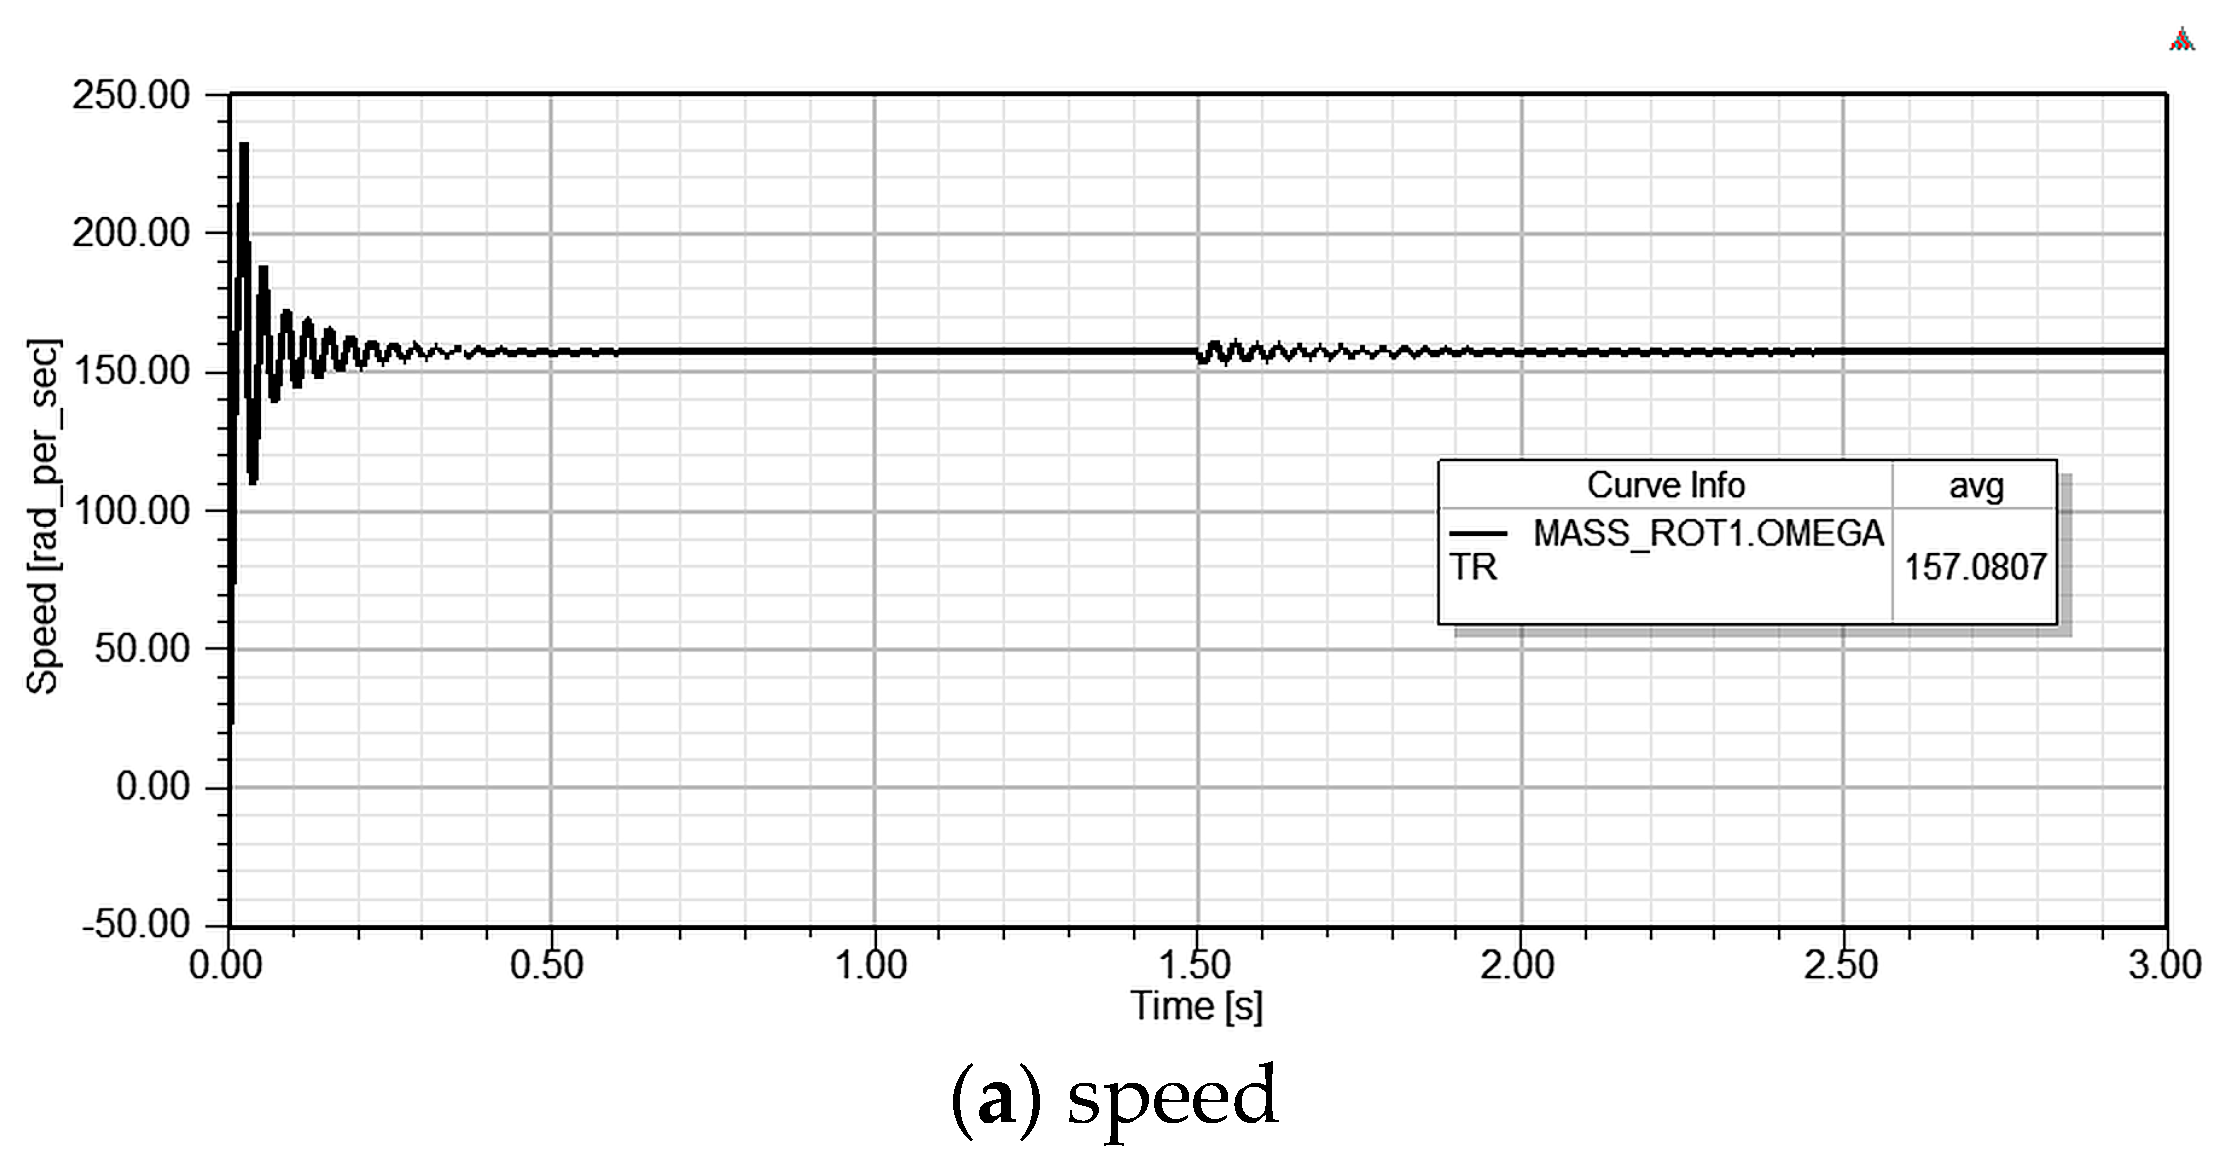
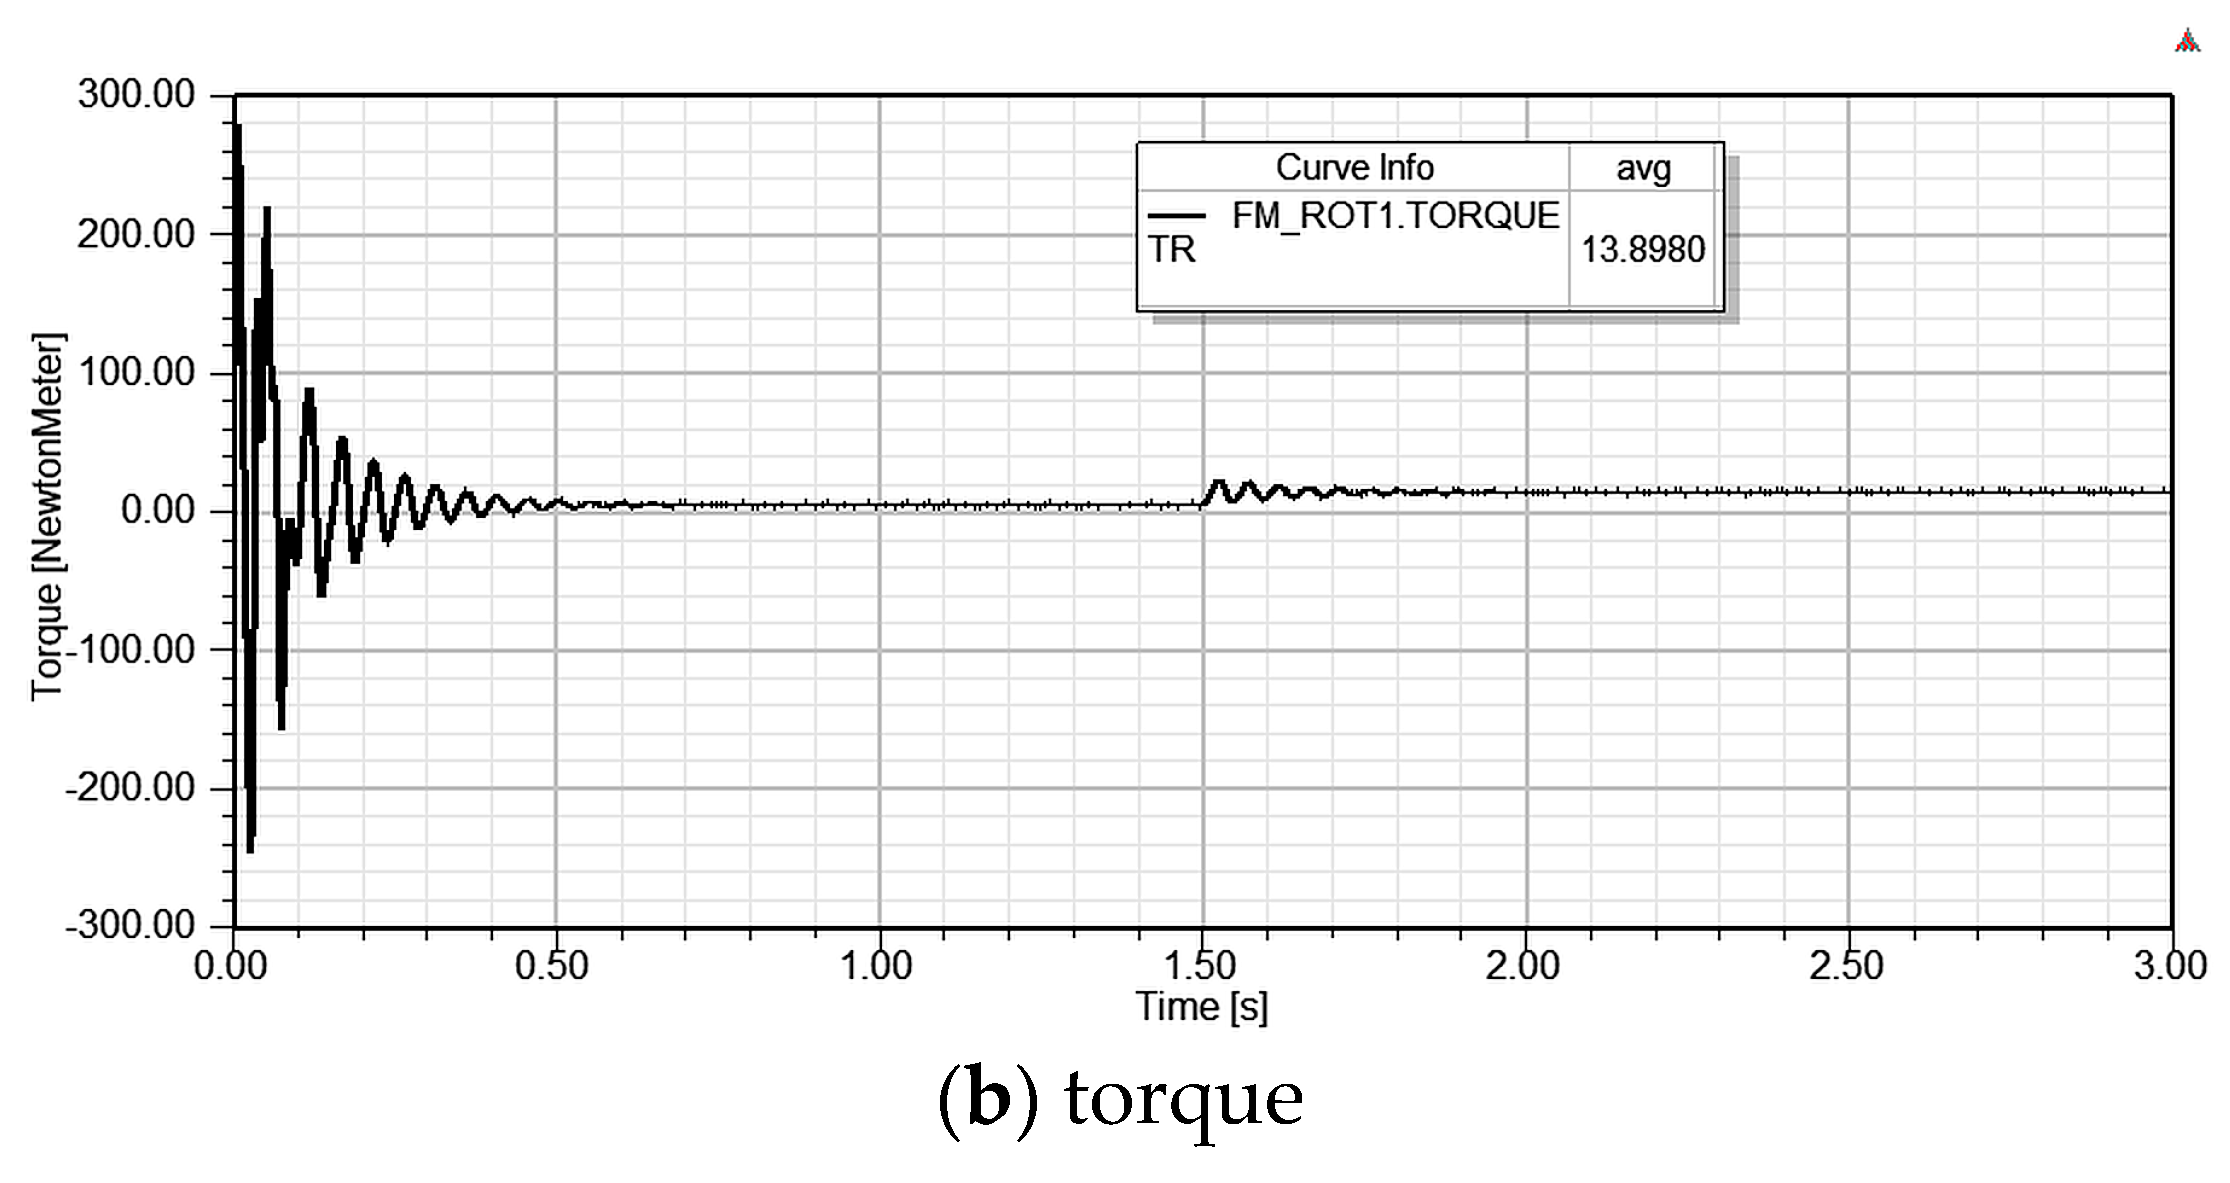
The transient response of model OM7 was analyzed under two operating conditions: (i) a constant load torque of 13.9 Nm with a moment of inertia of 0.02 kg·m
2, and (ii) a variable load torque of 5 Nm, followed by a step increase to 13.9 Nm at (t = 1.5) s, with the same moment of inertia of 0.02 kg·m
2.
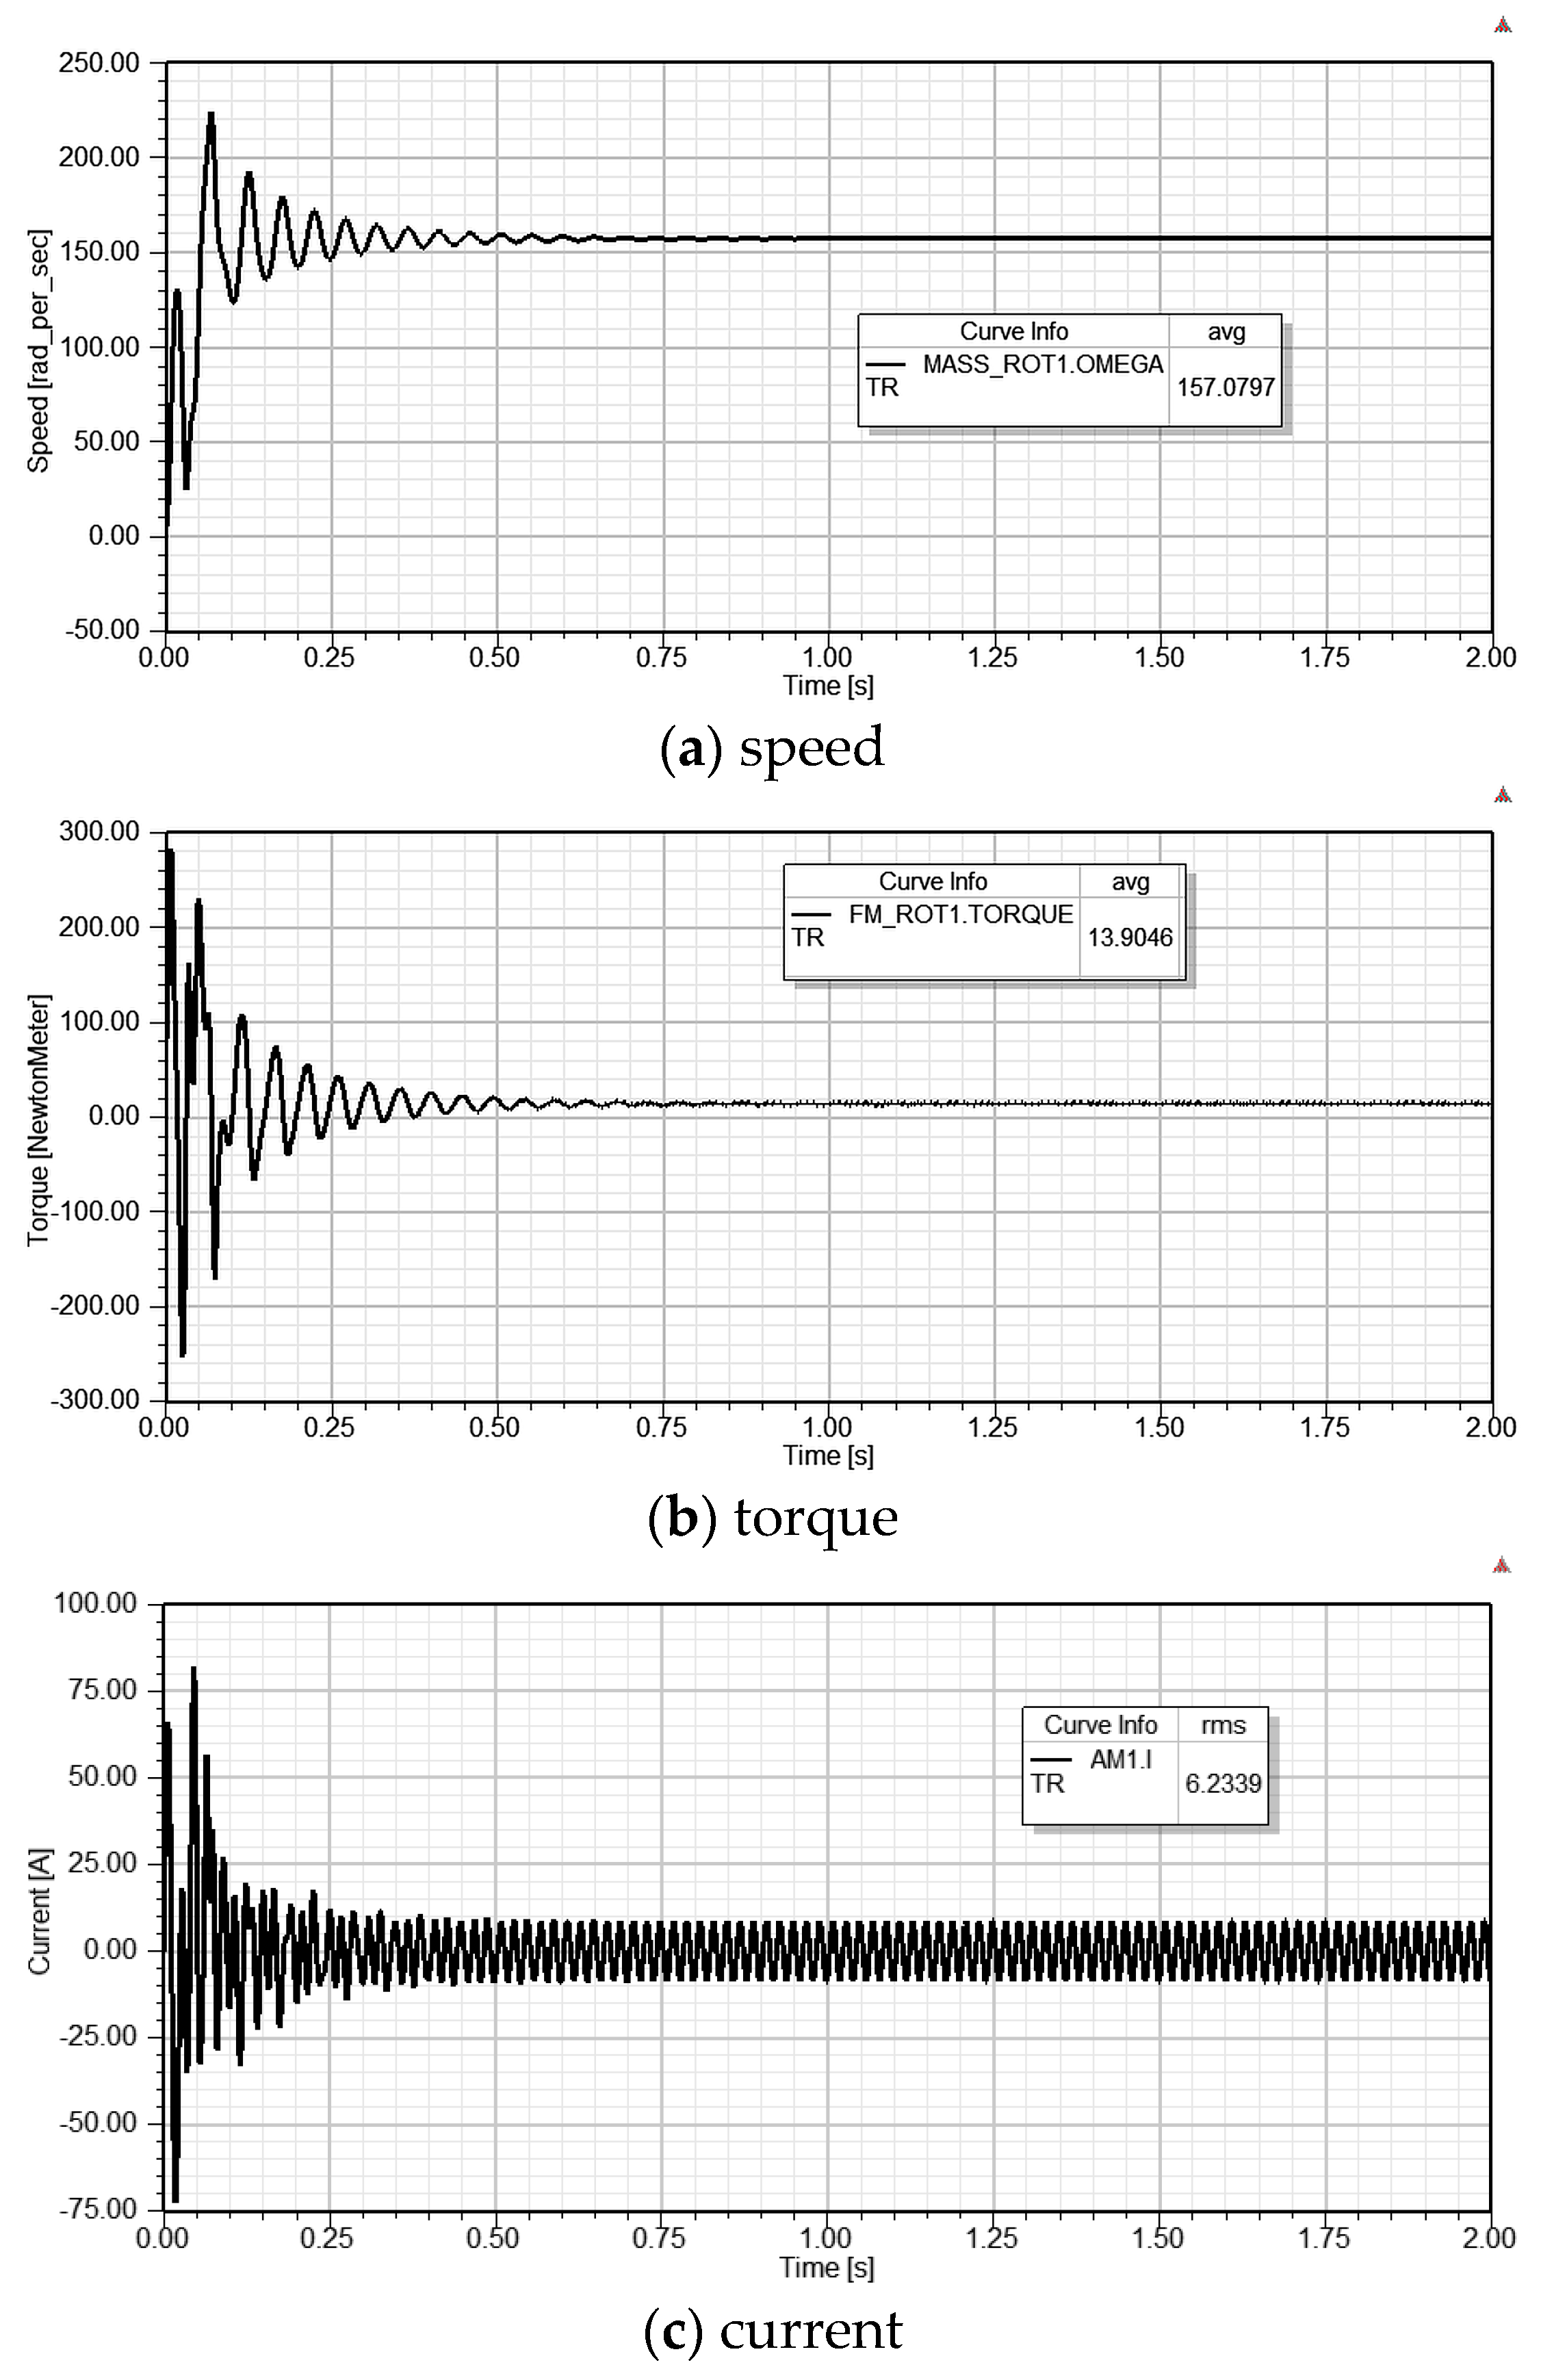
Figure 12a–c present the transient characteristics of speed, electromagnetic torque, and stator current, respectively, for the constant-load operating condition.
The results presented in
Figure 12 indicate that model OM7 successfully synchronizes with the supply network. However, the synchronization process lasts approximately 1.2 s and is accompanied by speed oscillations during motor starting. After synchronization is achieved, the electromagnetic torque stabilizes at approximately 13.9 Nm, which is consistent with the applied load torque of 13.9 Nm. Following synchronization, the rms value of the stator current is 6.23 A, which is in good agreement with the rated value of 6.2 A reported in
Table 7. The transient characteristics of speed and electromagnetic torque under variable-load conditions are presented in
Figure 13.
A comparison of the transient speed characteristics presented in
Figure 12a and
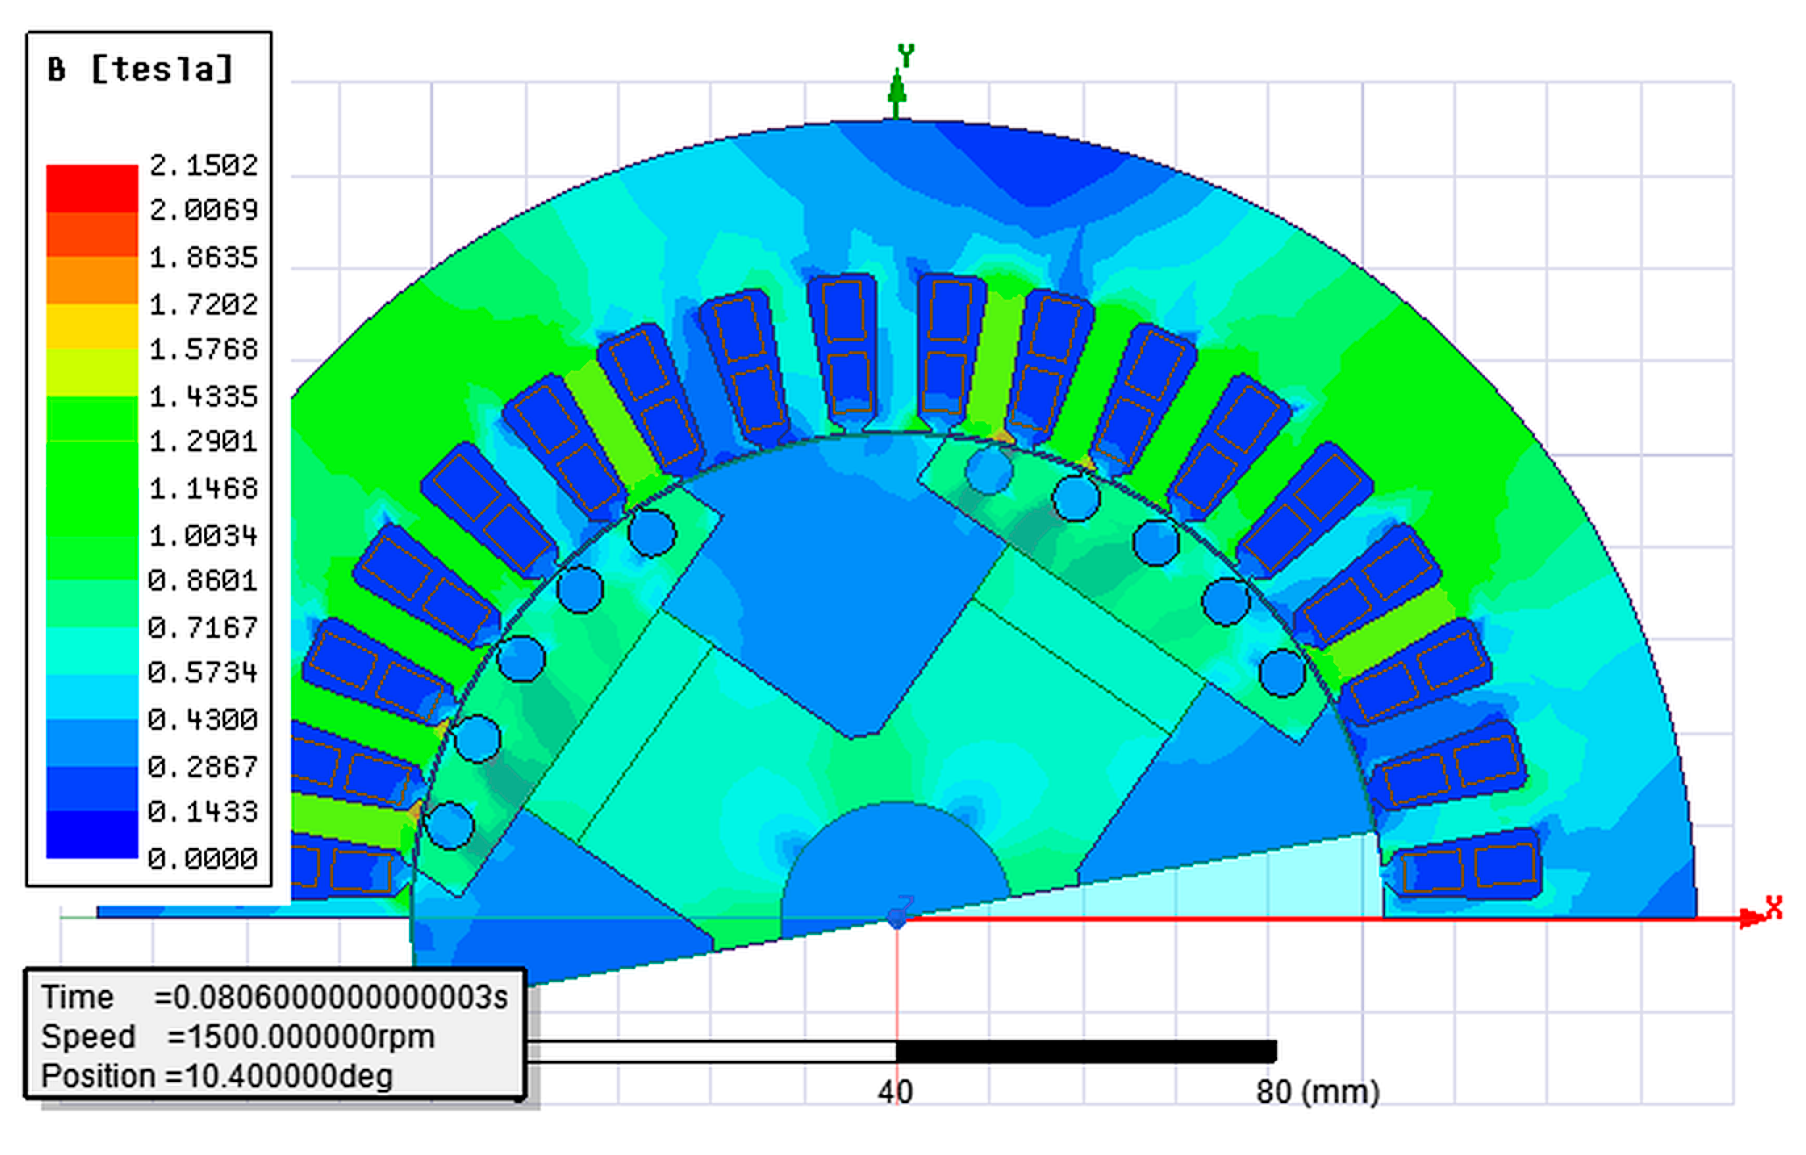
Figure 13a shows that, under variable-load conditions, the motor starts with a load torque of 5 Nm and synchronizes with the supply network more rapidly than under the constant rated-load condition. Specifically, synchronization is achieved after approximately 0.5 s, compared with 1.2 s when the motor starts under a constant load torque of 13.9 Nm. At t =1.5 s, the load torque is increased in a step from 5 Nm to 13.9 Nm. The resulting transient oscillations are damped within approximately 0.7 s, after which the motor remains synchronized with the supply network, successfully accommodating the load variation. The model OM7 employs thicker permanent magnets, which may generate excessive magnetic flux and potentially lead to saturation of the steel in the salient poles and stator teeth. Therefore, the flux density distribution in the motor cross-section was analyzed using the finite element method (FEM), and the results are presented in
Figure 14.
From
Figure 14, it can be observed that localized core saturation occurs in a small region of the stator teeth. In contrast, the magnetic flux distribution in the remaining part of the core remains within the linear region of the magnetization characteristic.
4. Discussion of Results
Finding an optimal motor design requires careful analysis of numerous motor models and often involves a trade-off between performance and manufacturing cost. The first optimization procedure, the optimetric (parametric) analysis, calculates motor performance characteristics based on various combinations of predefined design parameters. Depending on the designer’s selection, the relevant performance characteristics or parameters can be displayed as output results. In the case of the analyzed line-start synchronous motor with salient poles and permanent magnets, efficiency, power factor, starting torque, net motor mass, maximum power, and line current were selected as the key performance indicators and evaluated across 2475 motor models. The models with the highest efficiency were then identified among all generated solutions. Six models exhibited an efficiency of 93.74%, while two models achieved 93.76%. Compared with the initial model IM1, which has an efficiency of 92.08%, the optimized solutions demonstrate a clear efficiency improvement. This improvement is mainly attributed to the reduction in current, the use of thicker permanent magnets, decreased armature resistance, and consequently reduced overall copper losses. However, all optimized motor models (OM1–OM8) exhibit an increased net motor mass compared with the initial model. The improvement in efficiency is therefore achieved at the expense of higher material consumption and, consequently, increased manufacturing costs. An interesting outcome of the optimetric analysis is that six models (OM1–OM6) exhibit the same efficiency of 93.74%, while differing in their remaining performance characteristics. For example, model OM1 represents a cost-effective solution because it has the lowest net motor mass among models OM1–OM8, while maintaining high efficiency and power factor and good starting torque. Model OM7 was selected as the optimal design because it combines the highest efficiency with the highest power factor. Nevertheless, model OM8 may also be considered an equally suitable candidate, as it exhibits the same efficiency and a similarly high power factor. The final selection between these two models therefore depends on the relative importance assigned to the remaining performance characteristics and manufacturing considerations. The main advantage of the optimetric analysis is that it provides a comprehensive overview of a large number of motor models, often identifying several candidate designs that can be considered optimal solutions. This enables the designer to evaluate the trade-offs among different performance characteristics and manufacturing constraints before selecting the final design. However, the final selection of the optimal motor model relies heavily on the designer’s experience and careful interpretation of the optimization results. Consequently, the decision-making process may be influenced by subjective judgment, which represents one of the main limitations of this optimization approach. Finally, the applicability of the optimetric analysis is limited when a larger number of design parameters and wider parameter variation ranges are considered, owing to the substantial increase in the number of generated models and the associated computational effort. It is noteworthy that the motor model with the lowest efficiency obtained from the optimetric analysis, denoted as OM9, exhibits an efficiency of 90.19%. Its performance characteristics are presented in
Table 8. Consequently, the efficiency of the generated motor models spans a wide range, from 90.19% to 93.76%. These results emphasize the importance of carefully evaluating the optimization outcomes to identify the most suitable motor design by considering not only efficiency but also manufacturing costs and other relevant performance characteristics.
To verify the selection of model OM7 as the optimal design, GA optimization was performed using the same design parameters and variation ranges as those employed in the optimetric analysis. The resulting GA-optimized model, presented in
Table 6, achieved an efficiency of 93.757%, thereby confirming the selection of model OM7, with an efficiency of 93.76%, as the optimal solution. The optimized values of the four design parameters obtained by the GA indicate that, for practical engineering and manufacturing applications, these values should be rounded to feasible manufacturing dimensions. However, rounding the optimized parameters may alter the final motor design and its corresponding performance characteristics. As discussed in
Section 3, rounding the design parameters resulted in a motor model with an efficiency of 93.72%, which is slightly lower than the optimum value of 93.757%. This observation highlights the importance of considering manufacturing constraints during the optimization process, as the mathematically optimal solution may not exactly correspond to the practically manufacturable design. LSSMs exhibit high efficiency and can readily achieve the IE4 efficiency class due to reduced winding losses. The rotor current is induced only during the starting process. In steady-state operation, i.e., under rated load conditions, no current is induced in the damper winding; consequently, Joule losses in the rotor are eliminated, resulting in higher overall efficiency. Several examples of high efficiency can be found for 2.2 kW of LSSM. They are listed in
Table 9.
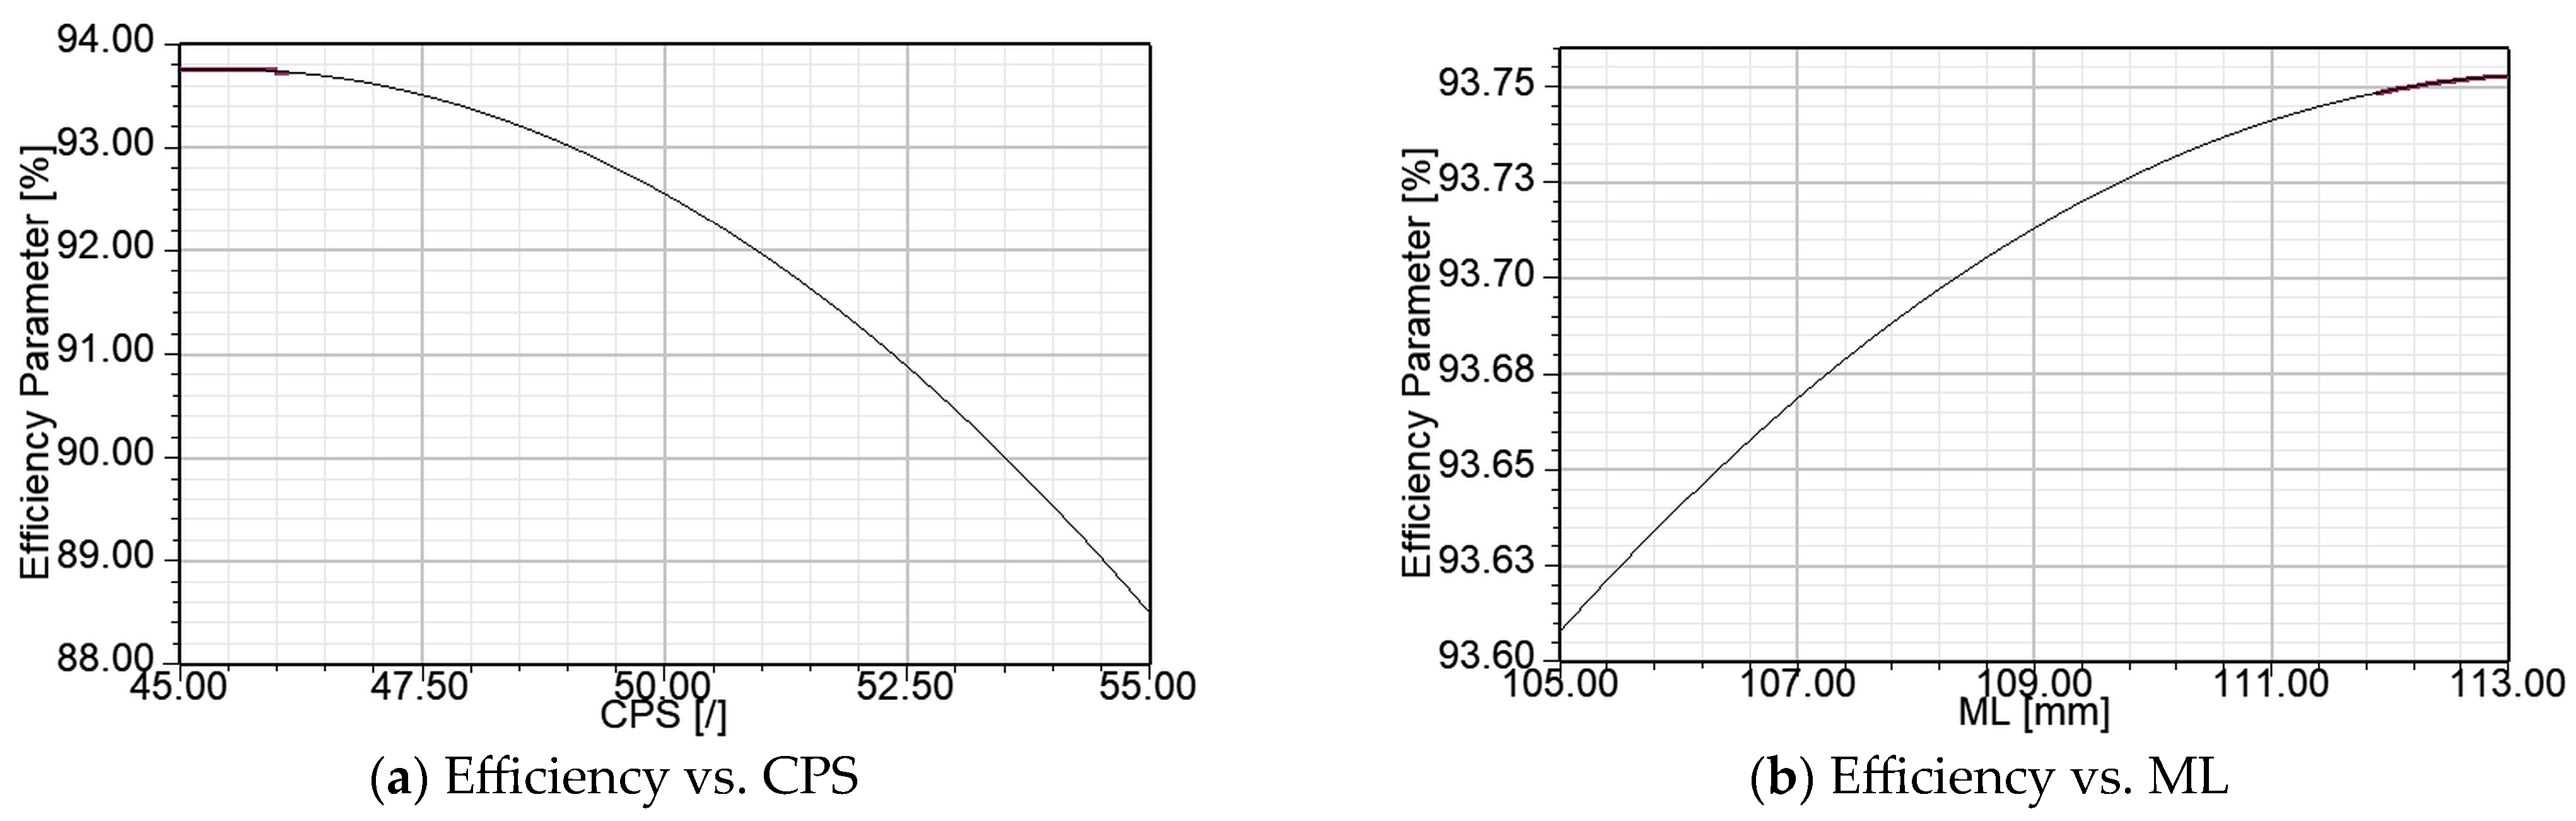
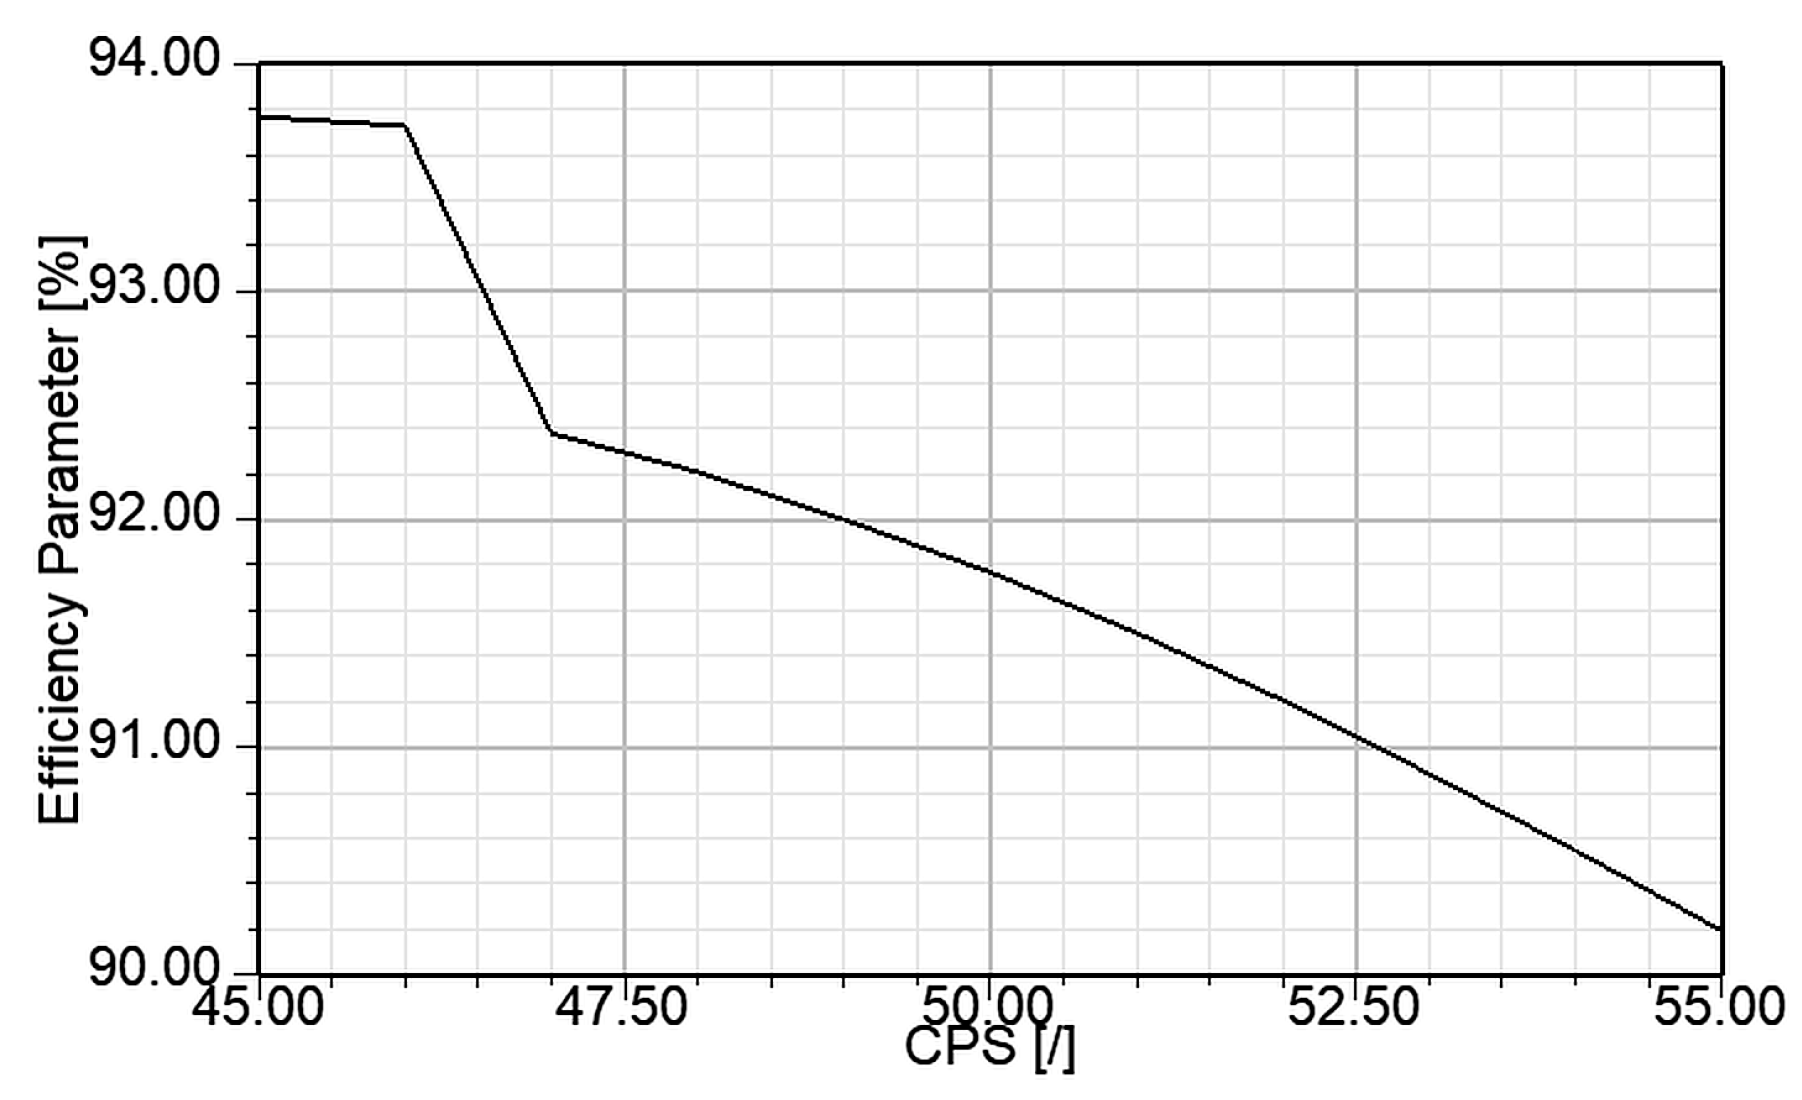
Equally important is the analysis of the influence of each of the four varied design parameters on motor efficiency. Therefore, the impact of the number of conductors per slot on motor efficiency is presented in
Figure 15 for model OM7. The analysis is performed by varying only the CPS parameter (
Table 4), while keeping the remaining three parameters constant at the values given in
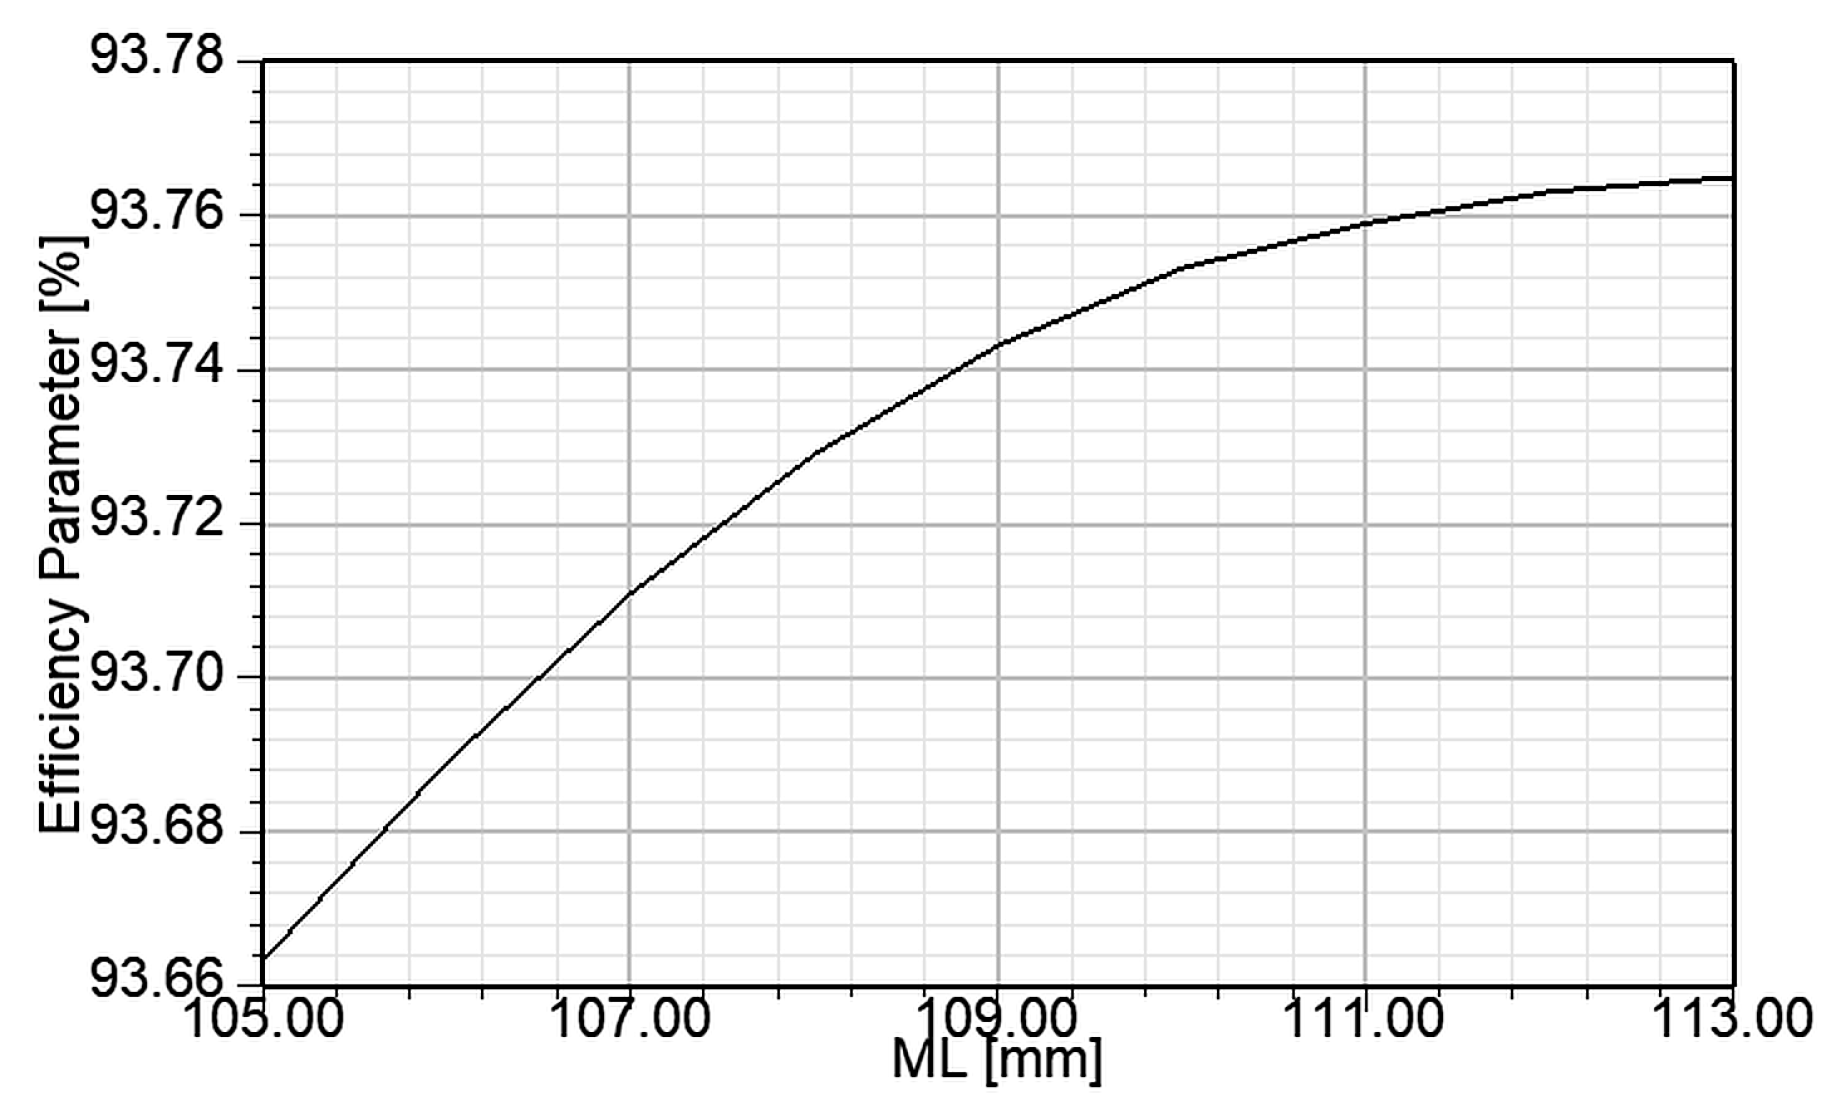
Table 7, namely ML = 113 mm, MT = 7 mm, and ORD = 104.2 mm. A similar analysis is conducted to investigate the influence of the machine length on motor efficiency, as shown in
Figure 16. The ML parameter is varied within the limits given in
Table 4, while the remaining three parameters are kept constant at the values specified in
Table 7, namely CPS = 45, MT = 7 mm, and ORD = 104.2 mm.
Increasing the number of conductors per slot leads to a reduction in efficiency due to increased Joule losses in the stator winding. It should be noted that the software automatically selects the wire diameter according to the CPS value and the imposed slot fill factor limit of 75% where the actual slot fill factor of optimized model is 73%. For example, at CPS = 45, the wire diameter is 0.6438 mm, the stator phase resistance is R
1 = 2.75016 Ω, the phase current is 3.58265 A, and the stator copper loss is 105.898 W. A significant decrease in efficiency is observed at CPS = 47, where the wire diameter is reduced to 0.5733 mm, the stator phase resistance increases to R
1 = 3.62227 Ω, the phase current is 3.60321 A, and the stator copper loss increases to 141.086 W. An increase in the number of conductors per slot (CPS) leads to higher stator winding resistance and, consequently, increased copper losses, resulting in reduced motor efficiency. In addition, increasing CPS increases the stator leakage reactance, which may negatively affect the power factor, starting torque, and pull-in torque. A lower CPS reduces the stator copper losses; however, a substantial reduction in CPS requires a higher current to maintain the same magnetic loading, which may increase stator winding temperature and adversely affect the overall efficiency. A higher CPS can reduce the peak asynchronous starting torque, whereas a lower CPS can enhance the starting torque due to the reduced leakage reactance. Furthermore, a higher CPS, associated with increased stator resistance, may adversely affect the motor synchronization capability and increase the risk of stalling before achieving synchronism. A comparison between the initial model IM1 and the optimized model OM7 (
Table 7) shows that the lower CPS value in OM7 contributes to a higher starting torque. However, an excessive CPS may adversely affect motor synchronization with the supply network and lead to a reduction in overall efficiency. According to
Figure 16, an increase in the machine length leads to an improvement in efficiency. A larger magnetic core requires a lower current to produce the same electromagnetic force, thereby reducing copper losses and enhancing efficiency. As shown in
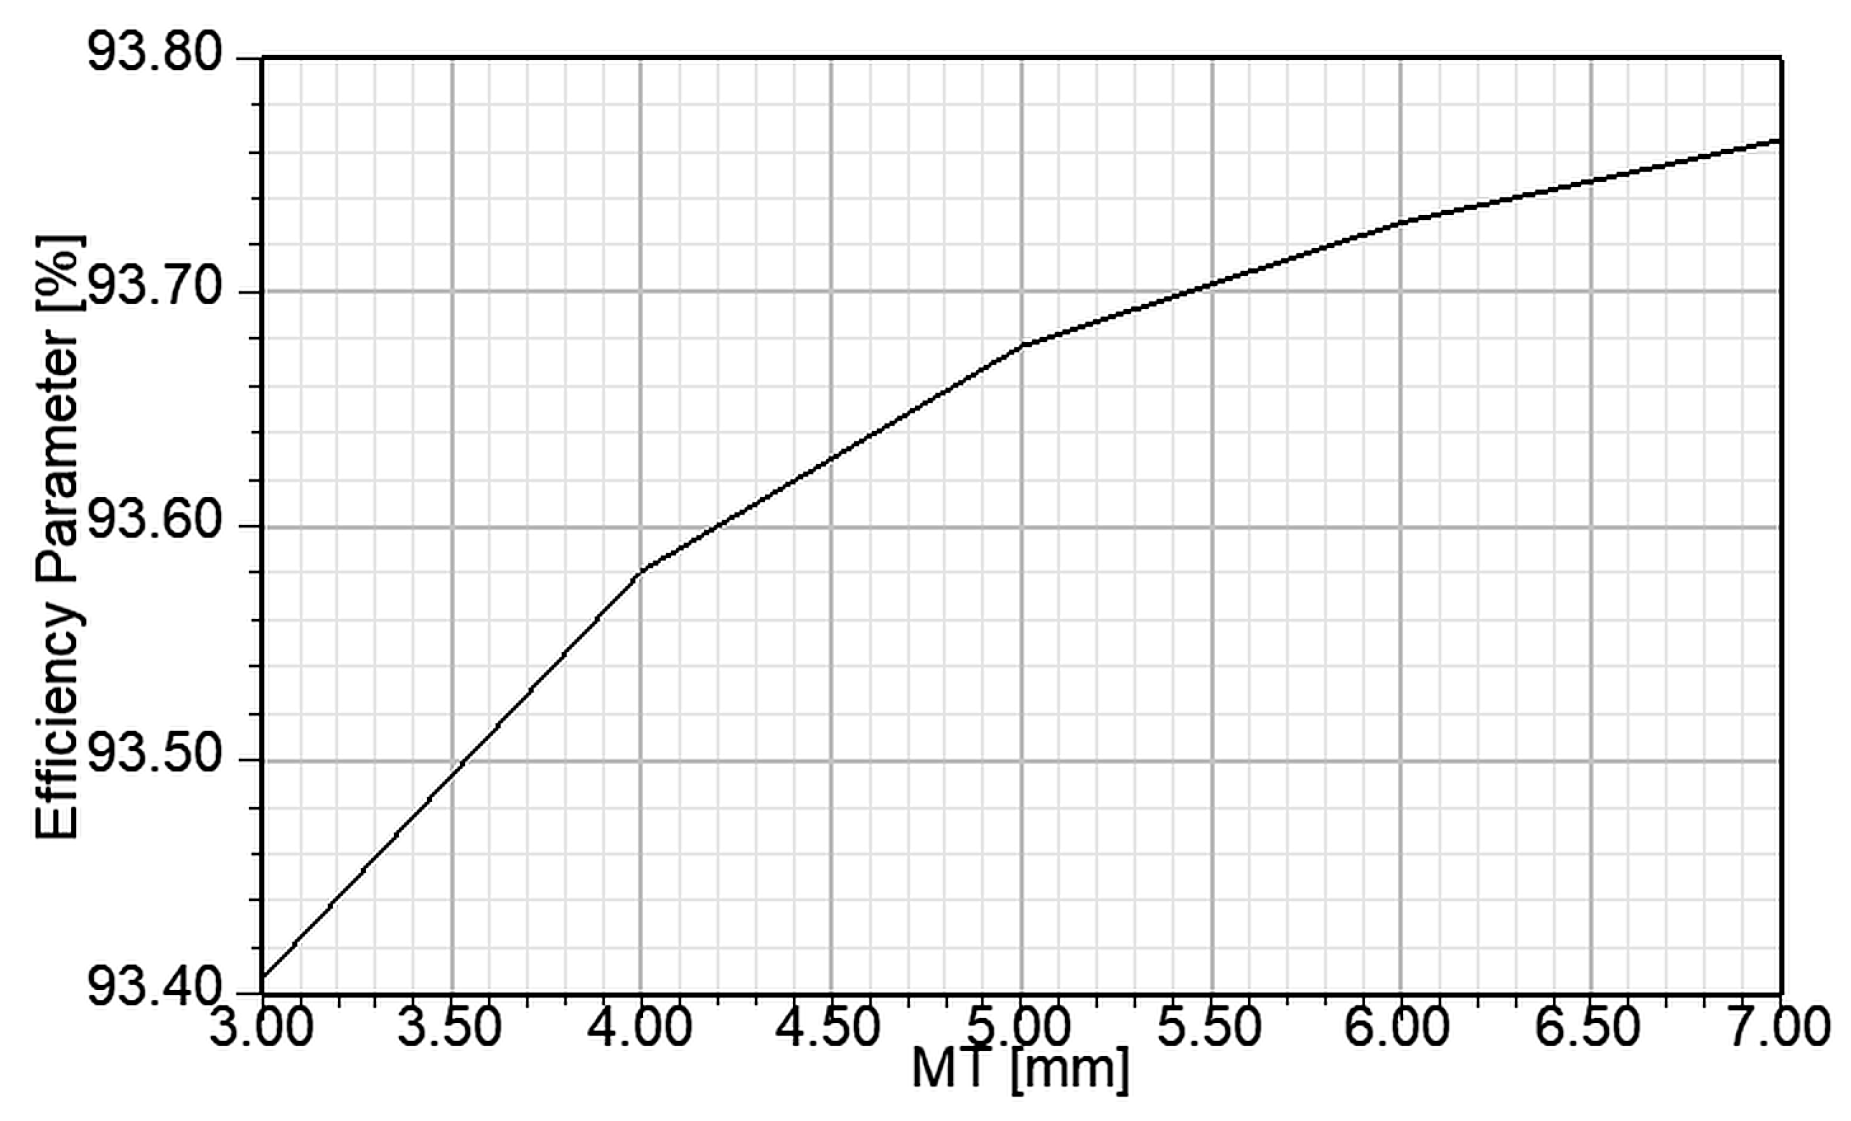
Table 7, after optimization, the core length of model OM7 increases to 113 mm compared with 109 mm in the initial model IM1, resulting in a reduction in the stator current from 6.3 A to 6.2 A. Increasing the length of the magnetic core may lead to higher eddy current and hysteresis losses, whereas a shorter magnetic core can cause local magnetic saturation, thereby deteriorating overall motor performance. In LSSMs with salient poles, increasing the machine axial length improves the steady-state efficiency. However, it simultaneously increases the rotor inertia and the magnet-induced braking torque, thereby reducing the starting acceleration and adversely affecting the pull-in capability and synchronization process. Following the same procedure as in the analysis of the CPS and machine length (ML) influence on efficiency, the effects of magnet thickness and air-gap length, represented here by the outer rotor diameter, are presented in
Figure 17 and
Figure 18.
According to
Figure 17, an increase in magnet thickness leads to an improvement in efficiency. Thicker magnets generate a stronger electromagnetic field, which reduces the stator current while maintaining the required electromagnetic torque. Consequently, stator copper losses are reduced. In addition, thicker magnets improve the power factor. However, excessively thick magnets may produce a high braking torque during the starting and acceleration phases of LSSM, which can hinder the motor from reaching synchronous speed and successfully synchronizing with the supply network. In contrast, excessively thin magnets may be susceptible to demagnetization under high transient loads or fault conditions. Furthermore, excessive magnet thickness may lead to saturation of the salient pole tips and increased core losses. Moreover, thicker magnets reduce the maximum allowable load inertia that the motor can successfully synchronize.
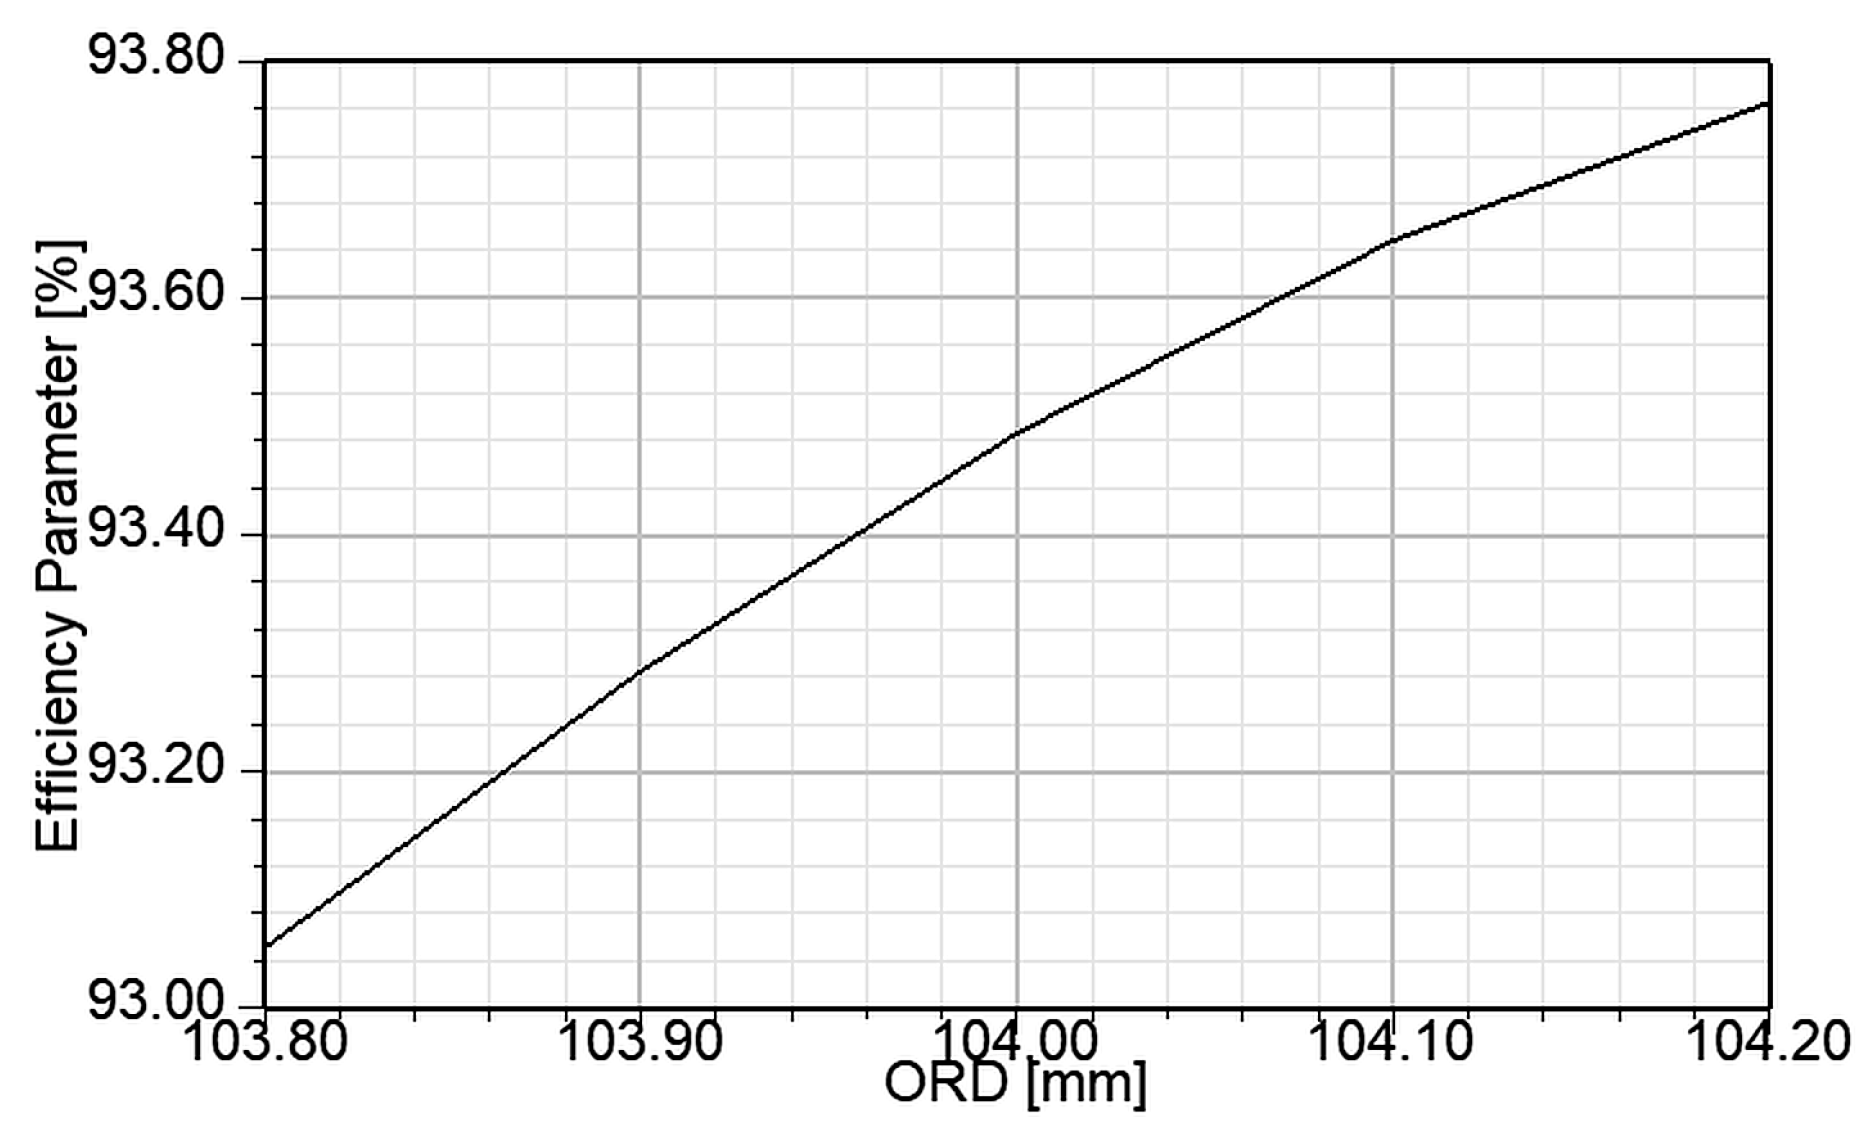
Figure 18 illustrates the influence of the outer rotor diameter on motor efficiency. An increase in ORD corresponds to a reduction in air-gap length. As shown in
Figure 18, increasing ORD, i.e., decreasing the air-gap length, improves the efficiency. The air-gap length significantly affects machine performance in several ways: a reduced air gap decreases magnetic reluctance, thereby improving the power factor and increasing the air-gap flux density. This results in a lower stator current, reduced copper losses, and improved efficiency. A smaller air gap makes pull-in into synchronism more difficult, particularly under high-inertia load conditions. A larger air gap weakens the interaction between the permanent magnets and the stator field during slip-speed operation, thereby reducing the magnet-induced negative braking torque and helping to maintain a higher net starting and accelerating torque produced by the squirrel-cage winding. However, manufacturing constraints related to the minimum achievable air-gap length must also be taken into account. The initial design (IM1) has an air-gap length of 0.5 mm, whereas the optimized design features a reduced air-gap length of 0.4 mm. This value maximizes both efficiency and power factor; however, it provides limited tolerance for manufacturing variations, which may represent a drawback of model OM7. By analyzing
Figure 15,
Figure 16,
Figure 17 and
Figure 18 and the individual influence of the four varied design parameters on motor efficiency, it can be concluded that the number of conductors per slot (CPS) has the most significant impact on efficiency. Specifically, variation of CPS results in a relatively wide efficiency range, from approximately 90% to 93.76%. The machine length exhibits the smallest influence on motor efficiency. Specifically, variation of the machine length from 109 to 113 mm results in a change in efficiency from 93.66% to 93.76%. A moderate influence on efficiency is observed for both the magnet thickness and the outer rotor diameter (ORD). Variation of ORD from 103.8 to 104.2 mm leads to an efficiency range from approximately 93% to 93.76%. The effect of magnet thickness on efficiency is slightly less pronounced than that of ORD, with efficiency varying within a narrower range from 93.4% to 93.76%. Here should be noted that optimetric optimum is a constrained boundary solution, since the efficiency is maximized at the edge of the manufacturability envelope.
The efficiency of the OM7 model is verified using the GA-OM model obtained through optimization with a single objective function, namely, efficiency, which is set to be maximized. However, motor optimization is often a multi-objective problem that requires the simultaneous evaluation of several operating parameters, such as starting torque, power factor, and motor mass. The optimal solution should therefore provide a combination of high efficiency, high power factor, and high starting torque, while maintaining a low net mass and, consequently, low material consumption. Therefore, the GA analysis of the LSSM with salient poles and permanent magnets is performed as a multi-objective optimization problem defined by four objective functions, with the corresponding weights and optimization goals given in
Table 10.
Efficiency is assigned the highest weight, together with starting torque, because the starting torque of the LSSM must be sufficient to ensure successful motor starting and synchronization with the grid, even when driving high-inertia loads. The weight factors assigned to motor mass and power factor are lower because synchronous motors can readily achieve high power factors, while the motor mass, which reflects the amount of material used in the motor construction, should be kept within a range that ensures stable motor operation and high efficiency. Nevertheless, efficiency remains the primary operating parameter to be improved. Furthermore, the model obtained from the multi-objective GA optimization should be comparable with the models presented in
Table 5, which were selected based on the highest efficiency. Therefore, efficiency is assigned the highest weight in the multi-objective optimization. It should be noted that the optimization with efficiency maximization as the single objective function is assigned to the GA-OM model (
Table 6). Maximization of the objective function can be applied only to models with a single objective function, such as the GA-OM model, in which efficiency is defined as the objective function to be maximized. In contrast, in the multi-objective optimization model, hereafter referred to as GAMO-OM, simultaneously maximizing a single objective function is inconsistent with the formulation of the model, in which each objective function is assigned a specific goal and weight. Considering that the multi-objective optimization model should be comparable with the previously analyzed optimization models, efficiency is assigned the highest weight and goal. Accordingly, the efficiency objective in
Table 10 is defined appropriately for a multi-objective optimization problem. In this formulation, a single objective function cannot simply be maximized independently, since the optimal solution is determined by simultaneously considering several objective functions, each with its corresponding goal and weight. The condition imposed on the efficiency requires the optimization model to search for solutions with an efficiency less than or equal to 100%, while simultaneously assigning the highest weight to efficiency among the optimization criteria. The cost function in Ansys Electronics Desktop multi-objective optimization using GA, maps the goals and weights into a single aggregated mathematical value called the cost function (C). When four goals alongside their respective weights are set, program evaluates each iteration by measuring how far the design’s simulated parameters are from targeted values (the “individual goal errors”). For every individual design point generated by the GA, program processes the four goals by calculating an Individual Error (
Errori) for each goal
i (where
i = 1, 2, 3, 4).
Errori equals to normalized distance between calculated value and goal target. Then, it applies user-defined weights (
Wi) to these errors. The final single scalar cost value is aggregated using following norm structure:
According to [
42] this norm is highly recommended for motor optimization because it severely punishes a design if even one of the four goals is far off target, forcing the algorithm to find a well-rounded balance. The goal for the starting torque in
Table 10 is based on the lowest starting torque among the models selected from the optimetrics analysis and presented in
Table 5. Accordingly, the condition imposed on the starting torque as an objective function is set to a value greater than or equal to this minimum value from
Table 5. This condition provides a consistent basis for comparing the model obtained through multi-objective optimization with the models selected from the optimetrics analysis. The optimization variables and their ranges are the same as those given in
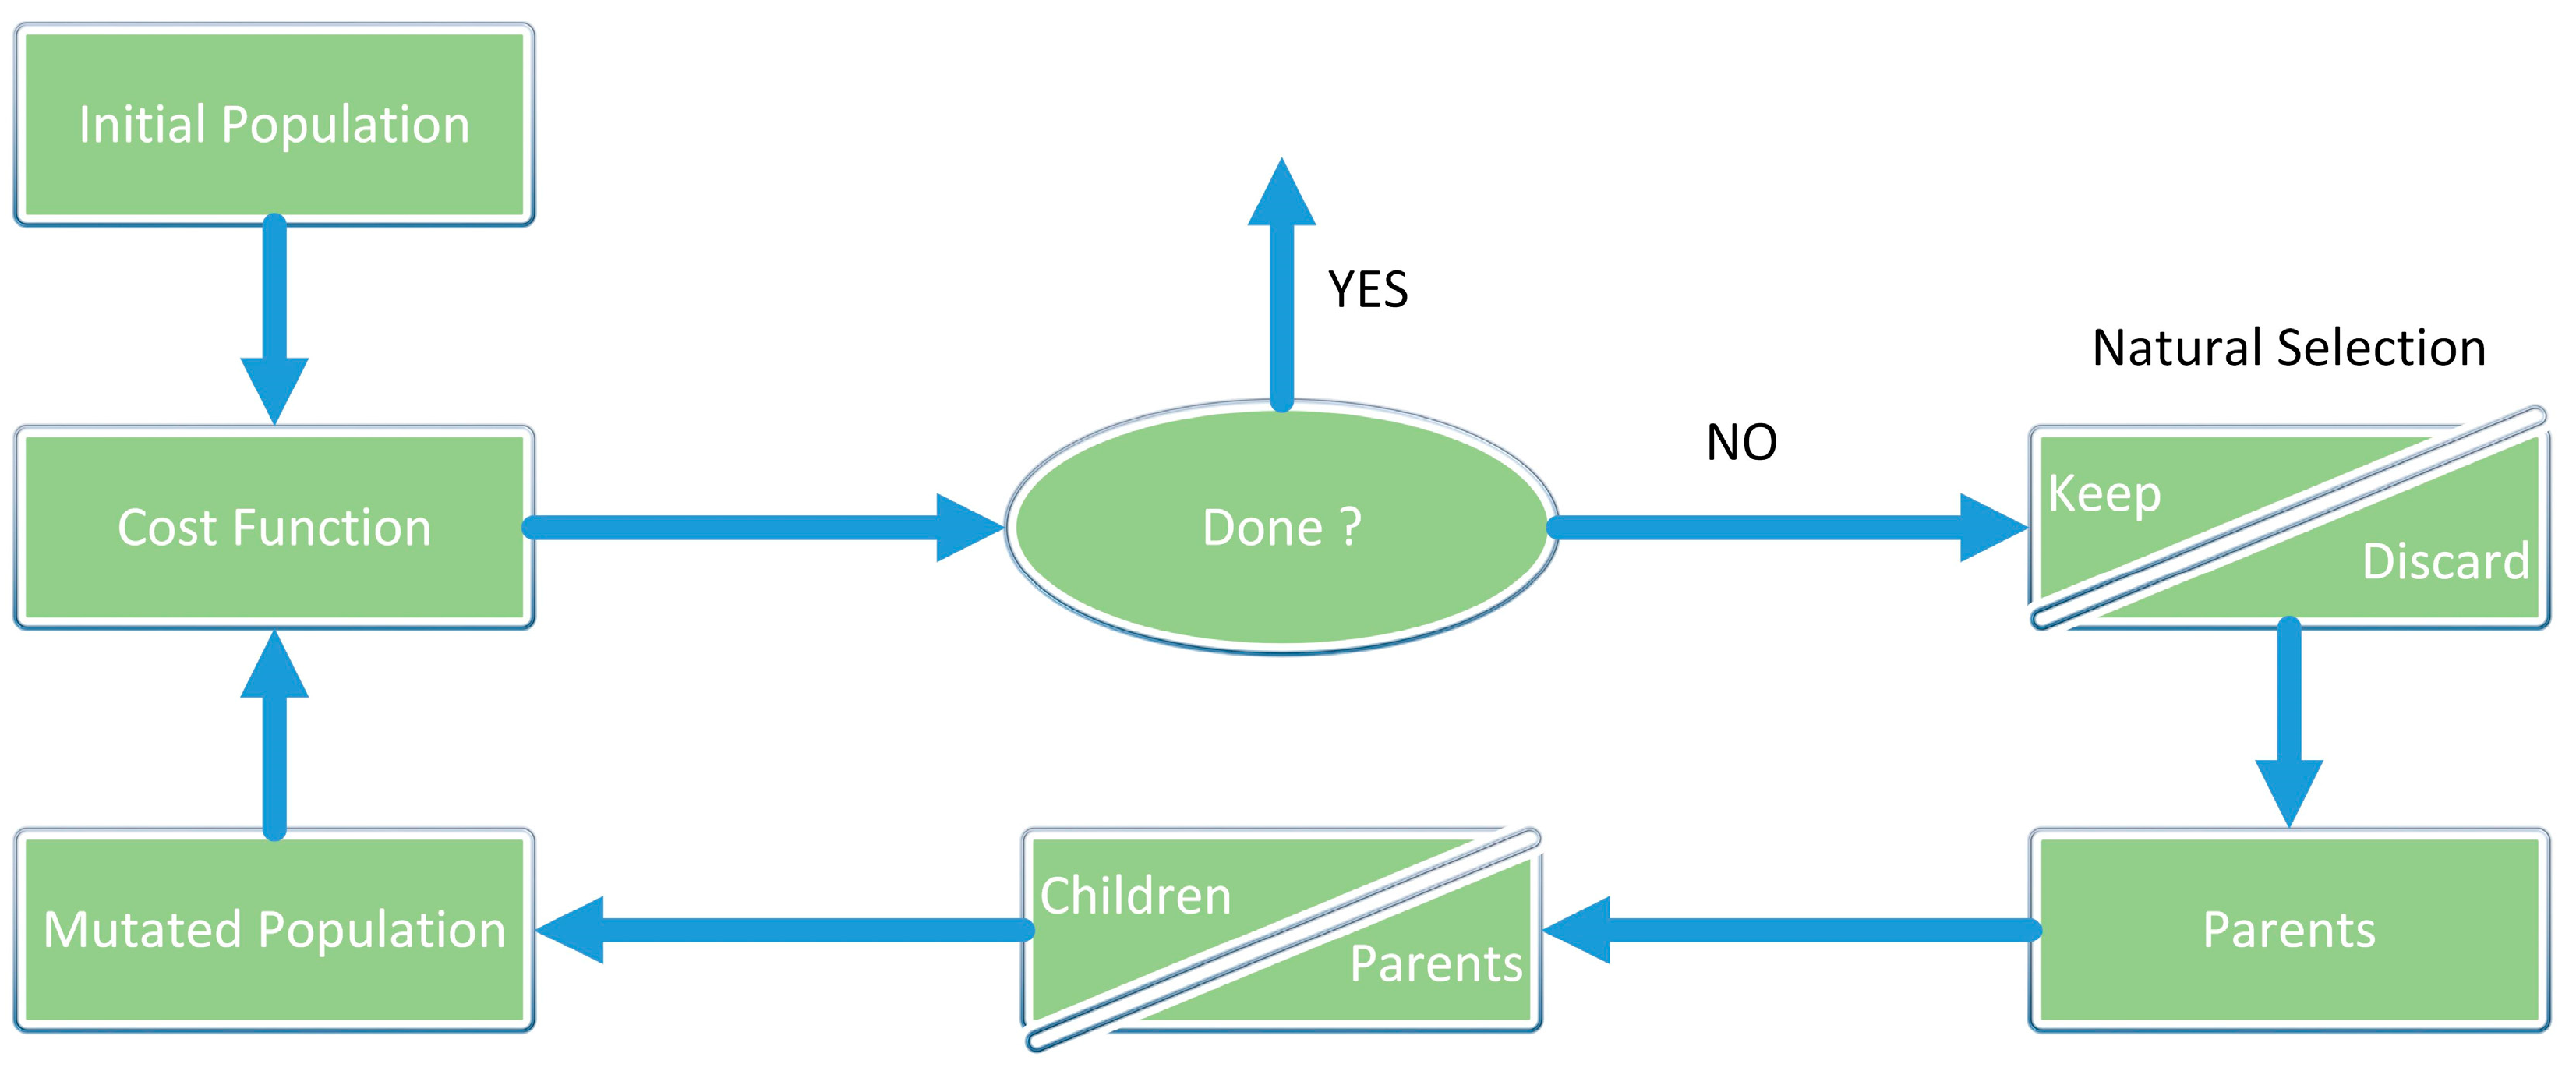
Table 4. The Genetic Algorithm (GA) performs a stochastic search and, as an iterative global optimization method, is employed to identify the optimal design variables for electric machines. It mimics the principles of natural evolution to optimize the machine design and improve its operating performance. The algorithm begins by generating an initial population of design configurations (individuals), where each individual represents a unique motor design defined by a specific combination of design parameters. In Ansys Electronics Desktop, these design variables are encoded into a vector or string, referred to as a chromosome. Continuous and discrete, manufacturable design dimensions are mapped into genetic representations. For each individual, the software calculates the relevant performance parameters, such as efficiency, torque, starting torque, net mass, and power factor. These output parameters are compared with the user-defined performance targets to calculate a global cost function. Individuals with better fitness, as determined by the cost function, are preferentially retained for subsequent generations. The first step in the mating process is the selection of individuals that will participate in reproduction. Potential parents are selected from the current generation, forming a subset of the population. The number of individuals is specified to determine the number of parents available to the optimizer. A mating pool is then created by randomly selecting individuals from the parent population. During this process, selected parents are cloned, allowing the same individual to be selected multiple times. Finally, to reduce the combined pool of parents and newly generated offspring to the predefined generation size, selection pressure is applied. In both optimization approaches, i.e., single-objective and multi-objective optimization, an elitist selection mechanism is employed. Only the best-performing individuals are retained, ensuring that the highest-quality motor designs are preserved in subsequent generations. The next generation is formed by combining individuals from the current generation with newly generated offspring and individuals retained from the Pareto front. The number of individuals in the next generation is predefined and corresponds to the selected population size, with preference given to the individuals exhibiting the best fitness according to the cost function. New candidate solutions (offspring) are generated from the mating pool using two primary genetic operators: crossover (recombination) and mutation. Crossover combines the “features” of parent individuals to generate new combinations according to a user-defined crossover probability. For continuous mechanical parameters, the crossover operation linearly combines the corresponding parent dimensions to generate new parameter values. Mutation introduces small random changes to the features of individuals according to a predefined mutation probability. It acts as a local search mechanism by randomly modifying selected design-variable values. Mutation is an essential component of the genetic search because it helps prevent population stagnation and reduces the likelihood of convergence to local optima. Thus, crossover enables the exploration of new combinations of design variables and mutation maintains population diversity, which is essential for effective GA optimization. In multi-objective optimization, the Pareto-front parameter specifies the number of the best-performing individuals, identified according to the optimization criteria, that are retained for subsequent generations. The block diagram of the implemented GA procedure is presented in
Figure 19.
The both optimization GA procedures (single objective and multi objective) are performed considering following criteria: maximum number of generations 100, parents-number of individuals 30, mating pool-number of individuals 30, children-number of individuals 30, pareto front-number of survivors 10, the next generation-number of individuals 30. The stopping criteria is maximum number of generations 100. The model obtained from the multi-objective GA optimization is hereafter referred to as GAMO-OM. The results of the multi-objective optimization process are presented in
Table 11. The efficiency of the GAMO-OM model is slightly lower than that of the OM7 model, at 93.66% compared with 93.76%, respectively. Similarly, the starting torque is slightly lower for the GAMO-OM model, with a value of 36.99 Nm compared with 37.44 Nm for the OM7 model. A similar trend is observed for the power factor. In contrast, the net mass of the GAMO-OM model is reduced to 15.16 kg compared with 15.92 kg for the OM7 model. It should be noted that, for manufacturing the GAMO-OM model, the optimized parameter values given in
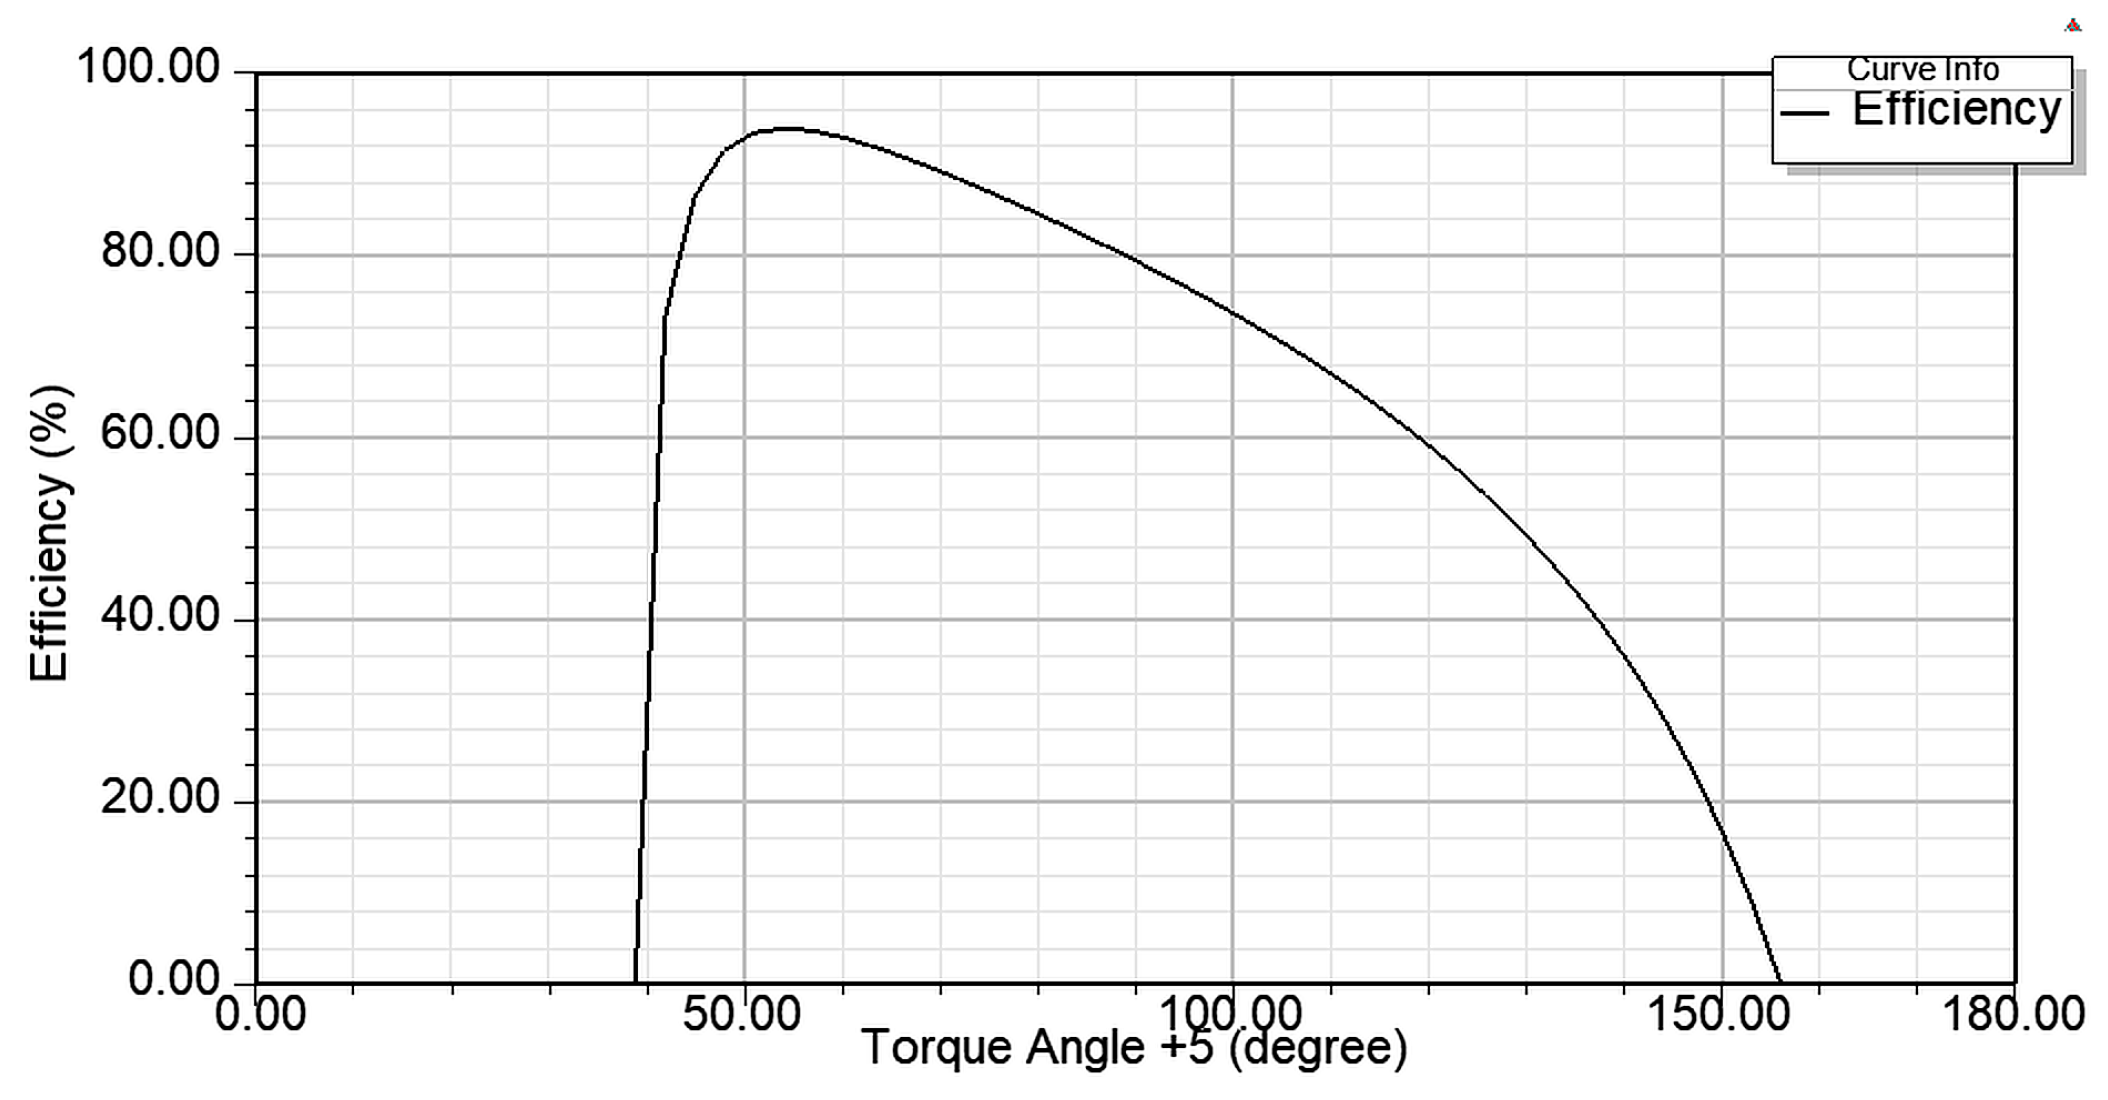
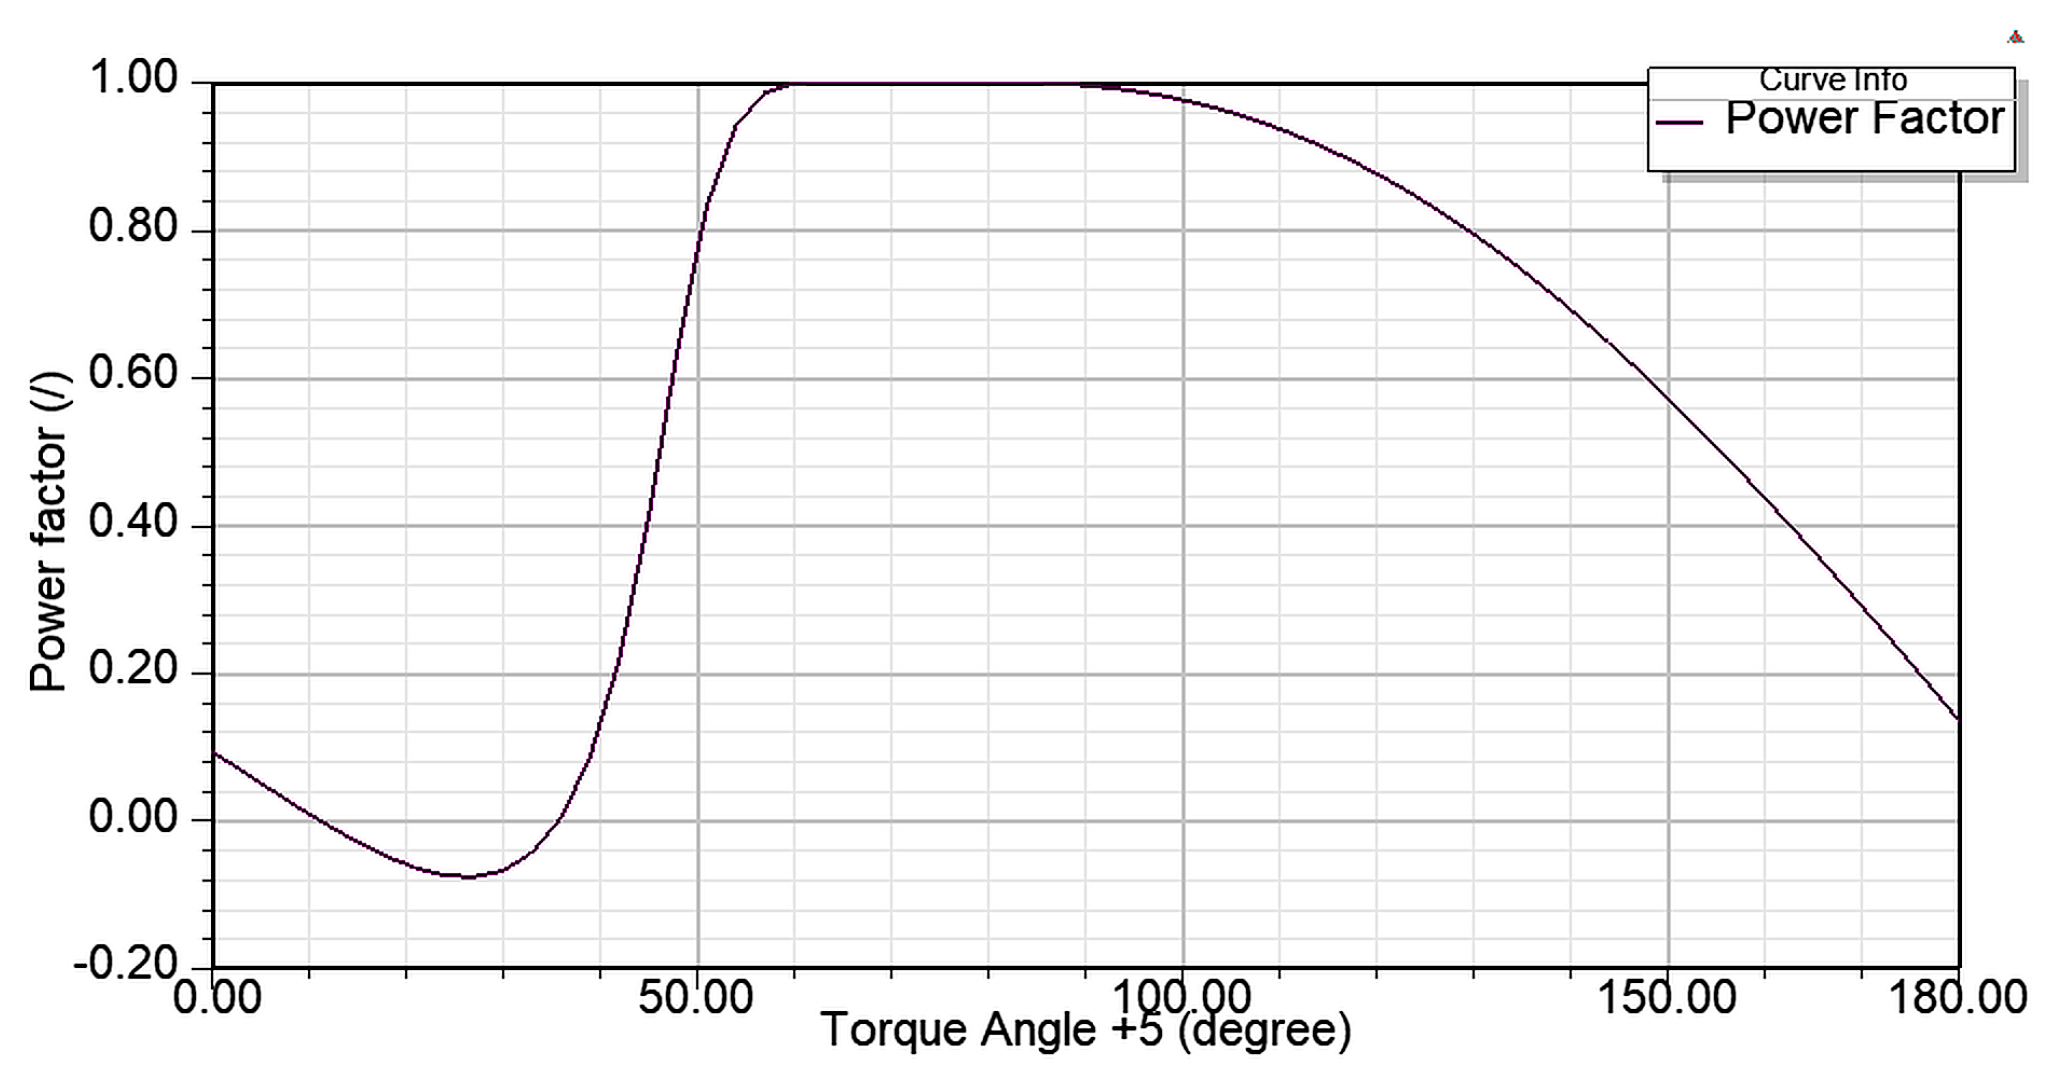
Table 11 must be rounded to manufacturing-feasible dimensions. Such modifications may affect the final operating characteristics of the motor. Therefore, the GAMO-OM model can be considered a potential trade-off between efficiency, material consumption, and manufacturing cost. However, the final operating characteristics of the manufactured motor will depend on the feasible dimensions adopted for the optimized parameters. Efficiency and power factor of GAMO-OM model are given in
Figure 20 and
Figure 21. They should support data in
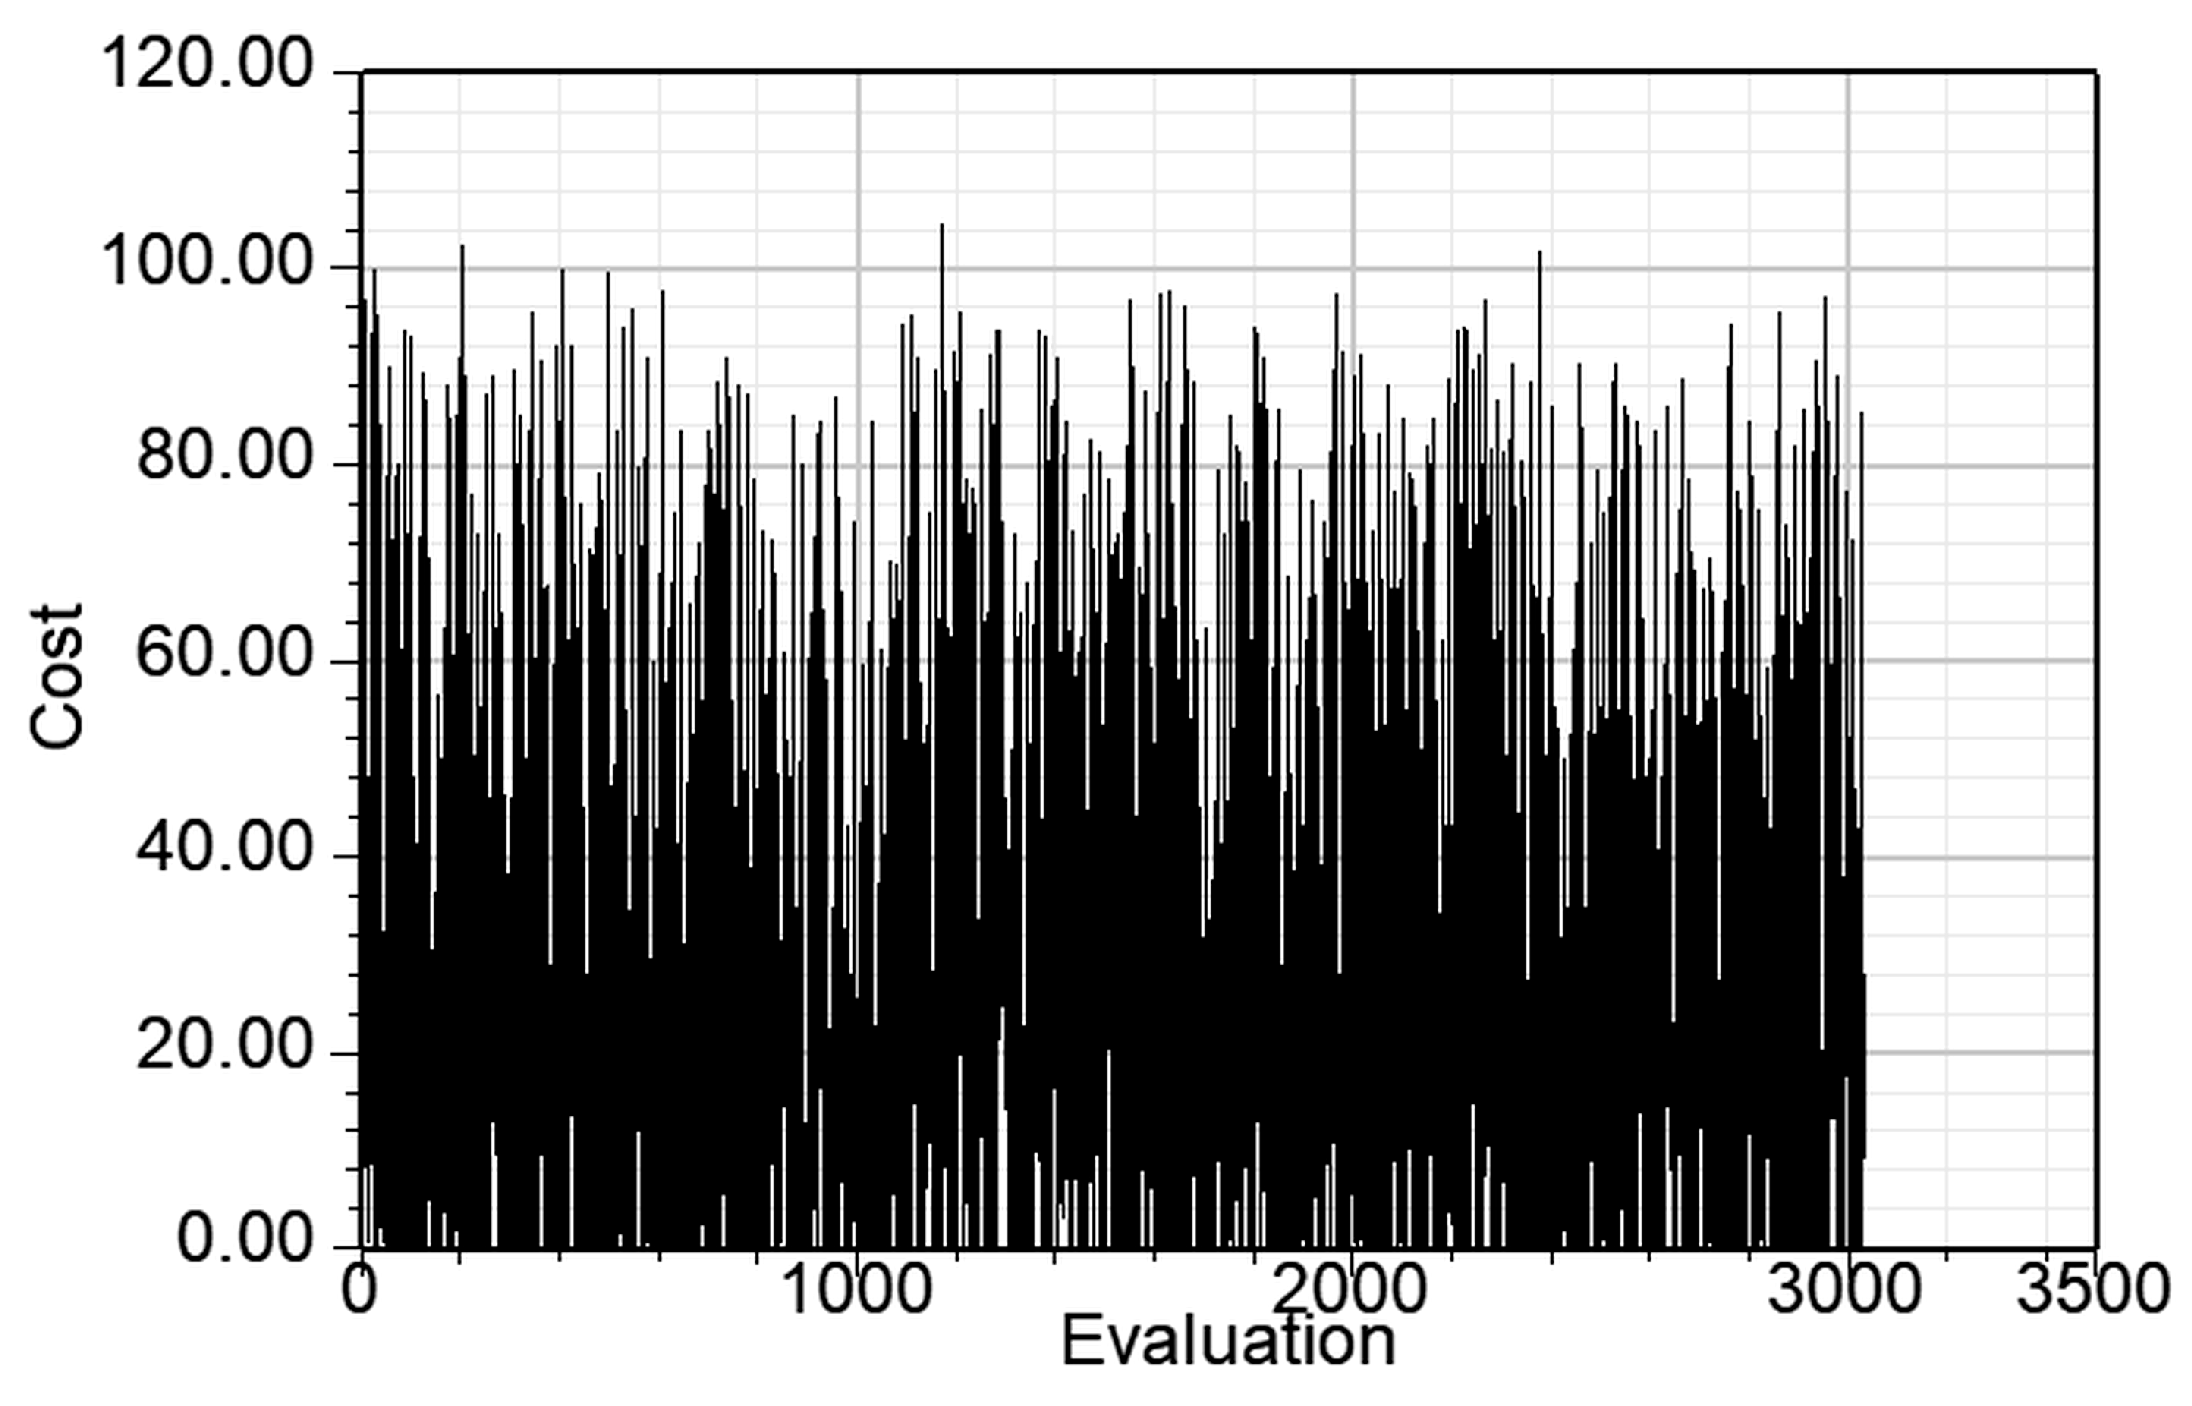
Table 11. The cost function of optimization of GAMO-OM model is given in
Figure 22.
The losses of models IM1 and OM7 are presented in
Table 7 and are categorized into stator copper losses, iron-core losses, and friction losses. The comparison between models IM1 and OM7 is performed under steady-state operation at synchronous speed and at the rated operating point. Therefore, the reported efficiency and losses correspond to steady-state operation at synchronous speed and rated load. Moreover, the optimization procedure is performed at the rated operating point. When the motor reaches synchronous speed under rated-load conditions, the permanent magnets rotate at precisely the same speed as the rotating magnetic field produced by the stator. Ideally, the fundamental magnetic field therefore produces no relative asynchronous motion or time-varying magnetic flux within the permanent magnets, resulting in zero eddy-current losses in the magnets. Therefore, the magnet losses are considered negligible under steady-state, rated-load operation, which is the operating condition used for the optimization.
Similarly, under steady-state synchronous operation, no current is induced in the damper-cage winding because there is no relative motion between the fundamental rotating magnetic field and the rotor. Consequently, the damper cage does not produce losses at synchronous speed under steady-state conditions. Therefore, the damper cage winding does not contribute to the losses during steady-state synchronous operation, which is the operating condition considered in the optimization procedure. Accordingly, the copper losses at steady-state synchronous speed and rated load correspond to the losses in the stator winding and are reported as stator copper losses in
Table 7.
Regardless of efficiency, each LSSM model must successfully synchronize with the supply network and maintain synchronous speed even under sudden load variations. Therefore, the transient speed responses of models IM1 and OM7 under acceleration with a constant load torque of 13.9 Nm and a moment of inertia of J = 0.02 kg·m
2 are presented in
Figure 2a and
Figure 12a, respectively. The starting and synchronization process under constant rated load is shorter for model IM1, whereas model OM7 exhibits a longer synchronization time, accompanied by more pronounced speed oscillations before reaching steady-state synchronous operation. In line-start synchronous motors (LSSMs), the d- and q-axis rotor resistances influence the asynchronous torque produced by the rotor cage winding. This torque counteracts the braking torque generated by the permanent magnets during the starting process. In particular, the d-axis rotor resistance contributes to an improvement in starting torque, thereby facilitating motor acceleration. The influence of the d-axis rotor resistance on synchronization is opposite in nature. A higher d-axis rotor resistance flattens the asynchronous torque characteristic, resulting in insufficient asynchronous torque to overcome the residual braking torque of the permanent magnets prior to synchronization. In contrast, a higher q-axis rotor resistance increases the starting torque and improves damping of speed oscillations, thereby enabling faster locking into synchronism.
Table 12 presents the start-up process data, including the d-axis and q-axis rotor resistances for models IM1 and OM7.
During start-up, the d-axis and q-axis rotor resistances of the IM1 model exhibit higher values compared with those of model OM7, which explains the shorter starting and synchronization time observed for IM1. In addition, the saliency ratio of IM1 is higher than that of OM7, contributing to a greater reluctance torque and enabling faster synchronization with the supply network.
Figure 3a and
Figure 13a present the transient speed characteristics of models IM1 and OM7 under variable-load conditions. For model IM1, a step load increase from 5 Nm to 13.9 Nm and a moment of inertia of J = 0.02 kg·m
2 is applied at 0.8 s, whereas for model OM7 the same load step is applied at 1.5 s. Similar to the case of acceleration under constant load, model IM1 accelerates and synchronizes with the network faster than model OM7. Following the load variation, the operation of IM1 stabilizes within approximately 0.25 s, while the stabilization and synchronization of OM7 require a longer time, approximately 0.5 s. The magnetic flux density distribution of models IM1 and OM7 is presented in
Figure 4a and
Figure 14, respectively.
The starting and synchronization capability of the optimized model OM7 is additionally evaluated after the parameter optimization using a separate software module that enables the analysis of the motor’s transient characteristics. The synchronization capability of an LSSM with salient poles and permanent magnets depends, among other factors, on the total inertia of the motor–load system. Therefore, the load is modelled separately and incorporated into the transient model together with its inertia. In addition, the transient analysis of the optimized model considers sudden load changes and evaluates its ability to maintain synchronization with the supply network following such disturbances. These sudden load changes cannot be incorporated directly into the optimization process and are therefore modelled and analyzed separately using the motor transient model. Both motors IM1 and OM7 exhibit small localized regions of core saturation in the vicinity of the stator teeth. However, the majority of the motor cross-section in both designs remains unsaturated, allowing operation within the linear region of the magnetization characteristic.
Equally important is to discuss the economic benefits that will arise from usage of the motor with higher efficiency (replacement of model IM1 with OM7) that will rise the efficiency of the motor from 92.087% to 93.76%. The increase in efficiency come with increased production costs generated mainly from the increase in permanent magnet weight from 0.68 kg in OM7 model compared with 0.47 kg in IM1 model. Additionally, the increase of copper weight in stator winding is found in model OM7 in comparison with IM1. Although OM7 has lower number of winding turns than IM1 the wire diameter in OM7 is increased that resulted in increased slot fill factor in OM7 thus the higher efficiency. The cooper weight of stator winding in IM1 is 2.79 kg while in OM7 is 3.22 kg. The increase in steel laminations contributes insignificantly in the increase of overall material costs. The incremental cost due to material increase in OM7 is estimated approximately to 35 EUR. In this cost is not foreseen the increase in working hours due to more complex mounting process of copper winding in OM7 resulting from higher slot fill factor. Annual energy saving can be calculated according to [
43]:
where
P is the motor rated power (kW),
AES is the annual energy savings (kWh),
L is the load factor,
hr is the annual operating hours, η
std is the efficiency of the motor before optimization, and η
hem is the efficiency of the high-efficiency motor, i.e., after the optimization. The efficiency values are expressed as decimal numbers in Equation (3). The annual electricity cost savings associated with the energy savings can be calculated as:
where C
e is the average energy cost (EUR/kWh). The payback period is calculated from:
The above-described method is implemented in calculating the payback period for IM1 is replaced by OM7. The replacement is calculated for 2920 operating hours and 4020 operating hours. The average price of electricity is considered to be 0.15 EUR/kWh in North Macedonia and the incremental costs for replacing the IM1 with OM7 is 35 EUR. The load factor is set to 0.9. Based on the data presented above, the results for annual savings and the payback period are summarized in
Table 13. The simple payback period depends on the number of operating hours. If motor has more operating hours the payback of the investment is faster. The presented economic analysis does not take into account the complexity of the wiring of stator winding in model with the higher efficiency, i.e., the more working hours needed or the costs of the specialized tools needed for achieving the high slot fill factor. The increase in the motor efficiency is the trade-off between increased production costs and energy savings. The industrial consumers with high number of low power electric motors might find beneficial to replace them with motors with higher efficiency due to energy savings and relatively short payback period.
5. Conclusions
Line-start synchronous motors (LSSMs) with salient poles and permanent magnets exhibit a relatively complex rotor structure, consisting of salient poles with embedded magnets and a damper winding, i.e., a squirrel-cage winding integrated into the rotor poles. Despite this complexity and the associated manufacturing cost, LSSMs have gained significant attention due to their high efficiency and near-unity power factor. Designing such machines presents several challenges in achieving an optimal compromise among efficiency, synchronization capability, and production cost. This paper addresses selected aspects that contribute to a better understanding of the influence of few design parameters on synchronization performance and efficiency. The influence of the number of damper bars and their dimensions is analyzed in this study. The selection of the number of damper bars must be carefully coordinated with the pole arc length and their geometric dimensions. The motor is evaluated with five, six, and seven damper bars, where the configurations with six and seven bars employ smaller and identical bar dimensions compared with the five-bar design. Due to the higher saliency ratio, which enhances the reluctance torque contribution, the model with five damper bars exhibits improved synchronization performance. In addition, this configuration provides a higher starting torque compared with the other two investigated designs. This model is selected for further optimization with respect to the air-gap length, number of conductors per stator slot, machine length, and magnet thickness. The optimetric analysis, in which multiple motor models are generated by varying the aforementioned parameters within predefined ranges, is adopted as the optimization method. The results indicate that several motor models achieve the highest or near-highest efficiency values and can therefore be considered as candidate optimal solutions. However, these models differ in terms of net motor mass and, consequently, production cost. The selection of the optimized model based on optimetric analysis strongly depends on the thoroughness and experience of the designer in evaluating a large number of generated motor models, and may therefore be subject to a degree of subjective influence. For this reason, the optimal solution obtained from the optimetric analysis is additionally verified using GA optimization. The parameter values obtained from GA optimization often require rounding for practical engineering and manufacturing implementation. In the analyzed case, rounding the optimized parameter values may lead to a motor design that does not correspond to the highest achievable efficiency. However, the computational capability of optimetric analysis becomes limited when a larger number of variables or broader variation ranges are considered. In the present study, optimetric analysis provides a comprehensive overview by generating a large number of motor models. It is observed that, in addition to the model with the highest efficiency, there exists a design with nearly the same efficiency but a considerably lower net mass compared with the efficiency-optimal solution. In this way, the designer can achieve a reasonable compromise between efficiency and cost when selecting the optimized motor model. The efficiency is increased to 93.76% in the optimized model compared with 92.08% in the initial design, at the expense of an increase in the net motor mass from 14.99 kg to 15.9 kg. The analysis of the influence of each varied parameter on motor efficiency indicates that the number of conductors per slot has the most significant impact, followed by the air-gap length. An increase in the number of conductors per slot leads to a reduction in efficiency, whereas a decrease in air-gap length results in improved efficiency. However, the air-gap length is constrained by manufacturing limitations related to the minimum achievable value. The influence of magnet thickness and machine length on efficiency is moderate, with increases in both parameters resulting in higher efficiency. Nevertheless, magnet thickness should be carefully selected, as excessively thick magnets may produce a higher braking torque during motor start-up, which can adversely affect synchronization. The synchronization capabilities of the initial and optimized models were also investigated. Owing to its higher saliency ratio and larger d-axis and q-axis rotor resistances, the initial model exhibits faster acceleration and achieves synchronization with the supply network in a shorter time than the optimized model. Furthermore, the initial model demonstrates superior damping of speed oscillations caused by sudden load variations, resulting in shorter transient periods and faster re-establishment of synchronous operation following load changes. The optimization resulted in a motor model with improved efficiency but increased net mass and inferior transient response characteristics, although successful synchronization was achieved under all investigated operating conditions. These findings demonstrate that careful and comprehensive analysis is required when optimizing LSSMs, as improving one performance characteristic may adversely affect others. Consequently, the optimal design should be selected by considering the overall machine performance rather than a single optimization objective. The selected design variables for optimization are simple to implement, and their modification does not require significant production costs. Consequently, the proposed design changes can be readily incorporated into the existing manufacturing process.
However, the presented results are based on software simulations. In practice, the efficiency of a manufactured prototype is expected to be slightly lower due to manufacturing tolerances, material property variations, and additional losses that are not fully accounted for in the simulation model. More specifically, manufacturing tolerances associated with the air-gap length may reduce the motor efficiency. The air-gap length of 0.4 mm in the optimized model requires high-precision machining, tight bearing tolerances, and careful control of rotor eccentricity, which may present a manufacturing challenge. Therefore, a larger air gap may be required for practical manufacturing of the optimized design. As shown in
Figure 18, increasing the air-gap length from 0.4 mm to 0.6 mm, i.e., by 0.2 mm compared with the optimized OM7 model, reduces the motor efficiency from 93.76% to approximately 93%. The software models are based on SmCo28 permanent magnets and M19-24G electrical steel laminations. Compared with high-grade NdFeB magnets, SmCo28 magnets have lower remanent flux density (B
r) at room temperature and are generally more expensive. Therefore, for large-scale production, the use of NdFeB magnets may represent a more economically feasible solution. At room temperature, NdFeB magnets exhibit higher maximum energy product (BH
max) and remanent flux density, resulting in a stronger air-gap magnetic field and higher magnet torque. Consequently, at an ambient temperature of 20 °C, NdFeB magnets can provide higher efficiency and higher torque density. However, at elevated temperatures above approximately 150 °C, SmCo28 magnets offer superior thermal stability, more stable torque characteristics, and a lower risk of irreversible demagnetization. Therefore, the selection of the permanent magnet material should consider both the operating temperature and the economic requirements of the application. The specific core losses of electrical steel laminations, which depend on the grade and properties of the material, can contribute to variations in the efficiency of a real-world prototype. For example, the electrical steel used in the presented model, M19-24G, has specific core losses of approximately 2.7 W/kg at 50 Hz and 1.5 T, whereas M15-26G exhibits lower specific losses of approximately 2.1 W/kg under the same conditions. In contrast, M43 and M45 grades exhibit higher specific core losses, ranging from approximately 3.5 to more than 4.5 W/kg at 1.5 T and 50 Hz, due to their lower silicon content and, in some cases, greater lamination thickness. However, these grades can provide a more cost-effective solution for lower-duty motor applications. Therefore, the final performance and efficiency of the physical prototype will depend strongly on the selected materials, manufacturing processes, and dimensional tolerances. In practical motor design, the selection of materials and manufacturing tolerances often represents a compromise between electromagnetic performance, manufacturing complexity, and overall cost.