Article

Exploration of the Inner-to-Outer Diameter Ratio Limit of Field Shaper in Electromagnetic Pulse Tube Forming

1
State Key Laboratory of Advanced Design and Manufacturing Technology for Vehicle, Hunan University, Changsha 410082, China
2
China Yangtze Power Co., Ltd. (CYPC), Wuhan 430000, China
3
National Engineering Research Center of Water Resources Efficient Utilization and Engineering Safety, Nanjing 210000, China
*
Author to whom correspondence should be addressed.
Machines 2026, 14(9), 1014; https://doi.org/10.3390/machines14091014
Submission received: 22 July 2026 / Revised: 30 August 2026 / Accepted: 31 August 2026 / Published: 7 September 2026

Abstract

Field shapers concentrate electromagnetic forces on tubes during electromagnetic pulse tube forming and strongly influence deformation capability. This study investigates how the field shaper’s inner-to-outer diameter ratio limits tube compression. A Kirchhoff-law-based analytical model was combined with coupled electromagnetic-mechanical simulations and experiments. The model predicts that increasing the inner diameter reduces both inner-surface current and magnetic pressure. Meanwhile, the hoop-stress indicator first increases and then decreases because the tube radius and pressure exert competing effects. Under the investigated geometry and operating conditions, the favorable inner-to-outer diameter ratio ranges from 0.15 to 0.50. Under these conditions, current-path interference begins near 0.7 and becomes severe above 0.8, rapidly reducing inner-surface current. Experiments using 70 and 80 mm tubes validated the coupled simulation within the investigated range and supported the predicted trend. These findings guide design and indicate that larger tubes require greater field-shaper outer diameters, larger coils, and higher discharge energy.

1. Introduction

EMPTF is an advanced solid-state method used to form and join different metals without melting [1]. It uses transient electromagnetic force to push one tubular part onto another at high speed [2,3]. EMPTF for welding could avoid intermetallic compounds due to melting [4] and increase the joining strength. Further, EMPTF is supplied by electromagnetic energy and is considered green manufacturing technology [5]. While much of the existing literature focuses on achieving a metallurgical bond, the fundamental physical prerequisite for any such application is the high-speed radial deformation of the tube [6]. When this pure deformation is utilized to tightly compress or mechanically lock tubes together, it represents a core capability of EMPTF [7,8]. Regardless of the final joint type, the fundamental deformation mechanics remain identical [9,10]. Consequently, the extensive literature on tubular impact joining serves as a valuable foundation for understanding tube deformation across different geometric scales.
EMPTF has been successfully applied to tubular parts across a wide range of diameters [11]. As shown in Table 1, the smallest reported compression involves T91 steel tubes with an outer diameter of 6.6 mm and a wall thickness of 0.45 mm [12]. In contrast, recent work demonstrated the effective welding of aluminum tubes with diameters up to 110 mm [13]. Between these two extremes, several studies have confirmed stable compressions at intermediate sizes, including 22.22 mm for copper–steel joints [14], 40 mm for aluminum–steel joints [15], and 80 mm [16]. These cases collectively indicate that current electromagnetic forming technologies can cover a practical tube diameter range from below 10 mm up to at least 110 mm, depending on the material combination, wall thickness, and coil configuration.
Although analytical and numerical studies have thoroughly investigated the Lorentz forces in tube crimping [17,18,19], the workable tube diameter limit for effective deformation is still unclear. Most existing studies focus on specific cases and do not explain what the maximum compression limit is under fixed conditions. The deformation capability is highly dependent on multiple process parameters, including the magnitude of the electromagnetic force, the spatial distribution of discharge energy, and the tooling geometry [20,21]. However, few studies attempt to clearly define this limit. In particular, the effect of the field shaper on the workable tube diameter has not been studied in depth. As electromagnetic forming processes are increasingly applied to large structural parts, it becomes more important to understand what determines the compression diameter limit and how it can be improved [22,23].
The field shaper plays a key role by concentrating the magnetic field and directing the electromagnetic force toward the tube [24,25]. When the tube becomes larger, the force required to achieve proper compression increases [26]. However, the ability of the field shaper to generate and focus that force does not increase without limit [27]. This suggests that there is a physical limit on how large a tube can be formed with a given field shaper design [28]. While this limitation is clear in theory, few studies have tried to define it or explain how to predict it. As the inner diameter of the field shaper increases, the focused magnetic pressure tends to decrease [29]. At the same time, a larger tube radius can lead to higher hoop stress, which may help improve deformation [30,31]. These competing effects suggest that there is an optimal size range where the compression is most effective. Understanding this relationship is important for expanding the use of EMPTF in larger applications.
In this work, an analytical model based on Kirchhoff’s laws was developed to investigate how the induced current changes with the field shaper geometry. The results show that the inner-loop current decreases as the inner diameter increases. When the diameter becomes excessively large, interference between the inner and outer loops occurs, leading to a sharp drop in the inner current. Because the magnetic pressure on the tube comes from this current, the pressure also becomes weaker. To describe the tube’s response, hoop stress was used as a new index for deformation capability. The analysis shows that hoop stress first increases and then decreases with diameter, which means that there is an optimal compression range. Simulations and experiments using field shapers corresponding to tube diameters of 70 mm and 80 mm confirmed these findings. The results provide a theoretical explanation and practical guidance for designing field shapers under the investigated conditions.

2. Methodology

2.1. Experiment

2.1.1. Experimental Principle

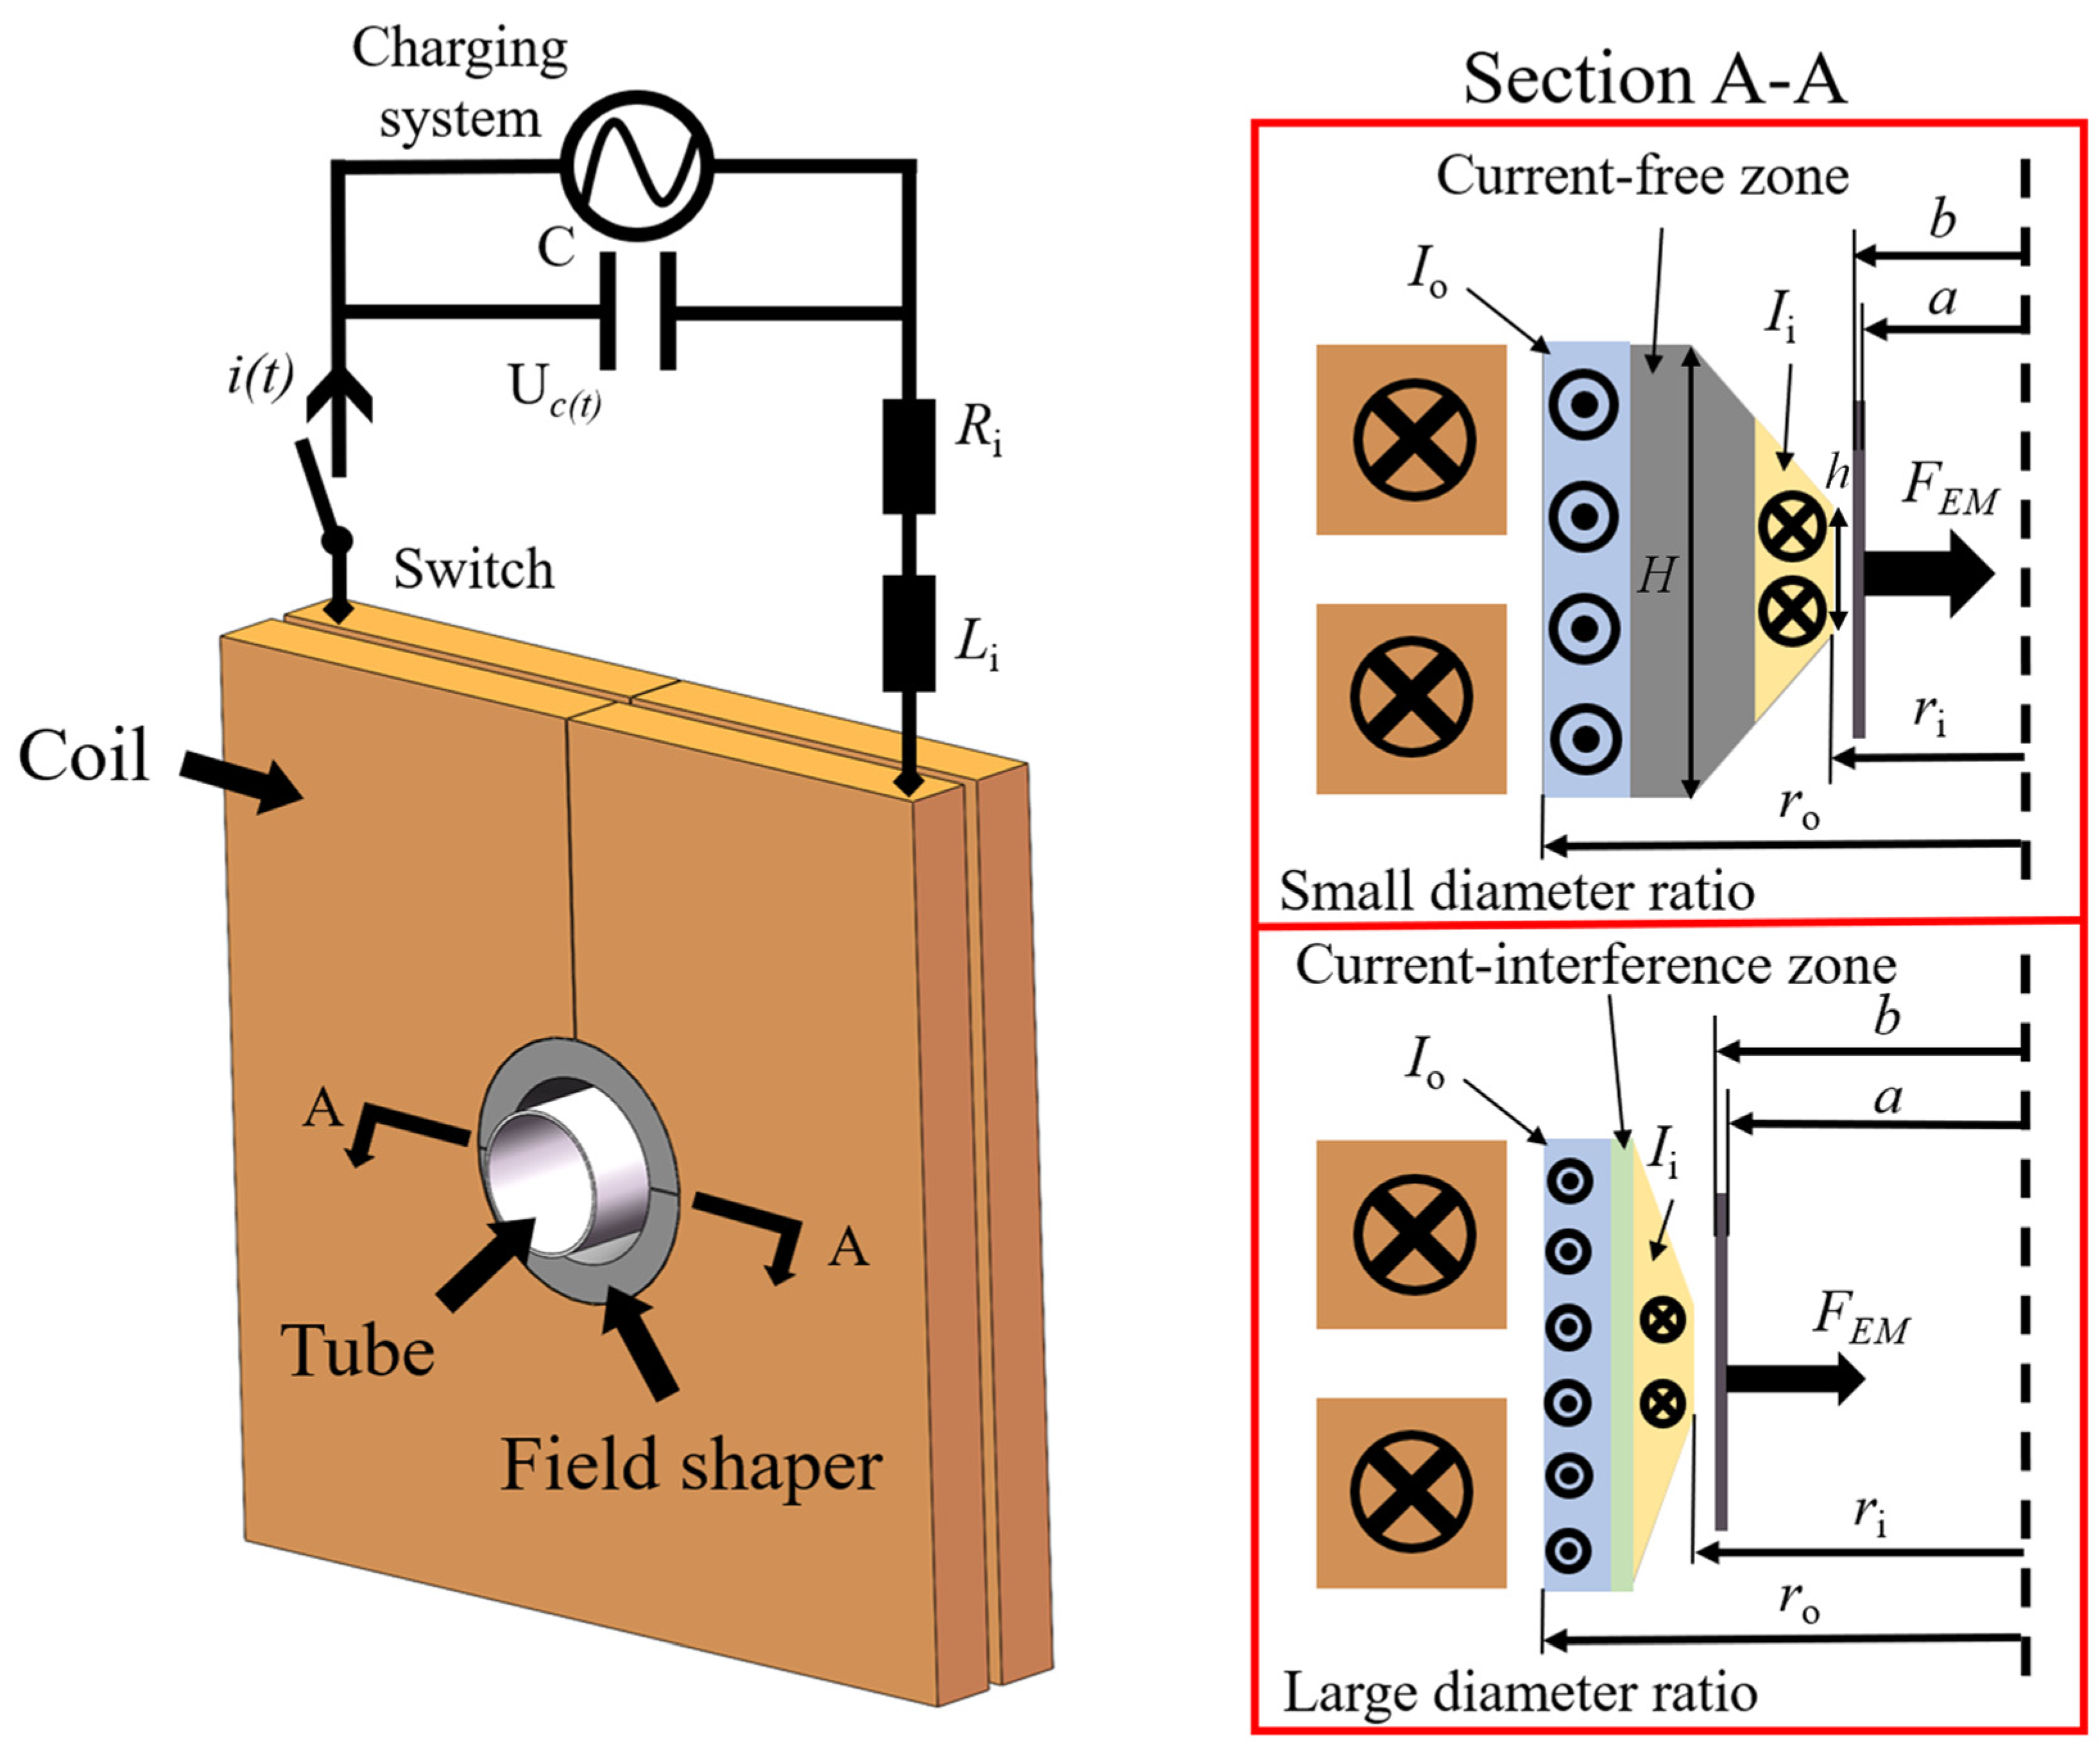
The working principle of EMPTF is illustrated in Figure 1. During the process, a high-frequency pulsed current is discharged from a capacitor bank through the coil, inducing a transient magnetic field. This field generates eddy currents in both the field shaper and the tube. The resulting Lorentz force FEM drives the tube to compress radially inward at a high velocity, experiencing severe plastic deformation.
In this system, the field shaper’s inner diameter is the critical geometric parameter that governs the current distribution. As shown in the cross-sectional views in Figure 1, when the diameter is small, a distinct current-free zone exists within the field shaper, ensuring efficient energy coupling. However, as the inner diameter increases, the field shaper’s effective wall thickness decreases relative to the skin depth. This leads to the emergence of a current interference zone, where overlapping current paths cause a significant drop in magnetic pressure. This study focuses on how this geometric transition limits the workable diameter range.
In Figure 1, ri and ro denote the inner and outer radii of the field shaper, respectively. The symbols a and b denote the inner and outer radii of the tube, respectively. The symbols H and h represent the axial heights of the outer and inner field-shaper walls, respectively.

2.1.2. Experimental Setup

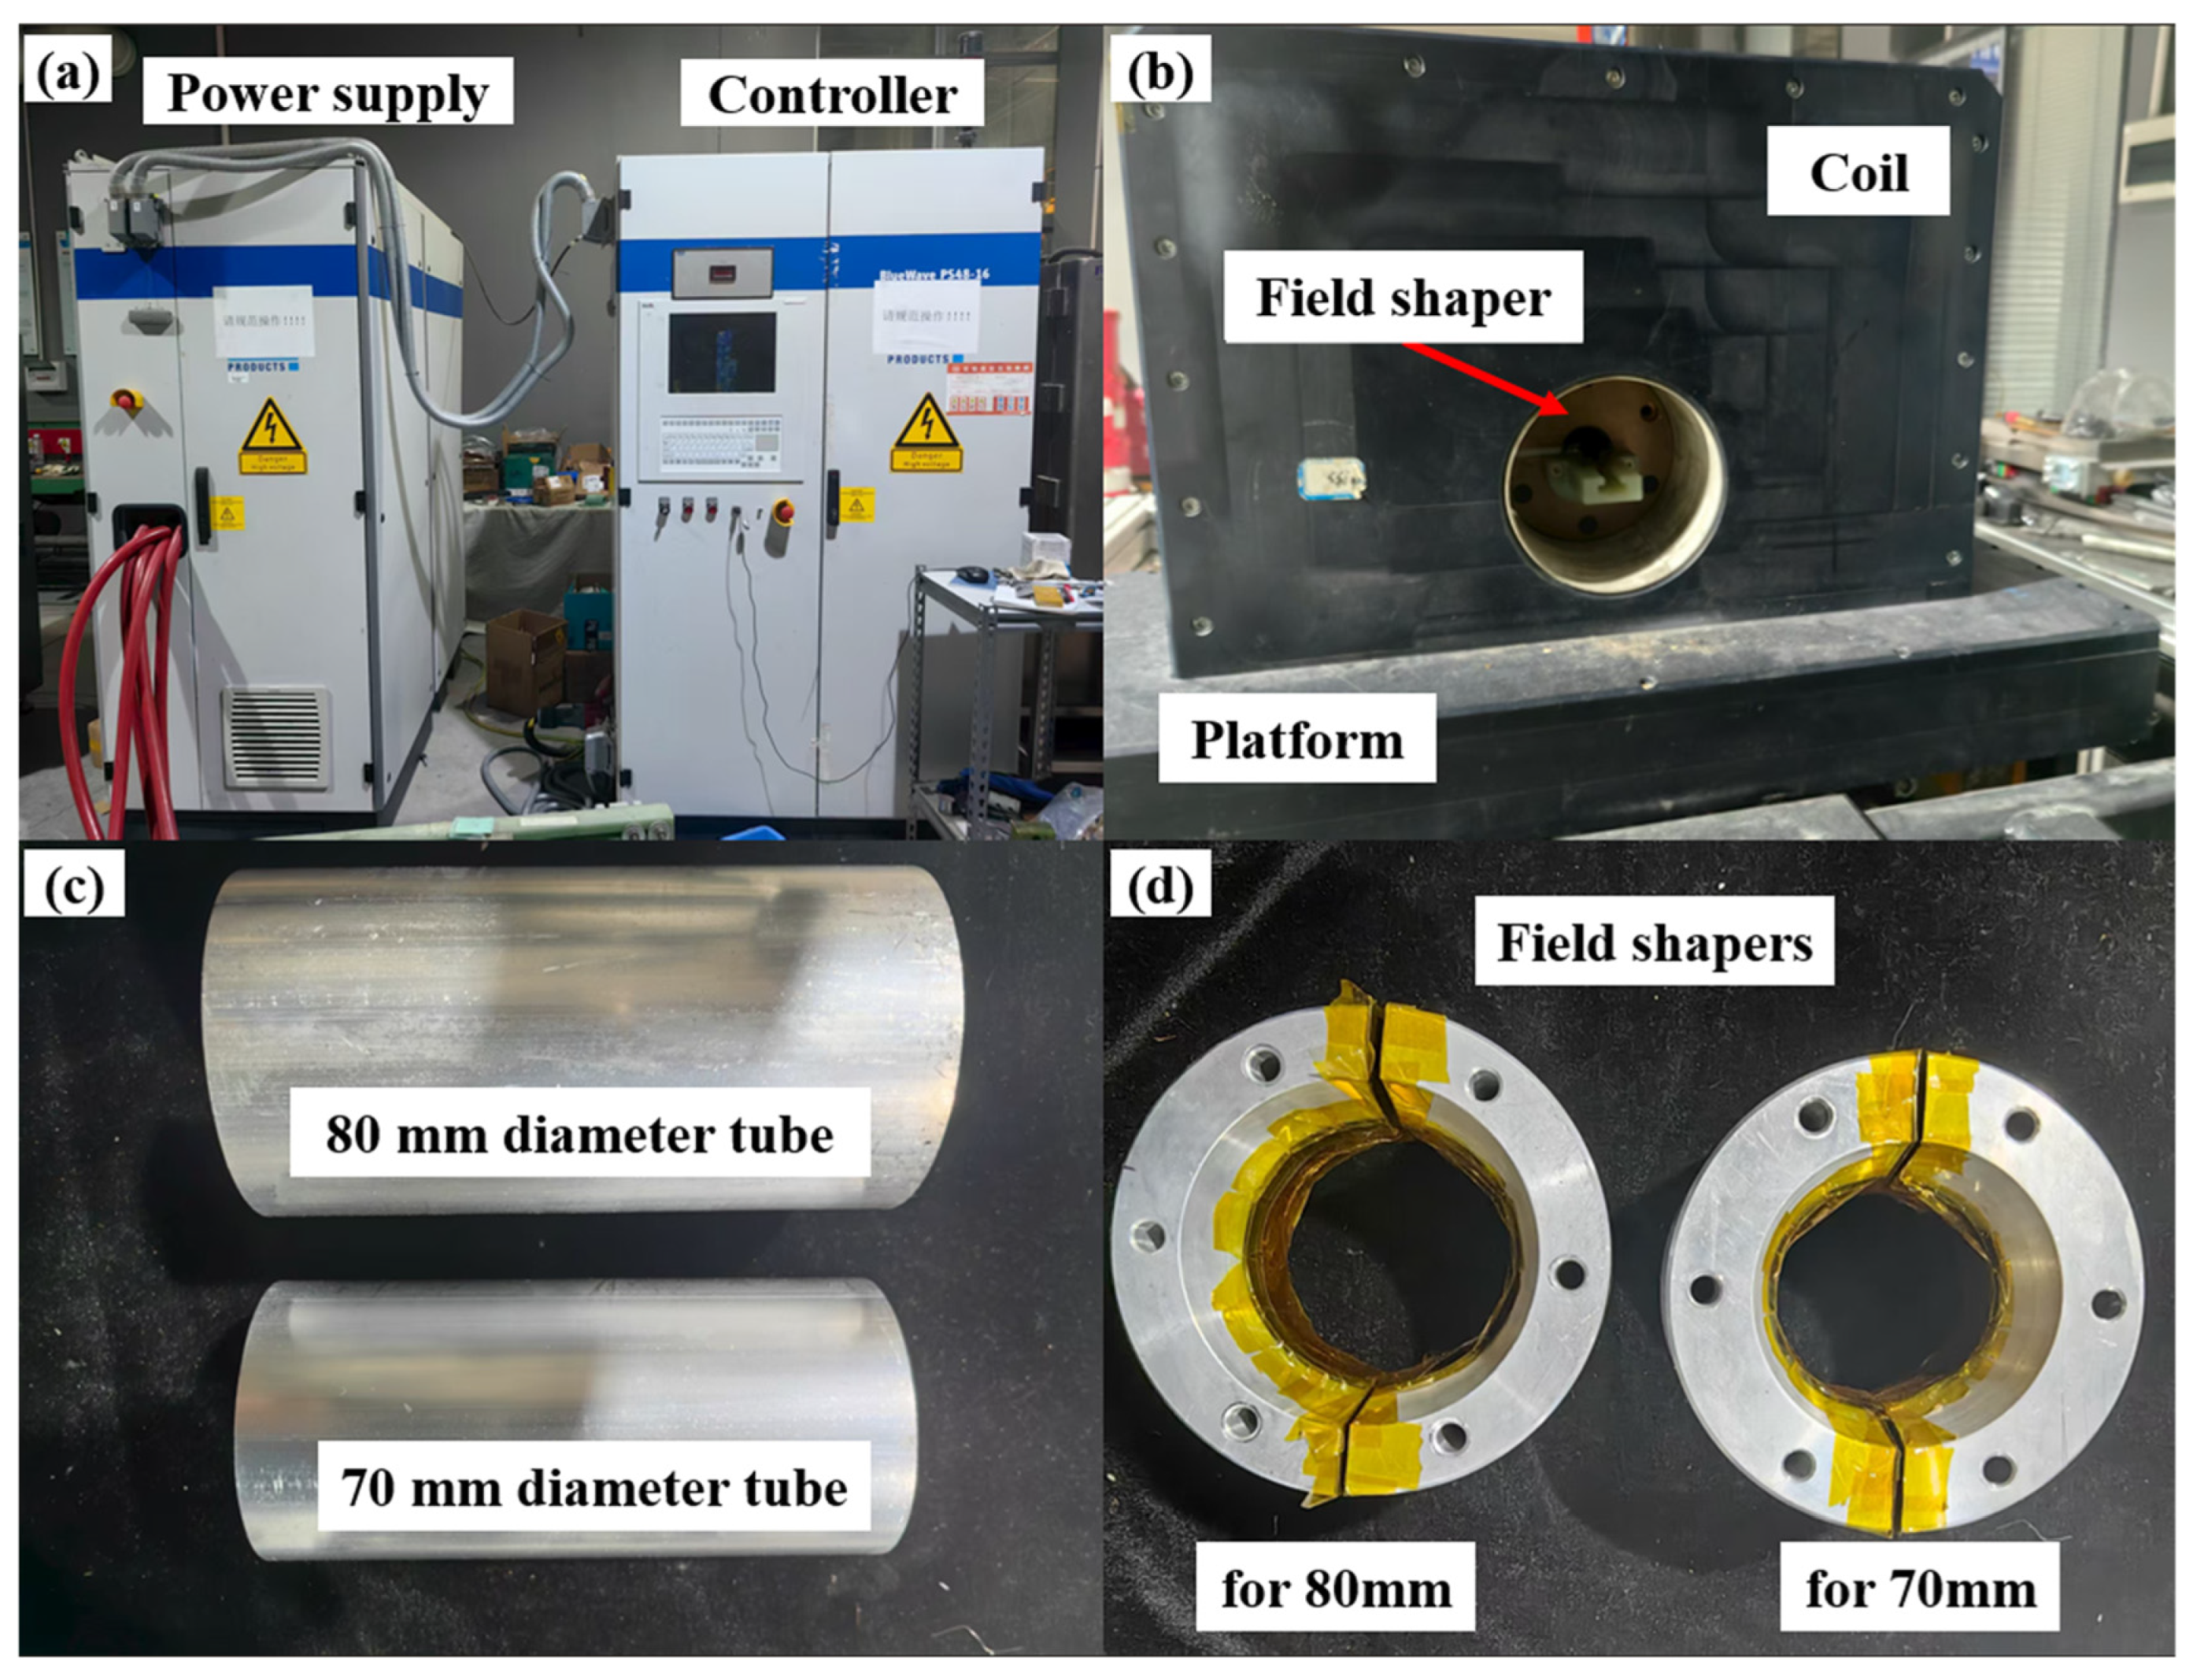
To confirm the accuracy of the simulation and analytical models, the specimens were prepared in the experiment. Figure 2 depicts the experimental equipment of EMPTF. The model of the discharge device included the controller and power supply. The power supply provides a maximum energy of 48 kJ. The current was measured by the Rogowski Coil. To investigate the effects of discharge energy and specimen size on deformation behavior, experiments were carried out using two types of field shapers in combination with aluminum tubes of 70 mm and 80 mm outer diameters. For each configuration, tests were conducted at discharge energies of 20, 23, 26, 29, 32, and 35 kJ. Each experimental condition was repeated three times. The mean relative deformation is reported, and the error bars represent one standard deviation.

2.2. Simulation

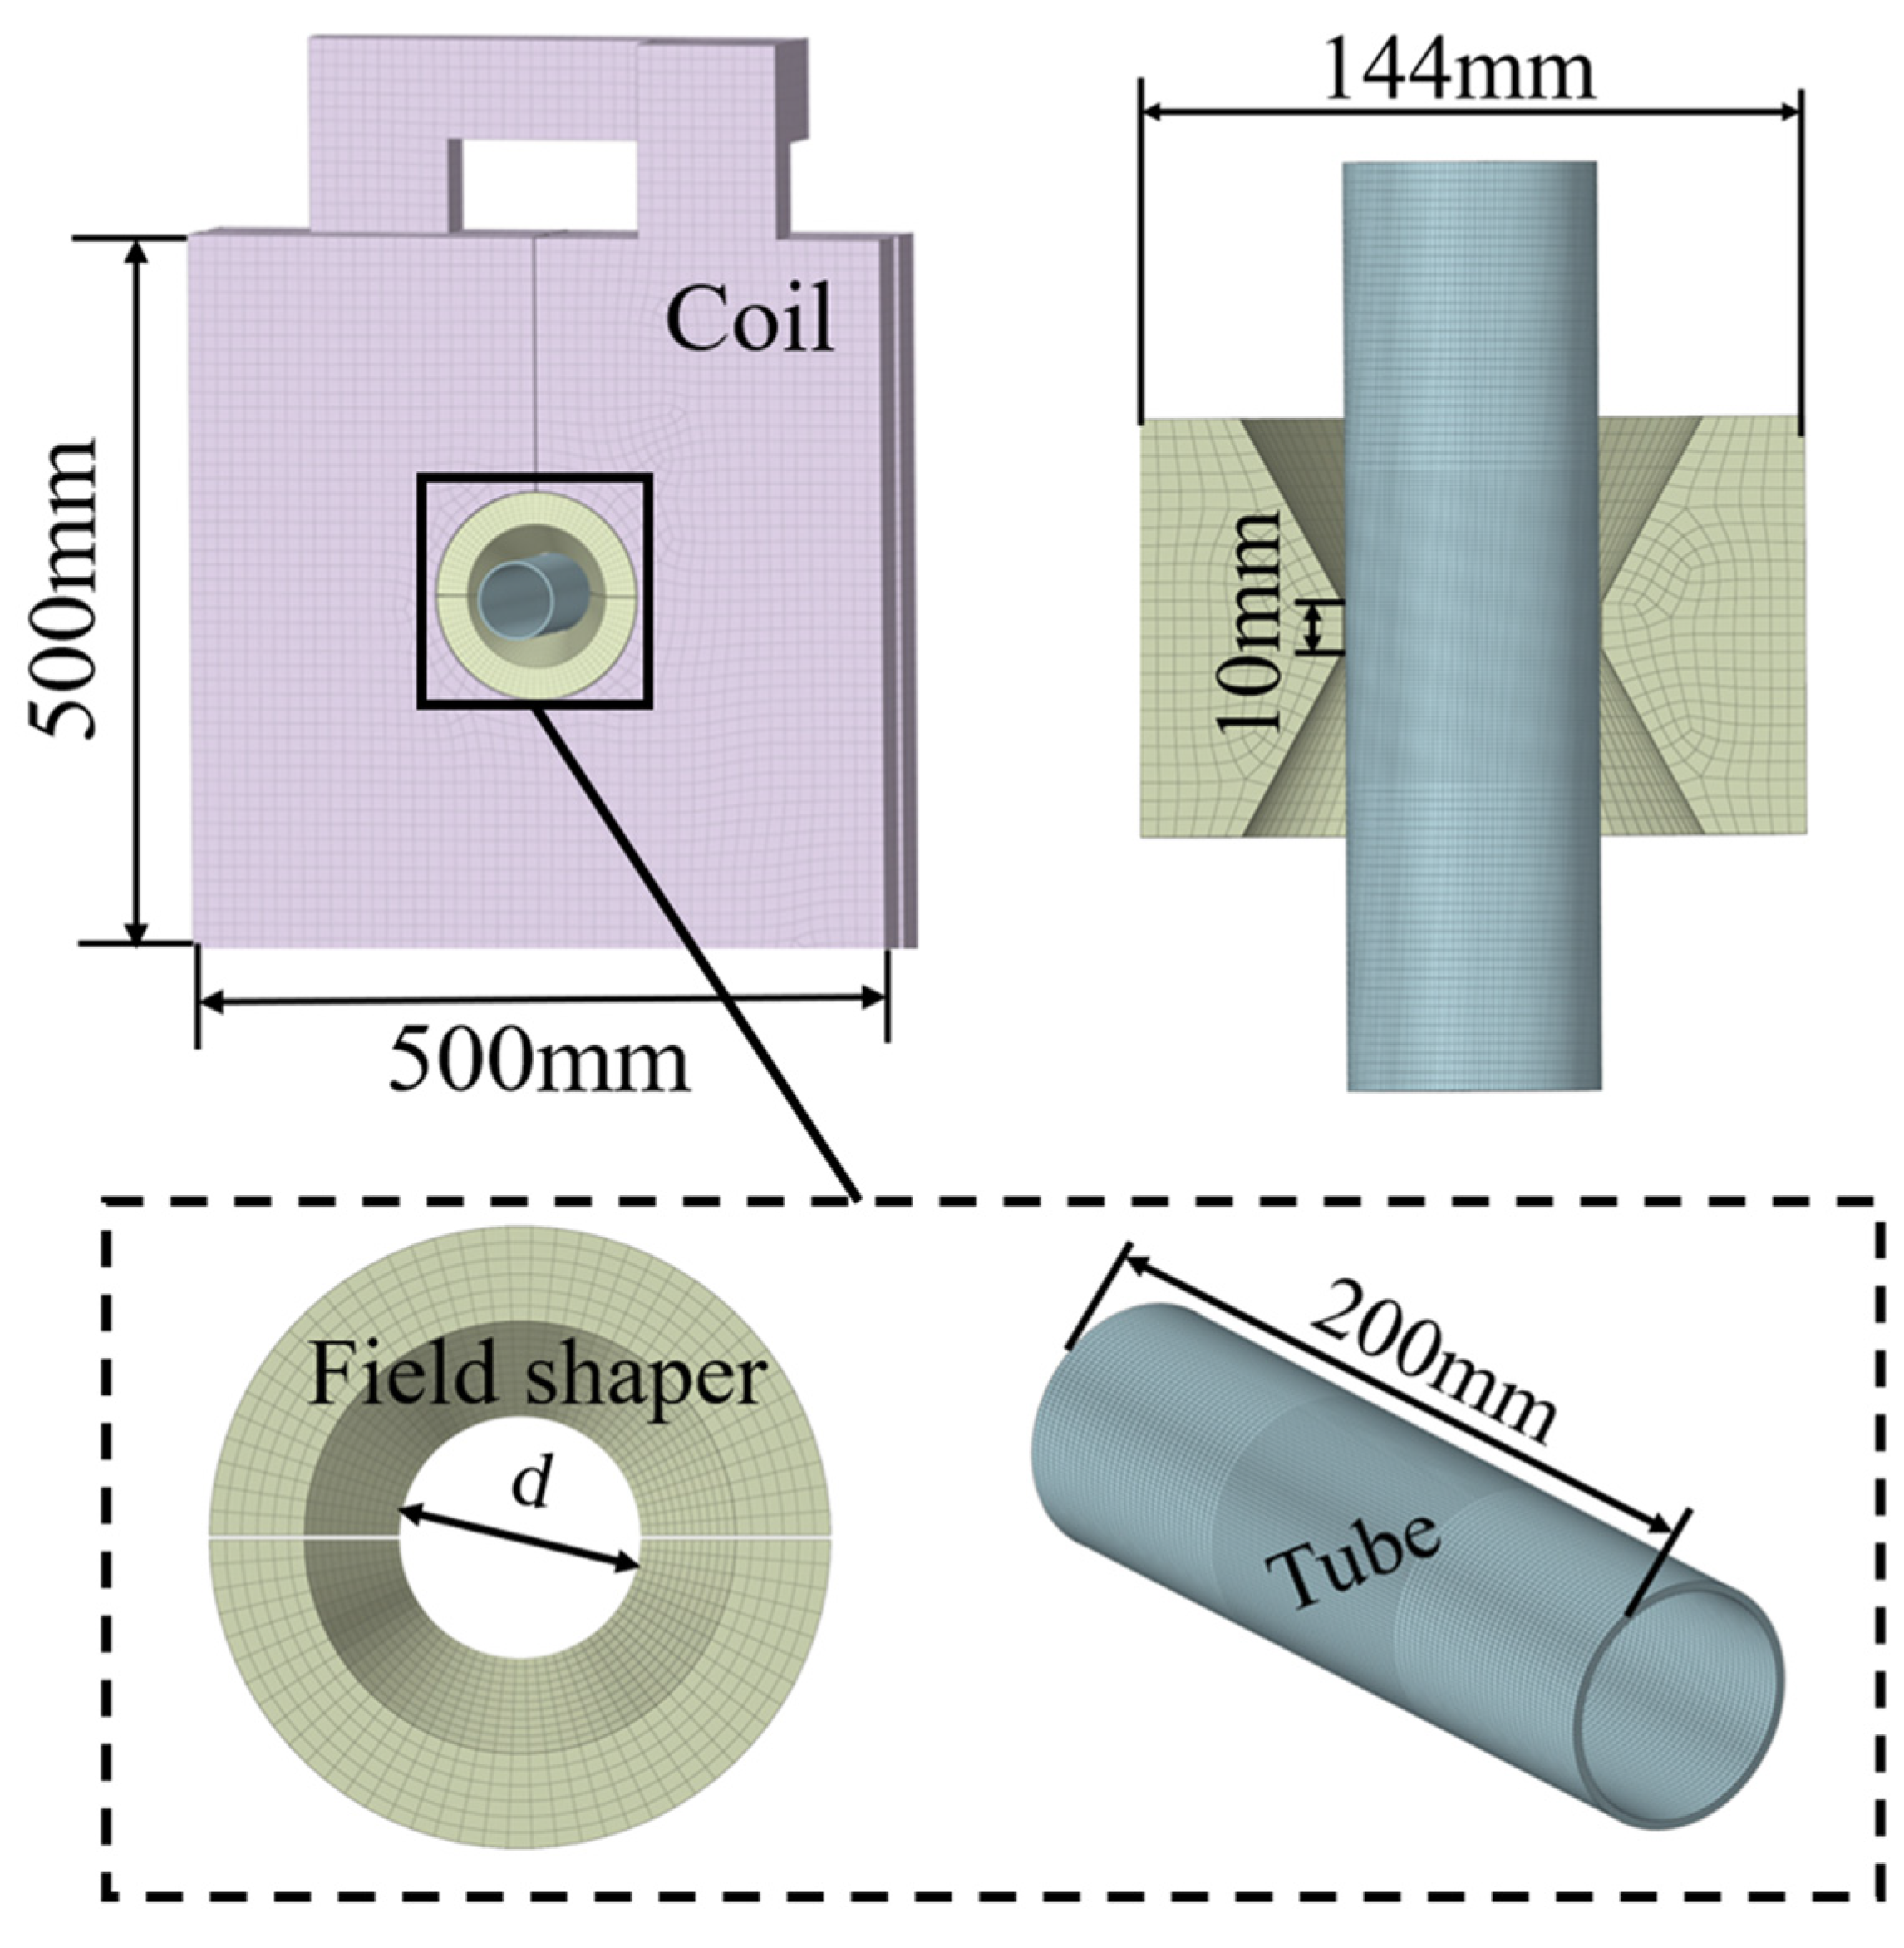
To enable further analysis, a 3D magnetic–mechanical coupling simulation model was established, as shown in Figure 3. The model used a coupled FEM–BEM method to link the magnetic and mechanical fields, which helped reduce computation time and improve accuracy. In the simulation, the electromagnetic solver calculated the magnetic field, and the mechanical solver handled the tube’s deformation. To reduce the computational cost, a finer mesh of 1 mm was used in the deformation zone, and a coarser mesh of 2 mm was applied elsewhere. Table 2 lists the material properties and electromagnetic parameters used in the simulation. The wall thickness of the tube was 2 mm, and the gap between the field shaper and the tube was set to 0.5 mm.
During the magnetic pulse deformation process, a simplified Johnson–Cook model was used. The field shaper and coil were defined as a rigid body. The constitutive equation of the simplified Johnson–Cook model is given in Equation (1).
σ = ( A + B ε n ) [ 1 + C ln ( ε r ε 0 ) ]
where σ is the equivalent stress; A, B, C, and n are the initial yield stress, hardening constant, strain rate sensitivity coefficient, and hardening exponent, respectively; and ε, εr, and ε0 denote the equivalent strain, equivalent plastic strain rate, and reference plastic strain rate, respectively. This constitutive law determines the strain-rate-dependent flow stress during transient deformation. The material parameters for the tube are listed in Table 3 [32].
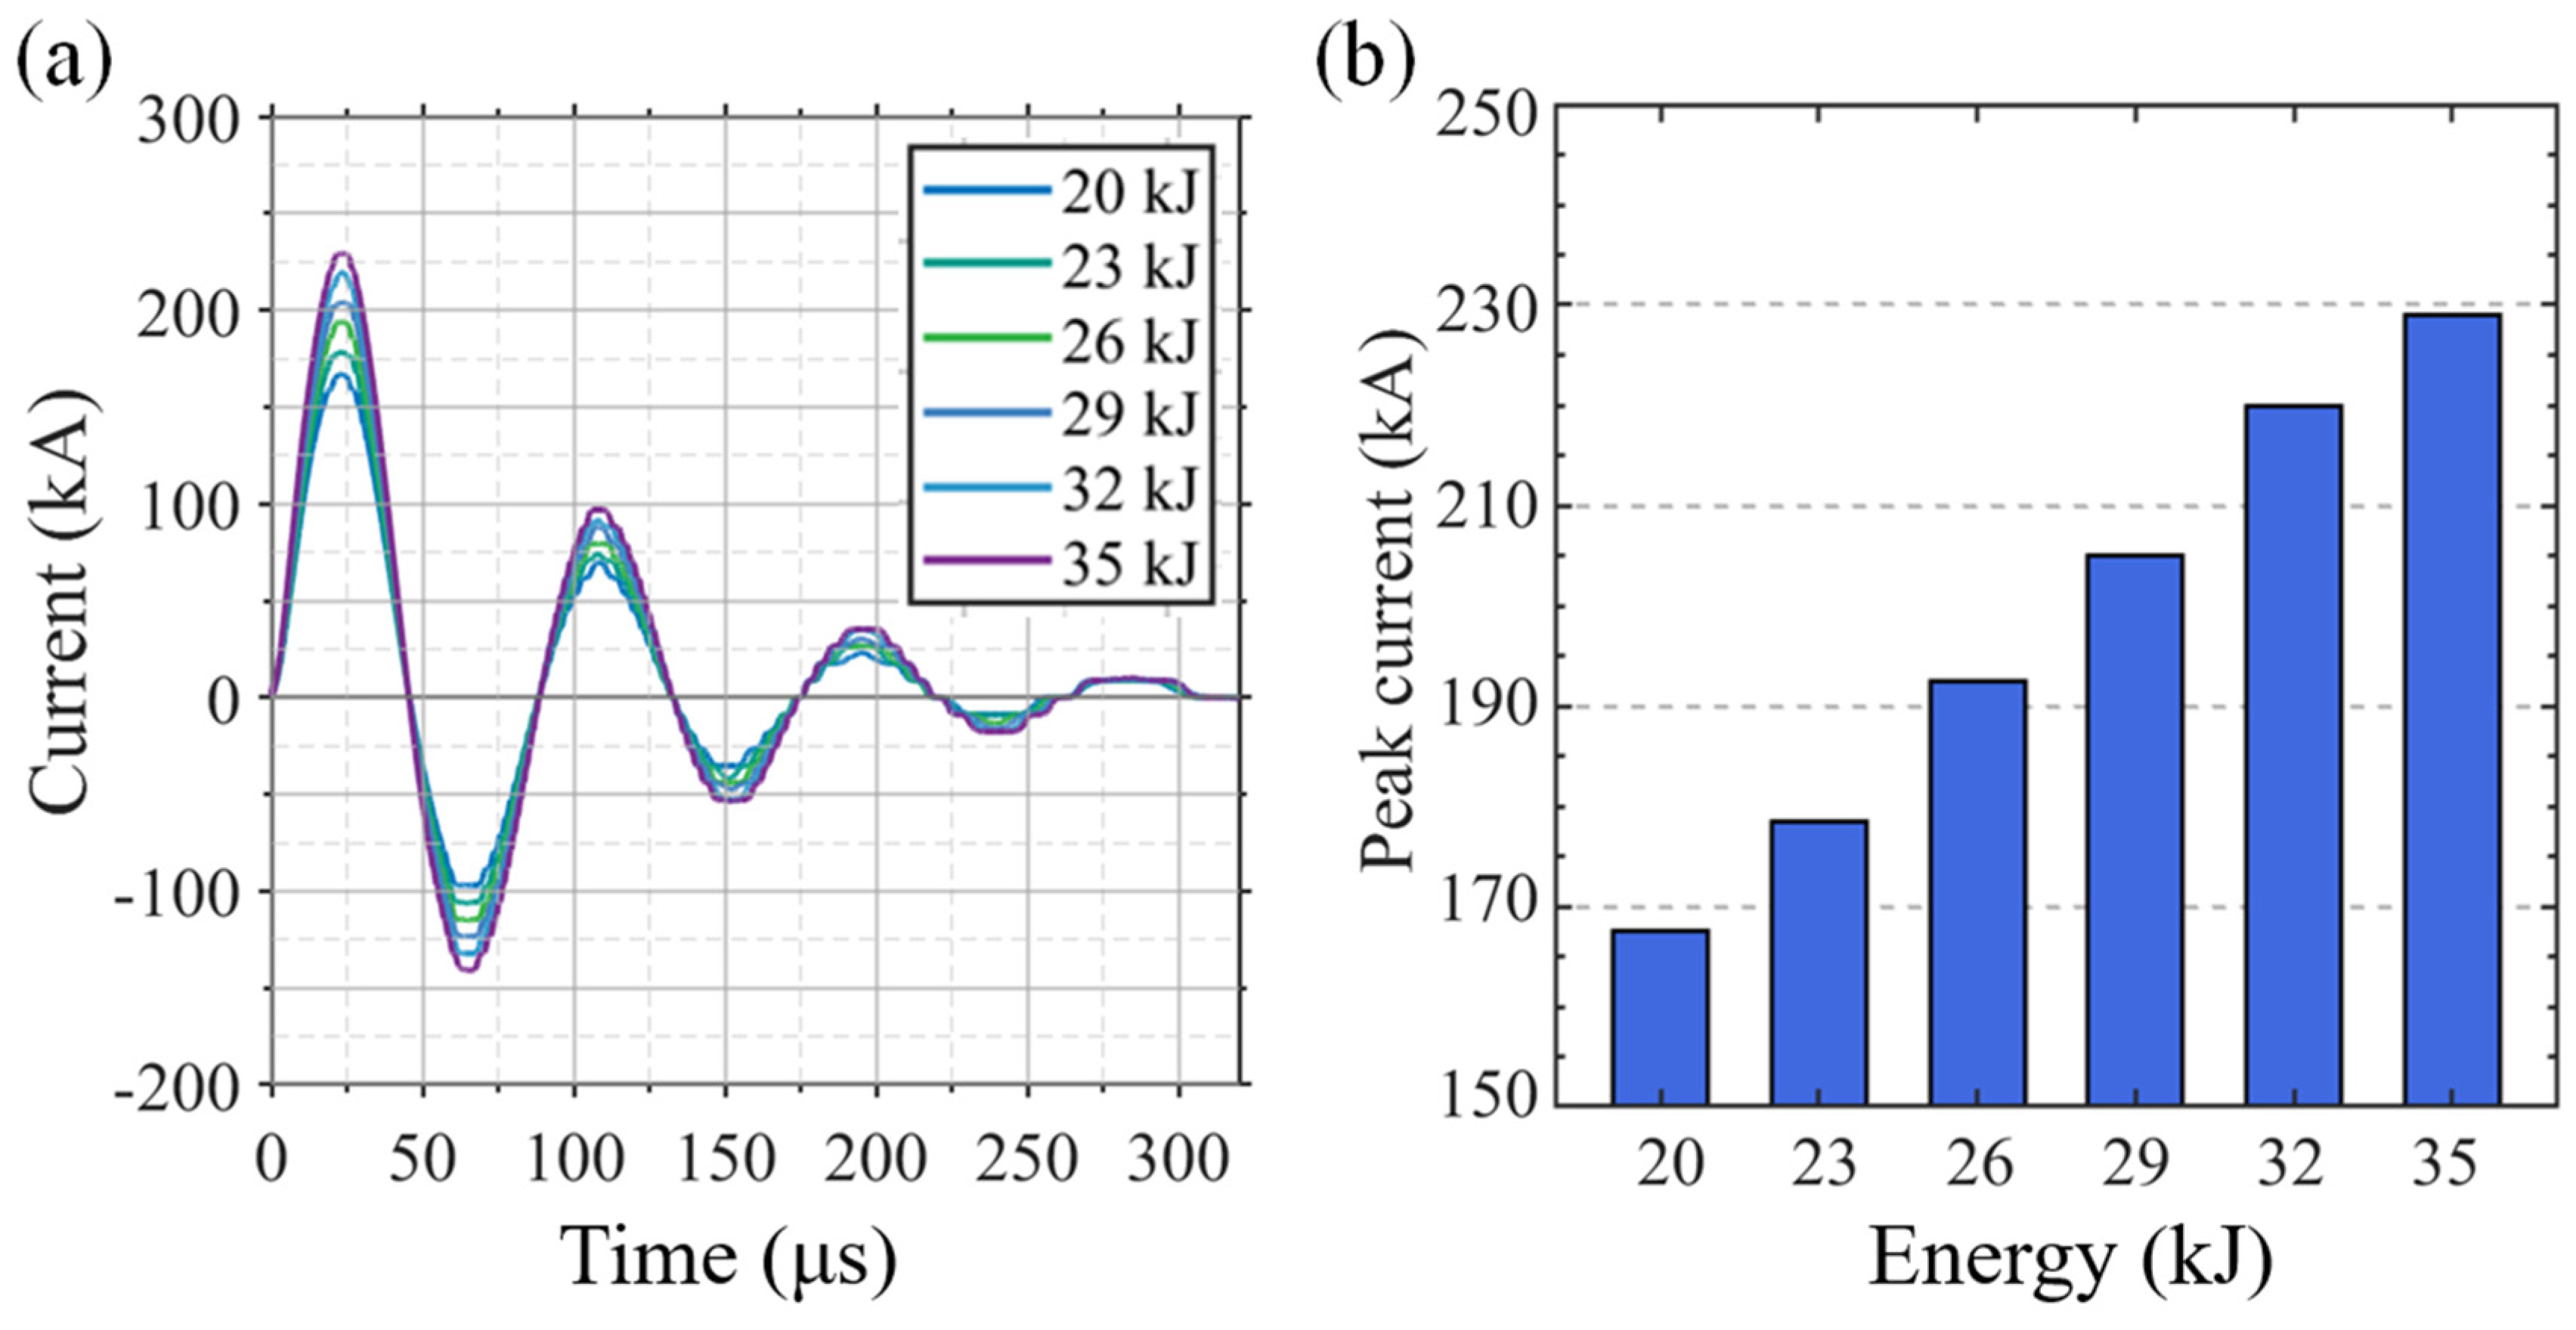
Since the deformation mainly occurs in the first half cycle of the discharge process, only the first current pulse is used as the excitation. To improve the fidelity of the simulation, the excitation current waveform was directly extracted from the experimental discharge data, as shown in Figure 4. The electromagnetic solution was transient throughout the entire current pulse. It retained self-induction, mutual coupling, eddy-current diffusion, and skin effects. Therefore, inductive effects were included when determining the nonuniform current distributions in the conductors. It also resolves proximity effects and local current crowding.
The electromagnetic time step was set to 0.10 μs. Time-step sensitivity was evaluated using the representative 35 mm model. The peak inner-surface current density was selected as the comparison index. Table 4 summarizes the results.
Reducing the time step from 0.10 to 0.05 μs changed the peak value by only 2.35%. Therefore, a time step of 0.10 μs was adopted for subsequent simulations.
These simulation settings provided the basis for analyzing how the field shaper geometry influences tube deformation behavior.

3. Results and Discussion

3.1. Validation of the Simulation Model

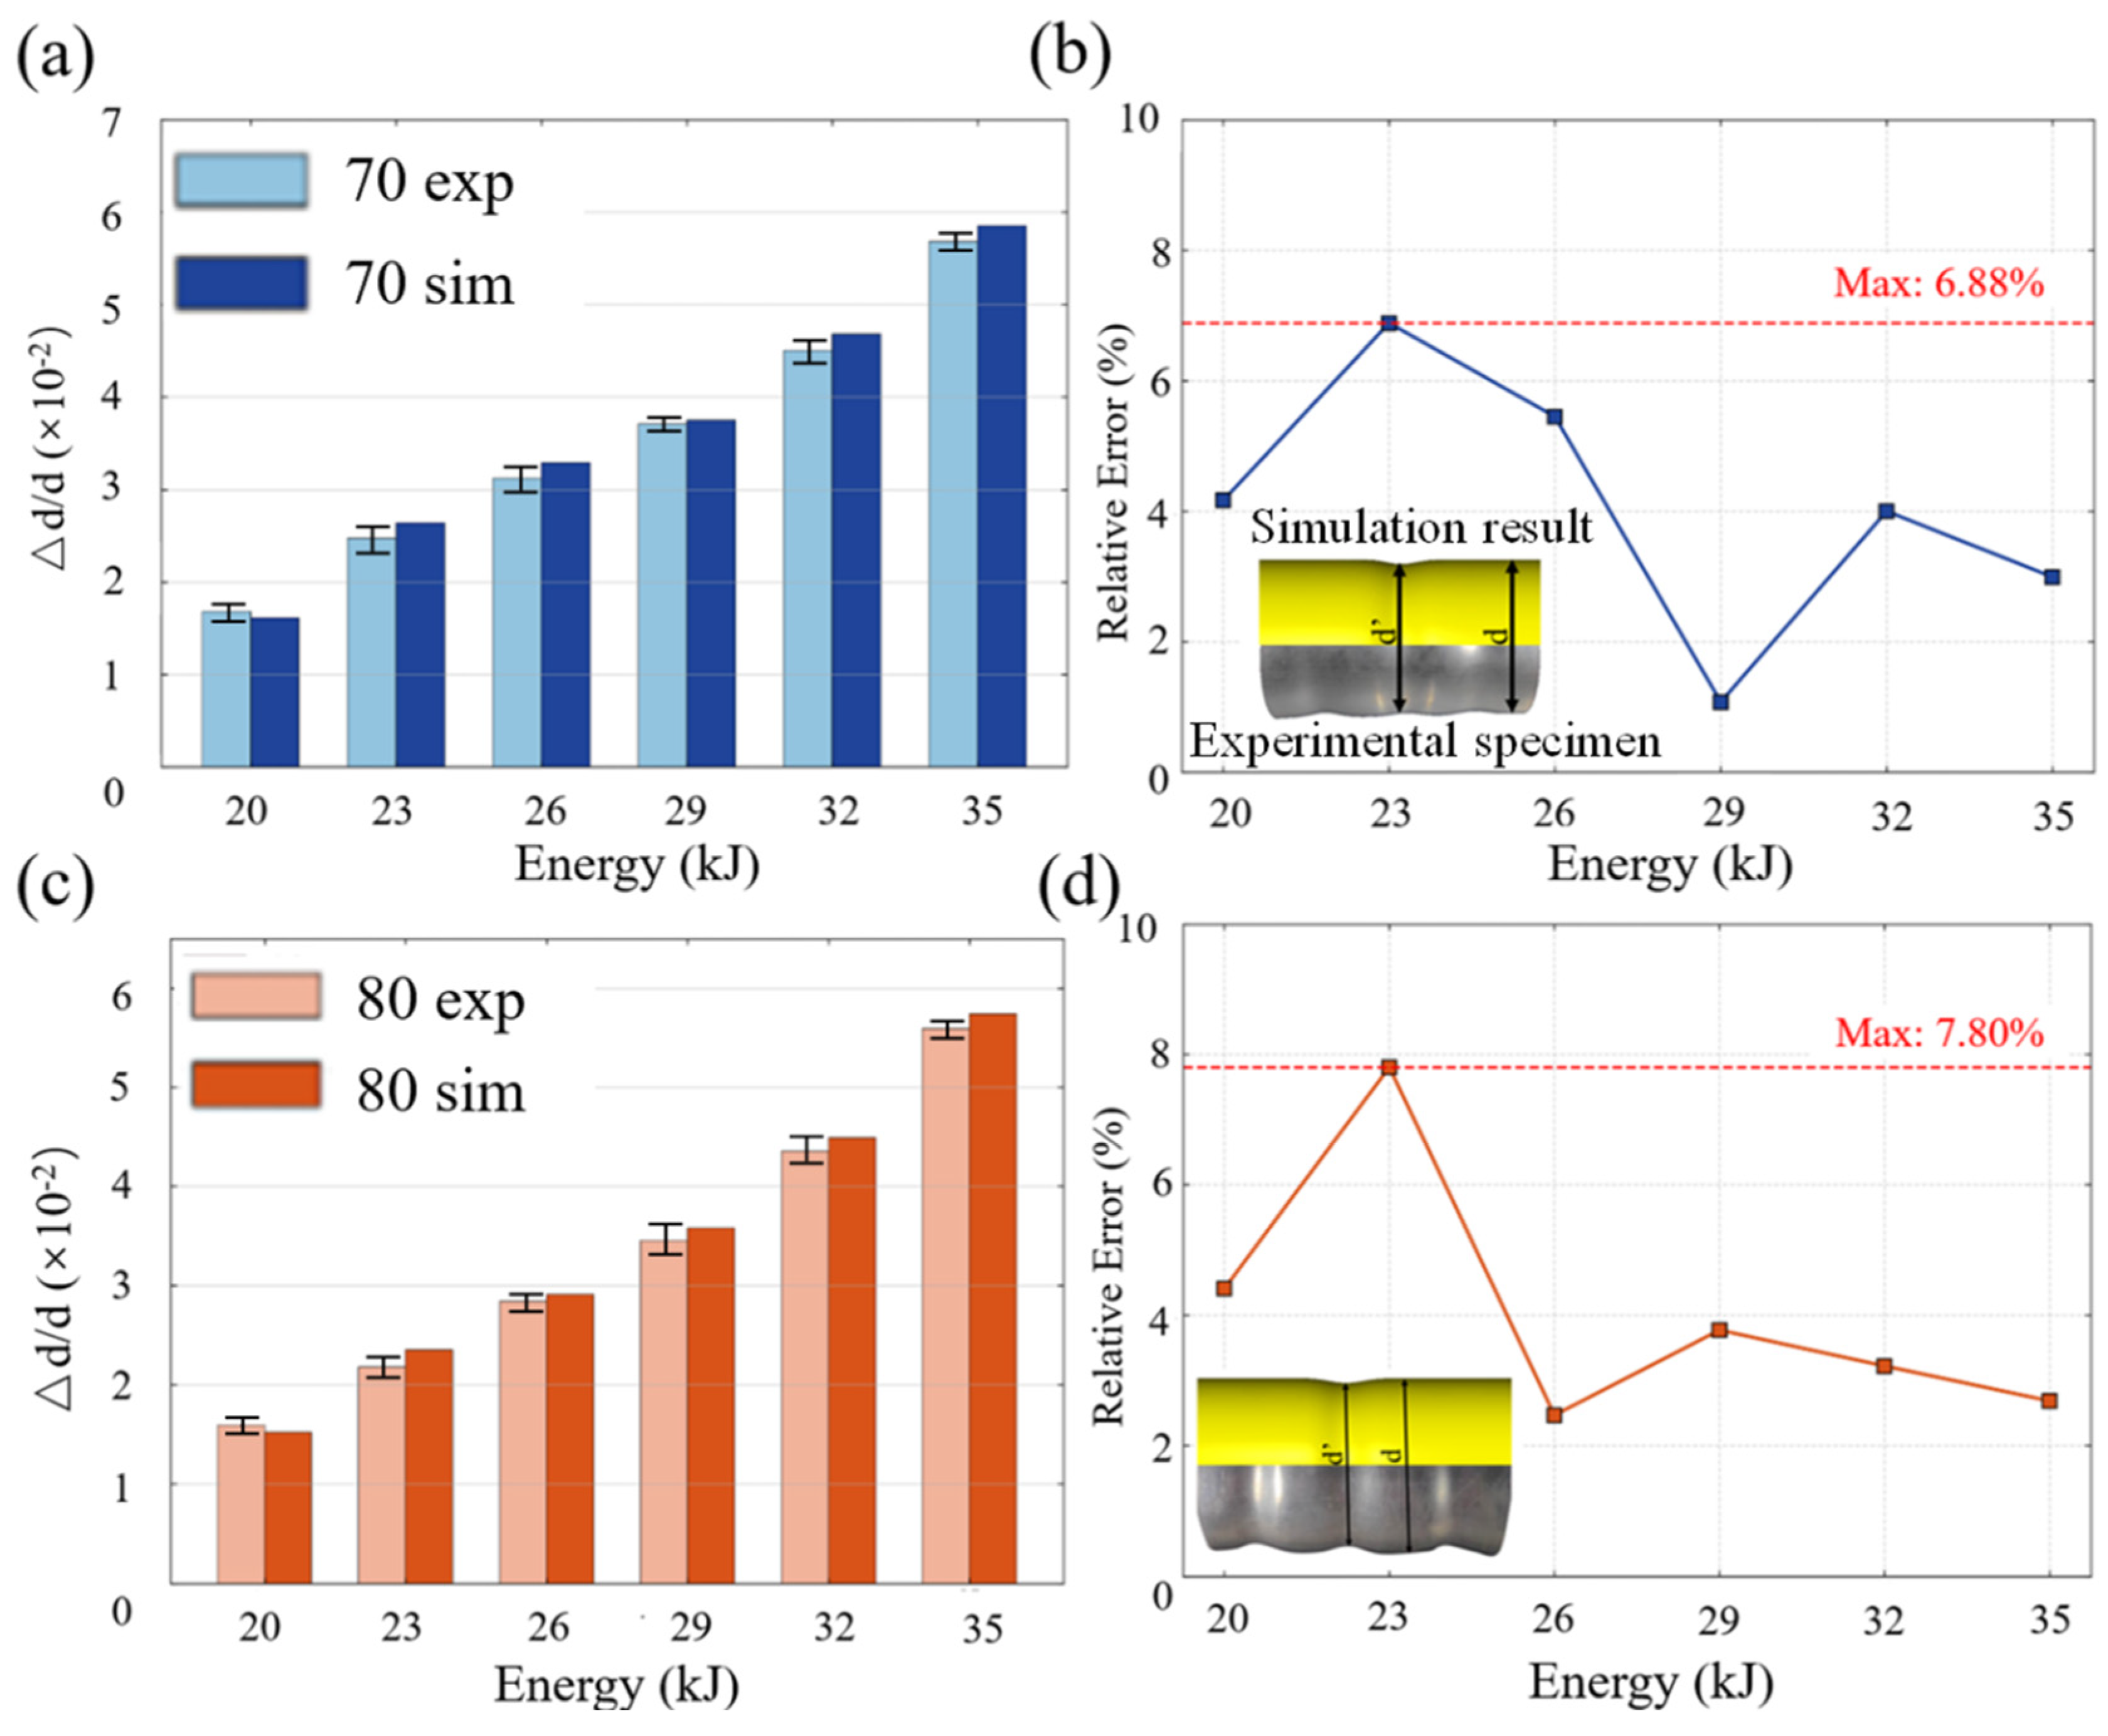
To investigate the effect of tube diameter on the deformation behavior and verify the accuracy of the numerical model, experiments were conducted on specimens with outer diameters of 70 mm and 80 mm. Figure 5 presents the experimental and simulated relative deformations under various discharge energies. As shown in Figure 5a,c, the relative deformation increases with the discharge energy, and the 70 mm tube consistently exhibits a higher relative deformation than the 80 mm tube across all energy levels. Furthermore, the simulation trends are highly consistent with the experimental measurements. According to Figure 5b,d, the maximum relative errors for the 70 mm and 80 mm tubes are 6.88% and 7.80%, respectively. This excellent agreement demonstrates the high reliability of the established model for subsequent analysis. The insets in (b) and (d) compare the simulated profile with the experimental specimen. Experimental values are presented as the mean ± standard deviation of three repeated tests.
Although the experiments were limited to 70 and 80 mm tubes, they support the coupled simulation within the tested range. The validated simulation covers eleven inner radii and supports the analytical model across the investigated range. The transition near 0.7–0.8 is therefore treated as condition-dependent rather than experimentally universal.

3.2. Analytical Model for Field Shaper Current Damping

3.2.1. Assumptions and Simplifications

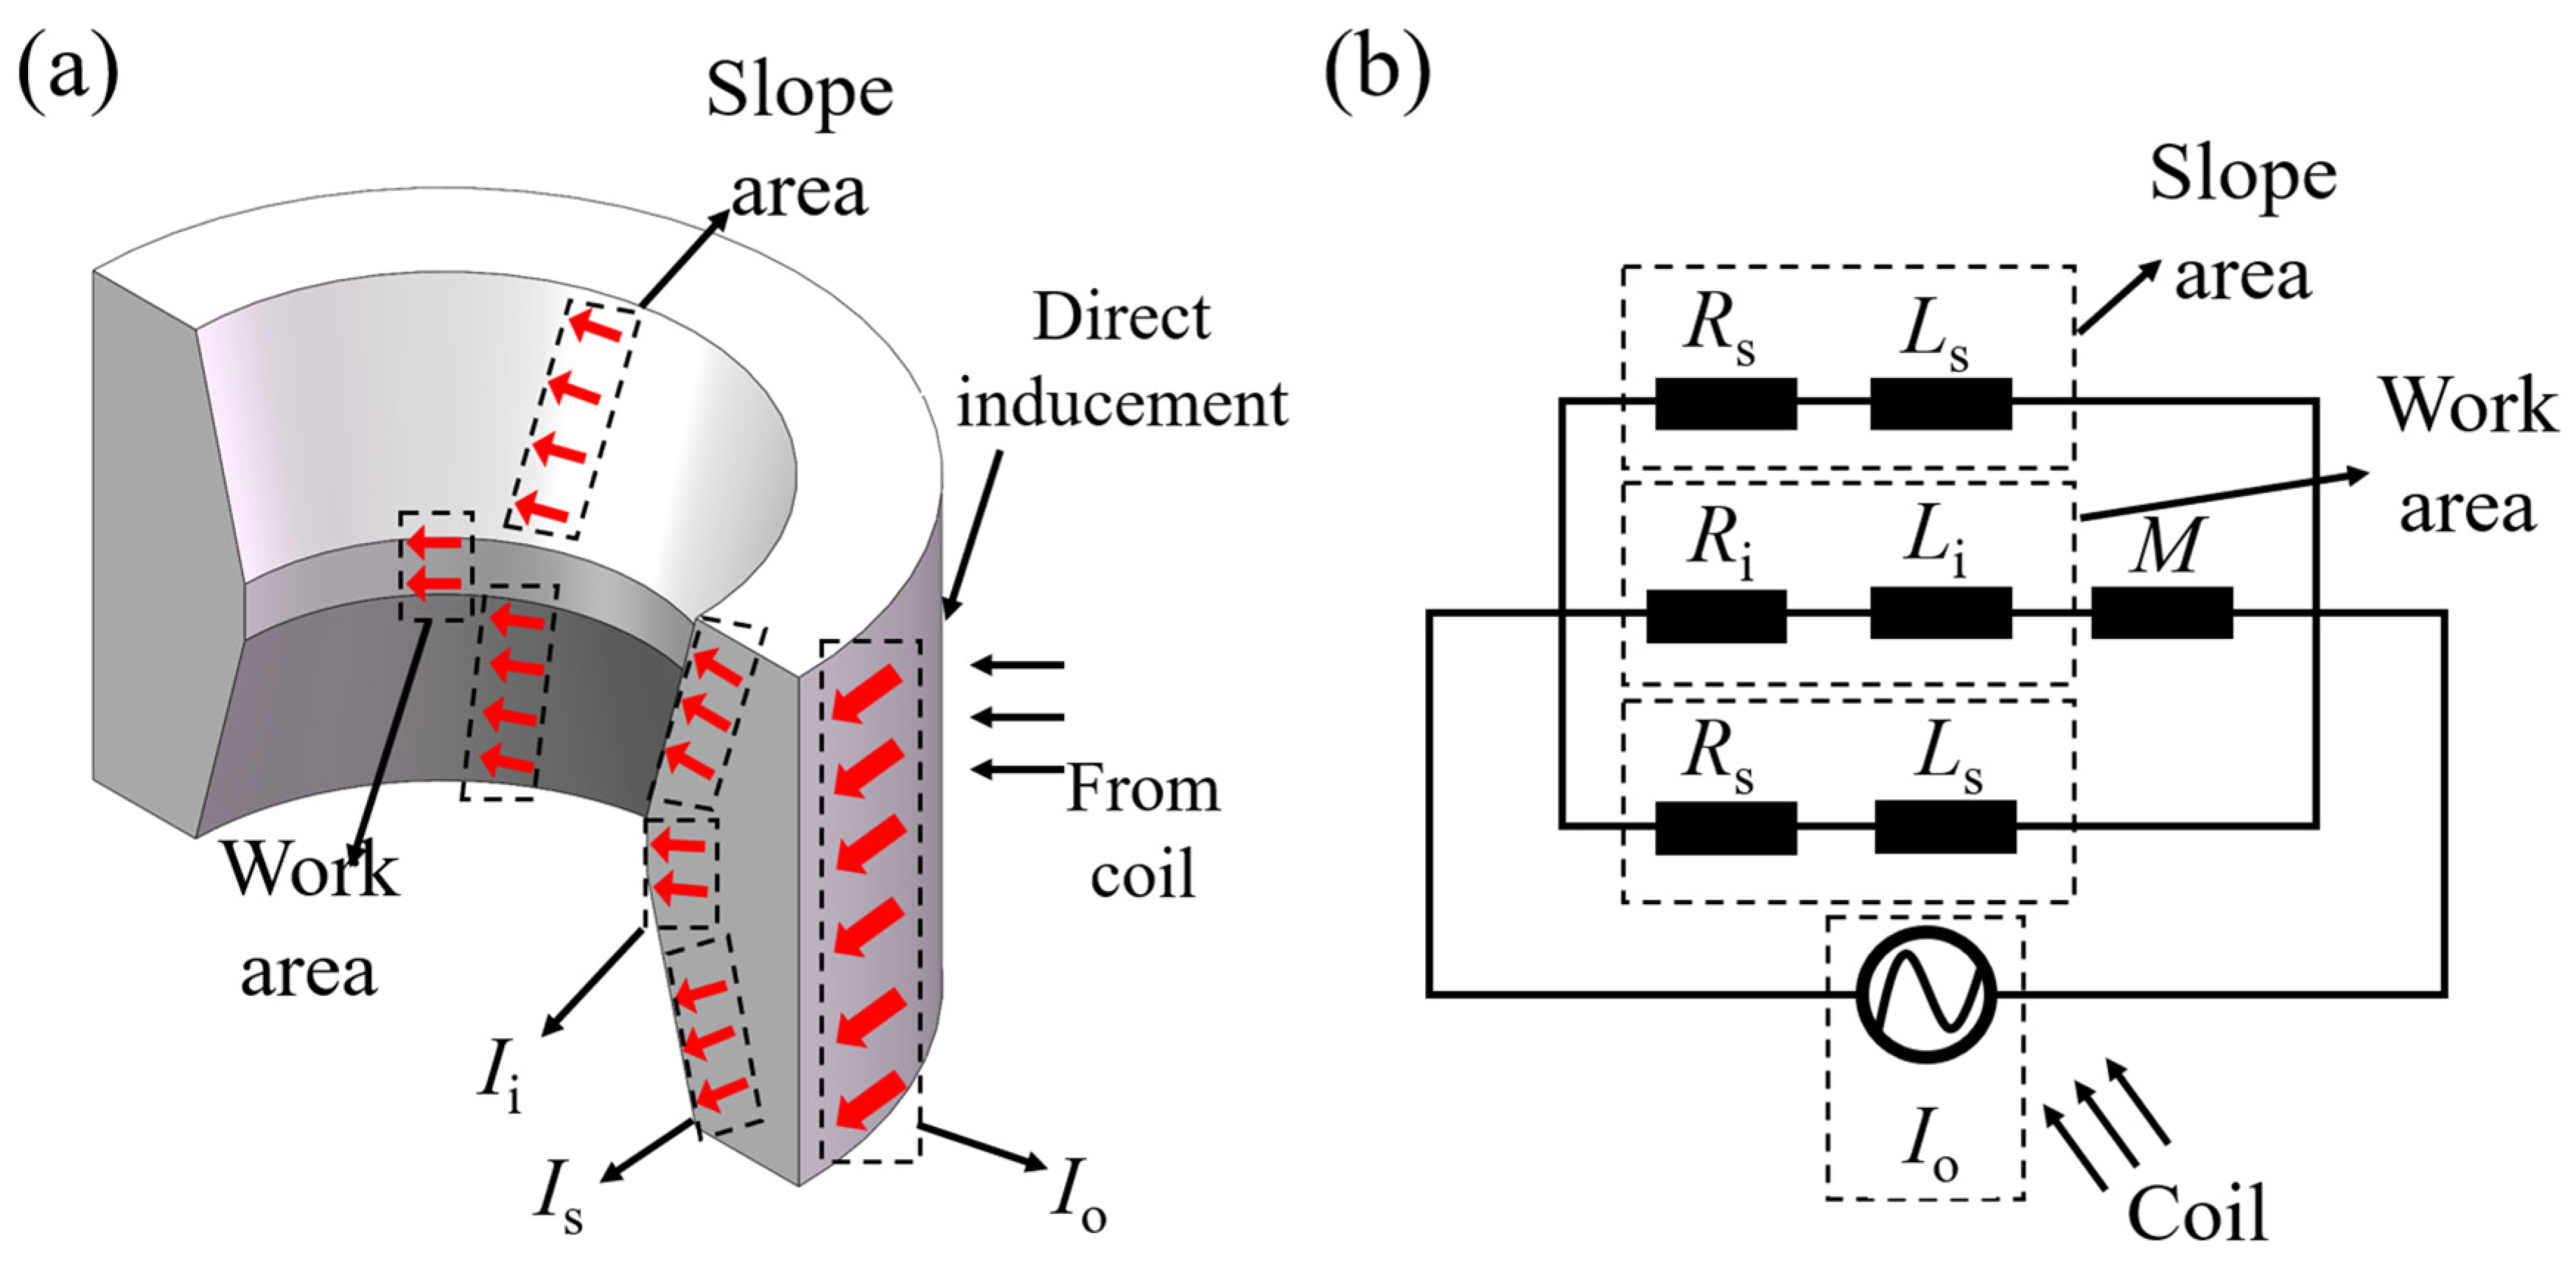
In the analytical model, it is assumed that the outer current of the field shaper does not change with the inner diameter when the outer diameter is fixed. This assumption can be explained by Maxwell’s equations. According to Ampère’s law, the magnetic field satisfies Equation (2):
× B = μ J
where the coil current primarily governs the magnetic field circulation along the outer surface, while the internal redistribution of induced currents has a negligible effect. The distribution mechanism of the outer current is illustrated in Figure 6a.
In addition, the magnetic diffusion in the conductor can be described by Equation (3):
B t = 1 μ σ   2 B
which indicates that for short pulses and thick walls, the penetration of the magnetic field is weak. Under these conditions, the outer boundary is dominated by primary coil coupling, making it a reasonable simplification to treat the outer current Io as constant.
Figure 6b presents the reduced circuit used to interpret peak-current redistribution. The full transient simulation retains self-induction, mutual coupling, magnetic diffusion, and skin effects throughout the discharge. The mutual coupling represented by M is included in the coupled electromagnetic solution. The analytical reduction is applied only at the measured coil-current peak, where the coil-current derivative approaches zero. At this instant, the coil-side inductive voltage is locally minimized. Therefore, resistance-based division is used only as a local approximation of the peak current distribution.

3.2.2. Influence of Geometry

Geometric variations alter the effective current paths within the slanted section and inner ring of the field shaper, thereby triggering a redistribution of the outer current. The conservation of the current in the field shaper, formulated according to Kirchhoff’s law, governs this redistribution and is expressed as seen in Equation (4):
I o   = I i   + 2 I s
where Io is the total outer current, Ii is the inner loop current, and Is represents the surface current on a single slanted section. This relation reflects that the outer current is jointly determined by the inner loop current and the surface currents from both slanted interfaces.
Because the slanted section and the inner ring can be regarded as parallel branches, the external current is divided based on their relative resistances. Therefore, the current in the inner ring can be expressed as shown in Equation (5):
I i = R s R s + 2 R i I o
Similarly, the current in a single slanted section is written as seen in Equation (6):
I s = R i R s + 2 R i I o
To evaluate these current divisions, the local resistances must be determined. The resistance evaluation requires the skin depth, which is defined by Equation (7):
δ = 2 μ σ ω
where μ is the magnetic permeability, σ is the electrical conductivity, and ω is the angular frequency.
The characteristic frequency was obtained from consecutive positive current peaks in Figure 4a. The measured period was approximately 85 μs, corresponding to a characteristic frequency of 11.8 kHz. Using the properties in Table 2, the calculated skin depth was approximately 0.97 mm.
To evaluate the slanted-section resistance, the surface is divided into infinitesimal circumferential conducting strips along the axial direction. The resistance of each strip depends on its local circumference, skin depth, and surface inclination. All strips connect the same equipotential boundaries and therefore conduct in parallel. Their conductance is integrated, and the reciprocal gives the equivalent resistance shown in Equation (8):
R s = 1 σ h / 2 H / 2 δ d y 2 π H h [ 2 ( r o r i ) y h r o + H r i ] H h ( H h ) 2 + 4 ( r o r i ) 2
Then, the equation can be simplified as seen in Equation (9):
R s = 4 π ( r o r i ) ( H h ) 2 + 4 ( r o r i ) 2 σ δ ( H h ) 2 ln ( r o r i )
Meanwhile, the resistance of the inner surface is given by Equation (10):
R i = π r i σ δ h
where ri and ro are the inner and the outer radii of the field shaper, respectively. H and h denote the heights of the outer and inner walls. The related geometric parameters used in the analytical model are summarized in Table 5.
With the redistribution of the external current calculated, the inner loop current Ii becomes the dominant factor in generating the electromagnetic pressure, which can be expressed as shown in Equation (11):
P M = B i 2 2 μ 0 = μ 0 I i 2 2 h 2
where PM is the magnetic pressure acting on the tube and μ0 is the permeability of free space. This pressure represents the electromagnetic loading acting on the tube surface. Its magnitude governs the tube’s acceleration and deformation, strongly affecting the compression quality in EMPTF.
In summary, this section establishes an analytical model to calculate the induced current on the field shaper’s inner surface. The analysis reveals how geometry governs the inner-loop current distribution. Ultimately, it provides a solid theoretical foundation for the preceding experimental and numerical findings.

4. Validation of Analytical Model

To verify the proposed analytical model, 3D coupled simulations were conducted under identical conditions. Key electromagnetic parameters, including the outer current Io, inner current Ii, and magnetic pressure PM, were extracted. To facilitate direct comparison, all variables were normalized using their respective maximum values, as defined in Equation (12):
X norm = X X max
The comprehensive comparison between the theoretical predictions and simulation results is presented in Figure 7.
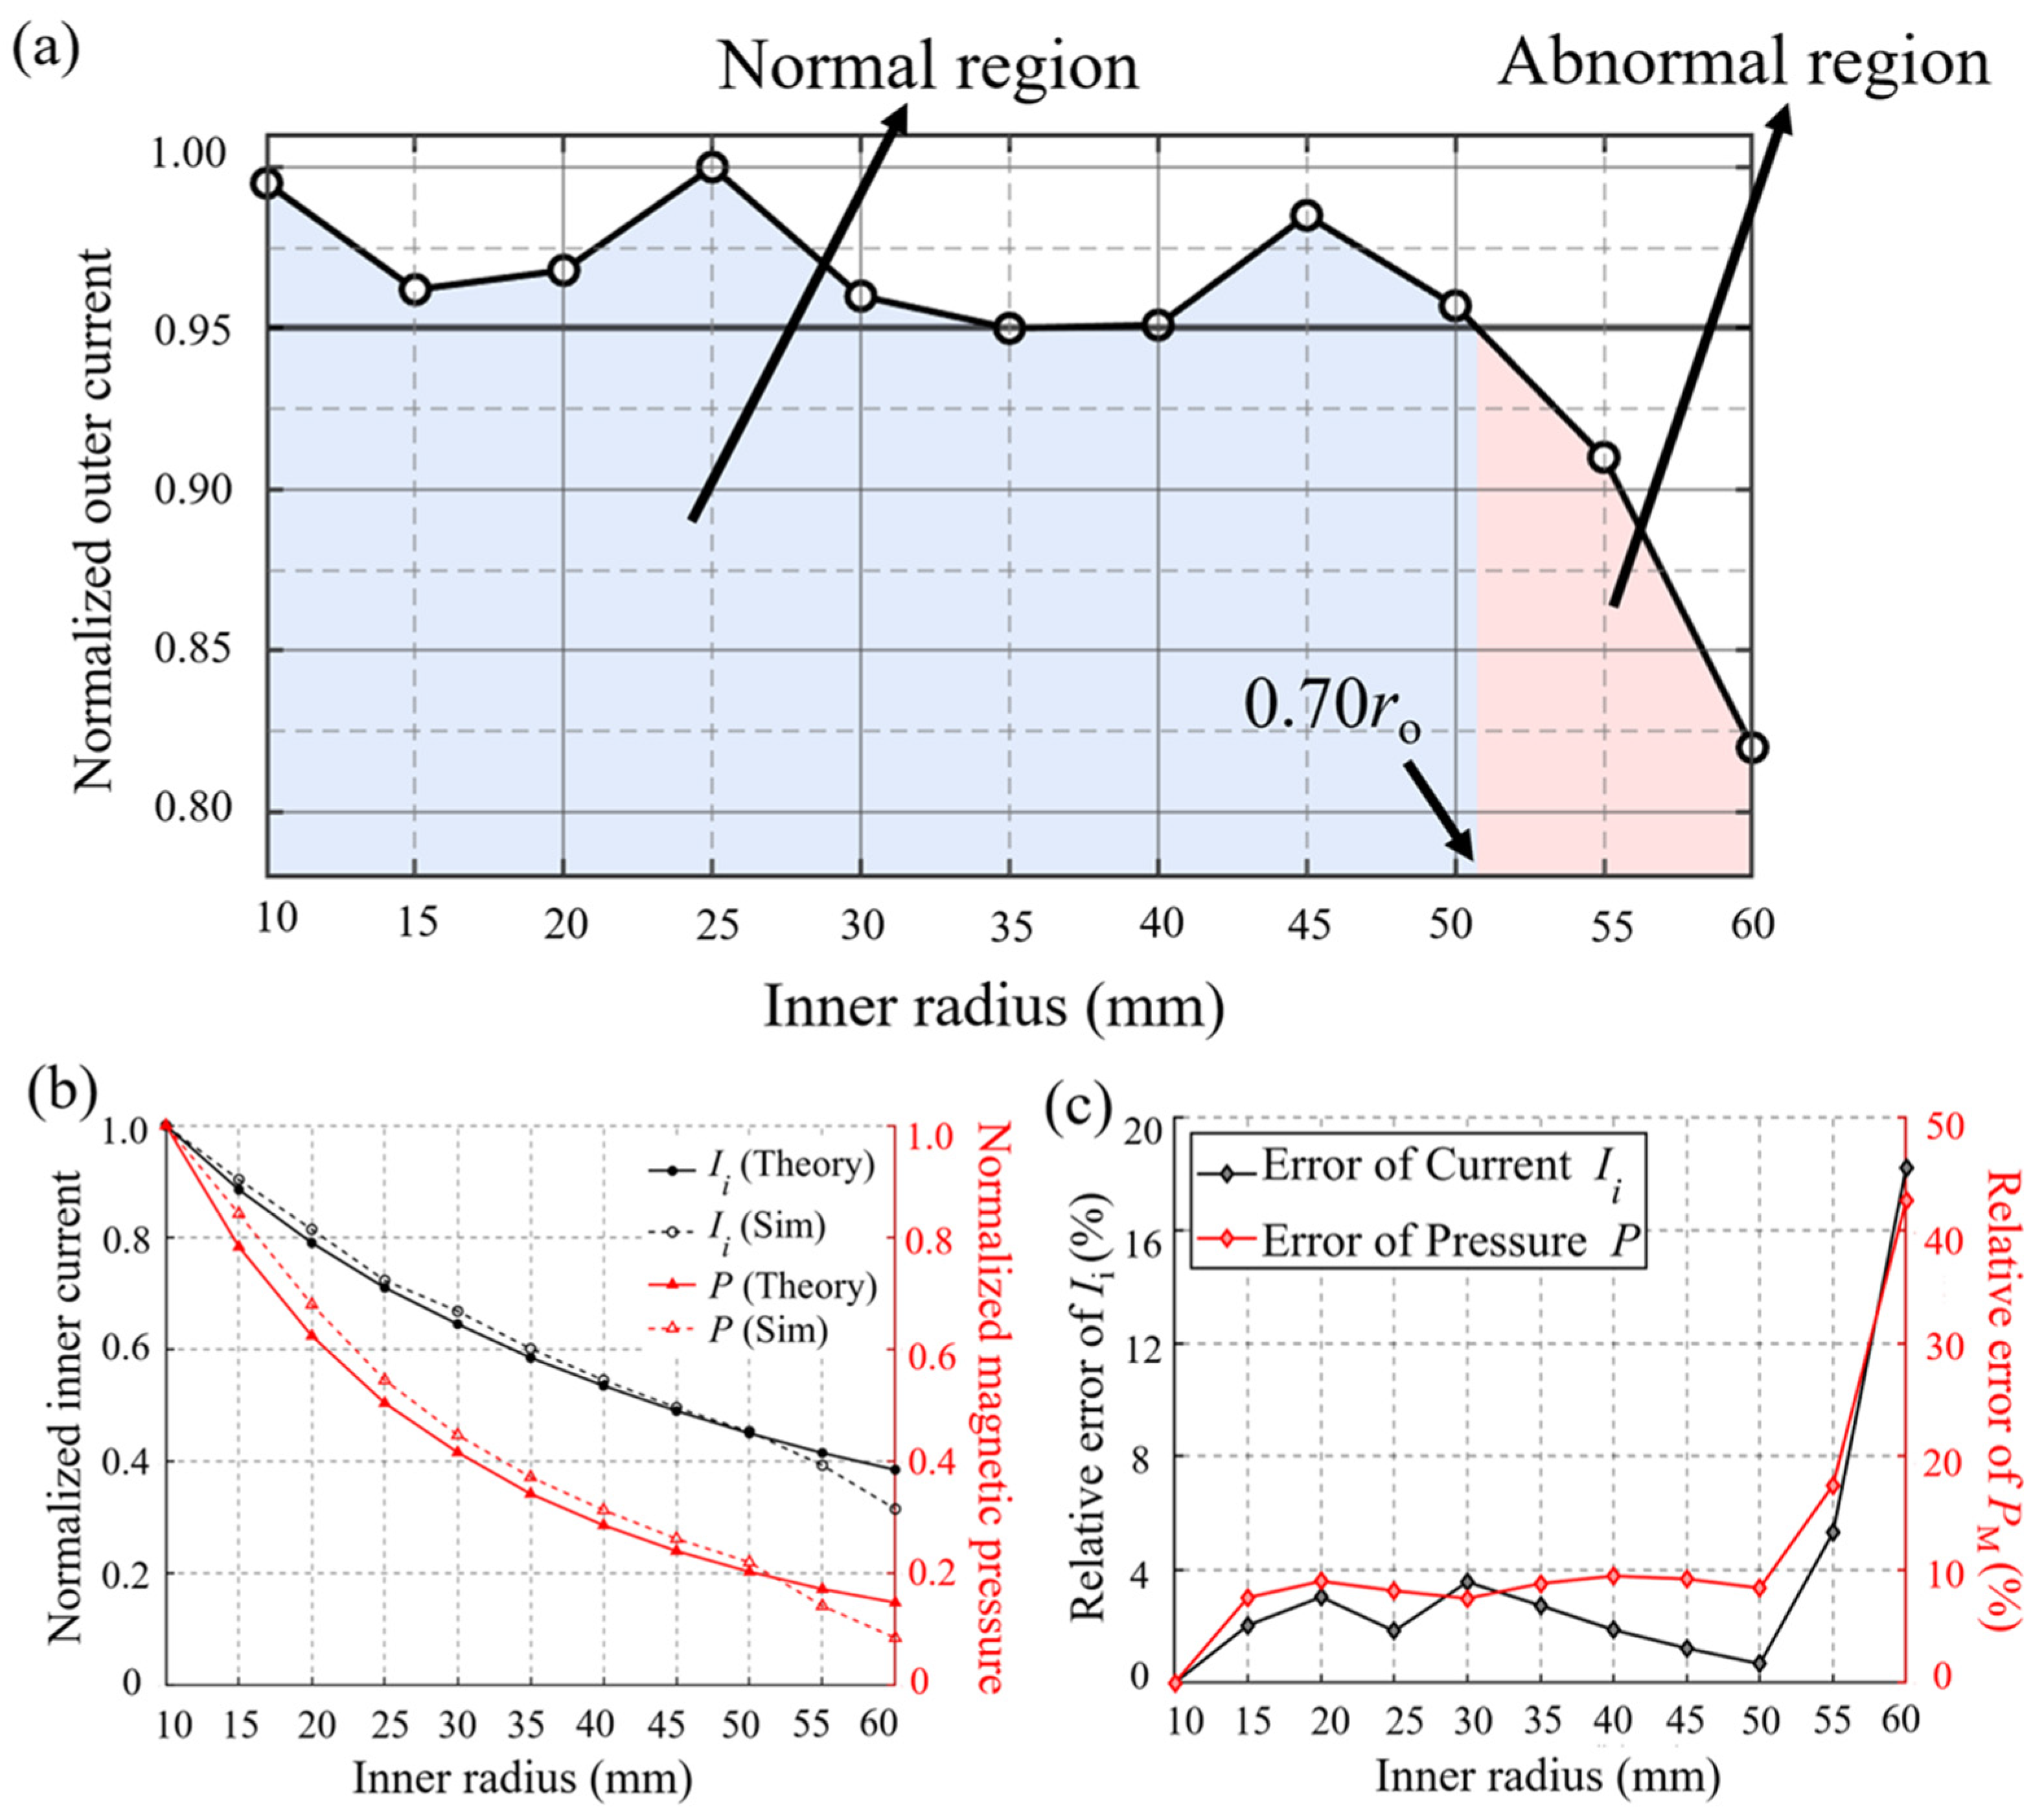
As the foundational assumption of the analytical model, the outer current Io was presumed to remain nearly constant. As shown in Figure 7a, the normalized Io successfully maintains a high level when the inner diameter is below approximately 50 mm. This boundary explicitly divides the deformation behavior into a “Normal region” and an “Abnormal region.” Within the normal region, the assumption of an invariant outer current is perfectly validated. Based on this premise, the subsequent analysis can accurately focus on the inner-loop variations.
Building upon the constant outer current, Figure 7b illustrates the variations of the inner current Ii and the magnetic pressure PM. Since the magnetic pressure scales with the square of the inner current, both parameters exhibit a pronounced, synchronized decreasing trend as the inner diameter enlarges. The theoretical curves align exceptionally well with the 3D simulation data.
Absolute values were also evaluated for the representative 35 mm case. The analytical and simulated inner currents are approximately 102 and 100 kA, respectively. Using Equation (11), the corresponding magnetic pressures are approximately 65 and 62 MPa.
The accuracy and applicable boundaries of the analytical model are further corroborated by the relative error analysis in Figure 7c. In the normal region, the peak inner-current error remains below 4%, while the magnetic-pressure error is approximately 10% or lower. This agreement supports the resistance-based peak-current approximation within its stated range. However, once the inner radius exceeds the 50 mm threshold and enters the abnormal region, a sharp spike in relative error is observed. This divergence confirms that the simplified resistive model is highly accurate within the normal region. However, as the wall becomes too thin, severe inductive effects and current interference dominate the system, requiring a more complex coupled analysis.

5. Underlying Physical Mechanism of the Geometric Ratio in EMPTF

5.1. Inner Current Attenuation at Large Diameters

As previously shown, the inner-loop current gradually decreases with an increasing inner diameter, aligning with theoretical predictions in the normal region. However, at excessively large diameters, the current experiences a sharp, unexpected drop. This anomalous decay deviates significantly from the initial analytical model, suggesting that an uncaptured physical mechanism begins to dominate in this regime.
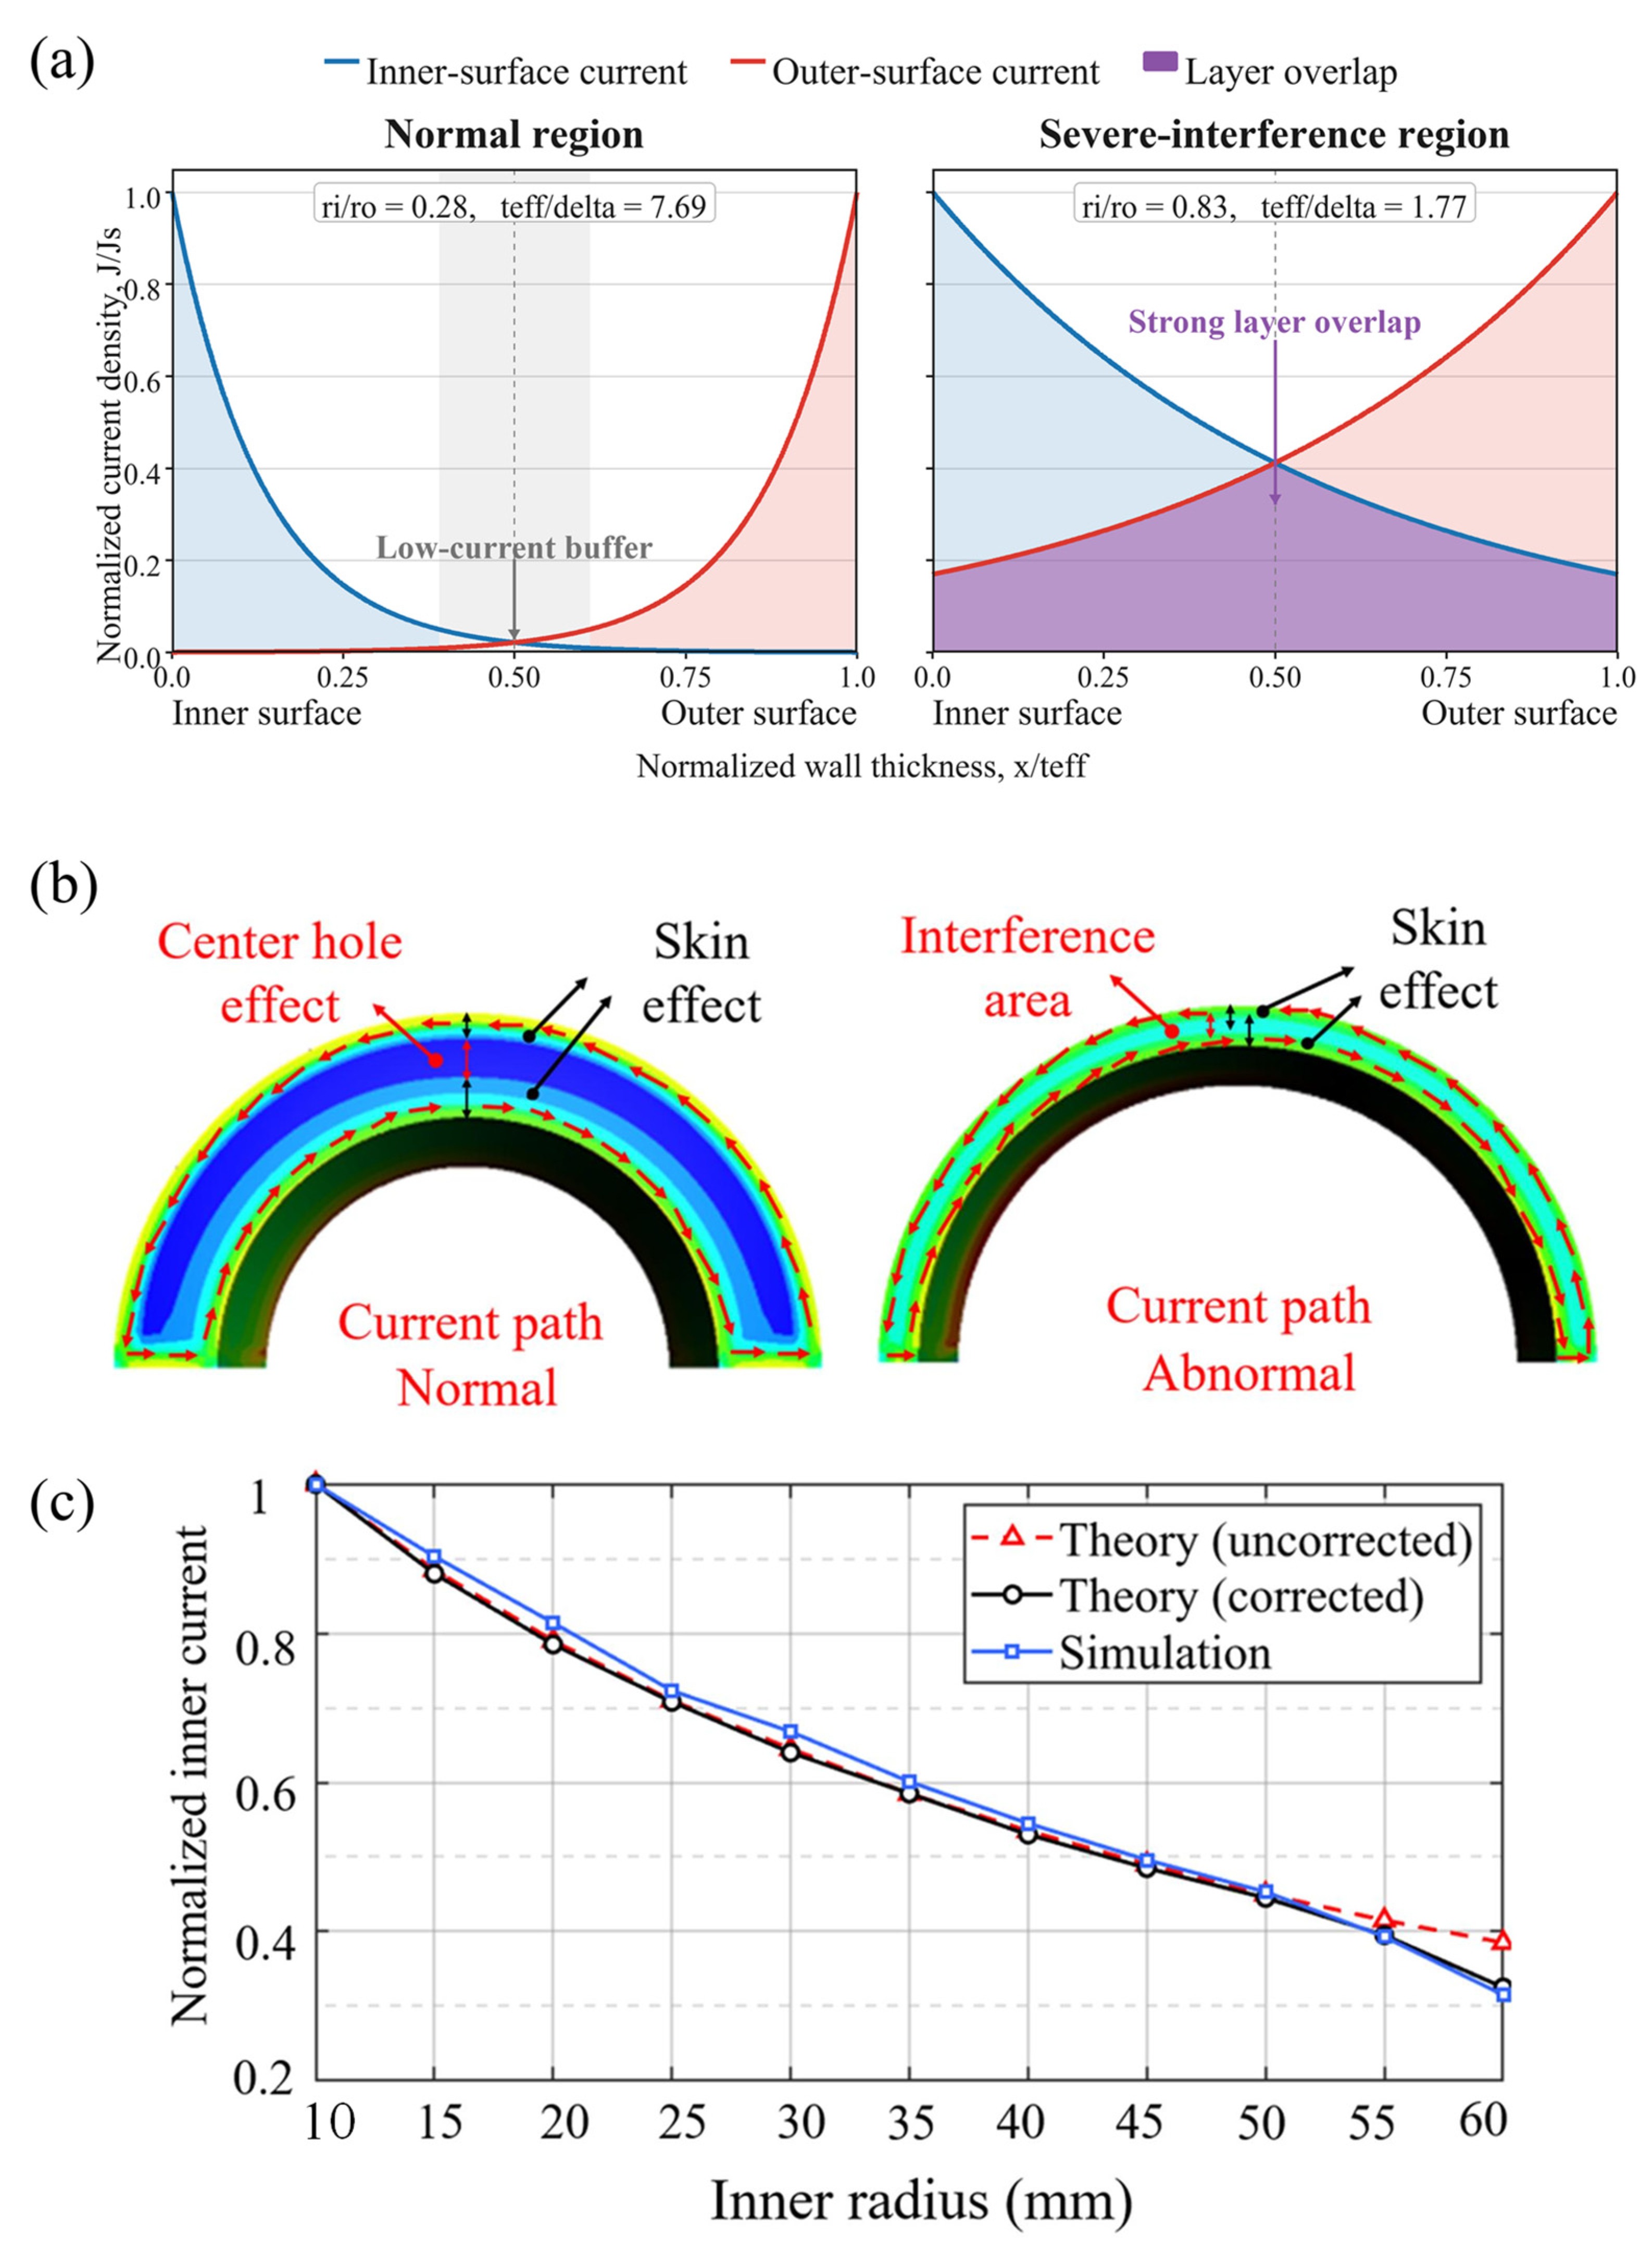
To elucidate this mechanism, Figure 8a presents analytical through-thickness current-density profiles. The normal case retains a low-current buffer between the two surface-current layers. This buffer disappears as the effective wall thickness decreases. The two penetration layers then overlap, as illustrated schematically in Figure 8b. This overlap is identified as an important mechanism contributing to the attenuation of the effective inner current under the investigated conditions.
To account for this interference, the skin effect must be explicitly considered. As defined earlier, the skin depth δ characterizes current penetration. When the wall thickness approaches δ, the current is no longer confined to the surface. Instead, it decays exponentially with depth, as expressed in Equation (13):
J = J s   e x p ( x δ )
where Js is the surface current density and x is the distance from the conductor surface. The current density decreases exponentially with depth. At three skin depths, it decreases to approximately 5% of its surface value. Using Equation (13), Figure 8a compares normalized penetration profiles for thickness ratios of 7.69 and 1.77. The two ratios represent inner radii of 20 and 60 mm, respectively. A 5% threshold identifies the low-current buffer in the analytical profiles.
The effective wall thickness is estimated from the inclined-section geometry, as given by Equation (14):
t eff h r o r i H h
This quantity represents the projected wall thickness normal to the inclined current path.
The current attenuation factor is defined by Equation (15):
η   = 1 exp t eff δ
The correction factor approaches unity for thick walls and decreases as current-layer overlap increases.
Applying this factor to the current from Equation (5) gives the corrected inner current, shown in Equation (16):
I i , corr =   η I i =   η R s R s + 2 R i I o
The corrected current is then substituted into Equation (11) to calculate magnetic pressure. Representative values near the interference region are listed in Table 6.
The thickness ratio decreases from 3.25 to 1.77 as the inner radius increases. This reduction indicates increasing overlap between the inner and outer current layers.
The effect of this correction is shown in Figure 8c. The uncorrected model deviates markedly in the large-diameter region. After correction, the predictions closely follow the 3D simulation results.
In summary, oversized inner diameters eliminate the zero-current buffer, forcing current paths to overlap and interfere. The proposed exponential skin-effect correction successfully captures this attenuation, significantly enhancing the fidelity of the analytical model.

5.2. Hoop Stress and Dynamic Yielding Analysis

Evaluating deformation capability solely by magnetic pressure is inadequate, as it ignores the tube’s structural resistance. A tube’s deformation heavily depends on its geometry, particularly the radius-to-thickness ratio. Thus, hoop stress is adopted as an effective comparative indicator to evaluate the geometry-dependent deformation tendency.
According to Lamé’s solution for thick-walled tubes subjected to external pressure, the hoop stress at radius r can be expressed as shown in Equation (17):
σ θ ( r ) = p i a 2 p o b 2 b 2 a 2 + ( p i p o ) a 2 b 2 ( b 2 a 2 ) r 2
where a and b are the inner and outer radii of the tube, respectively; pi and po denote the internal and external pressures; and r is the radial position where the stress is evaluated.
In the present case, the tube is only subjected to the external magnetic pressure generated by the induced current, while no internal pressure is applied. Hence, the inner pressure can be regarded as zero, and the outer pressure is determined by magnetic loading. Under these conditions, Equation (17) can be further simplified to give the expression for the hoop stress. The maximum value occurs at the inner wall of the tube, and is summarized as seen in Equation (18):
σ θ , max = 2 P M b 2 b 2 a 2 = 2 P M b 2 Δ r 2 b Δ r P M b Δ r
where △r represents the wall thickness of the tube.
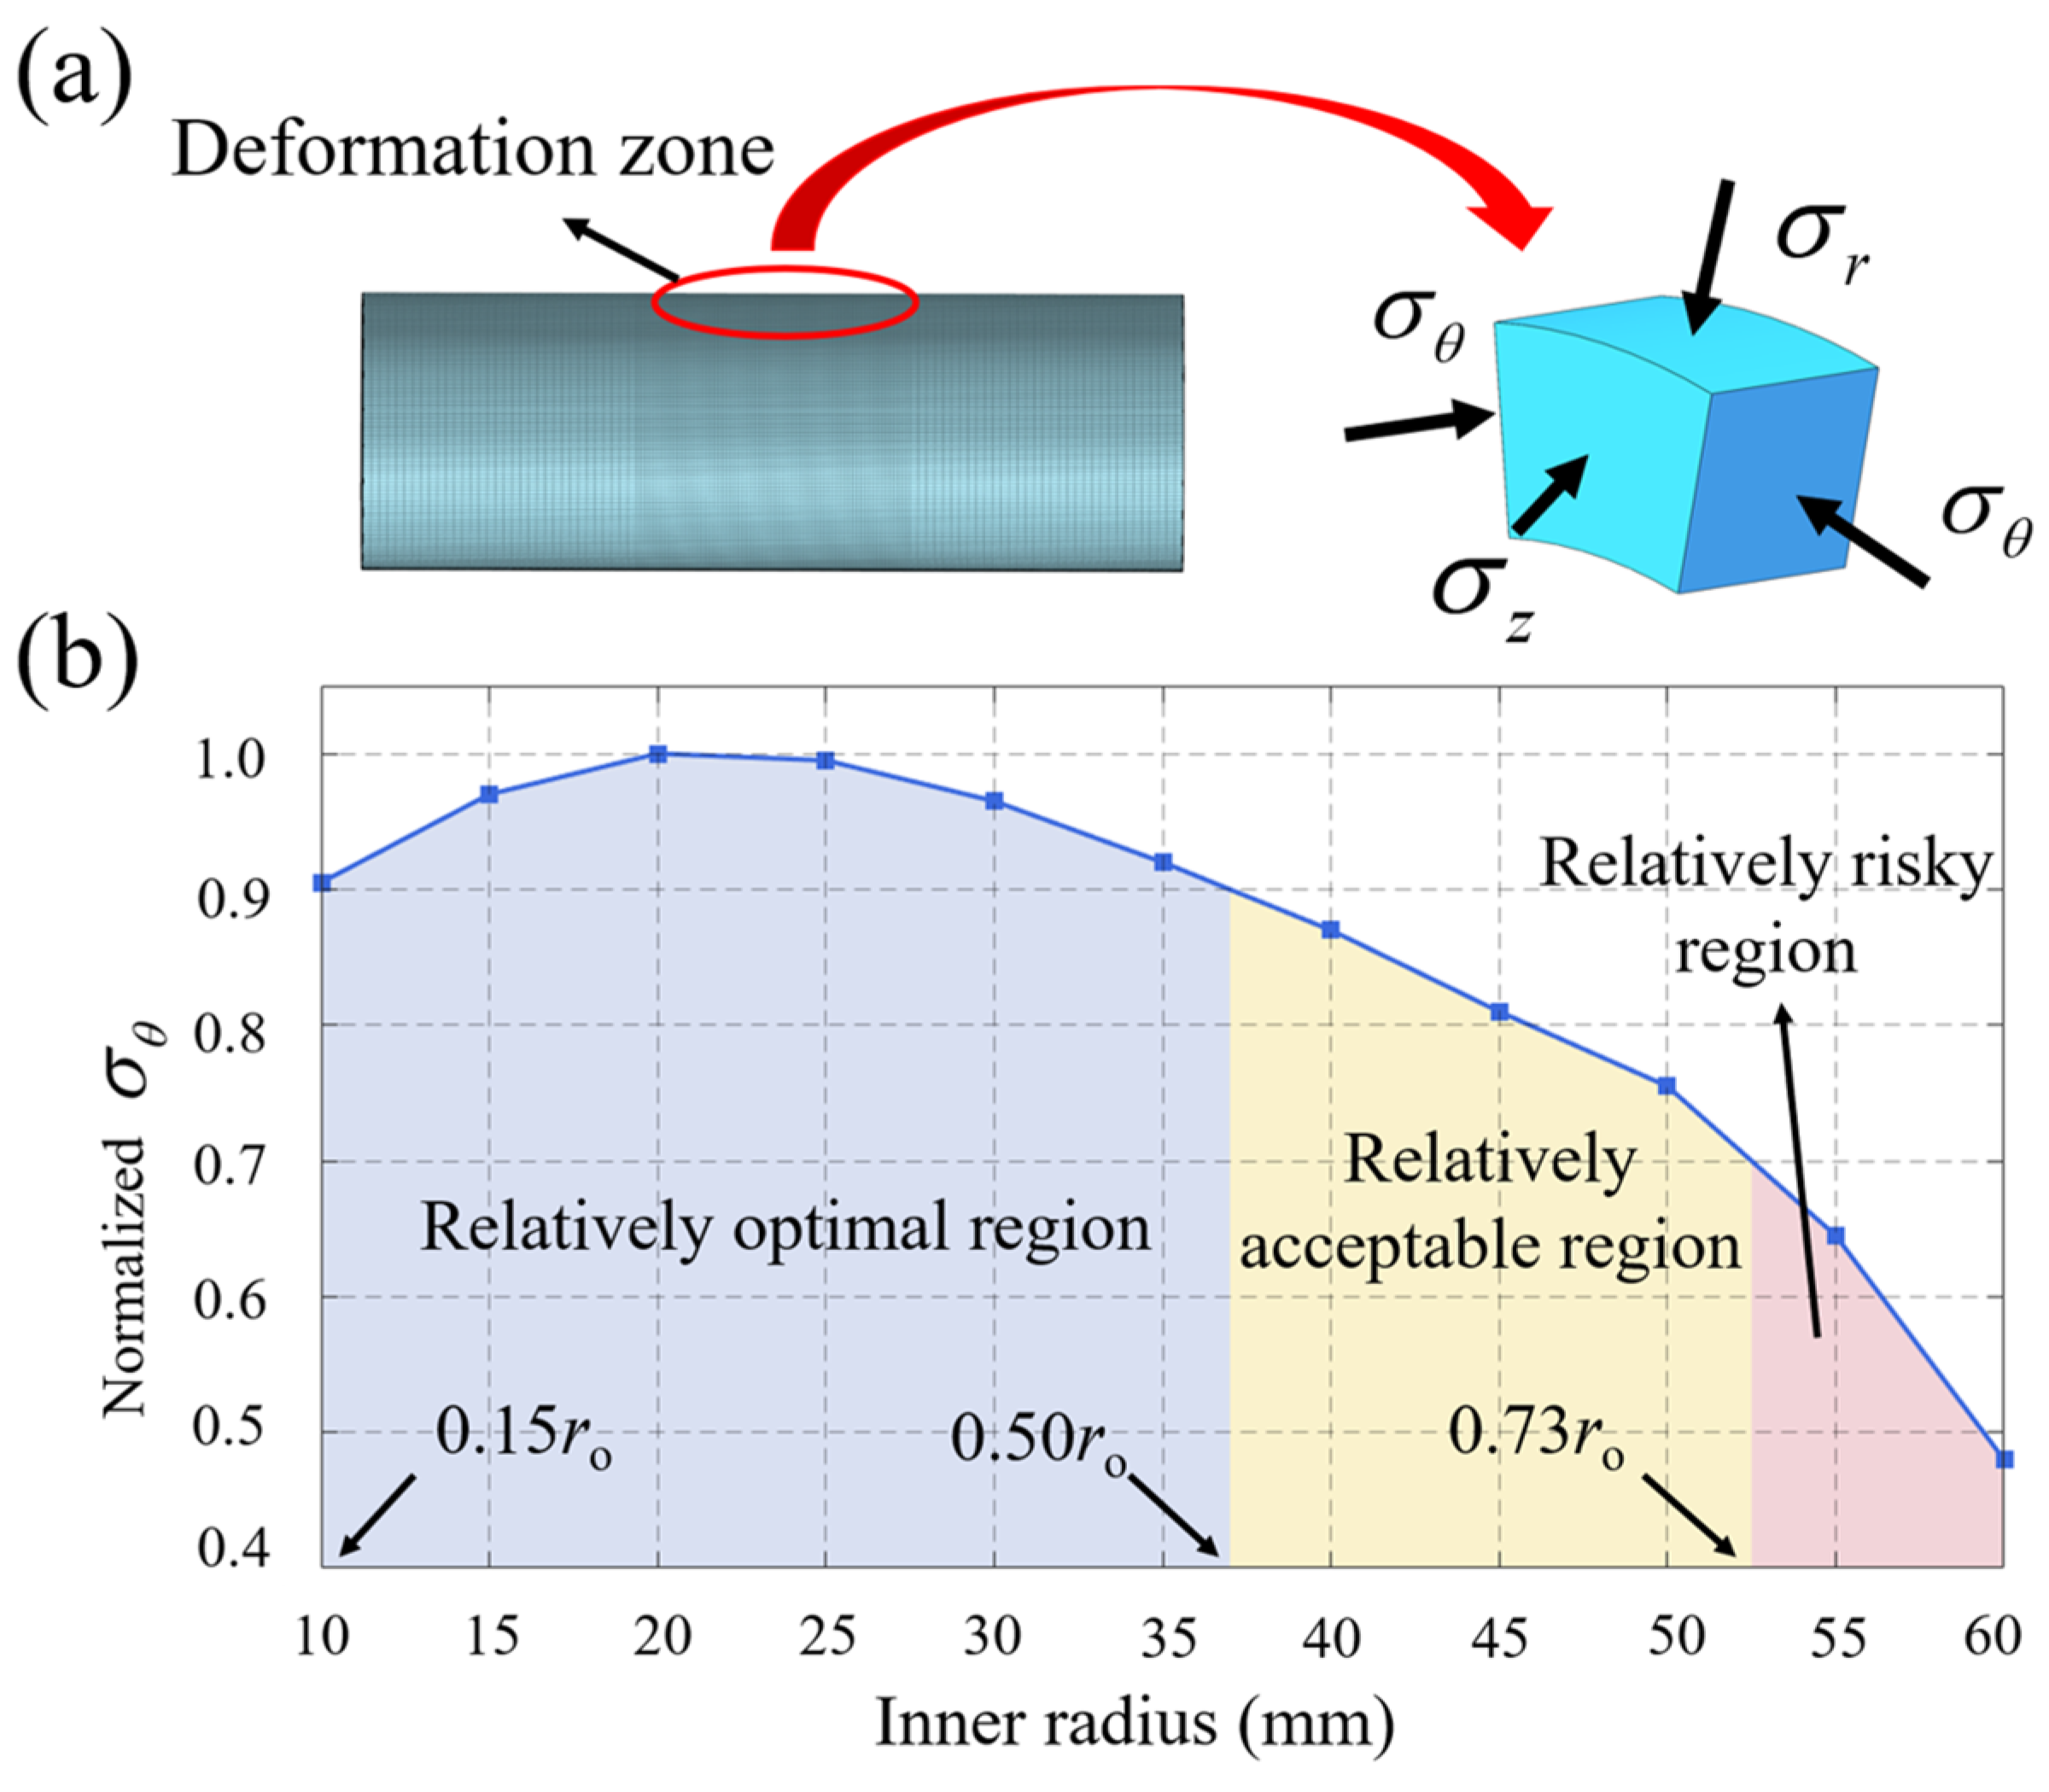
To explicitly correlate this macroscopic structural stress with the internal mechanical response, a differential element within the deformation zone is analyzed. As illustrated in Figure 9a, the element is subjected to a three-dimensional stress state comprising radial stress σr, hoop stress σθ, and axial stress σz.
According to the generalized Hooke’s law, the structural hoop strain is evaluated by Equation (19):
ε θ   =     1 E σ θ ν σ r + σ z
where ν is the Poisson’s ratio; E is the Young’s modulus.
To simplify the analytical model and focus on the primary radial shrinkage mechanism, a plane stress condition is assumed for the working region, setting the axial stress to zero. Furthermore, based on Lamé’s boundary conditions, the radial stress at the inner wall—where the maximum deformation initiates—is effectively zero. Substituting these boundary conditions into Equation (19) yields a direct linear relationship, as shown in Equation (20):
ε θ   =     σ θ , max E
At the inner boundary, hoop stress provides a qualitative measure of the radial loading tendency. It does not directly predict severe plastic deformation. Plastic yielding is governed by the strain-rate-dependent model in Equation (1).
Accordingly, dynamic yielding is identified using Equation (21):
σ eq σ JC
where the equivalent stress is obtained from the transient mechanical solution. The Johnson–Cook flow stress follows Equation (1). This criterion distinguishes the qualitative hoop-stress indicator from the simulated plastic response.
To examine this geometric dependence, the corrected inner current from Equation (16) was used in Equation (11). The resulting magnetic pressure was then substituted into Equation (18). The normalized results across various inner radii are plotted in Figure 9b.
It can be observed that the hoop stress does not decrease monotonically with an increasing inner radius. Instead, it follows a parabolic-like trend, first increasing and then declining. This non-monotonic behavior stems from the competition between two opposing effects: geometric amplification and magnetic load attenuation. As the radial dimension increases, the tube wall effectively amplifies the hoop stress due to a higher radius-to-thickness ratio. However, beyond a critical threshold, severe current interference causes a sharp decay in the induced magnetic pressure, which ultimately weakens the stress. In the intermediate range where the geometric effect prevails, the stress is driven upward to a peak. As shown in Figure 9b, the normalized hoop stress remains above 0.9 within a specific design window. Within the investigated conditions, the interval from 0.15ro to 0.50ro represents a favorable hoop-stress range. It is not a direct plastic-deformation limit.
The simulations include eleven inner radii from 10 to 60 mm. This corresponds to diameter ratios from 0.14 to 0.83. Experiments cover 70 and 80 mm tubes at six discharge energies from 20 to 35 kJ. The tubes have 2 mm walls, and the field-shaper gap is 0.5 mm. The field-shaper outer radius is 72 mm, while H and h are 80 and 10 mm. These cases cover the main variables of the present system, while the numerical thresholds remain condition-dependent.
Significantly, this theoretical trend accurately captures the macroscopic deformation observed in the experiments. As derived from the analytical model, despite the 80 mm tube possessing a larger absolute radial dimension, the 70 mm tube theoretically generates a greater compressive hoop strain. This outcome is perfectly consistent with the higher relative deformation of the 70 mm tube measured in the free-deformation tests. Such consistency not only validates the proposed analytical framework but also highlights its effectiveness in predicting size-dependent deformation behaviors in EMPTF.

6. Conclusions

This work systematically investigates how field shaper geometry influences the current distribution, magnetic pressure, and hoop stress in EMPTF. By integrating theoretical derivation, simulation, and experimental validation, we clarified the underlying physical mechanisms and proposed a new evaluation indicator. The results establish both a theoretical foundation and practical guidance for optimizing compression in tubular joints. The main conclusions are as follows:
(1)
Increasing the field shaper’s inner diameter triggers a current redistribution between the inner and outer loops. This attenuation of the inner current significantly reduces the magnetic pressure acting on the tube.
(2)
Under the investigated conditions, preliminary interference appears near a diameter ratio of 0.7. Severe current-path interference occurs above approximately 0.8, sharply reducing the electromagnetic driving capability. These thresholds are condition-dependent rather than universal limits.
(3)
Within the investigated conditions, the hoop-stress indicator remains favorable for diameter ratios of 0.15–0.50. This interval is a condition-dependent design window, rather than a universal optimum.
(4)
The experimental results reveal that despite a larger absolute radial contraction in 80 mm tubes, the 70 mm tubes exhibit a higher hoop strain. This observation aligns with the analytical stress predictions, corroborating the validity of the proposed model in capturing size-dependent deformation.

Author Contributions

Conceptualization, Q.Y. and H.S.; Methodology, Q.Y., H.L. and Z.W.; Software, Q.Y., Y.L. and J.C.; Validation, Q.Y. and H.S.; Formal analysis, Y.L. and Z.W.; Resources, Y.L.; Data curation, J.C.; Writing—original draft, Q.Y.; Writing—review & editing, H.S., J.C. and H.J.; Visualization, H.S.; Supervision, H.J.; Project administration, H.L. and H.J.; Funding acquisition, H.J. All authors have read and agreed to the published version of the manuscript.

Funding

This project was funded by the Open Research Fund of National Engineering Research Center of Water Resources Efficient Utilization and Engineering Safety (No. GJGCZX-JJ-202406).

Data Availability Statement

The data that support the findings of this study are available from the corresponding author upon request.

Conflicts of Interest

Authors Yi Lv and Haifan Li were employed by the company China Yangtze Power Co., Ltd. (CYPC). The remaining authors declare that the research was conducted in the absence of any commercial or financial relationships that could be construed as a potential conflict of interest.

References

  1. Zhang, L.; Duan, X.; Tian, Z.; He, Y.; Hu, Y.; Yin, L.; Xie, J. Study on Interface Diffusion and Welding Strength of Cu/Sn Dissimilar Metal Electromagnetic Pulse Welding Based on Molecular Dynamics Simulation. Mater. Today Commun. 2024, 40, 110095. [Google Scholar] [CrossRef] [Scilit]
  2. Li, C.; Wang, X.; Zhou, Y.; Shen, T.; Li, X.; Wu, H.; Xu, C. Decouple the Effect of the Horizontal and Vertical Components of the Collision Velocity on Interfacial Morphology in Electromagnetic Pulse Welding. J. Mater. Process. Technol. 2023, 321, 118161. [Google Scholar] [CrossRef] [Scilit]
  3. Li, Z.; Liu, W.; Peng, W.; Zhang, H. Development and Calibration of a Weldability Window for Al-Ti Composite by Magnetic Pulse Welding. Mater. Manuf. Process. 2026, 41, 653–660. [Google Scholar] [CrossRef] [Scilit]
  4. Thekkuden, D.T.; Mourad, A.-H.I.; Iftikhar, S.H.; Kumar, G.; Alkhedher, M. Feasibility of Friction Stir Welding for Sealing the Roller-Expanded Heat Exchanger Tube-to-Tubesheet Joints. Eng. Sci. 2024, 31, 1199. [Google Scholar] [CrossRef] [Scilit]
  5. Vengsungnle, P.; Poojeera, S.; Srichat, A.; Naphon, P. Optimized Performance of Closed Loop Control Electromagnetic Field for the Electric Generators with Energy Storage. Eng. Sci. 2024, 30, 1173. [Google Scholar] [CrossRef] [Scilit]
  6. Shi, H.; Qiao, S.; Qiu, R.; Zhang, X.; Yu, H. Effect of Welding Time on the Joining Phenomena of Diffusion Welded Joint between Aluminum Alloy and Stainless Steel. Mater. Manuf. Process. 2012, 27, 1366–1369. [Google Scholar] [CrossRef] [Scilit]
  7. Lyu, F.; Yu, H.; Cheng, X. Formability and Microscopic Behavior of 2219-T6 Aluminum Alloy under Electromagnetic Forming with Cryogenic Temperatures. J. Mater. Res. Technol. 2025, 37, 4466–4475. [Google Scholar] [CrossRef] [Scilit]
  8. Zhu, X.; Xu, X.; Zhang, W.; Du, L.; Shao, Z.; Lai, Z.; Han, X.; Li, L.; Cao, Q.; Ouyang, S. Electromagnetic Shielding Forming: A Facile Approach for Lorentz Force Regulation and Its Application in Tube Forming. J. Mater. Process. Technol. 2025, 338, 118795. [Google Scholar] [CrossRef] [Scilit]
  9. Wang, S.; Gao, X.; Huang, Z.; Jiang, H.; Li, G.; Cui, J. Joining of Large Diameter Thin-Walled Copper Conduit and Aluminum Wire Harness via Magnetic Pulse Crimping: Numerical and Experimental Analyses. Thin-Walled Struct. 2025, 213, 113318. [Google Scholar] [CrossRef] [Scilit]
  10. Li, X.; Tang, X.; Li, M.; Liu, Q.; Tuo, Z.; Cao, Q.; Li, L. Relaxation of Residual Stress in Aluminum Alloy Rings by Pulsed High Magnetic Field: Relieving Mechanisms and Performance Evaluation. J. Mater. Process. Technol. 2025, 338, 118778. [Google Scholar] [CrossRef] [Scilit]
  11. Su, Z.; Yin, L.; Jiang, H.; Zhang, L.; Chen, Y.; Zhang, L.; Zhang, H.; Feng, W. Research Progress of Electromagnetic Pulse Welding Technology: A Review. J. Mater. Res. Technol. 2025, 36, 217–235. [Google Scholar] [CrossRef] [Scilit]
  12. Sharma, S.K.; Aravind, J.M.V.V.S.; Mishra, S.; Rani, R.; Siddiqui, O.; Verma, R.; Chakravorty, G.; Das, C.; Sharma, A. Magnetic Pulse Welding of Thin Walled Ferritic Martensitic Steel T91 Tube to T91 Rod. Mater. Today Proc. 2023, 87, 115–121. [Google Scholar] [CrossRef] [Scilit]
  13. Li, X.; Li, M.; Tang, X.; Liu, H.; Gong, M.; Lai, Z.; Cao, Q.; Li, L. Magnetic Pulse Welding of Large-Diameter Aluminum-Steel Dissimilar Metal Tubes: Actuator Design, Welding Process, and Mechanism. Int. J. Adv. Manuf. Technol. 2025, 139, 1343–1361. [Google Scholar] [CrossRef] [Scilit]
  14. Shotri, R.; Faes, K.; De, A. Magnetic Pulse Welding of Copper to Steel Tubes–Experimental Investigation and Process Modelling. J. Manuf. Process. 2020, 58, 249–258. [Google Scholar] [CrossRef] [Scilit]
  15. Lueg-Althoff, J.; Bellmann, J.; Hahn, M.; Schulze, S.; Gies, S.; Tekkaya, A.E.; Beyer, E. Joining Dissimilar Thin-Walled Tubes by Magnetic Pulse Welding. J. Mater. Process. Technol. 2020, 279, 116562. [Google Scholar] [CrossRef] [Scilit]
  16. Bellmann, J.; Schettler, S.; Dittrich, S.; Lueg-Althoff, J.; Schulze, S.; Hahn, M.; Beyer, E.; Tekkaya, A.E. Experimental Study on the Magnetic Pulse Welding Process of Large Aluminum Tubes on Steel Rods. IOP Conf. Ser. Mater. Sci. Eng. 2019, 480, 012033. [Google Scholar] [CrossRef] [Scilit]
  17. Zhang, W.; Ouyang, S.; Du, L.; Sun, Y.; Lai, Z.; Han, X.; Li, L.; Qiu, L.; Cao, Q. Electromagnetic Forming with Automatic Feedback Control of Lorentz Force Distribution: A New Forming Method and Its Application to High-Uniformity Tube Deformation. J. Mater. Process. Technol. 2023, 313, 117869. [Google Scholar] [CrossRef] [Scilit]
  18. Bai, Q.; Liu, T.; Tian, Y.; Zhang, K.; Liu, Y.; Zhang, J.; Wang, B. Effect of Lorentz Force Distribution on Solidifed Microstructure and Segregation of Magnesium Alloys under Pulsed Electromagnetic Field. J. Alloys Compd. 2025, 1039, 183014. [Google Scholar] [CrossRef] [Scilit]
  19. Sofi, K.; Hamzaoui, M.; El Idrissi, H.; Nait Sidi Moh, A.; Jouaffre, D.; Hamzaoui, A. Electromagnetic Pulse Generator: An Analytical and Numerical Study of the Lorentz Force in Tube Crimping Processes. CIRP J. Manuf. Sci. Technol. 2020, 31, 108–118. [Google Scholar] [CrossRef] [Scilit]
  20. Jiang, X.; Yu, H.; Li, H. Optimization of Novel Coil Structure Parameters for Controlling Al/Fe Magnetic Pulse Welding Process. J. Manuf. Process. 2025, 134, 117–134. [Google Scholar] [CrossRef] [Scilit]
  21. Gavel, K.S.; Ahmed, M.; Ali, A.; Bhargaw, H.N.; Panthi, S.K.; Bhargav, A. A Novel Tool Design for Magnetic Pulse Welding of Sheet Metal Using Compression Coil. J. Manuf. Process. 2025, 144, 261–277. [Google Scholar] [CrossRef] [Scilit]
  22. Zhang, K.; Chen, S.; He, F.; Pan, Q.; Guo, Z.; Lu, Y. Design and Laboratory-Based Proof-of-Concept Verification of Electromagnetic Energy Harvesting Device for Multi-State Monitoring of Large-Diameter TBM Gauge Cutters. Tunn. Undergr. Space Technol. 2026, 173, 107585. [Google Scholar] [CrossRef] [Scilit]
  23. Cheng, X.; Yu, H. An Incremental Processing Method for Large Thin-Walled Ring Shells: Electromagnetic Incremental Assembly. J. Manuf. Process. 2025, 133, 138–150. [Google Scholar] [CrossRef] [Scilit]
  24. Siddiqui, O.; Hijaz Paul, W.U.; Alam, T. Electromagnetic Modelling & Experimental Analysis of Weld Tool Coil in Magnetic Pulse Welding. Int. J. Adv. Multidiscip. Res. Stud. 2024, 4, 1049–1055. [Google Scholar] [CrossRef] [Scilit]
  25. Zhang, S.; Lueg-Althoff, J.; Hahn, M.; Tekkaya, A.E.; Kinsey, B. Effect of Process Parameters on Wavy Interfacial Morphology During Magnetic Pulse Welding. J. Manuf. Sci. Eng. 2020, 143, 011010. [Google Scholar] [CrossRef] [Scilit]
  26. Zhong, D.; Ouyang, S.; Wang, Y.; Geng, H.; Deng, F.; Zhou, S. Systematic Comparison between Electromagnetic Repulsive and Attractive Forming for Aluminum Alloy Tube Expansion. J. Manuf. Process. 2026, 164, 548–561. [Google Scholar] [CrossRef] [Scilit]
  27. Zhang, H.; Li, X.; Ding, H. Optimization Design and Experimental Verification of Magnetic Pulse Spot Welding System of Dissimilar Metal Sheets Based on a Field Shaper. Sci. Rep. 2025, 16, 3228. [Google Scholar] [CrossRef] [Scilit]
  28. Wang, H.; Zhan, L.; Cui, X.; Yan, Z.; Li, R. Reducing Wrinkling and Springback While Improving the Forming Height of 7075 Aluminum Alloy Outer Edge Flanging Parts by Electromagnetic-Driven Forming. J. Mater. Process. Technol. 2026, 351, 119291. [Google Scholar] [CrossRef] [Scilit]
  29. Cui, J.; You, W.; Sun, H.; Li, G.; Wang, P.; Wang, Q.; Zheng, C.; Wang, C.; Jiang, H. Magnetic Pulse Welding of High-Strength Aluminum Alloy with Enhanced Lorentz Force via Novel Hollow Field Shaper. J. Mater. Process. Technol. 2025, 339, 118829. [Google Scholar] [CrossRef] [Scilit]
  30. Wang, G.; Ren, L. Quantitative Assessment of Internal Corrosion in Elbows Using Hoop Strain Based on OFDR Distributed Optical Fiber Sensor. Eng. Struct. 2025, 343, 121189. [Google Scholar] [CrossRef] [Scilit]
  31. Chen, Y.; Wang, Q.; Wang, K.; Zhou, B.; Zeng, H.; Liu, S.; Ji, X.; Wang, L.; Liu, J. Electromagnetic Modeling, Loss Analysis, and Stress Evaluation of Parallel-Wound No-Insulation High-Temperature Superconducting Magnets. Superconductivity 2025, 16, 100217. [Google Scholar] [CrossRef] [Scilit]
  32. Lesuer, D.R.; Kay, G.J.; LeBlanc, M.M. Modeling Large-Strain, High-Rate Deformation in Metals; Lawrence Livermore National Lab.: Livermore, CA, USA, 2001. [Google Scholar]
Figure 1. Schematic of EMPTF and current distribution under varying inner-to-outer diameter ratios.
Machines 14 01014 g001
Figure 2. Experimental setup for EMPTF: (a) Power supply and controller. (b) Coil and platform. (c) Aluminum tubes. (d) Field shapers.
Machines 14 01014 g002
Figure 3. Schematic of the simulation model and meshing strategy.
Machines 14 01014 g003
Figure 4. Discharge current responses: (a) current waveforms; (b) peak currents.
Machines 14 01014 g004
Figure 5. Experimental and simulated results: (a) relative deformation and (b) error for the 70 mm tube; (c) relative deformation and (d) error for the 80 mm tube.
Machines 14 01014 g005
Figure 6. Equivalent current model. (a) Schematic of current distribution. (b) Equivalent circuit.
Machines 14 01014 g006
Figure 7. Analytical model validation: (a) outer current Io; (b) inner current and magnetic pressure; (c) relative errors.
Machines 14 01014 g007
Figure 8. Inner-current attenuation: (a) analytical normalized through-thickness current-density profiles; (b) current-path interference mechanism; (c) corrected-model validation.
Machines 14 01014 g008
Figure 9. (a) Stress state of a tube element; (b) variation of normalized hoop stress with inner radius.
Machines 14 01014 g009
Table 1. Comparison of previous studies on electromagnetic pulse forming of metal tubes.
AuthorMaterialsOuter Diameter (mm)Wall Thickness (mm)
Sharma et al. (2023) [12]T91–T91 steel6.60.45
Shotri et al. (2020) [14]Cu–Steel22.220.89
Lueg-Althoff et al. (2020) [15]Al–Steel402
Bellmann et al. (2019) [16]Al–Steel801.5
Li et al. (2025) [13]Al–Steel1103
Table 2. Material properties of the coil, field shaper, and tube used in the simulation.
ParametersCoilField shaperTube
MaterialCopperAA6061-T6AA6061-T6
Density (kg/m3)9.0 × 1032.7 × 1032.7 × 103
Young’s modulus (GPa)976969
Poisson’s ratio0.30.330.33
Conductivity (S/m)5.8 × 1072.3 × 1072.3 × 107
Relative permeability111
Table 3. The parameters of 6061 aluminum alloy J–C model.
MaterialA (MPa)B (MPa)Cn
AA6061-T6324.0114.10.0020.42
Table 4. Time-step sensitivity of the representative 35 mm model.
Time Step (μs)Peak Mean Current Density (×1010 A/m2)Difference from the 0.05 μs Case (%)
0.201.1404.28
0.101.1632.35
0.051.191Reference
Table 5. Related parameters of field shaper.
ParametersHhrori
Value (mm)80107210–60
Table 6. Effective wall thickness and correction factors near the interference region.
Inner Radius ri (mm)Diameter Ratio ri/roEffective Thickness teff (mm)Thickness Ratio teff/δCorrection Factor η
500.693.143.250.961
550.762.432.510.919
600.831.711.770.830
Disclaimer/Publisher’s Note: The statements, opinions and data contained in all publications are solely those of the individual author(s) and contributor(s) and not of MDPI and/or the editor(s). MDPI and/or the editor(s) disclaim responsibility for any injury to people or property resulting from any ideas, methods, instructions or products referred to in the content.