1. Introduction
The elevator traction drive system is the core power unit of an elevator, and its operating condition is directly related to equipment safety, operational reliability, and maintenance cost. With the application of permanent magnet synchronous motors (PMSMs), variable-frequency drives, and intelligent control technologies in elevator systems, the fault modes of traction drive systems are no longer limited to conventional mechanical wear. They also involve motor faults, inverter power-device abnormalities, thermal anomalies, current distortion, voltage fluctuation, and multisource signal coupling. Previous studies have shown that sensor-data-based condition monitoring and machine learning methods can be used for fault prediction and predictive maintenance of elevator PMSM drive systems, providing a technical basis for the transition from scheduled maintenance to condition-based maintenance [
1,
2]. From the broader perspective of motor condition monitoring, vibration, current, voltage, temperature, and power signals can reflect the operating state of motors and their drive systems from different aspects. After time-domain, frequency-domain, or time-frequency signal processing, these signals can be used for fault classification and state identification [
3,
4,
5,
6].
For PMSMs and inverter-driven motor systems, inverter open-circuit faults, short-circuit faults, power-device overheating, stator winding faults, and demagnetization faults may degrade drive performance and, in severe cases, affect system safety. Existing reviews and methodological studies on PMSM fault diagnosis have summarized fault types, signal signatures, and fault-tolerant control strategies in drive systems [
7,
8,
9,
10]. Meanwhile, public fault datasets for inverter-driven PMSM systems have gradually become available, providing data support for model reproduction, method comparison, and fault feature analysis [
11]. For specific diagnostic tasks, data-driven methods have been applied to inverter open-circuit faults, stator winding faults, and demagnetization faults [
12,
13,
14]. In recent years, mechanism-informed methods, variable-condition representations, and interpretable diagnostic approaches have also been investigated to improve the reliability of PMSM fault diagnosis [
15,
16,
17,
18].
In addition to drive-side faults, motor-side and transmission-side abnormalities are also important for condition monitoring of elevator traction systems. Studies on induction motor and rotating machinery fault diagnosis have shown that vibration, current, and voltage signals can be used to identify different types of operating abnormalities [
19,
20,
21,
22]. In recent years, multisignal input and multisensor fusion methods have been introduced into motor fault diagnosis. Related studies have demonstrated the diagnostic value of multisource signals through multisignal CNNs, current-information fusion, multichannel data, and multisensor neural networks [
23,
24,
25,
26,
27]. In addition, comparisons between vibration and current signals, synchronized multisensor datasets, and current–vibration fusion diagnosis provide useful references for the modality ablation and independent secondary-dataset analysis conducted in this study [
28,
29,
30].
Although considerable progress has been made, several issues still require further investigation for fault diagnosis of elevator traction drive systems. First, real fault data from elevator field operation are difficult to obtain. Although public motor datasets provide a reproducible experimental basis, their applicability to real elevator systems remains bounded. Second, many motor fault diagnosis studies use random sample splitting for training and testing. For windowed samples generated from continuous signals, adjacent or highly similar signal segments may be assigned to both the training and test sets, resulting in overestimated model performance. Previous studies have shown that data leakage, inappropriate data splitting, and varying operating conditions can affect the evaluation results of vibration-signal-based fault diagnosis models [
31,
32,
33]. Third, multimodal input does not necessarily lead to more stable diagnostic results. Different signal modalities vary in noise level, installation condition, operating-condition sensitivity, and fault-discriminative capability, and simple feature concatenation may introduce redundant or unstable information. In addition, class imbalance may prevent Accuracy from adequately reflecting minority-class recognition performance [
34]; feature importance and interpretability analysis can help determine whether a model relies on physically meaningful signal features [
18,
33,
35]; and noise disturbance, sensor installation, and operating-condition variation may affect the diagnostic reliability of models under practical data acquisition conditions [
36,
37].
Based on these issues, this study conducts a fault diagnosis validation using two public motor-drive datasets. The PMSM inverter-drive fault diagnosis dataset contains current, voltage, temperature, and derived features, and is used to analyze the diagnosability of drive-side open-circuit, short-circuit, and overheating faults under an internal dataset split [
11]. The MOTOR fault detection dataset contains three-axis vibration, three-phase current, and three-phase voltage signals, and is used to analyze the classification performance of multimodal motor data from the independent secondary dataset under different validation protocols [
29]. Elevator traction drive systems differ from general motor systems because they operate under frequent start–stop cycles, rapid load changes, and restricted sensor-installation space. These characteristics increase signal variability and make feature stability, sensor placement, and modality selection more important for fault diagnosis. Therefore, the two public datasets are used as reproducible test beds to identify evaluation bias and signal-reliability risks that should be addressed before developing and deploying diagnostic models for elevator traction systems. The findings provide practical guidance for data-splitting design, signal-modality selection, and robustness evaluation, while field performance still requires validation using real elevator operating data.
The novelty of this study lies in a reproducible evaluation framework that jointly examines validation bias, signal-modality contribution, and noise sensitivity using two complementary public motor-drive datasets. The main contributions are as follows:
(1) Based on the PMSM inverter-drive fault diagnosis dataset, several baseline models, including Logistic Regression, Linear SVM, Random Forest, Extra Trees, and MLP, are compared under random splitting. Confusion matrices and feature importance are further used to analyze the basis of model discrimination.
(2) Based on the independent secondary MOTOR dataset, window-level statistical features are constructed from vibration, current, and voltage signals. The performance difference between random window splitting and strict block-split validation is compared to analyze the possible overestimation caused by random splitting.
(3) Under strict block-split validation, time-domain features and frequency-domain extended features are compared, and modality ablation experiments are conducted using vibration, current, voltage, and their combinations to analyze the contribution of different signal modalities to fault classification.
(4) For the vibration modality, which performs well under strict block-split validation, noise robustness analysis is carried out. Combined with feature importance results from the PMSM and MOTOR datasets, the engineering implications and limitations of the proposed validation study for elevator traction drive system fault diagnosis are discussed.
The remainder of this paper is organized as follows:
Section 2 introduces the datasets and task definition.
Section 3 describes data preprocessing, feature construction, baseline models, and validation protocols.
Section 4 presents the experimental settings and evaluation metrics.
Section 5 analyzes the experimental results and discusses their engineering implications.
Section 6 concludes the paper.
2. Datasets and Task Definition
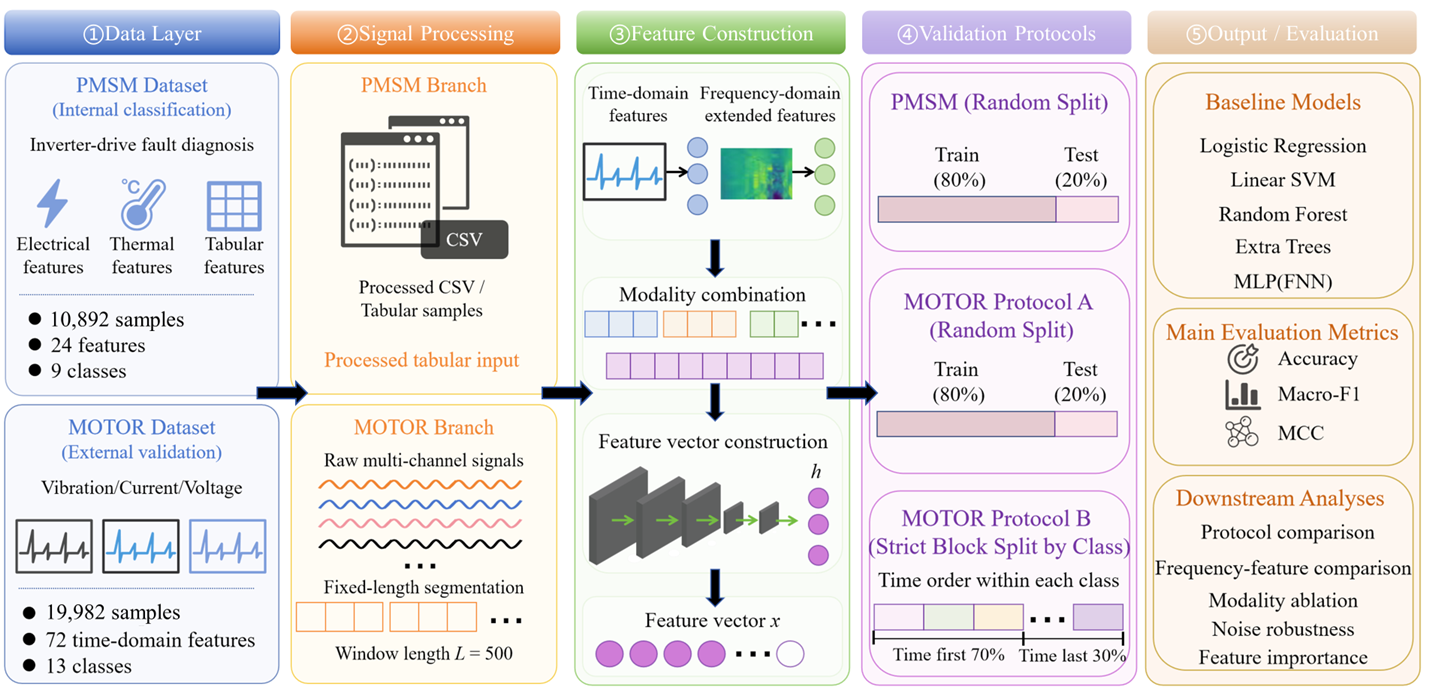
To evaluate the applicability of motor-drive fault diagnosis methods under different signal sources and validation protocols, two public motor-drive-related datasets were used in this study. The PMSM inverter-drive fault diagnosis dataset was used as the main dataset to evaluate the internal multiclass fault classification performance of inverter-driven motors and to analyze the contribution of electrical, thermal, and derived features to fault identification. The MOTOR fault detection dataset was used as an independent secondary dataset to compare diagnostic results under random splitting and strict block-split validation, and to further support modality ablation and noise robustness analysis. The basic information of the two datasets is summarized in
Table 1. The overall data flow, feature construction procedure, and validation workflow are shown in
Figure 1.
The two public datasets are not regarded as equivalent to real elevator field data in this study. Instead, they are used as reproducible experimental bases for fault diagnosis research on elevator traction drive systems. An elevator traction system generally consists of a motor, inverter drive, braking and transmission components, and a control system. During operation, it may experience inverter open-circuit faults, short-circuit faults, power-device overheating, abnormal motor vibration, current distortion, and voltage fluctuation. Therefore, the PMSM inverter-drive fault data and multimodal motor operation data can, to some extent, reflect typical signal variations in the drive, motor, and load-transmission parts of an elevator traction drive system, providing a basis for subsequent fault diagnosis model validation.
2.1. PMSM Inverter-Drive Fault Diagnosis Dataset
The PMSM inverter-drive fault diagnosis dataset was used as the main dataset in this study to evaluate the internal classification performance of inverter-driven motor faults. This dataset was acquired using a custom inverter-driven PMSM test rig operated at 15 V, 10 rad/s, and an ambient temperature of 25 °C. Phase and DC currents were measured using ACS712 20 A Hall-effect sensors, while three 10 kΩ NTC thermistors monitored the inverter half-bridge temperatures. An Arduino-based acquisition system recorded eight raw channels at 10 Hz under normal, open-circuit, short-circuit, and overheating conditions [
11]. The processed CSV file was used as the input in this study. It contains 10,892 samples and 24 features for modeling. The features mainly include A- and B-phase currents, DC bus voltage, DC current, power-device temperatures, power, current imbalance, temperature-difference features, and voltage and current rate-of-change features. The label column is FDD, which contains nine operating and fault states. The fault categories are listed in
Table 2. The data version used in this study corresponds to the public data repository [
38].
In terms of fault types, this dataset covers normal operation, inverter open-circuit faults, short-circuit faults, and overheating faults. Specifically, F0 represents the normal state; F1 and F2 correspond to open-circuit faults in different switching devices; F3, F4, and F5 correspond to short-circuit faults at different device locations; and F6, F7, and F8 correspond to overheating faults in different power modules or bridge-arm positions. These fault types are closely related to inverter power-device abnormalities, thermal failure risks, and drive-chain faults in elevator traction drive systems. Therefore, this dataset is suitable as the main dataset for this study.
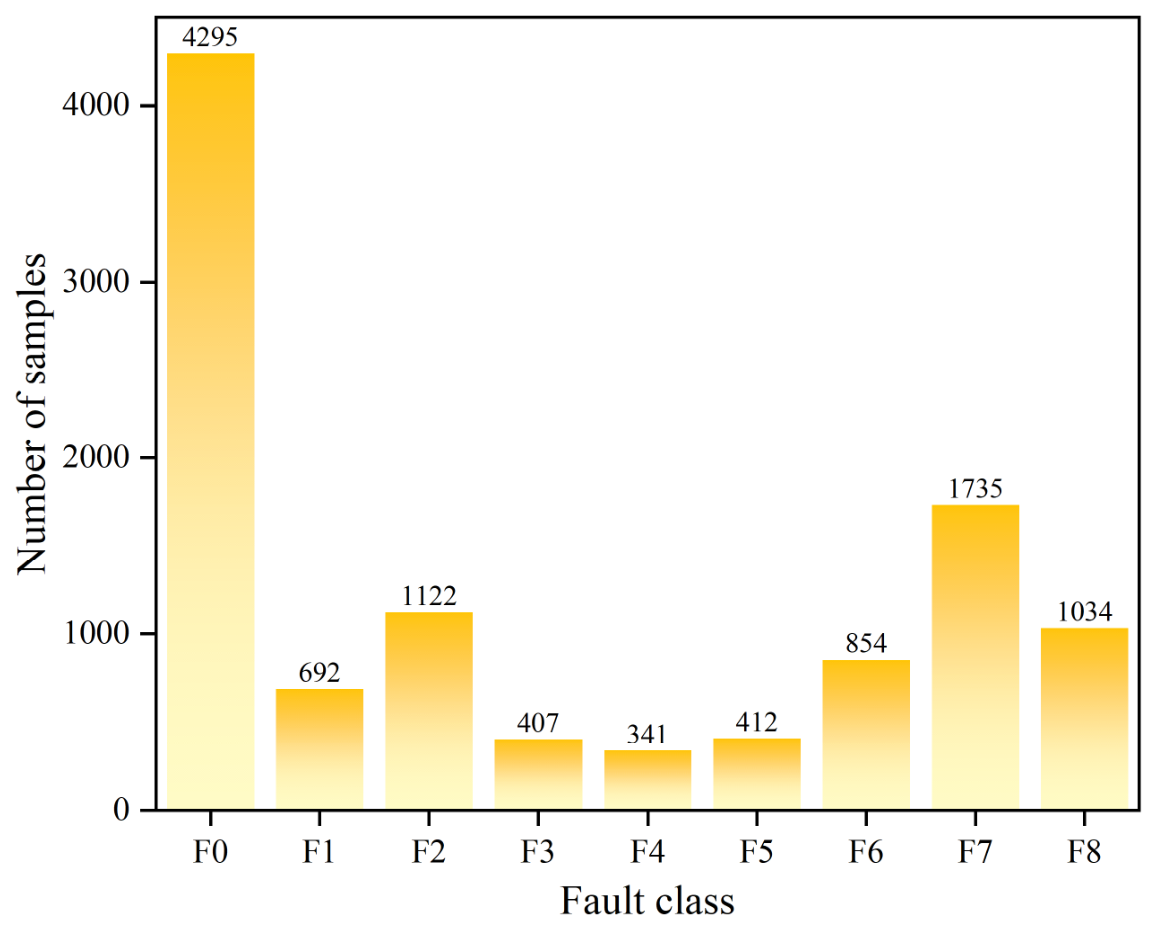
The sample distribution of each fault class is shown in
Figure 2. The PMSM dataset shows a certain degree of class imbalance. The normal state F0 has the largest number of samples, whereas some short-circuit fault classes, such as F3, F4, and F5, contain relatively fewer samples. Therefore, in the subsequent model evaluation, Accuracy is reported together with Macro-Precision, Macro-Recall, Macro-F1, and MCC to avoid overestimating minority-class recognition performance when using overall accuracy alone.
2.2. Independent Secondary MOTOR Dataset
The MOTOR fault detection dataset was used as an independent secondary dataset to evaluate the diagnostic performance of models on another type of multimodal motor signal data. This dataset was acquired using a 0.2 kW four-pole induction motor coupled to a four-quadrant dynamometer. A motor-mounted ADXL335 accelerometer measured three-axis vibration, isolated sensor modules measured three-phase currents and voltages, and all signals were synchronously recorded by a dSPACE system at 50 kHz. Each operating condition was recorded for 20 s under different motor-health, load, and phase-loss conditions [
29]. The dataset consists of 10 CSV files and one MAT label file. Each CSV file contains three-axis vibration signals X, Y, and Z; three-phase current signals I1, I2, and I3; and three-phase voltage signals V1, V2, and V3. In this study, every 500 sampling points were used as one non-overlapping signal window for feature extraction, resulting in 19,982 labeled windows. Eight statistical features were extracted from each of the nine signal channels, resulting in 72 features per window. The dataset contains 13 classes representing motor operating stage, health condition, phase-loss condition, and mechanical load, as summarized in
Table 3. Photographs and detailed schematics of the original experimental platforms are available in the corresponding dataset publications [
11,
29].
Compared with the PMSM dataset, the MOTOR dataset has two main characteristics. First, it retains the original vibration, current, and voltage signals, allowing the contribution of different signal modalities to fault diagnosis performance to be compared. Second, its window samples are generated from continuous signal acquisition. If random window splitting is directly applied, adjacent signal windows with similar waveform patterns may be assigned to both the training and test sets, leading to overestimated model performance. Similar issues have been discussed in vibration-signal-based fault diagnosis studies [
32]. Therefore, both random stratified splitting and label-wise strict block splitting were designed for this dataset to analyze the influence of validation protocols on diagnostic results.
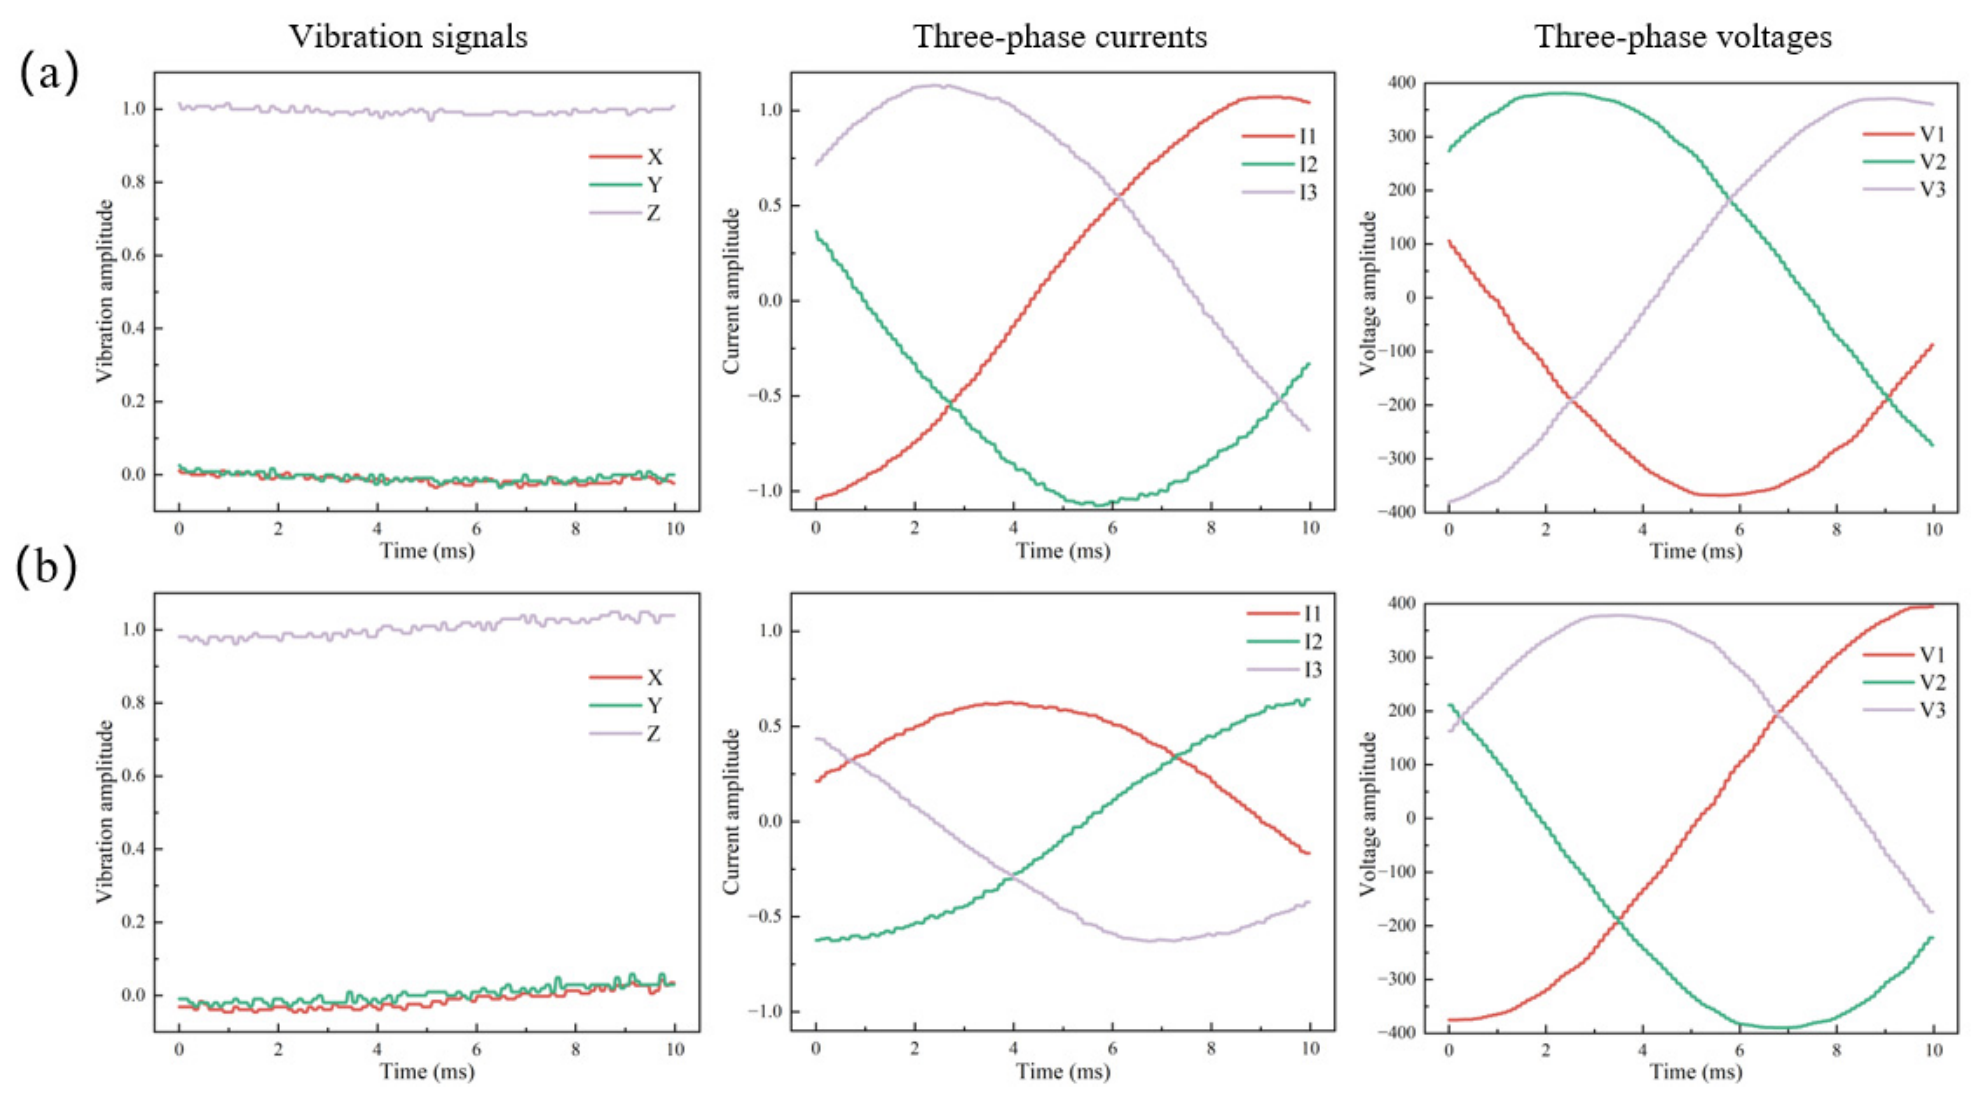
Representative short-time signal segments are shown in
Figure 3. Label 1 and Label 9 were selected as two representative classes to display the raw waveform patterns of three-axis vibration signals, three-phase current signals, and three-phase voltage signals. It should be noted that
Figure 3 is not intended to identify specific fault types directly, nor are the two labels interpreted as a normal–fault comparison. Instead, the figure illustrates the raw signal variations in different modalities in the Secondary dataset, providing a visual basis for subsequent time-domain feature extraction, modality ablation, and noise robustness analysis.
2.3. Task Mapping for Elevator Traction Drive Systems
The core operating chain of an elevator traction drive system includes the inverter, motor body, traction sheave, and load-transmission structure. Inverter faults may appear as switching-device open-circuit faults, short-circuit faults, overheating, and DC-side voltage or current abnormalities. Abnormalities in the motor body and transmission structure may appear as increased vibration, three-phase current imbalance, voltage fluctuation, and unstable operating states. Although the two public datasets used in this study are not real elevator operation data, their signal types and fault mechanisms show certain correspondence with those of elevator traction drive systems.
To clarify the scope of the two public datasets,
Table 4 summarizes the correspondence between typical elevator traction-system faults and the fault conditions covered by the datasets. This correspondence is based on similar fault mechanisms and signal responses rather than direct equivalence to real elevator faults. Elevator-specific faults that are not covered by either dataset are also listed.
2.4. Fault Diagnosis Task and Evaluation Objectives
In this study, fault diagnosis is defined as a multiclass supervised classification task. For the PMSM dataset, the input consists of electrical, thermal, and derived features for each sample, and the output is one of the class labels from F0 to F8. This task is used to evaluate the internal recognition capability of different machine learning models for inverter-driven motor fault classification and to analyze the contribution of key features to classification results.
For the independent secondary MOTOR dataset, the input consists of statistical features extracted from raw vibration, current, and voltage signal windows, and the output is one of the labels from 1 to 13. This task is used to evaluate model generalization under different validation protocols and to further analyze the effects of time-domain features, frequency-domain extended features, single-modality and multimodality combinations, and different noise levels on fault diagnosis performance.
The evaluation objectives of this study include four aspects. First, the fault classification performance of different baseline models on the PMSM dataset is evaluated to clarify the diagnosability of public inverter-drive data under an internal dataset split. Second, the performance difference between random window splitting and strict block splitting on the MOTOR dataset is compared to analyze the possible overestimation caused by random splitting. Third, the contributions of vibration, current, voltage, and their combinations are evaluated to determine whether simple multimodal concatenation necessarily outperforms a single modality. Fourth, the effect of noise disturbance on the best-performing modality model is analyzed to provide references for robust diagnosis of elevator traction drive systems under practical operating environments.
3. Methods
This study adopts reproducible feature construction, baseline models, and validation protocols to evaluate fault diagnosis performance on two public motor-drive-related datasets. The overall procedure includes data preprocessing, window segmentation, feature extraction, baseline classification, validation protocol design, modality ablation, noise robustness analysis, and feature importance interpretation, as shown in
Figure 1. The focus of this study is not to propose a complex deep learning architecture, but to analyze how data sources, validation protocols, signal modalities, and noise conditions affect diagnostic results.
3.1. Data Preprocessing and Window Segmentation
The PMSM inverter-drive fault dataset is provided in a processed tabular format, where each row corresponds to one sample and contains current, voltage, temperature, and derived features. After reading the processed CSV file, non-input label columns were removed, and FDD was used as the classification label. The modeling features include phase current, DC bus voltage, DC current, power-device temperature, current imbalance, temperature difference, voltage rate of change, and current rate of change. Missing values and non-numeric entries were checked during data loading to ensure that all variables entering the models were numerical features.
The independent secondary MOTOR dataset consists of continuous sampled signals. Each CSV file contains three-axis vibration, three-phase current, and three-phase voltage signals. To convert continuous signals into samples suitable for classification, a fixed-length window segmentation strategy was used. Let the original multichannel signal be denoted as
and the window length be
. The
window can be expressed as:
where
denotes the multichannel signal at the t-th sampling point, L is the window length, and Nw is the number of windows. In this study, L = 500, resulting in 19,982 labeled windows.
It should be noted that the windows in the MOTOR dataset are generated from continuous signals. If the windows are directly split at random, adjacent or similar signal segments may appear in both the training and test sets, allowing the model to learn local repeated patterns rather than more general fault-related features. Similar issues have been discussed in studies on data leakage in vibration-signal-based fault diagnosis [
32]. Therefore, both random stratified splitting and strict block splitting were used in the subsequent experiments to compare the effects of different validation protocols.
3.2. Time-Domain and Frequency-Domain Feature Construction
For the PMSM dataset, this study directly used the electrical, thermal, and derived features provided in the processed dataset. For the independent secondary MOTOR dataset, statistical features were extracted from vibration, current, and voltage signals. The original signal channels include , , , , , , , , and , giving a total of nine channels. Eight time-domain features were extracted from each channel, including mean, standard deviation, root mean square, minimum, maximum, peak-to-peak value, skewness, and kurtosis. Therefore, each window produced 72 time-domain features.
For a single-channel signal with length , the mean, standard deviation, and root mean square are defined as:
The peak-to-peak value describes the amplitude variation range within a window and is defined as:
Skewness and kurtosis are used to describe the distribution shape of the signal and are defined as:
In addition to time-domain features, frequency-domain extended features were further constructed to examine whether frequency-domain information can improve generalization under strict validation. The discrete Fourier transform of the windowed signal is given by:
The extracted frequency-domain features include dominant frequency, dominant-frequency amplitude, spectral centroid, spectral root mean square, spectral energy, and band energy ratios. The energy ratio of the
frequency band is defined as:
where
denotes the
frequency band and
is the frequency corresponding to the
DFT bin. Multiple frequency bands were used to describe the energy distribution across different frequency ranges. These frequency-domain extended features were not assumed to be superior to time-domain features by default; instead, their contribution was evaluated through strict block-split validation in the subsequent experiments.
3.3. Baseline Fault Diagnosis Models
Five commonly used machine learning models were adopted as baseline classifiers, including Logistic Regression, Linear SVM, Random Forest, Extra Trees, and MLP. Logistic Regression and Linear SVM were used as linear classification baselines, Random Forest and Extra Trees were used to model nonlinear feature relationships, and MLP was used as a shallow nonlinear learning model. Since the focus of this study is to compare the effects of validation protocols, feature settings, and modality combinations rather than to design a complex network architecture, these models are sufficient for baseline comparison.
For Logistic Regression, Linear SVM, and MLP, feature standardization was performed before model training. The standardization parameters were calculated only from the training set and then applied to the test set to avoid information leakage. Random Forest and Extra Trees were trained directly using the original feature values because they are not sensitive to feature scaling. Random Forest was also used for subsequent feature importance analysis.
3.4. Random Splitting and Strict Block-Split Validation Protocols
The validation protocol is a key part of the methodological design. For the PMSM dataset, random stratified 80/20 splitting was adopted. The class proportions were maintained as consistently as possible, with 80% of the samples used for training and 20% for testing. This setting was used to evaluate the classification performance of the PMSM inverter-drive fault dataset under a conventional internal split.
For the independent secondary MOTOR dataset, two validation protocols were used. The first was random stratified 80/20 splitting, which is consistent with the common practice in many fault diagnosis studies and reflects classification performance under randomly mixed window samples. The second was label-wise strict block splitting. The ten CSV files were processed in the source-defined order from File 1 to File 10, and the temporal order of the windows within each file was preserved. Although the windows did not overlap, temporally adjacent windows may still exhibit similar waveform patterns; therefore, random window splitting may assign highly similar segments to both the training and test sets. Within each class, the earlier 70% of windows were used for training and the later 30% were used for testing. Because the split was performed by label rather than by recording file or acquisition session, training and test windows could originate from the same file or session. Therefore, this protocol reduces the similarity leakage caused by randomly mixing adjacent windows, but does not completely eliminate file- or session-specific similarity.
Strict block splitting is not intended to artificially reduce performance, but to examine whether the model has generalization capability across different time segments. For continuously sampled motor signals, random window splitting can allow the training and test sets to share similar local waveform structures, especially when the window length is short and adjacent segments change slowly. Therefore, both random-split and block-split results were reported, and the performance gap between them was used as one basis for assessing model reliability.
In addition, time-domain features and frequency-domain extended features were further compared under the same strict block-split setting. This experiment was designed to answer a specific question: whether adding frequency-domain information can still provide stable improvement under a stricter validation protocol. If frequency-domain features fail to improve performance under block splitting, their contribution to cross-time-segment generalization is limited.
3.5. Modality Contribution and Robustness Analysis
The MOTOR dataset contains three signal modalities: vibration, current, and voltage. To analyze the contributions of different modalities to diagnostic performance, multiple modality combinations were constructed under strict block-split validation, including vibration only, current only, voltage only, vibration plus current, vibration plus voltage, current plus voltage, and all modalities. All modality combinations used the same training and test split, and Random Forest was used as the classifier to avoid comparison bias caused by different data splits or model settings.
The purpose of modality ablation is not to prove that multimodal input is always superior to a single modality, but to examine the actual contribution of different signals under strict validation. In motor-drive systems, vibration signals usually reflect mechanical-side state changes more directly, whereas current and voltage signals reflect electrical-side operating characteristics. Different modalities may be complementary, but redundant or noisy features may also degrade model generalization. Therefore, the ablation experiment was used to determine whether simple feature concatenation is truly effective.
For feature-level robustness analysis, Gaussian perturbations were independently added to each test-feature dimension after feature extraction, while the training set remained unchanged. For the feature, the signal power and noise variance were calculated as:
The SNR was therefore controlled separately for each feature dimension to account for differences in feature scale. This experiment evaluates robustness to feature-level perturbations rather than directly simulating sensor noise in the raw signals.
To further interpret the classification basis of the models, Random Forest feature importance was used to analyze the key features in the PMSM and MOTOR datasets. It should be emphasized that feature importance only reflects the model’s dependence on specific features under the current dataset and training conditions; it should not be directly interpreted as a causal mechanism of fault occurrence. In this study, feature importance was used as an auxiliary interpretation tool to identify the electrical, thermal, or vibration features mainly used by the model for classification and to support subsequent engineering discussion.
4. Experimental Settings
This section describes the experimental protocols, data splitting strategies, baseline models, evaluation metrics, and implementation details. The purpose of this study is not to obtain the highest single-point accuracy through extensive hyperparameter tuning, but to compare the effects of validation protocols, feature settings, signal modalities, and noise disturbance on diagnostic results. Therefore, all experiments were conducted using a unified data processing pipeline and fixed model settings. The experimental protocols summarized in
Table 5 P1 were used to evaluate the internal classification performance of the PMSM dataset; P2 and P3 were used to compare the performance of the MOTOR dataset under random splitting and strict block-split validation; P4 was used to compare time-domain features and frequency-domain extended features; P5 was used to analyze the contribution of different modality combinations; and P6 was used to evaluate the noise robustness of the vibration-only model.
4.1. Data Splitting Strategy
For the PMSM dataset, a stratified random 80/20 split was used. Specifically, 80% of the samples were used for training and the remaining 20% for testing, while maintaining approximately the same class proportions in both subsets. Since the PMSM dataset is already provided in a sample-level tabular format, no additional window segmentation was performed.
For the MOTOR dataset, two splitting strategies were used. The first was stratified random 80/20 splitting, in which 80% of all window samples were randomly selected as the training set and the remaining 20% as the test set, while preserving the class distribution. This setting reflects the classification performance under randomly mixed window samples.
The second strategy was the 70/30 label-wise strict block split described in
Section 3.4. For each class, the earlier 70% of windows were used for training and the later 30% were used for testing. This strategy preserves the temporal order of continuous signal windows and reduces the risk of performance overestimation caused by assigning adjacent or highly similar windows to both the training and test sets. Similar data leakage problems have been reported in vibration-signal-based fault diagnosis studies [
32].
A file- or session-level split was not adopted because the ten recording files do not contain identical label coverage, which would produce inconsistent class spaces between the training and test sets. The adopted label-wise block split should therefore be regarded as a stricter alternative to random window splitting, rather than as complete session-independent validation. The same strict block split was used in the feature comparison, modality ablation, and noise robustness experiments to ensure comparability across experiments.
4.2. Baseline Models and Parameter Settings
Five commonly used machine learning models were selected as baseline models: Logistic Regression, Linear SVM, Random Forest, Extra Trees, and MLP. These models represent linear classifiers, ensemble tree models, and shallow neural network models, respectively. No complex deep learning architecture was introduced because the focus of this study is not network structure design, but the influence of validation protocols, modality contribution, and noise disturbance on diagnostic results.
For Logistic Regression, Linear SVM, and MLP, the input features were standardized before training. The standardization parameters were calculated only from the training set and then applied to the test set to avoid information leakage. Random Forest and Extra Trees were trained directly using the original feature values. All models used consistent settings across different experimental protocols to avoid confounding the protocol comparison with model-setting differences. Since Random Forest can provide feature importance scores, it was also used as the main model for subsequent feature interpretation.
4.3. Evaluation Metrics
Accuracy, Macro-Precision, Macro-Recall, Macro-F1, and MCC were used to evaluate classification performance. Since both the PMSM and MOTOR datasets show class imbalance, Accuracy alone cannot fully reflect the recognition performance for minority classes. Therefore, Macro-F1 was used as the main evaluation metric, while MCC was reported as a complementary metric for overall classification consistency.
For a multiclass classification task containing
test samples, Accuracy is defined as:
where
is the true label of the
sample,
is the predicted label, and
is the indicator function.
For the
class, Precision and Recall are defined as:
where
,
, and
denote the true positive, false positive, and false negative samples of class
, respectively. The class-level F1-score is defined as:
For multiclass tasks, Macro-F1 is calculated by equally averaging the F1-scores of all classes:
where
is the number of classes. Because each class has the same weight in Macro-F1, this metric more directly reflects the model’s recognition capability for minority fault classes.
MCC is used to measure the consistency between predicted labels and true labels. For multiclass classification, the multiclass MCC form is used:
where
is the total number of correctly classified samples,
is the total number of samples,
is the number of samples predicted as class
, and
is the number of samples truly belonging to class
. A value of MCC closer to 1 indicates more reliable overall classification performance.
To quantify uncertainty under strict block-split validation, 95% confidence intervals were estimated using 1000 bootstrap resamples of the test results with a fixed random seed of 42.
4.4. Implementation Details
All experiments were conducted in Python3.11.9. The main libraries used for data reading, feature extraction, model training, performance evaluation, and figure generation included pandas2.2.2, NumPy1.26.4, SciPy1.13.1, scikit-learn1.5.1, and Matplotlib3.9.0. The window length of the MOTOR dataset was 500 sampling points. At a sampling frequency of 50,000 Hz, each window corresponded to 10 ms.
The PMSM dataset was read directly from the processed CSV file, and FDD was used as the label. For the MOTOR dataset, 10 raw CSV signal files were first read and then combined with the MAT label file to construct window-level samples. Time-domain statistical features were extracted from the vibration, current, and voltage channels of each window. In the frequency-domain extended feature experiment, FFT-related features and band energy ratios were further calculated.
Model training and testing were carried out strictly according to the corresponding experimental protocols. Random-split experiments used stratified sampling to maintain class proportions in the training and test sets. Strict block-split experiments followed the within-class window order and did not randomly shuffle samples at the window level. Standardization, model training, and feature importance calculation were performed only on the training set, while the test set was used only for final performance evaluation.
Experimental results were saved in both tabular and graphical forms. Classification performance was recorded using Accuracy, Macro-Precision, Macro-Recall, Macro-F1, and MCC. Confusion matrices were used to analyze misclassification relationships among specific classes. Feature importance was used to interpret the model’s dependence on different input features. Noise robustness results were used to observe performance degradation under different signal-to-noise ratio levels.
5. Results and Discussion
5.1. Fault Diagnosis Results on the PMSM Dataset
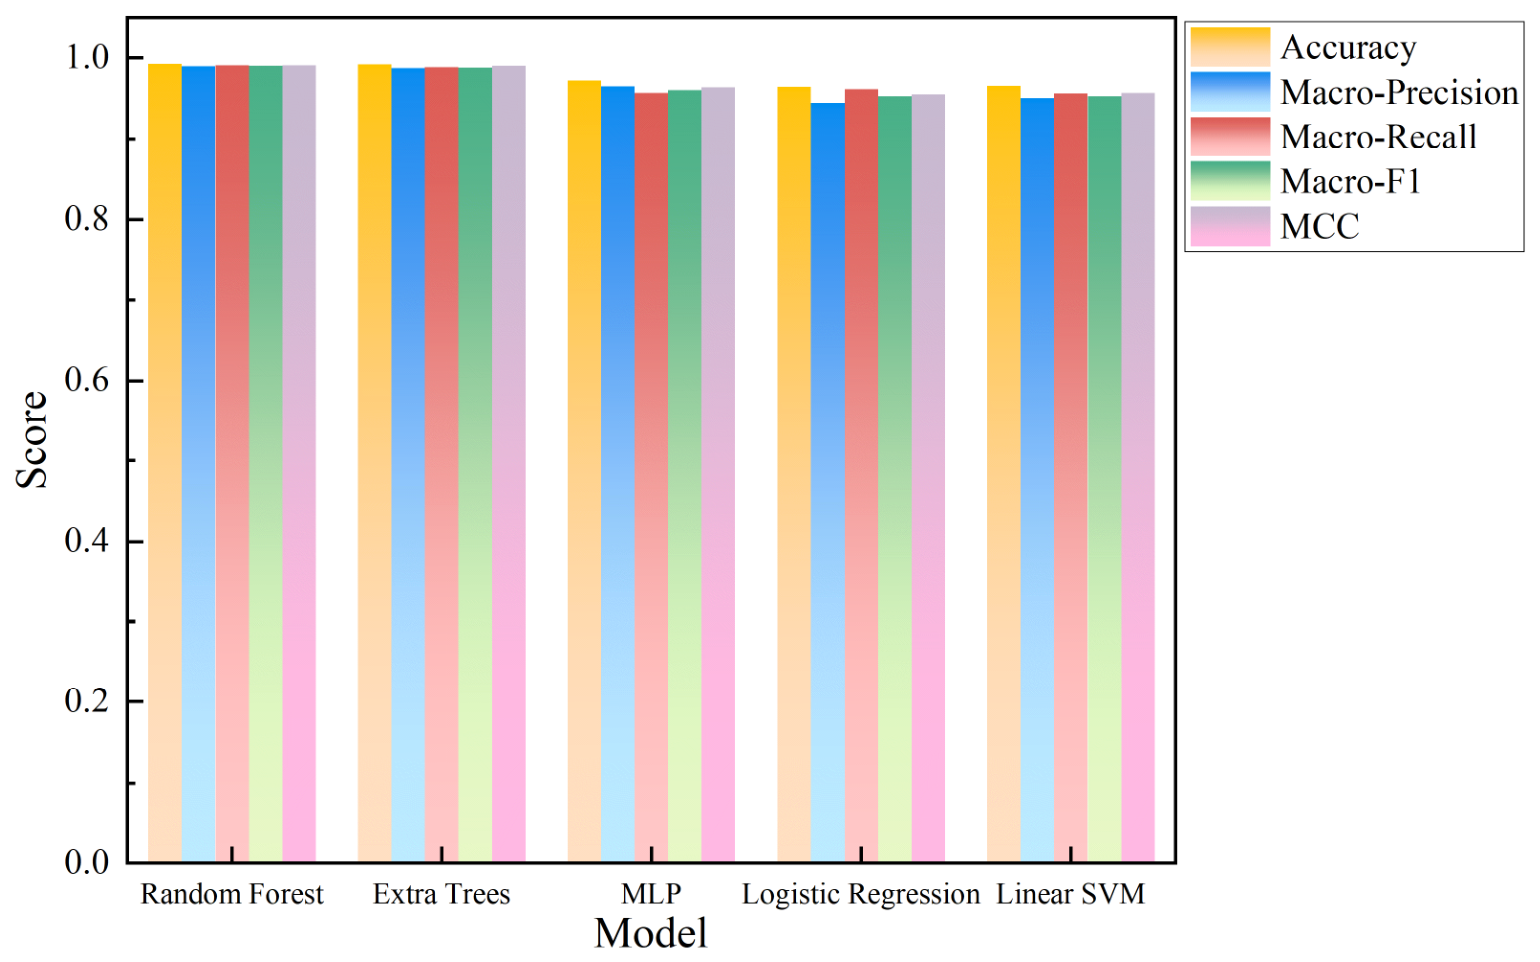
Table 6 presents the classification results of the baseline models on the PMSM dataset under stratified random 80/20 splitting. Overall, all five models achieved high classification performance. Random Forest performed best, with an Accuracy of 0.9927, a Macro-F1 of 0.9901, and an MCC of 0.9907. Extra Trees achieved comparable results, with an Accuracy of 0.9922 and a Macro-F1 of 0.9879. MLP, Logistic Regression, and Linear SVM showed slightly lower performance, but their Macro-F1 scores remained above 0.95.
Figure 4 compares the classification performance of different baseline models on the PMSM dataset. The tree-based models outperformed the linear models and MLP, indicating that the relationships between the electrical, voltage, temperature, and derived features and the fault classes are partly nonlinear. Open-circuit faults, short-circuit faults, and overheating faults do not exhibit identical feature variations, and different feature combinations may form clearer class boundaries. Therefore, Random Forest and Extra Trees achieved more stable classification performance.
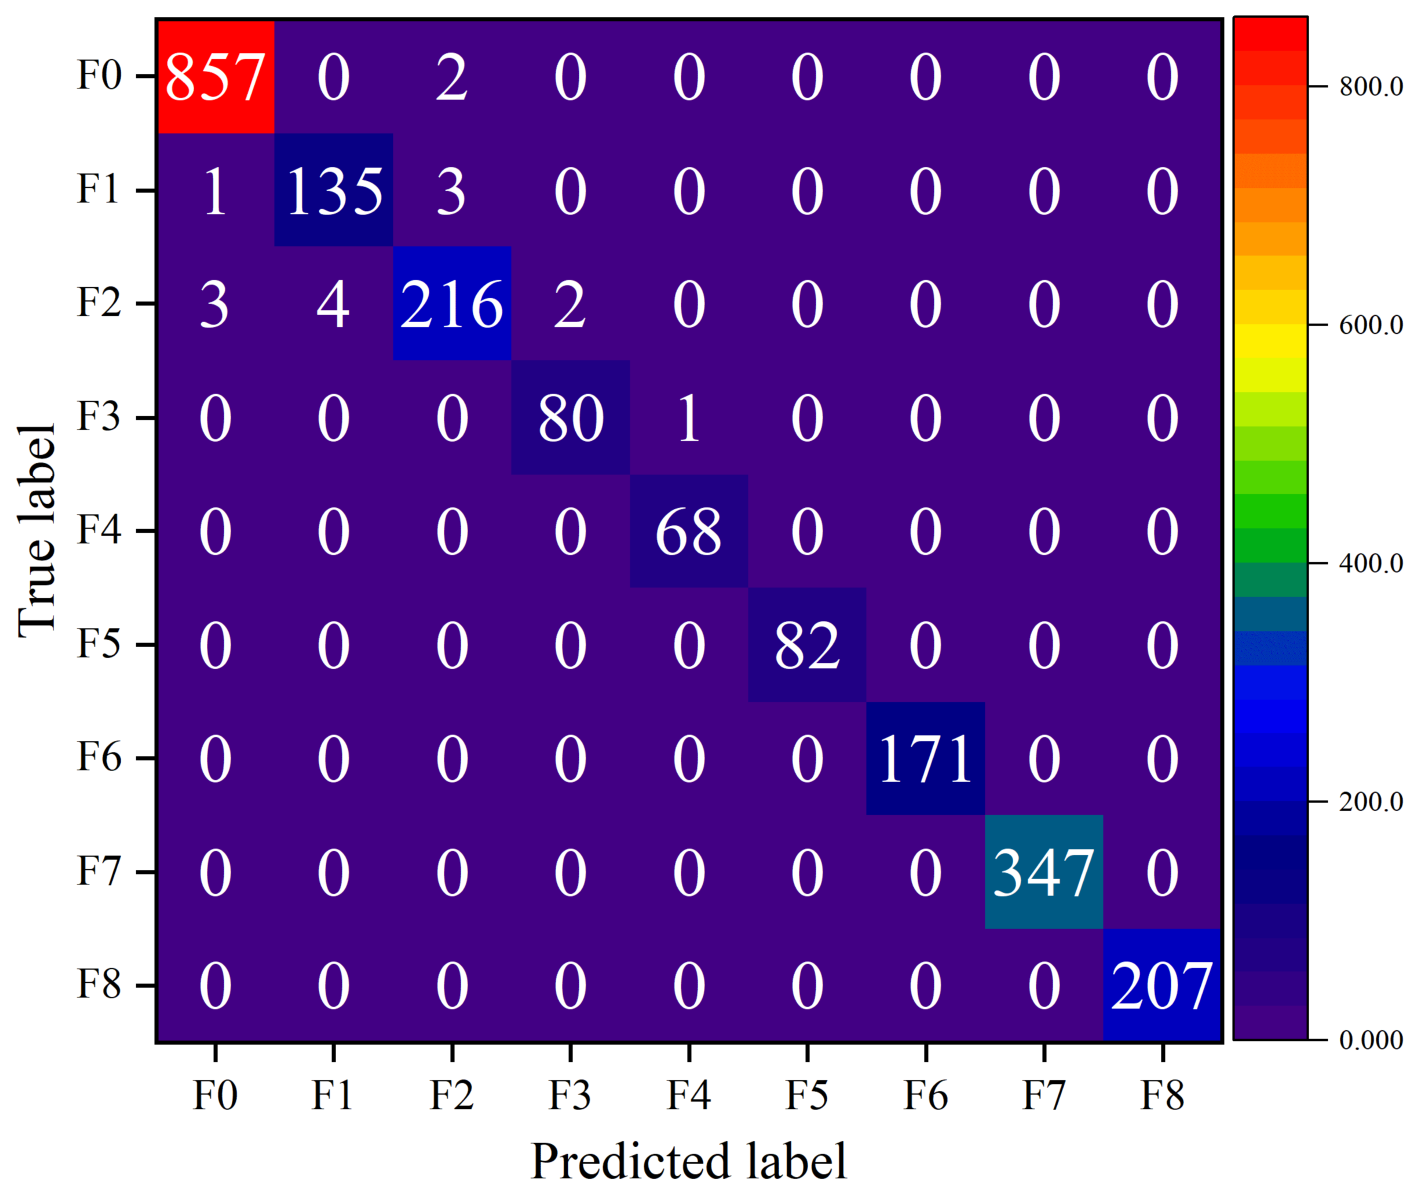
Figure 5 shows the confusion matrix of Random Forest on the PMSM dataset. Most samples are distributed along the main diagonal, indicating that the model can effectively distinguish the F0–F8 operating and fault states. A small number of misclassifications mainly occurred between fault classes with similar feature patterns, especially short-circuit faults at different device locations or overheating faults at different bridge-arm positions. These faults may exhibit similar electrical and thermal feature variations, and therefore a few confusions may still occur when classification relies only on tabular features.
The high performance on the PMSM dataset indicates that current, voltage, temperature, and derived features provide strong discriminative information for inverter-drive fault diagnosis. In particular, when open-circuit, short-circuit, and overheating faults coexist, the tree-based models still maintain a high Macro-F1, suggesting that these features contain relatively stable class-related information. However, this result is based on an internal random split of the same dataset and cannot be directly generalized to different devices, different operating conditions, or real elevator field scenarios. Therefore, the strict validation results on the MOTOR dataset are more suitable for discussing generalization risks.
5.2. Fault Diagnosis Results on the Independent Secondary MOTOR Dataset
Table 7 shows the classification results on the independent secondary MOTOR dataset under stratified random 80/20 splitting. Random Forest again achieved the best performance, with an Accuracy of 0.9922, a Macro-F1 of 0.9682, and an MCC of 0.9914. Extra Trees also achieved Accuracy and MCC values close to those of Random Forest, but its Macro-F1 was lower, at 0.9425. Logistic Regression, MLP, and Linear SVM showed relatively lower performance, but their overall classification results remained high.
As shown in
Table 7, the diagnostic results under random window splitting are high and are even close to the random-split results on the PMSM dataset. This indicates that traditional machine learning models based on time-domain statistical features can extract discriminative information from vibration, current, and voltage signals. However, the MOTOR dataset is generated by segmenting continuous signals, and adjacent windows may have strong waveform similarity. If the windows are directly split at random, the training and test sets may contain signal segments from nearby time periods. As a result, the high scores may be partly due to fault-related features and partly due to local waveform similarity between adjacent windows.
Therefore, the results in
Table 7 should be regarded as a random-window baseline rather than direct evidence of engineering generalization. For continuously sampled motor signals, high scores on randomly split test windows may reflect the recognition of similar signal segments rather than generalization across time segments. Without further validation, this issue may lead to an overly optimistic assessment of model performance.
5.3. Performance Difference Between Random Splitting and Strict Block-Split Validation
To examine whether random window splitting overestimates model performance, strict block-split validation was further applied to the MOTOR dataset.
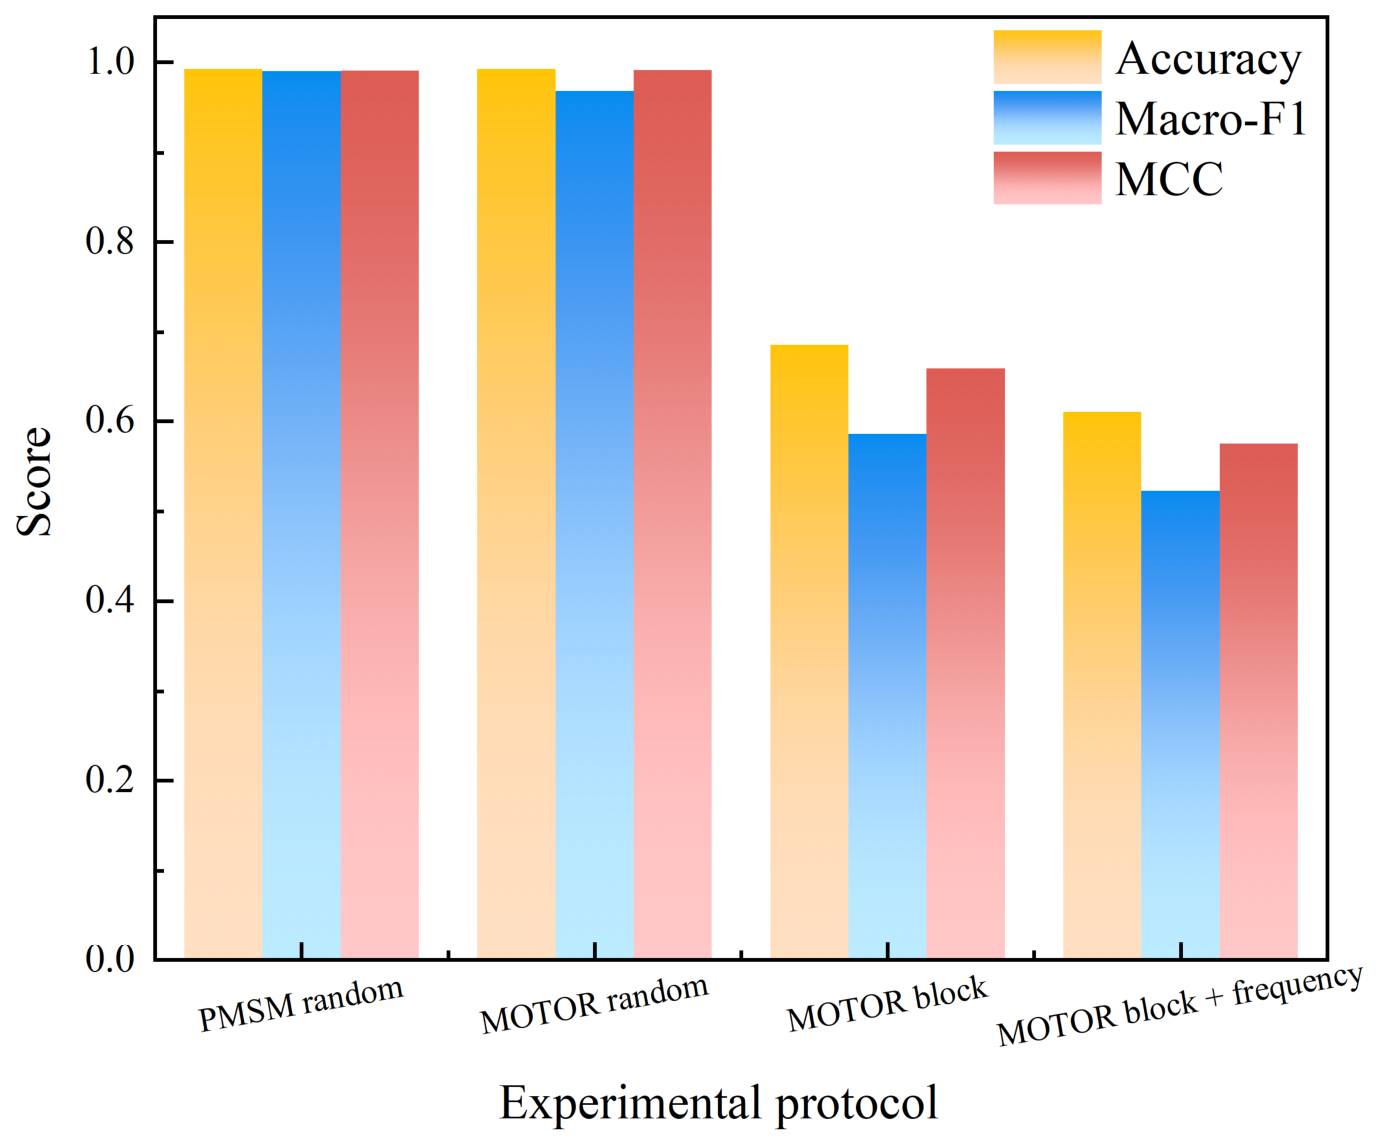
Table 8 shows the results under this protocol. Compared with random splitting, the performance of all models decreased noticeably. Random Forest remained the best-performing model, but its Accuracy decreased to 0.6857, Macro-F1 to 0.5856, and MCC to 0.6591. The Macro-F1 scores of Extra Trees and MLP were 0.5358 and 0.5347, respectively, while those of Logistic Regression and Linear SVM further decreased to 0.4882 and 0.4372.
Figure 6 compares the Accuracy, Macro-F1, and MCC results under the PMSM random split, MOTOR random split, MOTOR strict block split, and MOTOR strict block split with frequency-domain extended features. The most obvious change appears on the MOTOR dataset: the Macro-F1 reaches 0.9682 under random splitting but decreases to 0.5856 under strict block-split validation. This gap shows that the validation protocol can substantially change the performance assessment of models trained on continuous windowed data. Reporting only random-split results may lead to an overly optimistic conclusion, whereas block-split validation, although yielding lower scores, better exposes the recognition pressure faced by the model on later time segments. Similar data leakage and evaluation bias issues have been discussed in vibration-signal-based fault diagnosis studies [
32].
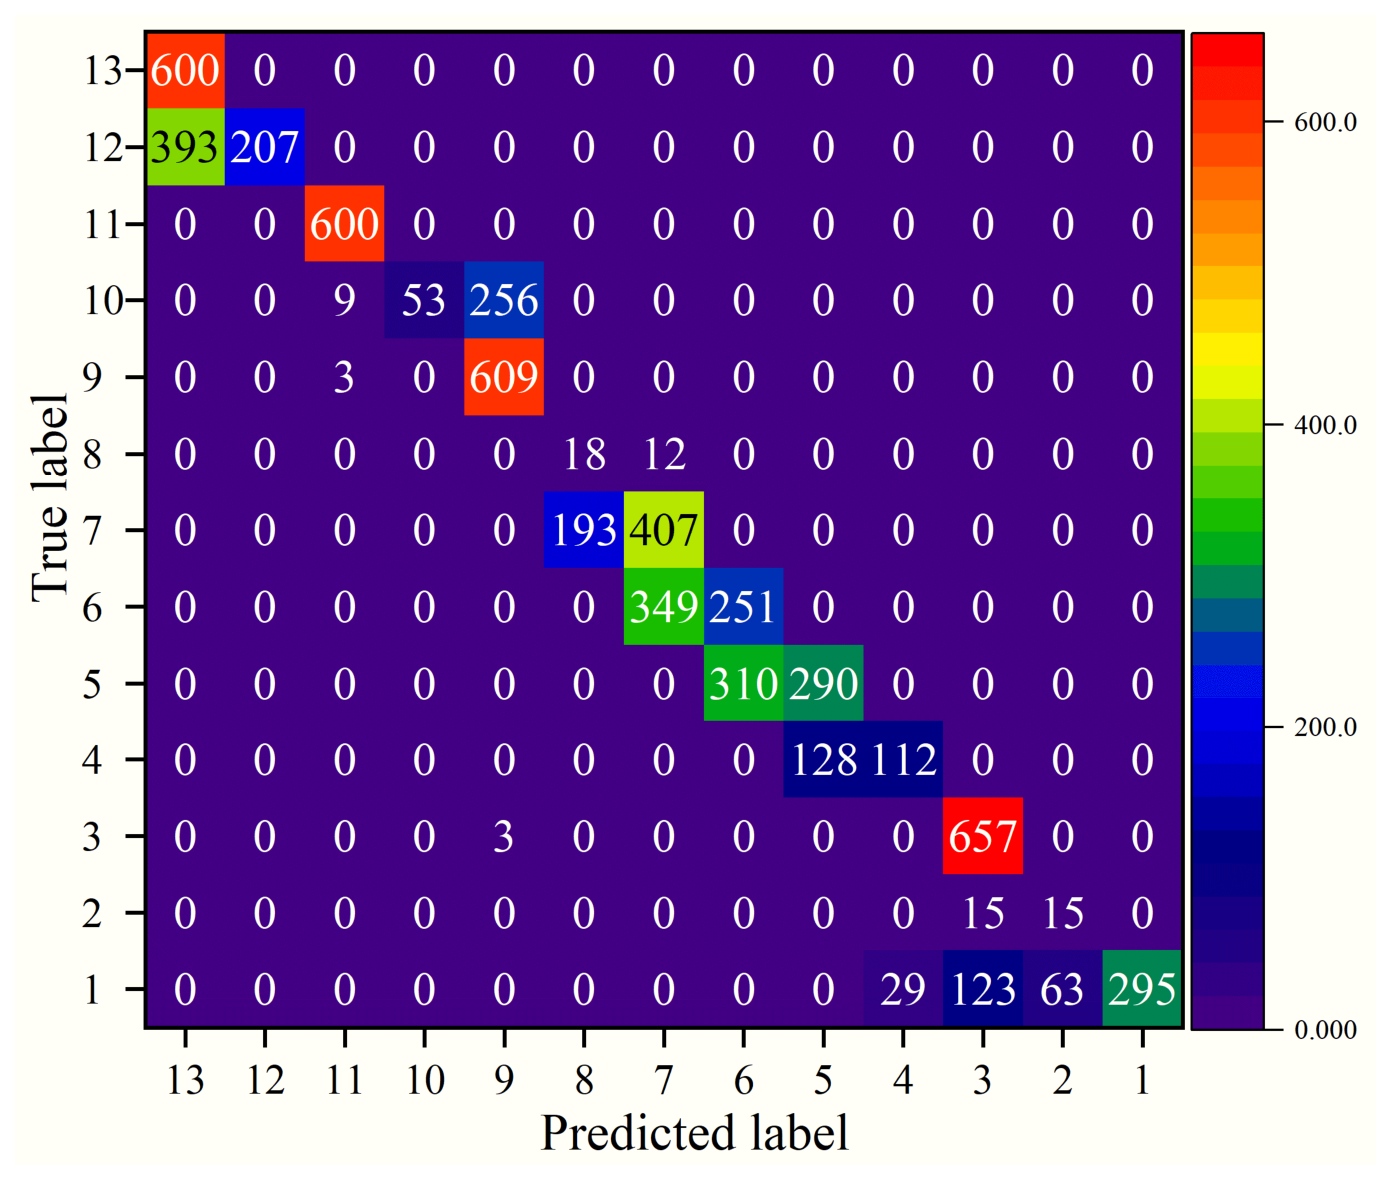
Figure 7 shows the confusion matrix of Random Forest under strict block-split validation. Compared with the confusion matrix of the PMSM dataset, the MOTOR dataset exhibits more obvious class confusion under strict validation, and several labels are frequently misclassified. This indicates that when test samples come from later time segments within each class, the model’s discriminative ability decreases for some classes. The decrease in Macro-F1 is larger than that in Accuracy, suggesting that the model can still correctly identify some classes with large sample sizes, but its precision and recall are insufficient for several difficult classes.
This performance gap is one of the most important findings of this study. Random splitting is more suitable for evaluating classification ability under mixed same-distribution windows, whereas strict block splitting is closer to cross-time-segment validation and can reveal the generalization pressure of models on continuous signals. For long-term operating equipment such as elevator traction drive systems, models are more likely to encounter new signal segments generated during subsequent operation rather than randomly shuffled historical segments. Therefore, although strict block-split validation produces lower scores, it is more informative for engineering applications.
Table 9 reports the per-class F1 scores and bootstrap-based 95% confidence intervals of Random Forest under strict block-split validation. The results show considerable differences among classes, with lower and less stable performance for Labels 2, 8, and 10.
The bootstrap-based 95% confidence intervals for Accuracy, Macro-F1, and MCC were 0.6747–0.6973, 0.5715–0.5993, and 0.6476–0.6712, respectively.
5.4. Comparison Between Time-Domain Features and Frequency-Domain Extended Features
Table 10 shows the results after adding frequency-domain extended features under strict block-split validation. Random Forest remained the best-performing model under the frequency-domain extended feature setting, but its Accuracy, Macro-F1, and MCC were 0.6103, 0.5226, and 0.5753, respectively, which were lower than the corresponding values obtained using only time-domain features, namely 0.6857, 0.5856, and 0.6591. Other models also did not show stable improvement.
These results indicate that, for the MOTOR dataset and the current feature construction scheme, simply adding frequency-domain extended features does not improve generalization performance under strict validation. The absence of improvement does not necessarily mean that frequency-domain features are ineffective. Instead, it may be related to the window length, fixed frequency-band settings, and increased feature dimensionality. Some frequency-domain features may be sensitive to local signal segments and may fail to form more stable class boundaries under strict block-split testing.
Therefore, the subsequent analysis of the MOTOR dataset is based mainly on time-domain features. This result also suggests that increasing the number of features does not necessarily improve engineering generalization. For continuous motor signals, feature stability may be more important than feature complexity. If frequency-domain information is further used in future work, more targeted frequency-band selection, feature screening, or representation construction should be considered based on fault mechanisms rather than simply expanding the feature dimension.
5.5. Modality Ablation Experiment
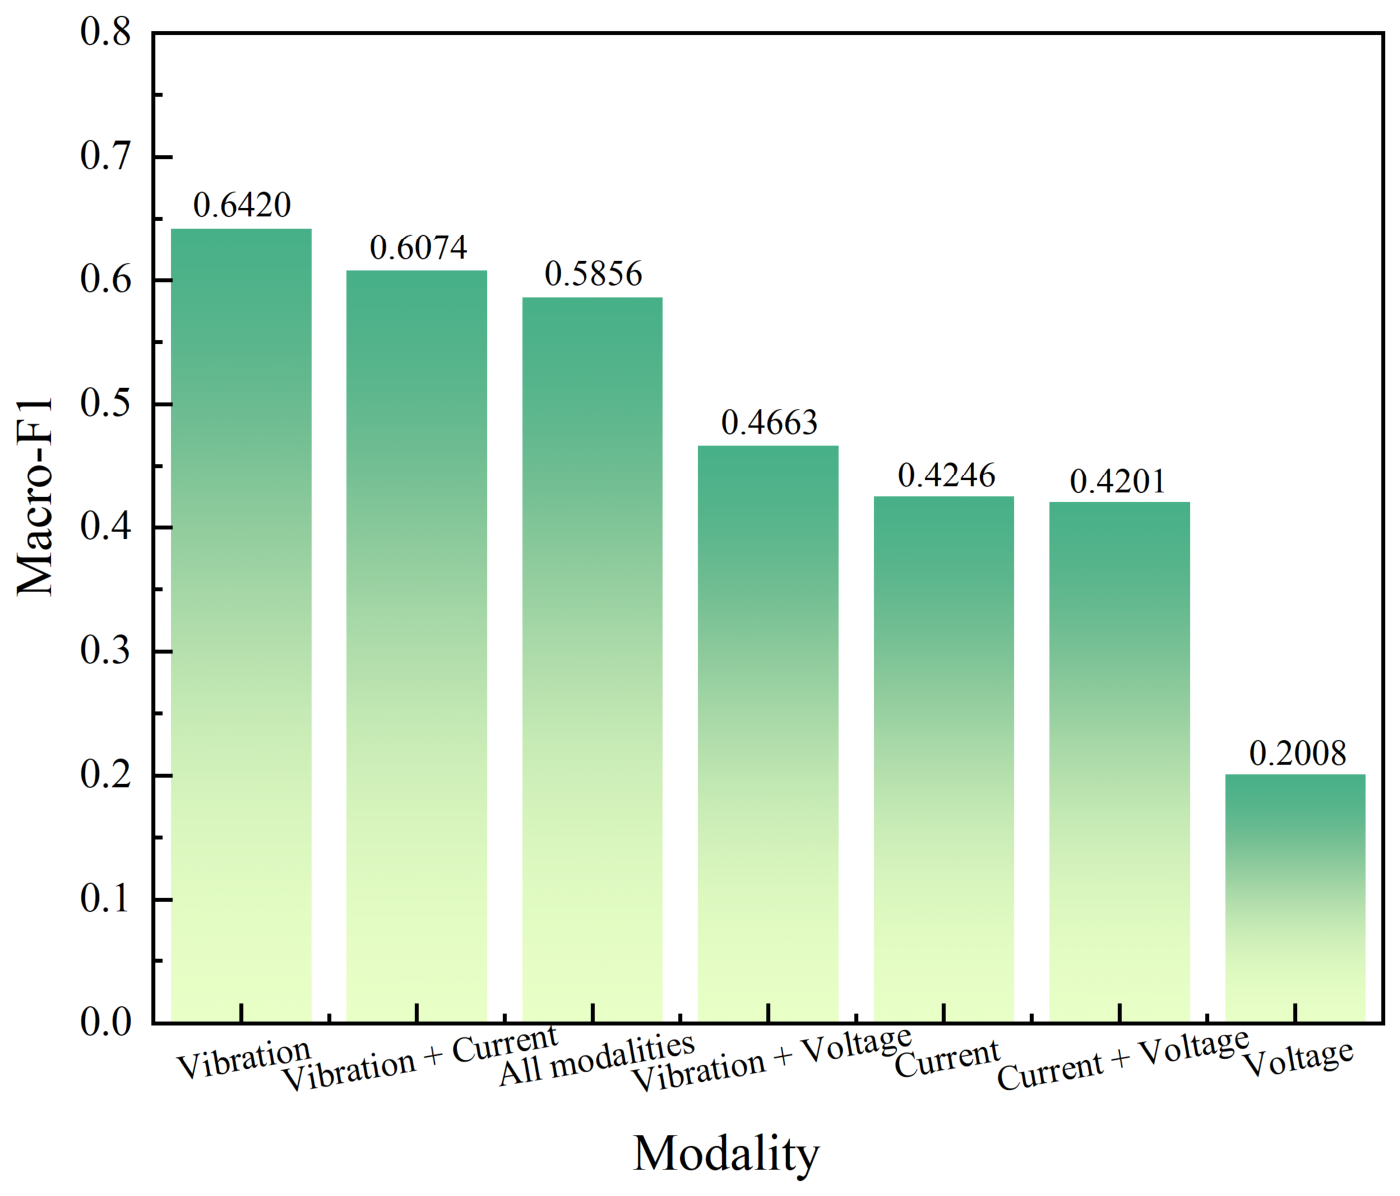
Table 11 shows the modality ablation results on the MOTOR dataset under strict block-split validation. When only vibration features were used, Random Forest achieved the best performance, with an Accuracy of 0.7285, a Macro-F1 of 0.6420, and an MCC of 0.7031. These values were higher than those obtained using all modalities, where the Accuracy, Macro-F1, and MCC were 0.6857, 0.5856, and 0.6591, respectively. The combination of vibration and current ranked second, with a Macro-F1 of 0.6074. The current-only, voltage-only, and current-plus-voltage settings performed much worse than the vibration-related combinations.
Figure 8 compares the Macro-F1 scores of different modality combinations. Under strict block-split validation, vibration is the most contributive modality in the MOTOR dataset. In contrast, current and voltage alone show limited classification ability, and the voltage-only setting has the lowest Macro-F1 of 0.2008. Under the tested Random Forest setting, simple feature-level concatenation of all modalities did not outperform the vibration-only modality.
These results indicate that, under the tested Random Forest setting, simple feature-level concatenation did not improve performance over the vibration-only modality. In the MOTOR dataset, vibration features provide the most direct class-discriminative information. Although current and voltage features also contain certain fault-related information, simple concatenation does not improve performance under strict block-split validation. A possible reason is that the stability and discriminative capability of different modalities are not consistent. Weakly relevant or noisy features may interfere with the selection of the main discriminative features by the tree-based model. Previous studies on multisignal motor fault diagnosis have also shown that vibration, current, and voltage signals can provide complementary information, but their effectiveness depends on fault type, signal quality, and fusion strategy [
23,
27,
30].
For elevator traction drive systems, multisensor acquisition remains valuable, but the fusion strategy should be carefully designed. Vibration, current, voltage, and temperature signals should be selected according to fault type, installation condition, and signal quality, rather than assuming that more sensors always lead to better diagnosis. In long-term operating scenarios, if a modality is strongly affected by noise, installation position, or operating-condition fluctuation, simple feature concatenation may reduce model stability.
5.6. Feature-Level Noise Robustness Analysis
Since the vibration-only modality performed best under strict block-split validation, its stability under noise disturbance was further analyzed.
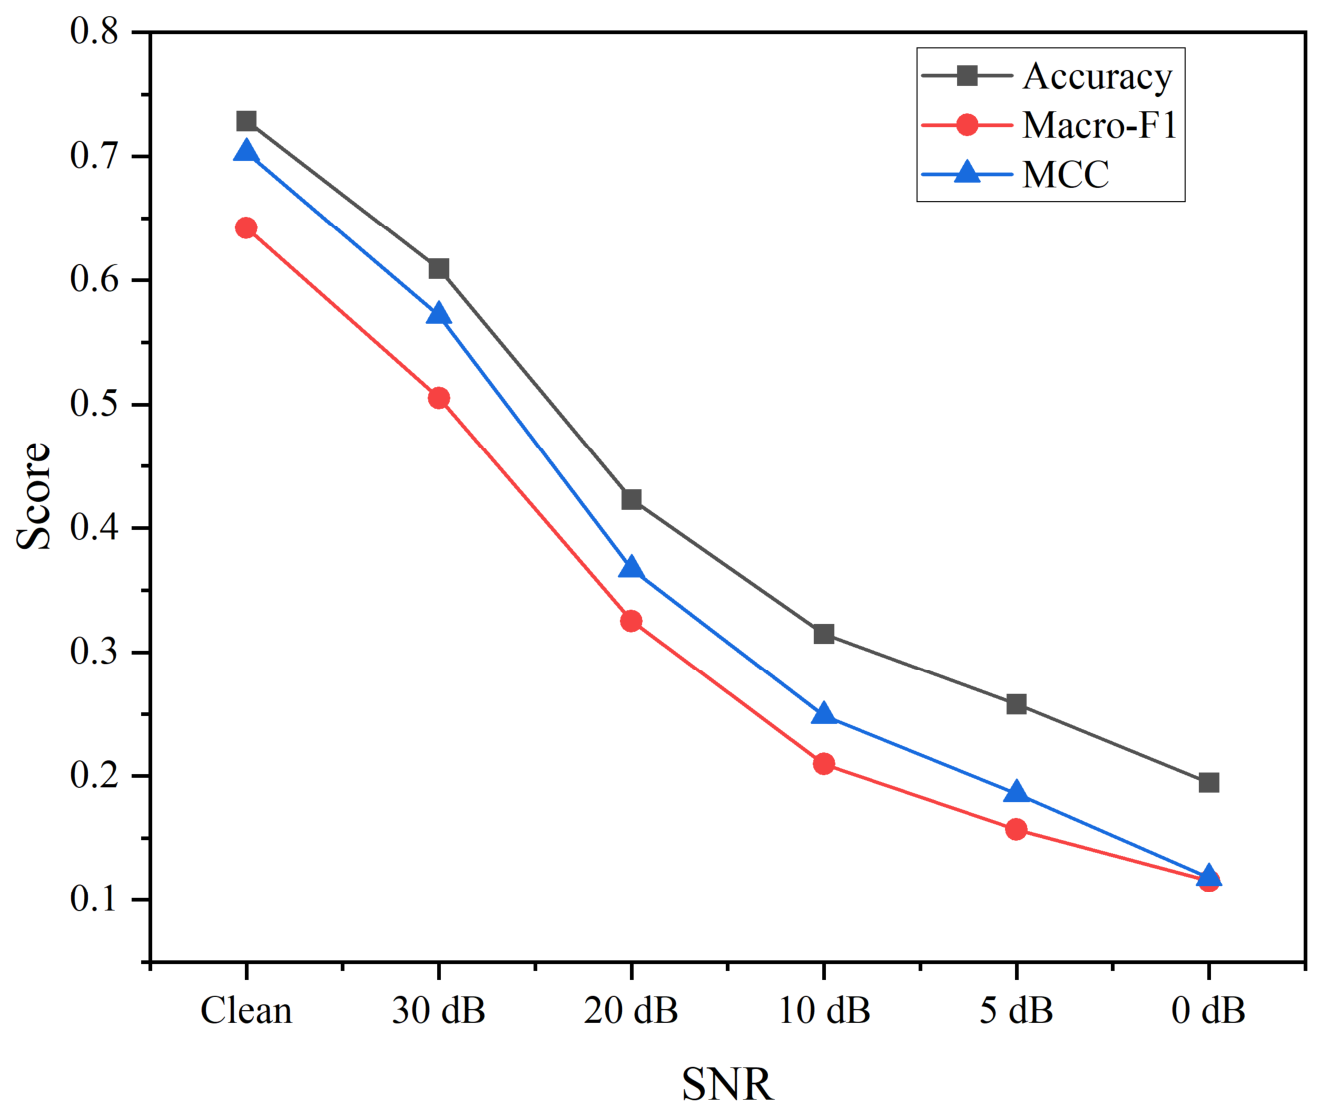
Table 12 presents the results under different signal-to-noise ratio levels. Under the clean condition, the model achieved an Accuracy of 0.7285, a Macro-F1 of 0.6420, and an MCC of 0.7031. When the SNR was 30 dB, the Macro-F1 decreased to 0.5052. When the SNR was further reduced to 20 dB, the Macro-F1 decreased to 0.3252. Under the 10 dB, 5 dB, and 0 dB conditions, model performance continued to decline.
Figure 9 shows the performance trend of the model as noise increases. Although the vibration-only model performs best under the clean test condition, it is sensitive to noise disturbance. As the SNR decreases, Accuracy, Macro-F1, and MCC all decline markedly. Macro-F1 decreases more rapidly, suggesting that noise has a stronger effect on minority or difficult-to-classify classes.
The noise experiment further reveals the limitation of the vibration-only modality. Vibration signals are sensitive to mechanical state changes, but they are also easily affected by sensor installation, structural transmission paths, and environmental disturbances. For elevator traction systems, if the vibration sensor is installed unstably, or if background vibration is introduced by guide rails, the machine room, the traction sheave, or car operation, the model performance may be lower than that observed under the clean experimental condition. Therefore, before deploying vibration-based diagnostic models in the field, denoising, sensor fixation, robust feature extraction, and multisource signal cross-validation should be considered. Actual elevator sites may also contain impulsive interference from electromagnetic switching, narrow-band vibration caused by mechanical resonance, and low-frequency drift caused by sensors. These disturbances may respectively produce abrupt feature changes, persistent frequency-specific deviations, and slow baseline shifts, and their effects may differ from those of Gaussian noise. Related studies also indicate that sensor type, acquisition condition, and operating environment can affect the reliability of induction motor condition monitoring models [
36,
37].
Because the noise was introduced after feature extraction, these results should be interpreted as feature-level perturbation robustness rather than direct sensor-noise robustness. Adding noise to the raw signals before feature extraction will be considered in future work.
5.7. Feature Importance and Interpretability Analysis
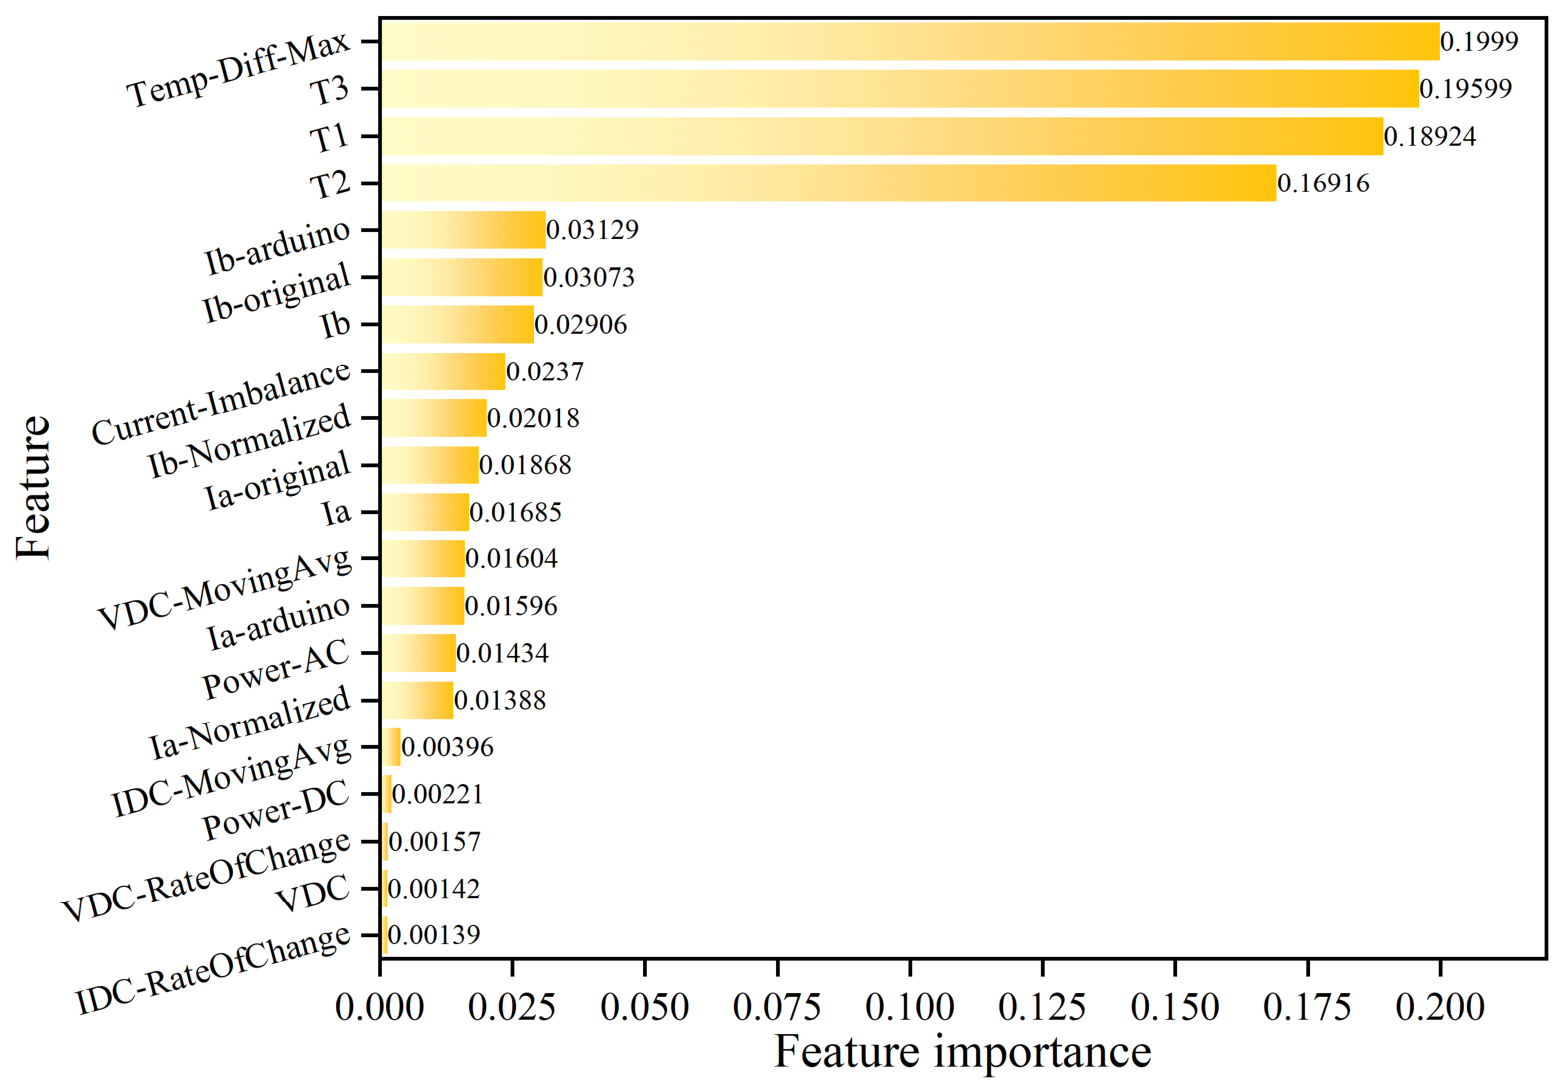
Figure 10 shows the feature importance ranking of Random Forest on the PMSM dataset. Temp_Diff_Max, T3, T1, and T2, which are temperature-related features, rank at the top and show considerably higher importance than most current and voltage features. They are followed by Ib, Ia, current imbalance, voltage moving average, and power-related features.
The PMSM classification results rely strongly on temperature difference and power-device temperature features. This is related to the overheating fault classes included in the dataset. For inverter-drive systems, power-device overheating, uneven bridge-arm temperature rise, and temperature-difference variations can directly reflect thermal abnormalities. Therefore, it is reasonable that temperature features have high importance in classification. Previous studies on motor temperature prediction and temperature estimation have also shown that temperature-related variables are important for drive-system thermal condition monitoring and early abnormality identification [
39,
40,
41]. Although current and voltage features have lower importance than temperature features, they still appear among the top 20 features, indicating that electrical signals also contribute to the identification of open-circuit faults, short-circuit faults, and operating states.
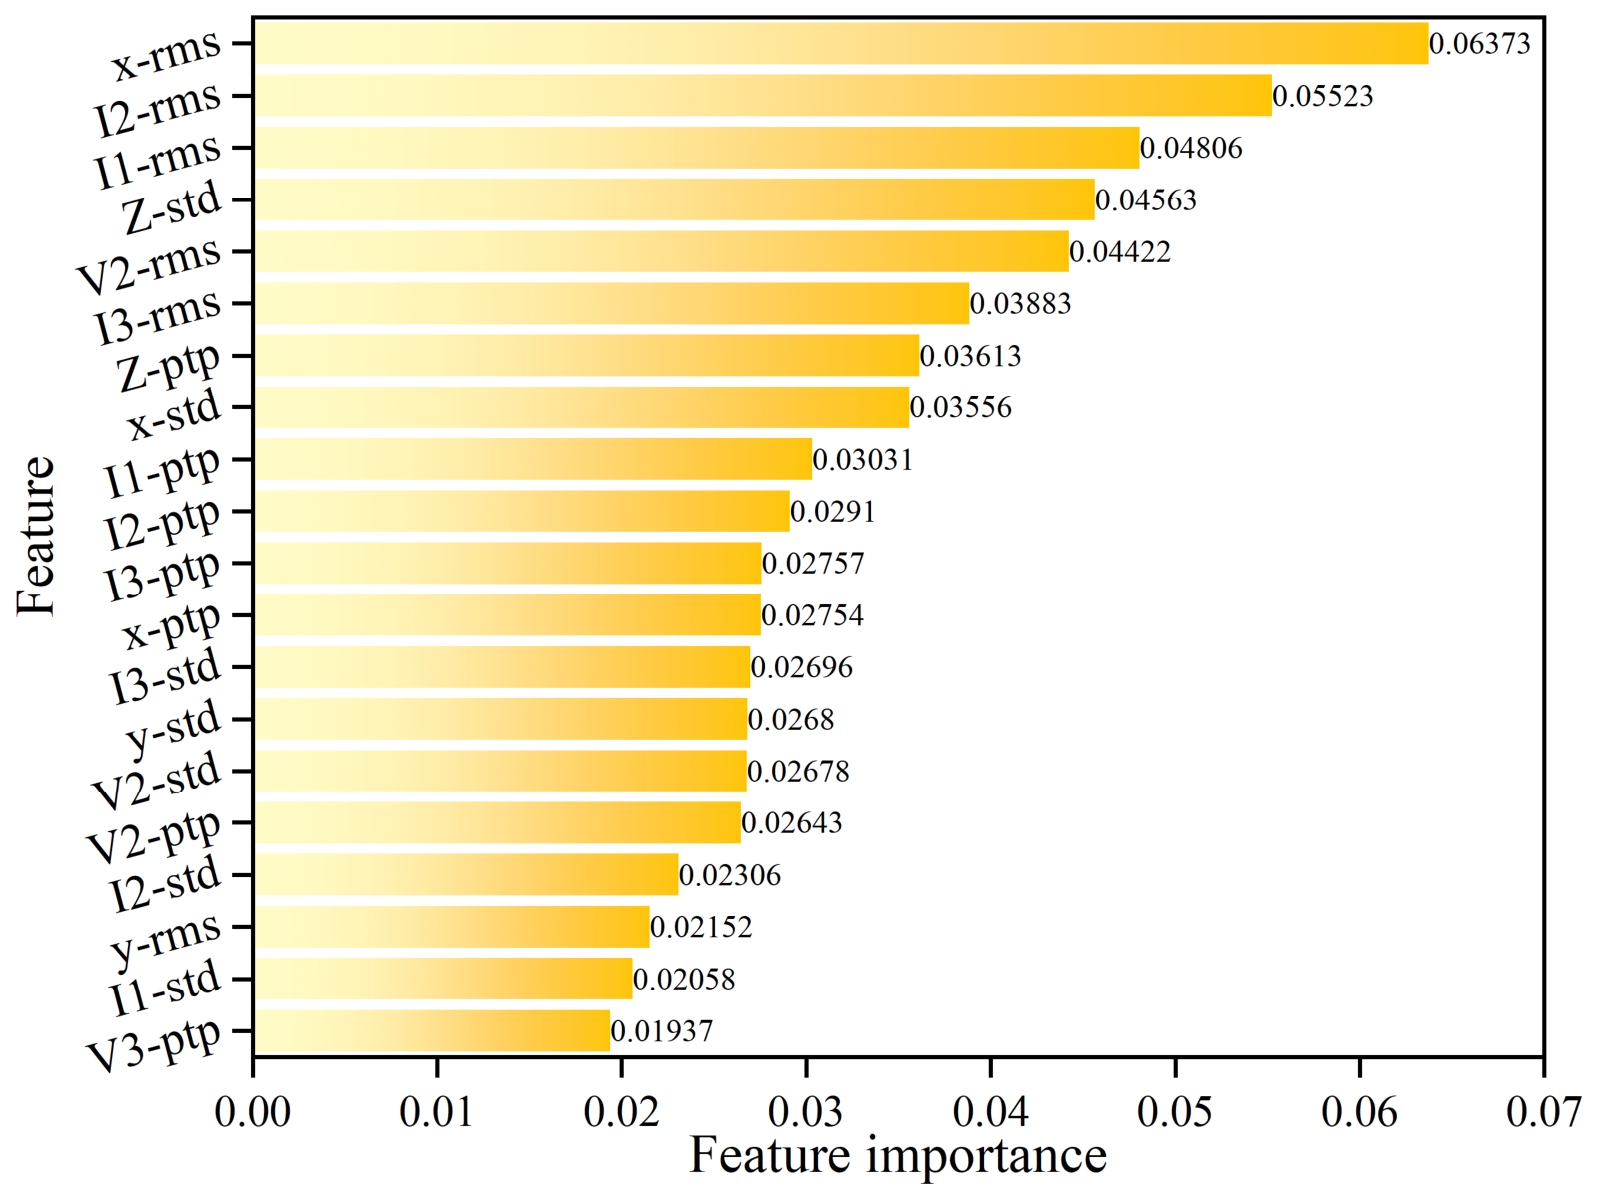
Figure 11 shows the feature importance ranking of Random Forest on the independent secondary MOTOR dataset. Unlike the PMSM dataset, the most important features in the MOTOR dataset mainly include vibration RMS, standard deviation, peak-to-peak value, and several current and voltage statistical features. In particular, x-rms, I2-rms, I1-rms, Z-std, V2-rms, and I3-rms show relatively high importance.
The feature importance results on the MOTOR dataset are generally consistent with the modality ablation results. Vibration features account for a large proportion of the top-ranked features, indicating that the model mainly relies on vibration amplitude and fluctuation-related features for classification under strict block-split validation. Meanwhile, several current and voltage RMS features also make certain contributions, suggesting that the electrical modalities are not completely ineffective. However, under simple feature concatenation, they do not provide an overall advantage over the vibration-only modality.
It should be noted that Random Forest feature importance only reflects the model’s dependence on variables under the current dataset and splitting strategy, and should not be directly interpreted as the causal contribution of fault mechanisms. Therefore, feature importance is used here as an auxiliary interpretability tool rather than as a mechanism-level conclusion. Combining the modality ablation and noise robustness results shows that vibration amplitude and fluctuation features are most useful for classification in the MOTOR dataset, but they are also more sensitive to disturbance. In the PMSM dataset, temperature-related features dominate the importance ranking, indicating that overheating-related faults contribute strongly to model discrimination. However, in real elevator systems, such features require reliable temperature measurement conditions. Feature importance and interpretability analysis can help identify the basis of model discrimination, but they should still be interpreted together with fault mechanisms and field validation [
18,
35].
5.8. Engineering Implications and Limitations for Elevator Traction Drive Systems
Table 13 summarizes the main experimental results of this study. Overall, the PMSM dataset achieves high classification performance under random splitting, indicating that drive-side electrical and thermal features can effectively distinguish open-circuit, short-circuit, and overheating faults. The MOTOR dataset also achieves high performance under random splitting, but its performance decreases substantially under strict block-split validation, indicating that diagnostic results for continuous windowed data are sensitive to the validation protocol. The modality ablation results further show that the vibration-only modality performs best under strict validation, whereas the noise experiment indicates that this modality, although discriminative, is also sensitive to disturbance.
For elevator traction drive systems, these results provide three main implications. First, drive-side diagnosis should pay attention to temperature and temperature-difference information. Current and voltage signals alone may be insufficient to fully characterize power-device overheating faults. Second, vibration signals are valuable for motor-side diagnosis, but their effectiveness depends on sensor installation and field noise conditions. Third, model evaluation should not rely only on random window splitting. For continuously operating equipment, cross-time-segment or block-based validation can better reflect model stability in practical monitoring scenarios.
This study also has several limitations. Both datasets used in this study are public motor-drive-related datasets rather than real elevator field data, and therefore the experimental results cannot directly represent field deployment performance. The label systems of the PMSM and MOTOR datasets are also different, and this study does not perform cross-dataset label alignment or transfer learning. In addition, this study uses traditional machine learning models and handcrafted features, without further considering deep temporal models, domain adaptation, or sensor-reliability-aware fusion strategies. Future work should focus on collecting and openly releasing an elevator traction-system dataset with synchronized electrical, thermal, vibration, and operating-condition information, and using it to validate the proposed evaluation framework under real operating conditions.
6. Conclusions
This study addressed the fault diagnosis needs of elevator traction drive systems by conducting a validation study based on a PMSM inverter-drive fault diagnosis dataset and a MOTOR fault detection dataset. Rather than proposing a complex model architecture, this study focused on analyzing how different data sources, validation protocols, signal modalities, and noise conditions affect diagnostic results. The main conclusions are as follows:
(1) The PMSM dataset showed high diagnosability under stratified random splitting. All five baseline models achieved good classification performance, among which Random Forest performed best, with an Accuracy of 0.9927, a Macro-F1 of 0.9901, and an MCC of 0.9907. Feature importance analysis showed that temperature-related features, including Temp_Diff_Max, T3, T1, and T2, contributed strongly to the classification results. This indicates that temperature and temperature-difference features are important for identifying overheating faults in inverter-drive systems, while current, voltage, and current-imbalance features also contribute to the identification of open-circuit faults, short-circuit faults, and operating states.
(2) The independent secondary MOTOR dataset also achieved high performance under random window splitting, but its performance decreased markedly under strict block-split validation. For Random Forest, the Accuracy, Macro-F1, and MCC were 0.9922, 0.9682, and 0.9914 under random splitting, but decreased to 0.6857, 0.5856, and 0.6591 under strict block splitting, respectively. This difference indicates that, for continuously sampled signals, random window splitting may assign adjacent or similar segments to both the training and test sets, thereby overestimating model performance. In contrast, block splitting better reflects the generalization pressure faced by the model on later time segments.
(3) Under strict block-split validation, simply adding frequency-domain extended features did not improve model performance. When frequency-domain extended features were used, Random Forest achieved an Accuracy of 0.6103, a Macro-F1 of 0.5226, and an MCC of 0.5753, which were lower than the results obtained using only time-domain statistical features. This suggests that, under the current window length and frequency-band settings, the frequency-domain extended features did not form more stable class boundaries. For continuous motor signals, increasing the number of features does not necessarily improve engineering generalization. Future use of frequency-domain information should involve more targeted band selection, feature screening, or representation construction based on fault mechanisms.
(4) The modality ablation results showed that vibration was the most contributive modality in the MOTOR dataset. Using vibration features alone, Random Forest achieved an Accuracy of 0.7285, a Macro-F1 of 0.6420, and an MCC of 0.7031 under strict block-split validation, outperforming the all-modality concatenation setting. Although current and voltage signals contain certain fault-related information, directly concatenating all modalities did not improve performance. This indicates that, under the tested Random Forest setting, simple feature-level concatenation did not outperform the vibration-only modality. Signal modalities in elevator traction drive systems should therefore be selected according to fault type, acquisition condition, and signal quality.
(5) The feature-level perturbation experiment showed that the vibration-only model, although effective under clean test conditions, was sensitive to Gaussian perturbations in the extracted features. From the clean condition to the 0 dB condition, the Macro-F1 decreased from 0.6420 to 0.1155, and the MCC decreased from 0.7031 to 0.1183. These results indicate that the classifier is sensitive to disturbances in the extracted vibration features. They should not be interpreted as direct sensor-noise results because the perturbations were introduced after feature extraction.
Overall, this study provides a reproducible evaluation framework for identifying the effects of validation protocols, modality selection, and noise disturbance before the field deployment of diagnostic models for elevator traction systems. The results show that random window splitting, modality selection, and noise disturbance can substantially affect diagnostic performance assessment. Future work should incorporate real operating data from elevator traction systems and further validate the models under cross-condition, cross-device, and long-term operating scenarios. Sensor-reliability-aware multimodal fusion and robust diagnostic methods should also be further investigated.