Article

An Improved Mesh Stiffness Model for Cracked Spur Gears Considering Tooth Surface Contact Characteristics

1
School of Mechanical Engineering & Automation, Northeastern University, Shenyang 110819, China
2
Key Laboratory of Vibration and Control of Aero-Propulsion Systems Ministry of Education of China, Northeastern University, Shenyang 110819, China
*
Authors to whom correspondence should be addressed.
Machines 2026, 14(7), 759; https://doi.org/10.3390/machines14070759 (registering DOI)
Submission received: 7 June 2026 / Revised: 28 June 2026 / Accepted: 29 June 2026 / Published: 6 July 2026
(This article belongs to the Section Machine Design and Theory)

Abstract

Tooth crack, as a typical fault, directly affects the meshing characteristics of gears, which causes abnormal vibration and noise during the gear meshing process, with some even threatening the operational safety of the mechanical device. Meanwhile, the mapping relation between the tooth crack and the actual meshing characteristics is still unclear under the tooth surface morphology and lubrication properties. Aiming at this issue, an integrated time-varying meshing stiffness (I-TVMS) model with cracks is proposed under the complex and variable working conditions. Based on the potential energy method, the analytical expressions with cracks are derived and calculated, and, then, the variation laws of I-TVMS under different crack parameters, tooth surface morphology, and structural and excitation parameters are investigated. Combined with the healthy tooth, the crack increases the contact load on the tooth surface, and reduces the oil film thickness, which decreases the I-TVMS of the cracked tooth. The greater the crack depth and torque is, the smaller the oil film thickness, and the weaker the I-TVMS fluctuation will be. The influence of the crack angle depends on the crack type and meshing region. The tooth-root crack is more sensitive in the single-tooth region, whereas the tooth surface crack shows a larger change only in the double-tooth mean value. When the crack location transitions from the tooth root to the tooth top, the stiffness attenuation gradually weakens.

1. Introduction

Gears, as critical movement and power transmission systems, are widely applied to the aerospace, wind power, ship, rail traffic, and other engineering fields. However, due to material defects, machining or installation errors, or a complex and changeable working environment, the gear system often suffers from poor lubrication, and abnormal vibration and noise, which cause various gear surface defects, including cracks, spalling, pitting, and wear, and further influence the kinetic behavior of the gear system by affecting the TVMS of the meshing teeth. Among various types of gear faults, the influence of cracks on the meshing stiffness is the most significant [1,2], which directly reduces the meshing stiffness value. Hence, to analyze the influence of cracks on the meshing features, more and more scholars have modeled and analyzed tooth crack, which not only reveals the crack damage mechanism and vibration behavior, but also provides a theoretical basis for the fault diagnosis and condition monitoring of the gear transmission system.
In recent years, the gear meshing stiffness was widely explored with different approaches by domestic and foreign scholars, including the experimental method, potential energy method, finite element method, and analytical-finite element method. Ma and his team members [3,4] conducted extensive research on the gear meshing stiffness and proposed a variety of calculation approaches. During the gear meshing process, the TVMS is affected by lubrication, friction, the tooth surface morphology, and so on. Zhou et al. [5] presented a novel stiffness-damping model with an oil film, and the integrated meshing characteristic was researched, whereafter a new stiffness model under mixed elastohydrodynamic lubrication (EHL) was put forward, taking into account the asperity contact stiffness and oil film stiffness [6]. Considering EHL contact, Tian et al. [7] proposed an approach for calculating the TVMS, and the influences of the speed, torque, and asperity were analyzed. Combining the asperity contact stiffness and oil film stiffness, Xiao et al. [8,9] revised the computational method of the TVMS, which was researched by the key system parameters. Based on the mixed EHL model and the rough surface, Chen et al. [10] constructed a novel gear meshing stiffness model. According to the TEHL and Blok theory, Zhou et al. [11] proposed a comprehensive TVMS model considering the thermal stiffness, oil film stiffness, and tooth stiffness. Based on the effects of the axial misalignment, lead crown relief, and temperature, Hu et al. [12] designed a synthetical TVMS of the spur gear, and the impact mechanism of the temperature, modification amounts, and misalignment were analyzed. Chen et al. [13] established a comprehensive TVMS model and revealed the mechanism of action between the tooth deviation and gear structure.
During the process of gear meshing, the meshing teeth are subjected to greater bending stress, and a large number of cracks occur at the tooth root zone. However, when a larger contact stress and more intense meshing impact occur on the tooth, the crack can also appear on the tooth surface, which is displayed in Figure 1. Since the crack fault has the most significant impact on the meshing stiffness, tooth crack has gradually attracted scholars. In the process of research, the research mainly focuses on different types of cracks and crack propagation paths that occur on the gear body, tooth surface, or tooth root. Chaari et al. [14] developed a tooth crack model, and the reduction in the TVMS was quantified. Based on the improved healthy meshing stiffness calculation model, Ma et al. [15] presented three cracked meshing stiffness models, considering different degrees of cracks. Wan et al. [16] built a 2D finite element spur gear model with an initial crack, and the tooth root crack propagation path was analyzed. The computational formula of the gear meshing stiffness with a spatial crack was derived by Yu et al. [17], and the influences of key parameters on the TVMS were investigated. Wang et al. [18,19] presented an analytical-FE model for calculating the time-varying mesh stiffness, which was researched with different crack propagation paths. Yang et al. [20] put forward a novel approach for calculating the tooth fillet foundation stiffness of the cracked tooth, which could accurately obtain the TVMS of the cracked tooth. Verma et al. [21] applied the extended-FEM to study the TVMS and crack propagation behavior of the tooth, and investigated the influence of the rim thickness on the tooth crack propagation path. Considering the crack nucleation and propagation stages, Li et al. [22] proposed a rolling contact fatigue model for lubricated gear contacts of rough surfaces. Taking into account the interaction between the neighboring teeth, Ning et al. [23] presented an improved method for the spur gear MS, which could calculate the MS with the tooth root crack. Liu et al. [24] established the MS model of the opening-crack tooth with elastoplastic deflection, and the mesh stiffness of the gear with crack failure was estimated. He et al. [25] used FE analysis and experimental testing to research the propagation path of the tooth root crack, which demonstrated the crack position and length had little effect on the tooth root crack path. Yang et al. [26] proposed an improved TVMS approach considering the crack position, and the effects of the crack position and depth were analyzed.
Figure 1 is used to illustrate two typical crack forms considered in this work, namely, tooth root cracks and tooth surface cracks. The crack geometries used in the stiffness derivation are prefabricated analytical cracks rather than cracks obtained directly from fatigue tests; the crack depth, direction, and initial position are defined as prescribed geometric variables for the I-TVMS model.
TVMS is one of the main internal excitations, which directly affects the operational stability of the gear transmission system [27]. Mohammed et al. [28] investigated the mapping relation between the crack size and the mesh stiffness, which could be applied to detect the tooth crack quantificationally. Meng et al. [29] analyzed the dynamic response of the gear drive system with 10 different cracks. Mo et al. [30,31] built the gear dynamic model with cracks, and the effect mechanism of cracks on the TVMS and dynamic behavior were researched. Ning et al. [32] proposed a gear dynamics model considering the non-uniform crack by using the slice method, and the vibration features were analyzed. Based on the tooth root transition curve, Zhao et al. [33] analyzed the influences of different crack degrees on the tribo-dynamic behavior with the gear. Based on the improved TVMS and gear crack models, Mukherjee et al. [34] developed a coupled electromechanical model, which was evaluated under various crack depths. Liu et al. [35] designed a simplified crack path model to research the TVMS, and the crack parameter effect on the response was analyzed through simulation and experiment. Zhou et al. [36] put forward a novel dynamic model of gears combining with delayed meshing out due to root crack, and the effects of different crack depths and angles on the dynamic properties were investigated. Considering the actual crack propagation paths, Ma et al. [37] established a gear dynamic model with cracks, and put forward two novel evaluation indices to distinguish different stages of the crack. Liu et al. [38] developed a velocity-dependent TVMS calculation algorithm, and researched the effect of the crack on the velocity-dependent mesh stiffness and dynamics, which revealed the coupling effect of the crack tooth position and speed fluctuation.
The foregoing research has proposed many effective approaches for calculating and analyzing the healthy or faulty TVMS. However, it is noteworthy that the tooth crack mainly occurs during the service process, which is influenced by various dynamic factors such as lubrication, friction, tooth surface morphology, and torque. However, most of the current research is divorced from the actual working environment and inherent characteristics of the gear, and calculates the TVMS of the healthy/faulty tooth independently, which cannot truly reflect the impact of the crack fault on the meshing and vibration performances of the gears. Conversely, it is also impossible to reveal the influence mechanism on the meshing stiffness with cracks under dynamic factors. Moreover, most of the literature has focused on the effect of tooth root crack on the meshing features, while the influence of tooth surface crack has rarely been studied. Therefore, to obtain a more accurate crack stiffness calculation model and better reveal the influencing mechanism of the crack fault under dynamic conditions on the TVMS, an integrated TVMS calculation model with cracks is proposed considering the lubrication and tooth surface morphology, which can more accurately reveal the effect of cracks on the TVMS under a dynamic environment. Furthermore, the mapping relationship between the cracked level and the TVMS is achieved.
Compared with representative existing TVMS models, the proposed I-TVMS formulation treats tooth root cracks and tooth surface cracks within one framework, couples the crack-induced stiffness reduction with oil-film stiffness and asperity-contact stiffness, and consistently evaluates the crack geometry, tooth surface topography, torque, and module.
The organization of the research is presented as follows: Section 1 introduces the relevant study of the TVMS with or without tooth crack. And. then, the theoretical calculation model of the integrated TVMS with a cracked tooth is presented considering the lubrication and tooth surface morphology in Section 2. And the influences of the crack parameters, tooth surface topography, structure parameter, and excitation on the integrated TVMS are investigated in Section 3. Finally, Section 4 displays the main conclusions.

2. Integrated TVMS Calculation of Cracked Spur Gear

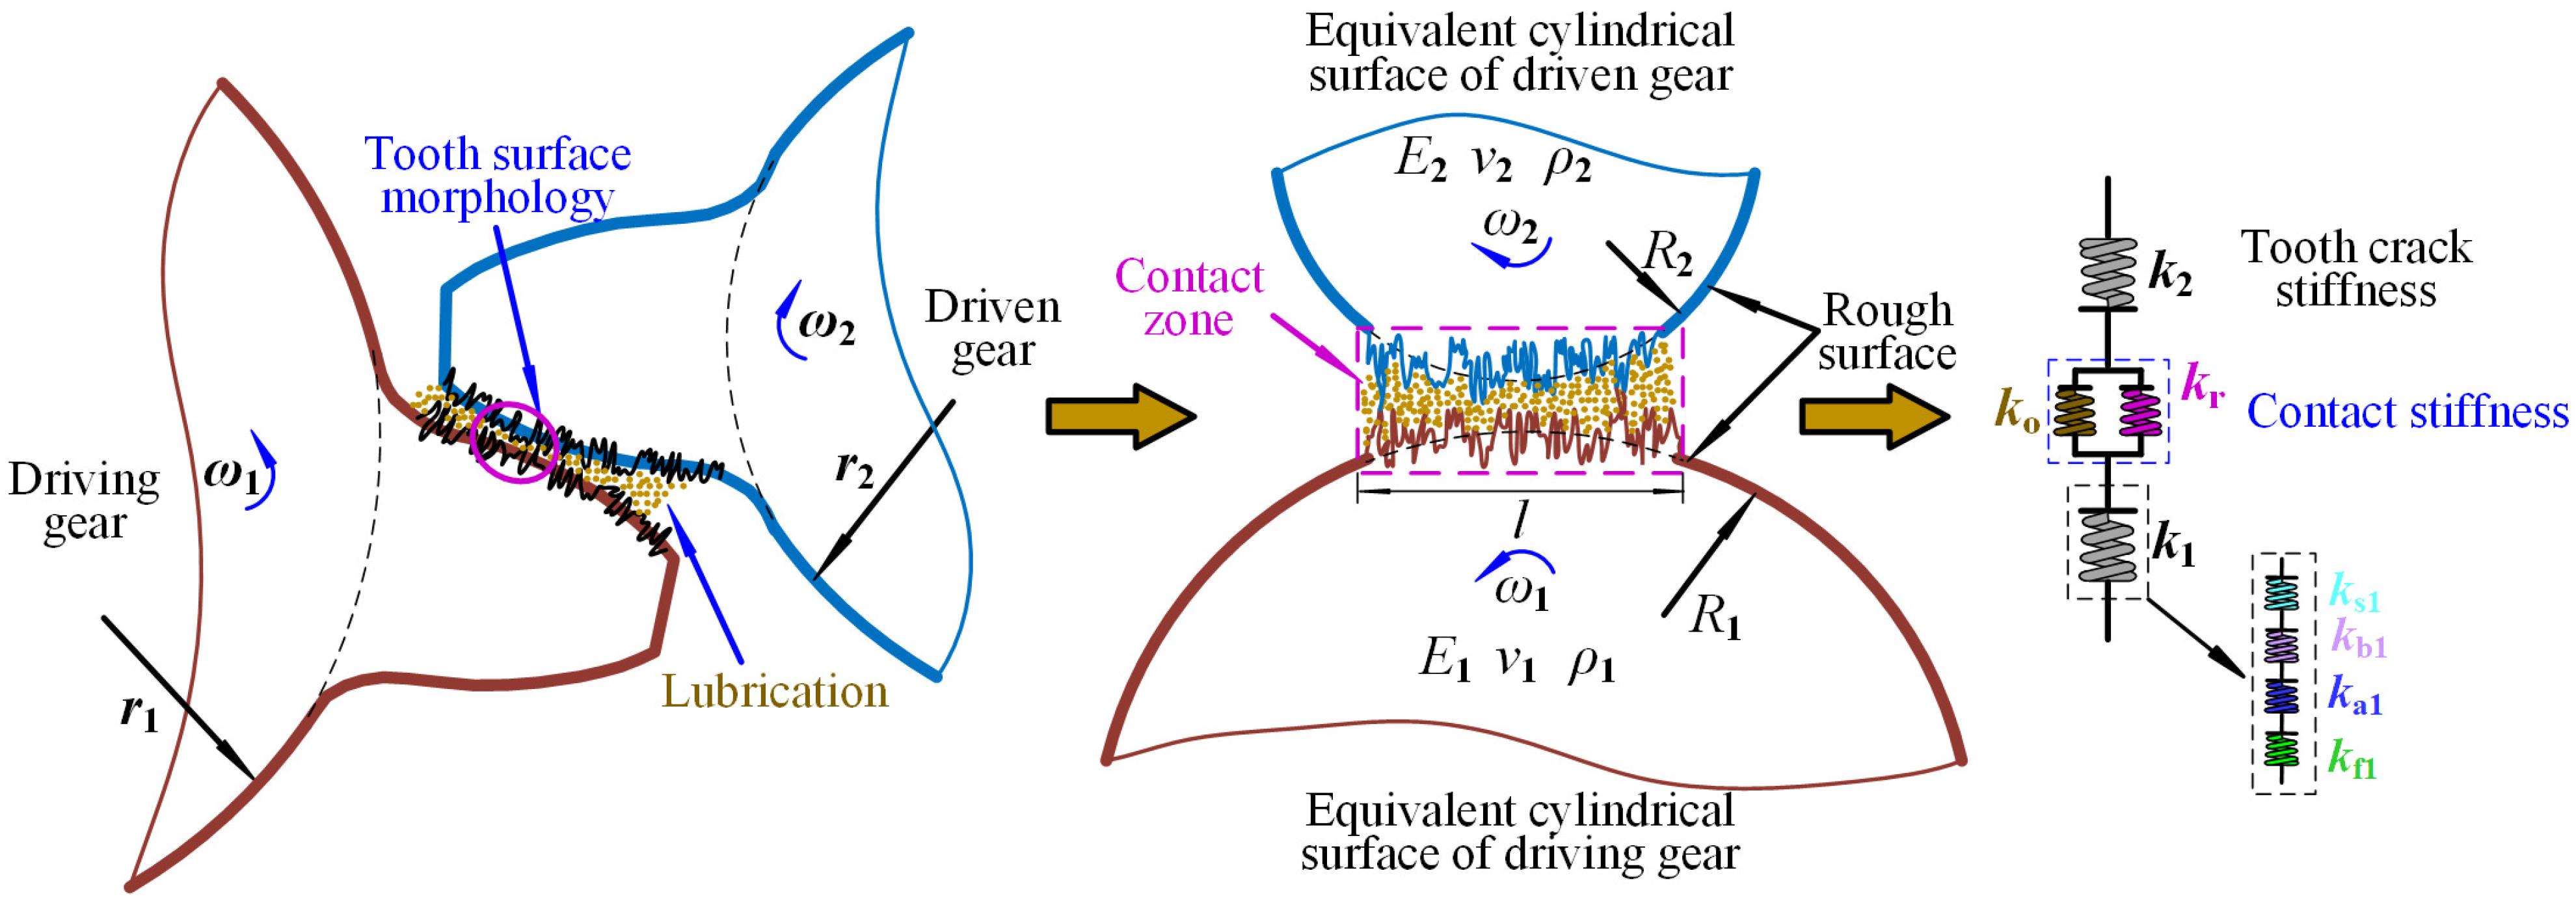
The I-TVMS has a time-varying characteristic which is directly influenced by the lubrication, friction, tooth surface topography, crack, and so on. To calculate the TVMS with cracks in the actual meshing process, the oil film stiffness and asperity contact stiffness are considered in the improved model. In Figure 2, the I-TVMS is composed of six parts, namely, the oil film stiffness, asperity contact stiffness, fillet-foundation stiffness, shear stiffness, tooth bending stiffness, and axial compressive stiffness [6].
Here, kl denotes the oil-film stiffness generated by the EHL pressure p, km denotes the asperity-contact stiffness related to the tooth surface morphology, and p represents the oil-film pressure solved from the Reynolds equation together with the film-thickness and load-balance equations.
The model is developed under the following assumptions: the meshing contact is simplified as the two-dimensional line contact; the crack is assumed to extend uniformly along the tooth face width; an open-crack condition is used; the tooth deformation is elastic; and the temperature variation, misalignment, frictional heating, and partial crack closure are not explicitly included in the current formulation.

2.1. Tooth Surface Morphology Characteristics

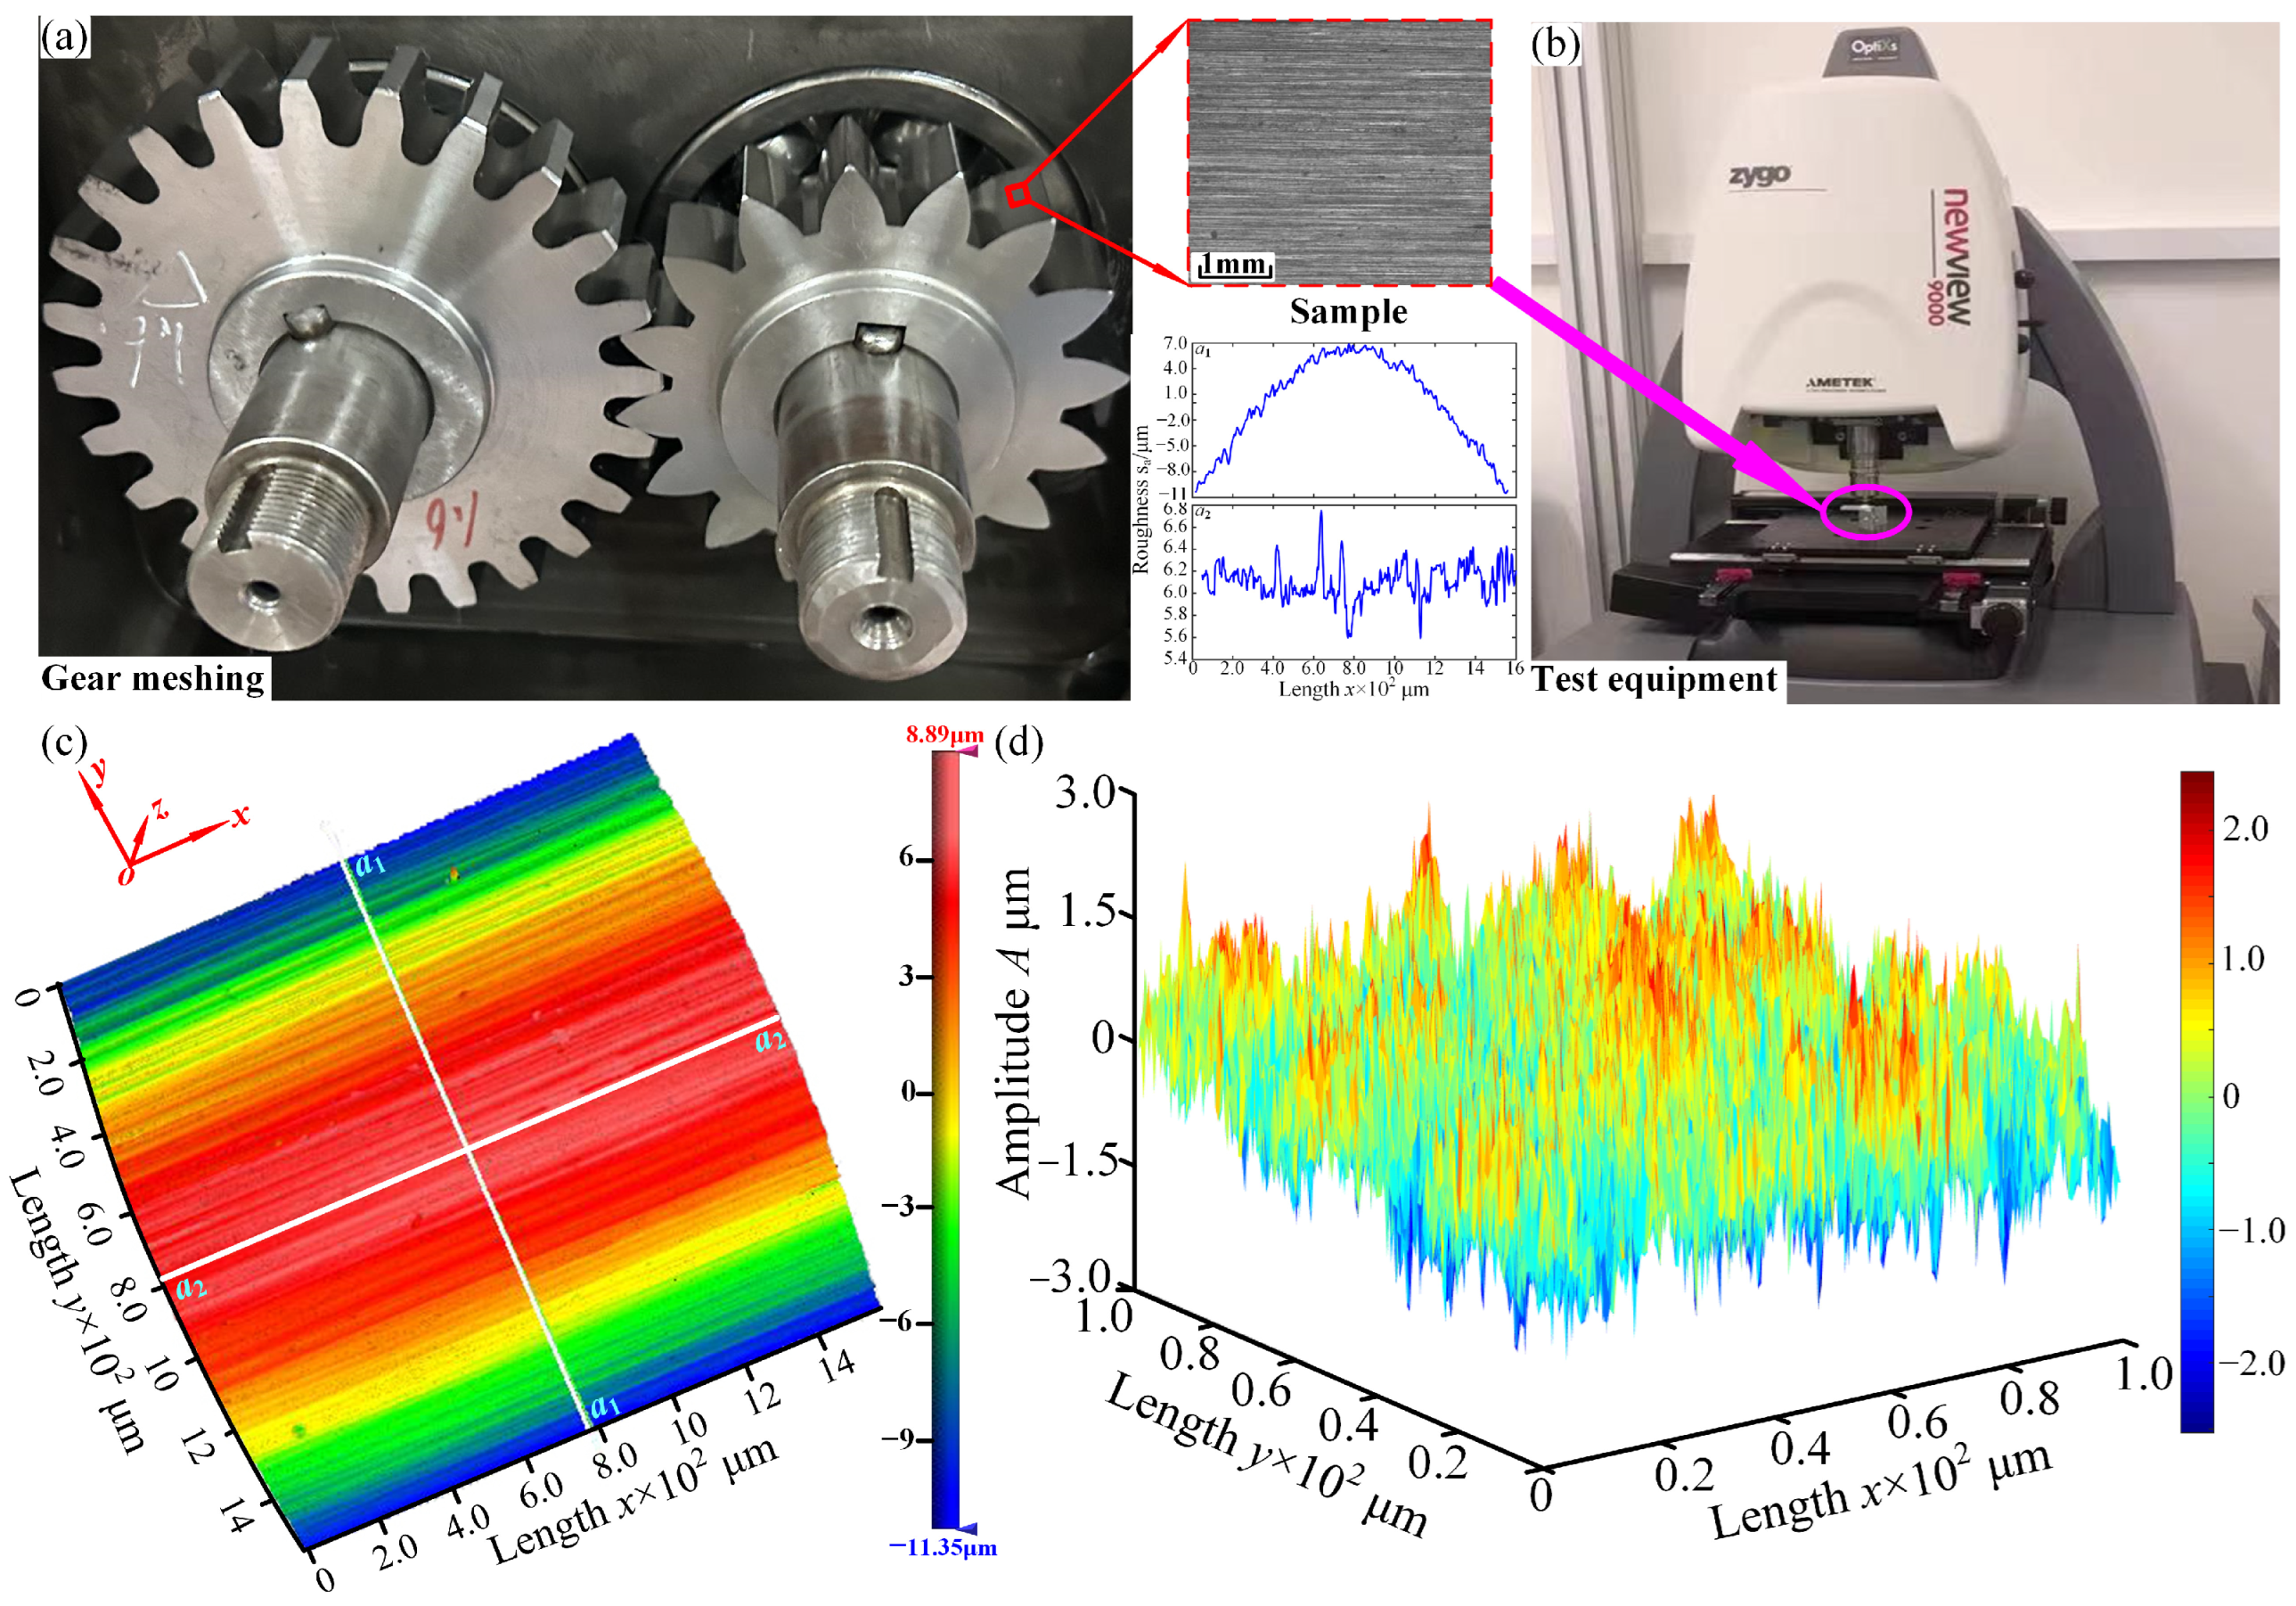
Due to the machining and post-processing of tooth surfaces (e.g., milling, grinding, and scraping surfaces), the tooth surface inevitably shows a non-smooth feature, which is measured by a Newview 9000 3D non-contact surface morphometer (Banshi Intelligent Technology (Shenzhen) Co., Ltd., Shenzhen, China), and the corresponding measurement results are displayed in Figure 3. It can be seen that the 3D tooth surface roughness topography presents fractal characteristics [39]. Therefore, the Weierstrass–Mandelbrot (W–M) fractal function will be applied to characterize the tooth surface fractal model. The W–M function of the 3D tooth surface morphology can be expressed as follows [40]:
W M ( x , y ) = L G L D 2 ln γ M 1 / 2 m = 1 M n = 0 n max γ ( D 3 ) n × cos ϕ m , n cos 2 π γ n ( x 2 + y 2 ) 1 / 2 L × cos tan 1 y x π m M + ϕ m , n
where L is the sampling length, and D indicates the fractal dimension of the asperity surface. G is the characteristic scale parameter, and x and y represent the measured distances in the x-direction and y-direction, respectively. Moreover, other symbols can be found in Ref. [40]. The simulation result of the 3D tooth surface morphology is shown in Figure 3d, which is close to the actual tooth surface morphology. Hence, the W–M fractal function will be applied to characterize the tooth surface roughness morphology in the following section.

2.2. The Gear Lubrication Contact Model

In this research, the contact between the teeth is regarded as a line contact, and the lubricating oil is equivalent to a non-Newtonian fluid. Hence, the EHL theory is applied to establish the gear lubrication contact model. In the contact region, the thickness of the oil film and pressure can be written as follows [4,5,7]:
The W–M result is regarded as close to the measured tooth surface morphology because both the measured surface and the reconstructed surface show similar fractal roughness characteristics. The non-Newtonian description is used here to reflect the pressure-dependent viscosity and density of the lubricant in high-pressure EHL contact.
x ρ h 3 η p x = 12 u ( ρ h ) x
where ρ represents the lubricating oil density, h denotes the oil film thickness, η is the lubricating oil viscosity, u means the entrainment velocity, and p is the oil film pressure.
The oil film thickness h is expressed as follows [4]:
h = h 0 + x 2 2 r e z r + δ e
where h0 means the central film thickness of the rigid bodies, re represents the equivalent radius of the curvature, zr stands for the amplitudes of the asperity profile, which can be obtained by the W–M fractal function, and δe denotes the surface deformation, which can be derived by the following equation [7]:
δ e = 2 π E e x in x out p ( s ) ln ( s x ) 2 d s
where xin and xout denote the inlet and outlet coordinates of the lubricant, and Ee represents the equivalent elastic modulus, which is obtained as follows:
E e = 2 1 υ 1 2 E 1 + 1 υ 2 2 E 2
where E1 and E2 are the elastic modulus of the driving gear and the driven gear, respectively, and υ1 and υ2 denote the corresponding Poisson ratios.
The viscosity–pressure equation and density–pressure equation of lubricating oil can be expressed as follows [5]:
η = η 0 exp ln η 0 + 9.67 1 + 1 + p p 0 0.68
ρ = ρ 0 1 + 0.6 × 10 9 p 1 + 1.7 × 10 9 p
where η0 is the ambient viscosity of the lubricant, and p0 denotes the pressure factor.
The load balancing equation is as follows:
w = x out x in p d x
where w means the load of the unit axial length.
The Reynolds-equation-based isothermal line-contact EHL problem was discretized on a finite-difference grid. The computational domain was set as x in [−4.0, 1.5] with 256 nodes. The pressure distribution was initialized using the Hertzian pressure distribution. During the iterative solution, the elastic deformation, film thickness, viscosity–pressure relation, density–pressure relation, and Reynolds-equation coefficient were updated successively. The discretized Reynolds equation was solved by a Gauss–Seidel relaxation iteration, and negative pressure values were set to zero to satisfy the cavitation constraint. The relative pressure residual between two consecutive iterations was used as the convergence criterion, and the iteration was terminated when the residual was lower than 1 × 10⁻⁵.
All numerical procedures, including the EHL pressure iteration, tooth-stiffness integration, crack-parameter analysis, and post-processing, were implemented in MATLAB R2020b on a 64-bit Windows workstation equipped with an Intel Core i7-10750H CPU @ 2.60 GHz, 16 GB RAM, and an NVIDIA GeForce RTX 2060 GPU with 6 GB memory.
In Figure 3, subfigure (a) shows the measured gear sample, subfigure (b) shows the Newview 9000 non-contact surface morphometer, subfigure (c) shows the measured three-dimensional tooth surface topography, and subfigure (d) gives the W–M fractal reconstruction used in the subsequent model.

2.3. The Asperity Contact Stiffness Model

During the meshing process of the gears, when the tooth surface micro-protrusions exceed the thickness of oil film, the surface will experience asperity contact. Hence, according to the Johnson load-sharing concept, the tooth surface contact load is borne by the oil film and asperity. Meanwhile, the Hertz contact stiffness in the TVMS will be replaced by the rough contact and the oil film stiffnesses. According to Ref. [9], the asperity contact stiffness is given as follows:
In the load-sharing relationship, the meshing contact load is shared by the oil film and asperity contact within the local tooth-contact region, while the tooth crack changes the structural stiffness of the cracked tooth. The present study couples these contact and crack effects in the I-TVMS model.
k r = 2 n A n E β h l ( z + l h ) 1 2 π σ exp z 2 2 σ 2 d z
where An is the nominal contact area, n represents the density of concave–convex bodies, E denotes the equivalent elastic modulus, and σ stands for the standard deviation of the equivalent radius of the curvature of the concave–convex body and the surface roughness. Moreover, the other symbol meanings could be obtained in Ref. [9].

2.4. The Oil Film Stiffness

The oil film serves as an important medium during the meshing process of gears, which bears a portion of the contact load. For the convenience of computing, the oil film stiffness is replaced by the average oil film stiffness [6,14], which can be written as follows:
k o = B h A n 1 τ
in which τ represents the proportion of the asperity contact area to the total contact area, h is the thickness of the oil film, and B denotes the volume modulus of the lubricating oil, which can be written as follows:
B = 1 1 1 + B 0 ln 1 + p B 0 1 + B 0 B 0 + p 1 + B 0
where B0 is the volume modulus under environmental pressure, B0′ indicates the change rate of pressure under environmental stress (the value is approximately 1.1) [8], and p is the average lubricating oil pressure.
After the pressure and film-thickness distributions were converged, the average oil-film pressure and the mean film thickness in the Hertzian contact region were extracted and substituted into Equation (10) to calculate the average oil-film stiffness used in the I-TVMS model.
It is noted from Figure 2 that the oil film stiffness and the asperity contact stiffness are in a parallel relationship, which can be expressed as follows:
k c = k r + k o

2.5. The Tooth Stiffness Model

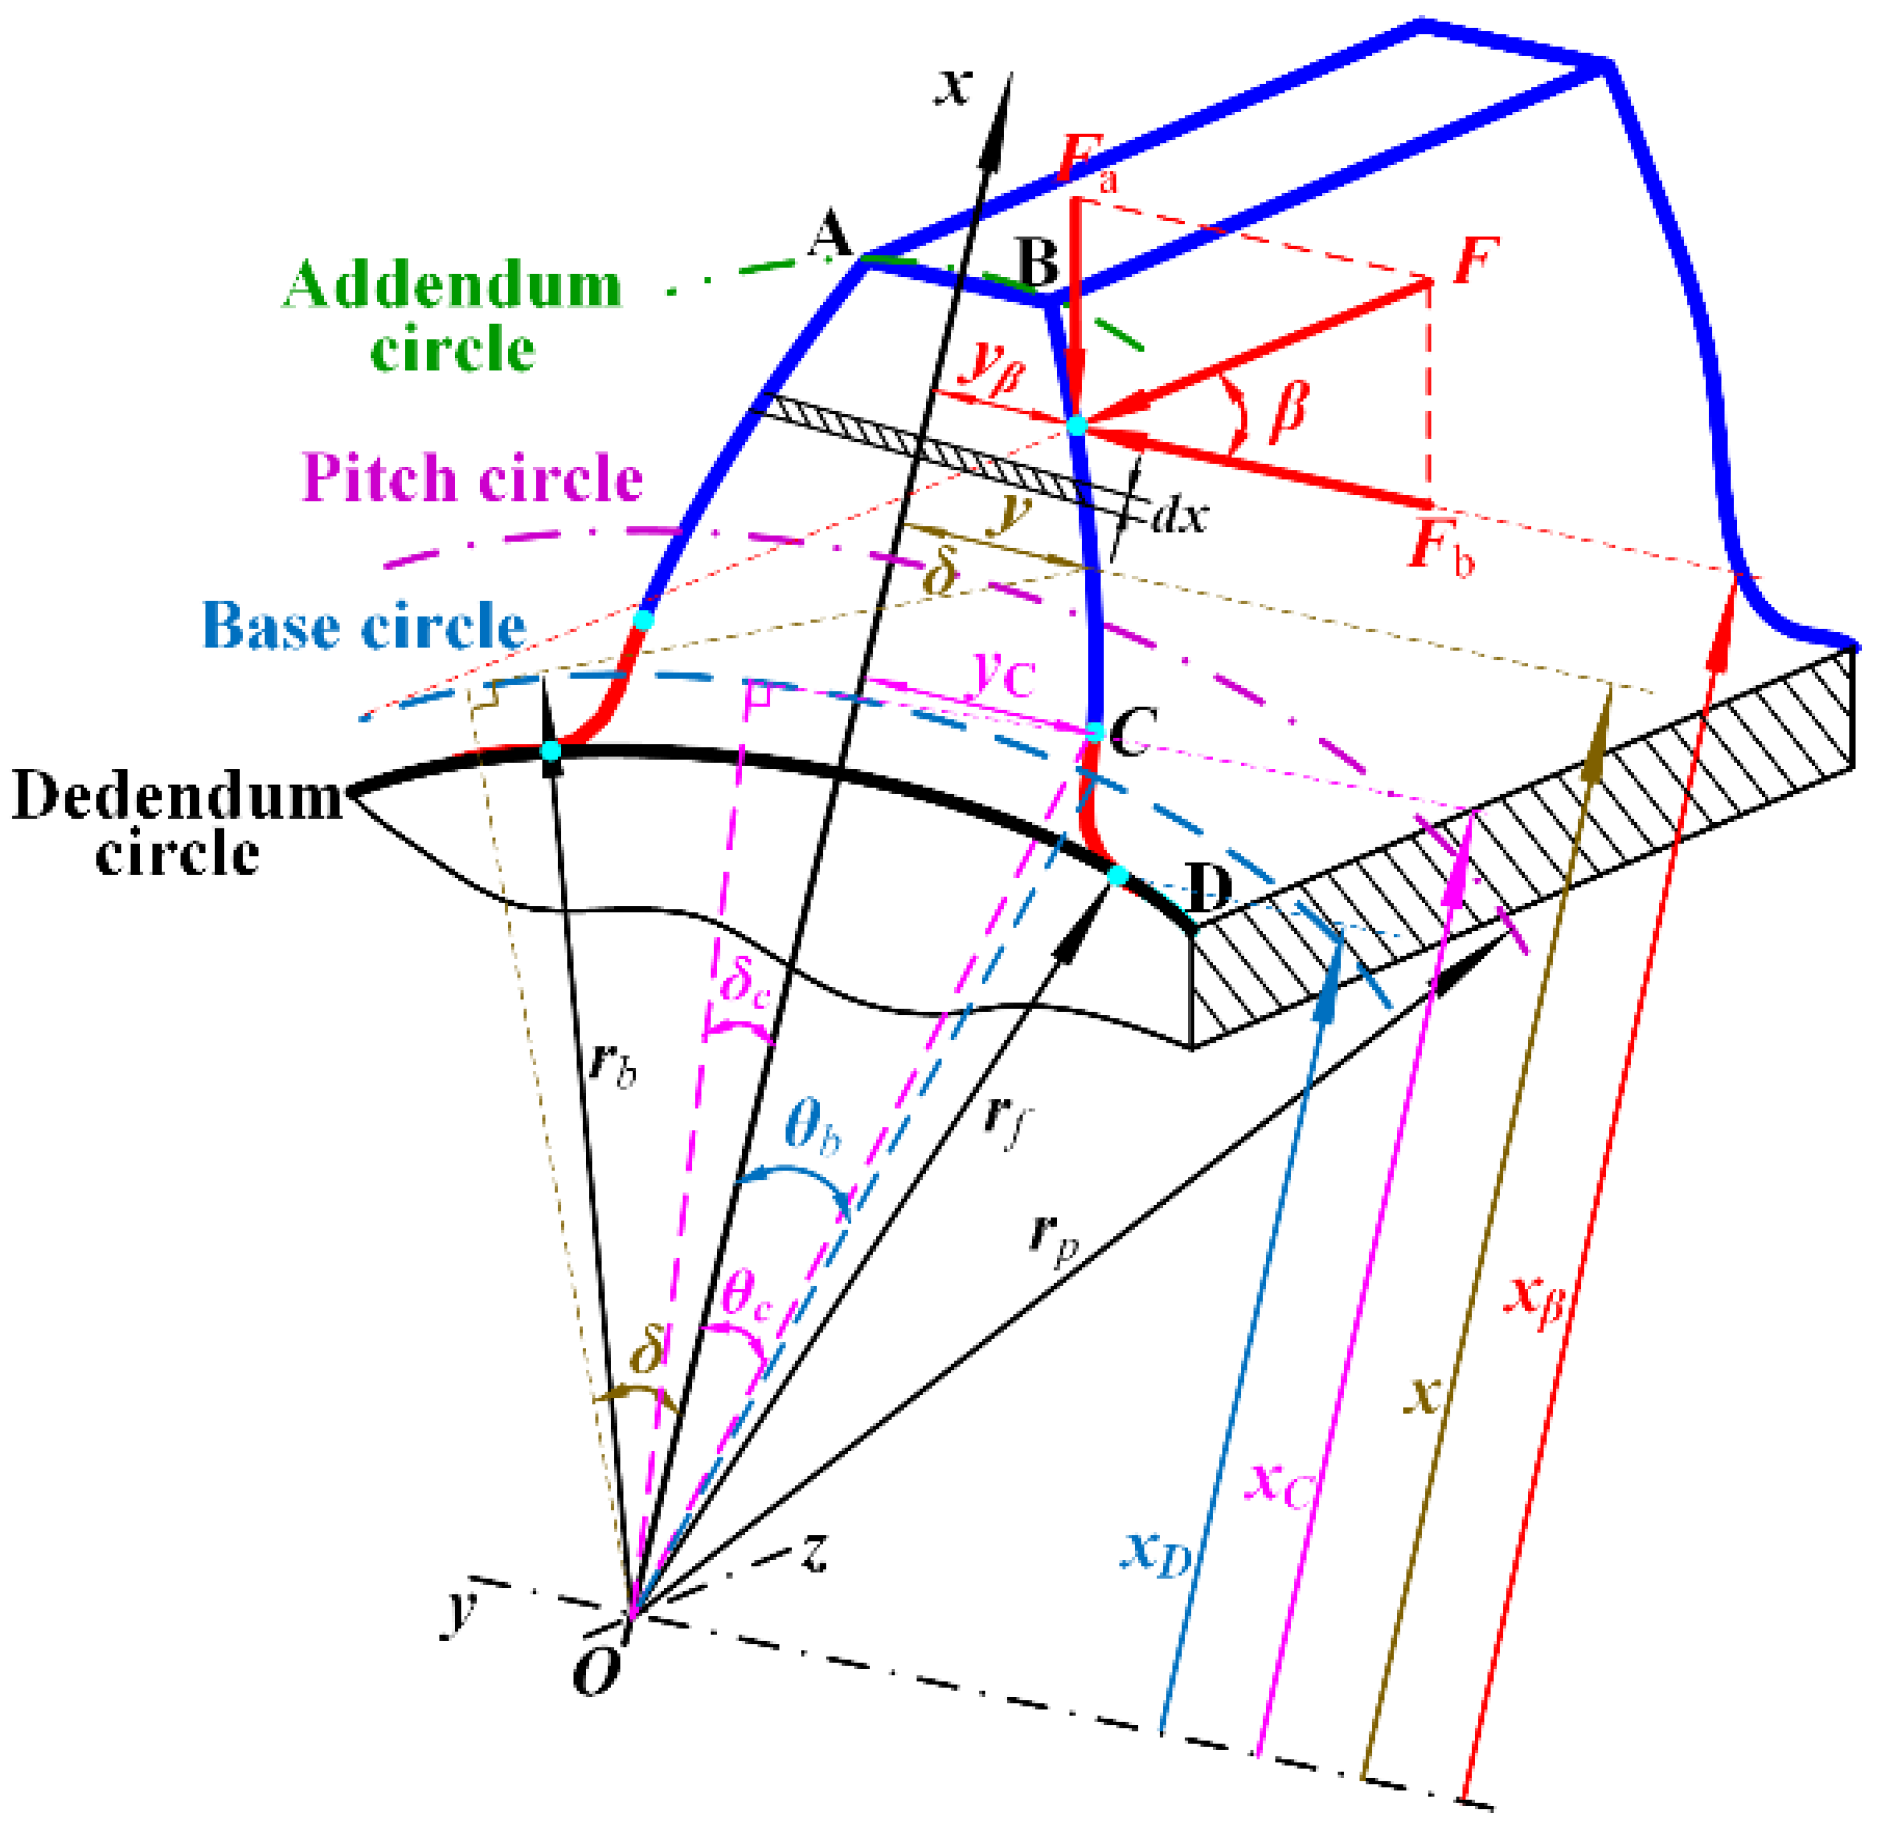
In Figure 4, the tooth is imitated by a non-uniform cantilever beam, and the tooth profile’s composition is tripartite: the addendum curve AB, involute curve BC, and transition curve CD. According to the potential energy method, the bending stiffness kb, shear stiffness ks, axial compression stiffness ka, and fillet foundation stiffness kf could be written as follows [17,26]:
1 k b = δ C β cos β ( x β x 1 ) y β sin β 2 E I x 1 d x 1 d δ d δ + π 2 α cos β ( x β x 2 ) y β sin β 2 E I x 2 d x 2 d γ d γ
1 k s = δ C β 1.2 cos 2 β G A x 1 d x 1 d δ d δ + π 2 α 1.2 cos 2 β G A x 2 d x 2 d γ d γ
1 k a = δ C β sin 2 β E A x 1 d x 1 d δ d δ + π 2 α sin 2 β E A x 2 d x 2 d γ d γ
1 k f = cos 2 β E L 2 + L * u f S f 2 + M * u f S f + P * ( 1 + Q * tan 2 β )
where x1 and x2 represent the arbitrary point on the involute curve and the transition curve in the x direction, respectively; and xβ and yβ are the coordinates of the meshing points on the x-axis and y-axis, which can be expressed as follows:
x 1 = r b δ + θ b sin δ + cos δ x 2 = r p cos ϕ a 1 / sin λ + r ρ sin λ ϕ
x β = r b δ β + θ b sin δ β + cos δ β y β = r b δ β + θ b cos δ β sin δ β
in which rp is the pitch radius, and rρ represents the blade tip fillet radius used for processing gear. The other parameter meanings can be referred to in Refs. [17,26].
Therefore, the I-TVMS considering the lubrication and tooth surface morphology is written as follows:
1 k I - TVMS = i = 1 n 1 k c i + j = 1 2 1 k b i j + 1 k s i j + 1 k a i j + 1 k f i j
in which i is the number of meshing teeth pairs simultaneously.
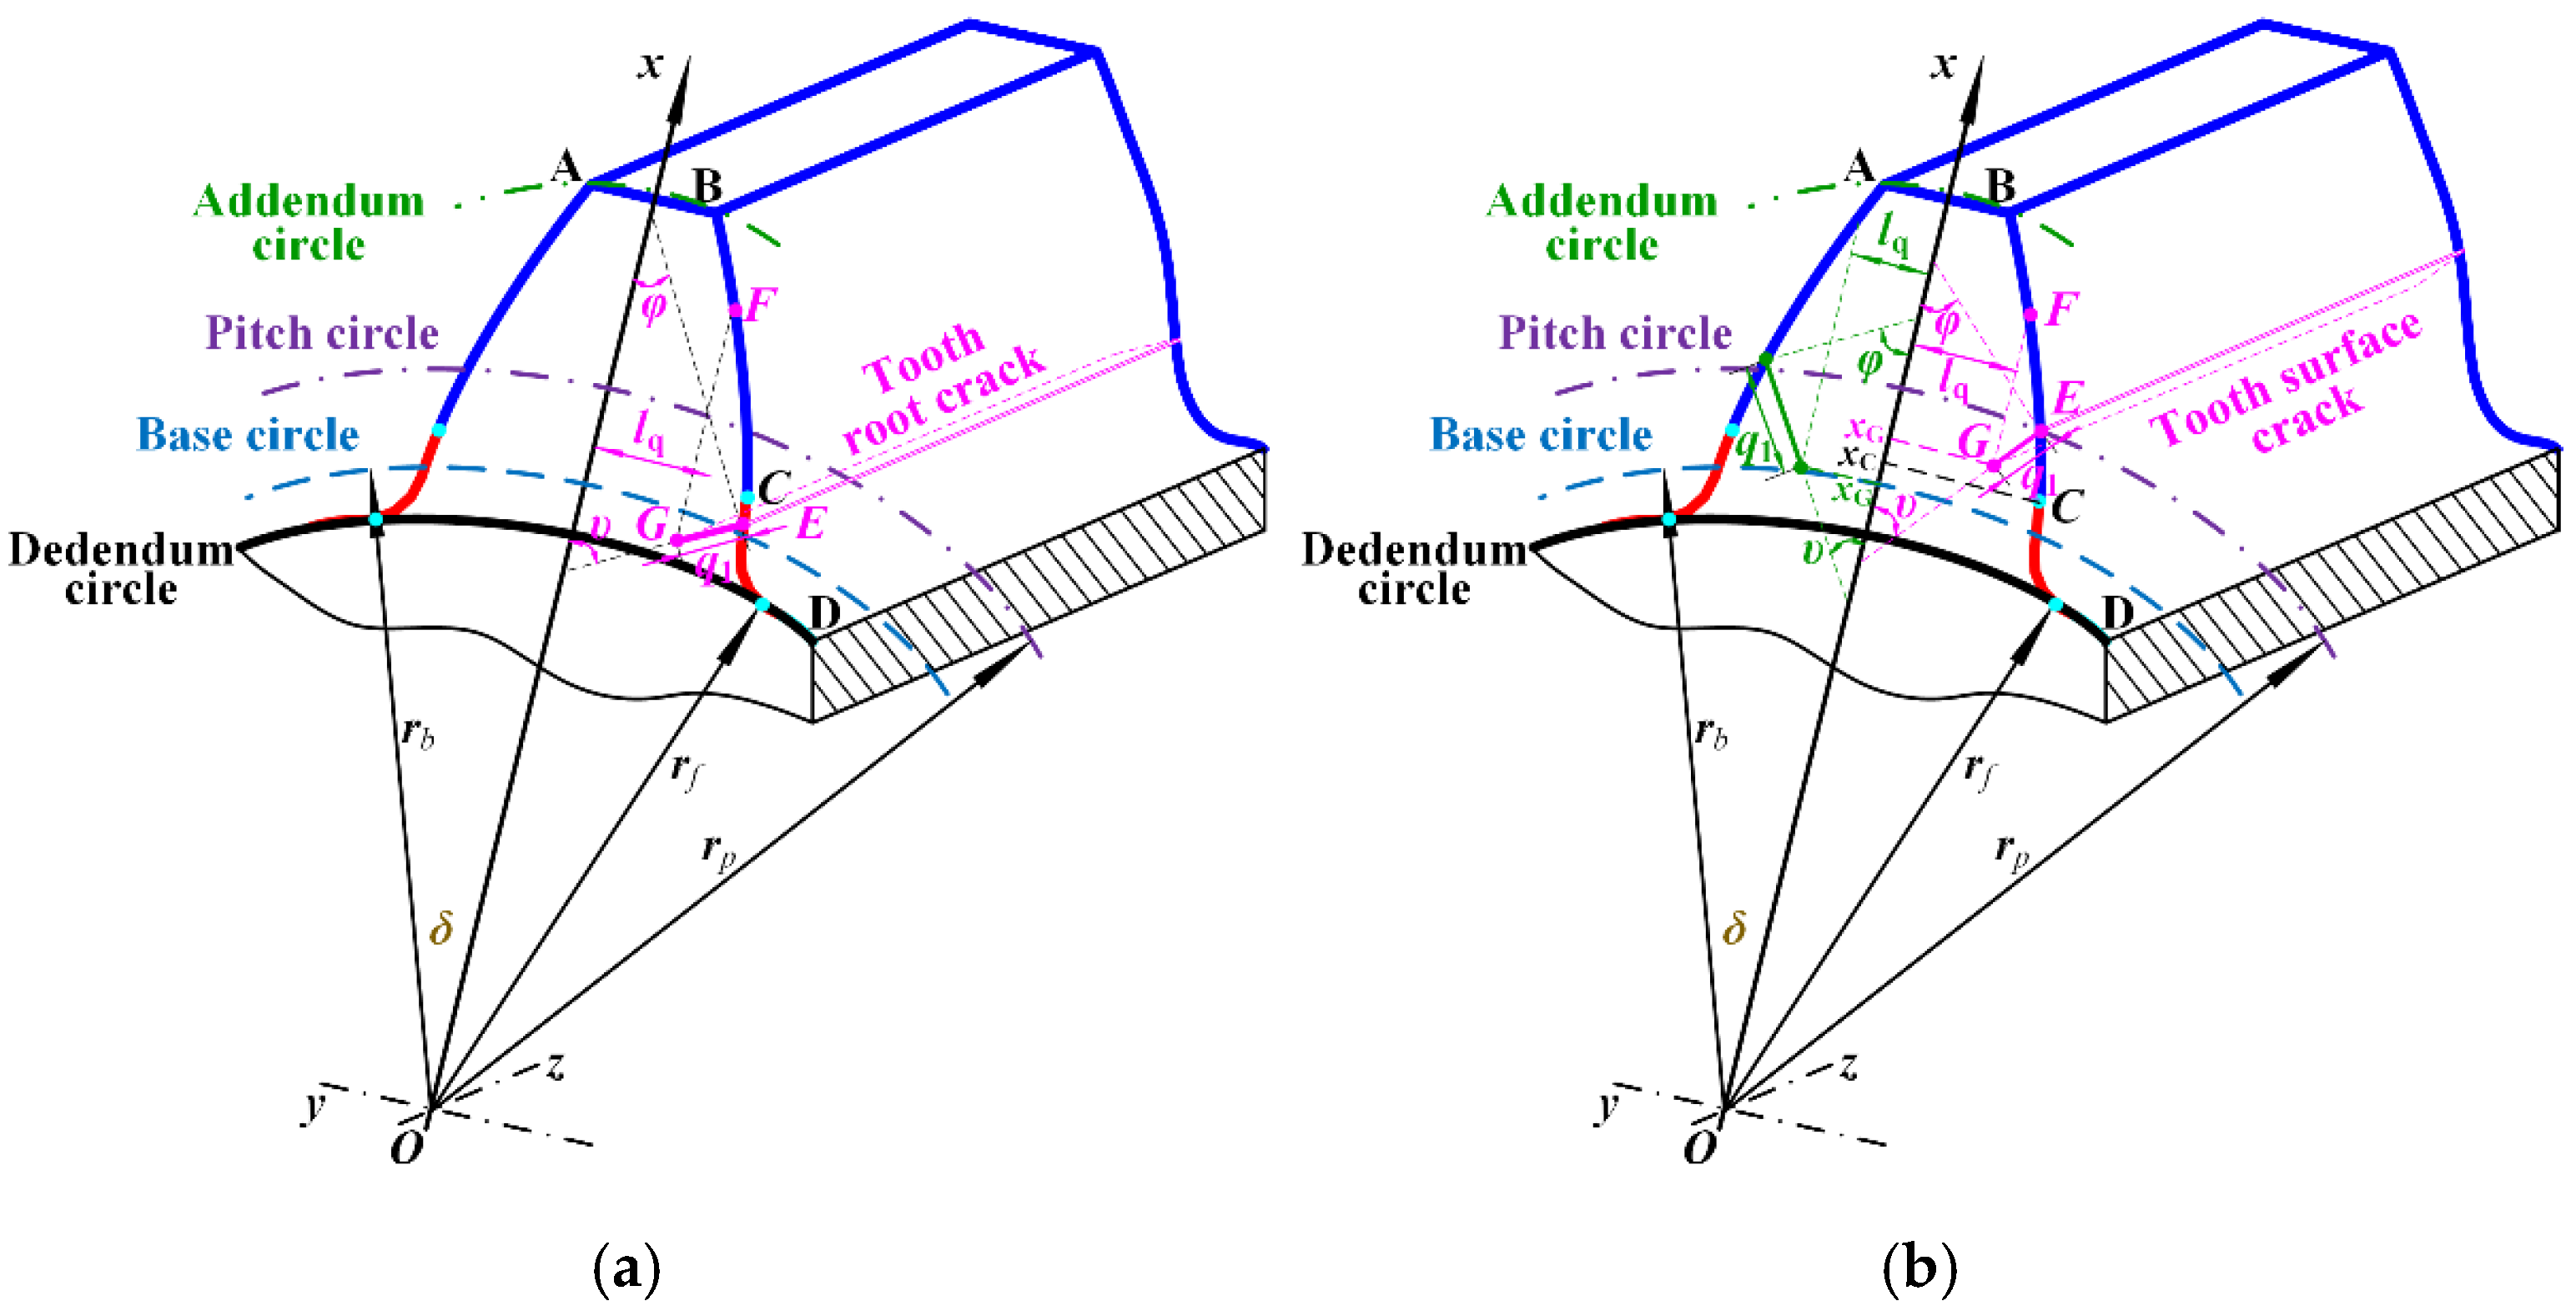
The crack occurs at the gear tooth transition curve (curve CD), which is called tooth root crack (RC). Meanwhile, the I-TVMS composition of the tooth with tooth root crack is similar to a healthy tooth. In the research, it assumes that the crack depth is uniform and extends along the entire tooth width, and the tooth profile curve remains unchanged. When tooth root crack occurs, the burdened axial pressure and the fillet foundation stiffness are the same as that of a healthy tooth, and the corresponding mathematical expression is the same. However, the normal bending moment and shear force of the cracked tooth decrease, which leads to the revision of Equations (13) and (14). Figure 5a displays the schematic diagram of tooth root crack, which is simulated as a straight line, and the start point and endpoint are E and G, respectively. q1, υ, and ψ represent the crack depth, crack propagation direction, and crack initial position. According to the transition curve equation (Equation (20)), the crack point coordinates (G) are given by the following:
x E = r p cos ϕ a 1 / sin λ E + r ρ sin λ E ϕ y E = r p sin ϕ a 1 / sin λ E + r ρ cos λ E ϕ
x G = x E q 1 cos υ ,               y G = y E q 1 sin υ
As shown in Figure 5a, the effective cross-sectional moment of inertia and cross-sectional area (A) with tooth root crack are written as follows [17,30]:
I x 1 = 1 12 l q + y 1 3 L     2 3 y 1 3 L   ,         A x 1 = ( l q + y 1 ) L ,               x C x x F 2 y 1 L ,                                 x > x F  
I x 2 = 1 12 l q + y 2 3 L 2 3 y 2 3 L ,           A x 2 = ( l q + y 2 ) L ,                 x G x < x C 2 y 2 L ,                                   x < x G
where lq represents the distance from the root of the crack to the center line of the tooth, which can be expressed as lq = yEq·sin υ. xC, xG, and xF denote the coordinates of the transition curve starting point, crack starting point, and crack ending point on the x axis, respectively. y1 and y2 are the arbitrary points on the involute curve and the transition curve in the y direction, which can be written as follows:
y 1 = r b δ + θ b cos δ cos δ y 2 = r p sin ϕ a 1 / sin γ + r ρ cos γ ϕ
in which the parameter meanings are the same as that in Equation (20).
Substitute Equations (13) and (14) into Equations (6) and (7): the bending stiffness and shear stiffness with tooth root crack are calculated. And, then, the corresponding I-TVMS with tooth root crack is rewritten as follows:
1 k I - TVMS = i = 1 n 1 k c i + j = 1 2 1 k br i j + 1 k sr i j + 1 k a i j + 1 k f i j
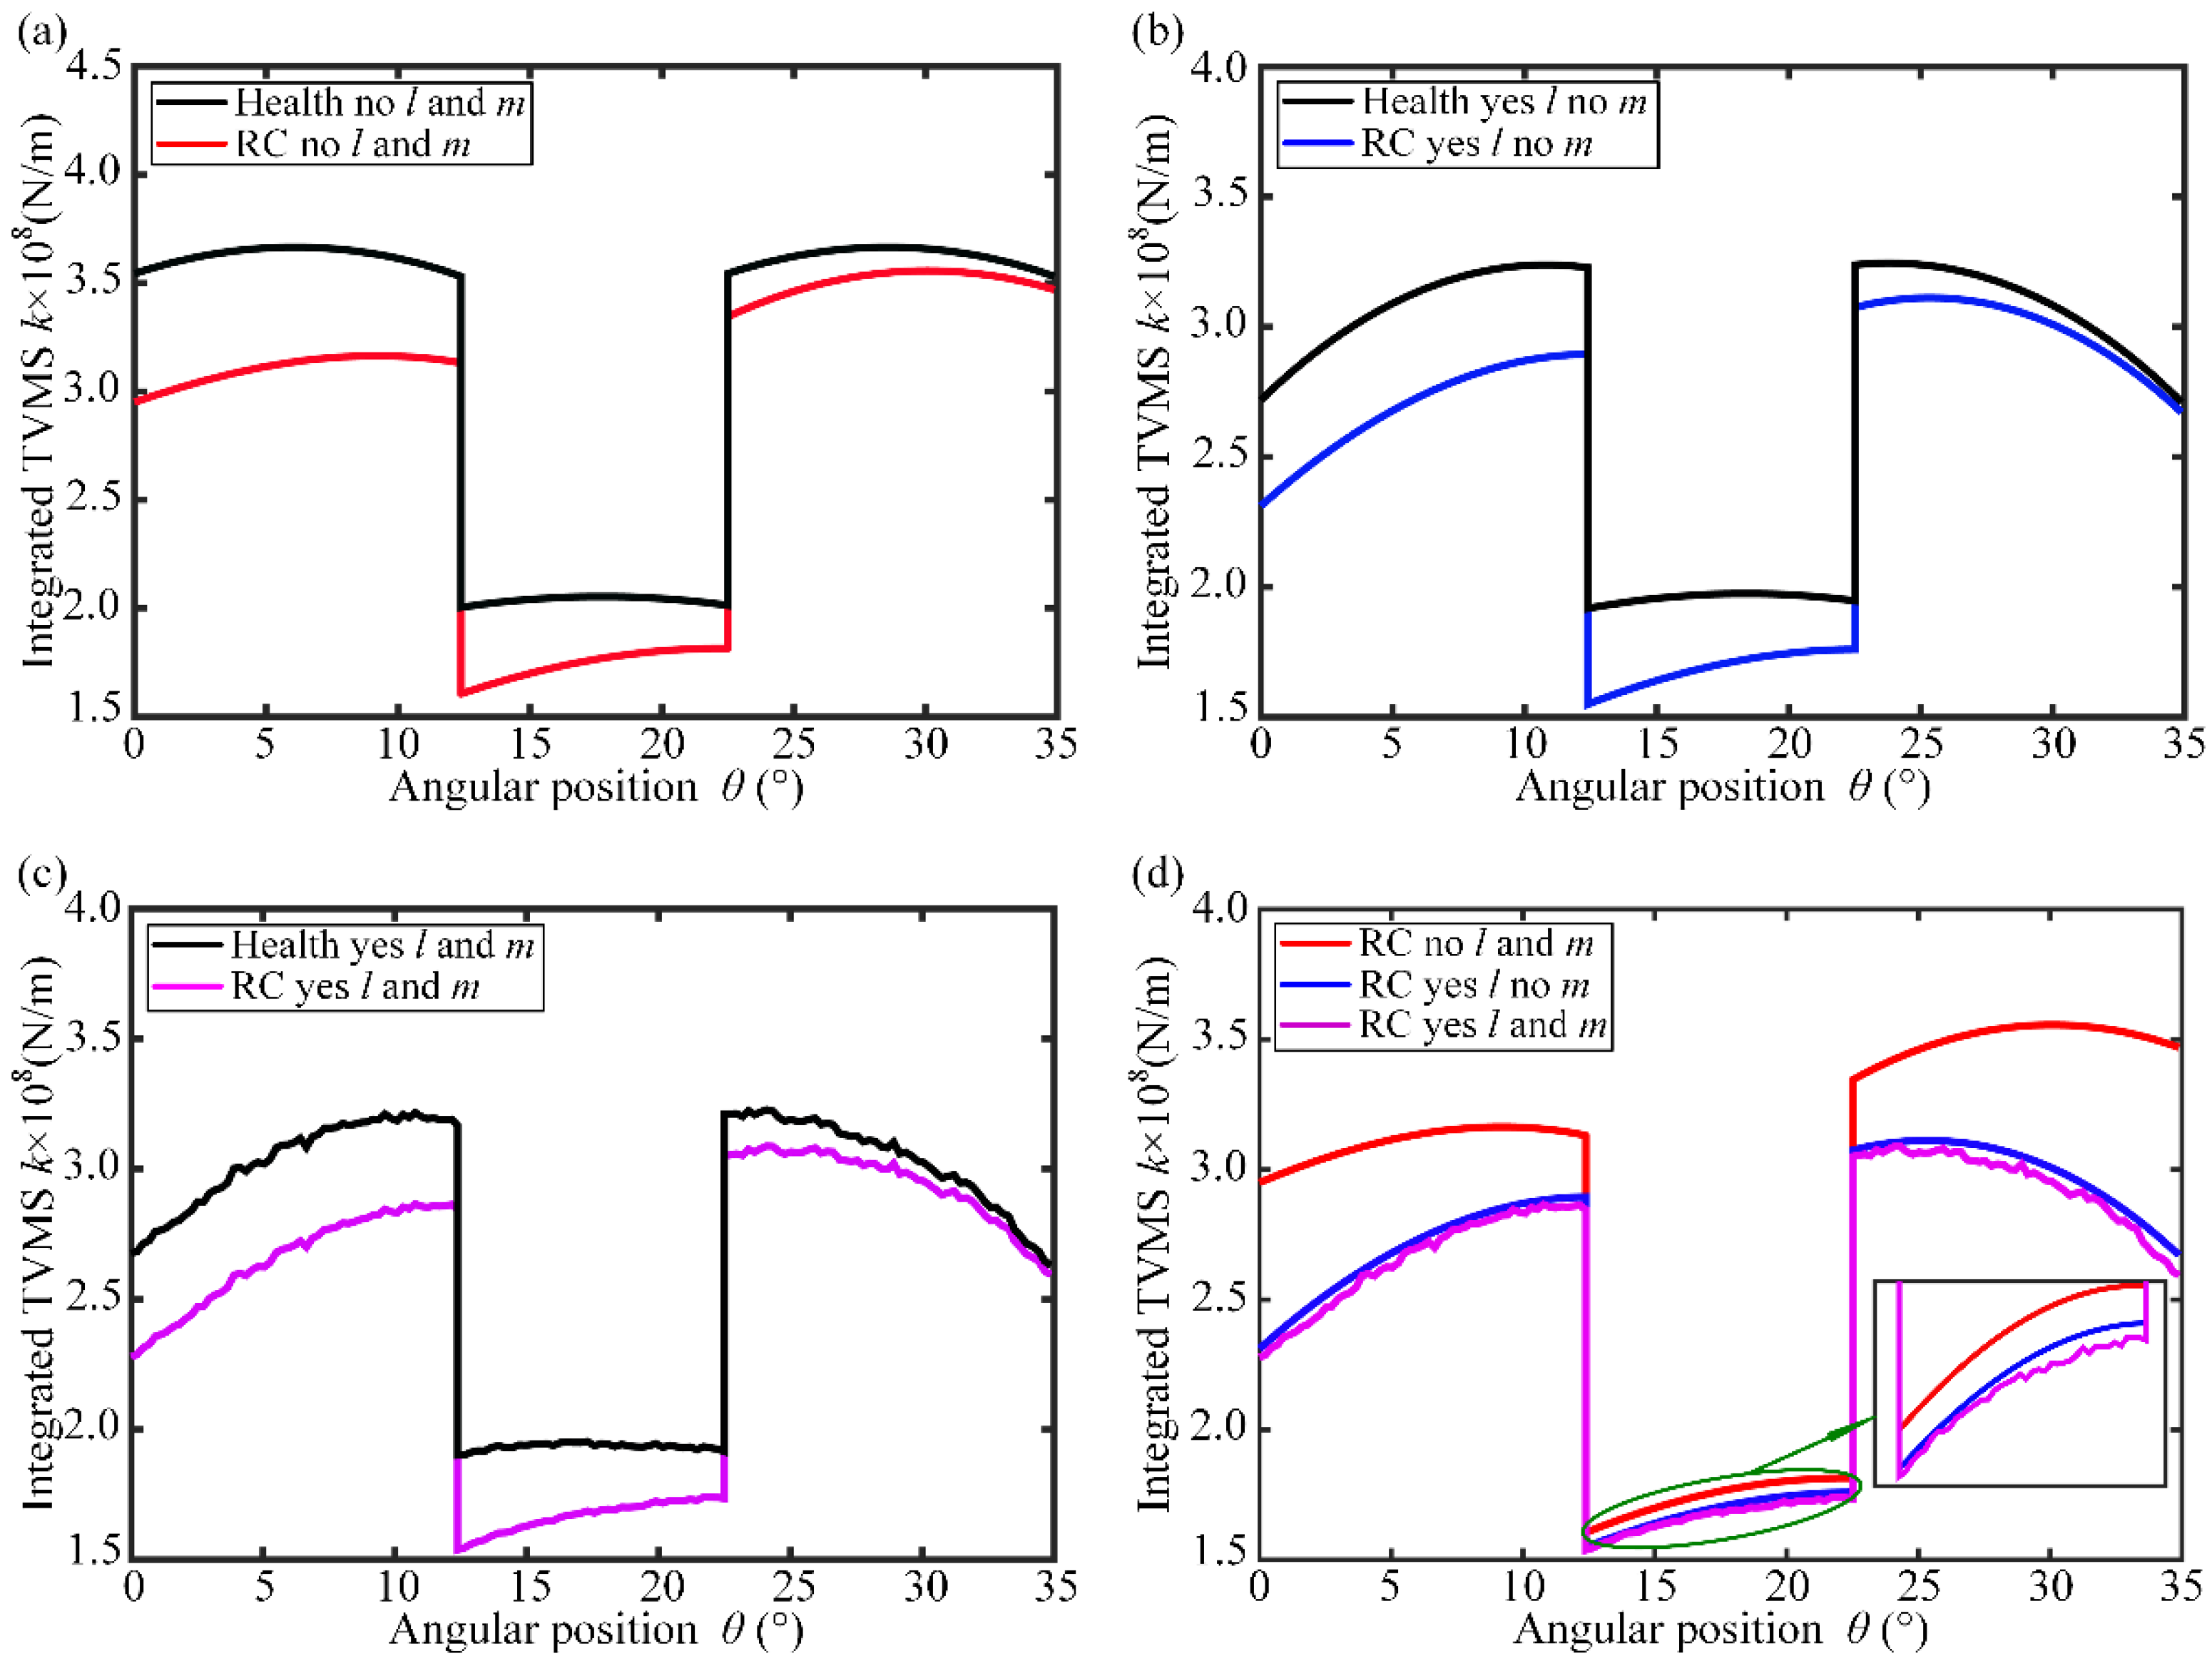
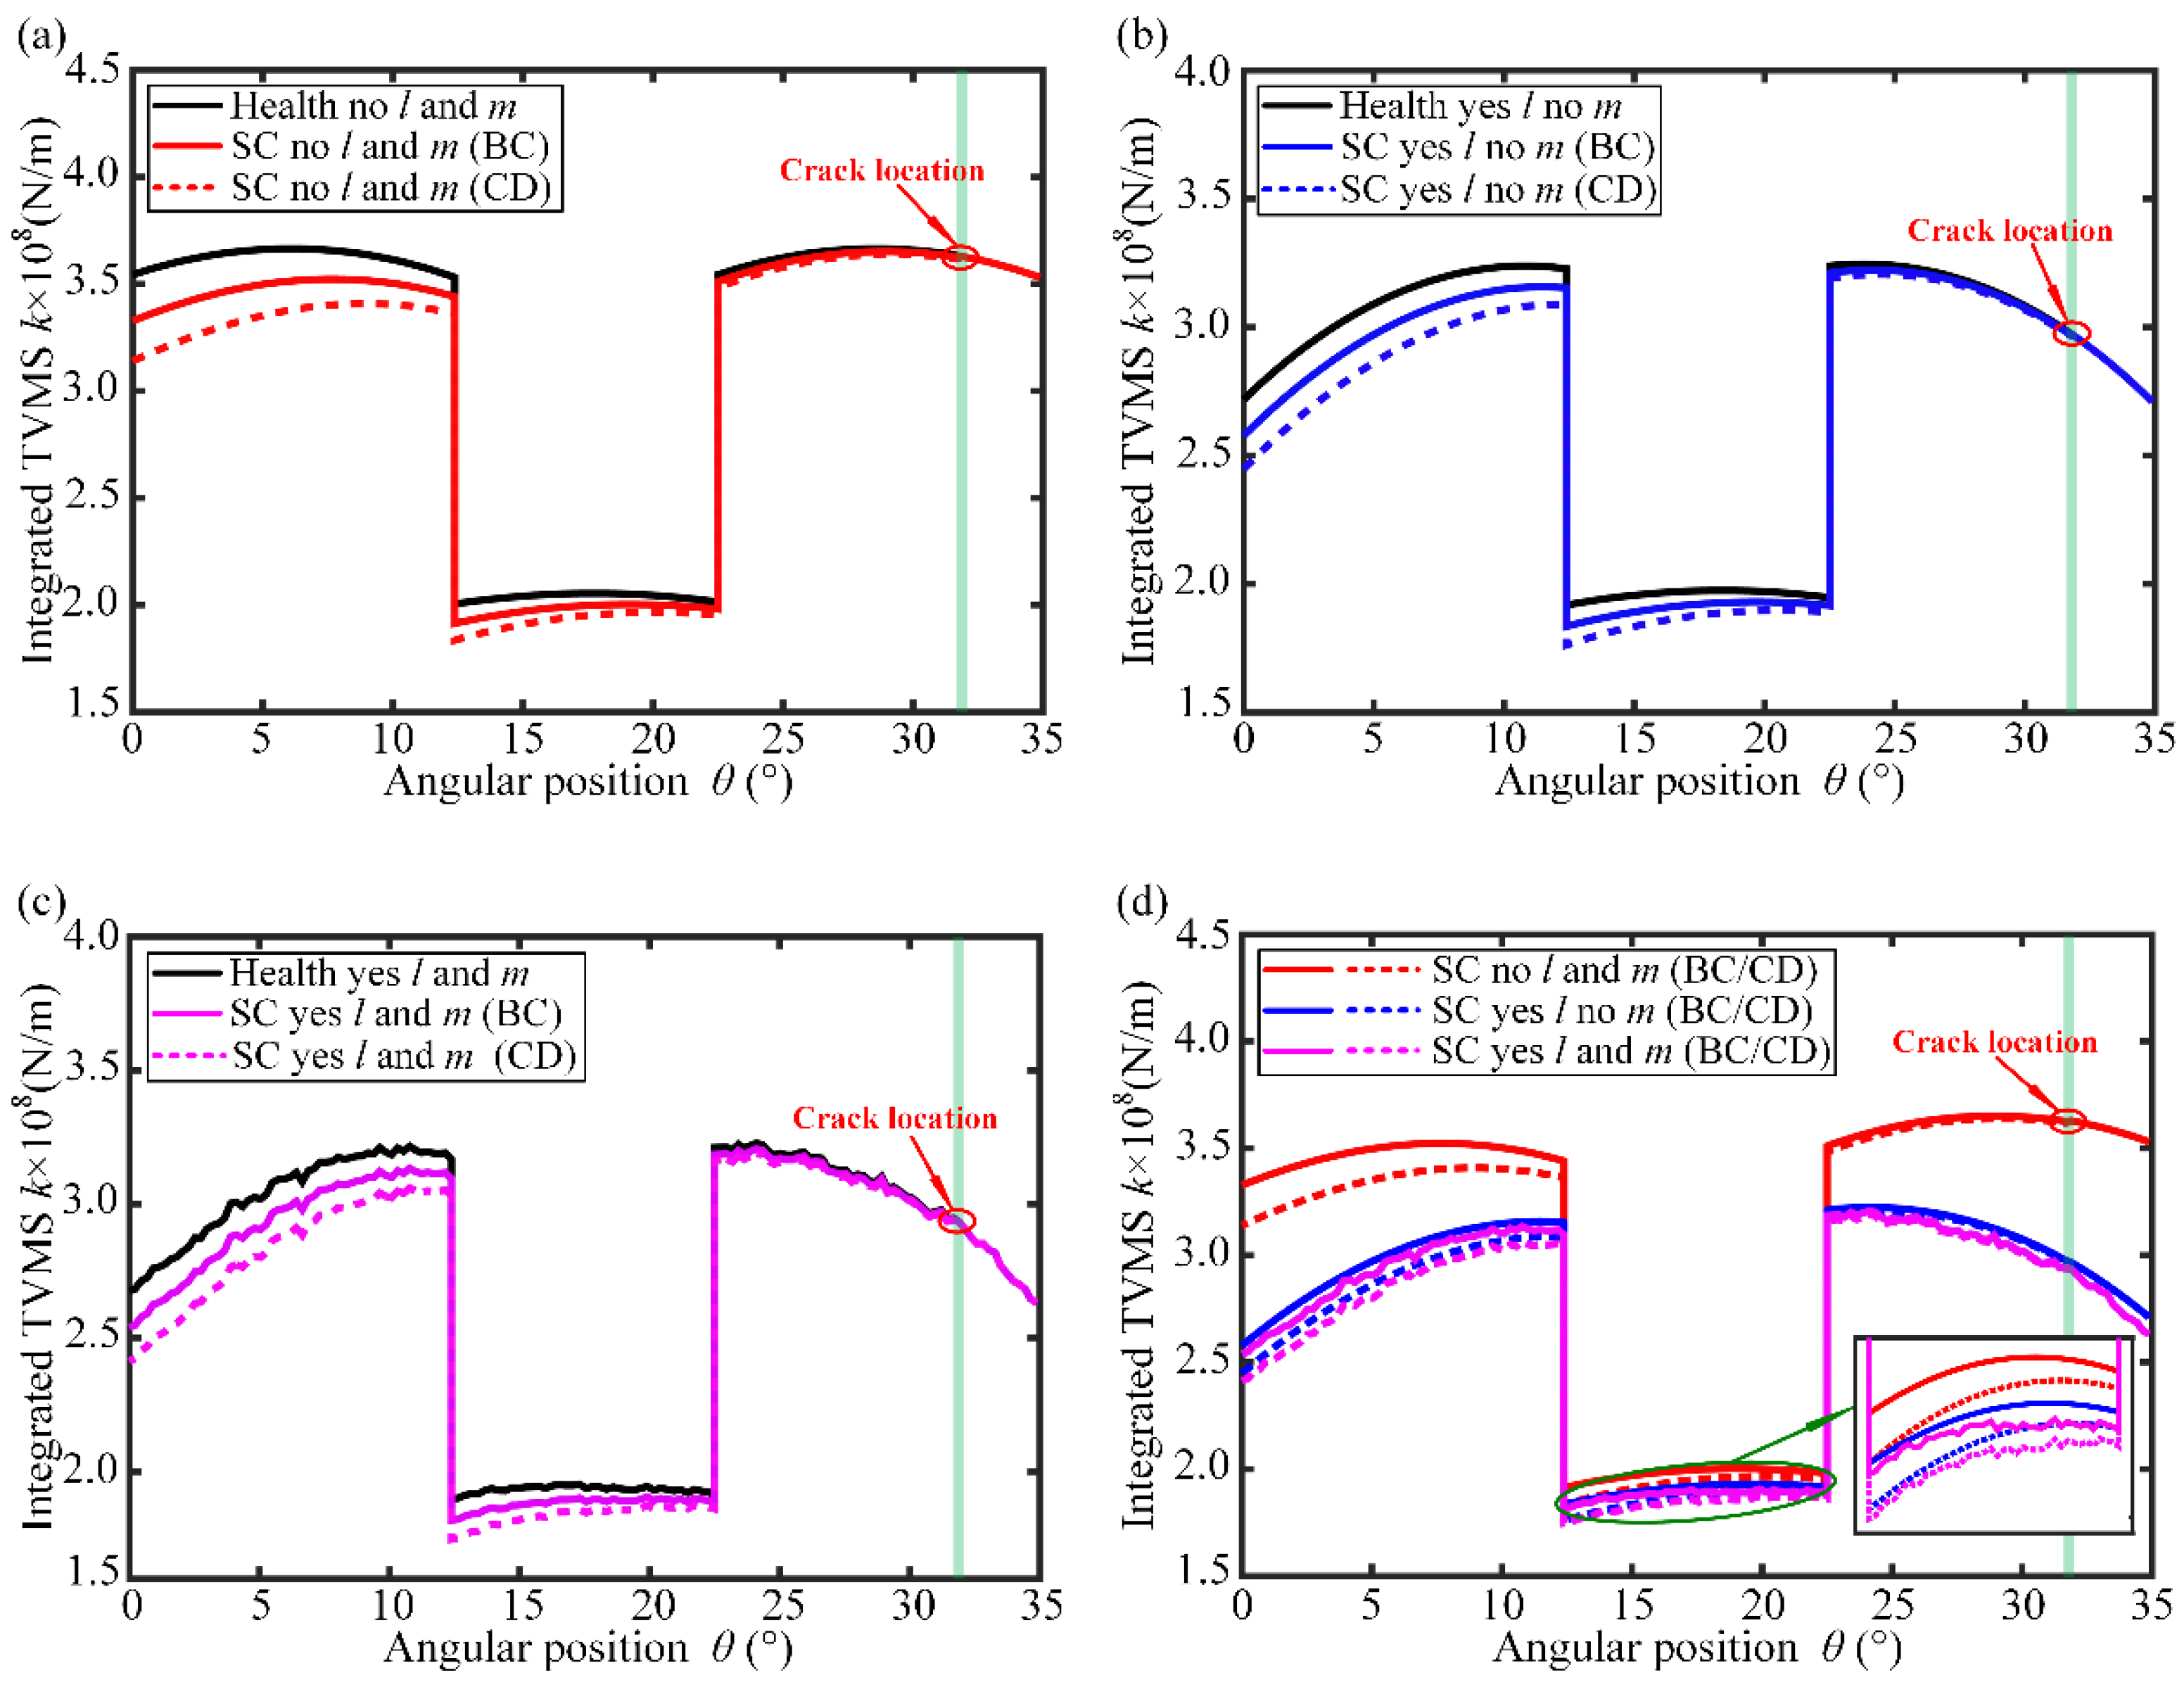
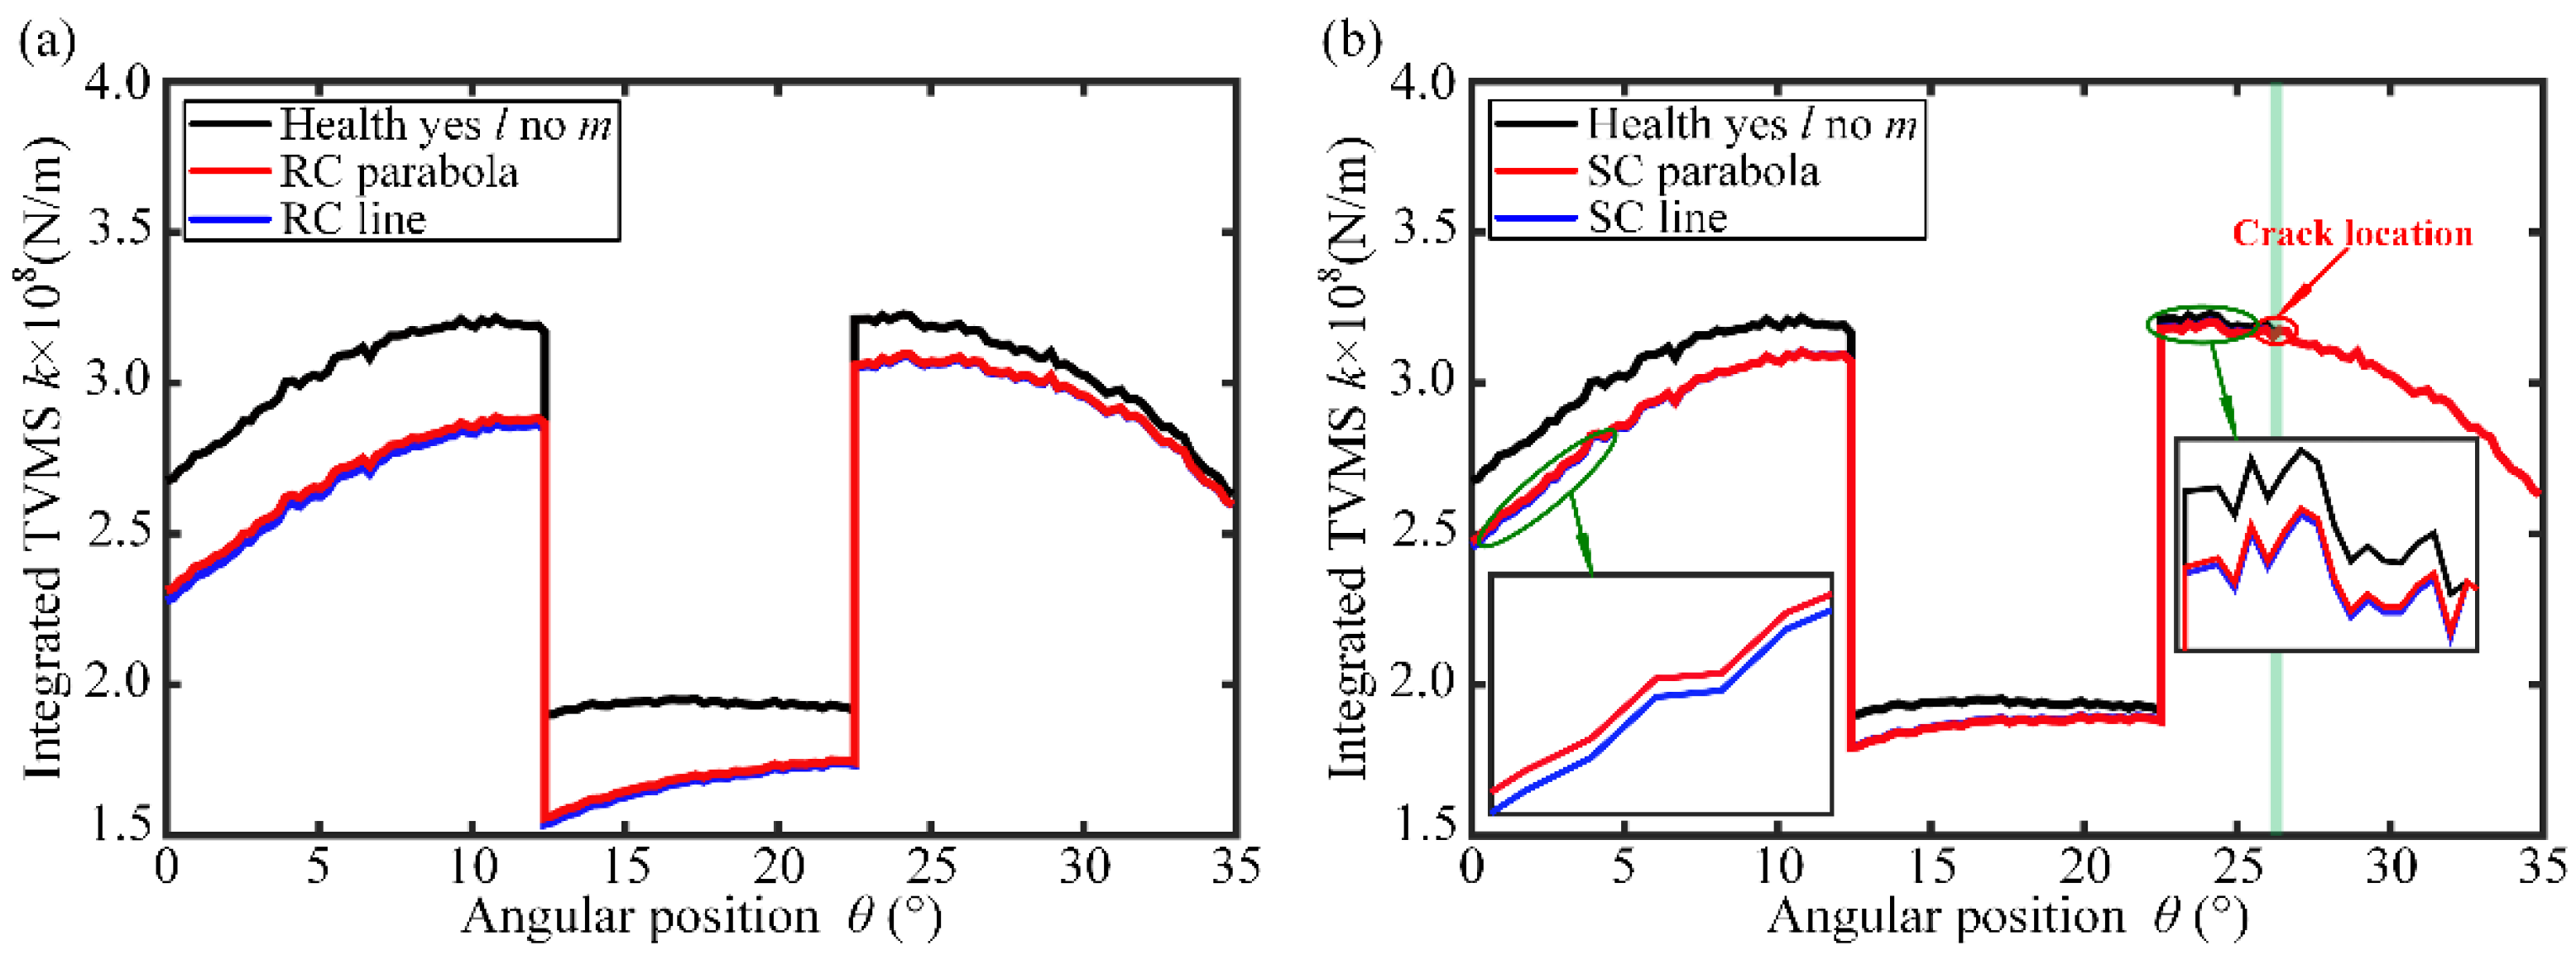
In order to verify the necessity of considering lubrication and the tooth surface morphology on the I-TVMS, an engineering case will be carried out in this section. The key parameters of the spur gear are summarized in Table 1. Figure 6 displays a comparative analysis of the I-TVMS for healthy teeth and tooth root crack under different influence factors. Comparing Figure 6a–c, it can be observed that the I-TVMS with RC is lower than that without RC in a tooth meshing cycle, and the reduction in the single-tooth meshing region is significantly larger than that in the double teeth meshing region. The main reason for this phenomenon is that tooth root crack makes the bending and shear stiffnesses decrease. As shown in Figure 6d, the I-TVMS presents a significant difference as the lubrication and the tooth surface morphology are considered in the meshing process. Hence, it is absolutely necessary to take into account the meshing properties of the gears when analyzing the I-TVMS of the cracked tooth.
The gear parameters in Figure 3, Figure 4 and Figure 5 and Table 1 correspond to the same baseline spur gear pair. The profile shift coefficients of the driving and driven gears are both set to zero in the present calculation.
In the legend of Figure 6, “l” and “m” are used only as abbreviated condition labels: “l” indicates that lubrication is considered, whereas “m” indicates that the tooth-surface morphology is considered. They are not mathematical variables. The label “l” is different from the contact length l in Figure 2, and “m” is different from the gear module m in Section 3.7.
The crack is called tooth surface crack (SC) as the crack appears at the tooth involute region (curve CD). Figure 5b displays the schematic diagram of tooth surface crack, and the coordinate of the starting point of the crack is obtained using the involute equation. Based on the position of the crack endpoint, the tooth surface crack model is divided into two cases:
(1) Case1: The crack endpoint projection is located below the evolvent, namely, xG > xC (as shown in Figure 5b); the effective I and A can be written as follows:
I x 1 = 1 12 l q + y 1 3 L 2 3 y 1 3 L ,         A x 1 = ( l q + y 1 ) L           x G x x F 2 y 1 L                             x > x F   or   x C x < x G
I x 2 = 2 3 y 2 3 L ,           A x 2 = 2 y 2 L
(2) Case2: The crack endpoint projection is located below the transition curve, namely, xG < xC (as shown in Figure 5b); the effective I and A can be rewritten as follows:
Although Equations (22), (23), (28) and (29) have similar mathematical forms, they correspond to different crack cases and different effective cross-sectional boundaries. Therefore, the applicable variables and crack regions are not identical.
I x 1 = 1 12 l q + y 1 3 L 2 3 y 1 3 L ,                 A x 1 = ( l q + y 1 ) L                         x C x x F 2 y 1 L                                           x > x F
I x 2 = 1 12 l q + y 2 3 2 3 y 2 3 L ,   ,           A x 2 = ( l q + y 2 ) L ,                   x G x x C 2 y 2 L ,                                     x < x G  
As the meshing point is located below the crack, the meshing region of the cracked tooth is equivalent to the healthy tooth meshing, and the corresponding I and A remain unchanged, which results in the I-TVMS curves of the cracked tooth and healthy tooth overlapping. Contrarily, when the meshing point is located above the crack, the calculation formulae of I and A are replaced, which causes the stiffness curve to decrease and undergo a sudden change at the location of the tooth surface crack.
Figure 7 shows the comparison results of the I-TVMS for healthy-teeth and tooth-surface-crack gears under different influence factors (the black solid line is the I-TVMS of the healthy tooth, and the solid line and dotted line represent the stiffness of the tooth surface crack as the crack endpoint is projected onto the involute region and transition curve region, respectively). According to Figure 7, it is noticed that the I-TVMS of the cracked tooth reduces little by little from the crack location to the tooth top in the corresponding single-/double-tooth meshing region, which present the similar changing trends between RC and SC, except that the sudden change in the crack location is observed. Therefore, the dynamic meshing environment and different crack locations must be considered in the analysis of the cracked tooth meshing stiffness. Moreover, the I-TVMS as the crack endpoint is projected onto the transition curve is obviously lower than the I-TVMS of the crack endpoint located on the involute zone. The fundamental reason for this is that, when the crack endpoint projects onto the transition curve, it is equivalent to increasing the crack depth, which reduces the bending moment and shear force, and further decreases the I-TVMS.
The abrupt stiffness change at the tooth surface crack is mainly caused by the piecewise effective-section model and the open-crack assumption. In an actual gear, the crack-tip geometry and partial crack closure may smooth this transition; therefore, additional regularization should be considered when the stiffness curve is further used in dynamic simulations.
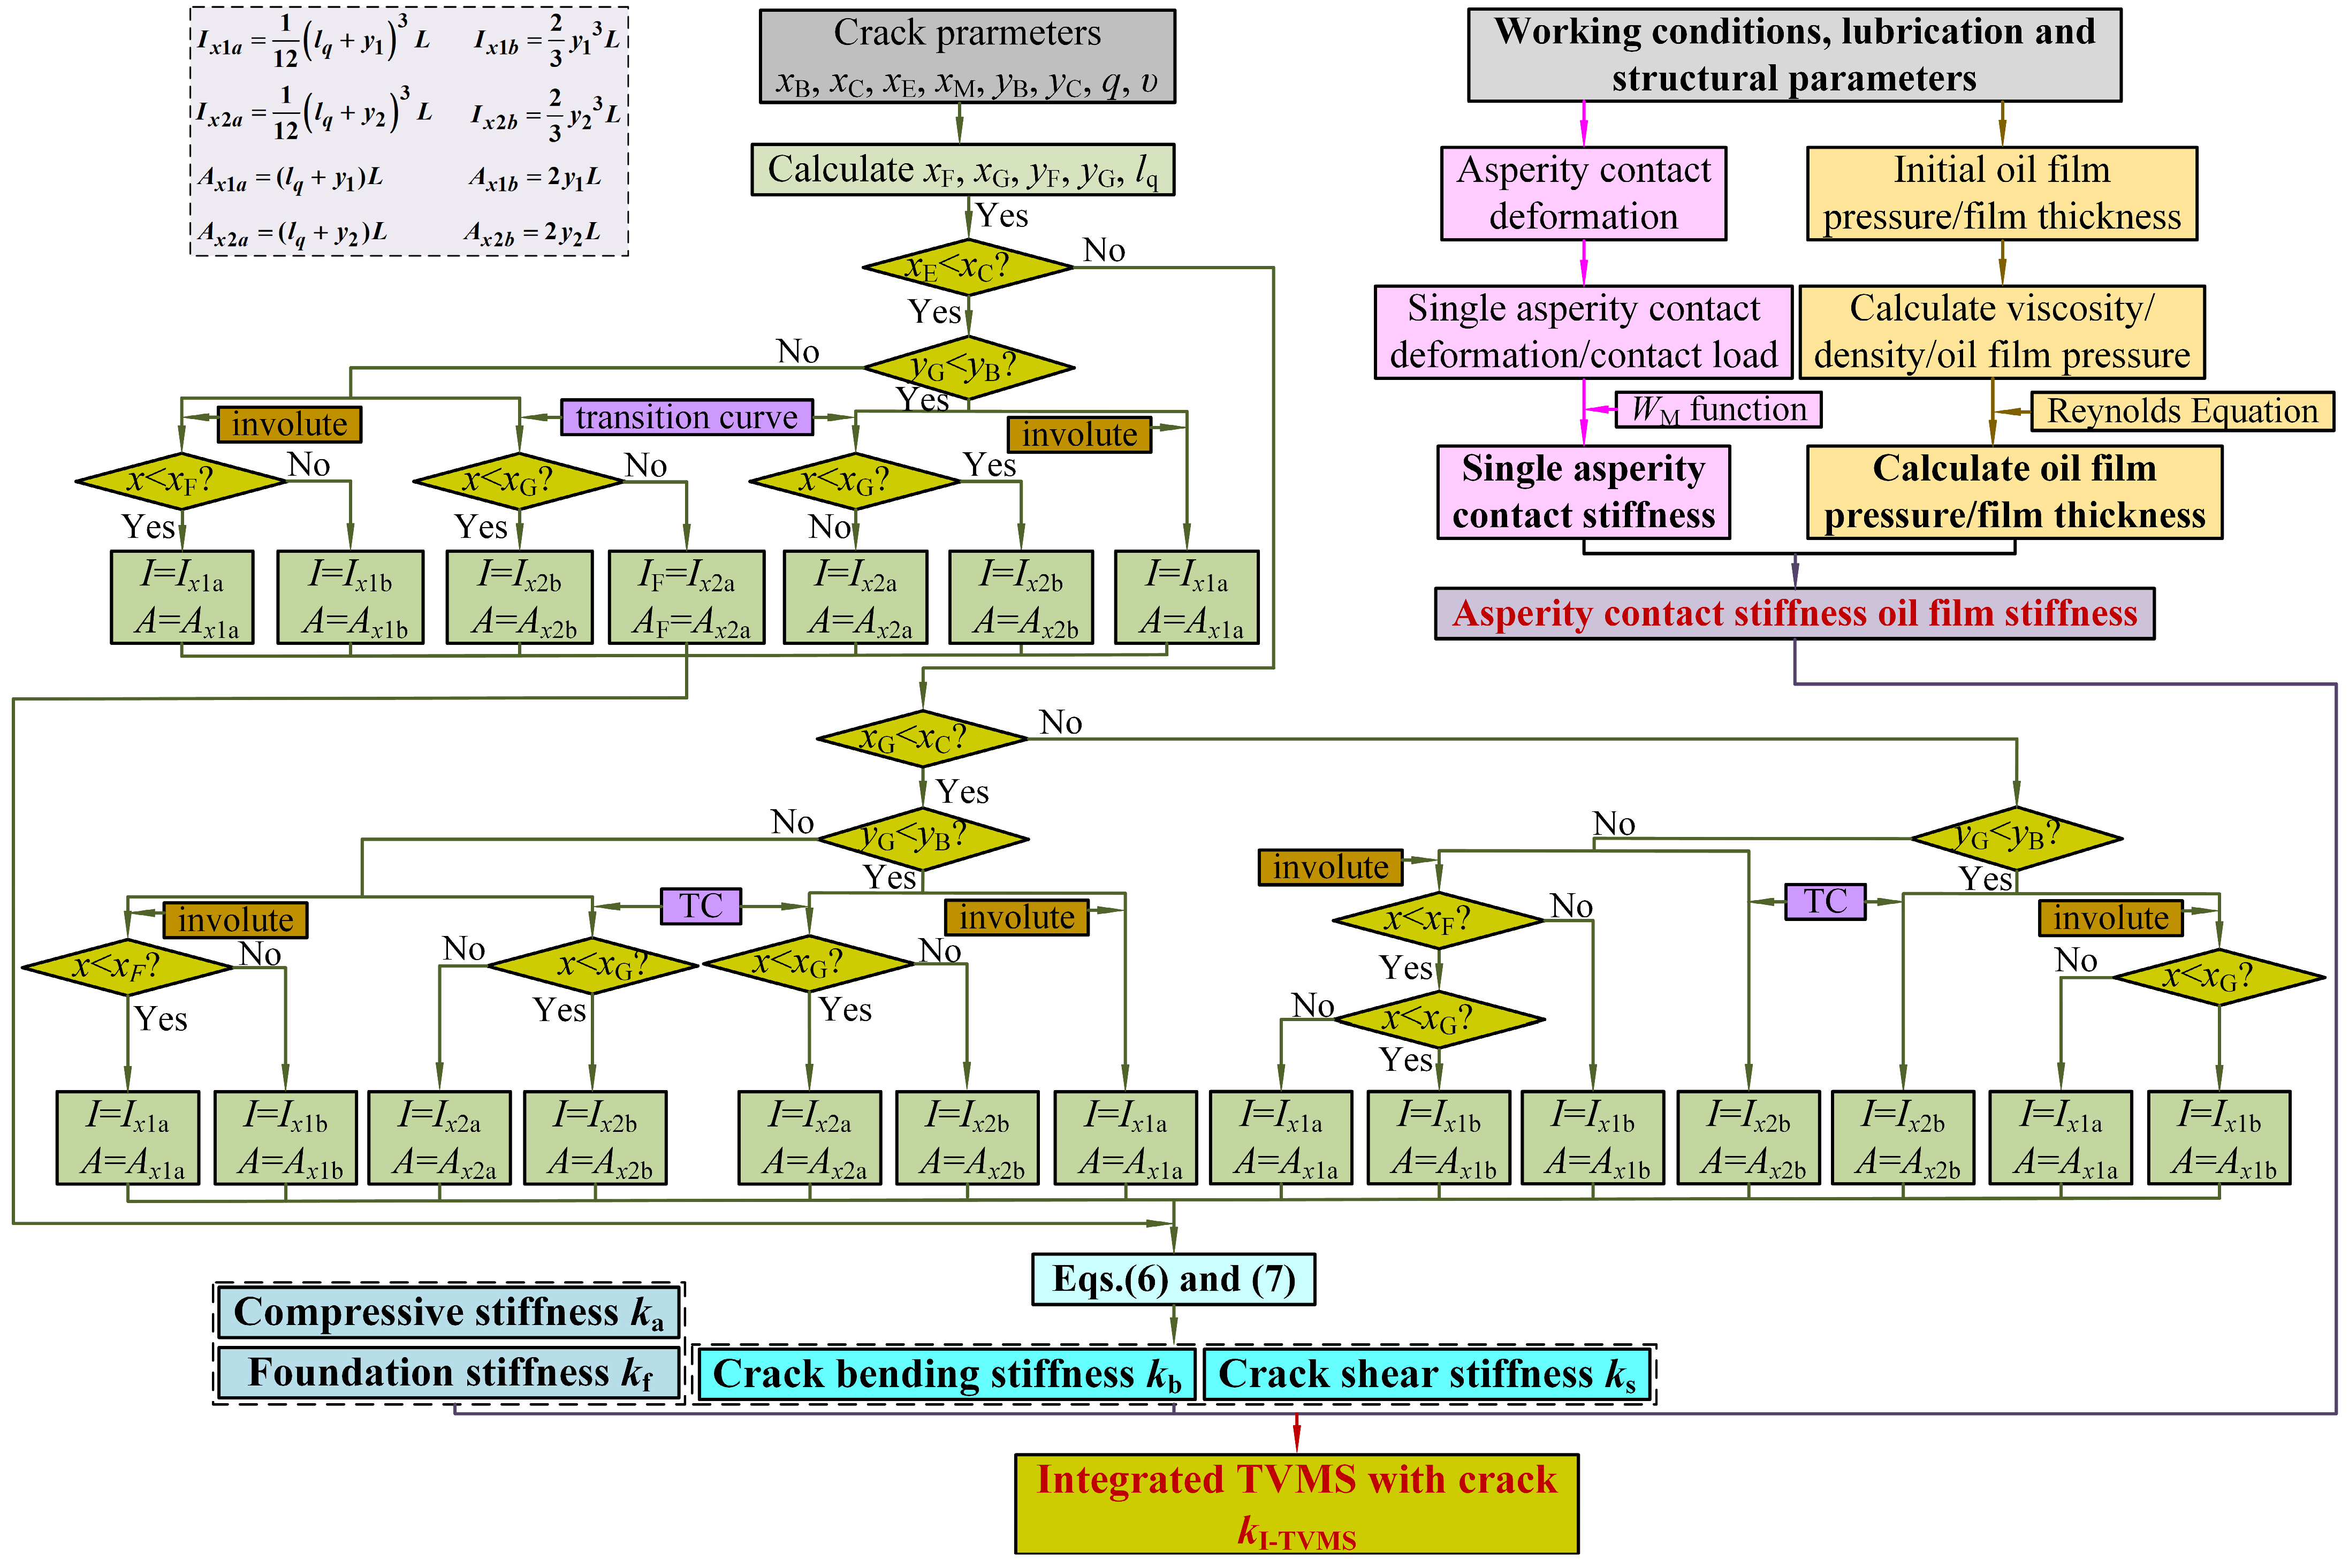
To better illustrate the calculation process of the I-TVMS with cracks, Figure 8 displays the flowchart of the computational procedure, which can be illustrated as follows:
Step 1: According to the processing technology and meshing state of the gears, the expression of the tooth surface morphology is obtained. And, then, the tooth surface topography–elastohydrodynamic lubrication model is constructed.
Step 2: The asperity contact stiffness, oil film stiffness, and gear tooth stiffness are calculated.
Step 3: Based on the different types of cracks, the integrated TVMS with cracks under the dynamic meshing condition is obtained.

3. Parameter Analysis

Due to the effects of cyclic stress, impact load, tooth surface contact load, etc., the fatigue crack often occurs at the tooth root or tooth surface, which further affects the I-TVMS and dynamic characteristics of the gear. In this section, to assess the effect of key parameters on the integrated time-varying meshing stiffness with tooth crack, the parametric analysis with the crack parameters (crack propagation path, crack depth, crack location, and crack angle), tooth surface morphology, torque, and module are carried out based on the presented method, respectively (unless otherwise stipulated herein, the crack depth is set to 40%, and the position of the tooth root crack and tooth surface crack are set to 25% and 20%, respectively).
Unless otherwise stated, the following parameter studies use the same baseline gear pair and operating assumptions, so that the influences of the crack geometry, tooth surface topography, torque, and module can be compared consistently.

3.1. The Effect of Crack Propagation Path on I-TVMS

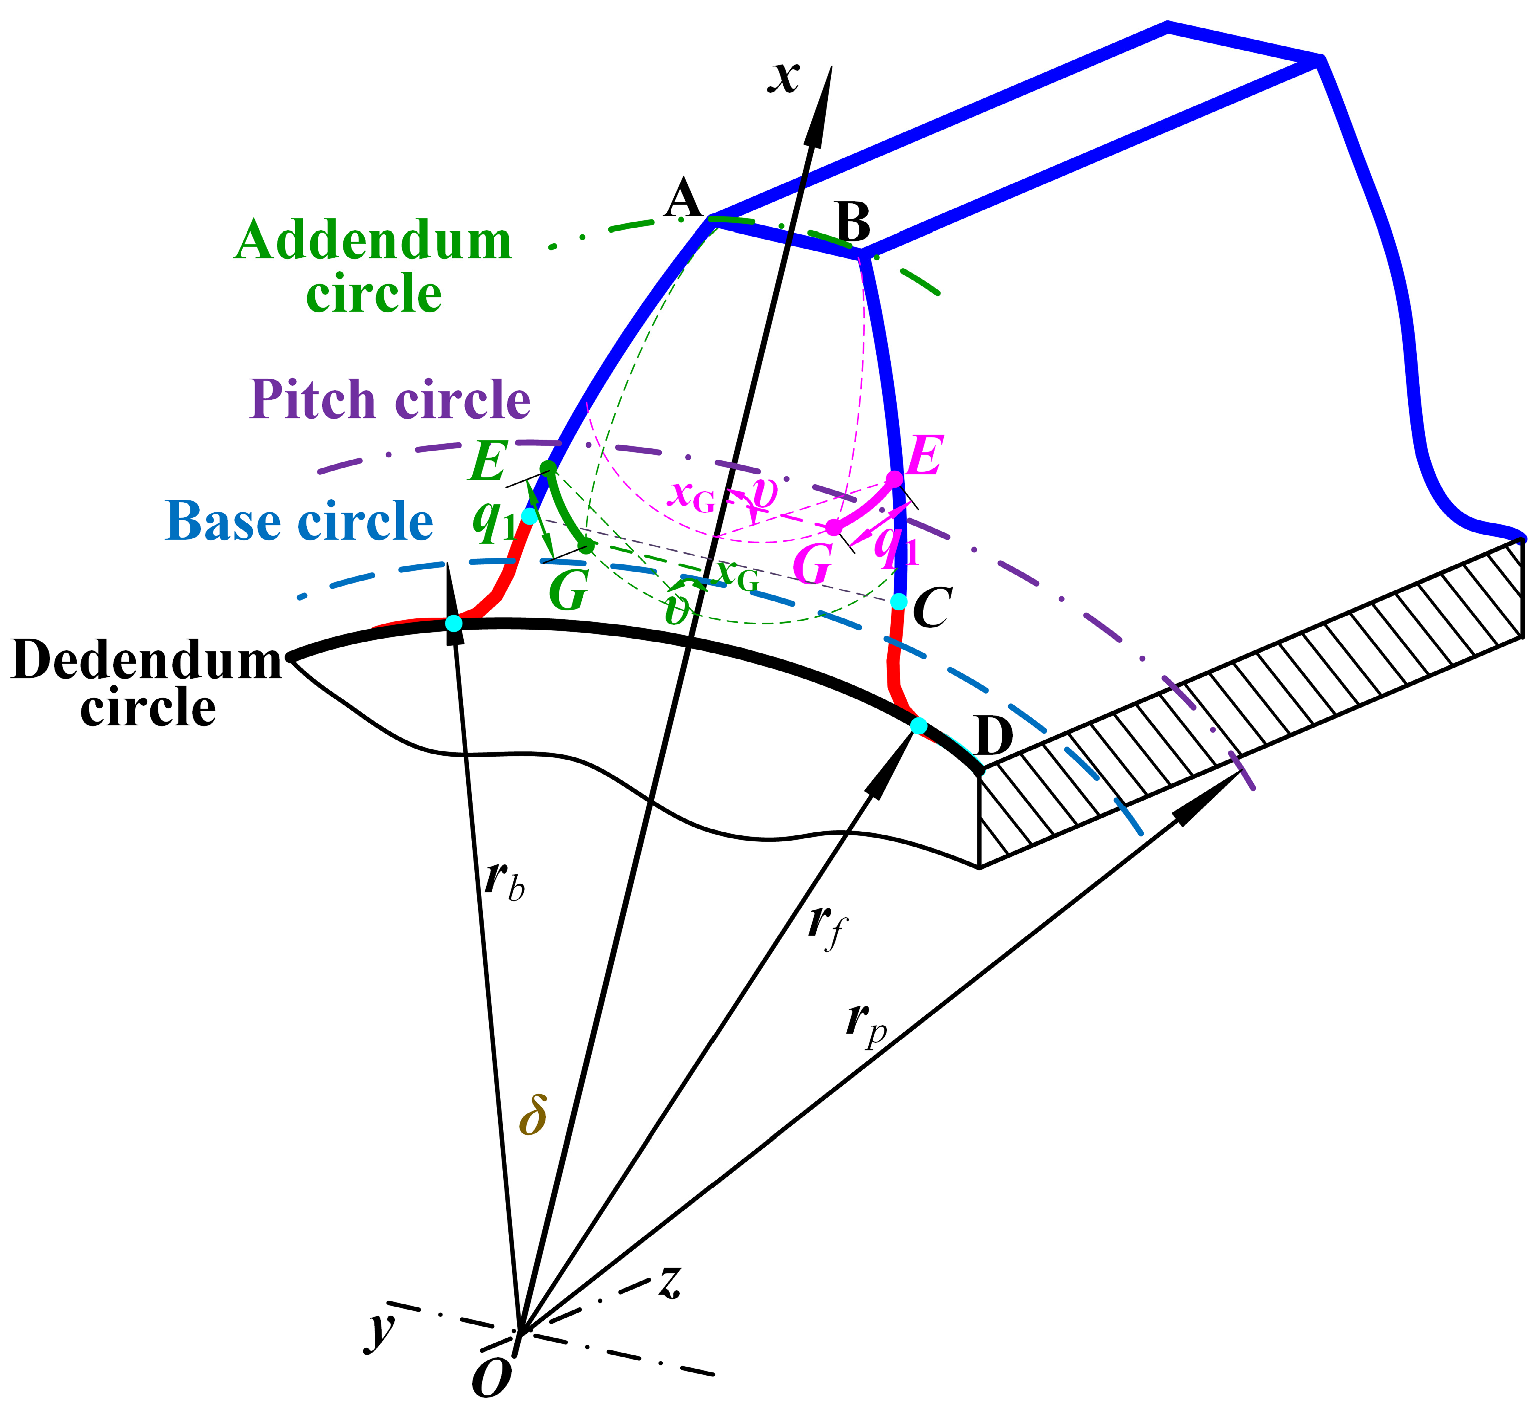
In the published research, the crack propagation path is often equivalent to a straight line. However, Yu [17] used the parabola to simulate the crack and calculated the corresponding TVMS. Moreover, Mukherjee [34] selected the parabola as the crack limit line between the crack endpoint G and the tooth profile top B. Hence, the parabola will be applied to simulate the crack propagation path on the tooth surface and the limit line for the reduction in tooth thickness in the following research, which are displayed in Figure 9.
(1) Case1: The crack endpoint projection is located below the evolvent, namely, xG > xC (see Figure 9); the effective I and A is expressed as follows:
I x 1 = 1 12 y 1 + y G + y B y G ( x B x G ) 2 ( x 1 x G ) 2 3 L 2 3 y 1 3 L , ,                 A x 1 = y 1 + y G + y B y G ( x B x G ) 2 ( x 1 x G ) 2 L ,                     x > x G 2 y 1 L ,                                                                                                                                   x C x < x G
I x 2 = 2 3 y 2 3 L ,           A x 2 = 2 y 2 L
(2) Case2: The crack endpoint projection is located below the transition curve, namely, xG < xC (see Figure 9); the effective I and A is rewritten as follows:
I x 1 = 1 12 y 1 + y G + y B y G ( x B x G ) 2 ( x 1 x G ) 2 3 L ,                 A x 1 = 2 y 1 L
I x 2 = 1 12 y 2 + y G + y B y G ( x B x G ) 2 ( x 2 x G ) 2 3 L 2 3 y 2 3 L ,           A x 2 = y 2 + y G + y B y G ( x B x G ) 2 ( x 2 x G ) 2 L                 x G x < x C 2 y 2 L                                                                                                                             x < x G
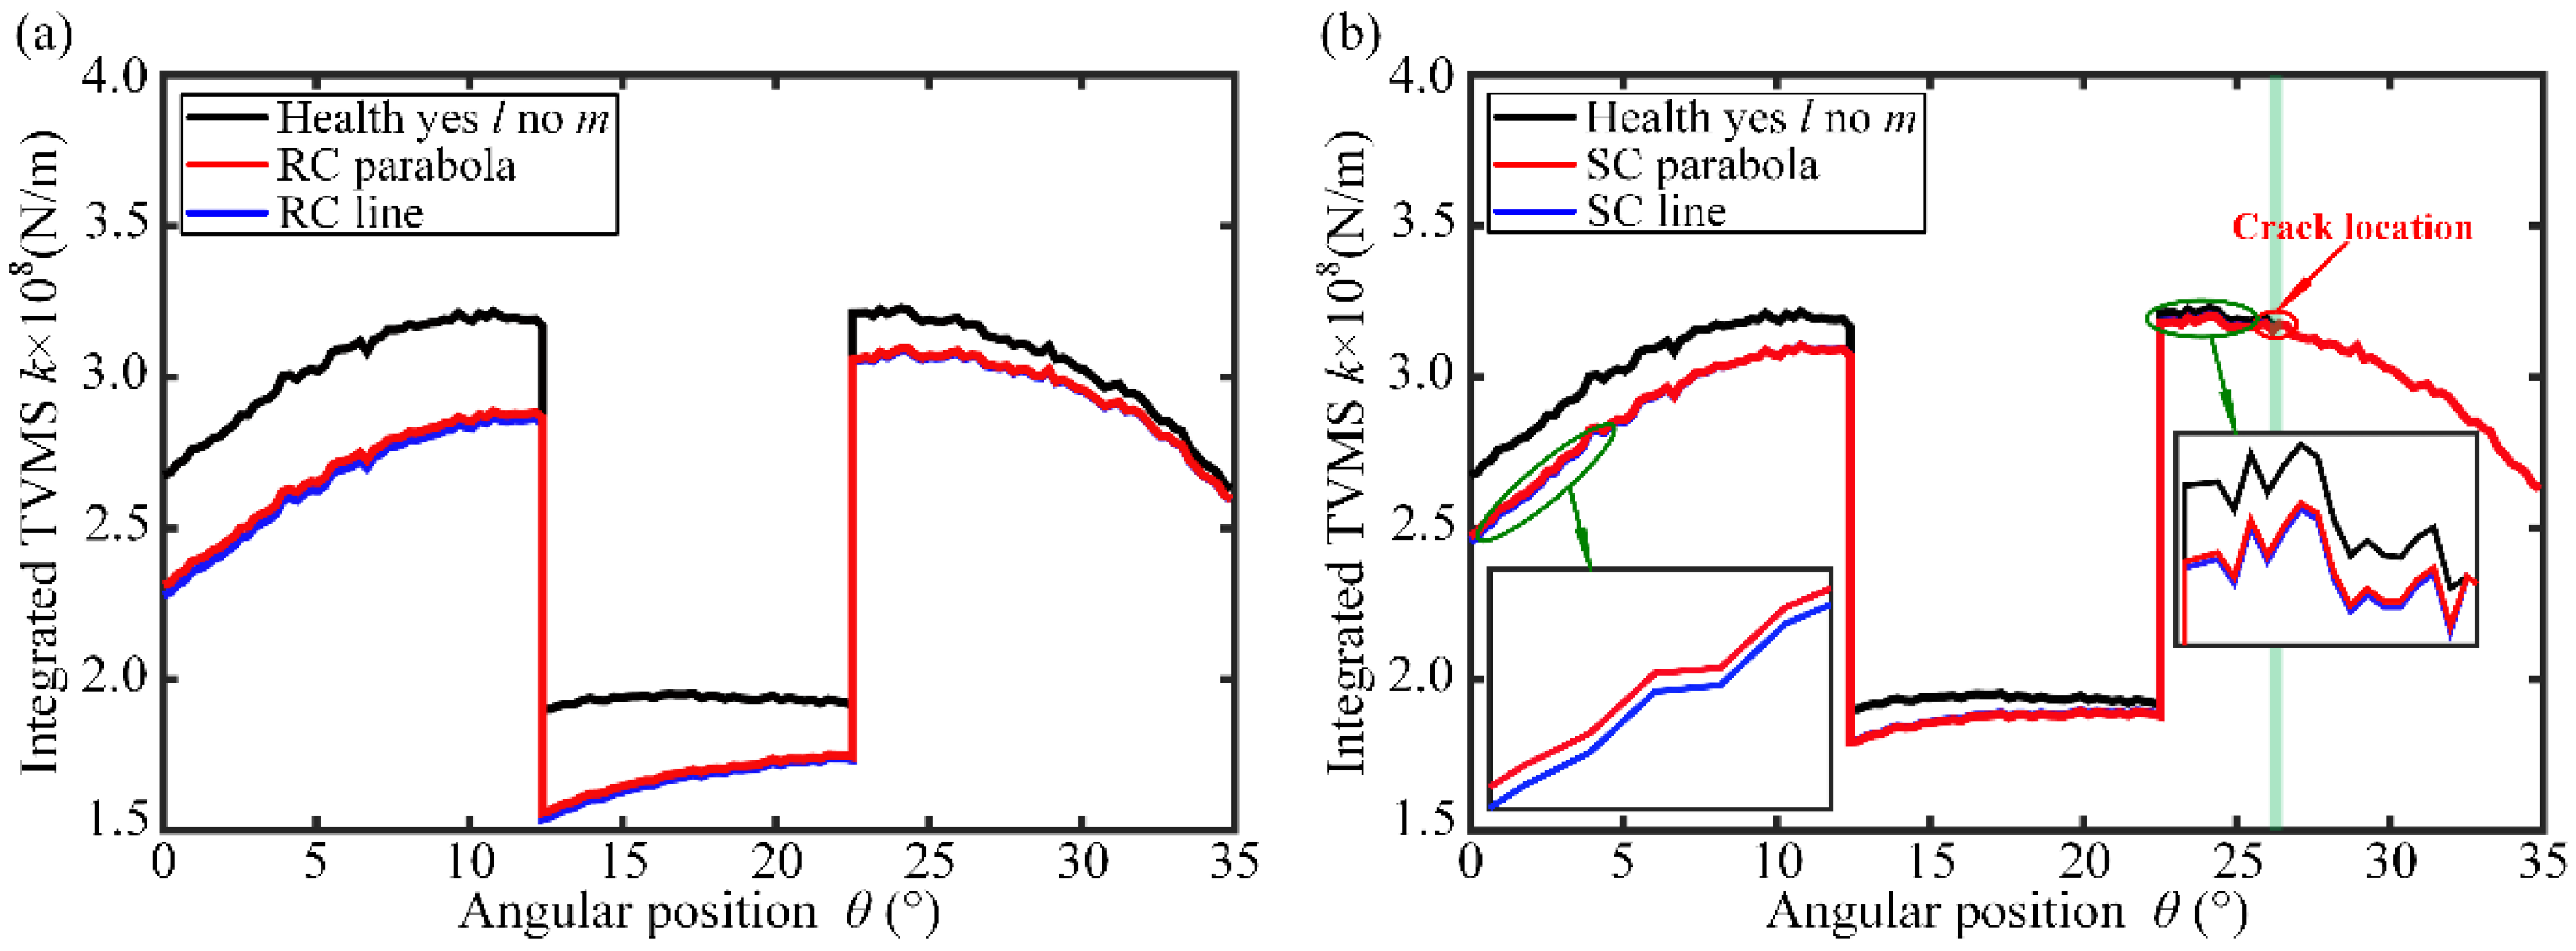
In order to compare the calculation accuracy and efficiency of the I-TVMS with a parabola and straight line, Figure 10 shows the integrated TVMS curves of tooth root crack and tooth surface crack under different crack propagation paths. It can be noted that the calculation accuracy of the I-TVMS with two approaches shows a relatively small difference, and the error gradually decreases with the meshing of gears. For tooth root crack, the maximum calculation error of the two expansion paths is approximately 1.27%, while that of the tooth surface cracks is only 0.69%. Moreover, the computational efficiency using the linear propagation path is significantly higher than that of the parabolic calculation result. Moreover, the calculation efficiencies of tooth root crack and tooth surface crack have increased by 11.52% and 9.07%, respectively.
The comparison in Figure 10 is used to validate the accuracy and efficiency of the proposed crack-path simplification against published parabolic crack-path models. The maximum calculation errors are 1.27% for the tooth root crack and 0.69% for the tooth surface crack, while the calculation efficiencies are improved by 11.52% and 9.07%, respectively.

3.2. The Effect of Crack Depth on I-TVMS

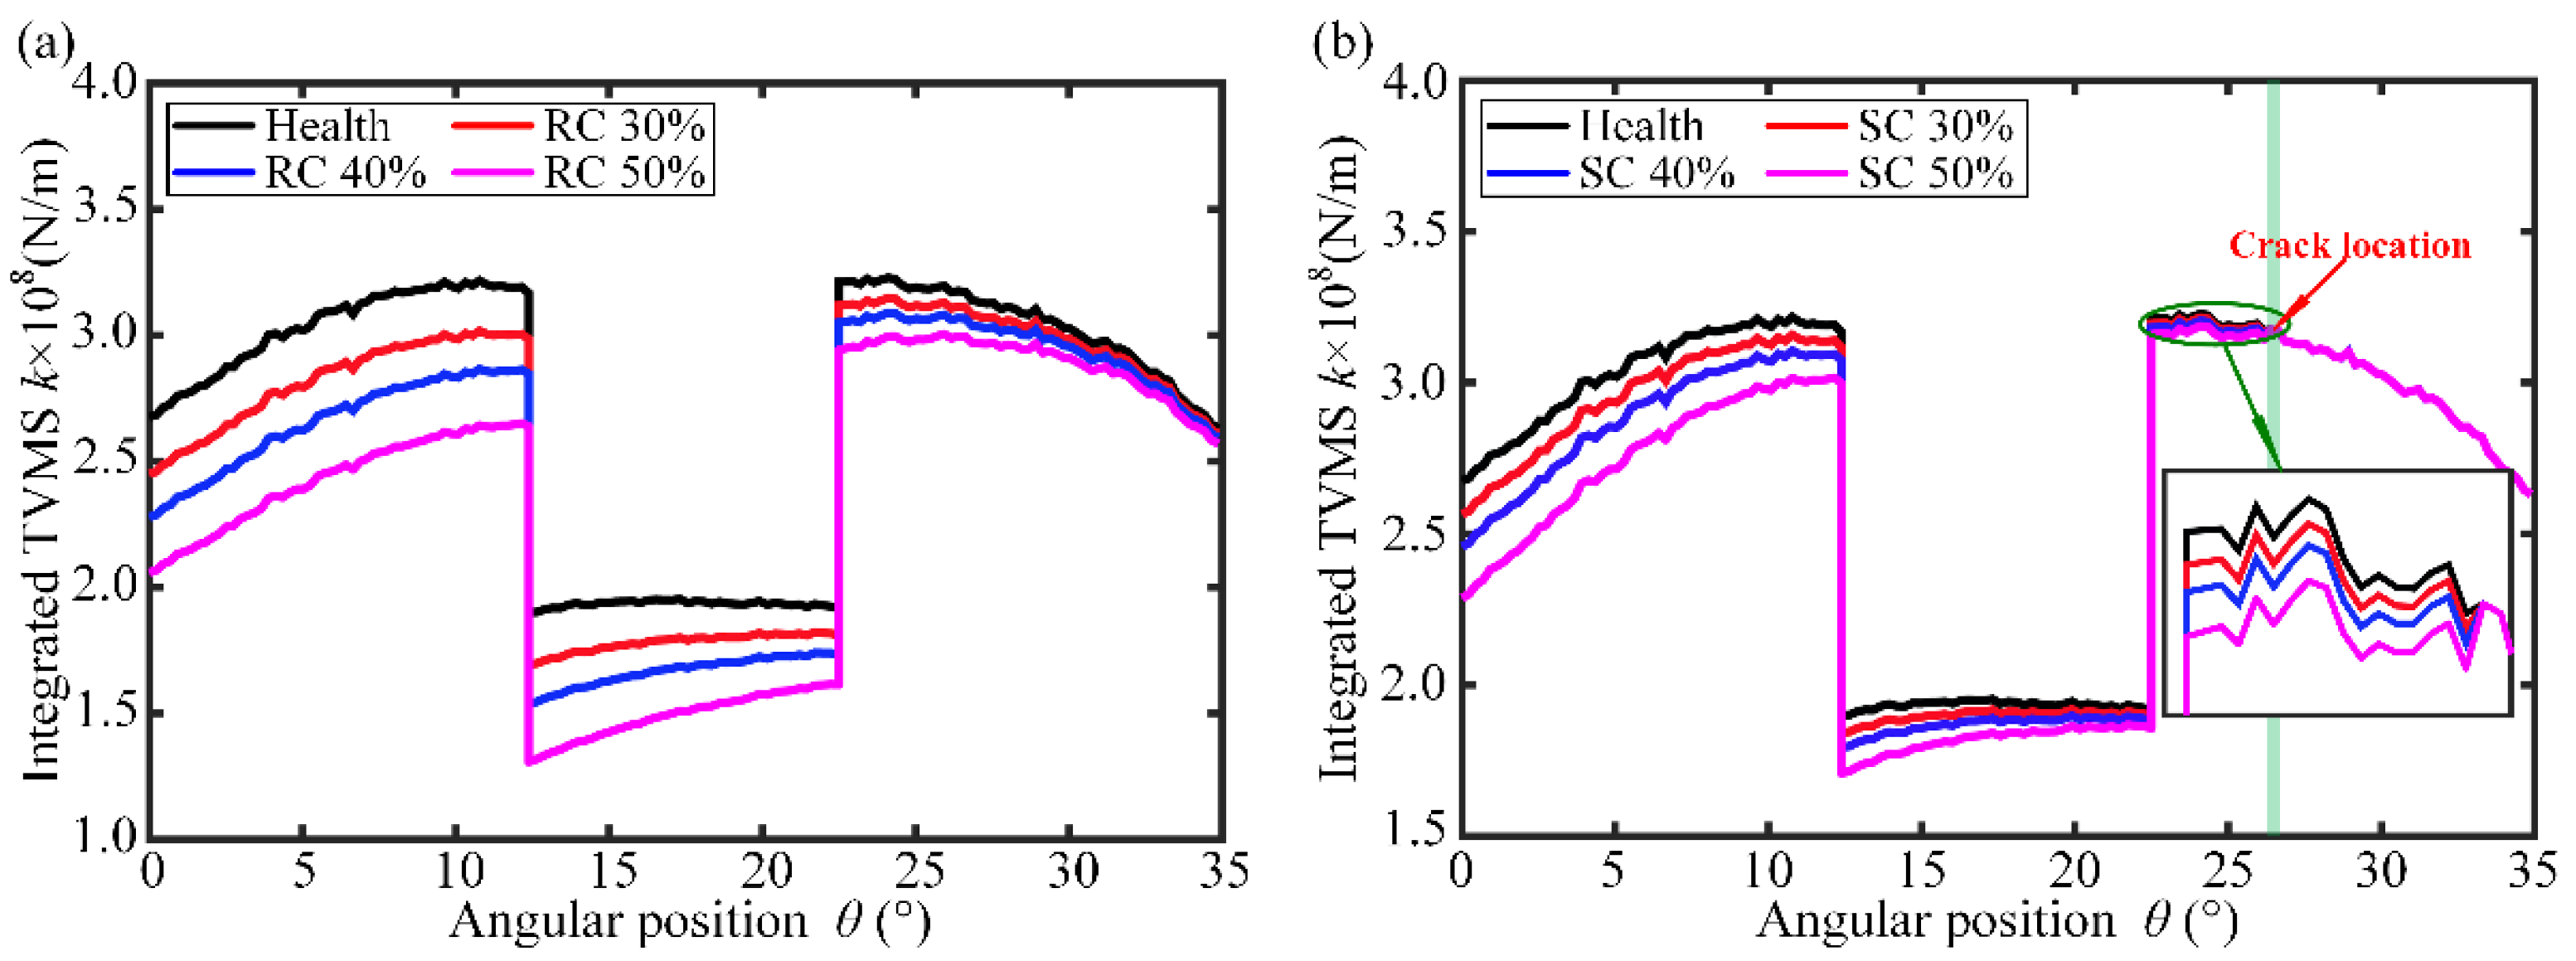
With the increase in the number of gear meshing cycles, the crack depth gradually intensifies, which directly affects the trend of the I-TVMS. To research the effect of the crack depth on the I-TVMS, three cases of crack depth are researched—γ = 30%, 40%, and 50%, respectively—and the change rules of I-TVMS are displayed in Figure 11. It can be noted from Figure 11 that the I-TVMS in the single-/double-tooth meshing region significantly decreased with the change in angle position. The main reason for this phenomenon is because the flexibility is greater as the meshing point is located at the cracked tooth top than that at the tooth profile or root of the cracked tooth, which leads to the idea that the I-TVMS of the right double-tooth region is greater than that of the left double-tooth region. In addition, as the crack depth gradually intensifies, the attenuation amount and attenuation rate of the I-TVMS gradually increase. By comparing the computed results in Figure 11a, when the crack depth is further increased from γ = 30% to γ = 50%, the maximum reduction in the integrated TVMS of the cracked teeth decreases from 8.46% to 23.08% compared with that of the healthy tooth. The reason for this phenomenon is that the bending stiffness and shear stiffness decrease significantly with the increasing crack depth. Meanwhile, it is noted that the tooth surface topography will cause an overall fluctuation of the I-TVMS curve. From Figure 11b, one can see that, as the meshing point is located between the crack and the tooth root, the I-TVMS remains unchanged. However, the I-TVMS significantly decreases and undergoes a sudden change at the crack location when the meshing point is in the region between the crack and the tooth top. Therefore, the reduction in the I-TVMS increases with increasing crack depth, which indicates that the crack depth has a significant impact on the I-TVMS. Moreover, the reduction ratios of I-TVMS under different crack depths are listed in Table 2.

3.3. The Effect of Crack Location on I-TVMS

Due to the complex working environment and the meshing impact of gears, the crack occurs at different positions of the tooth, which has different degrees of influence on the I-TVMS. To investigate the impact of the crack location on the I-TVMS, the values of the crack location are set as follows: l = 25% (RC), l = 20% (SC), l = 40% (SC), and l = 60% (SC). For the root crack, l = 0% means that the crack starting point is at the beginning of the transition curve, and l = 100% means that the crack starting point is at the end of the transition curve; for tooth surface cracks, l = 0% means that the crack start point is at the involute start point, and l = 100% means that the crack start point is at the involute endpoint; and the crack depth is 40% and remains unchanged. From Figure 12, one can note that the crack location presents a significant impact on the meshing characteristics. The I-TVMS of the cracked tooth is significantly lower than that of the healthy tooth during one meshing cycle, and the stiffness value of the left double-tooth meshing zone is significantly lower than that of the right zone. Beyond that, as the crack position shifts from the tooth root to the tooth top, the influence of the crack location on the I-TVMS weakens, and the obvious jumping occurs at the crack position. The reason for this phenomenon is that the crack has no effect on the I-TVMS as the meshing point is located between the crack and the tooth root region. This is because, the closer the crack is to the tooth top, the larger the meshing zone without the effect by the crack, and the smaller the weakening effect on the I-TVMS will be. To more clearly illustrate the change rule of the I-TVMS, Table 3 presents the corresponding changes. For the sensitivity summary in Table 4, additional endpoint cases from the same crack-location parameter sweep were used, namely, l = 20% to 40% for the tooth-root crack and l = 15% to 60% for the tooth surface crack.
In Section 3.3, l denotes the normalized crack location along the corresponding crack region. It is distinct from the contact length l in Figure 2 and from the legend abbreviation “l” used for lubrication in Figure 6.
Figure 12 is used to evaluate the influence of the crack location when the crack depth is fixed at γ = 40%. The influence of different crack-depth values is presented separately in Figure 11 and Table 2.
Figure 11 and Figure 12 present the continuous variation trends of the I-TVMS, whereas Table 2 and Table 3 summarize the maximum reduction ratios for the quantitative comparison. Therefore, the tables are retained as numerical summaries rather than duplicated information.

3.4. The Effect of Crack Angle on I-TVMS

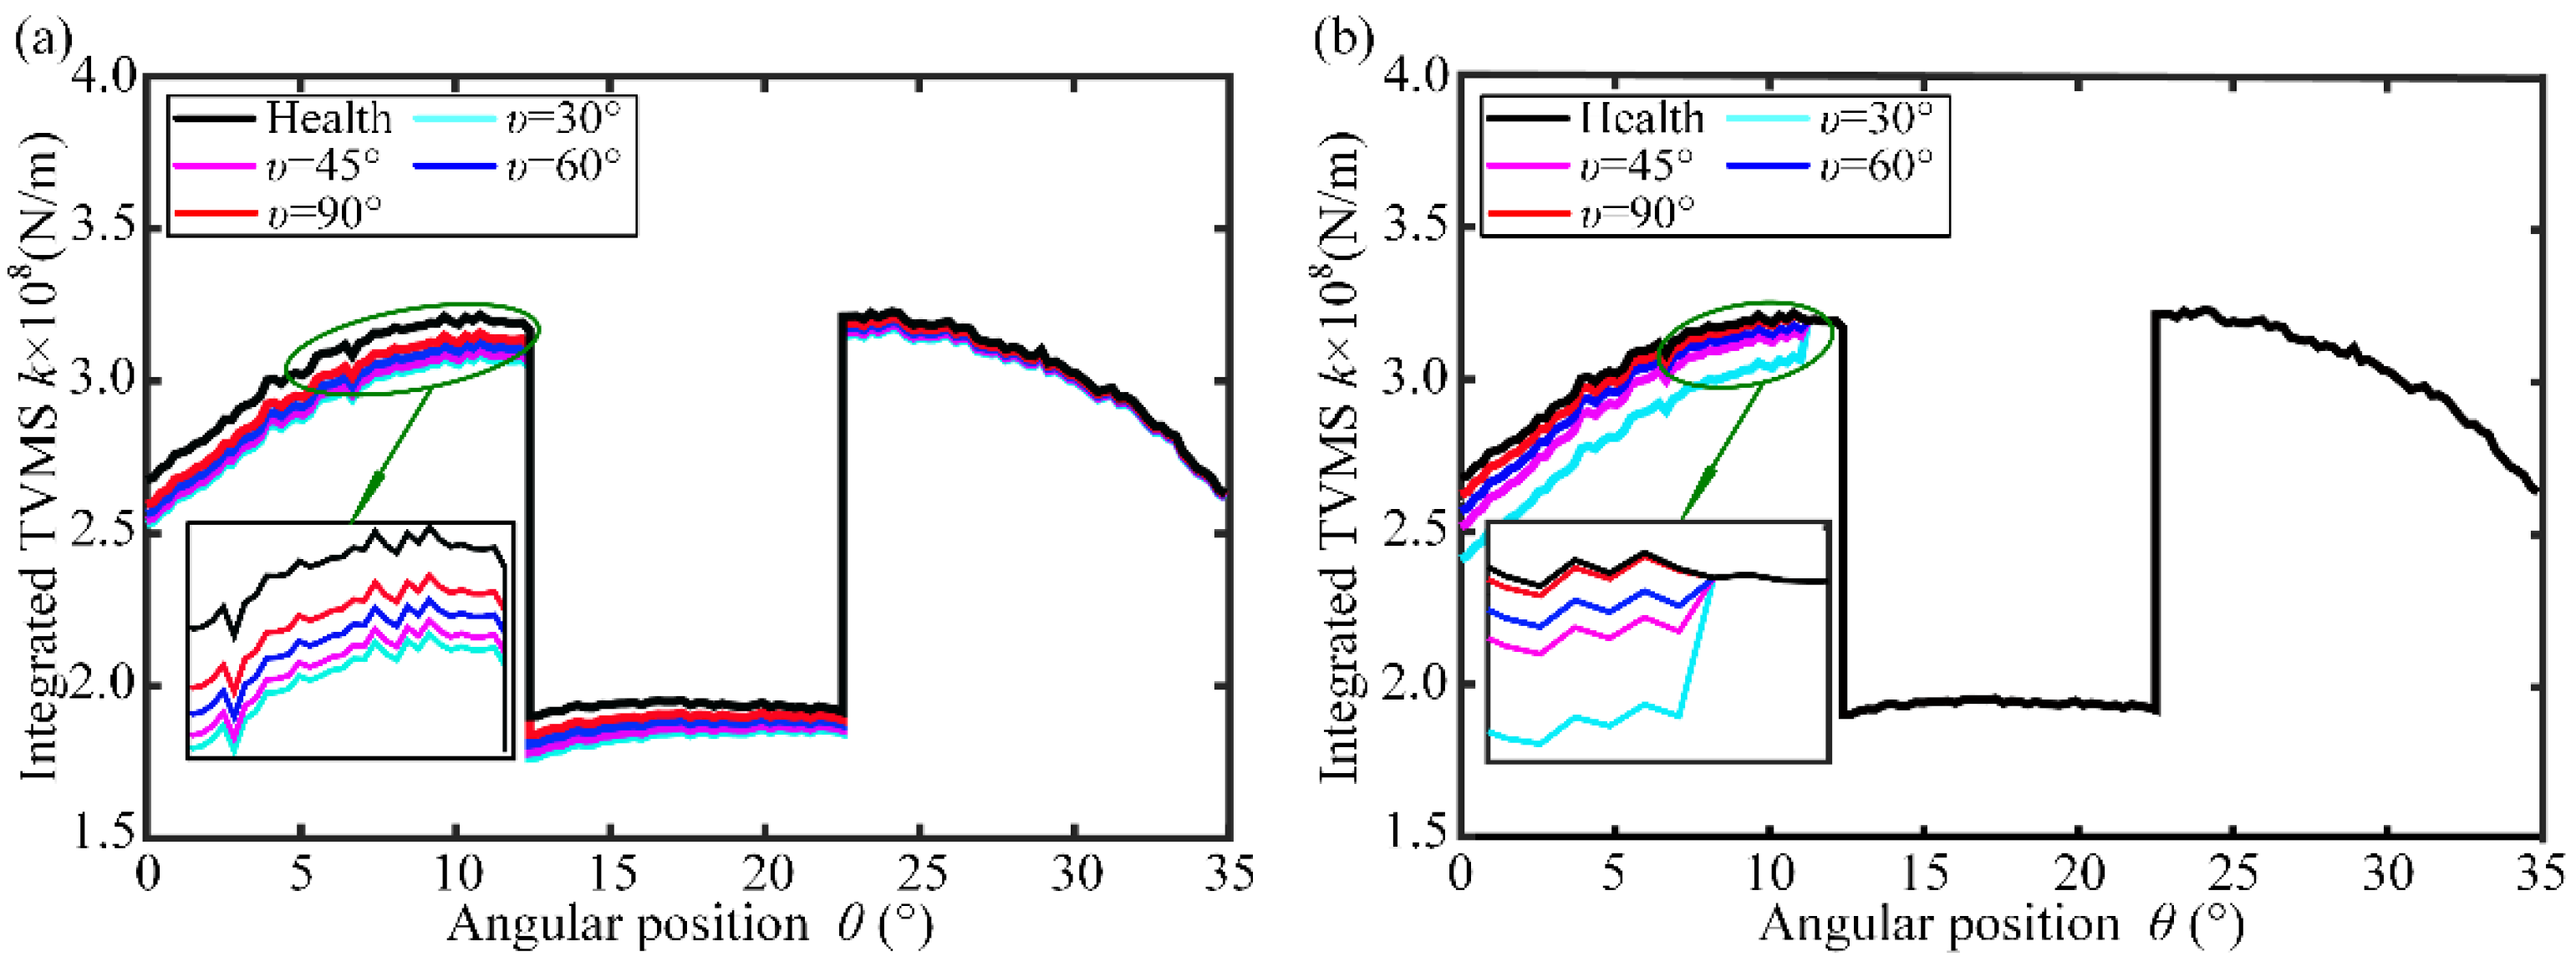
Keeping the depth of the crack unchanged, the increasing crack extension angle will reduce the actual length of the crack, which weakens the effect of the crack on the integrated time-varying meshing stiffness. To examine how the crack angle affects the I-TVMS, Figure 13 and Table 4 present the corresponding results of the I-TVMS with different crack angles, namely, υ = 30°, 45°, 60°, and 90°. From Figure 13a, one can see that the I-TVMS value will always be influenced by the tooth root crack, but the attenuation of the meshing stiffness decreases as the crack angle increases. Compared with tooth root crack, the I-TVMS of the tooth surface crack exhibits different change trends. Namely, the meshing stiffness undergoes a sudden change at the tooth surface cracks, and the attenuation gradually decreases as the crack angle is increased. As a result, the I-TVMS increases as the crack angle increases. As the meshing point is near the cracked tooth top, the stiffness attenuation of the tooth surface crack is larger than that of the tooth root crack.

3.5. The Effect of Tooth Surface Morphology on I-TVMS

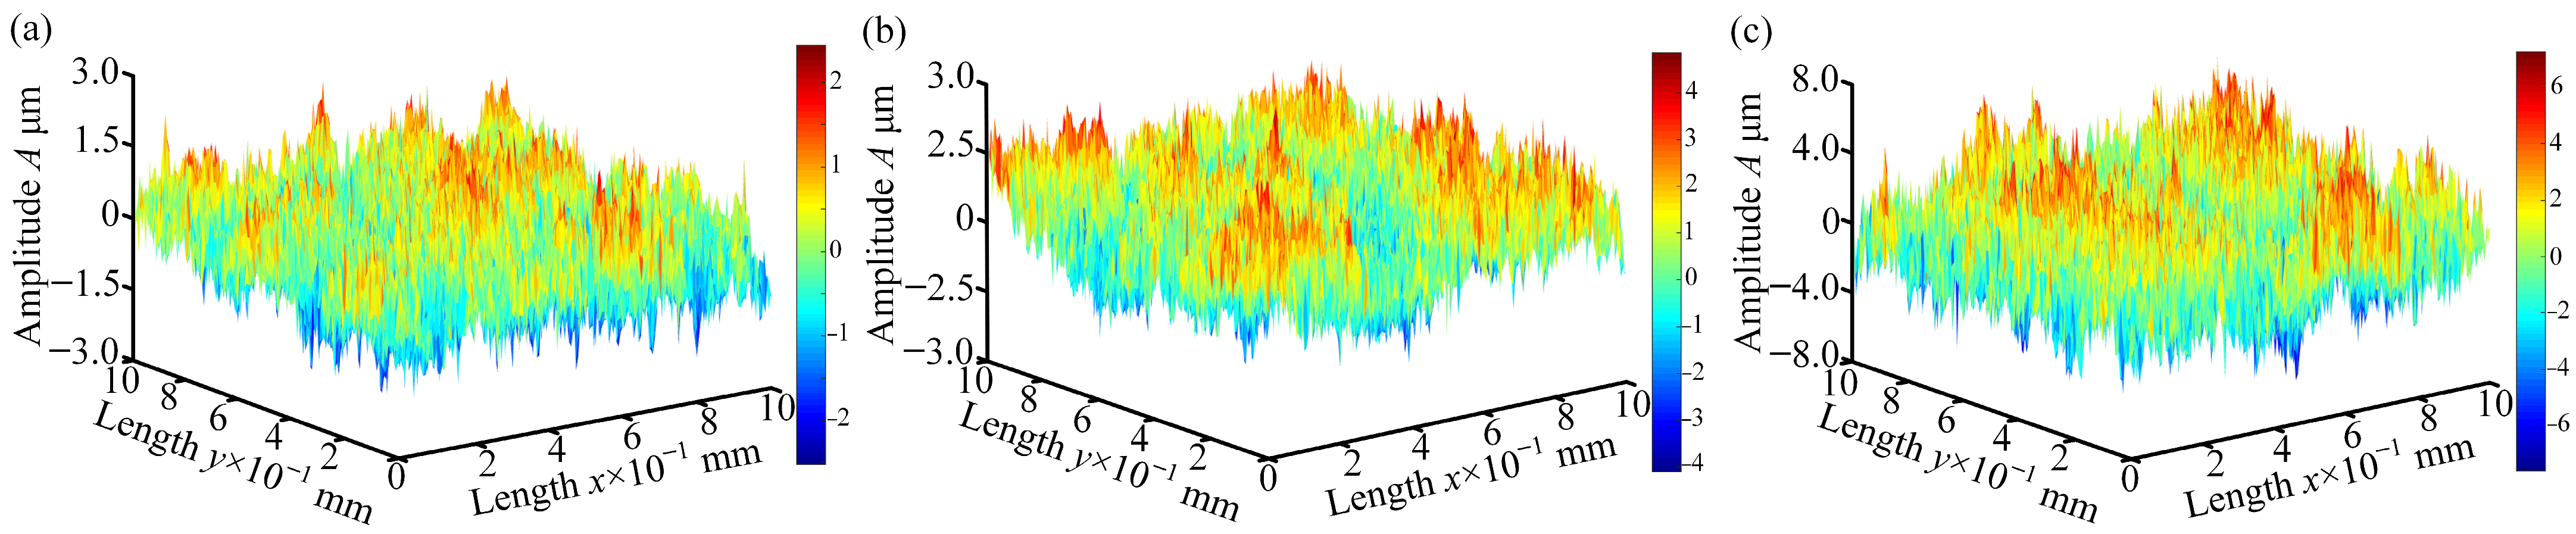
The surface morphology, as a key evaluation indicator for the gear surface quality, has an important impact on the lubrication and meshing features of the gear transmission system. However, there are few studies on the effect of the tooth surface morphology on the integrated time-varying meshing stiffness with cracks. Hence, to better investigate the influence of the tooth surface morphology on the I-TVMS, the tooth surface morphology of the cracked tooth with G = 1 × 10⁻⁴, G = 2 × 10⁻⁴, and G = 4 × 10⁻⁴ is displayed by a W–M fractal function in Figure 14. It can be noticed that the asperity gradually increases as the G increases, which further leads to the tooth surface becoming rougher.
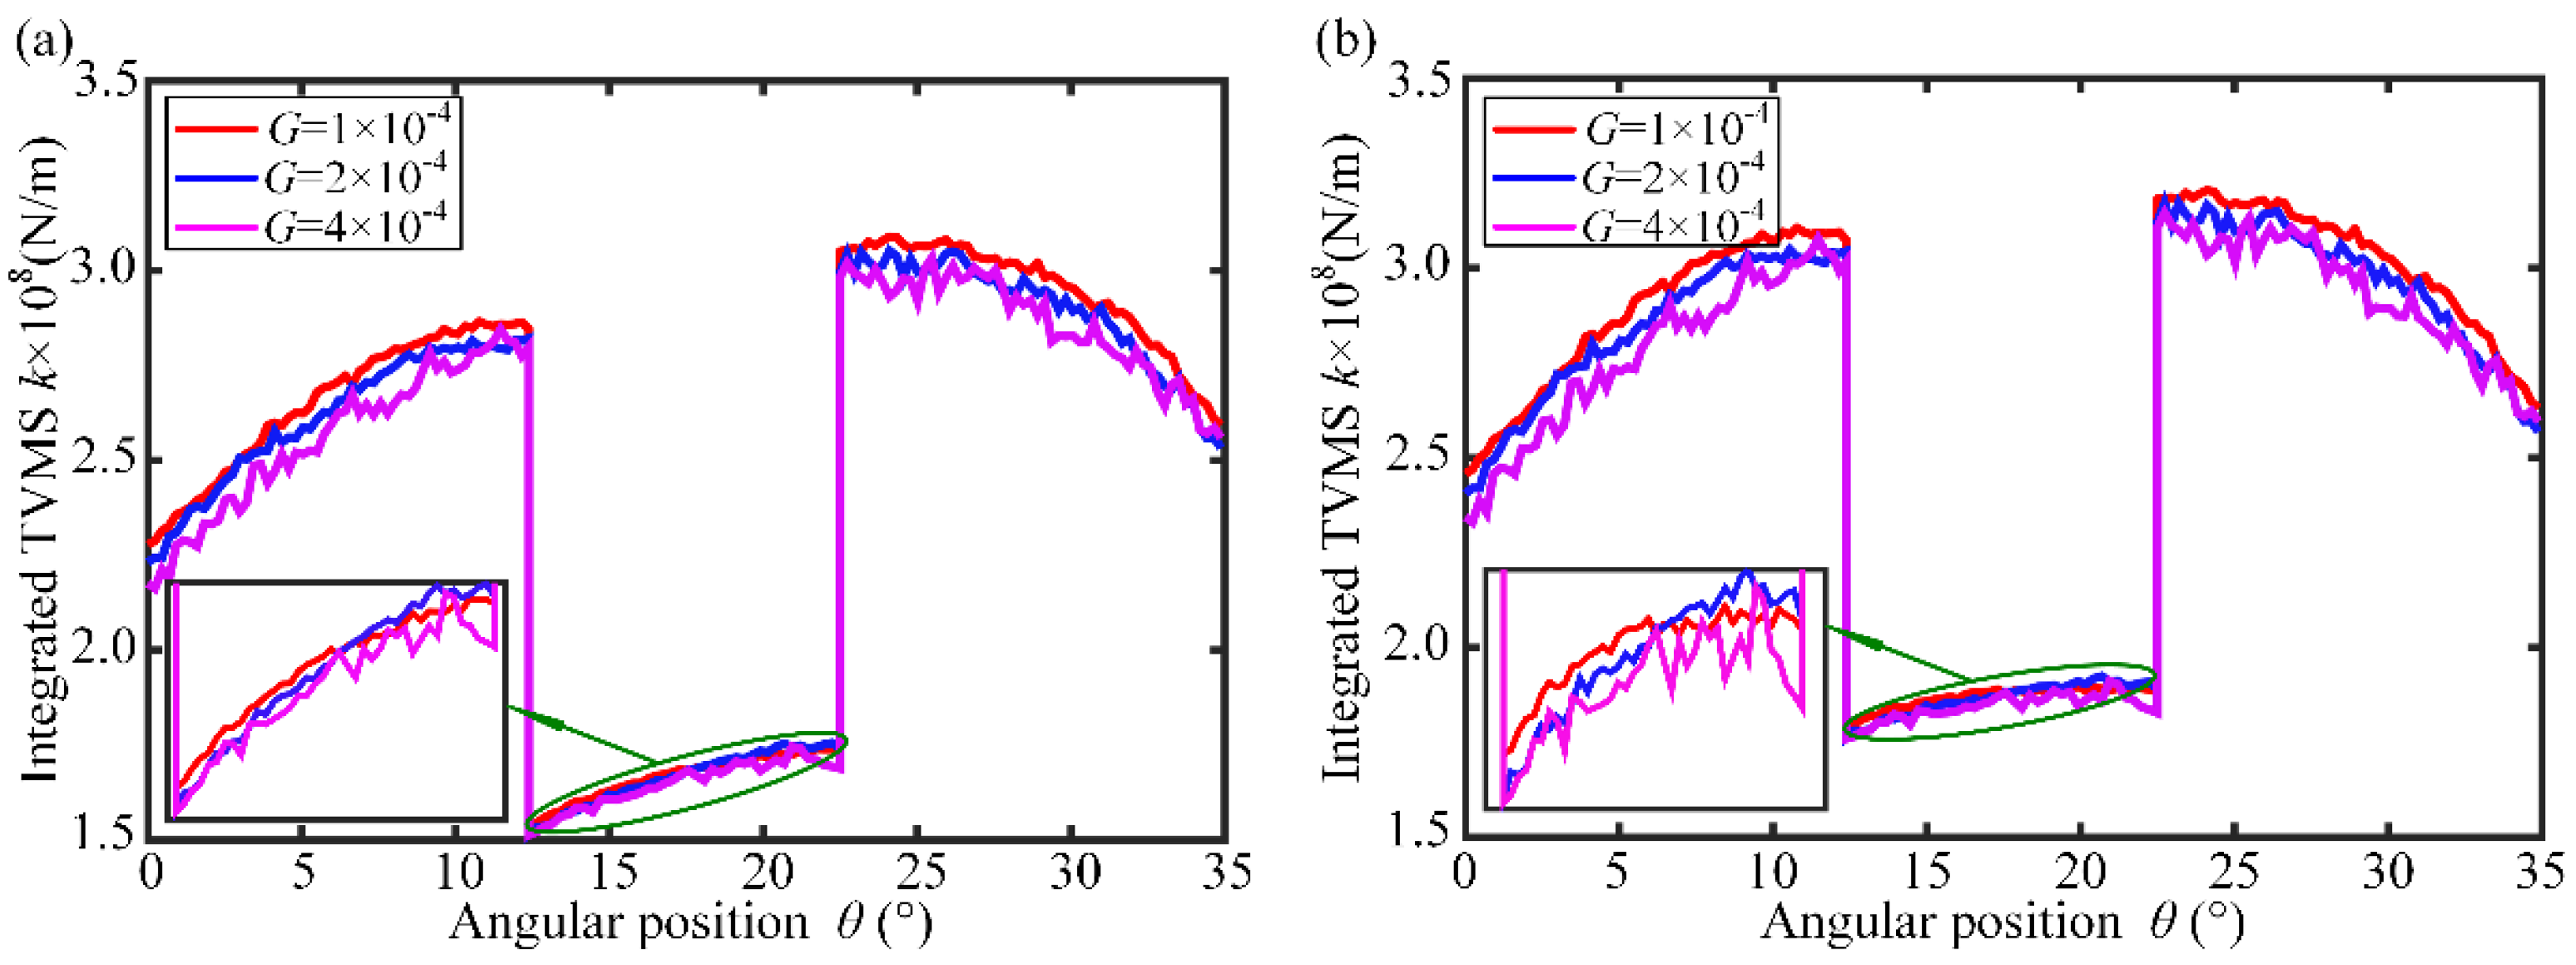
Keeping all the other parameters unchanged, the G increases gradually from 1 × 10⁻⁴ to 4 × 10⁻⁴. In Figure 15, the results reveal that the I-TVMS in the single-/double-tooth meshing zones decreases, and the fluctuation of the stiffness curve is gradually intensified with an increasing G. The main reason is that the actual contact area is much smaller than the theoretical contact area due to tooth-surface asperities, which decreases the contact stiffness and further reduces the I-TVMS. Moreover, the influence of the G on the I-TVMS in the double-tooth meshing region is greater than that in the single-tooth meshing region.
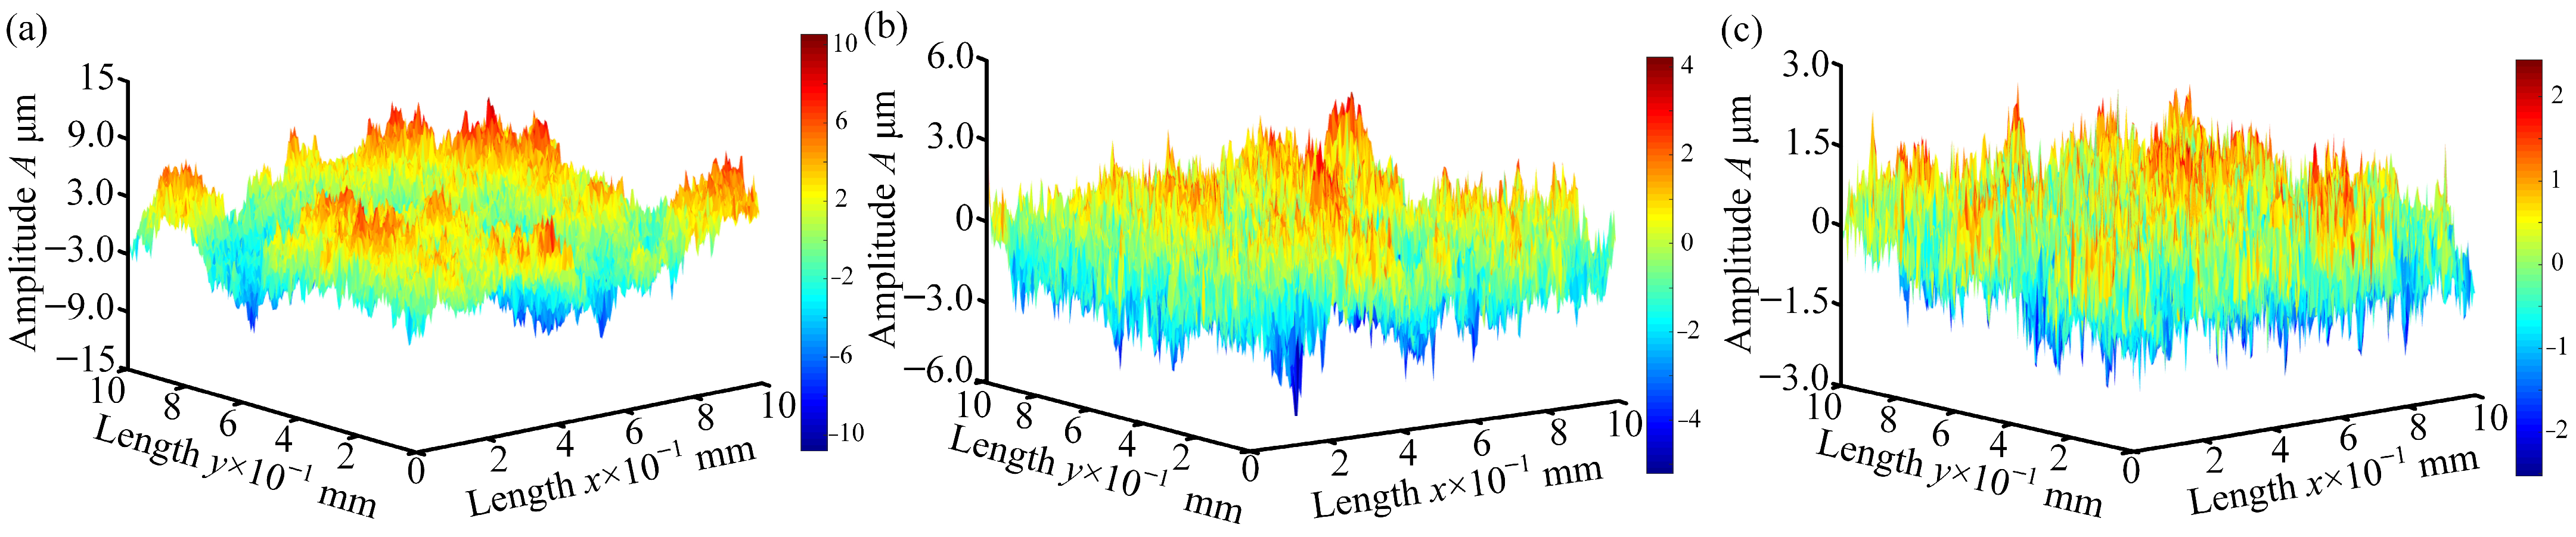
The fractal dimension D directly affects the asperity distribution of the tooth surface. To investigate the influence of parameter D on the I-TVMS, Figure 16 displays the different tooth surface morphology of various D = 2.6, 2.7, and 2.8, firstly. It is obvious that the fractal dimension D is more sensitive when it comes to the peak distribution. Namely, the peak density increases and the gear surface become smooth with the increasing D.
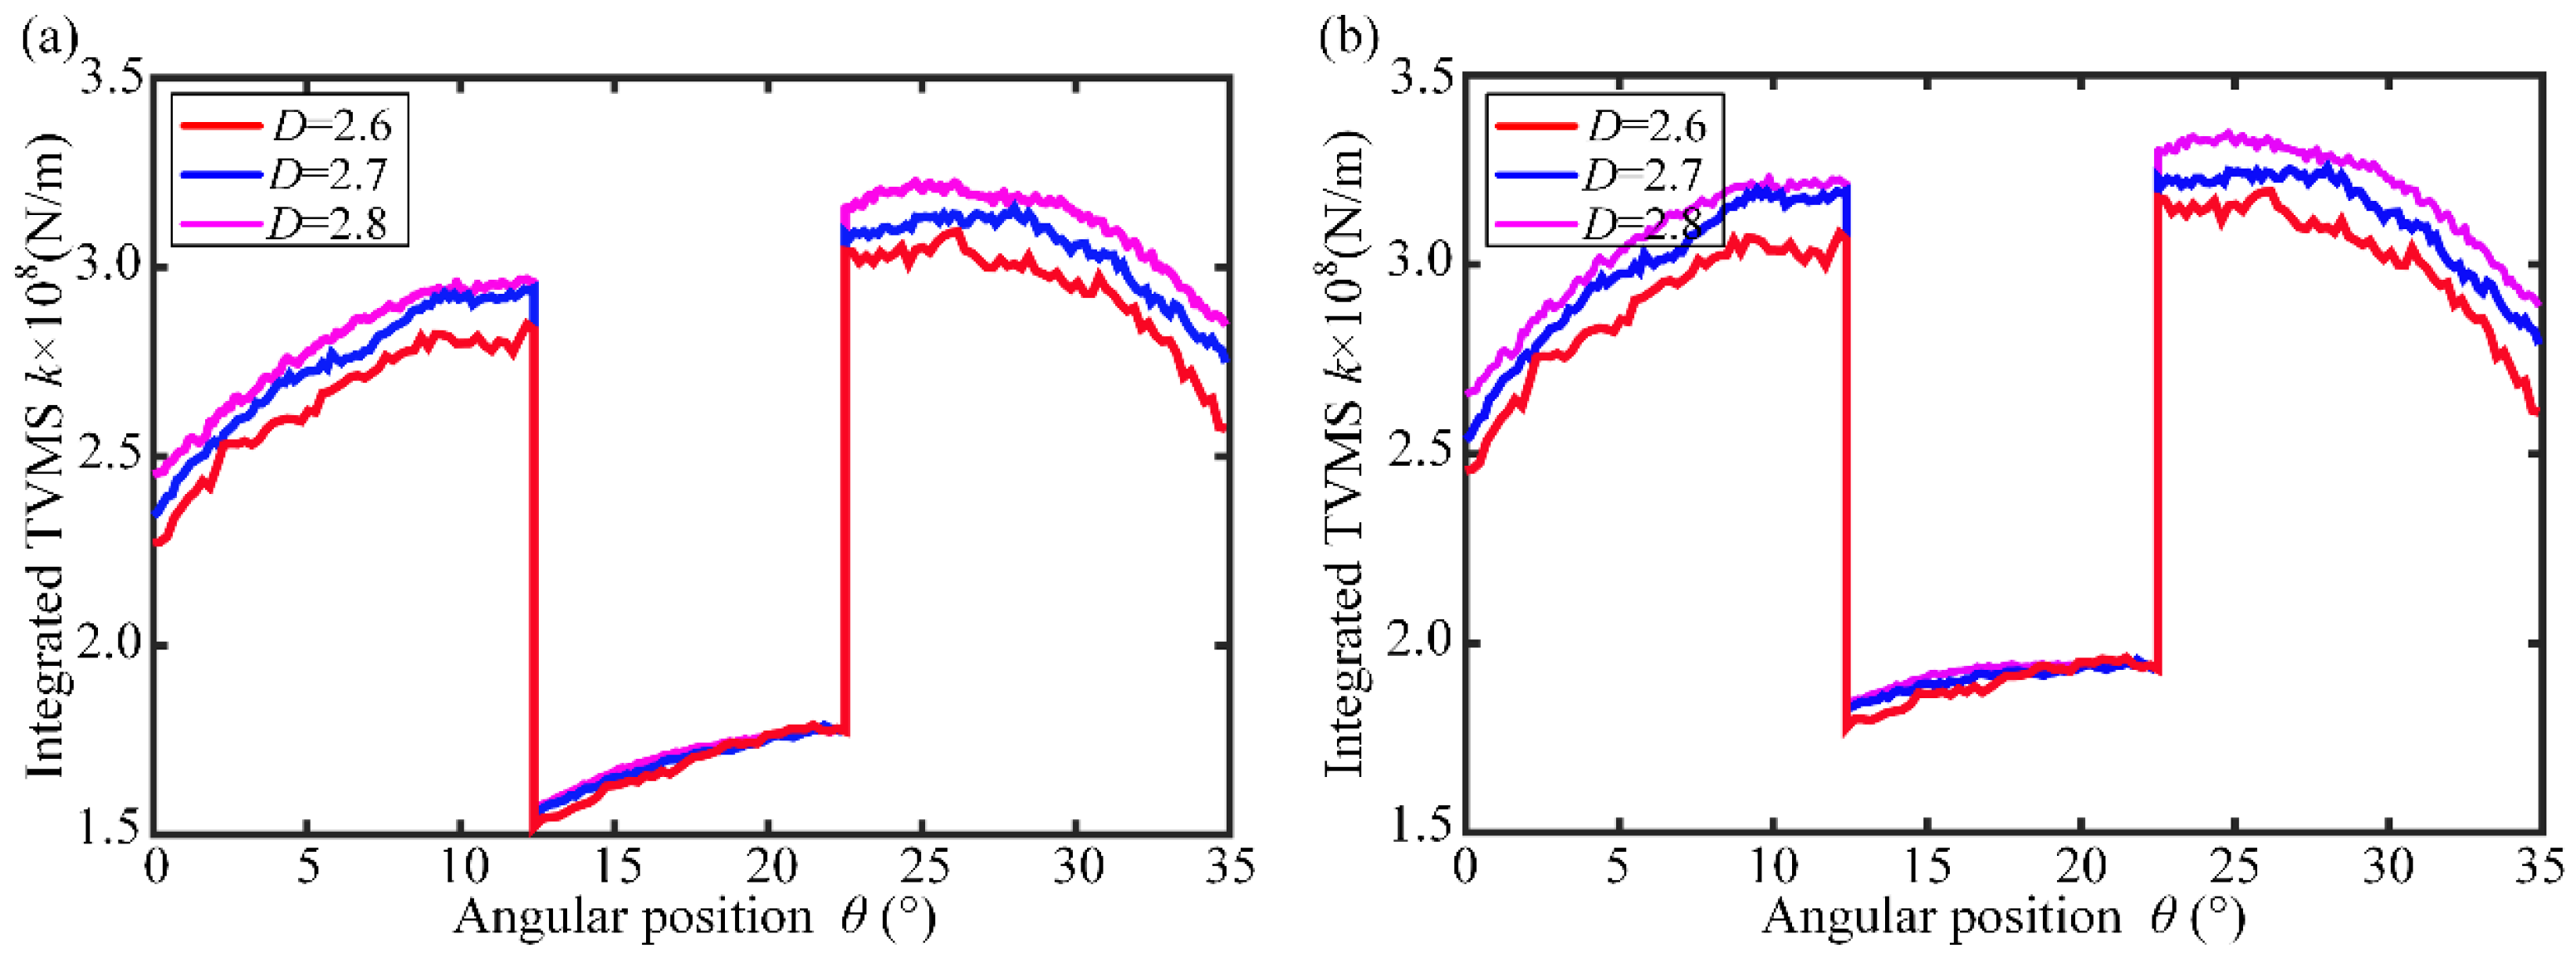
The effect of parameter D on the I-TVMS will be assessed in this subsection. As illustrated in Figure 17, the I-TVMS value alternately changes with the increase in D, especially in the single-tooth meshing zone. In the double-tooth meshing zone, it is noted that the increasing D could increase the I-TVMS. Moreover, the fluctuation of the stiffness is intensified with the increase in D. It can be concluded that, the rougher the gear surface is, the less fluctuation the I-TVMS value has. As for the tooth root crack and tooth surface crack, it is seen that the trend of the integrated TVMS is similar at the first glance.

3.6. The Effect of Torque on I-TVMS

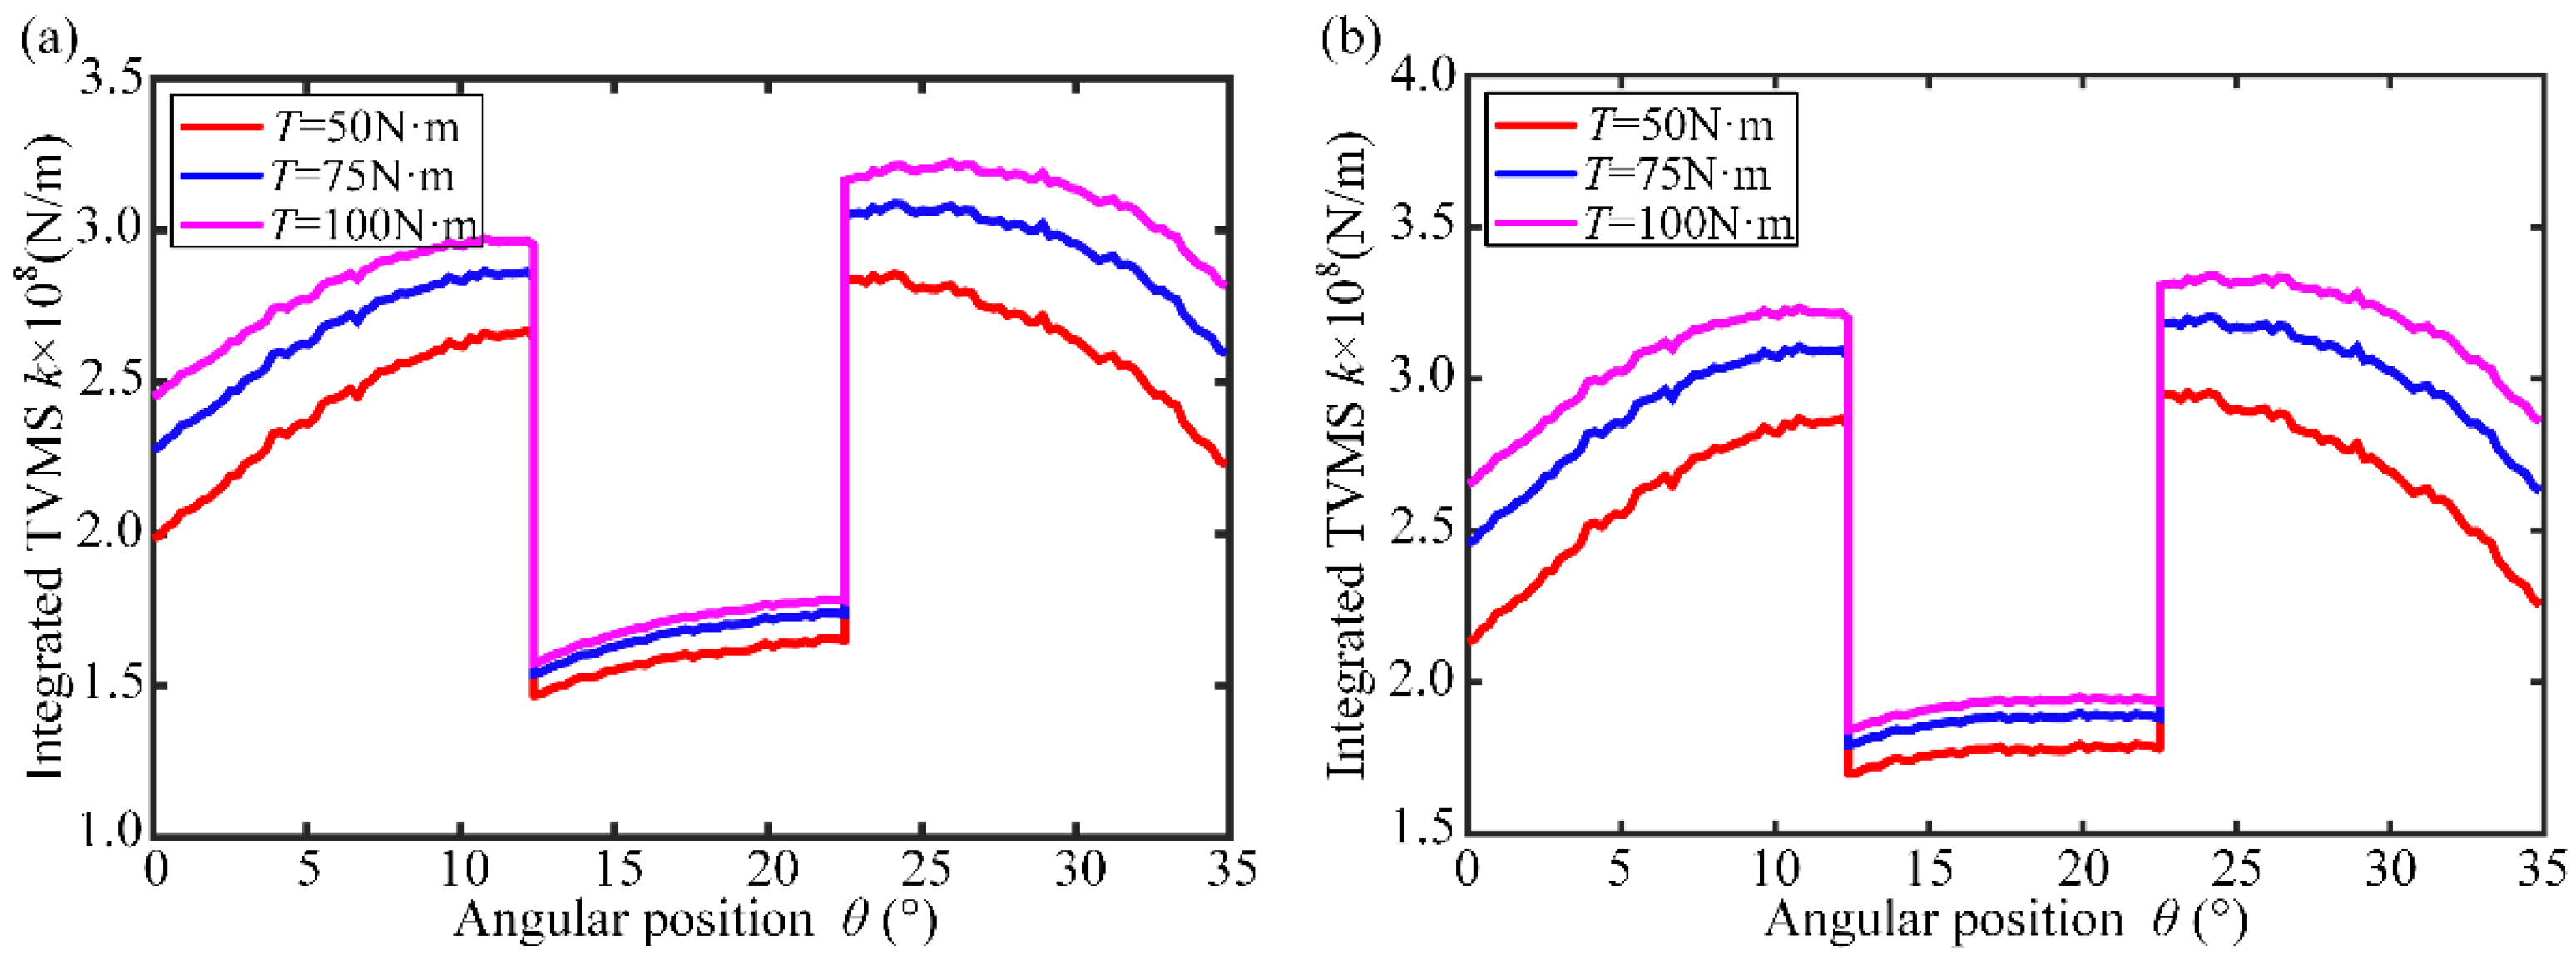
The influences of various torques on the I-TVMS are researched and compared with a gradual increase from 50N·m to 100N·m. It is noted from Figure 18 that the effect of the torque on the integrated TVMS is more obvious than the foregoing parameters; namely, the I-TVMS changes within progressively larger ranges with the increasing load on the cracked tooth, but the fluctuation has significantly decreased. This is mainly because the increasing torque directly leads to an increase in the tooth surface contact pressure and area, and further increases the contact stiffness. Although the variation tendency of the I-TVMS in the single-/double-tooth meshing region is the same, the influence in the double-tooth meshing region is significantly greater than that in the single-tooth meshing region. Moreover, note that the torque has different degrees of influence on the tooth root crack stiffness and tooth surface crack stiffness. The tooth root crack is frequently in an open state during the meshing process, and the deformation of the tooth root crack increases as the torque is increased, which leads to an increase in the bending stiffness and the I-TVMS. For tooth surface crack, it does not play a role throughout the entire meshing process, which is only in the open state as the meshing point is located between the tooth top and the crack. Hence, the attenuation of the tooth surface crack stiffness is less than that of the tooth root crack stiffness under the same torque.

3.7. The Effect of Module on I-TVMS

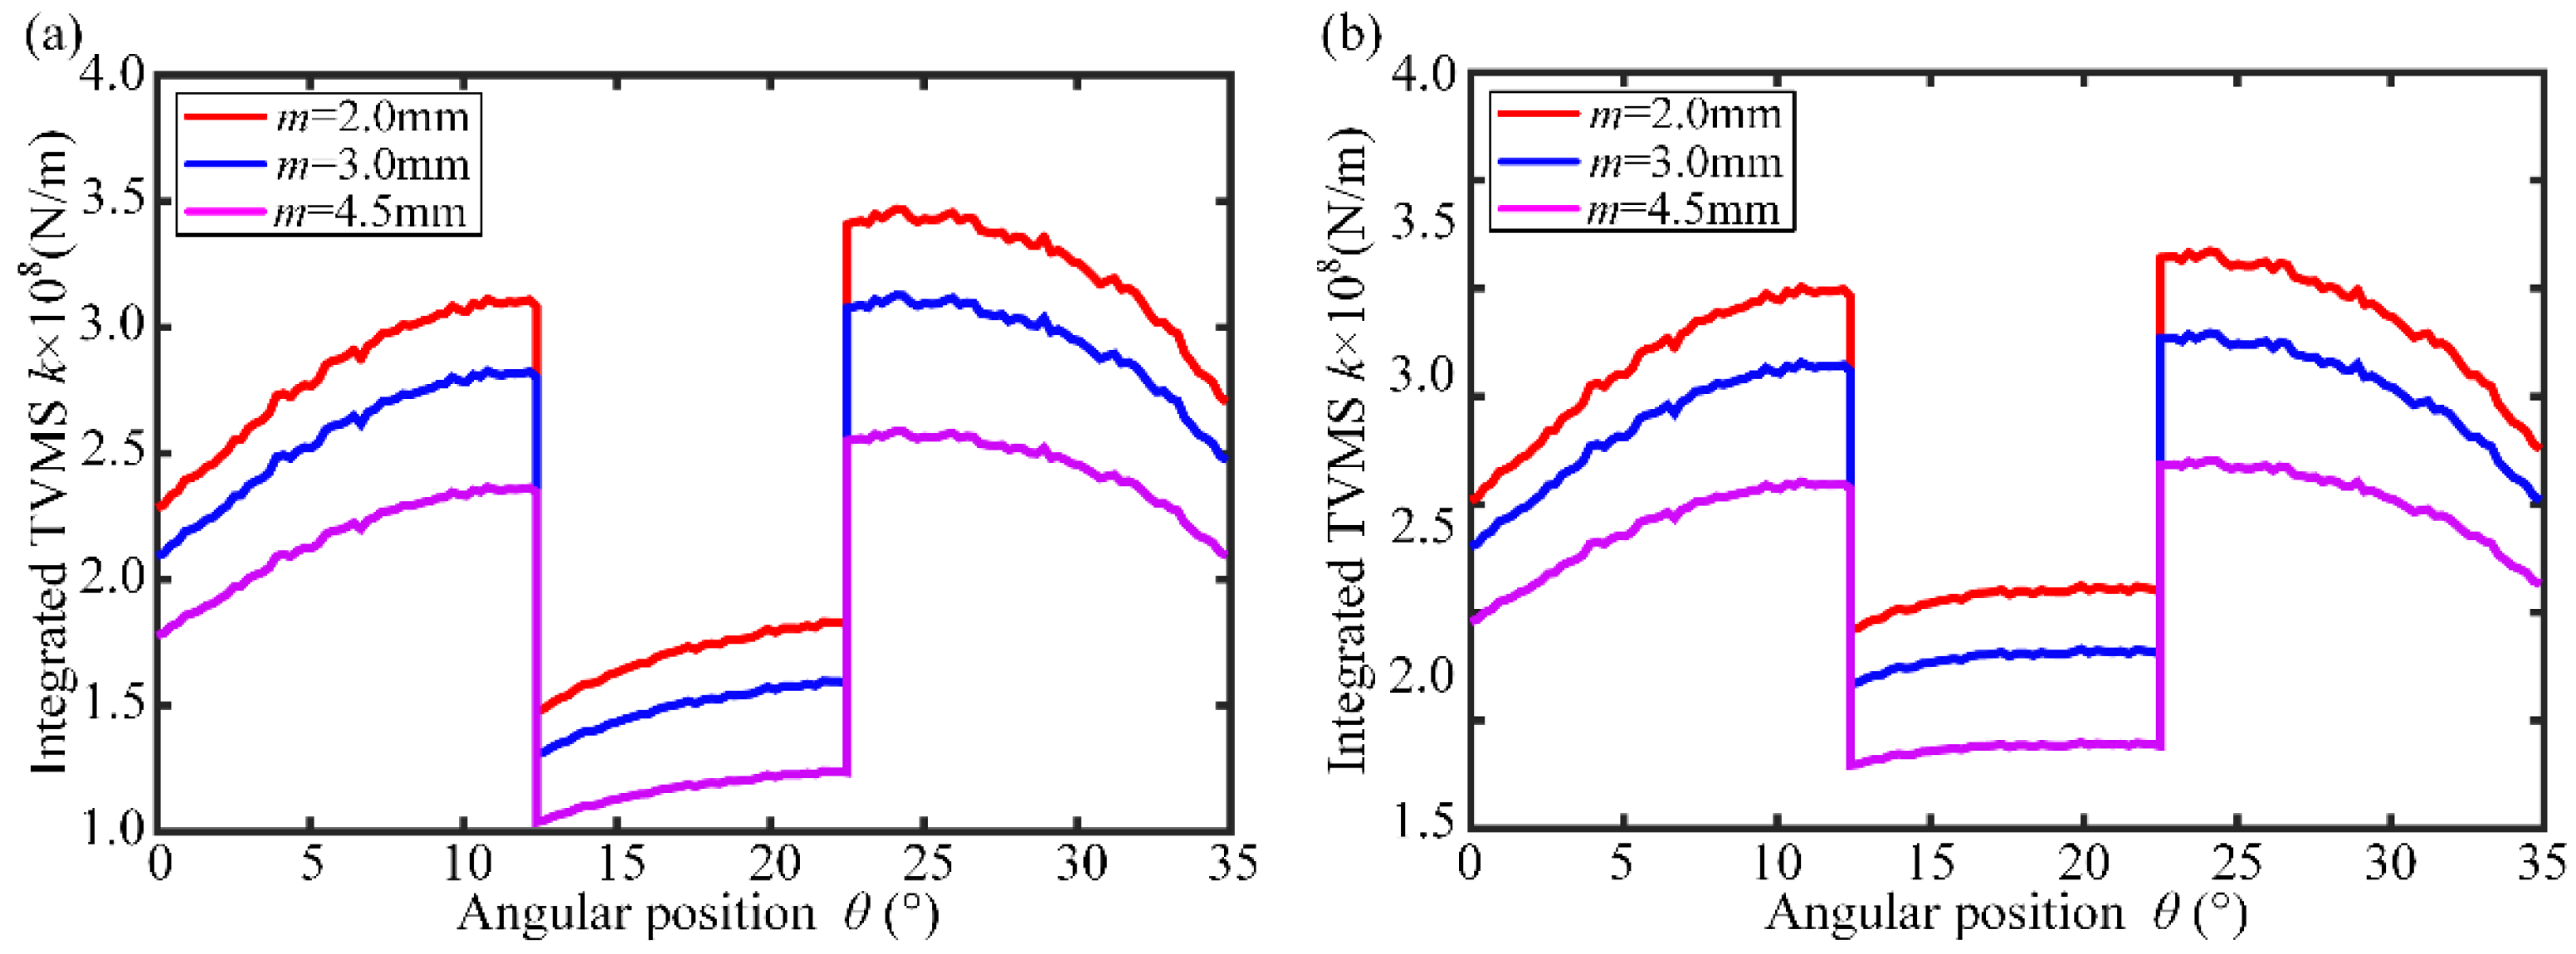
In this subsection, the effect of module m on the I-TVMS will be assessed, as illustrated in Figure 19. The values of m are set as 2mm, 3mm and 4.5mm, respectively. It can be found that the module m is more sensitive to the I-TVMS. Keep the other parameters unchanged; the tooth size will be increased proportionally with an increasing module, which decreases the I-TVMS of the cracked tooth, and weakens the fluctuation of the curve. The main reason for this phenomenon is that, as the module of the cracked tooth increases, the effective cross-sectional area and rotational inertia also increase, which leads to a decrease in the integrated TVMS.
To quantify the parameter sensitivity, the relative variation in the I-TVMS was calculated as (khighklow)/klow × 100%, where k denotes the mean or peak stiffness in the corresponding meshing region. The results are summarized in Table 5 and Table 6. The module and torque show the strongest influence on the I-TVMS, followed by the crack depth for the tooth-root crack. The crack location, crack angle, and surface morphology parameters mainly cause moderate changes in the single- and double-tooth meshing regions.

4. Conclusions

In this research, an I-TVMS model with cracks is proposed based on the complex and variable working conditions. Based on this, the effects of key parameters on the meshing characteristics with tooth root crack and tooth surface crack are discussed, and the main conclusions are summarized as follows:
(1)
Considering the tooth surface topography and lubrication, an integrated TVMS of the cracked tooth (RC and SC) is proposed, and the meshing characteristics are investigated under different crack parameters, tooth surface morphology, torque, and module, which exhibit different sensitive characteristics. The improved model can more precisely assess the I-TVMS of the gear with the cracked tooth in the actual working environment.
(2)
In practice, due to the relatively small initial crack angle and crack extent, the I-TVMS curves obtained by the linear crack and parabolic crack almost overlap. Hence, the crack propagation path is equivalent to a linear crack to enhance computational efficiency. Moreover, compared with the healthy tooth, the cracked tooth increases the contact load to some extent, which reduces the oil film thickness, and, in turn, intensifies the fluctuation of the I-TVMS.
(3)
The I-TVMS decreases as the crack depth and the G is increased, but the tooth root crack leads to a greater attenuation of stiffness than the tooth surface crack. The larger crack propagation angle and torque, the higher the I-TVMS. Moreover, the influence of the crack angle varies with the crack type and meshing region. The torque produces a positive variation in the I-TVMS for both crack types, with a greater influence in the double-tooth meshing region than in the single-tooth meshing region. When the crack position shifts from the tooth root to the tooth top, the attenuation of the I-TVMS gradually weakens.
The present model still has several limitations. It is mainly applicable to the spur gear pair and idealized crack geometries considered in this study. Future work will focus on experimental validation, crack-tip/closure modelling, temperature-dependent lubrication, and dynamic response analysis under broader operating conditions. Since the present work is mainly a theoretical analysis, a more accurate gear-meshing experimental test bench will be designed and built in future research to validate the proposed model and the predicted I-TVMS variation under cracked gear conditions.

Author Contributions

S.Z.: conceptualization, formal analysis, writing—original draft, and writing—review and editing. X.L.: formal analysis. C.Z.: software. T.X.: visualization. Y.Z. and Z.R.: investigation. All authors have read and agreed to the published version of the manuscript.

Funding

The project is supported by the Natural Science Foundation of China (No. 52275091), Fundamental Research Funds for the Central Universities (No. N25QSX007), and Shenyang Natural Science Foundation (No. 23-503-6-02).

Data Availability Statement

Some data, models, or code generated or used during the study are available from the corresponding author upon request.

Conflicts of Interest

The authors declare that there are no conflicts of interest regarding the publication of this paper.

References

  1. Ma, H.; Zeng, J.; Feng, M.J.; Pang, X.; Wang, Q.B.; Wen, B.C. Review on dynamics of cracked gear systems. Eng. Fail. Anal. 2016, 66, 166–176. [Google Scholar]
  2. Liang, X.H.; Zuo, M.J.; Feng, Z.P. Dynamic modeling of gearbox faults: A review. Mech. Syst. Signal Process. 2018, 98, 852–876. [Google Scholar] [CrossRef]
  3. Ma, H.; Pang, X.; Song, R.Z.; Yang, J. Time-varying mesh stiffness calculation of spur gears based on improved energy metho. J. North. Univ. Nat. Sci. 2014, 35, 863–866. [Google Scholar]
  4. Huang, W.K.; Ma, H.; Zhao, Z.F.; Wang, P.F.; Peng, Z.K.; Zhang, X.X.; Zhao, S.T. An iterative model for mesh stiffness of spur gears considering slice coupling under elastohydrodynamic lubrication. J. Cent. South Univ. 2023, 30, 3414–3434. [Google Scholar] [CrossRef]
  5. Zhou, C.J.; Xiao, Z.L. Stiffness and damping models for the oil film in line contact elastohydrodynamic lubrication and applications in the gear drive. Appl. Math. Model 2018, 61, 634–649. [Google Scholar] [CrossRef]
  6. Zhou, C.J.; Xing, M.C.; Hu, B. A mesh stiffness model with the asperity contact for spur gear in mixed elastohydrodynamic lubrication. J. Braz. Soc. Mech. Sci. 2022, 44, 466. [Google Scholar] [CrossRef]
  7. Tian, H.X.; Zhao, X.J.; Huang, W.K.; Ma, H. A stiffness model for EHL contact on smooth/rough surfaces and its application in mesh stiffness calculation of the planetary gear set. Tribol. Int. 2024, 196, 109720. [Google Scholar] [CrossRef]
  8. Xiao, H.F.; Gao, J.S.; Wu, J.Z. Mesh stiffness model of a spur gear pair with surface roughness in mixed elastohydrodynamic lubrication. J. Braz. Soc. Mech. Sci. 2022, 44, 136. [Google Scholar] [CrossRef]
  9. Xiao, H.F.; Sun, Y.Y.; Xu, J.W. Investigation into the normal contact stiffness of rough surface in line contact mixed elastohydrodynamic lubrication. Tribol. Trans. 2018, 61, 742–753. [Google Scholar] [CrossRef]
  10. Chen, G.; Xiao, K.; Wang, J.X.; Pu, W.; Han, Y.F. Calculation of gear meshing stiffness considering lubrication. J. Tribol. 2020, 142, 031602. [Google Scholar]
  11. Zhou, S.H.; Zhang, D.S.; Zhou, C.H.; Yu, X.H.; Zhou, Z.; Ren, Z. A comprehensive mesh stiffness model for spur gear considering coupling effective of thermo-elastohydrodynamic lubrication. Phys. Fluids 2024, 36, 117172. [Google Scholar] [CrossRef]
  12. Hu, F.; Luo, B.; He, F.H.; Yang, Q. Research on the stiffness of spur gear pairs based on the improved energy method under multiple influencing factors. Meccanica 2025, 60, 1079–1097. [Google Scholar] [CrossRef]
  13. Chen, Z.G.; Zhou, Z.W.; Zhai, W.M.; Wang, K.Y. Improved analytical calculation model of spur gear mesh excitations with tooth profile deviations. Mech. Mach. Theory 2020, 149, 103838. [Google Scholar] [CrossRef]
  14. Chaari, F.; Fakhfakh, T.; Haddar, M. Analytical modelling of spur gear tooth crack and influence on gear mesh stiffness. Eur. J. Mech. A-Solid 2009, 28, 461–468. [Google Scholar] [CrossRef]
  15. Ma, H.; Song, R.Z.; Pang, X.; Wen, B.C. Time-varying mesh stiffness calculation of cracked spur gears. Eng. Fail. Anal. 2014, 44, 179–194. [Google Scholar] [CrossRef]
  16. Wan, Z.G.; Zi, Y.Y.; Gao, H.R. Gear crack propagation simulation and analysis of mesh stiffness. Appl. Math. Mech. 2015, 36, 14–20. [Google Scholar]
  17. Yu, W.N.; Shao, Y.M.; Mechefske, C.K. The effects of spur gear tooth spatial crack propagation on gear mesh stiffness. Eng. Fail. Anal. 2015, 54, 103–119. [Google Scholar] [CrossRef]
  18. Wang, Q.B.; Chen, K.K.; Zhao, B.; Ma, H.; Kong, X.G. An analytical-finite-element method for calculating mesh stiffness of spur gear pairs with complicated foundation and crack. Eng. Fail. Anal. 2018, 94, 339–353. [Google Scholar] [CrossRef]
  19. Chen, K.K.; Huangfu, Y.F.; Ma, H.; Xu, Z.T.; Li, X.; Wen, B.C. Calculation of mesh stiffness of spur gears considering complex foundation types and crack propagation paths. Mech. Syst. Signal Process. 2019, 130, 273–292. [Google Scholar] [CrossRef]
  20. Yang, L.T.; Wang, L.M.; Shao, Y.M.; Mechefske, C.K.; Chen, Q.Y. A new calculation method for tooth fillet foundation stiffness of cracked spur gears. Eng. Fail. Anal. 2021, 121, 105173. [Google Scholar] [CrossRef]
  21. Verma, J.G.; Kumar, S.; Kankar, P.K. Crack growth modeling in spur gear tooth and its effect on mesh stiffness using extended finite element method. Eng. Fail. Anal. 2018, 94, 109–120. [Google Scholar] [CrossRef]
  22. Li, S.; Kolivand, A. Crack nucleation and propagation modeling for lubricated spur gear contacts of rough surfaces. Mech. Mach. Theory 2022, 170, 104726. [Google Scholar] [CrossRef]
  23. Ning, J.Y.; Chen, Z.G.; Zhi, Y.S.; Hua, X.; Zhai, W.M. Improved analytical method for gear body-induced deflections with tooth root crack considering structural coupling effect. Eng. Fail. Anal. 2022, 137, 106400. [Google Scholar] [CrossRef]
  24. Liu, Y.H.; Shi, Z.Q.; Liu, X.A.; Cheng, Z.; Zhen, D.; Gu, F.S. Mesh stiffness model for spur gear with opening crack considering deflection. Eng. Fail. Anal. 2022, 139, 106518. [Google Scholar] [CrossRef]
  25. He, H.F.; Zhao, L.Y.; Huang, J.H.; Liu, H.L.; Yuan, Y.H. Experimental and numerical studies on the propagation paths of gear root cracks. Eng. Fail. Anal. 2024, 311, 110583. [Google Scholar] [CrossRef]
  26. Yang, Y.; Tang, J.Y.; Hu, N.Q.; Shen, G.J.; Li, Y.H.; Zhang, L. Research on the time-varying mesh stiffness method and dynamic analysis of cracked spur gear system considering the crack position. J. Sound Vib. 2023, 548, 117505. [Google Scholar] [CrossRef]
  27. Wu, S.Y.; Zuo, M.J.; Parey, A. Simulation of spur gear dynamics and estimation of fault growth. J. Sound Vib. 2008, 317, 608–624. [Google Scholar] [CrossRef]
  28. Mohammed, O.D.; Rantatalo, M. Dynamic response and time-frequency analysis for gear tooth crack detection. Mech. Syst. Signal Process. 2016, 66, 612–624. [Google Scholar] [CrossRef]
  29. Meng, Z.; Shi, G.X.; Wang, F.L.; Zhan, X.Y.; Fan, F.J. Vibration characteristic analysis of cracked gear based on time-varying meshing stiffness. J. Mech. Eng. 2020, 56, 108–115. [Google Scholar] [CrossRef]
  30. Mo, S.; Wang, L.; Hu, Q.S.; Zhou, C.P.; Gao, H.J.; Cen, G.J. Time varying meshing stiffness of cracked gears and fault vibration for transmission system. J. Cent. South Univ. Sci. Tech. 2023, 54, 1769–1778. [Google Scholar]
  31. Mo, S.; Wang, D.D.; Chang, B.Y.; Zhao, X.H.; Houjoh, H. Nonlinear dynamic characteristics analysis of herringbone gear transmission system with tooth root crack. Commun. Nonlinear Sci. Numer. Simulat. 2025, 142, 108572. [Google Scholar] [CrossRef]
  32. Ning, J.Y.; Chen, Z.G.; Wang, Y.W.; Li, Y.F.; Zhai, W.M. Vibration feature of spur gear transmission with non-uniform depth distribution of tooth root crack along tooth width. Eng. Fail. Anal. 2021, 129, 105713. [Google Scholar] [CrossRef]
  33. Zhao, J.; Hou, L.; Li, Z.M.Q.; Zhang, H.; Zhu, R.P. Prediction of tribological and dynamical behaviors of spur gear pair considering tooth root crack. Eng. Fail. Anal. 2022, 135, 106145. [Google Scholar] [CrossRef]
  34. Mukherjee, S.; Kumar, V.; Sarangi, S. An integrated gear tooth crack analysis of coupled electromechanical model: A complexity-based approach. Chaos Soliton Fract. 2024, 186, 115294. [Google Scholar] [CrossRef]
  35. Liu, Z.M.; Chang, C.; Hu, H.D.; Ma, H.; Yuan, K.; Li, X.; Zhao, X.; Peng, Z. Dynamic characteristics of spur gear system with tooth root crack considering gearbox flexibility. Mech. Syst. Signal Process. 2024, 208, 110966. [Google Scholar] [CrossRef]
  36. Zhou, W.G.; Zhu, R.P.; Li, Z.W.; Liu, W.Z.; Wang, J.J. An improved dynamic model of spur gears considering delayed meshing out of the contact point due to root crack. Mech. Syst. Signal Process. 2024, 212, 111325. [Google Scholar] [CrossRef]
  37. Ma, Z.Y.; Zhao, X.J.; Wu, Y.P.; Ma, H.; Cao, P.; Guan, H.; Liu, Z.; Fan, C.; Zhu, J.; Yan, P.; et al. Two novel indicators for gear crack diagnosis based on vibration responses: Experiment and simulation. Mech. Mach. Theory 2025, 205, 105905. [Google Scholar] [CrossRef]
  38. Liu, G.M.; Zhang, L.L.; Li, J.H.; Li, H.G.; Tong, G.; Duan, P.; Jiang, H.; Kong, X.; Liu, F. Dynamics analysis for an improved gear model considering velocity-dependent mesh stiffness with tooth root crack. J. Sound Vib. 2025, 600, 118872. [Google Scholar] [CrossRef]
  39. Zhao, Z.F.; Han, H.Z.; Wang, P.F.; Ma, H.; Zhang, S.; Yang, Y. An improved model for meshing characteristics analysis of spur gears considering fractal surface contact and friction. Mech. Mach. Theory 2021, 158, 104219. [Google Scholar] [CrossRef]
  40. Ausloos, M.; Berman, D.H. A multivariate Weierstrass-Mandelbrot function. Proc. R. Soc. Lond. A Math. Phys. Sci. 1985, 400, 331–350. [Google Scholar] [CrossRef]
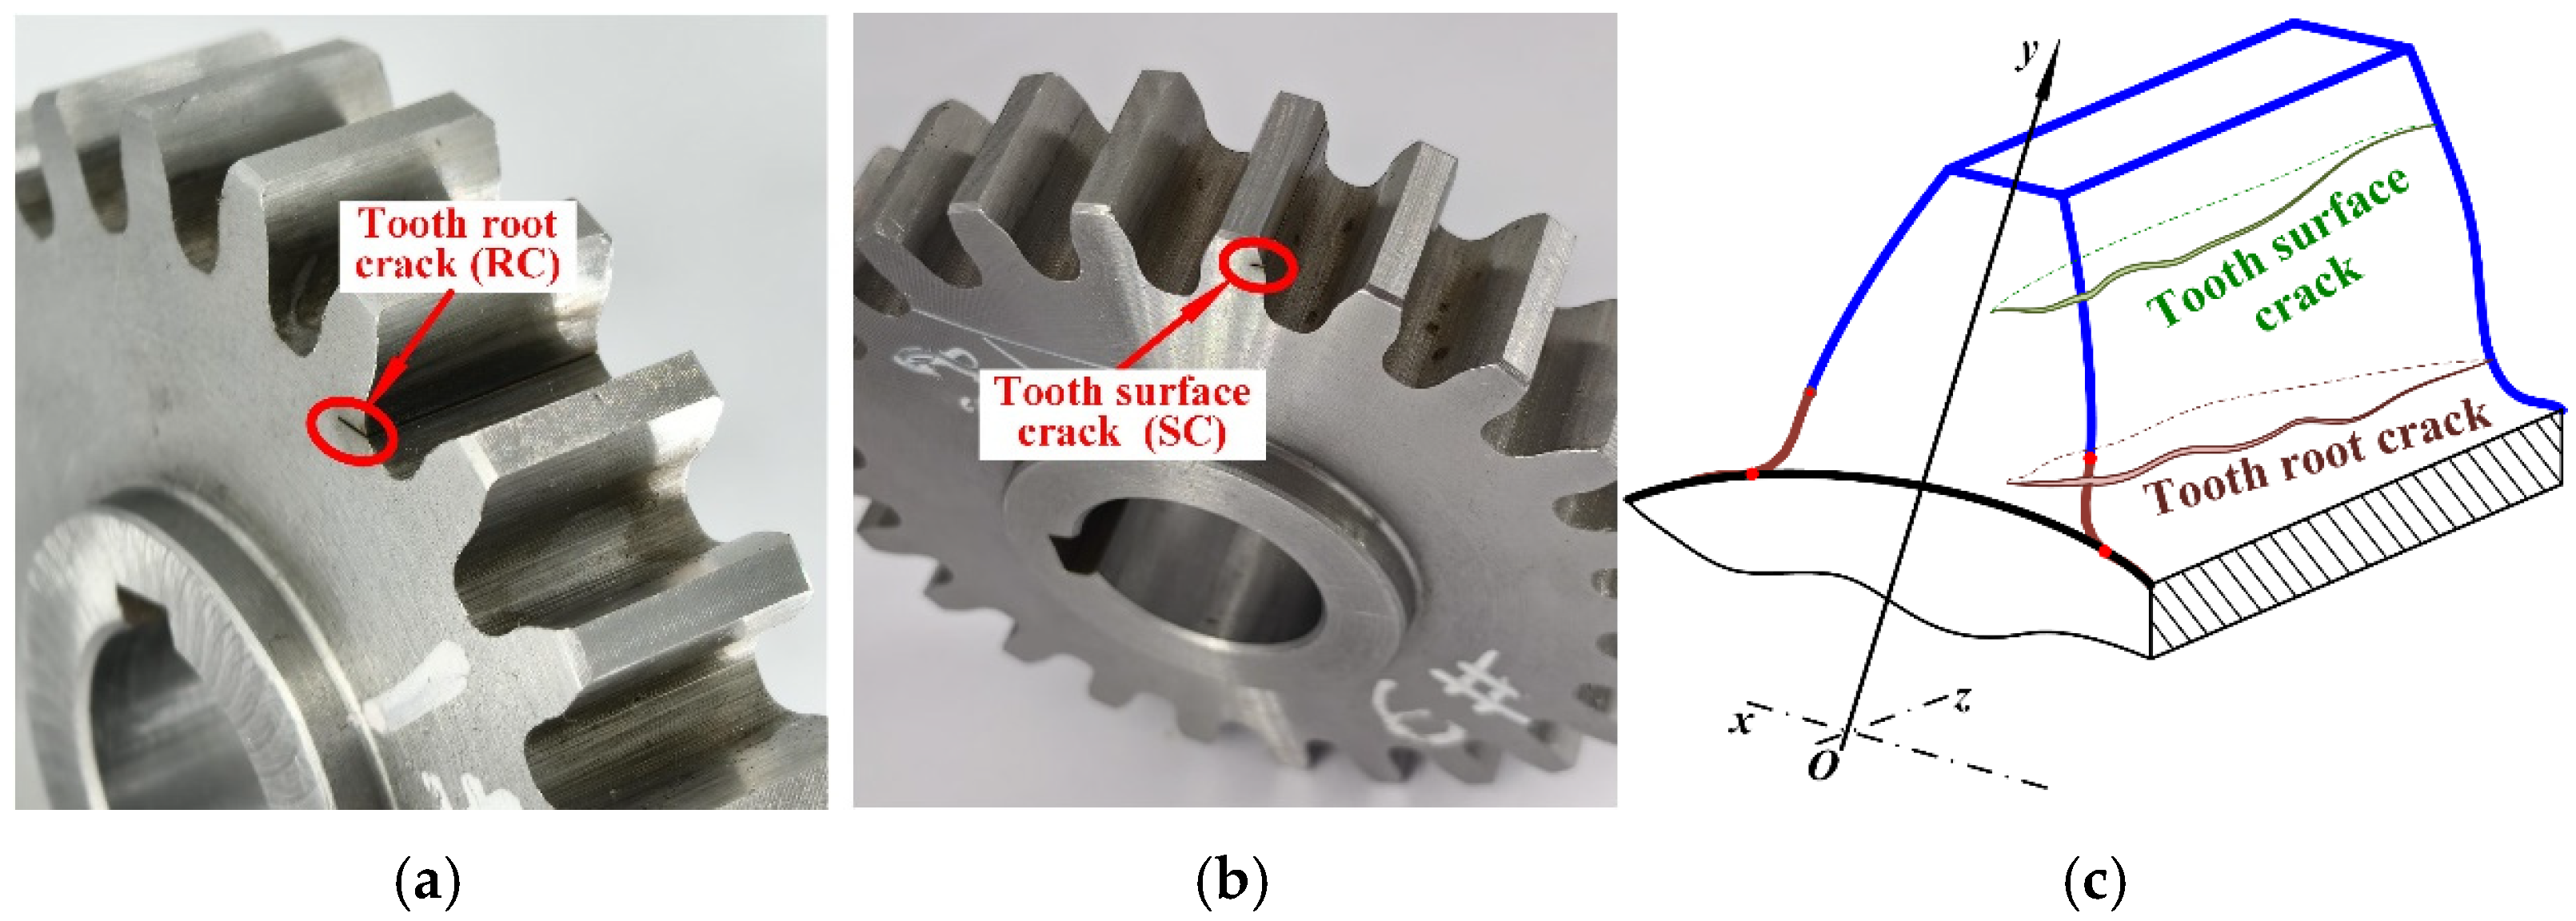
Figure 1. The tooth cracks: (a) tooth root crack, (b) tooth surface crack, and (c) schematic diagram of tooth crack.
Machines 14 00759 g001
Figure 2. The integrated TVMS model of gear.
Machines 14 00759 g002
Figure 3. The tooth surface topography characteristic: (a) gear measurement sample, (b) Newview 9000 3D non-contact surface morphometer; (c) 3D tooth surface topography measurement result; and (d) 3D tooth surface morphology simulation result with G = 1 × 10⁻⁴ and D = 2.8.
Machines 14 00759 g003
Figure 4. The geometric model of gear profile.
Machines 14 00759 g004
Figure 5. The schematic diagram of cracked tooth: (a) tooth root crack, and (b) tooth surface crack.
Machines 14 00759 g005
Figure 6. Model validation of I-TVMS with/without tooth root crack: (a) I-TVMS without lubrication and tooth surface topography, (b) I-TVMS with lubrication and without tooth surface topography, (c) I-TVMS with lubrication and tooth surface topography, and (d) I-TVMS with three operating conditions.
Machines 14 00759 g006
Figure 7. Model validation of I-TVMS with/without tooth surface crack: (a) I-TVMS without lubrication and tooth surface topography, (b) I-TVMS with lubrication and without tooth surface topography, (c) I-TVMS with lubrication and tooth surface topography, and (d) I-TVMS with three operating conditions.
Machines 14 00759 g007
Figure 8. The flowchart of tooth crack calculation.
Machines 14 00759 g008
Figure 9. Schematic diagram of tooth surface crack with parabolic propagation path and limit line.
Machines 14 00759 g009
Figure 10. The I-TVMS under different crack propagation paths: (a) tooth root crack, and (b) tooth surface crack.
Machines 14 00759 g010
Figure 11. The kI-TVMS under different crack depths: (a) tooth root crack, and (b) tooth surface crack.
Machines 14 00759 g011
Figure 12. The kI-TVMS under different crack locations. (a) tooth root crack, and (b) tooth surface crack.
Machines 14 00759 g012
Figure 13. The kI-TVMS under different crack angles: (a) tooth root crack, and (b) tooth surface crack.
Machines 14 00759 g013
Figure 14. The tooth surface morphology under different G: (a) G = 1 × 10⁻⁴, (b) G = 2 × 10⁻⁴, and (c) G = 4 × 10⁻⁴.
Machines 14 00759 g014
Figure 15. The kI-TVMS under different G: (a) tooth root crack, and (b) tooth surface crack.
Machines 14 00759 g015
Figure 16. The tooth surface morphology under different D: (a) D = 2.6, (b) D = 2.7, and (c) D = 2.8.
Machines 14 00759 g016
Figure 17. The kI-TVMS under different D: (a) tooth root crack, and (b) tooth surface crack.
Machines 14 00759 g017
Figure 18. The kI-TVMS under different torques: (a) tooth root crack, and (b) tooth surface crack.
Machines 14 00759 g018
Figure 19. The kI-TVMS under different modules: (a) tooth root crack, and (b) tooth surface crack.
Machines 14 00759 g019
Table 1. The key baseline parameters of the spur gear used for the I-TVMS calculation.
ParameterSymbolValue
Tooth numberz1/z216/24
Modulem (mm)4.5
Young’s modulusE (GPa)212
Poisson’s ratioυ0.289
Tooth widthB (mm)20
Pressure angleα20°
Crack depth (%)γ0/40
Profile shift coefficientx1/x20/0
Input torqueT (N m)100
Driving-gear speedn1 (r/min)1200
Lubricant ambient viscosityeta0 (Pa s)0.05
Pressure reference factorp0 (Pa)1.96 × 10⁸
Pressure-viscosity exponentZ0.68
Fractal dimensionD2.6/2.7/2.8
Characteristic scale parameterG1 × 10−4/2 × 10−4/4 × 10−4
Sampling lengthL (mm)1
EHL computational domainxin/xout−4.0/1.5
EHL grid nodesN256
Pressure residual toleranceepsilonp<1 × 10⁻⁵
Table 2. The maximal reduction ratio of kI-TVMS under different crack depths.
Crack DepthTooth Root CrackTooth Surface Crack
Single-ToothDouble-ToothSingle-ToothDouble-Tooth
γ = 30%10.91% 8.46% 3.03% 4.12%
γ = 40%19.08% 14.86% 5.62% 8.15%
γ = 50%31.21% 23.08% 10.12% 14.52%
Table 3. The maximal reduction ratio of kI-TVMS under different crack locations.
Crack LocationTooth Crack
Single-ToothDouble-Tooth
RC = 25%19.08% 14.86%
SC = 20%5.62% 8.15%
SC = 40%2.65% 5.23%
SC = 60%-2.87%
Table 4. The maximal reduction ratio of kI-TVMS under different crack angles.
Crack DepthTooth Root CrackTooth Surface Crack
Single-ToothDouble-ToothSingle-ToothDouble-Tooth
υ = 30°7.19% 5.43% -9.95%
υ = 45°6.26% 4.94% -5.96%
υ = 60°4.82% 4.11% -4.04%
υ = 90°3.17% 3.04% -2.03%
Table 5. Relative variation in I-TVMS for tooth root crack.
Tooth Root Crack
ParameterRangeSingle MeanSingle PeakDouble MeanDouble Peak
Crack depth30% to 50%−16.21%−11.36%−8.43%−4.53%
Crack angle30°to 90°+3.28%+2.81%+1.60%+1.10%
Crack location20% to 40%−1.57%−1.39%−0.55%−0.58%
D2.6 to 2.8+1.26%−0.03%+3.47%+2.75%
G1 × 10−4 to 4 × 10⁻⁴−1.26%+0.33%−3.23%−1.82%
Torque50 to 100+7.80%+7.68%+16.83%+12.85%
Module2 to 4.5−24.28%−25.38%−20.63%−22.18%
Table 6. Relative variation in I-TVMS for tooth surface crack.
Tooth Surface Crack
ParameterRangeSingle MeanSingle PeakDouble MeanDouble Peak
Crack depth30% to 50%−4.16%−2.65%−3.54%−0.88%
Crack angle30°to 90°0.00%0.00%+2.66%0.00%
Crack location15% to 60%+4.30%+3.52%+2.60%+0.95%
D2.6 to 2.8+1.46%−0.07%+3.62%+2.93%
G1 × 10−4 to 4 × 10⁻⁴−1.41%+0.69%−3.39%−1.88%
Torque50 to 100+8.76%+8.63%+17.56%+13.00%
Module2 to 4.5−27.17%−27.67%−21.54%−23.20%
Disclaimer/Publisher’s Note: The statements, opinions and data contained in all publications are solely those of the individual author(s) and contributor(s) and not of MDPI and/or the editor(s). MDPI and/or the editor(s) disclaim responsibility for any injury to people or property resulting from any ideas, methods, instructions or products referred to in the content.