4.1. Experimental Settings
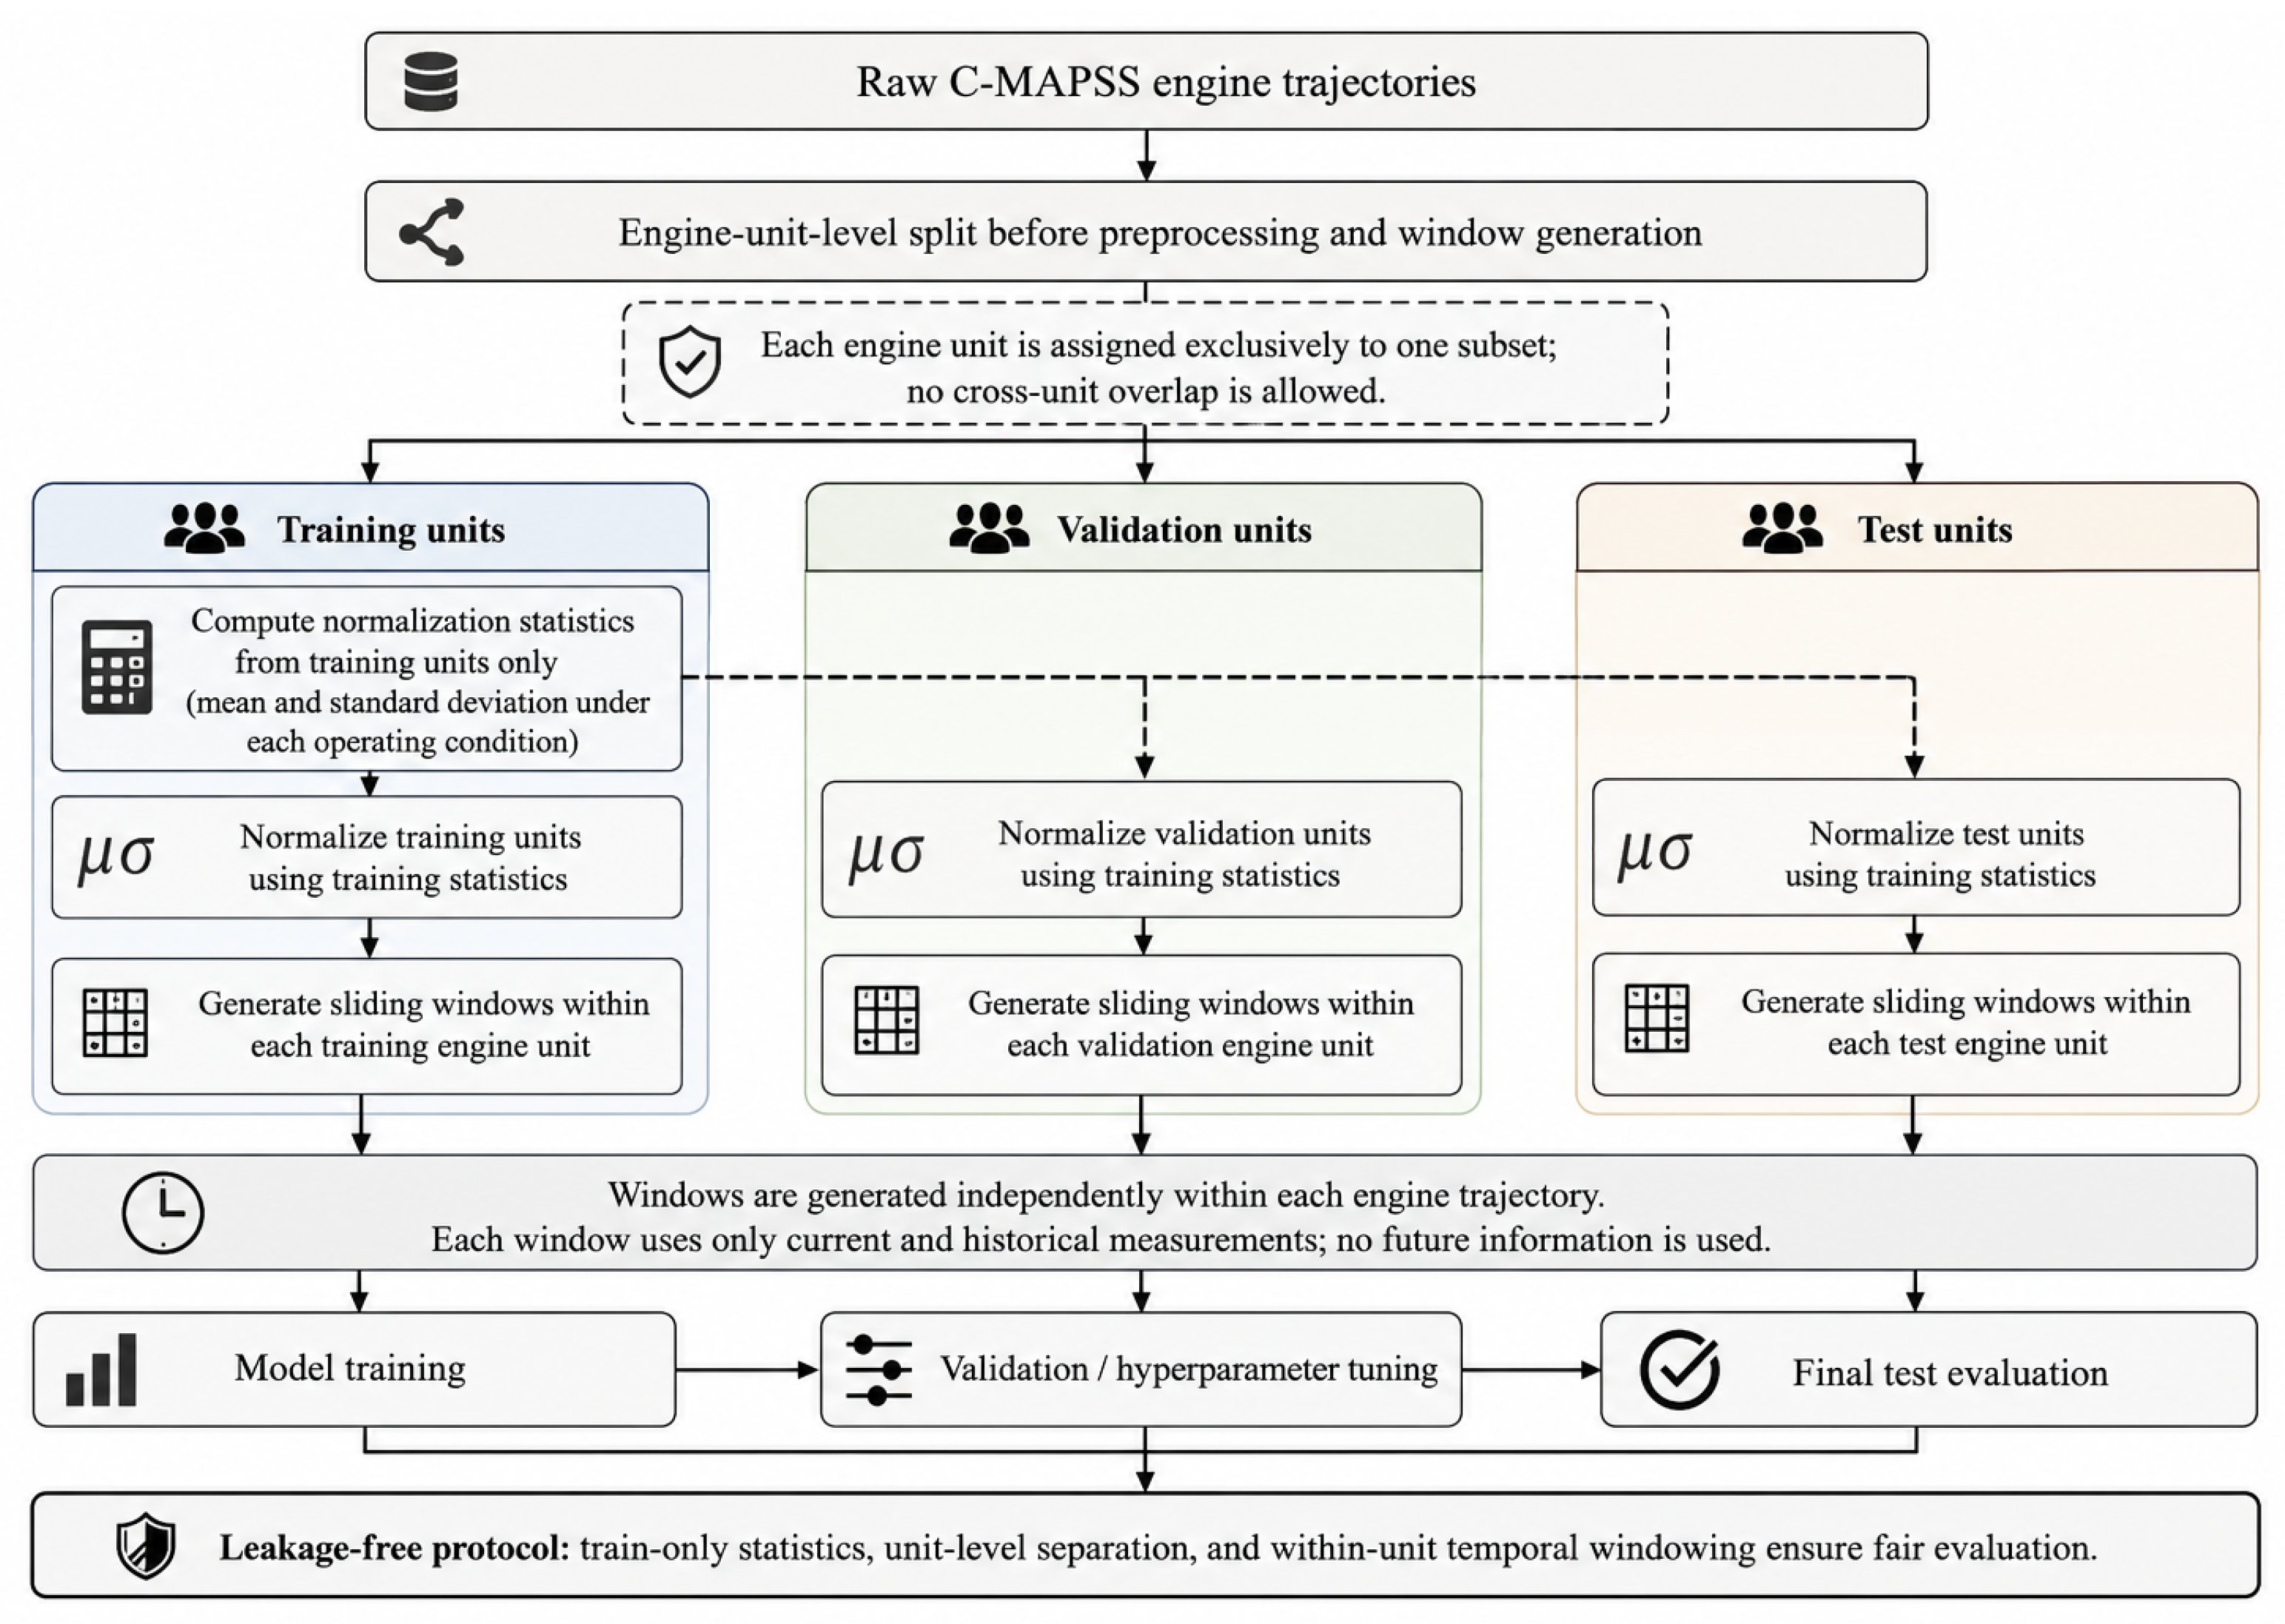
All experiments were conducted under the unified leakage-free workflow described in
Section 3 and illustrated in
Figure 3. The experimental procedure consisted of three consecutive stages. First, the original monitoring data were transformed into condition-adapted and degradation-sensitive samples through the preprocessing pipeline. Second, five representative models, namely XGBoost, LightGBM, Random Forest, MSTA-CNN, and Bi-LSTM, were trained on the preprocessed training windows under the same three-class health state classification setting. Third, the trained models were evaluated on the corresponding test windows using a consistent set of classification metrics. This unified design ensures that the observed performance differences mainly reflect model capability rather than inconsistencies in data processing or target definition.
To assess the statistical stability of the neural network models, Bi-LSTM and MSTA-CNN were each trained under five different random seeds on the FD002 validation partition, which is the same held-out split used in the ablation study. Tree-based models, namely Random Forest, XGBoost, and LightGBM, were evaluated under fixed hyperparameters and a fixed random seed; because their training procedures are deterministic given the same data and configuration, repeated-run variability analysis is directed primarily at the neural network models, whose results are more sensitive to random initialization and stochastic mini-batch optimization.
Table 5 reports the mean, standard deviation, and 95% confidence interval of the main classification metrics over the five repeated runs.
As shown in
Table 5, both neural network models exhibit small run-to-run variation, with standard deviations in Macro-F1 not exceeding 0.004 and 95% confidence intervals spanning approximately 0.010. These results indicate that the reported neural-network performance is relatively stable under different random initializations. However, because the performance margins among several candidate models in this benchmark remain within a few percentage points, the present study avoids claiming statistically definitive superiority of any single model family, and the comparisons reported in the following sections should be interpreted as indicative of performance trends rather than conclusive rankings.
4.2. Overall Performance Comparison Across Models and Datasets
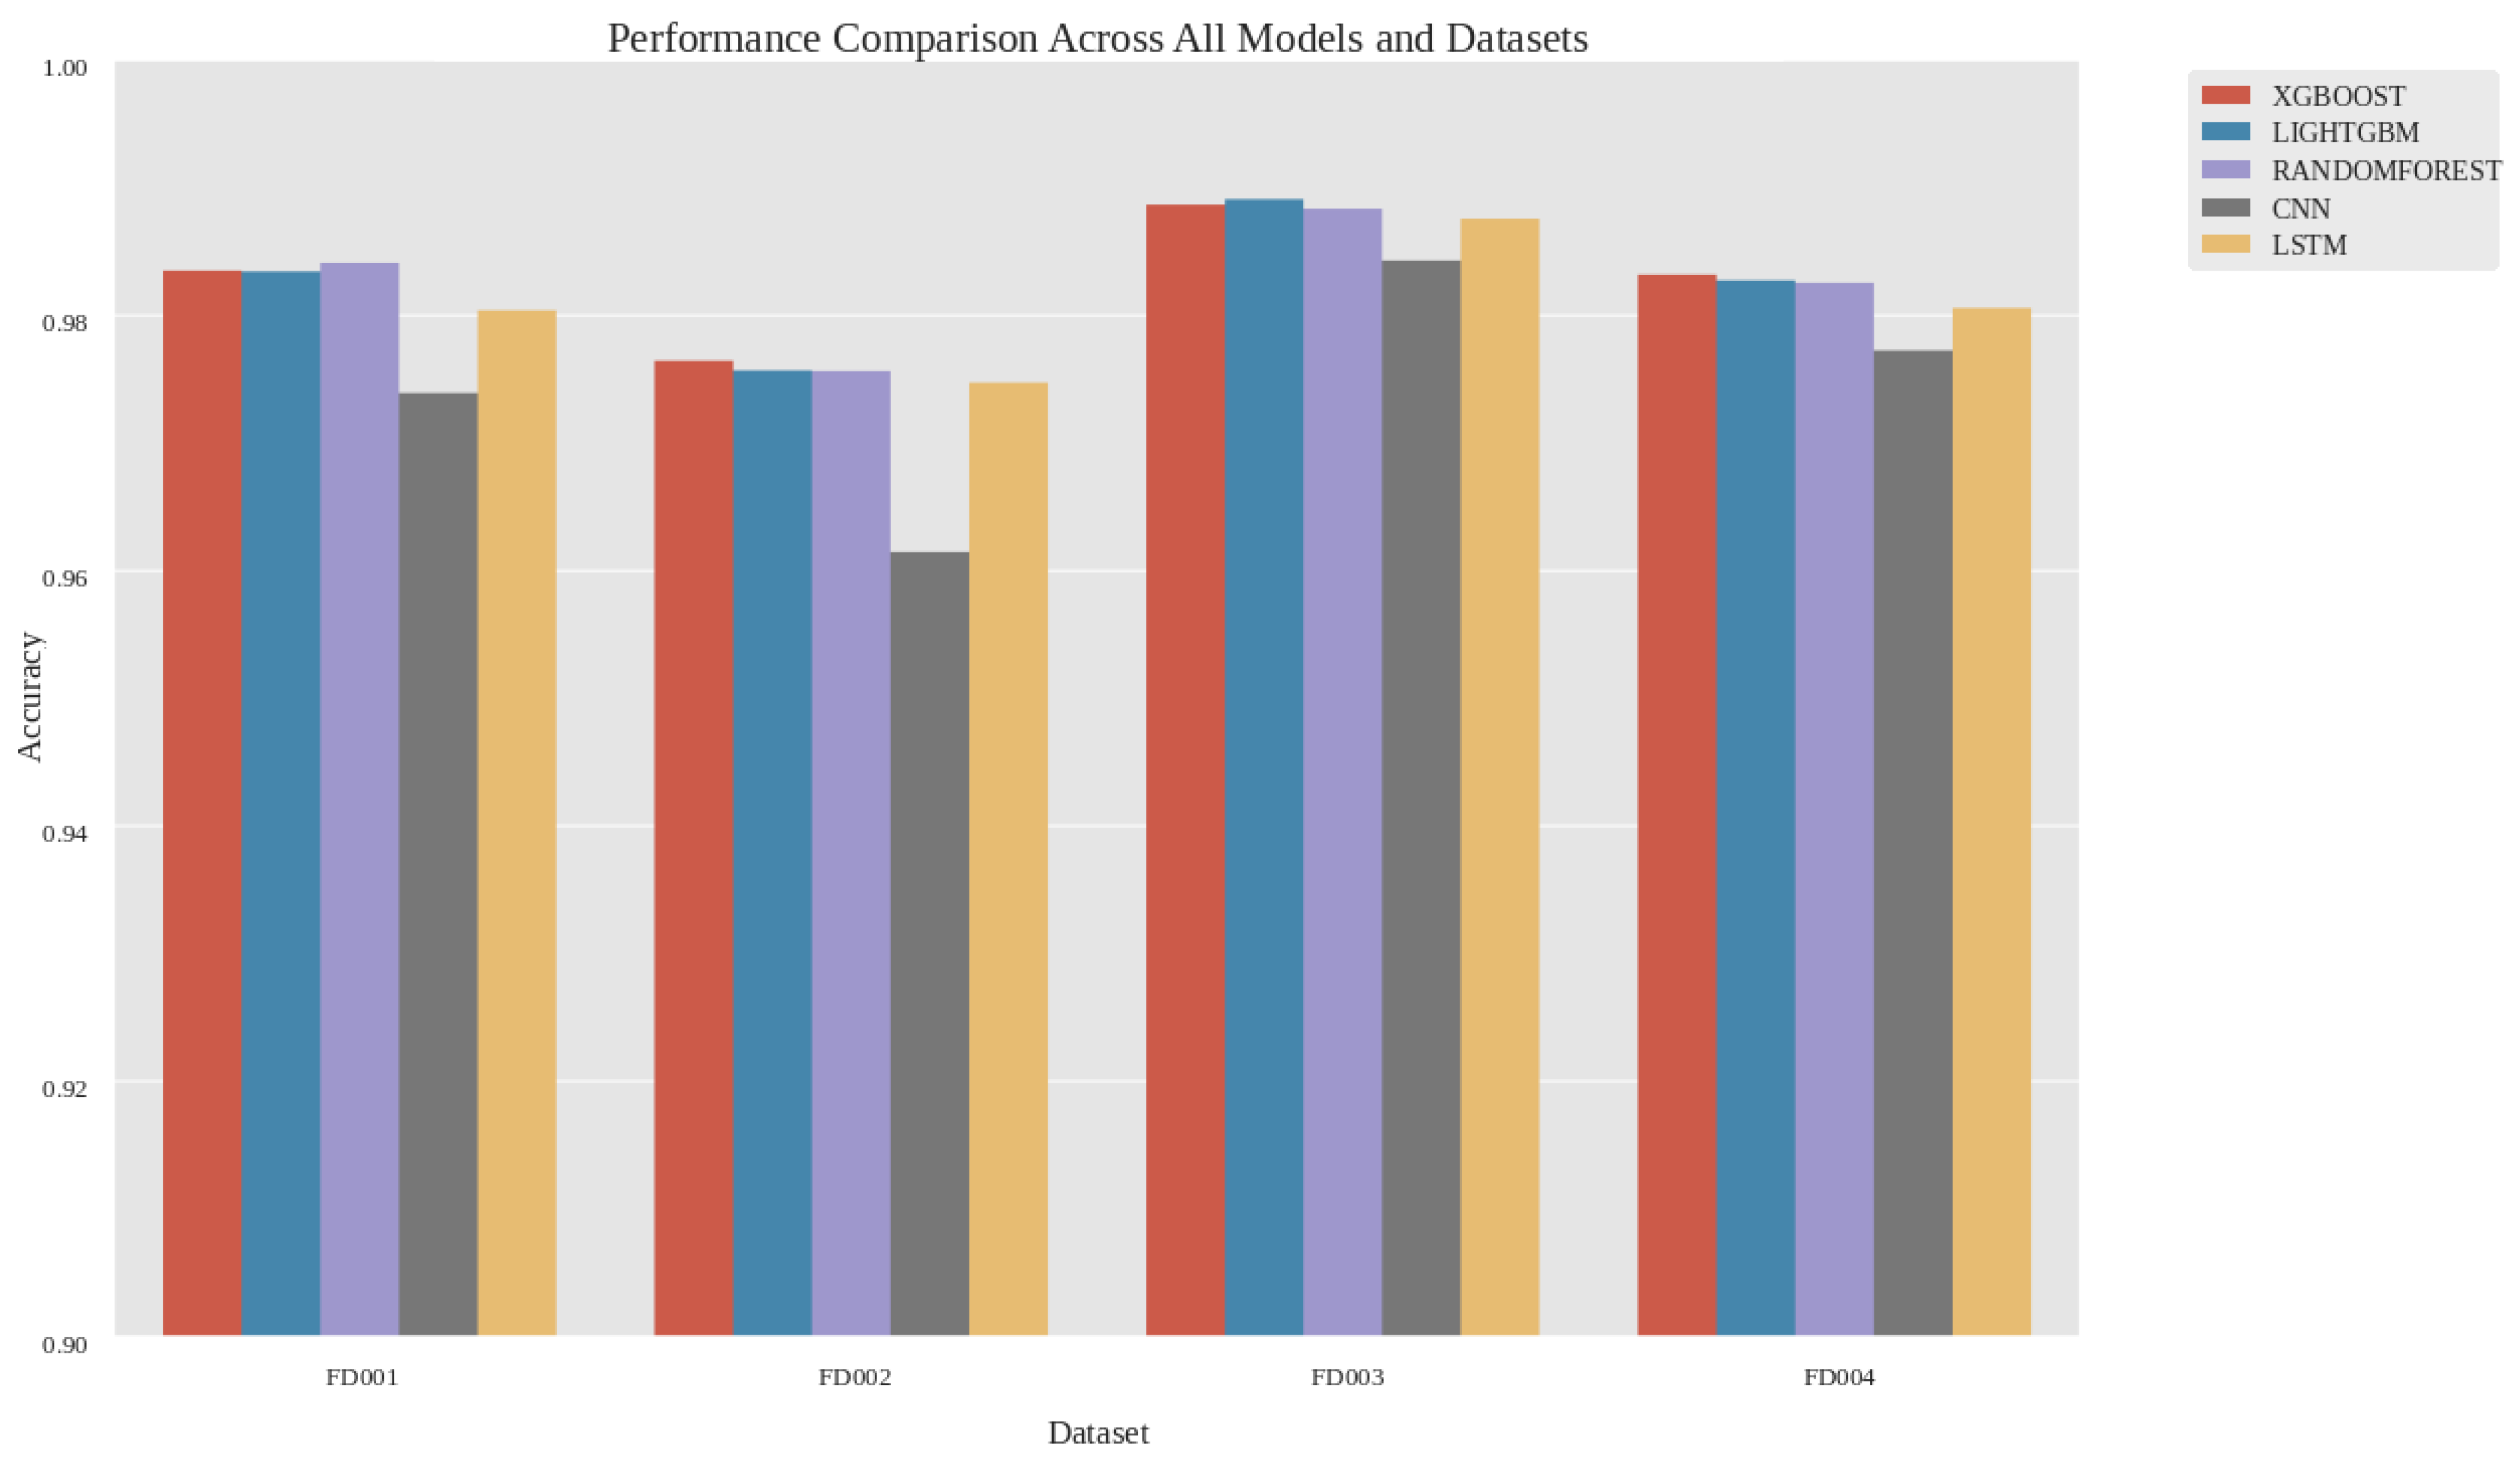
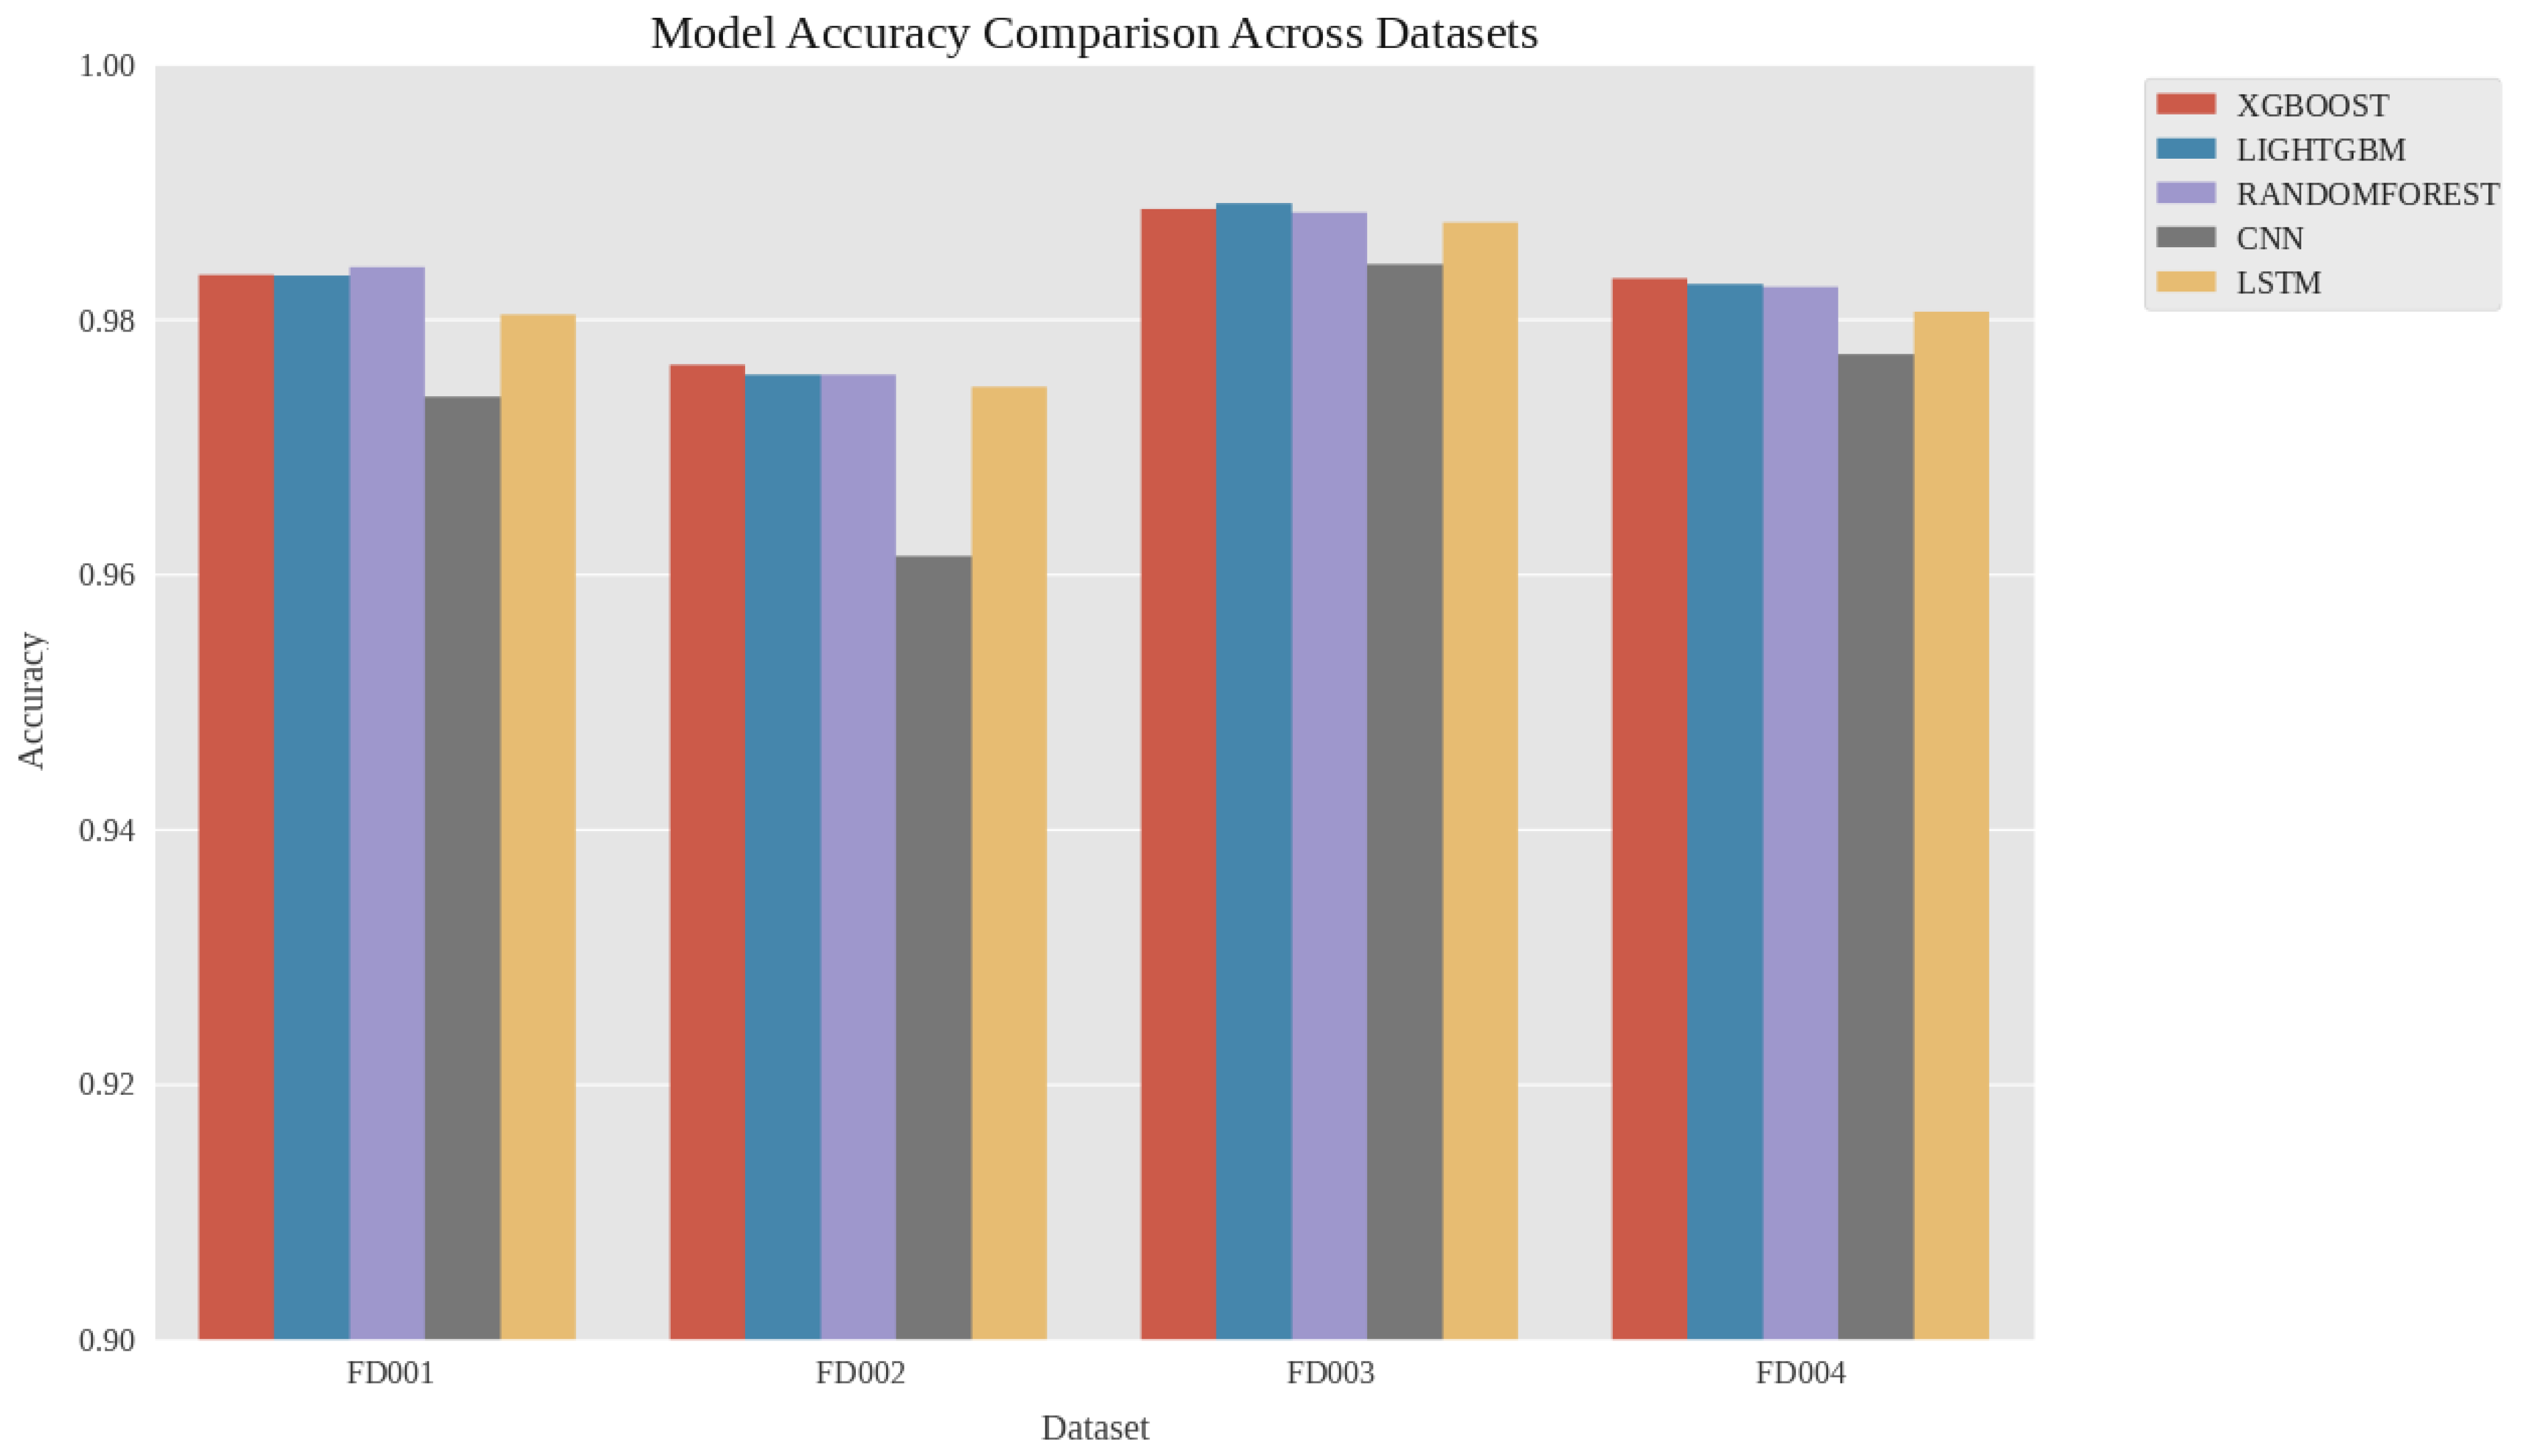
The overall accuracy results show that all five models achieve high classification performance on the four C-MAPSS subsets, indicating that the proposed maintenance-oriented task formulation is feasible for C-MAPSS-based health state assessment. However, clear differences can be observed among model families. Tree-based models generally occupy the leading positions, while the Multi-Scale Temporal Attention CNN (MSTA-CNN) achieves the lowest accuracy among the five evaluated models on all subsets. For clarity, the terms “CNN-based model” and “CNN-based architecture” used in the following figures and family-level comparisons all refer to this same MSTA-CNN model.
As shown in
Table 6, the best results on FD001, FD002, FD003, and FD004 are achieved by Random Forest, XGBoost, LightGBM, and XGBoost, respectively. The corresponding accuracies are 0.9841, 0.9764, 0.9891, and 0.9832. These results indicate that tree-based models generally achieve the highest accuracy in this evaluation, with the best tree-based model outperforming Bi-LSTM by 0.0015 to 0.0037 across the four subsets.
As shown in
Figure 6, the accuracy comparison reveals a consistent performance ranking across the four benchmark subsets. Tree-based models, especially XGBoost, LightGBM, and Random Forest, achieve the highest accuracy levels across all subsets, whereas MSTA-CNN achieves the lowest accuracy in all cases. This is consistent with the proposed preprocessing pipeline producing a discriminative structured feature space that particularly benefits ensemble tree models.
From the dataset perspective, FD003 yields the highest accuracy and FD002 the lowest across all five models. This pattern is consistent with the hypothesis that task difficulty is influenced by the complexity of the underlying operating conditions and degradation environment. The relatively lower results on FD002 suggest that multi-condition settings introduce additional classification ambiguity that is not fully resolved by condition-aware preprocessing alone.
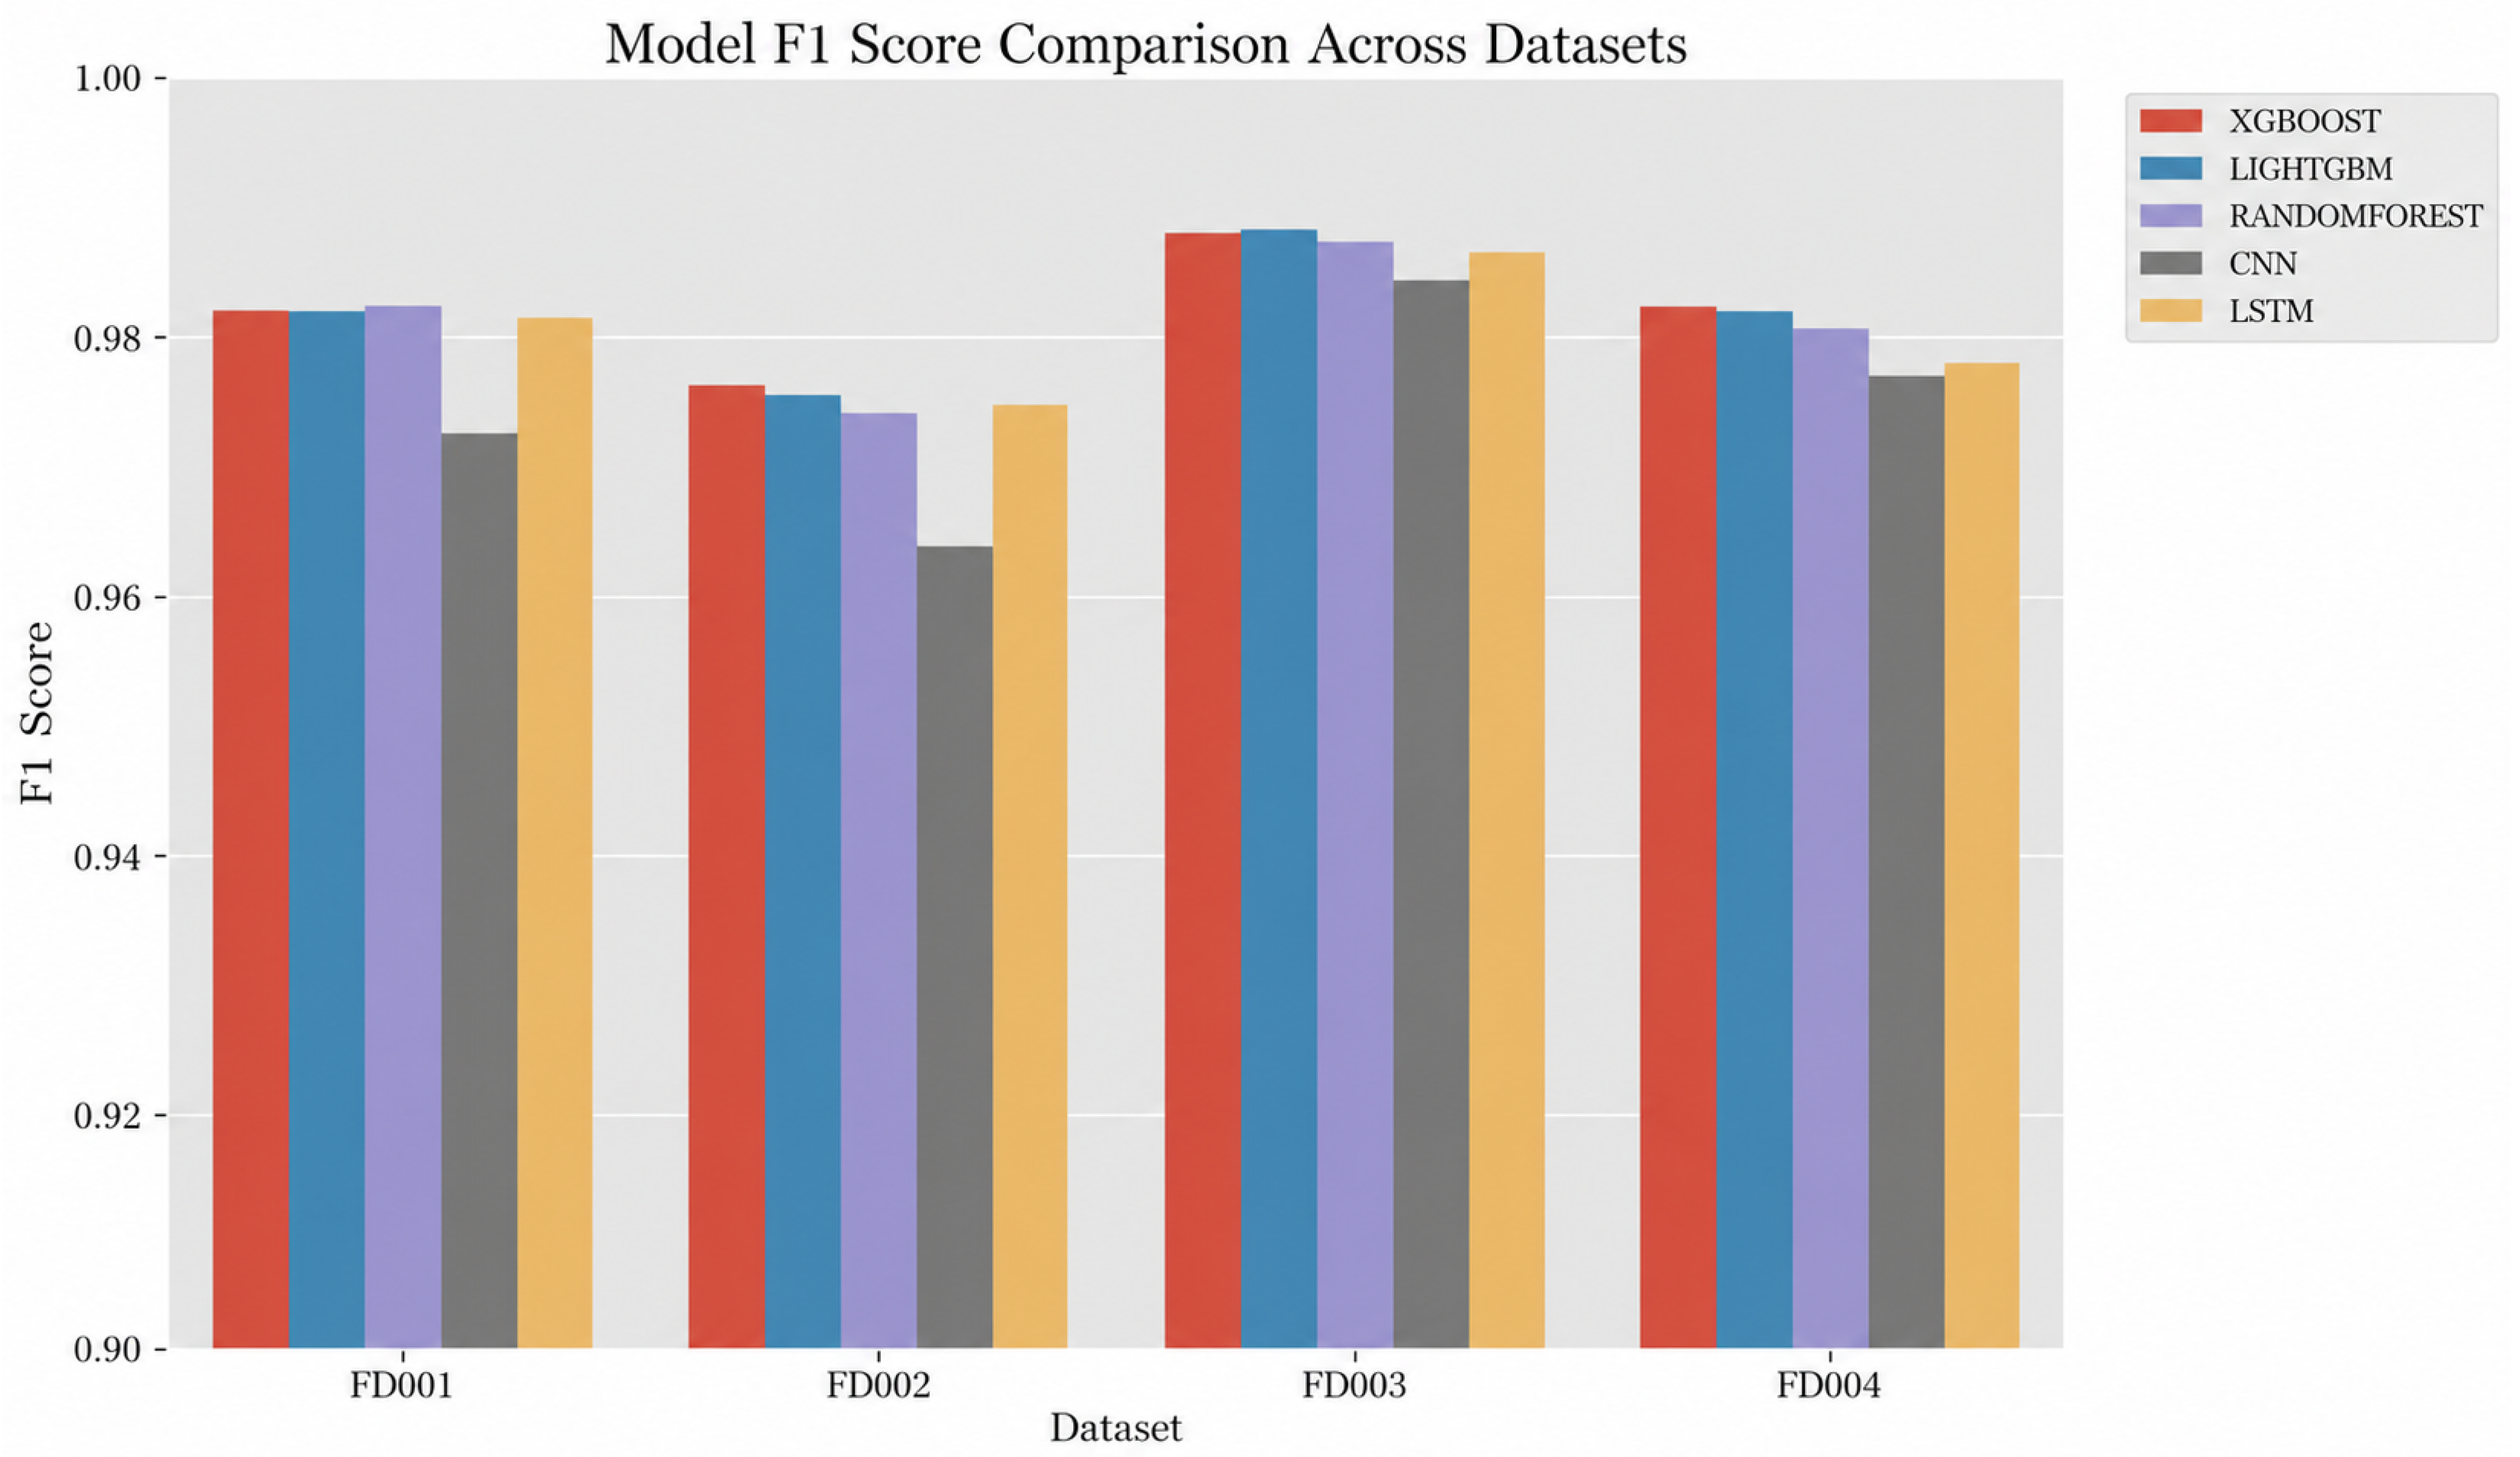
The F1-score results exhibit a ranking pattern broadly consistent with the accuracy results, which supports the reliability of the overall conclusion. Tree-based models again occupy the top positions in the comparison, while Bi-LSTM consistently outperforms MSTA-CNN. This cross-metric consistency suggests that the performance differences among the leading models are not caused merely by class-distribution bias, but are also reflected in class-sensitive discrimination behavior.
Table 7 further shows that MSTA-CNN achieves stable multi-metric performance across FD001–FD004, although it remains lower than the best-performing tree-based models and Bi-LSTM on all subsets. Its highest accuracy is observed on FD003, while FD002 remains the most challenging subset.
As shown in
Figure 7, the F1-score comparison further verifies the performance pattern observed in the accuracy results. The ranking of the five models remains largely unchanged, with tree-based models continuing to occupy the top positions and Bi-LSTM consistently outperforming MSTA-CNN. This cross-metric consistency suggests that the performance differences among the leading models are not primarily attributable to majority-class bias, but are also reflected in balanced discrimination across the three maintenance states.
Compared with accuracy alone, the F1-score provides a more informative view of class-sensitive performance because it reflects the balance between precision and recall. The close agreement between the two metrics suggests that the proposed framework performs reliably not only in terms of overall correctness but also in terms of maintaining relatively balanced recognition ability across Normal, Warning, and Fault classes. This is particularly important for predictive maintenance, where weak recognition of transitional or high-risk classes would reduce practical usefulness even if global accuracy remained high.
Another observation is that the gap between Bi-LSTM and MSTA-CNN is apparent under F1-score evaluation. This is consistent with the view that long-term temporal dependency modeling provides additional benefit over local convolutional pattern extraction for the present task. The F1-score results therefore offer complementary support for the relevance of temporal sequence modeling in maintenance-oriented health assessment.
As shown in
Figure 8, the overall benchmark comparison provides a compact summary of the performance relationships among models and datasets. Three key observations can be drawn. First, all five models achieve high classification performance across all benchmark subsets, indicating that the maintenance-oriented reformulation is feasible under the present benchmark conditions. Second, the top-performing models in each subset belong to the tree-based family, which is consistent with condition-aware preprocessing and degradation-sensitive feature construction exposing a discriminative structured feature space that benefits ensemble methods. Third, among the deep learning models, Bi-LSTM shows a consistent advantage over MSTA-CNN, suggesting that long-range temporal dependency provides additional benefit over local convolutional feature extraction for this task.
This benchmark-level view moves the analysis beyond individual subset results and reveals a stable family-level ranking. Rather than relying on a single winning model, the results show that the proposed pipeline supports multiple competitive classifiers, which suggests that the observed performance is attributable not only to model selection but also to the joint design of task formulation, preprocessing, and representation strategy.
From a predictive maintenance perspective, this comparison suggests that the framework supports maintenance-oriented health assessment under different degradation scenarios in this benchmark setting. It also indicates that future improvements are more likely to come from better transitional-state modeling and calibration rather than from simply replacing one model family with another.
These findings suggest that the preprocessing and feature construction steps transform the original degradation sequences into a representation that exposes class-relevant variation in a way that benefits classification. The final performance is therefore not solely attributable to model complexity, but also to the quality of the input representation. This is a practically relevant observation because it implies that performance gains in maintenance-oriented health assessment can be pursued through better data preparation alongside advances in model architecture.
4.4. Class-Level Error Analysis Based on Confusion Matrices
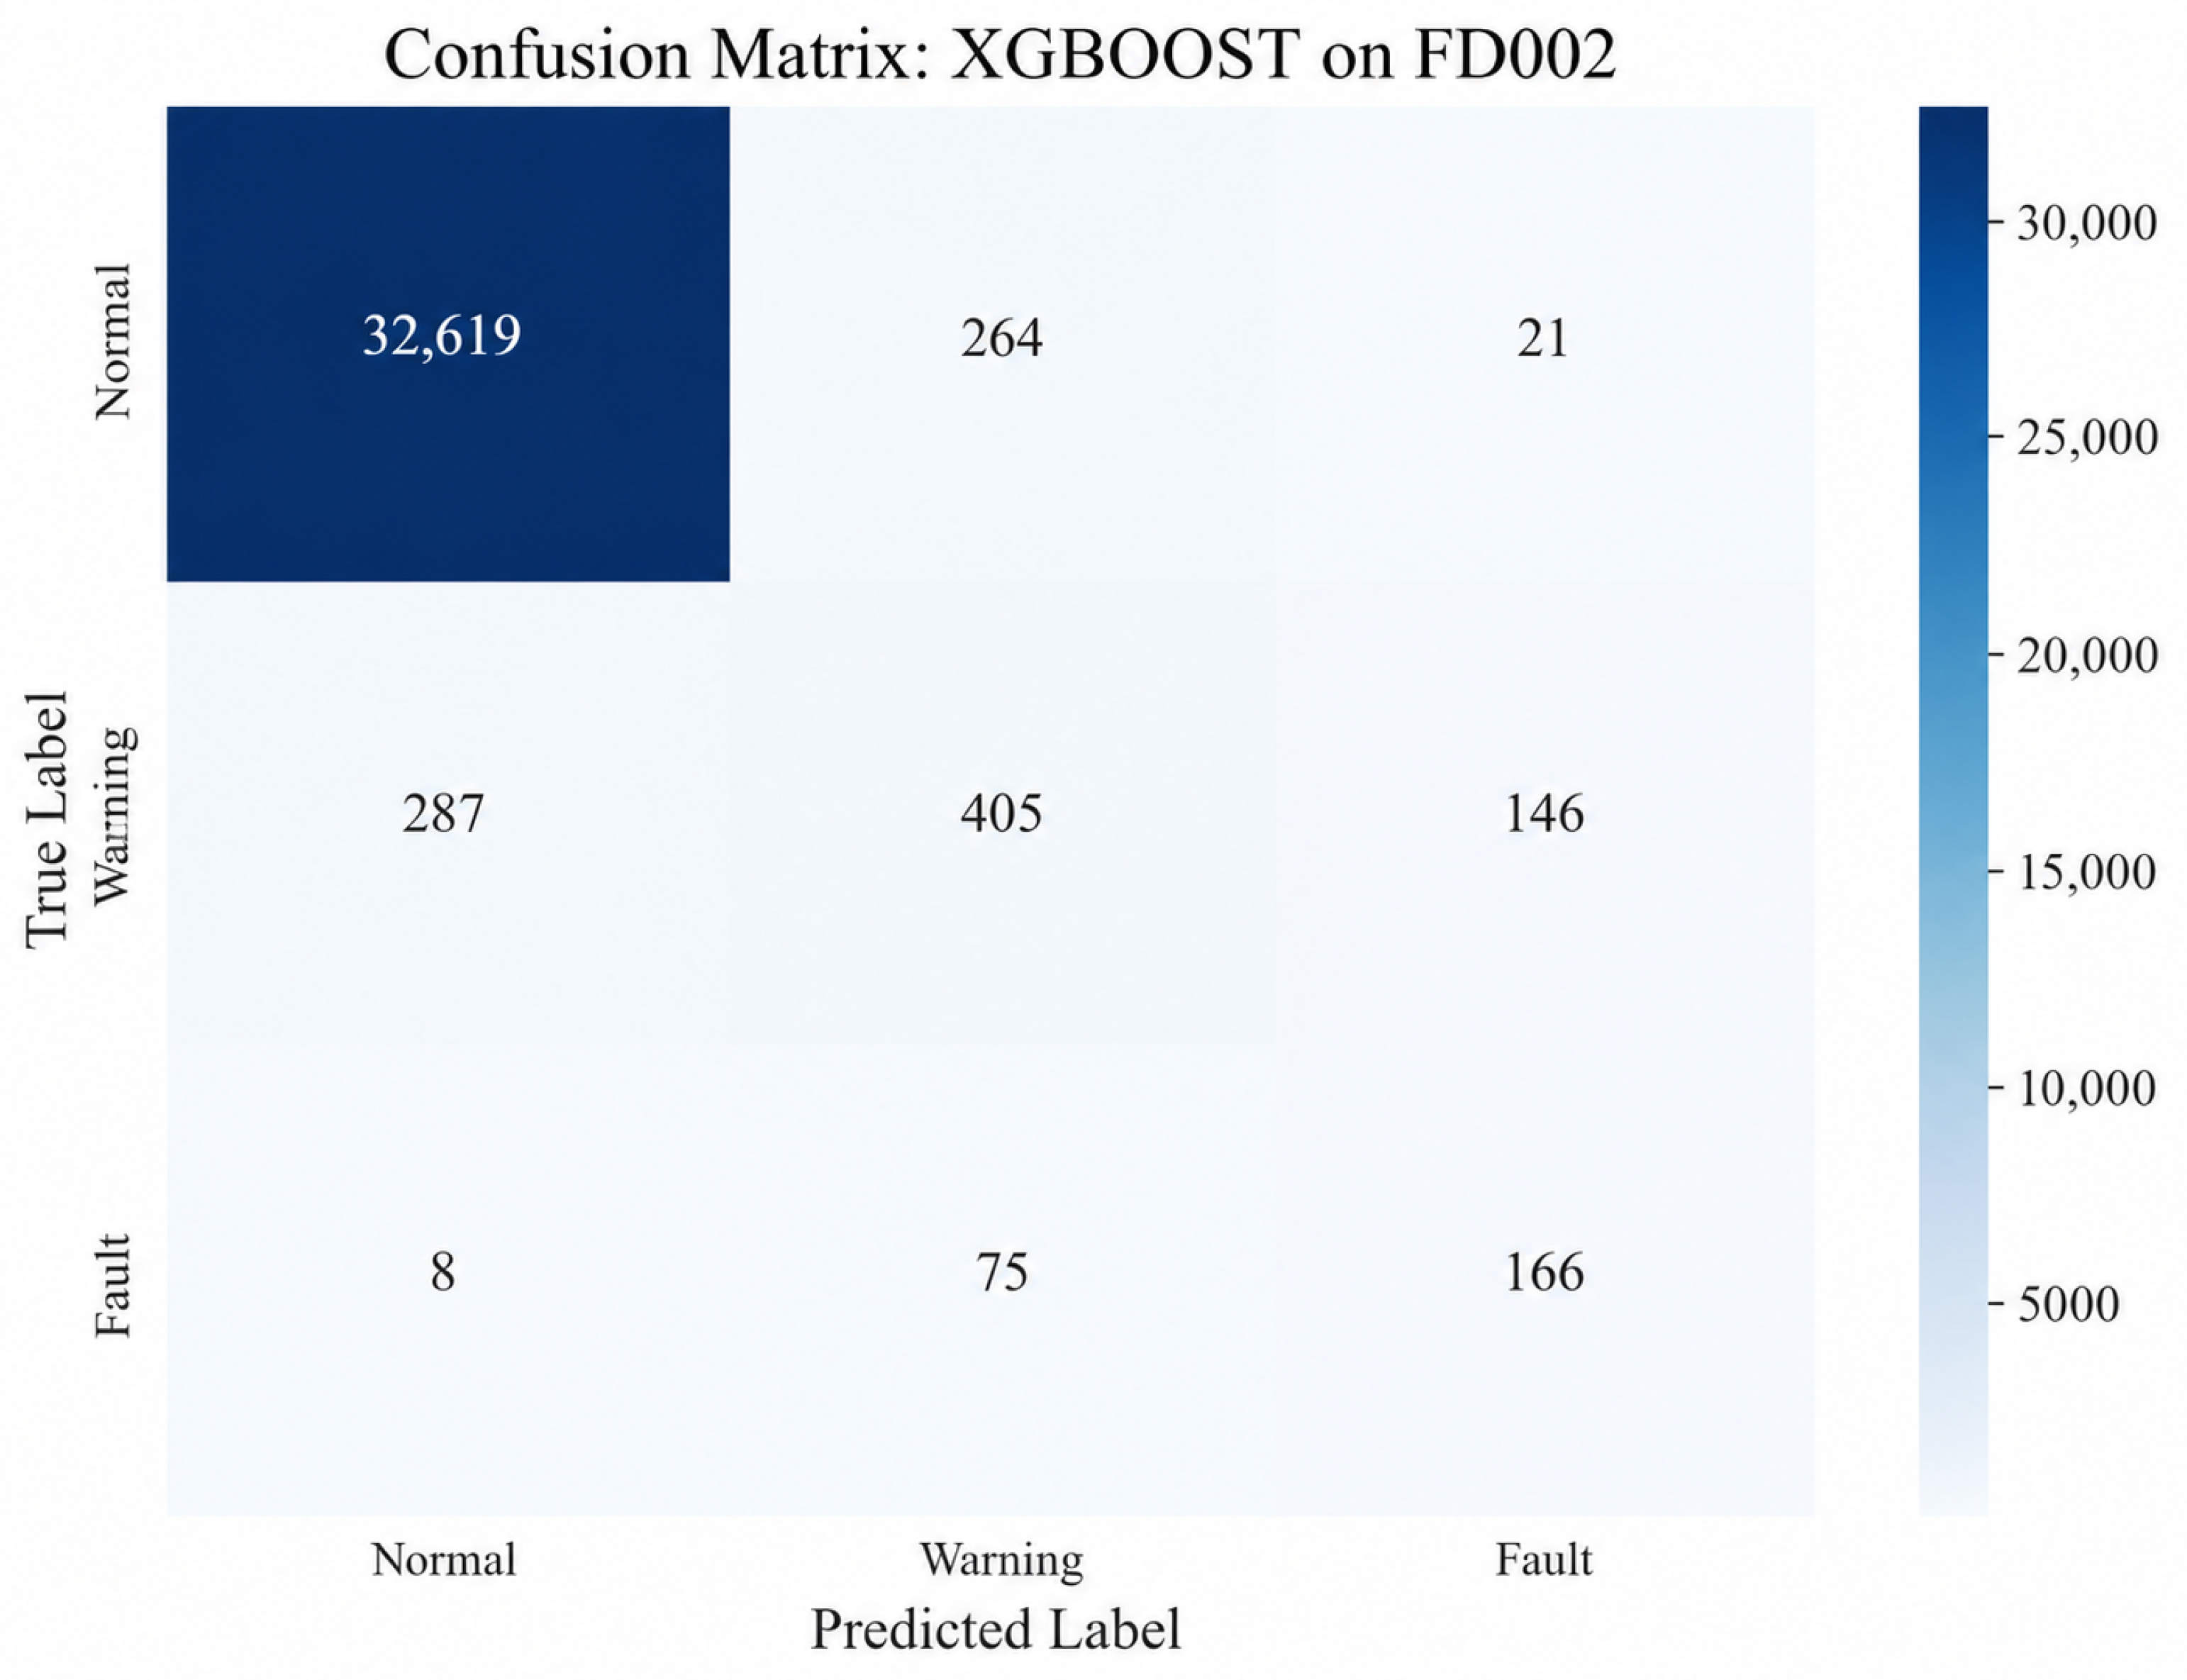
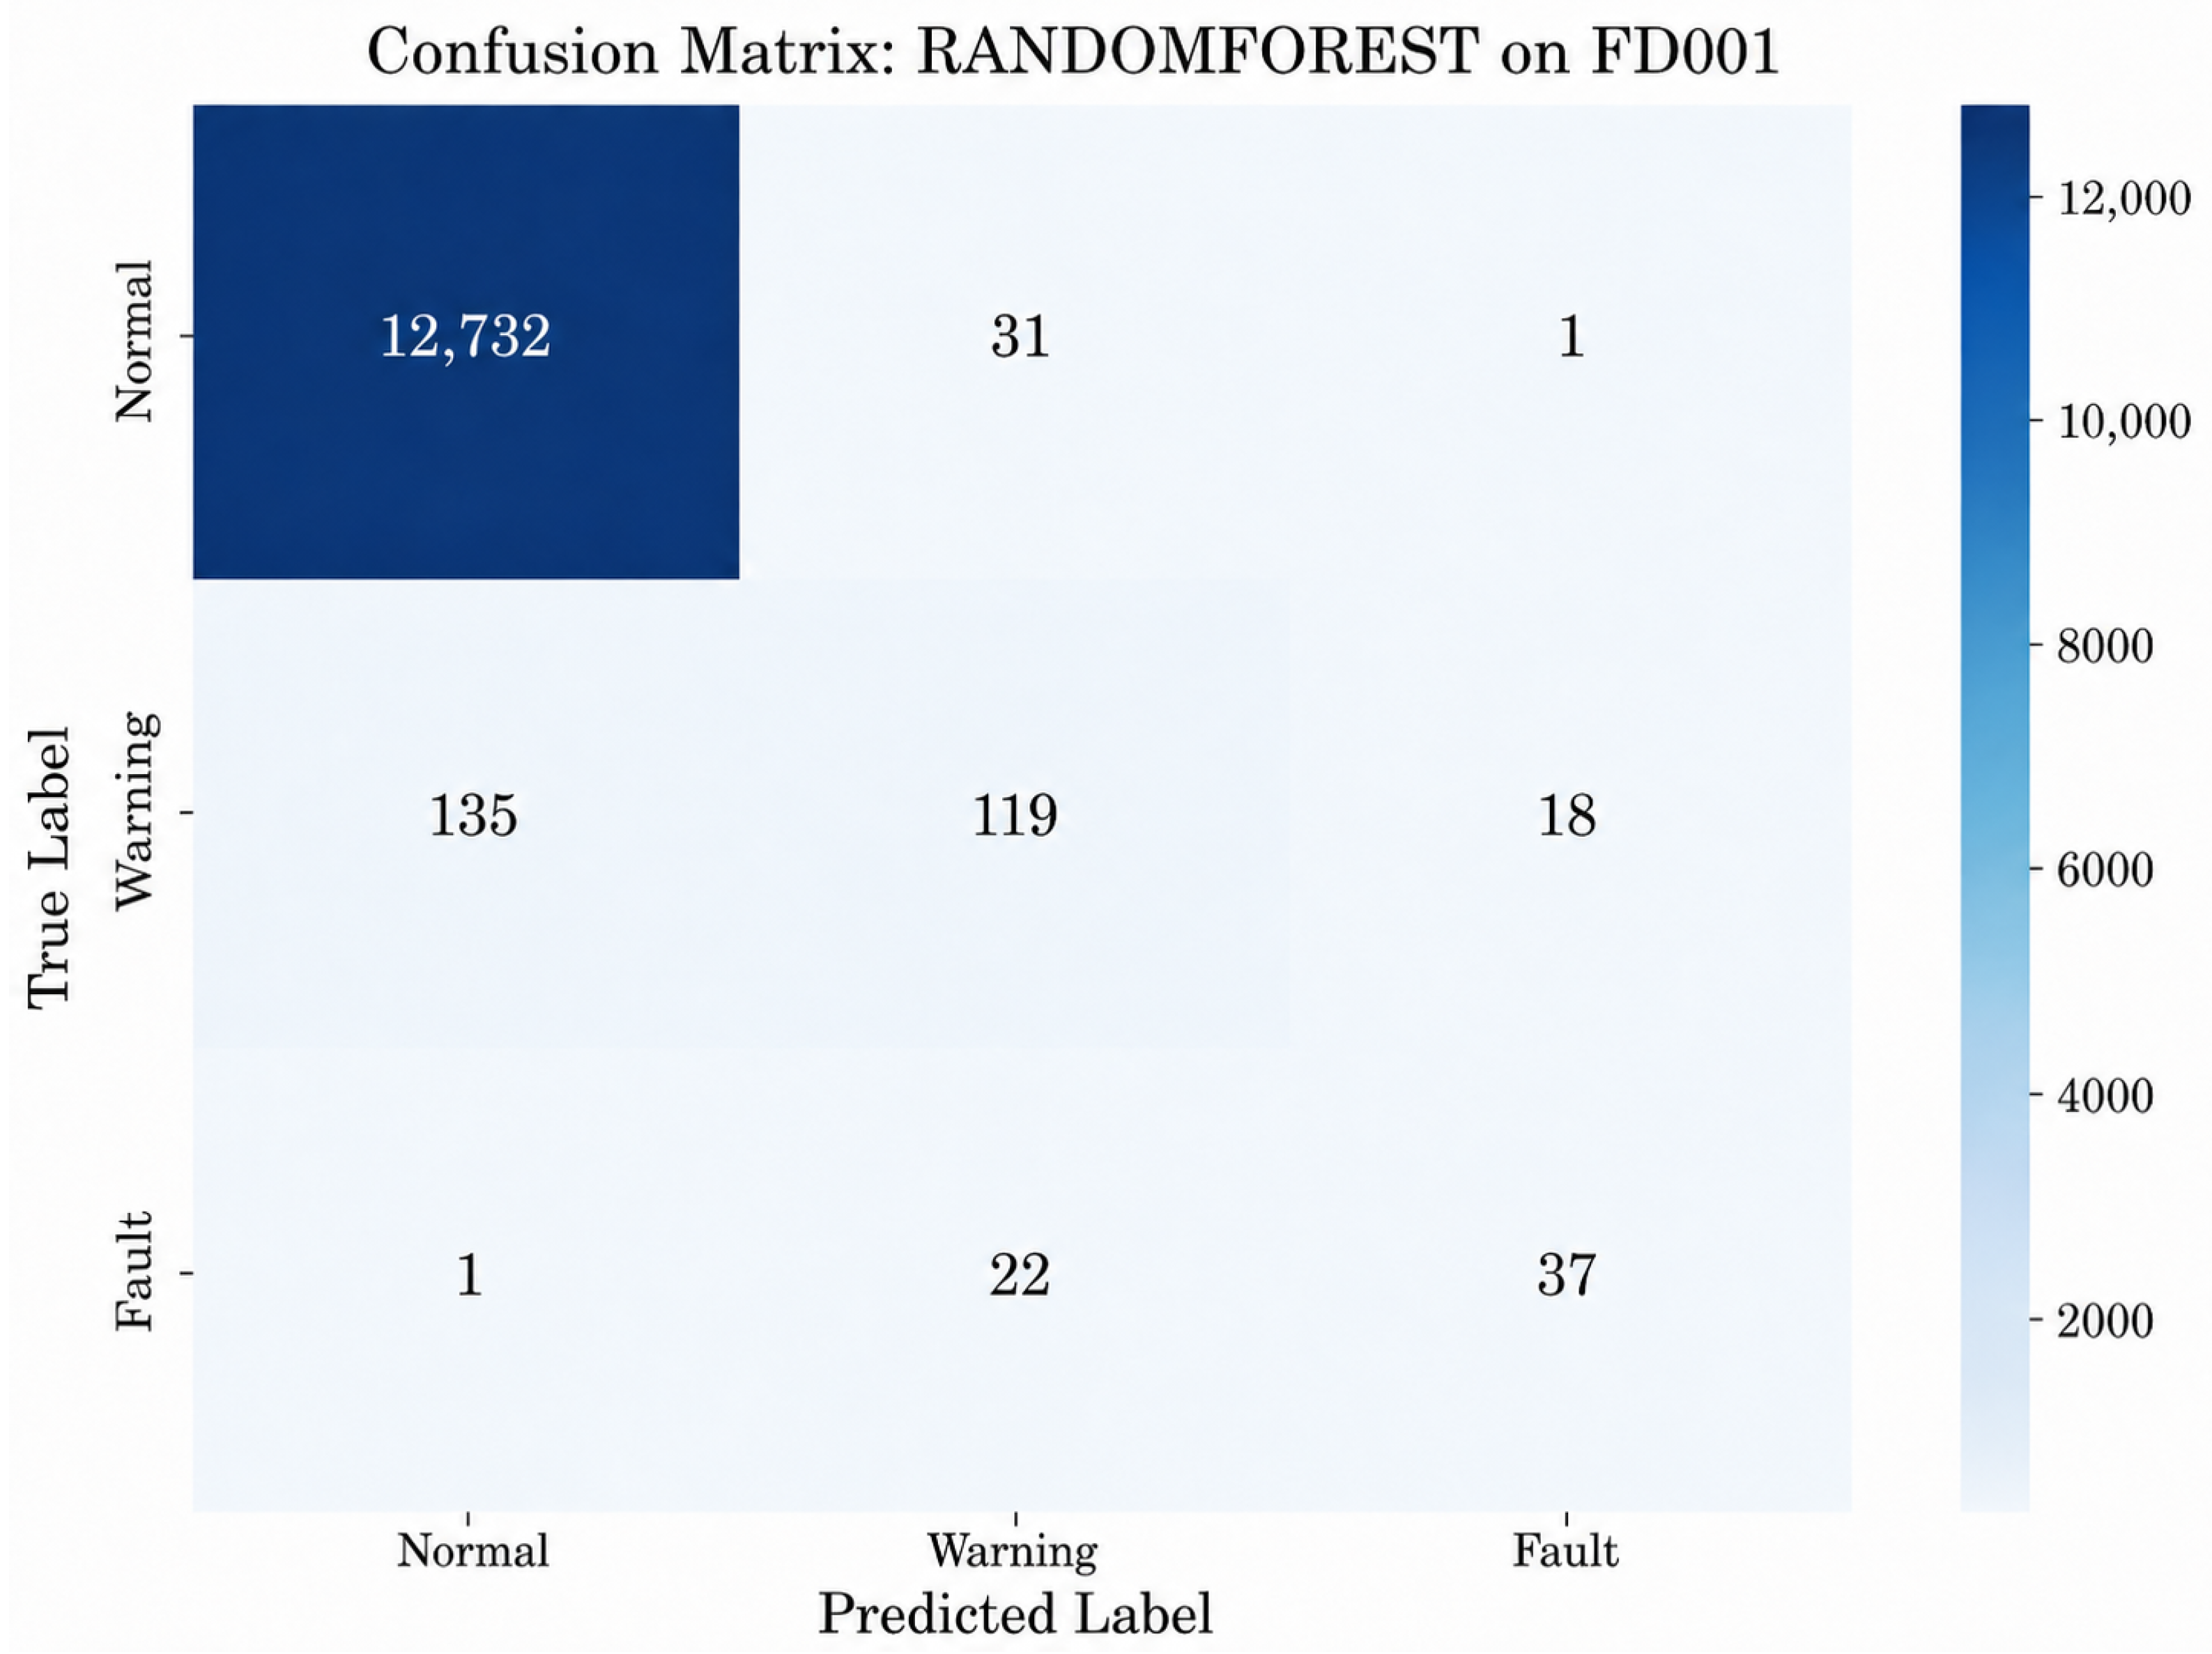
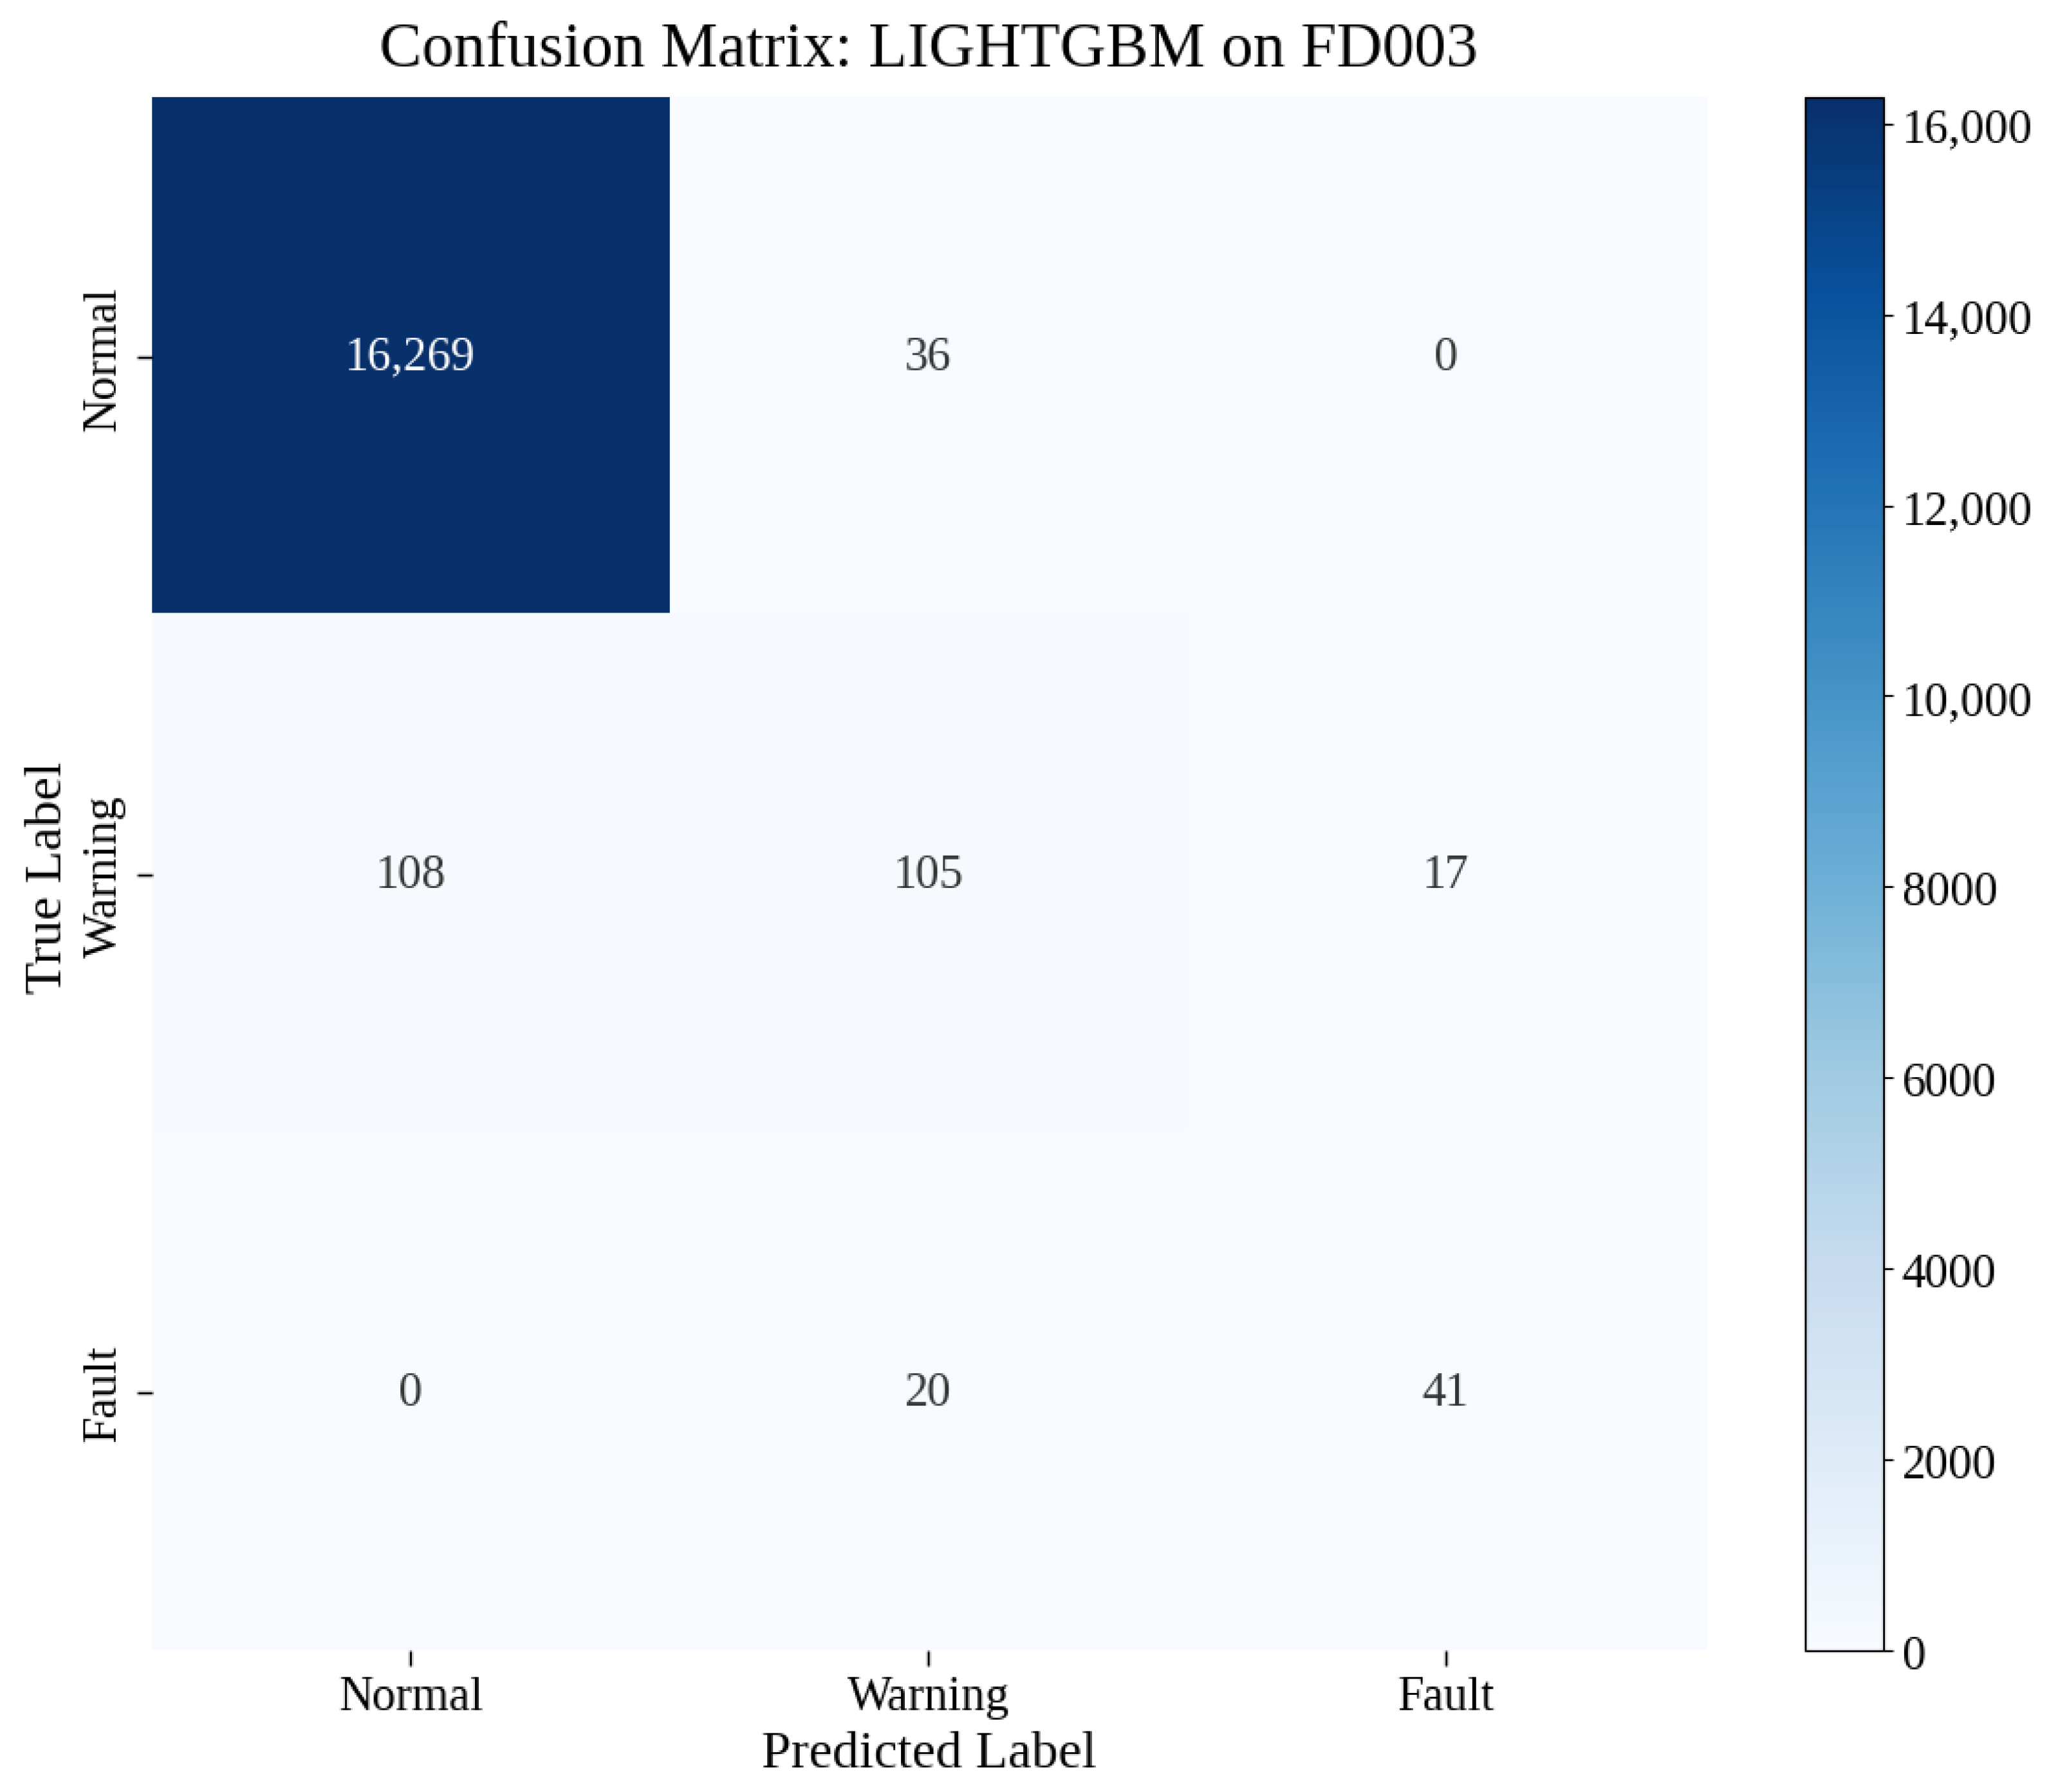
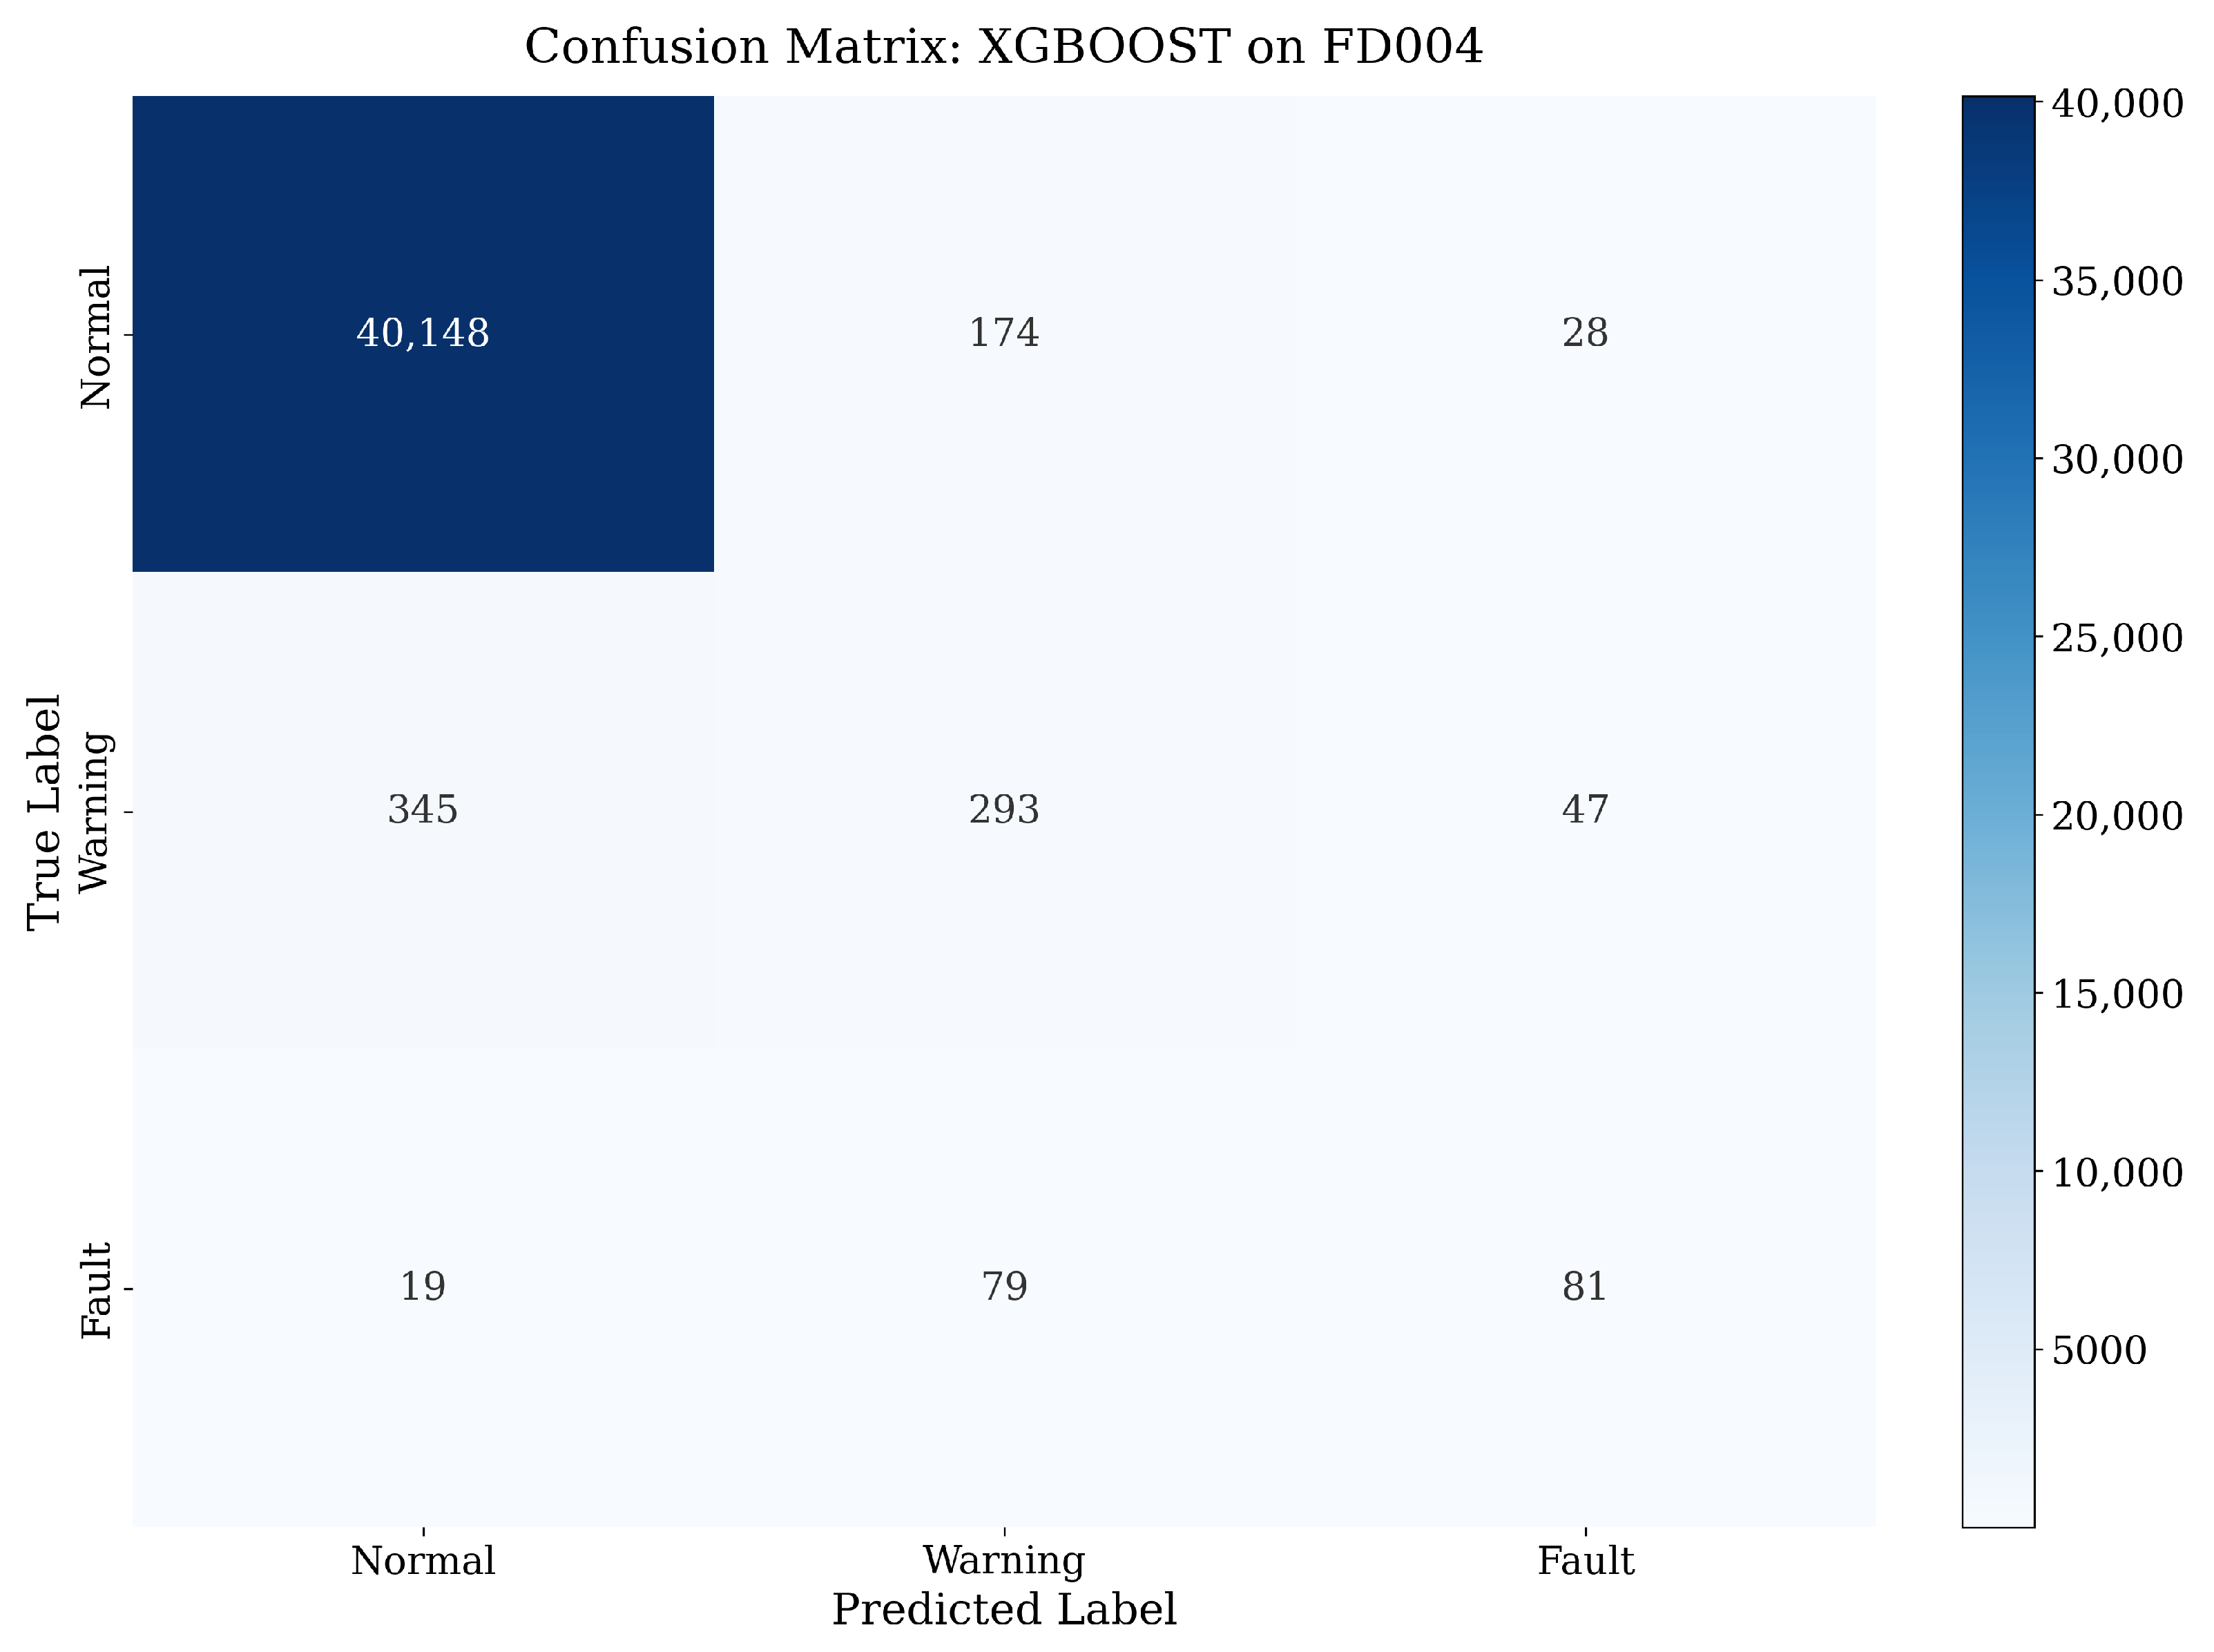
The confusion-matrix analysis of the best-performing model on each subset reveals a common structural pattern across all four datasets. As shown in
Figure 9,
Figure 10,
Figure 11 and
Figure 12, the diagonal entries for the Normal class are consistently the largest in each row, reflecting high per-class accuracy. Direct confusion between Normal and Fault is limited in all four subsets, indicating that the framework is effective at distinguishing the two outer health states. The Warning class, by contrast, shows the most off-diagonal entries in each confusion matrix, confirming that the transitional degradation stage is the primary source of classification difficulty.
As shown in
Figure 9 and
Figure 10, the confusion matrices for FD001 and FD002 show diagonal-dominant patterns for all three classes. In both subsets, the Normal class achieves high diagonal frequency, and Normal-to-Fault and Fault-to-Normal misclassifications are limited. The two outer health states are therefore more separable than the transitional Warning class, which is the expected pattern in maintenance-oriented classification.
At the same time, the two subsets reveal different levels of classification difficulty. Compared with FD001, FD002 shows a more pronounced off-diagonal concentration around the Warning class, reflecting the stronger distributional overlap introduced by multiple operating conditions. These two confusion matrices together illustrate both the general pattern of the framework and the influence of dataset complexity on class-level discrimination.
As shown in
Figure 11 and
Figure 12, the confusion patterns on FD003 and FD004 further confirm that the Warning state is the most difficult class to distinguish, even when the overall classification performance remains high. In FD003, the diagonal dominance is particularly strong, indicating relatively clear class separation, yet the remaining off-diagonal entries still concentrate mainly around the Warning class. In FD004, the overlap between Warning and its neighboring states becomes more noticeable, reflecting the increased challenge of maintenance-oriented classification under more complex degradation conditions.
These two confusion matrices further confirm that the principal difficulty of the task lies in identifying the transitional Warning region rather than separating Normal from Fault. The framework performs more reliably for the two outer health states than for the Warning class, and the main room for improvement lies in better characterization of borderline warning conditions.
In contrast, the most substantial misclassification occurs in the Warning class. Across all four subsets, Warning samples are more frequently confused with both Normal and Fault than either of the two outer states are confused with each other. This pattern is particularly evident in FD002 and FD004, where a noticeable proportion of Warning samples is predicted as Normal, and a smaller but still meaningful portion is predicted as Fault. Such behavior is consistent with the role of Warning as an intermediate degradation stage located near the decision boundary between health and failure-prone conditions.
4.5. Class-Wise Discriminative Ability Based on ROC Curves
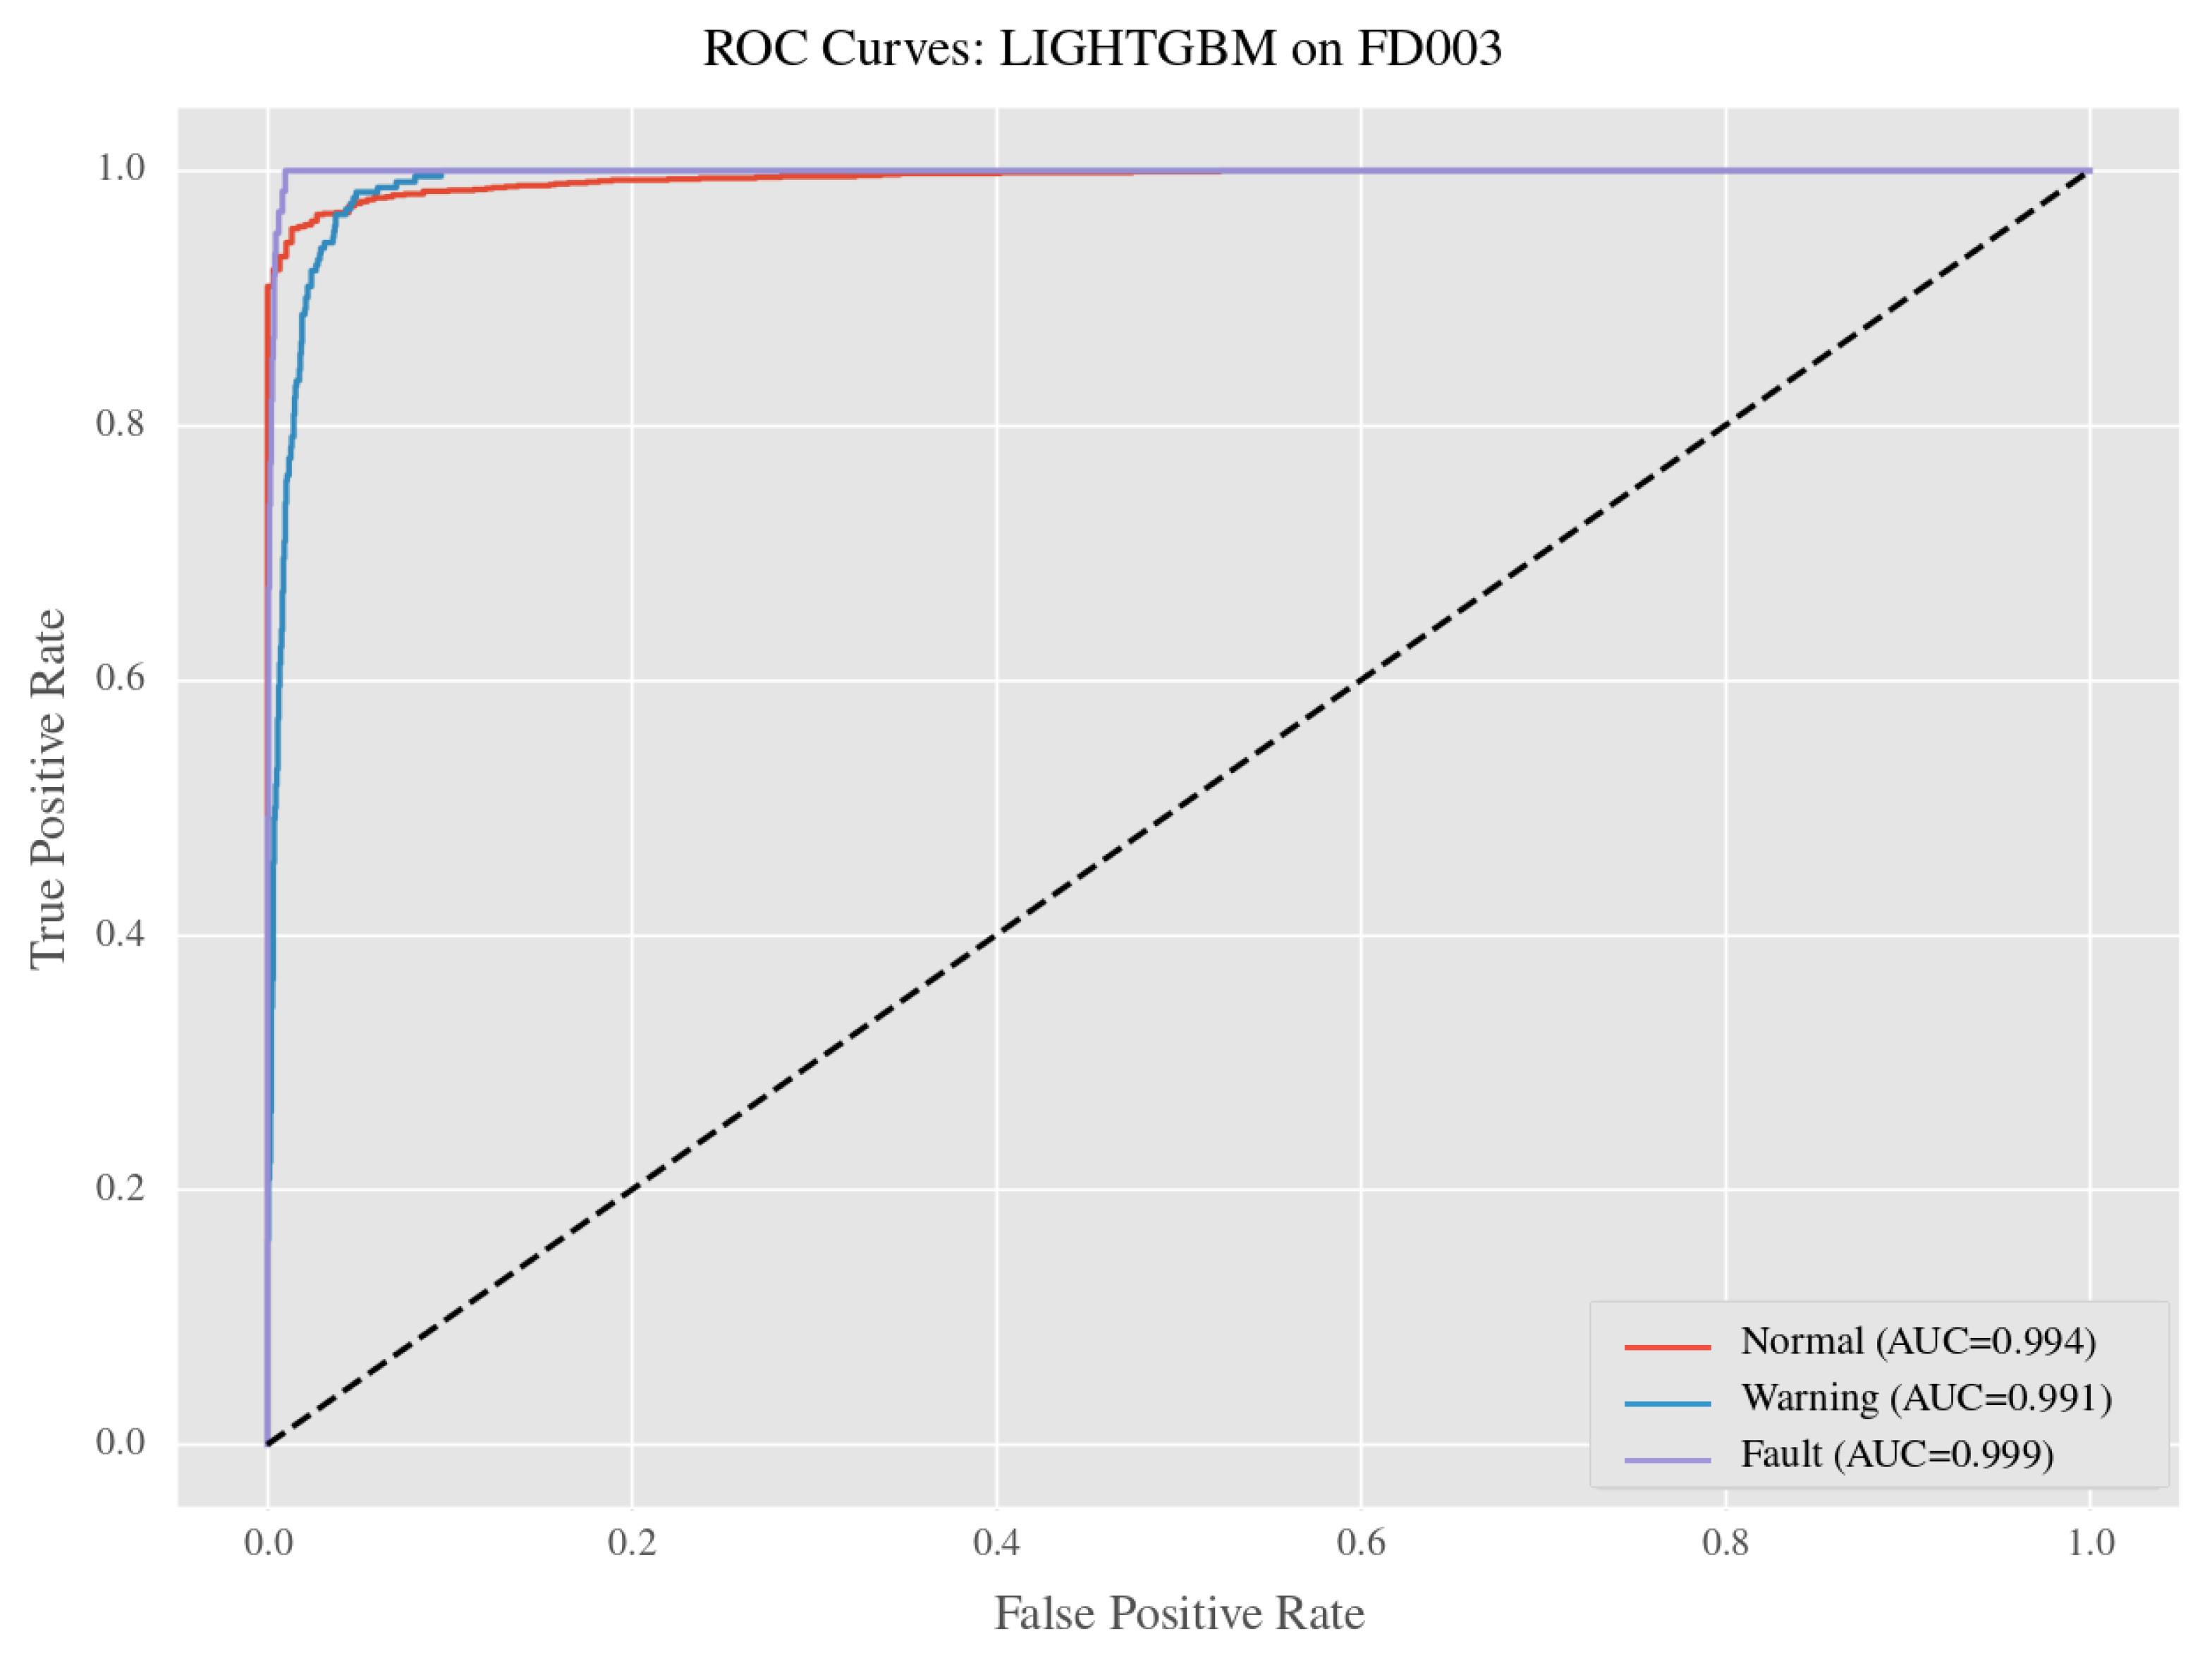
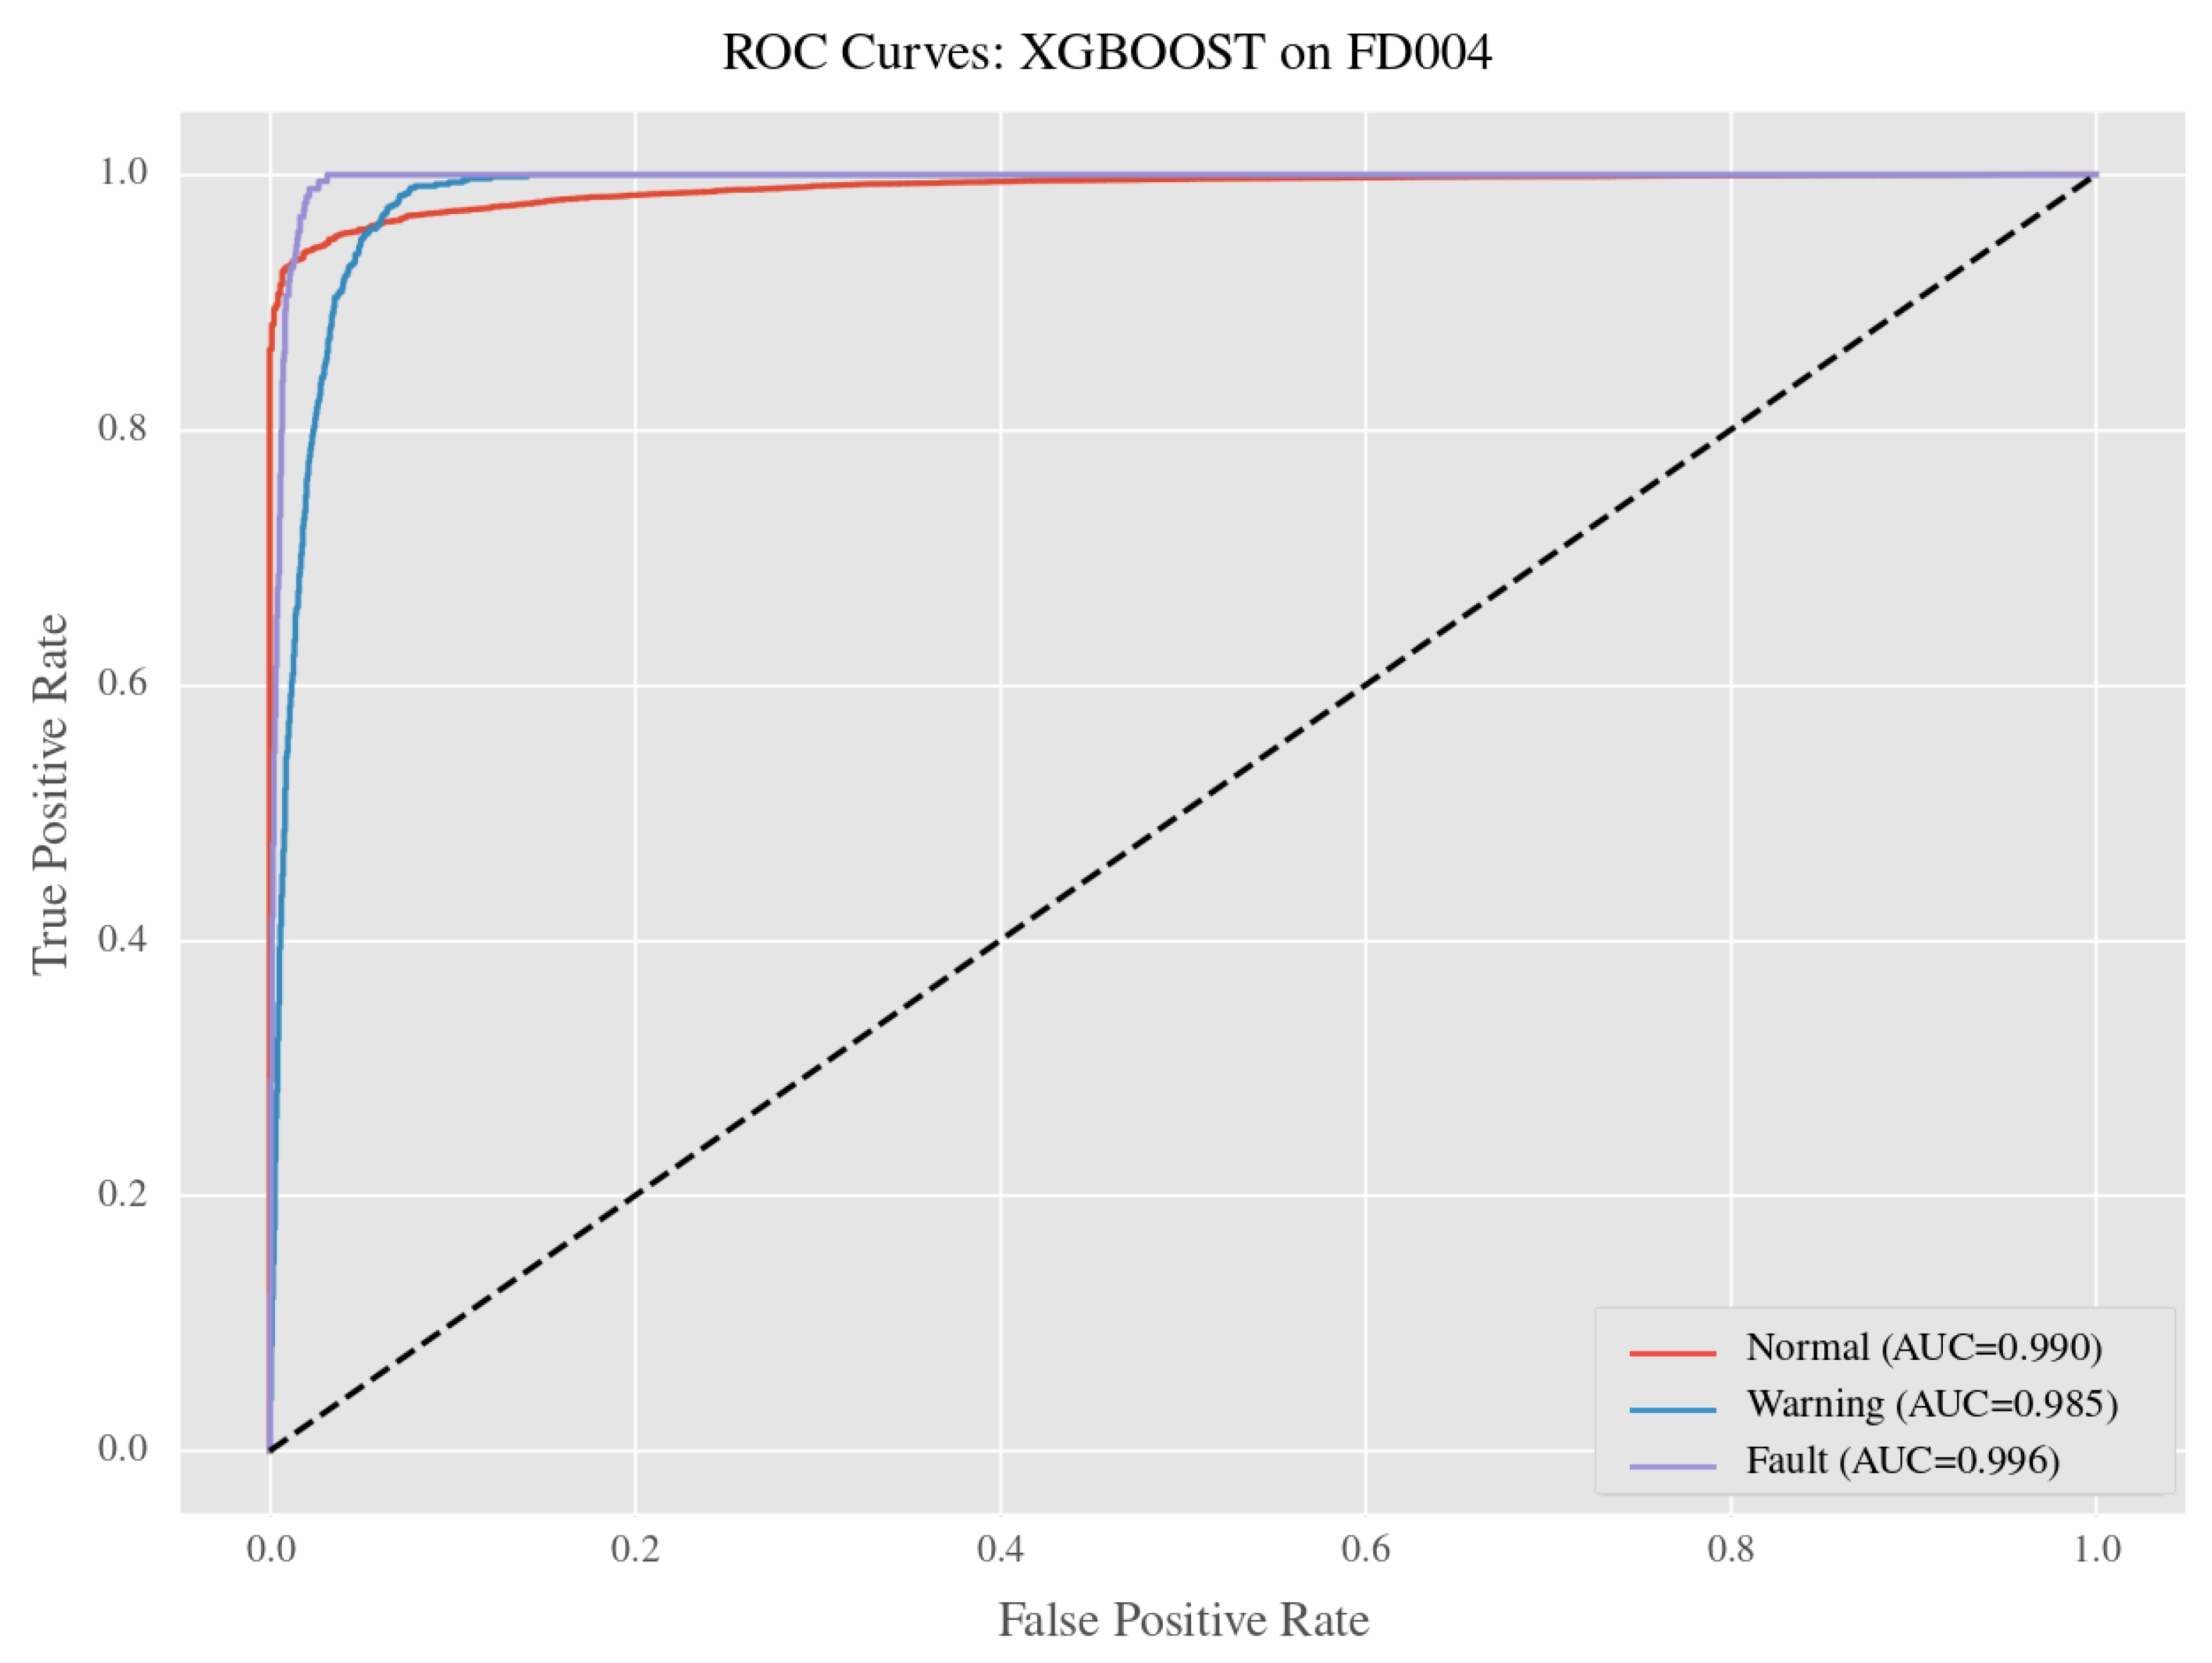
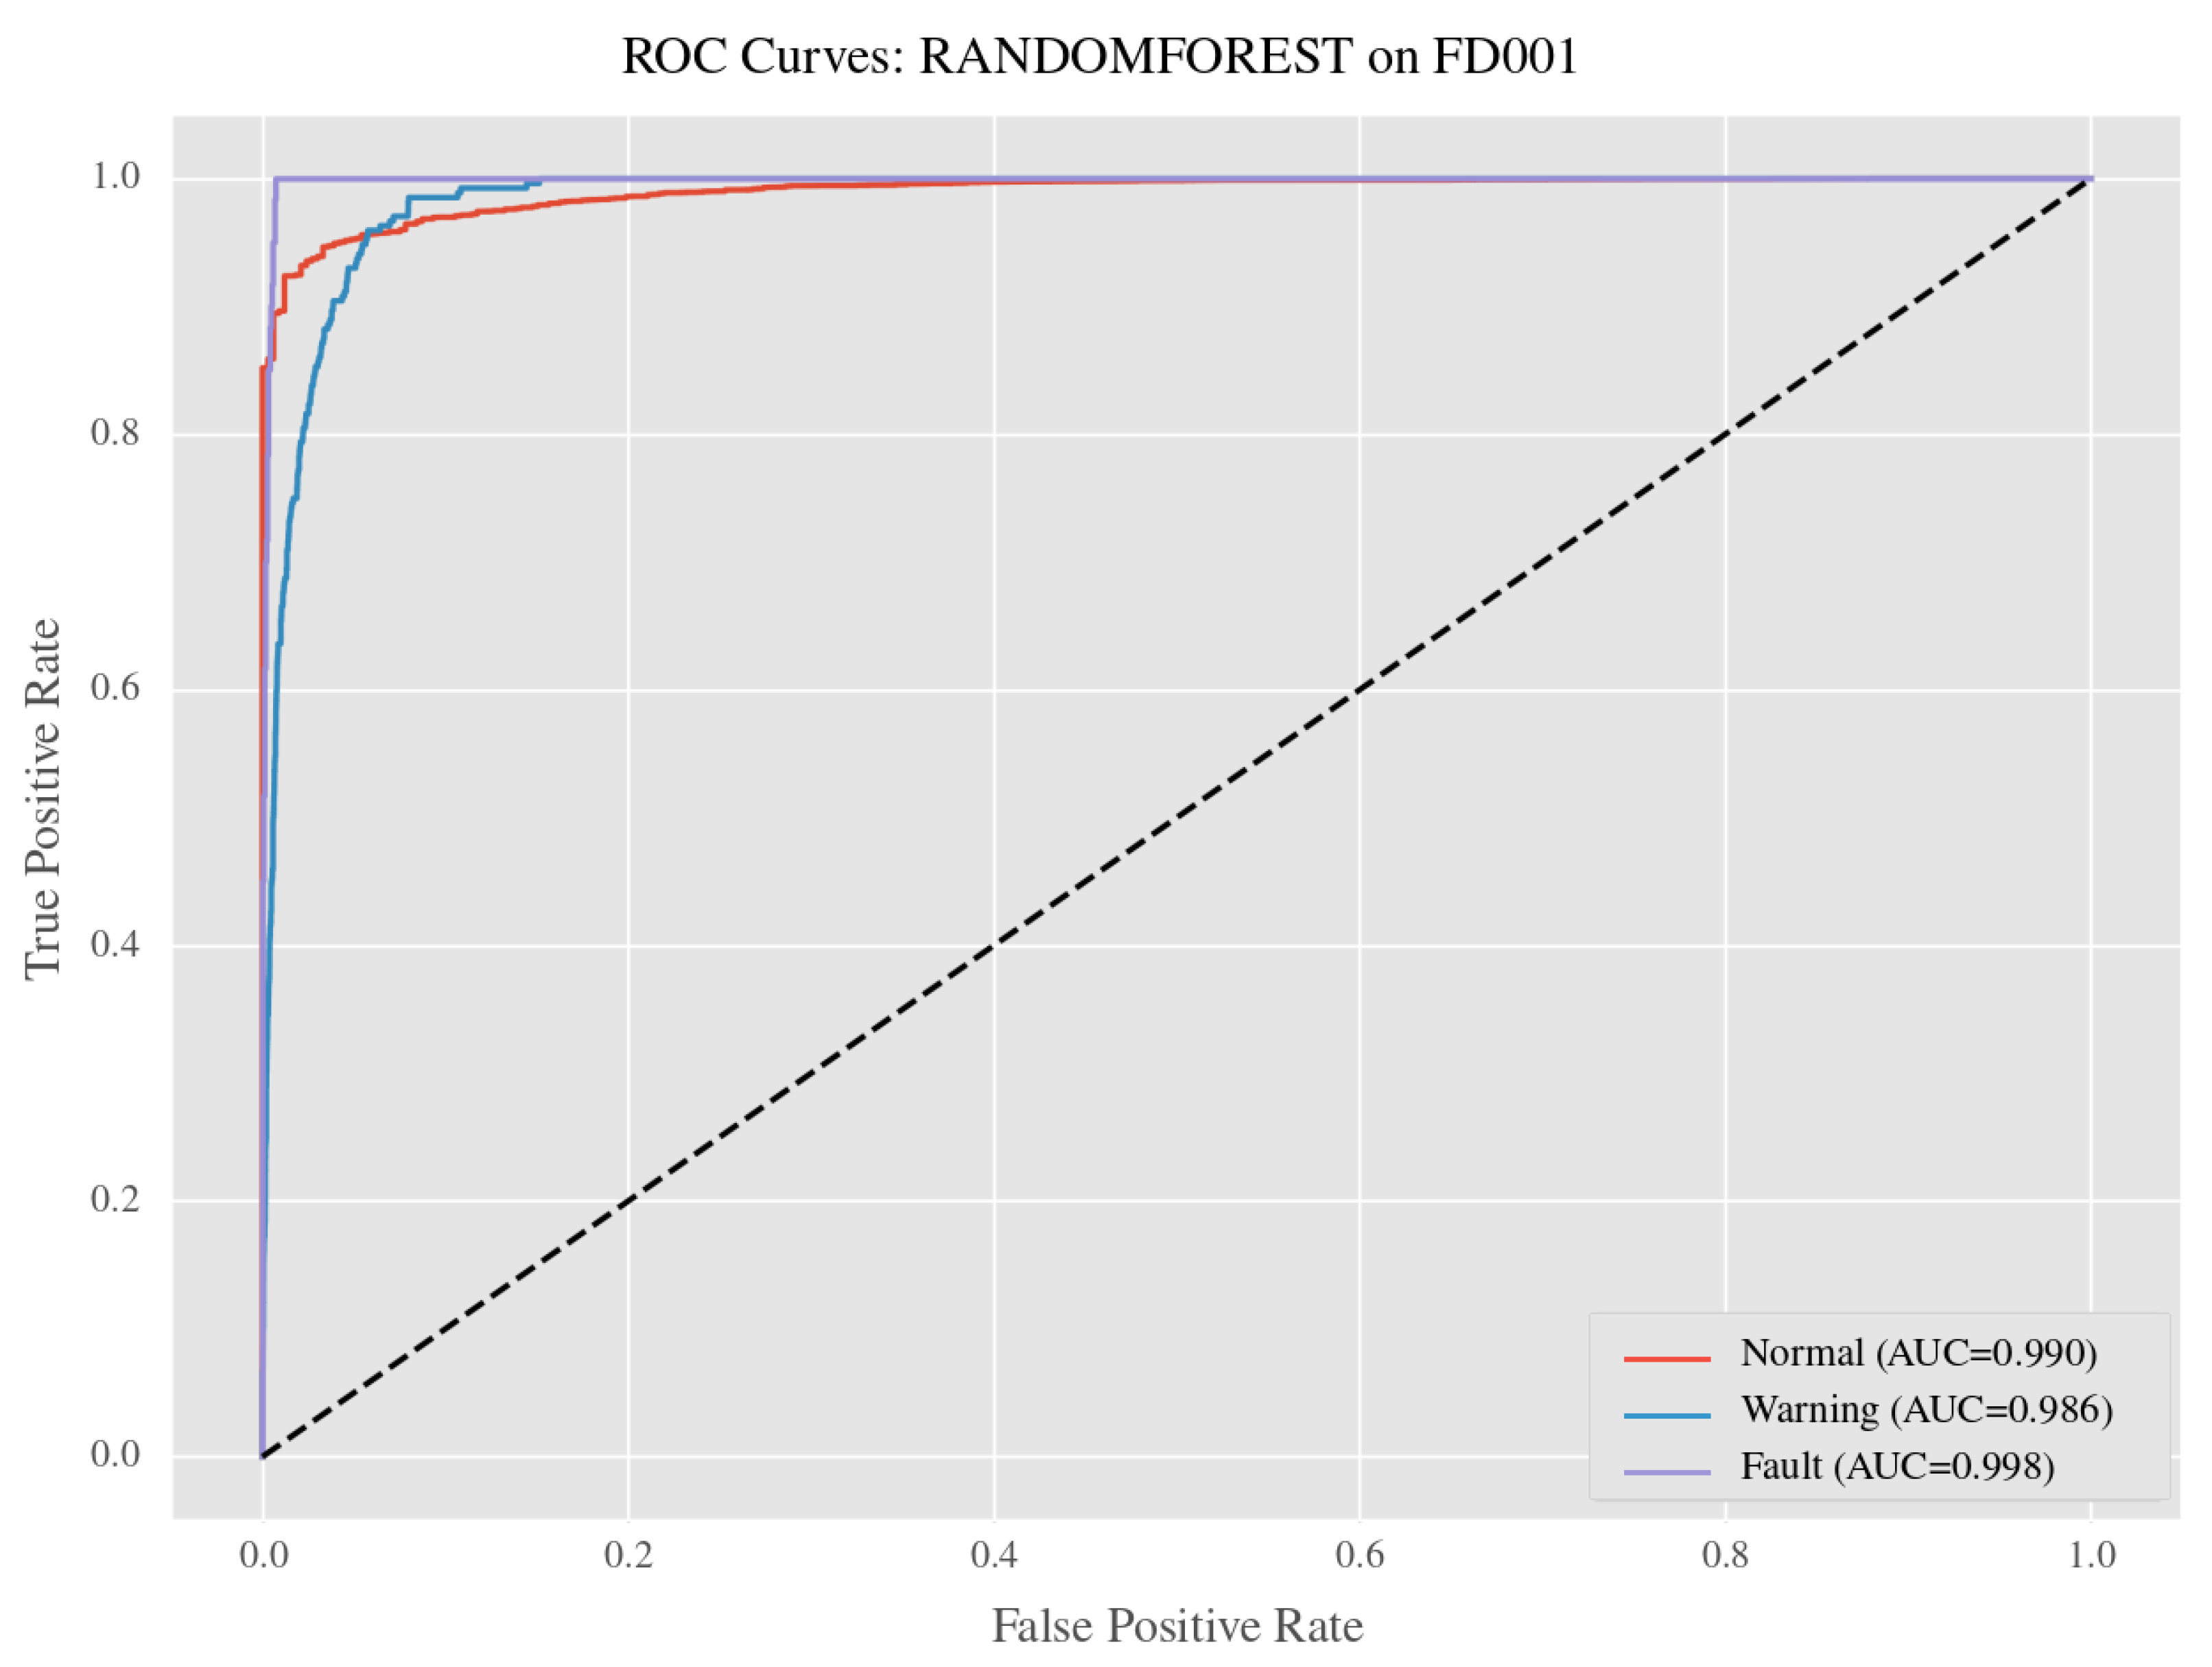
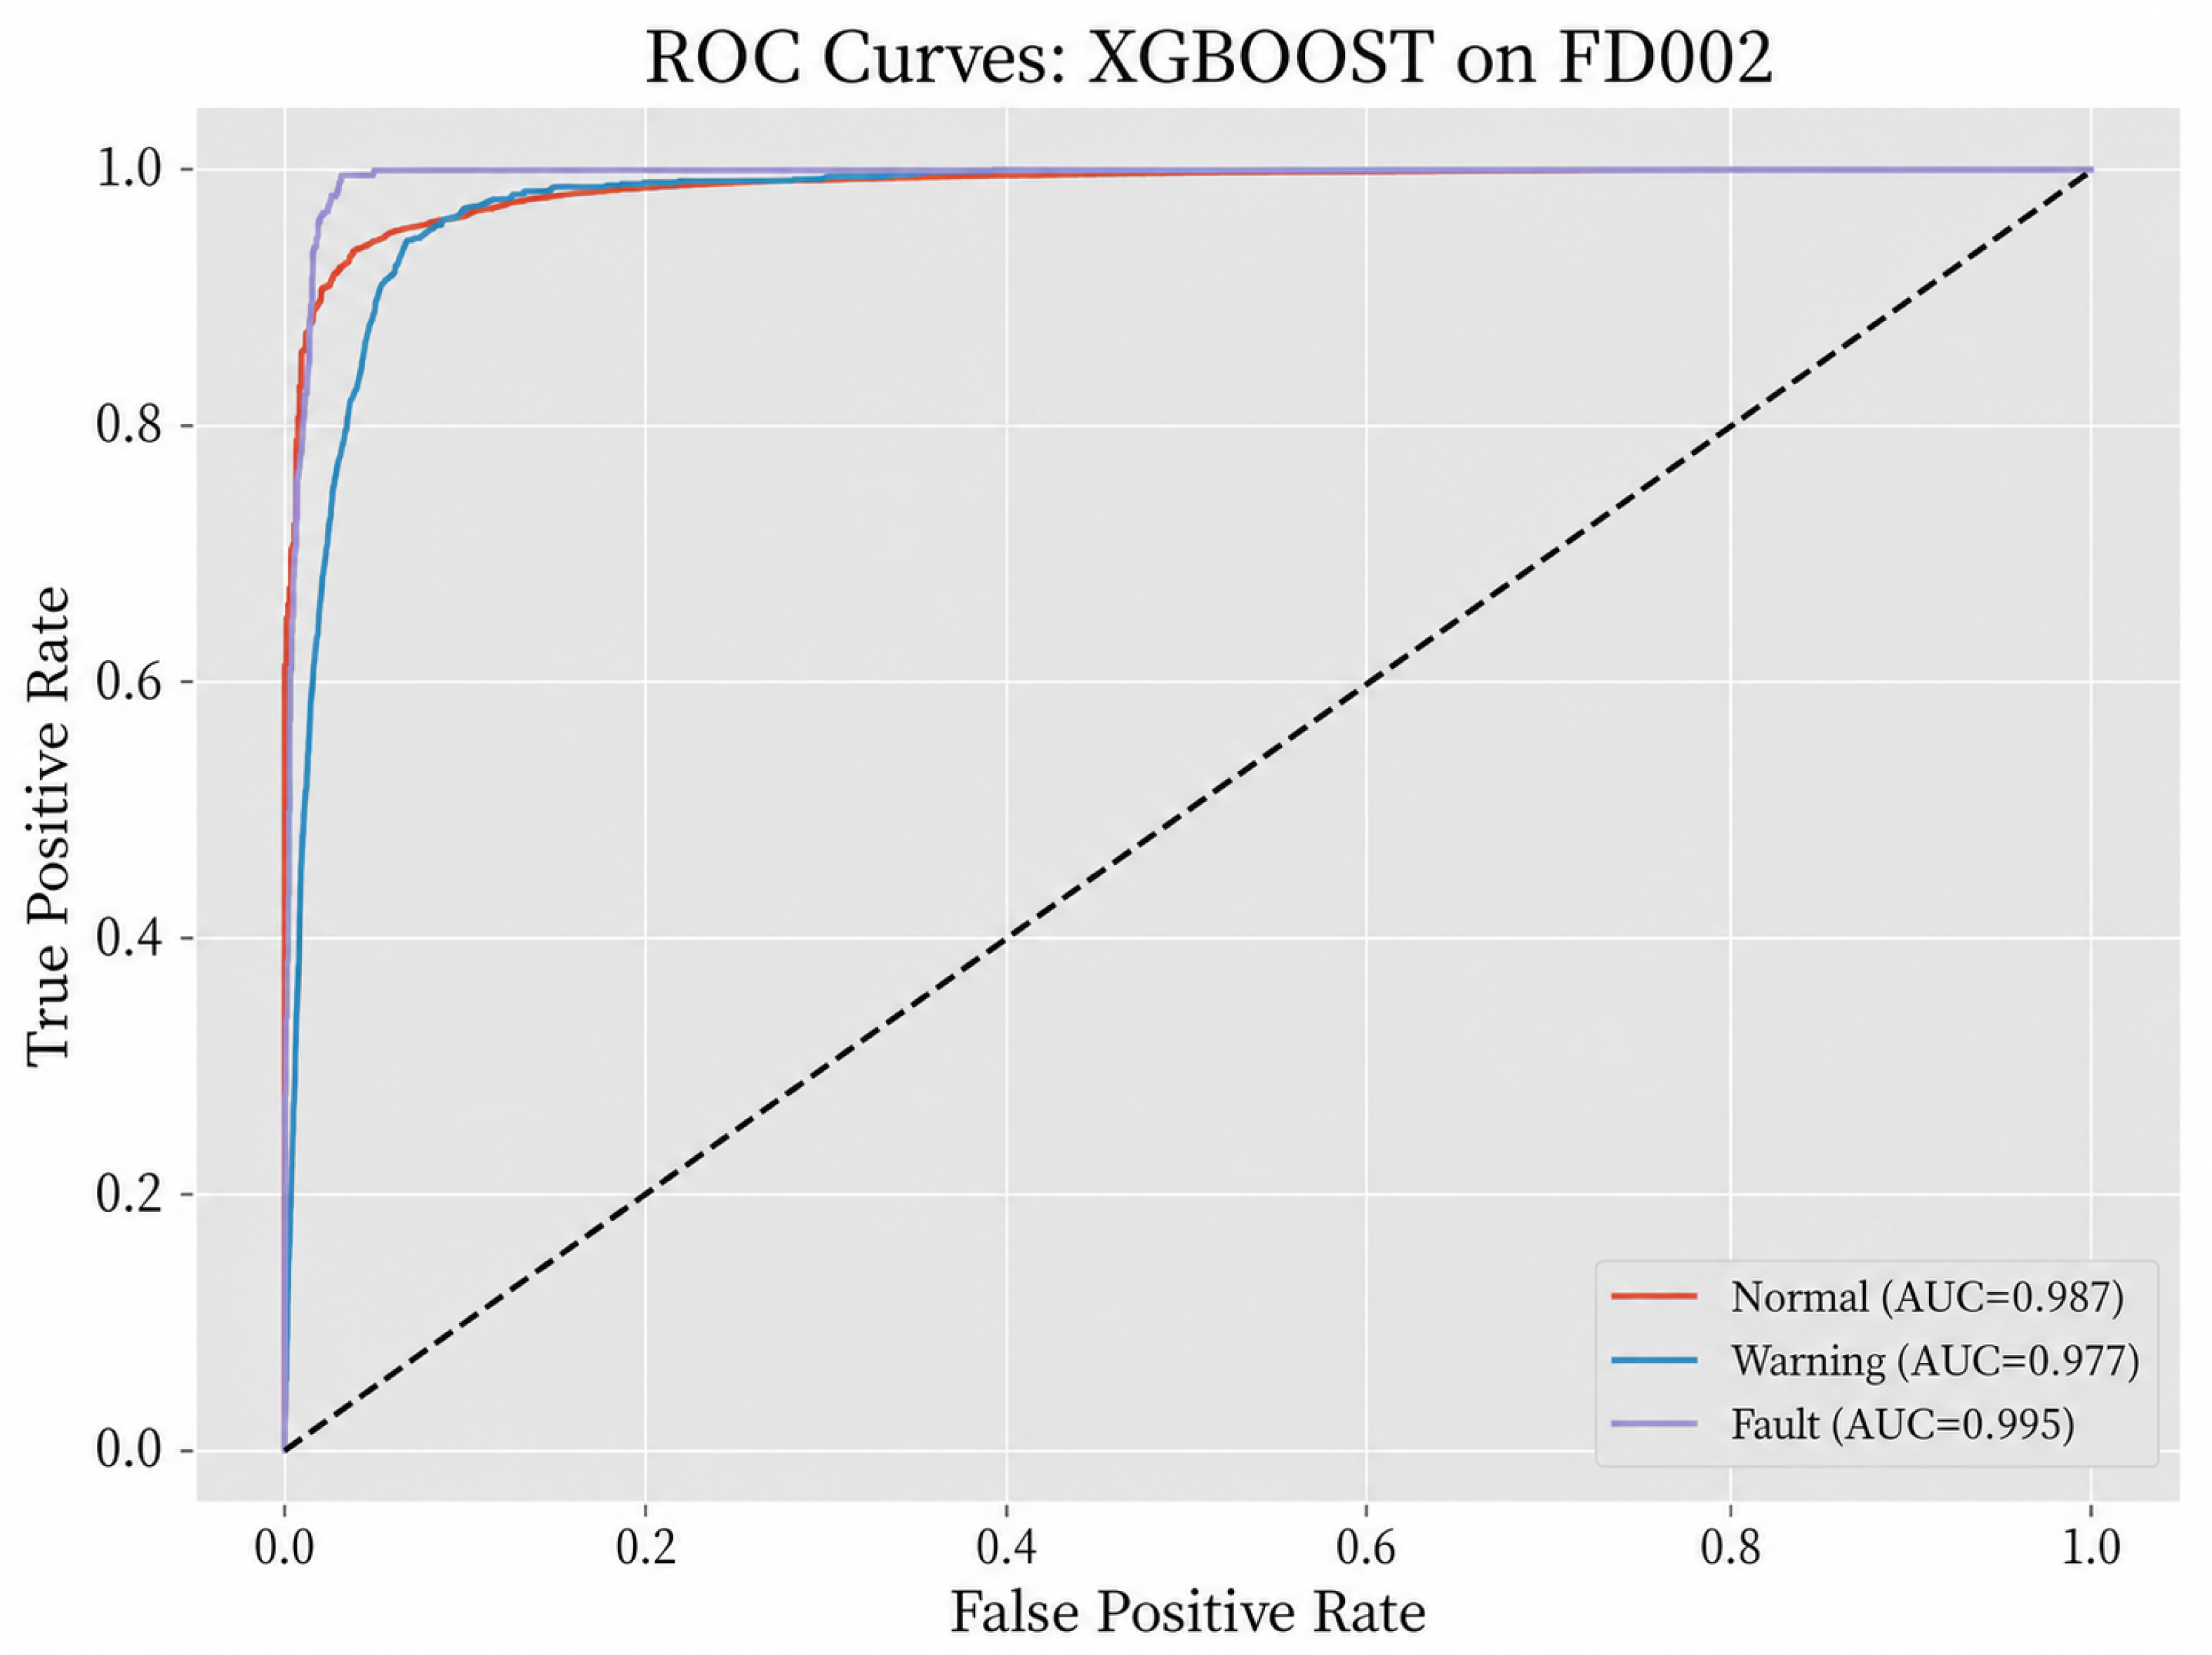
To further evaluate the class-wise discriminative ability of the proposed framework, the ROC curves of the best-performing model on each C-MAPSS subset are examined. Compared with hard-label metrics such as accuracy and F1-score, ROC analysis provides a more detailed view of how well the model separates different health states in the probability space. This is particularly important in the present study, because predictive maintenance not only requires correct classification outcomes, but also depends on reliable ranking behavior across Normal, Warning, and Fault states. The ROC results show that the best-performing models on FD001–FD004 achieve favorable discrimination performance, with curves remaining close to the upper-left region of the ROC space and class-wise AUC values at high levels across all subsets.
As shown in
Figure 13, the ROC curves on FD001 show favorable class-wise separability for all three health states. The curves of the Normal and Fault classes remain close to the ideal upper-left boundary, indicating reliable discrimination under the single-condition setting. By contrast, the Warning class exhibits slightly weaker separation, which is consistent with the transitional nature of the intermediate degradation stage.
As shown in
Figure 14, the ROC curves on FD002 indicate that the best-performing model maintains satisfactory discrimination ability under a more complex degradation environment. Compared with FD001, the Warning-class curve shows a slightly more inward shape, indicating reduced separability in the transitional state. This is consistent with the observation that multi-condition settings introduce additional distributional overlap near the decision boundary between healthy and degraded conditions.
Despite this increased difficulty, the Fault class retains favorable separability, with the corresponding ROC curve remaining close to the ideal boundary. This is important for predictive maintenance applications because it suggests that the model retains sensitivity to severe degradation even under more challenging operating conditions.
As shown in
Figure 15, the ROC curves on FD003 show the most favorable overall discrimination performance among the four subsets, with all three class curves remaining close to the ideal upper-left region. This indicates that the learned representation achieves clearer class separation in FD003 relative to the other subsets under the present framework.
As shown in
Figure 16, the ROC curves on FD004 also show good class-level separability, although the Warning class remains the least separable of the three categories. The Normal and Fault classes both show favorable ROC behavior, indicating that the framework distinguishes the two outer health states reasonably well even under a more complex operating scenario.
Compared with FD003, the ROC pattern of FD004 reveals slightly stronger overlap in the warning-related region, consistent with the increased heterogeneity of its degradation conditions. The intermediate health state continues to be the principal source of residual ambiguity, while the identification of fault-prone states remains comparatively reliable.
Overall, the ROC results indicate that the framework separates the two outer health states consistently across all subsets under the present benchmark conditions, while Warning-class discrimination remains the primary source of residual ambiguity. This pattern is consistent with the inherent difficulty of transitional degradation stages in aero-engine health evolution, and suggests that future improvements in intermediate-state characterization are likely to have the greatest practical impact.




 ,
,