Article

Automatic Recognition Technology of Welding Path for Ship Structures Based on Visual Image Recognition
School of Naval Architecture and Ocean Engineering, Jiangsu University of Science and Technology, Zhenjiang 212100, China
*
Author to whom correspondence should be addressed.
Machines 2026, 14(6), 663; https://doi.org/10.3390/machines14060663
Submission received: 19 April 2026 / Revised: 27 May 2026 / Accepted: 4 June 2026 / Published: 8 June 2026
(This article belongs to the Special Issue Advances in Smart Manufacturing and Industry 4.0)

Abstract

To overcome the inherent limitations of conventional offline programming in adapting to dimensional deviations and assembly-induced errors during robotic welding of ship structures, this paper proposes a point-cloud-enhanced visual scanning paradigm that enables automatic weld seam identification and collision-free trajectory planning. A dedicated monochromatic vision system is rigidly integrated onto a six-axis industrial robot, enabling high-fidelity feature extraction and geometric contour reconstruction for the precise localization of multi-configuration weld seams. The proposed approach substantially reduces manual teaching operations, enhances environmental adaptability in unstructured shipbuilding workshops, and improves global positioning accuracy. The core technical contributions are threefold: (1) systematic design and precision calibration of the integrated robotic vision system, including a hand–eye calibration procedure; (2) development of a hybrid 2D image-3D point cloud processing pipeline that combines SURF and FLANN for image stitching with RANSAC-based plane segmentation and PCA-driven contour reconstruction; and (3) extensive experimental validation across five distinct workpiece configurations. These results confirm the system’s strong applicability for intelligent and efficient shipbuilding welding, significantly outperforming conventional offline programming, which exhibits deviations exceeding 5 mm under identical conditions. Quantitative error analysis demonstrates that the online recognition method achieves a weld localization root mean square error (RMSE)of 0.82 mm, a standard deviation of 0.45 mm, and a verified maximum absolute deviation of 1.5 mm.

1. Introduction

The global shipbuilding industry has faced sustained operational pressure since the 2008 financial crisis, leading to industrial consolidation, capacity reduction, and a strategic push for structural optimization [1,2]. The advent of the “Industry 4.0” paradigm and the “Made in China 2025” initiative has positioned the transformation and upgrading of shipbuilding enterprises toward intelligent manufacturing as a critical imperative [3,4]. Within this context, hull welding-a process that is both labor-intensive and cycle-time-critical-represents a primary bottleneck. The automation and intelligentization of welding processes are thus essential enablers for enhancing efficiency and maintaining stringent cost control [5,6].
Welding is an indispensable process in hull construction, characterized by diverse structural components, complex joint configurations, and a significant aggregate welding workload. Consequently, the integration of robotic systems is a key developmental trajectory [7,8]. While advanced international shipyards, particularly in Japan and South Korea, have achieved automation rates of approximately 80% for specific applications, the majority of domestic Chinese shipyards still rely on manual and semiautomatic operations [9,10].
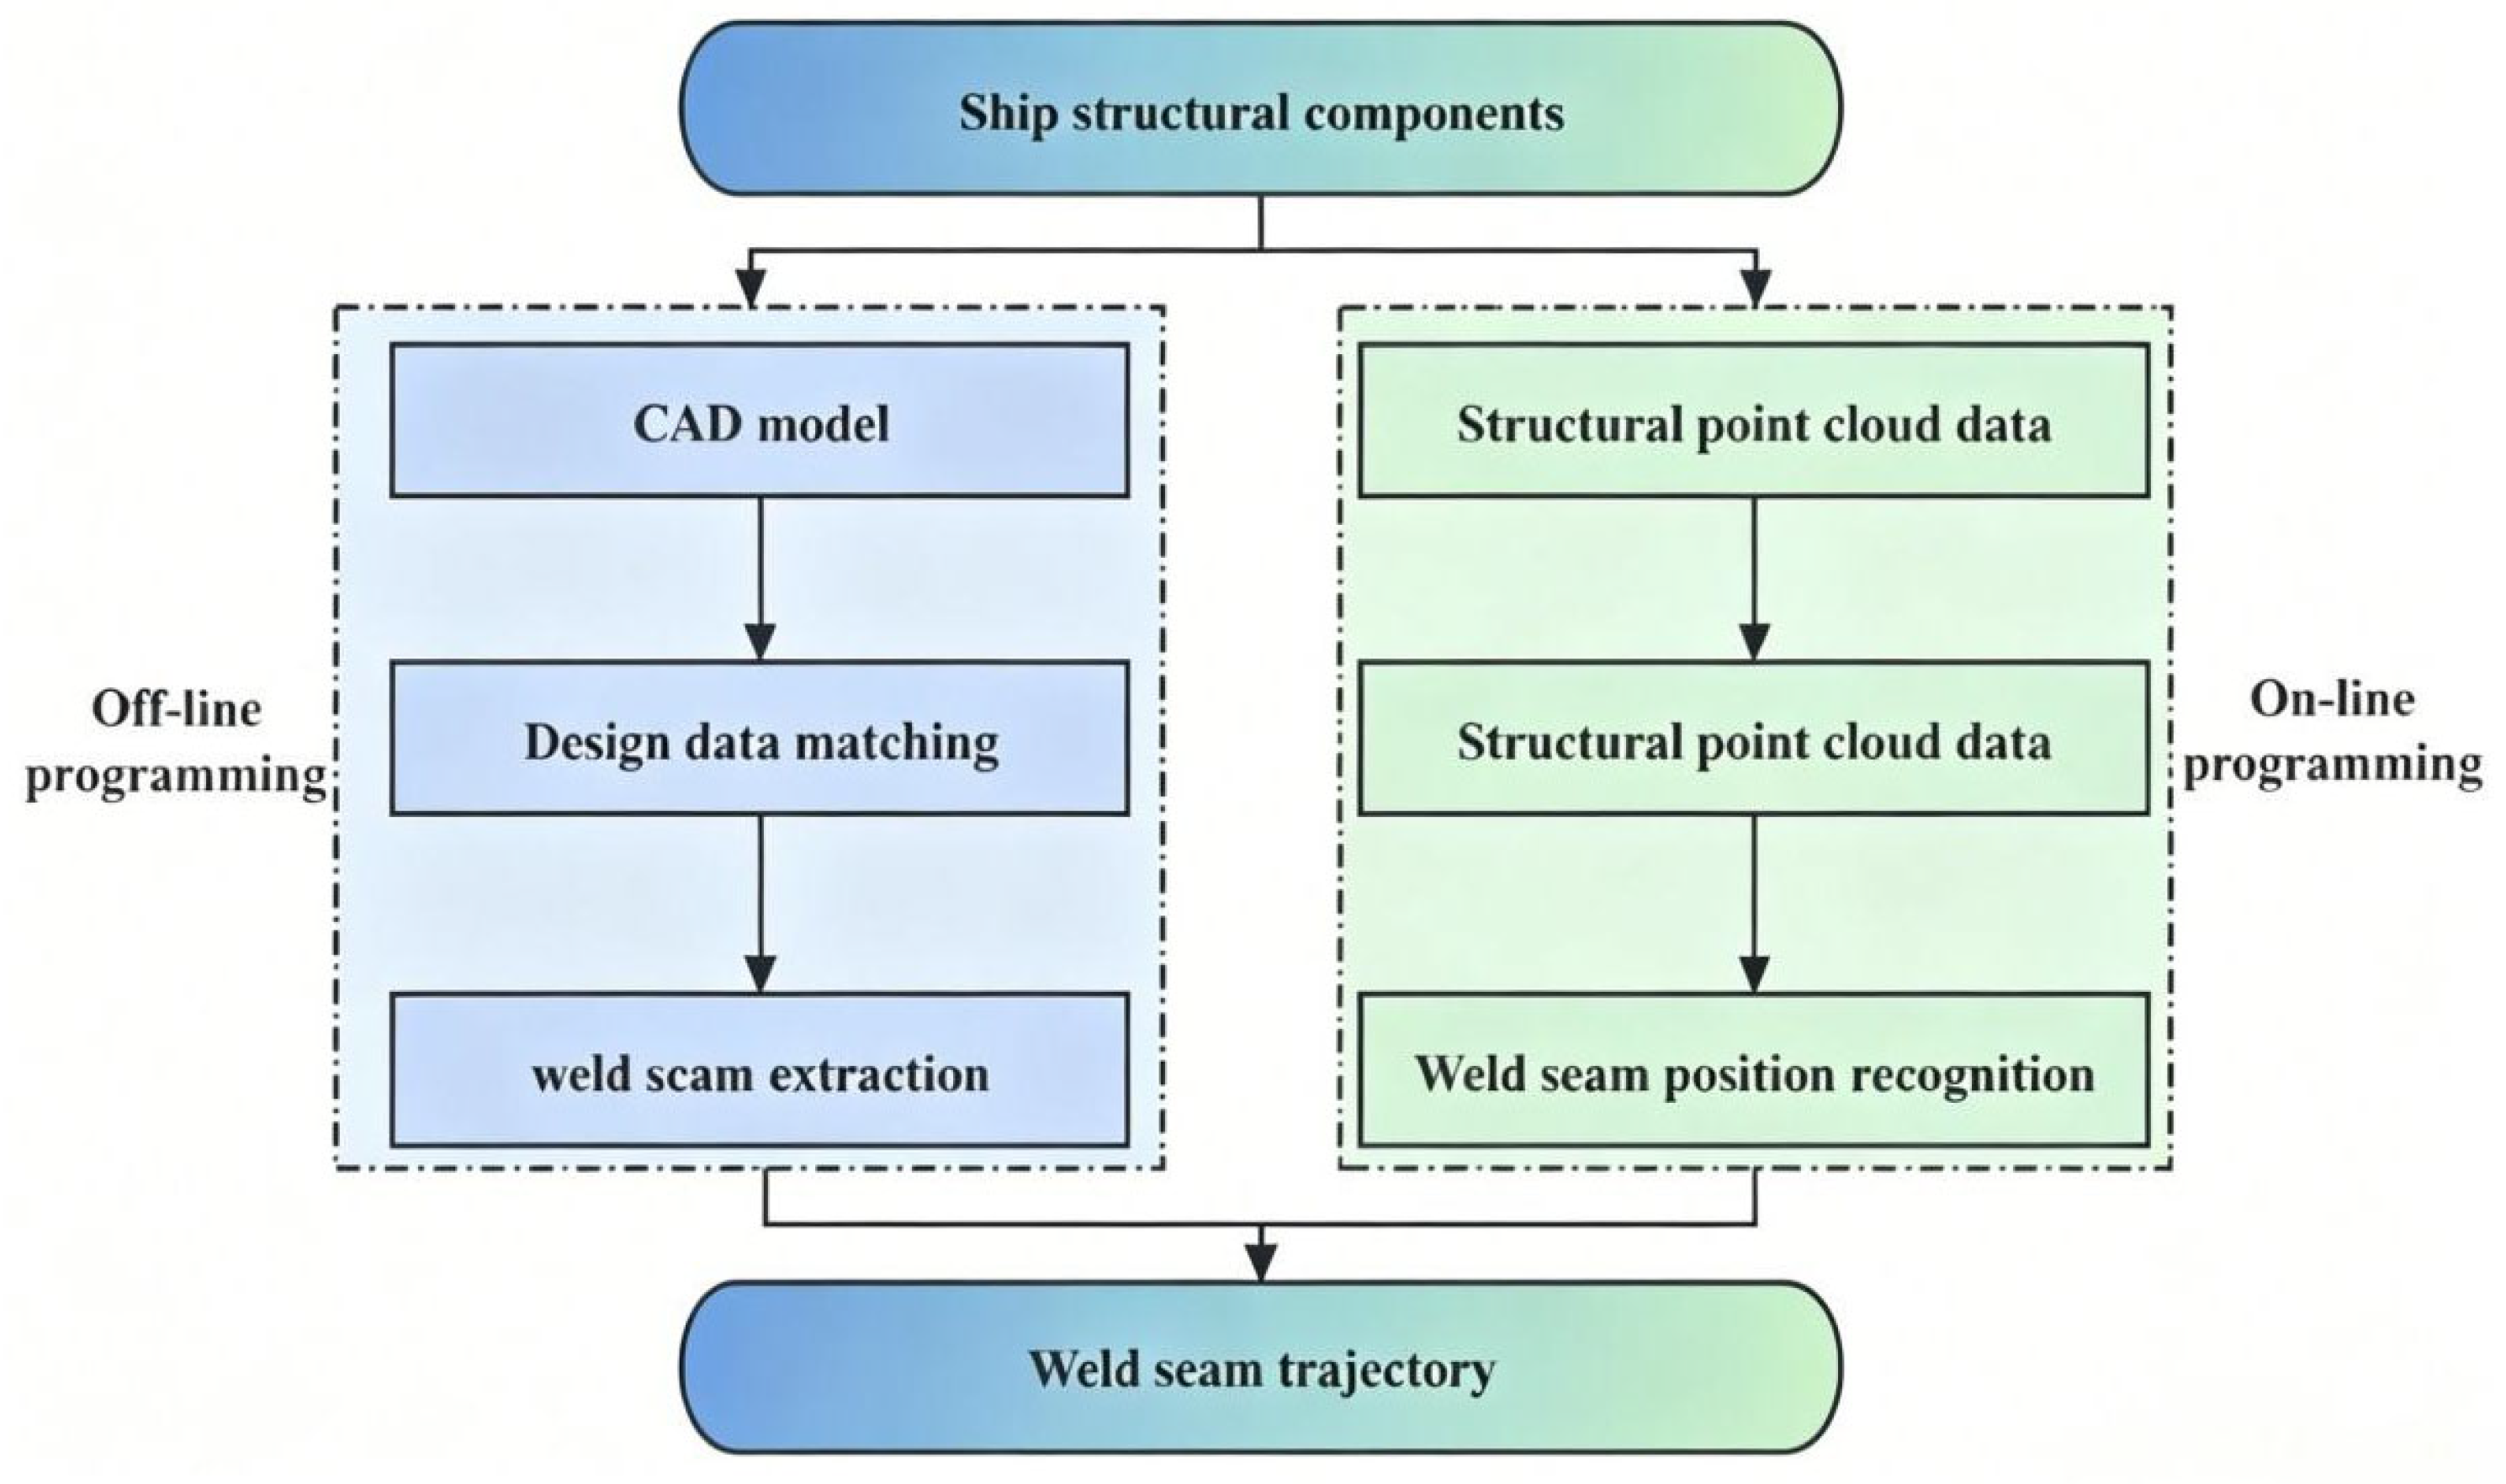
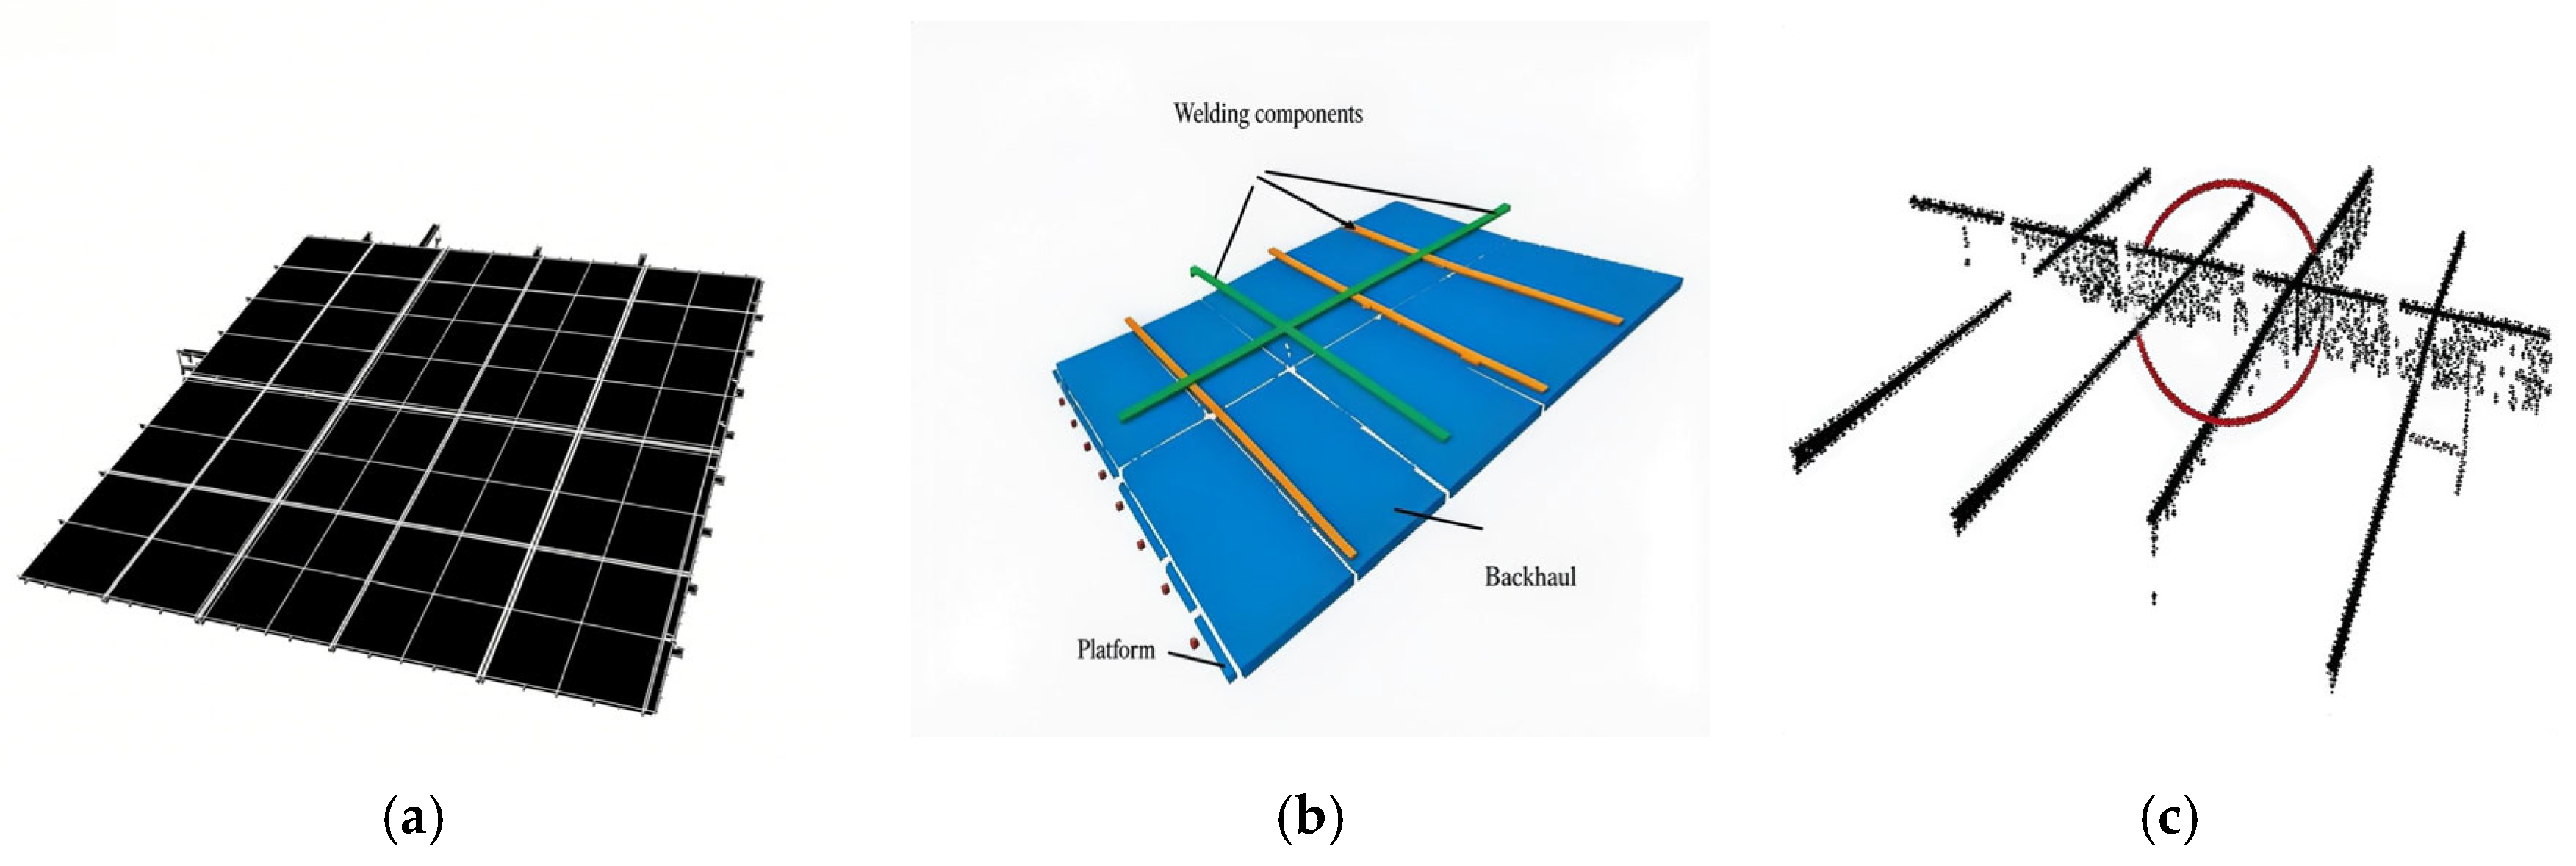
A core enabling technology for closing this gap is the accurate recognition of weld seam positions, which directly dictates welding quality and productivity. Currently, offline programming based on computer-aided design (CAD)models is a standard approach for generating robotic welding trajectories [11,12]. As illustrated in Figure 1, this method extracts spatial coordinates from a design model to guide the robot:
Previous studies have investigated vertically oriented intelligent assembly lines and model-based programming for group-level operations [13,14]. However, such methodologies are fundamentally constrained by discrepancies between the nominal CAD model and the actual, deformed physical workpiece caused by cutting, forming, and pre-welding assembly errors. These inaccuracies necessitate either extensive manual re-teaching or supplementary sensor-based positioning, ultimately compromising overall welding efficiency [15].
To overcome these limitations, vision-based online recognition methodologies have emerged as a robust alternative, offering the capability to accurately perceive workpiece position and orientation in real-time while exhibiting high tolerance to geometric deviations. Research has employed three-dimensional point cloud data and hybrid coarse-fine positioning strategies for weld seam recognition [16]. Arent, N.Q. et al. developed a digital twin-driven model for capacity evaluation and scheduling, while other studies focused on feature extraction from group vertical assemblies [17]. Despite these advances, a significant research gap remains: existing studies predominantly address simple weld configurations or isolated components, failing to resolve the challenges posed by multi-component ship structural parts characterized by complex point cloud data and the necessity for concurrent recognition of multiple, interference-prone weld seams.
Filling this gap, this study proposes a comprehensive, vision-based methodology for the real-time generation of weld seam trajectories tailored specifically for complex ship structural components. The key scientific and technical contributions distinguishing this work from existing system-integration-level studies are:
(1) A novel multi-stage algorithmic framework hybridizing 2D image processing (SURF/FLANN for wide-field-of-view image stitching) with 3D point cloud analysis (RANSAC for intelligent component segmentation and PCA for precise contour reconstruction and localization). This hybrid framework is specially optimized to adapt to the scale and structural complexity of ship block assemblies.
(2) The development of an interference-aware trajectory generation algorithm. By constructing a constrained workspace volume and implementing collision detection based on reconstructed component contours, the system automatically eliminates infeasible path segments, which surpasses the capability of conventional simple path planning methods.
(3) A rigorous quantitative validation protocol beyond single-case visual demonstration, including statistical error analysis (mean error, maximum absolute error, standard deviation, RMSE) and direct quantitative comparison with traditional offline programming across five typical workpiece types, establishing solid quantitative superiority of the proposed method.
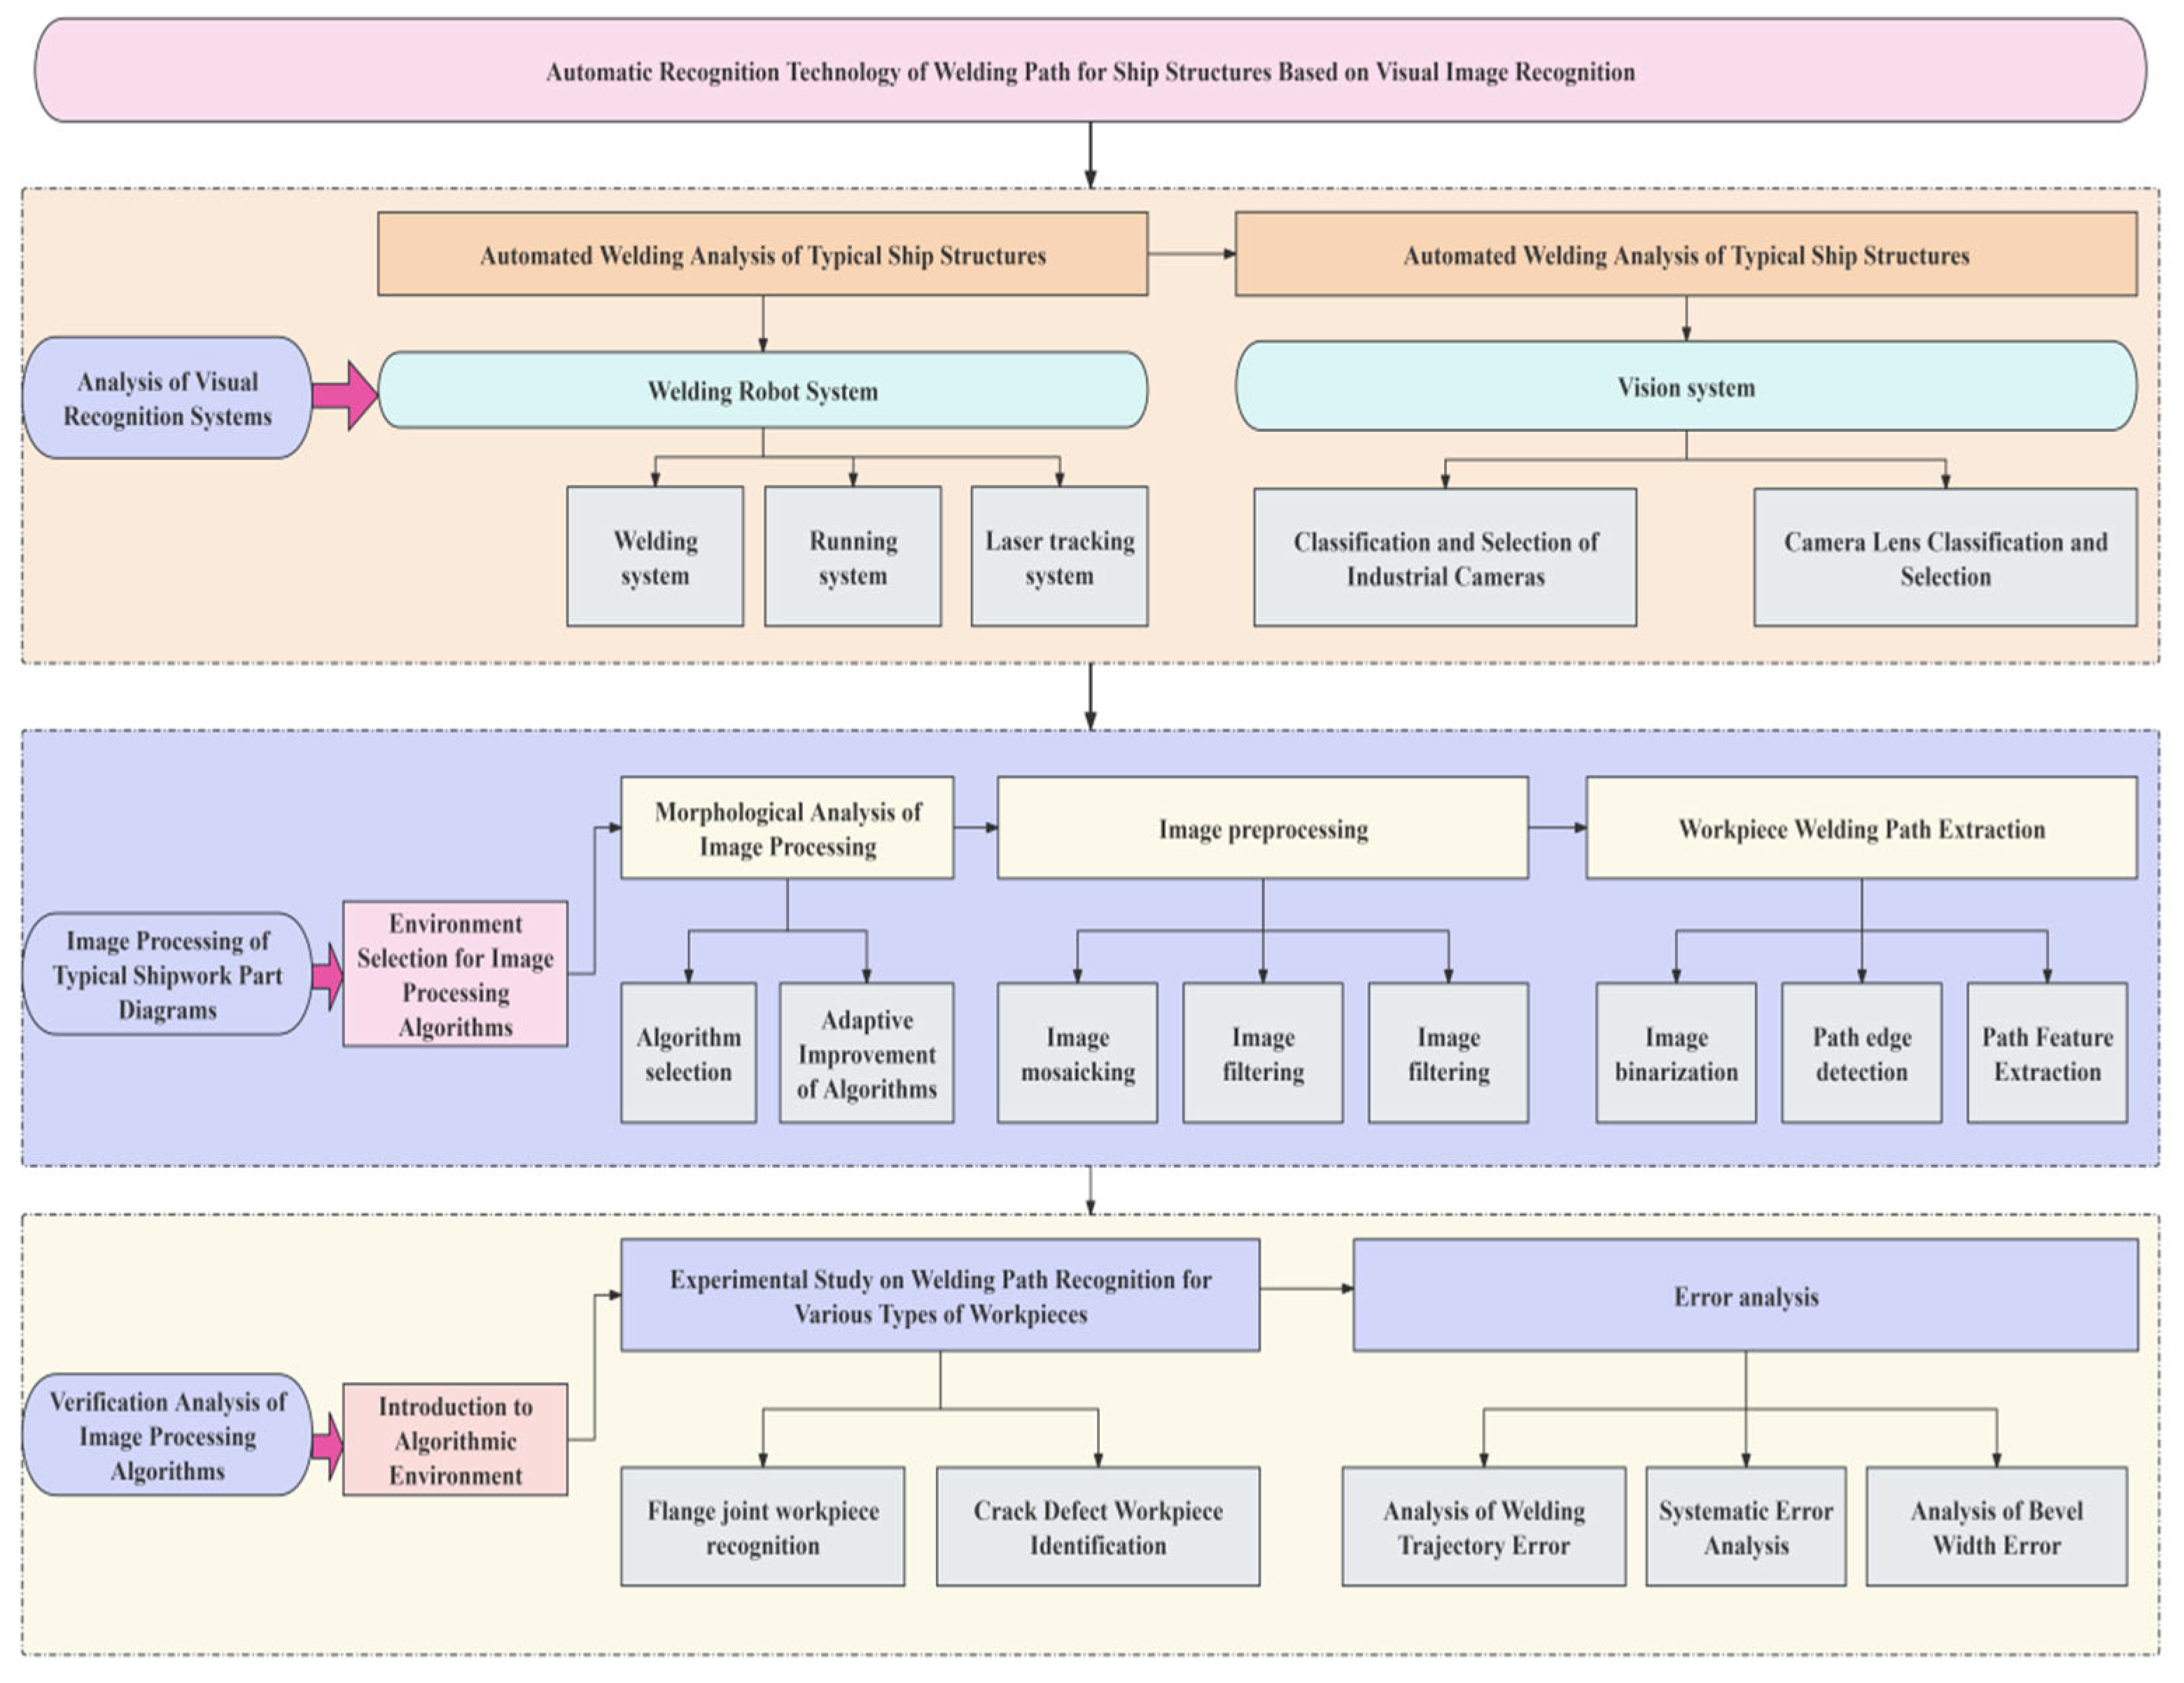
The proposed system architecture integrates a monochrome industrial camera with a KUKA KR-16-L6-2 manipulator and a linear traverse track to achieve comprehensive scanning coverage. The overarching research methodology is schematically depicted in Figure 2, which illustrates the complete workflow from point cloud acquisition and preprocessing to weld seam trajectory generation:

2. Visual Recognition System for Welding Path in Typical Ship Structures

2.1. Adaptive Analysis of Automated Welding for Ship Structures

Modern shipbuilding has widely adopted an “intermediate product-oriented” manufacturing mode, and the integrated hull construction, outfitting, and painting (IHOP) workflow has become the core production framework. Steel processing, sub-assembly, and panel welding are sequential and highly coupled production stages. Although flow-line welding has been applied to large flat panels in some advanced domestic shipyards, the fabrication of geometrically complex structures (curved hull blocks, longitudinal stiffeners, transverse web frames) still heavily depends on manual and semi-automatic welding operations. Excessive manual participation leads to unstable welding quality, harsh working environments, and low production throughput.
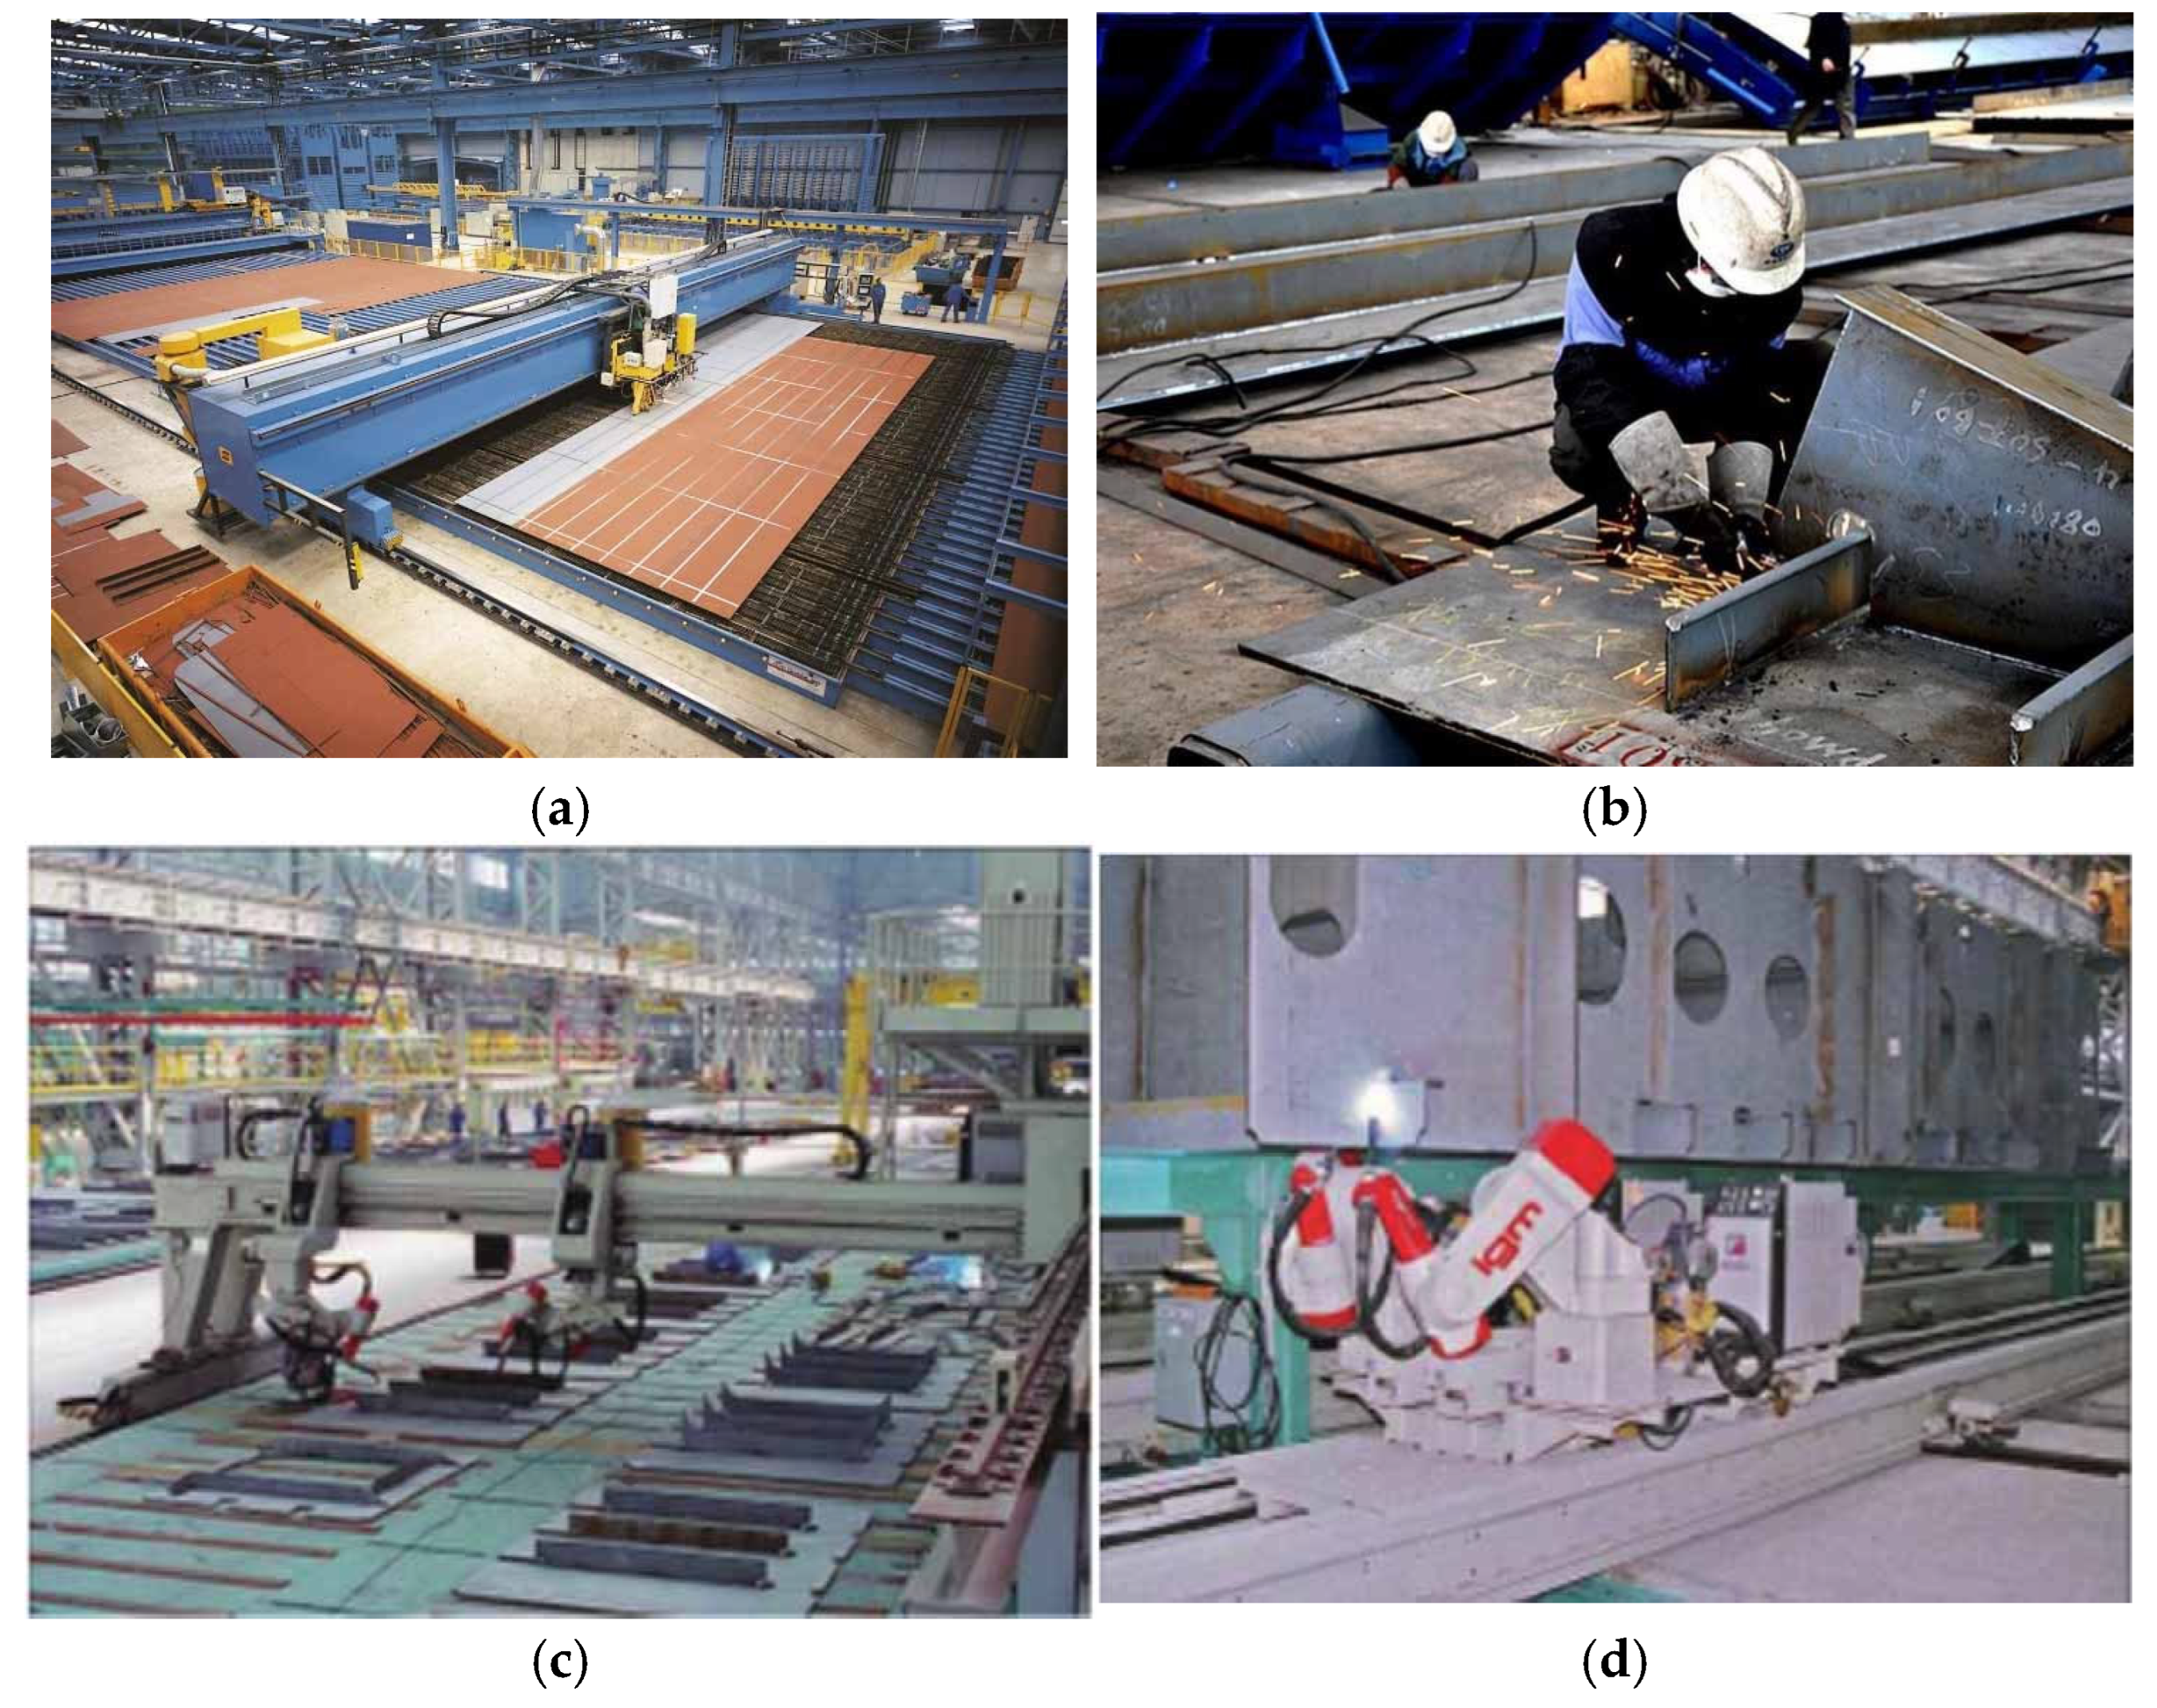
Figure 3 illustrates the classification and characteristics of mainstream ship welding technologies ranging from manual to fully automated modes. Shipbuilding enterprises urgently need to improve the operational efficiency of automated welding systems for complex structural components, so as to maximize capital investment returns and accelerate the intelligent manufacturing transformation process [18].
In recent years, domestic shipyards have gradually promoted automated welding systems to cope with rising labor costs and improve production efficiency. Meanwhile, welding automation technology has made remarkable progress, especially for geometrically complex ship structures such as curved hull surfaces and assembled joints of longitudinal and transverse stiffeners. To accelerate intelligent upgrading, shipyards must prioritize optimizing the operational efficiency of existing automated production workshops.

2.2. Construction of Welding Robot System

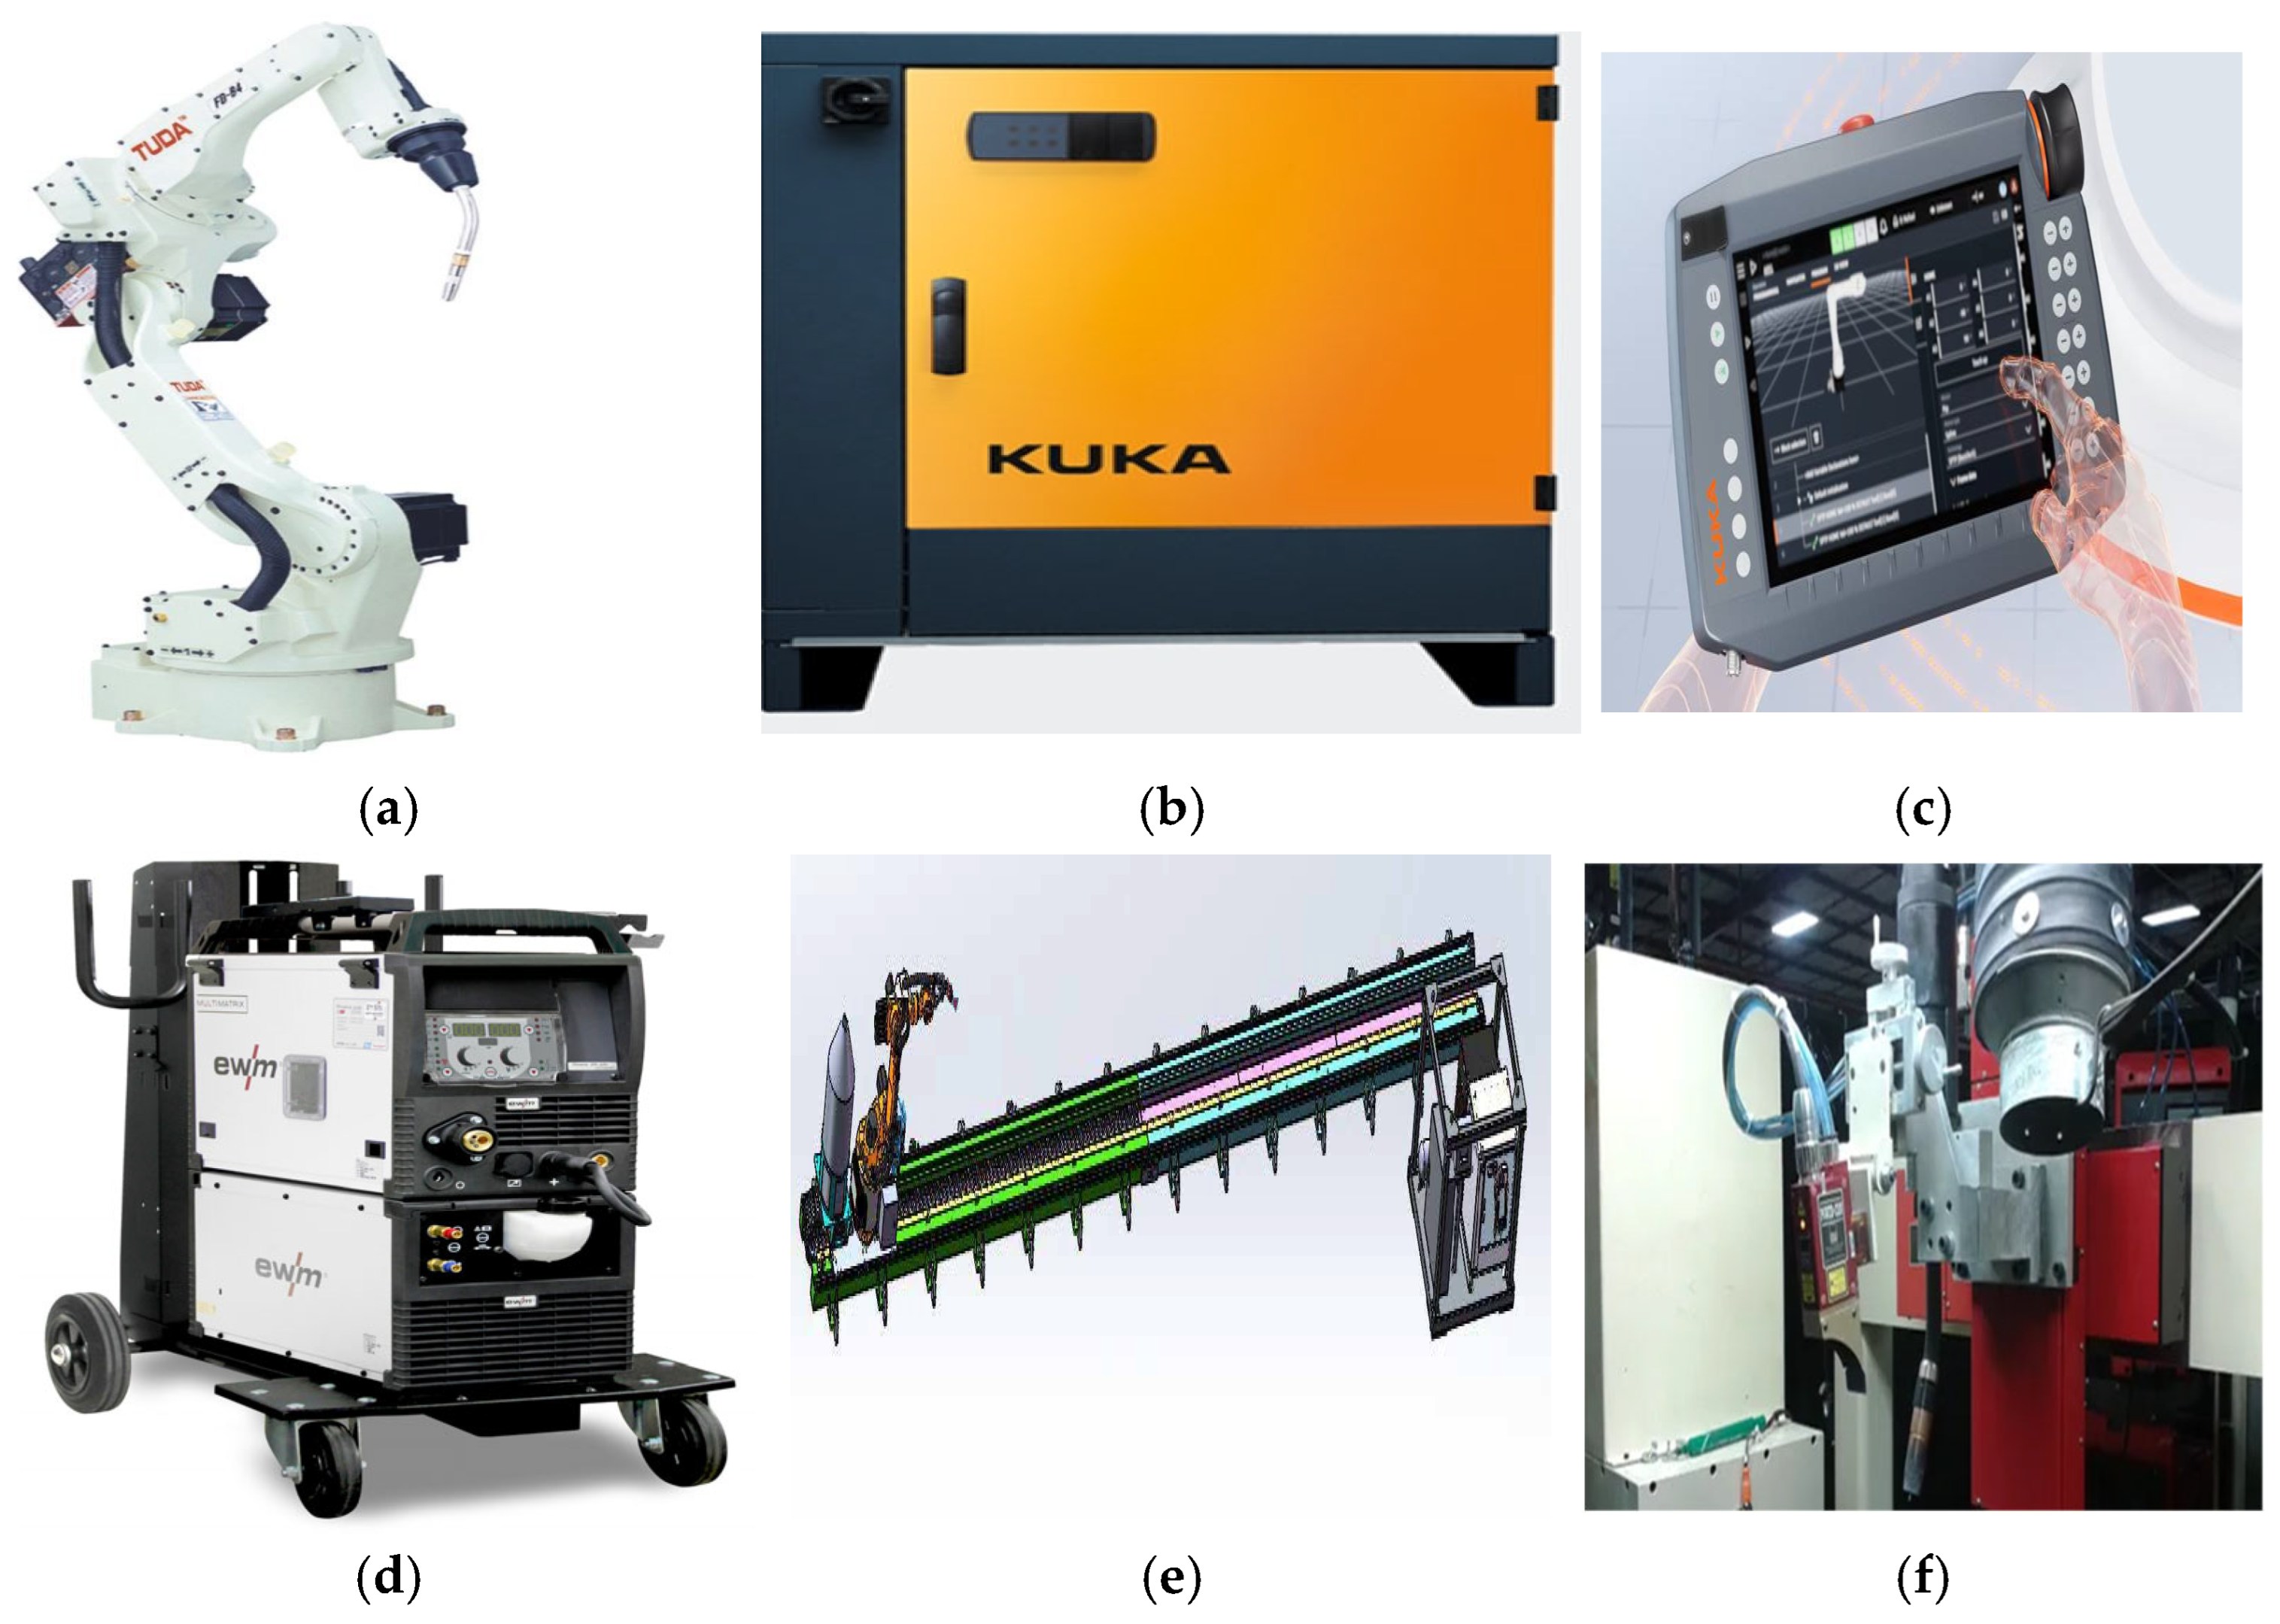
The overall welding robotic system is built based on the KUKA KR-16-L6-2 six-axis articulated robot, which features high repeatability (±0.05 mm) and excellent kinematic flexibility, as shown in Figure 4. The system is equipped with a KR C4 standard control cabinet integrated with a PC-based controller and power electronic modules, and human–machine interaction is realized via the KUKA smartPAD handheld programmer. The welding power source adopts EWM Phoenix 551 Puls multi-process inverter welding equipment.
Considering the large overall dimension of ship structural components, an auxiliary linear traverse track composed of precision guide rails and servo actuators is rigidly installed on the frame to expand the robot’s effective working space. The Servo-Robot POWER-TRAC laser tracking module is integrated for real-time weld path fine tracking, while this study focuses on the coarse localization of weld seams via the proposed visual recognition system [19].

2.3. Design of Visual Recognition System

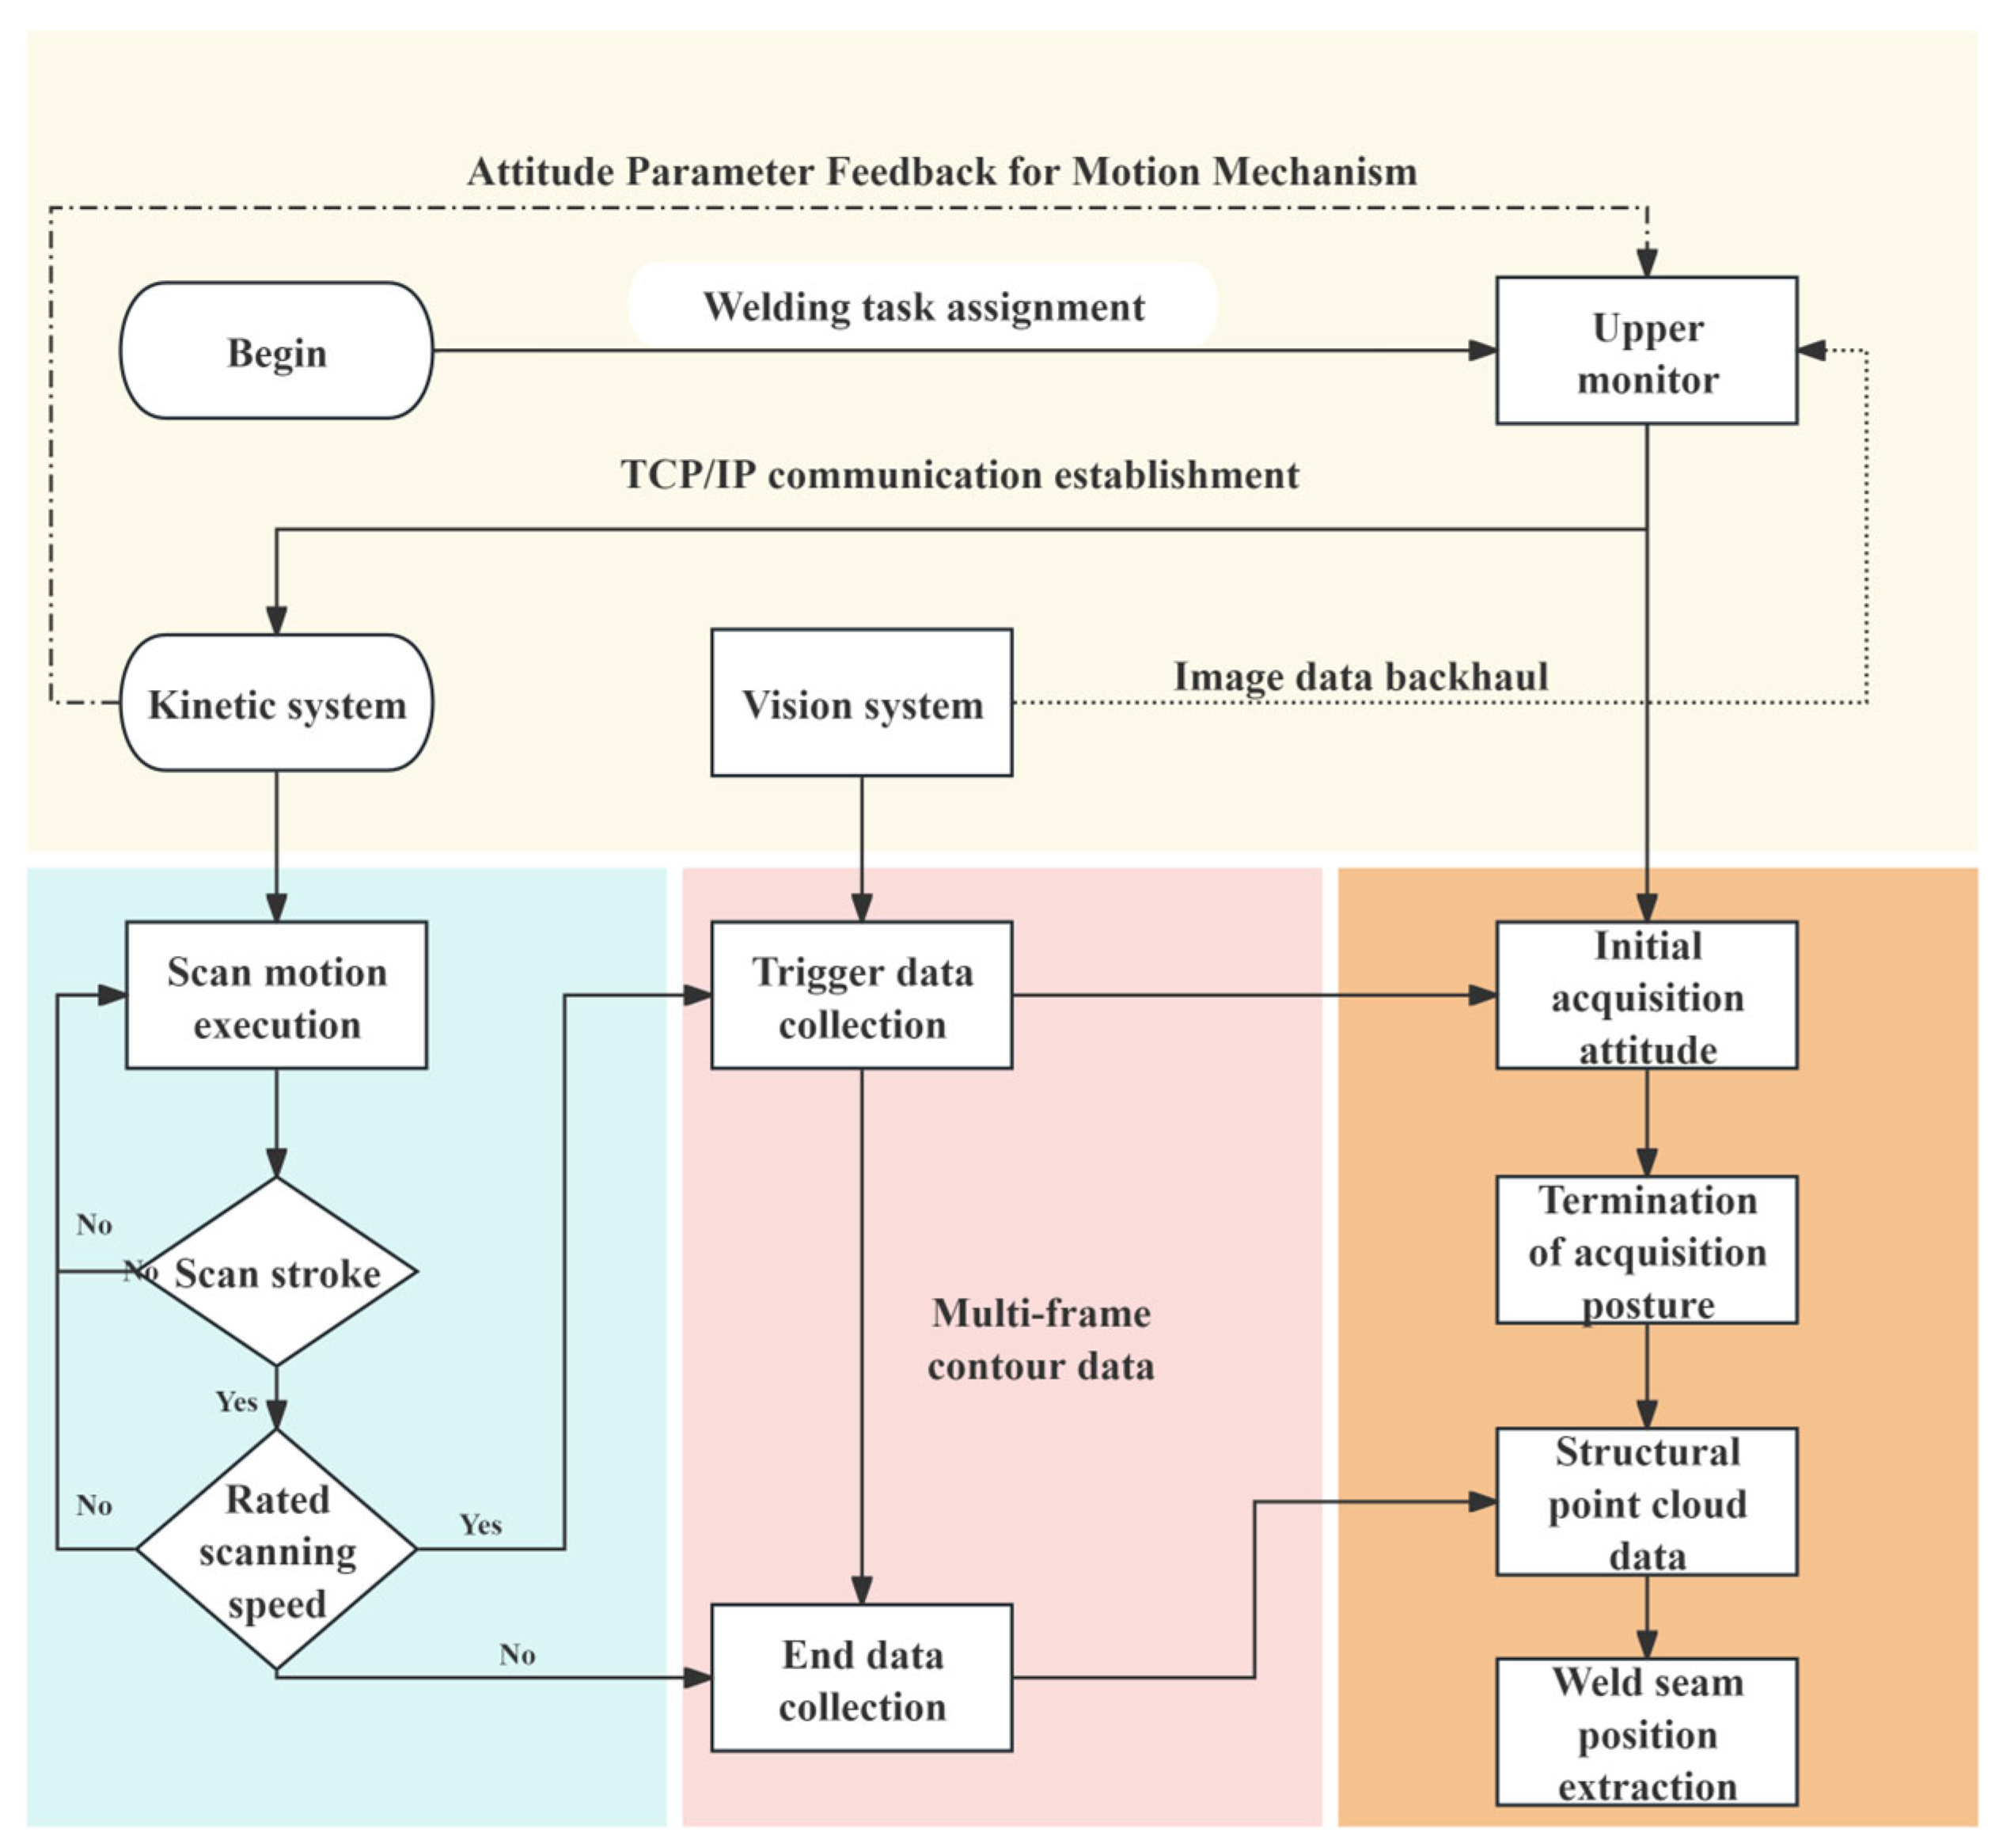
When a ship structural workpiece is transported to the welding station, the host computer receives production tasks and initializes the motion control subsystem and vision subsystem via TCP/IP communication protocol. The host computer sends scanning instructions to the robot system, which executes the preset scanning trajectory and feeds back real-time robot pose and kinematic parameters synchronously. The host verifies the trajectory rationality according to the initial pose and monitors the scanning speed in real time. Once the scanning speed stabilizes to the set value, the vision system starts to collect linear laser profile data and synchronously records robot pose and motion parameters. The vision sensor splices continuous laser profiles into an integral raw 3D point cloud. At the end of scanning, the robot decelerates automatically; data acquisition stops when the speed drops below the threshold, and the final pose and sensor data are stored completely.
The hand–eye transformation matrix is adopted to unify the raw point cloud into the global coordinate system, and structural features such as rib plates and base plates are extracted to realize sub-component division and weld seam localization [20].
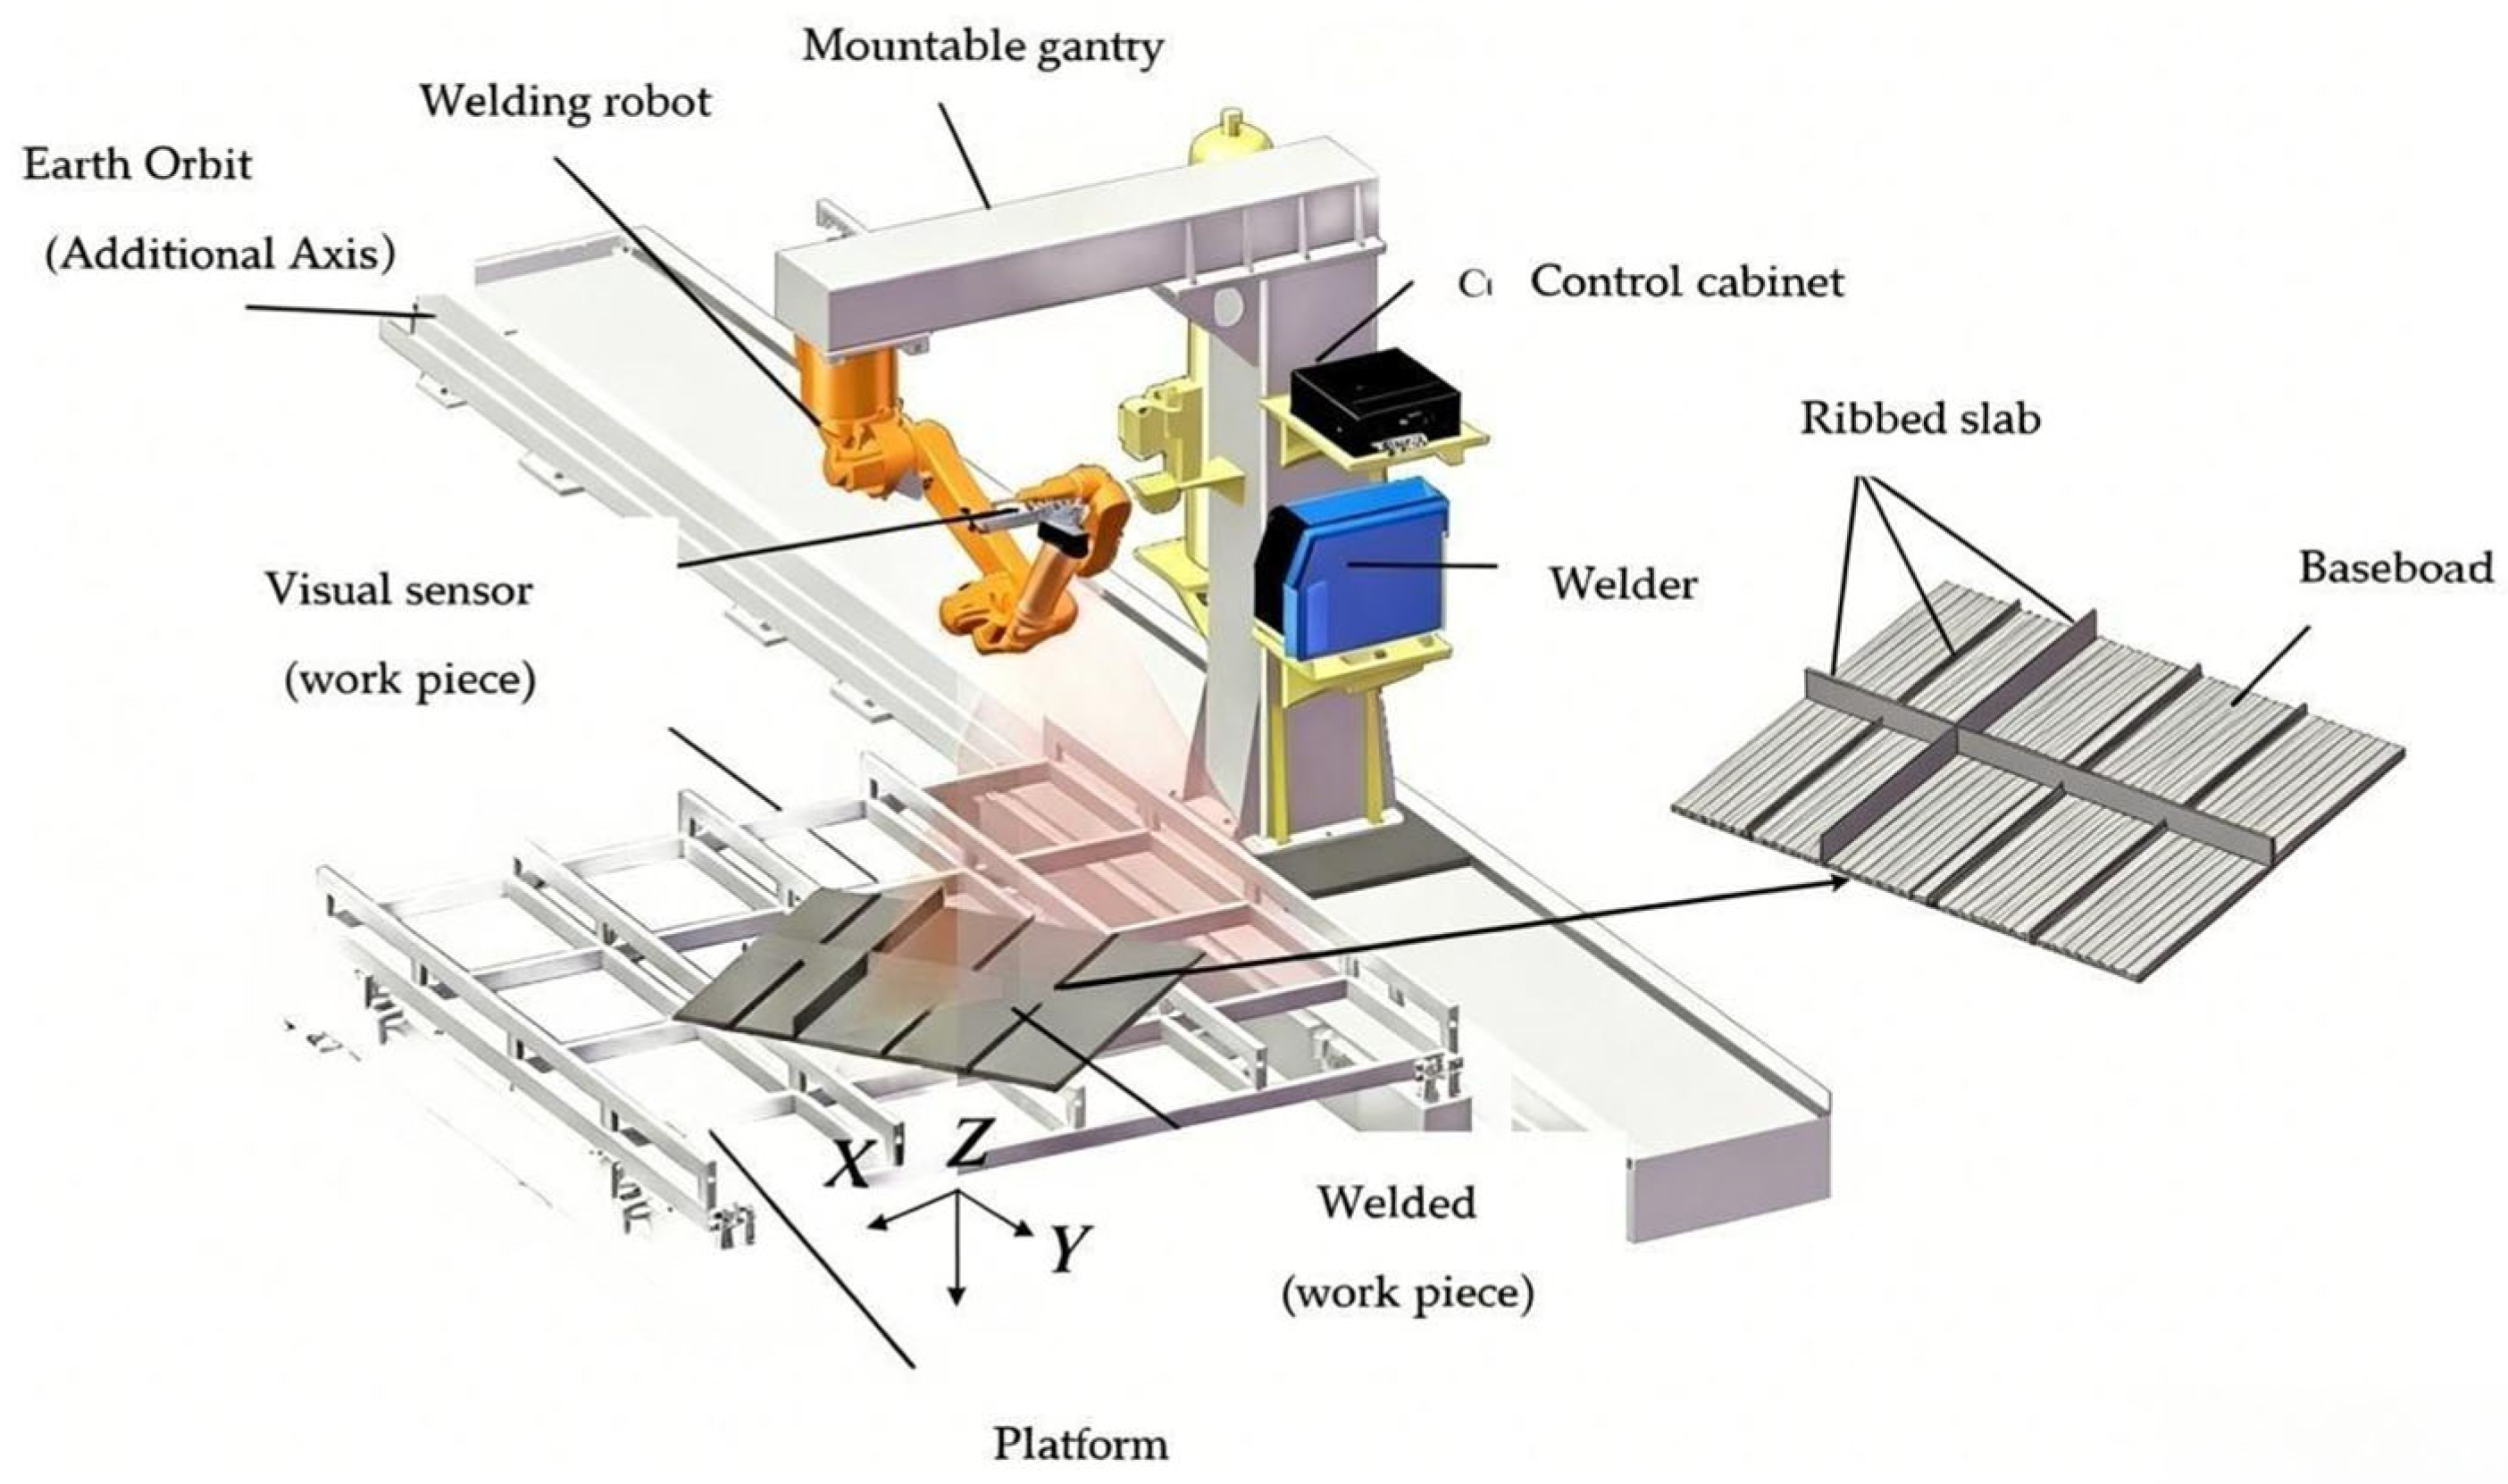
Figure 5 shows the hardware layout of the visual recognition system: a gantry-mounted six-axis welding robot with an external linear axis and a rigidly fixed vision sensor. The external linear axis is collinear with the robot Y-axis and global Y-axis, and the Z-axis is perpendicular to the work platform. Cooperative motion of the gantry and robot realizes full coverage scanning of typical ship assemblies including base plates and transverse rib plates.
The visual recognition workflow adopts a multi-stage collaborative mechanism to ensure stable data acquisition and high-precision processing, as shown in Figure 6 [21]:
(1) Initialization: Upon a workpiece entering the station, the host computer establishes a TCP/IP link with the motion controller and the vision system.
(2) Scanning Trajectory Execution: The host issues a scanning command. The robot, utilizing its integrated track, executes a pre-defined scanning trajectory over the workpiece at a constant linear velocity of 0.35 m/s. The robot’s pose and kinematic state are synchronously streamed to the host.
(3) Data Acquisition: Once a stable scanning velocity is achieved, the vision system is triggered to capture sequential laser line profiles at a rate of 1 frame per second. This iterative process was established experimentally to balance point cloud density with processing throughput.
(4) Data Fusion and Processing: The acquired profile frames and corresponding robot poses are fused using the pre-calibrated hand–eye transformation matrix, generating a unified 3D point cloud of the structural component in a global coordinate system.
(5) Feature Extraction and Path Generation: The host computer processes the global point cloud to segment structural components, reconstruct weld contours, identify weld seam positions, and generate an executable, collision-free trajectory for the welding robot.
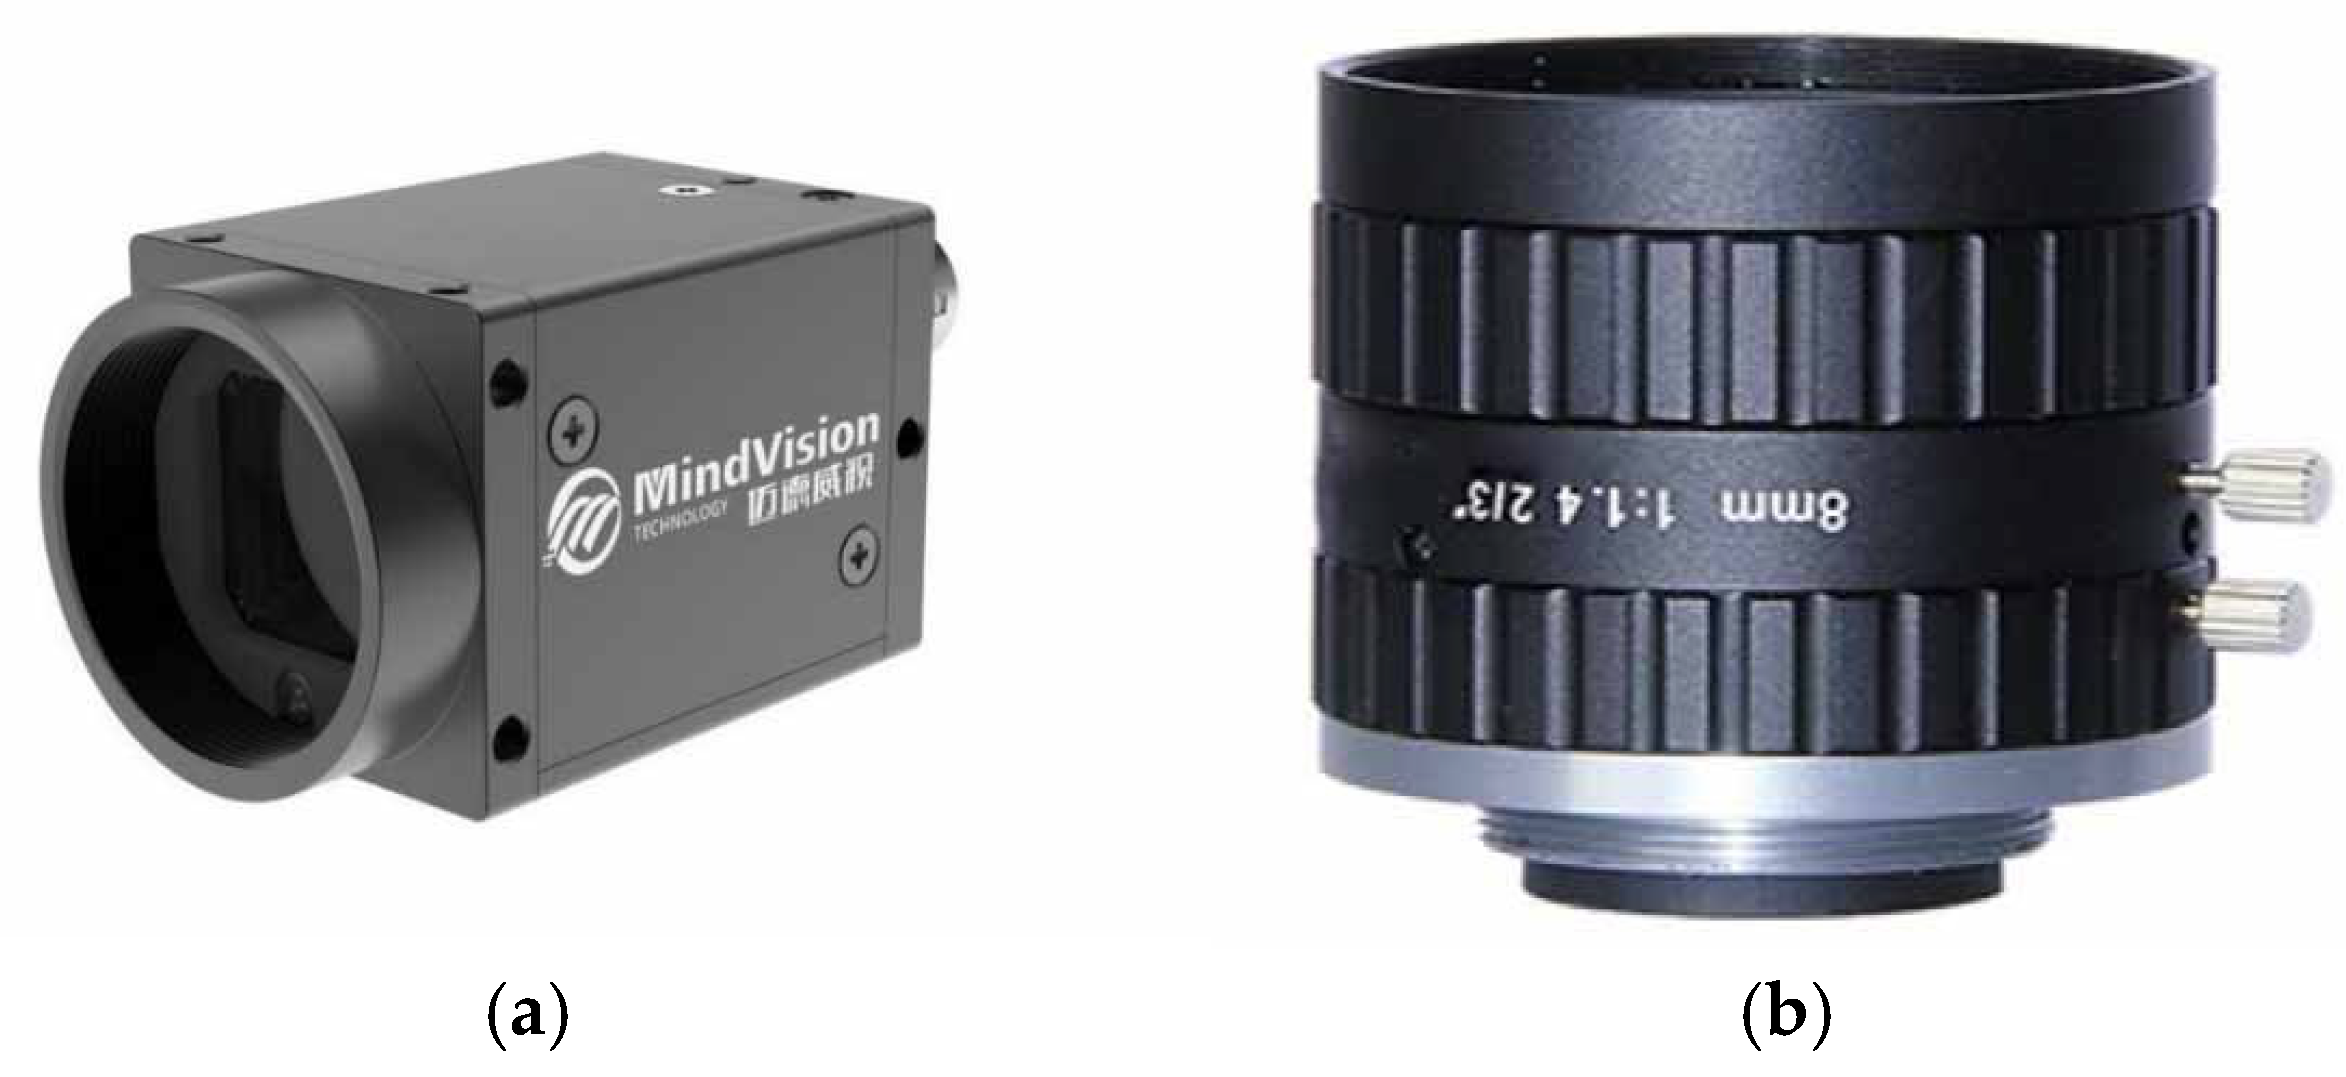
The selection of an industrial camera is the fundamental premise of the entire visual recognition framework, which directly determines the accuracy and stability of welding path recognition. Ship structural workpieces are mostly single-color metal materials without effective color feature information, so color cameras cannot provide additional recognition advantages. Monochrome industrial cameras are more suitable for meeting the high-precision positioning requirements of this research [22]. Through comprehensive cost–benefit analysis and market performance comparison, the Medway MV-GED200M-T monochrome industrial camera is selected as the core visual sensor, matched with the Medway MV-LD-8-3M-A lens assembly, as shown in Figure 7.
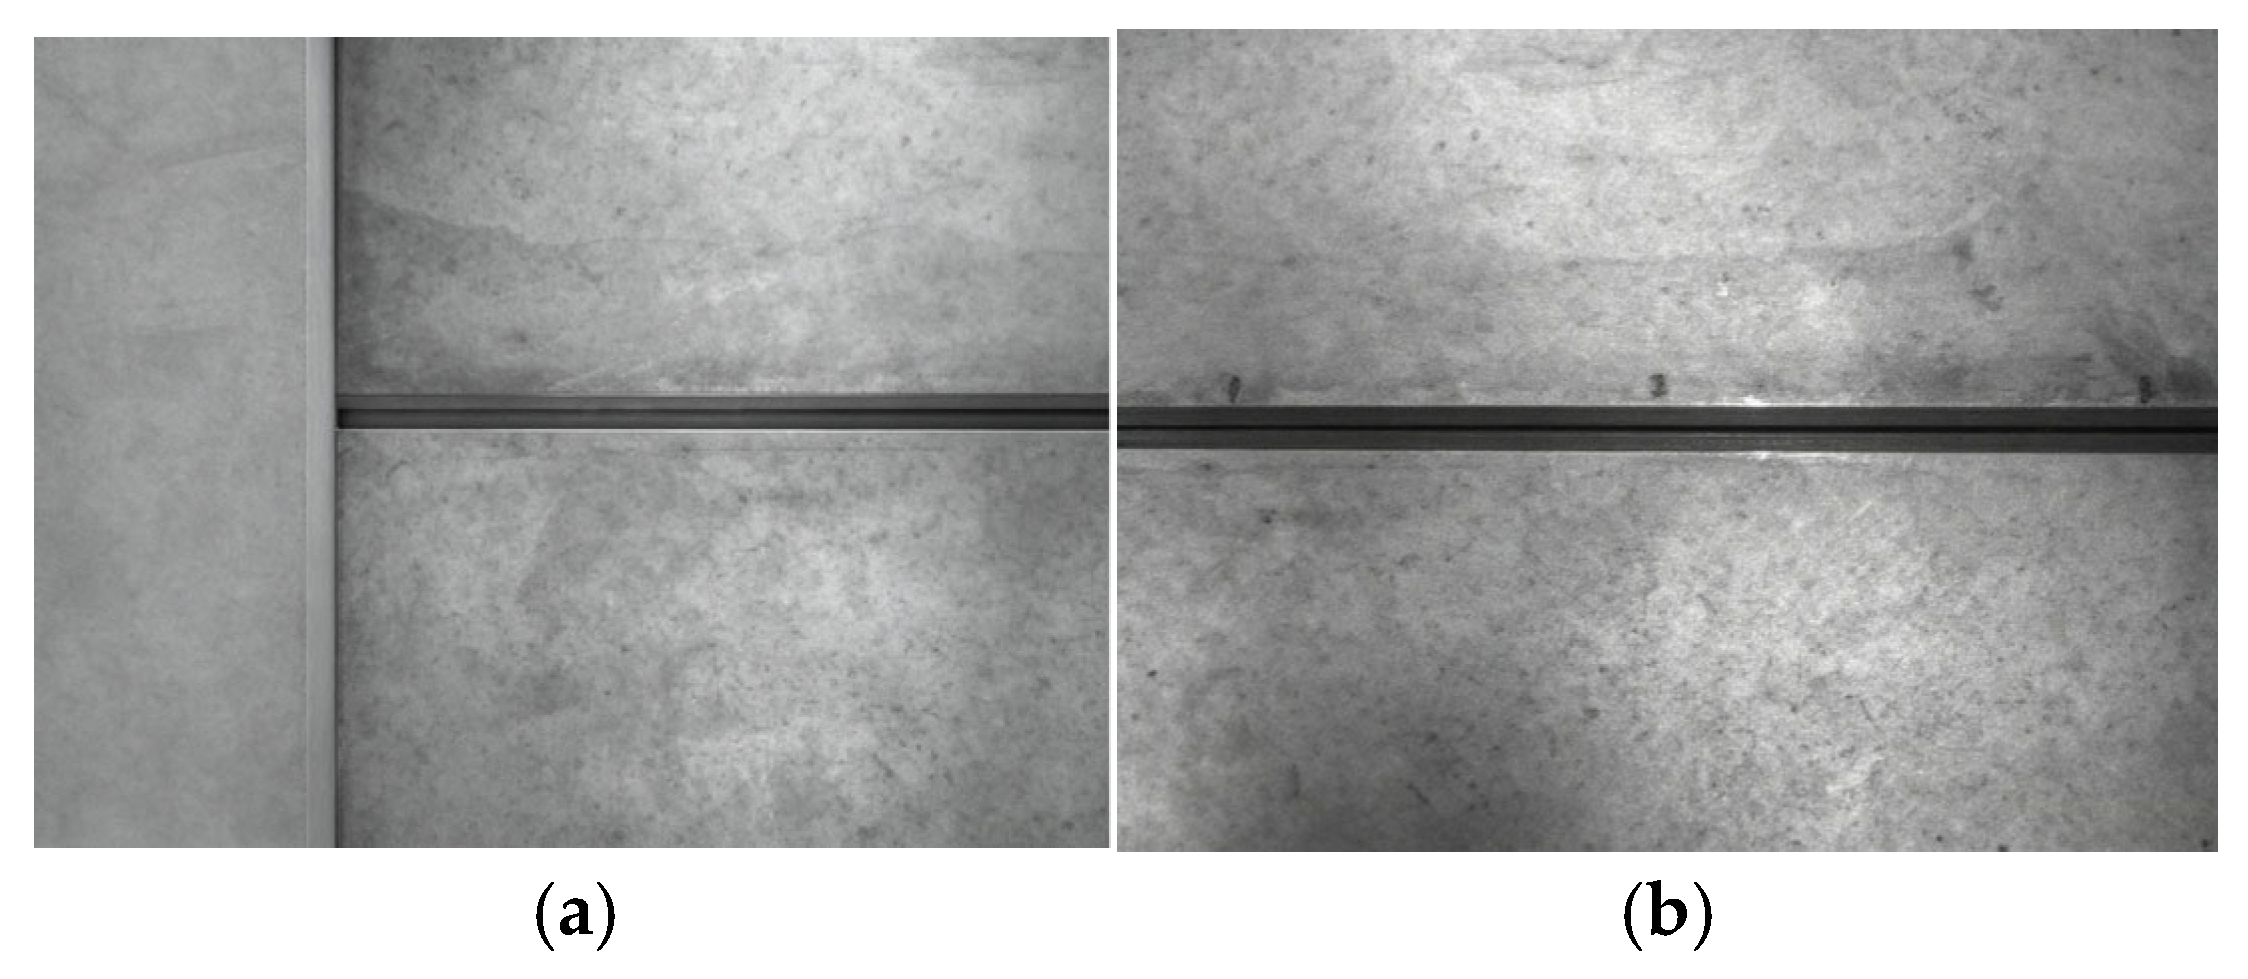
After completing camera and lens selection, image acquisition experiments are carried out to verify whether the collected weld path images meet subsequent processing requirements. With camera software debugged and hardware modules installed, more than 40 workpiece sample images are collected under actual shipyard natural lighting (no auxiliary light required). Continuous shooting is performed at 0.35 m/s robot moving speed with 1 fps sampling rate, and single-frame static shooting is supplemented. No specular reflection, geometric distortion, defective pixels, dead pixels, or excessive noise are observed in the sampled images, and the clarity fully meets the standard for subsequent algorithm processing. Representative images of the arc starting point and welding path are shown in Figure 8 [23].

3. Processing of Welding Path Image and Feature Value Extraction

3.1. Principles of Image Processing Algorithms

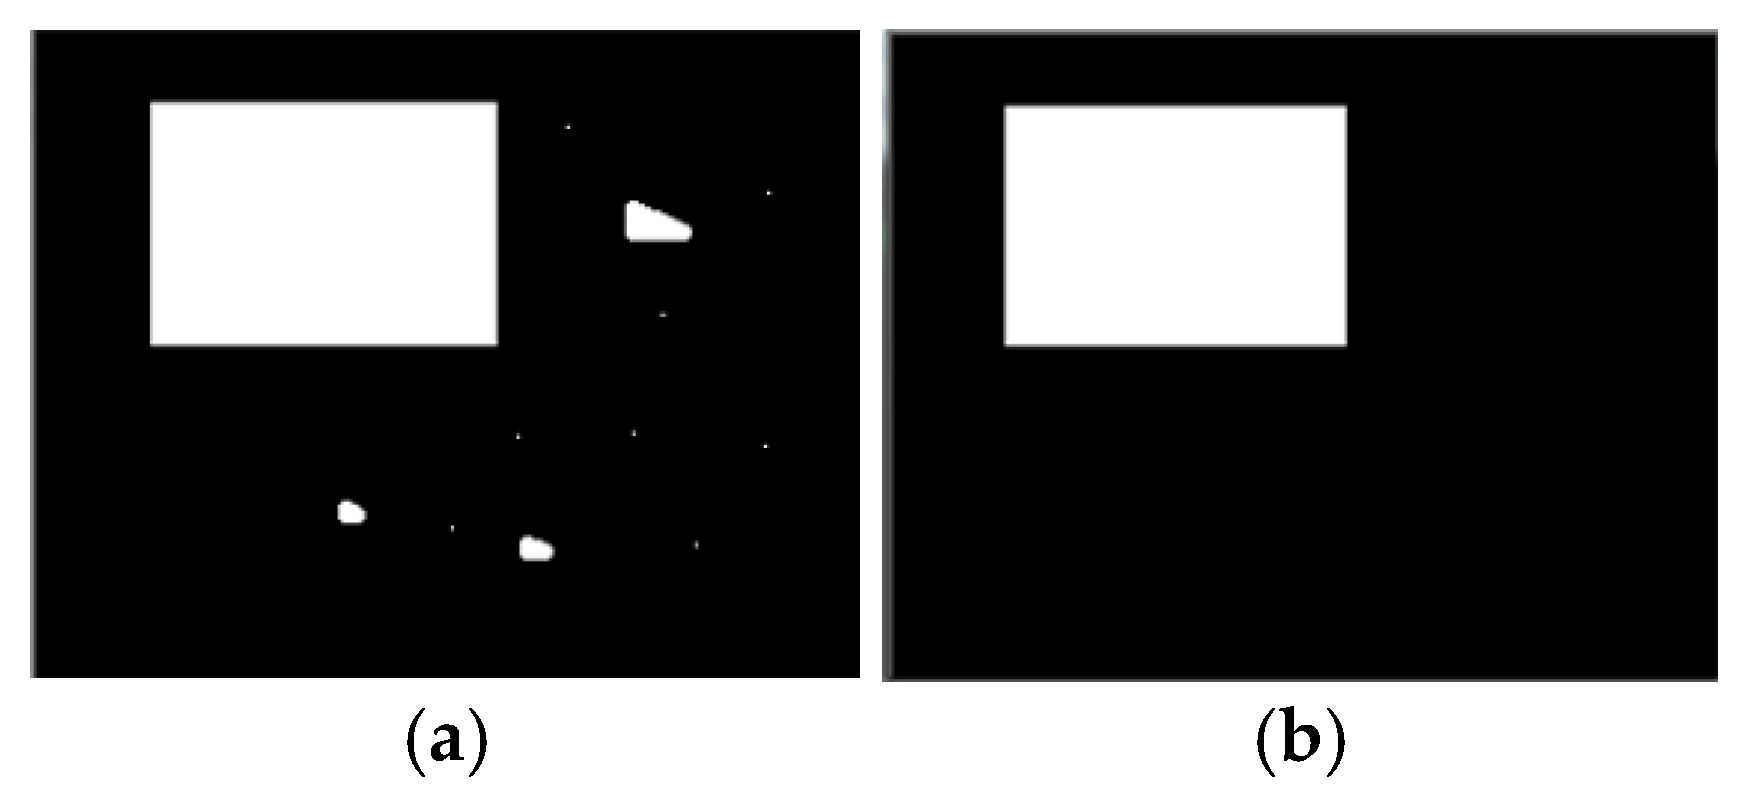
Basic morphological image processing operations mainly include erosion, dilation, and combined opening/closing transformations. Erosion and dilation are widely used in image preprocessing: suppressing acquisition noise, separating discrete target units, bridging adjacent feature regions, identifying pixel intensity extreme regions, and calculating gradient magnitude. This study adopts a hybrid 2D-3D processing framework:2D image processing is used to stitch high-resolution wide-field panoramic images, and 3D point cloud reconstruction is further realized based on panoramic images. Morphological erosion and dilation are the core of noise suppression and feature connection. Opening operation removes small independent interference targets and smooths outer contours, as shown in Figure 9.
The erosion operation is formally defined by translating a structuring element S across an image set X. For each position x reached during this translation, the set of points satisfying the condition specified in Equation (1) is identified. The aggregate collection of all such points x that fulfill this criterion constitutes the locus of maximal correlation between the structuring element S and the image set X. This resultant point set is designated as the erosion of the image set X by the structuring element S [24].
1   S + x X 2   S + x X C 3   S + x X , S + x X C 0
erosion can also be defined by set theory as:
X Θ S = x S + x X
The purpose of the convolution operation is to obtain the maximum pixel value within specific regions of an image. Structural element S is combined with the image X through near-centroid convolution, which calculates the maximum value of pixels in the area covered by structural element S and assigns this maximum value to the designated pixel at the reference point. The definition of the set is as shown in Equation (3):
X S = S + x X φ
The opening operation essentially involves sequentially applying erosion and dilation operations to an image, denoted by the symbol X S . As shown in Equation (4):
X S = X Θ S S
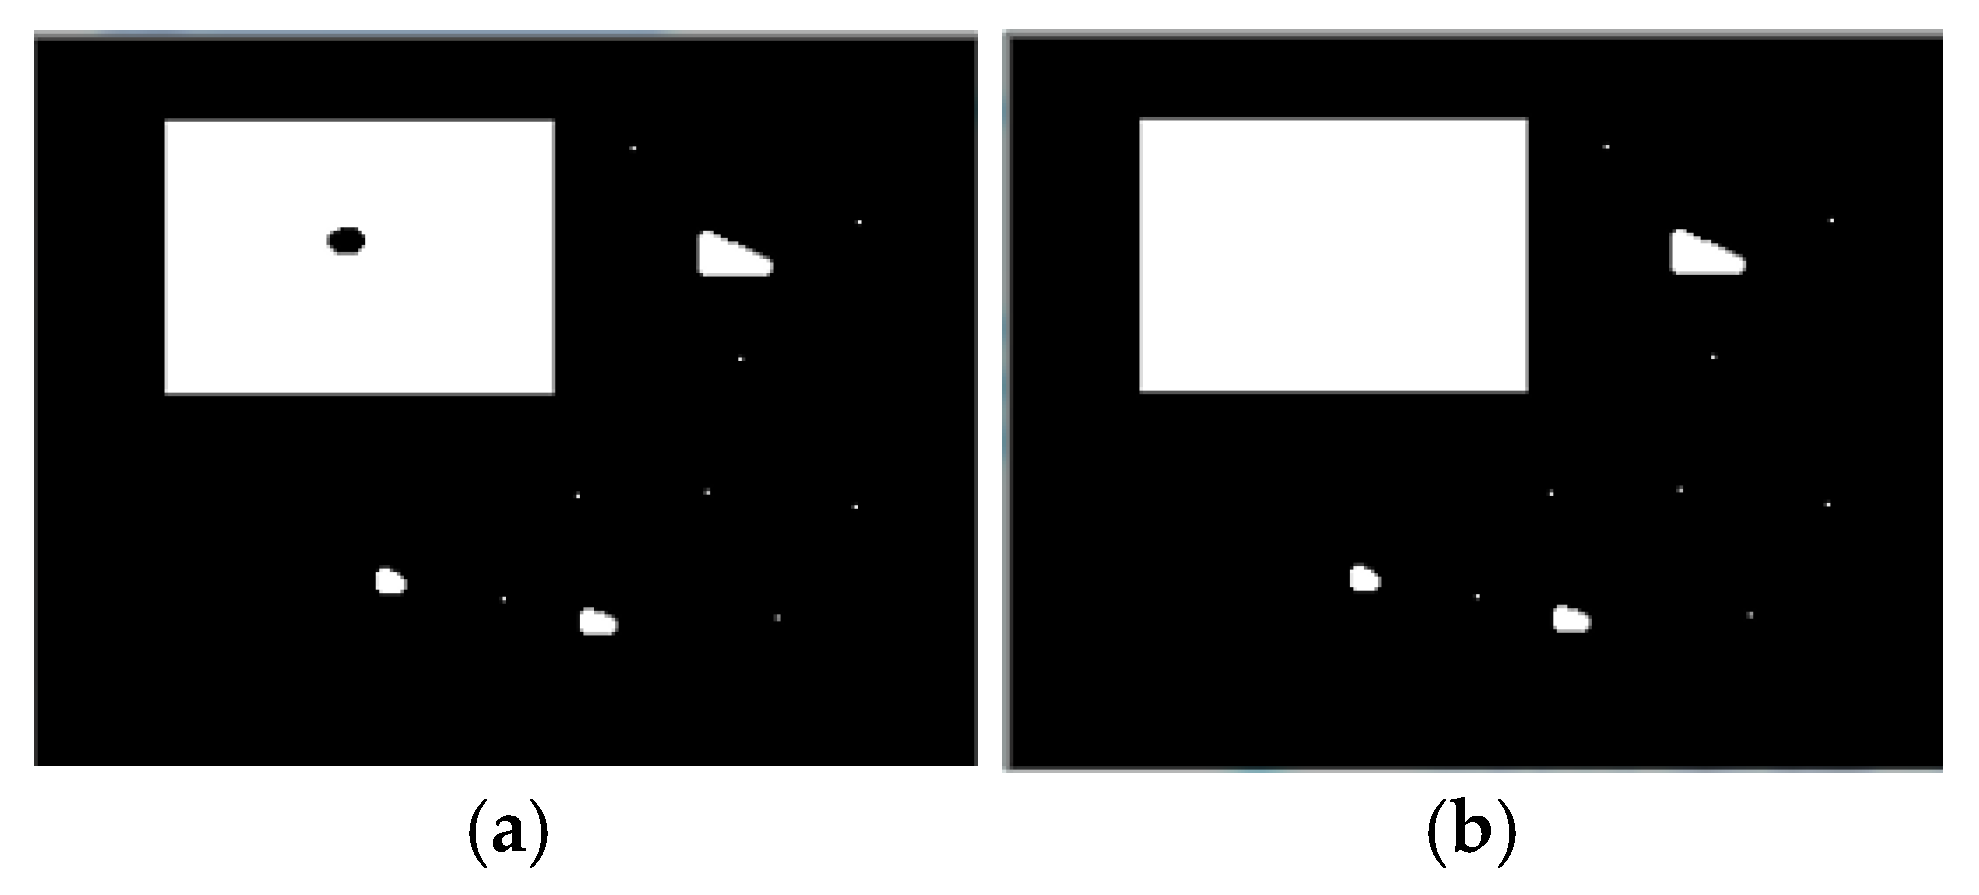
Closing operation fills small internal holes and narrow gaps in target regions, and maintains contour connectivity, as shown in Figure 10.
The closing operation is a process that first applies a dilation operation followed by an erosion operation to an image, denoted by the symbol X●S. As shown in Equation (5):
X S = X S Θ S
The closing operation can fill small holes in large color patches within the image, as shown in Figure 11.
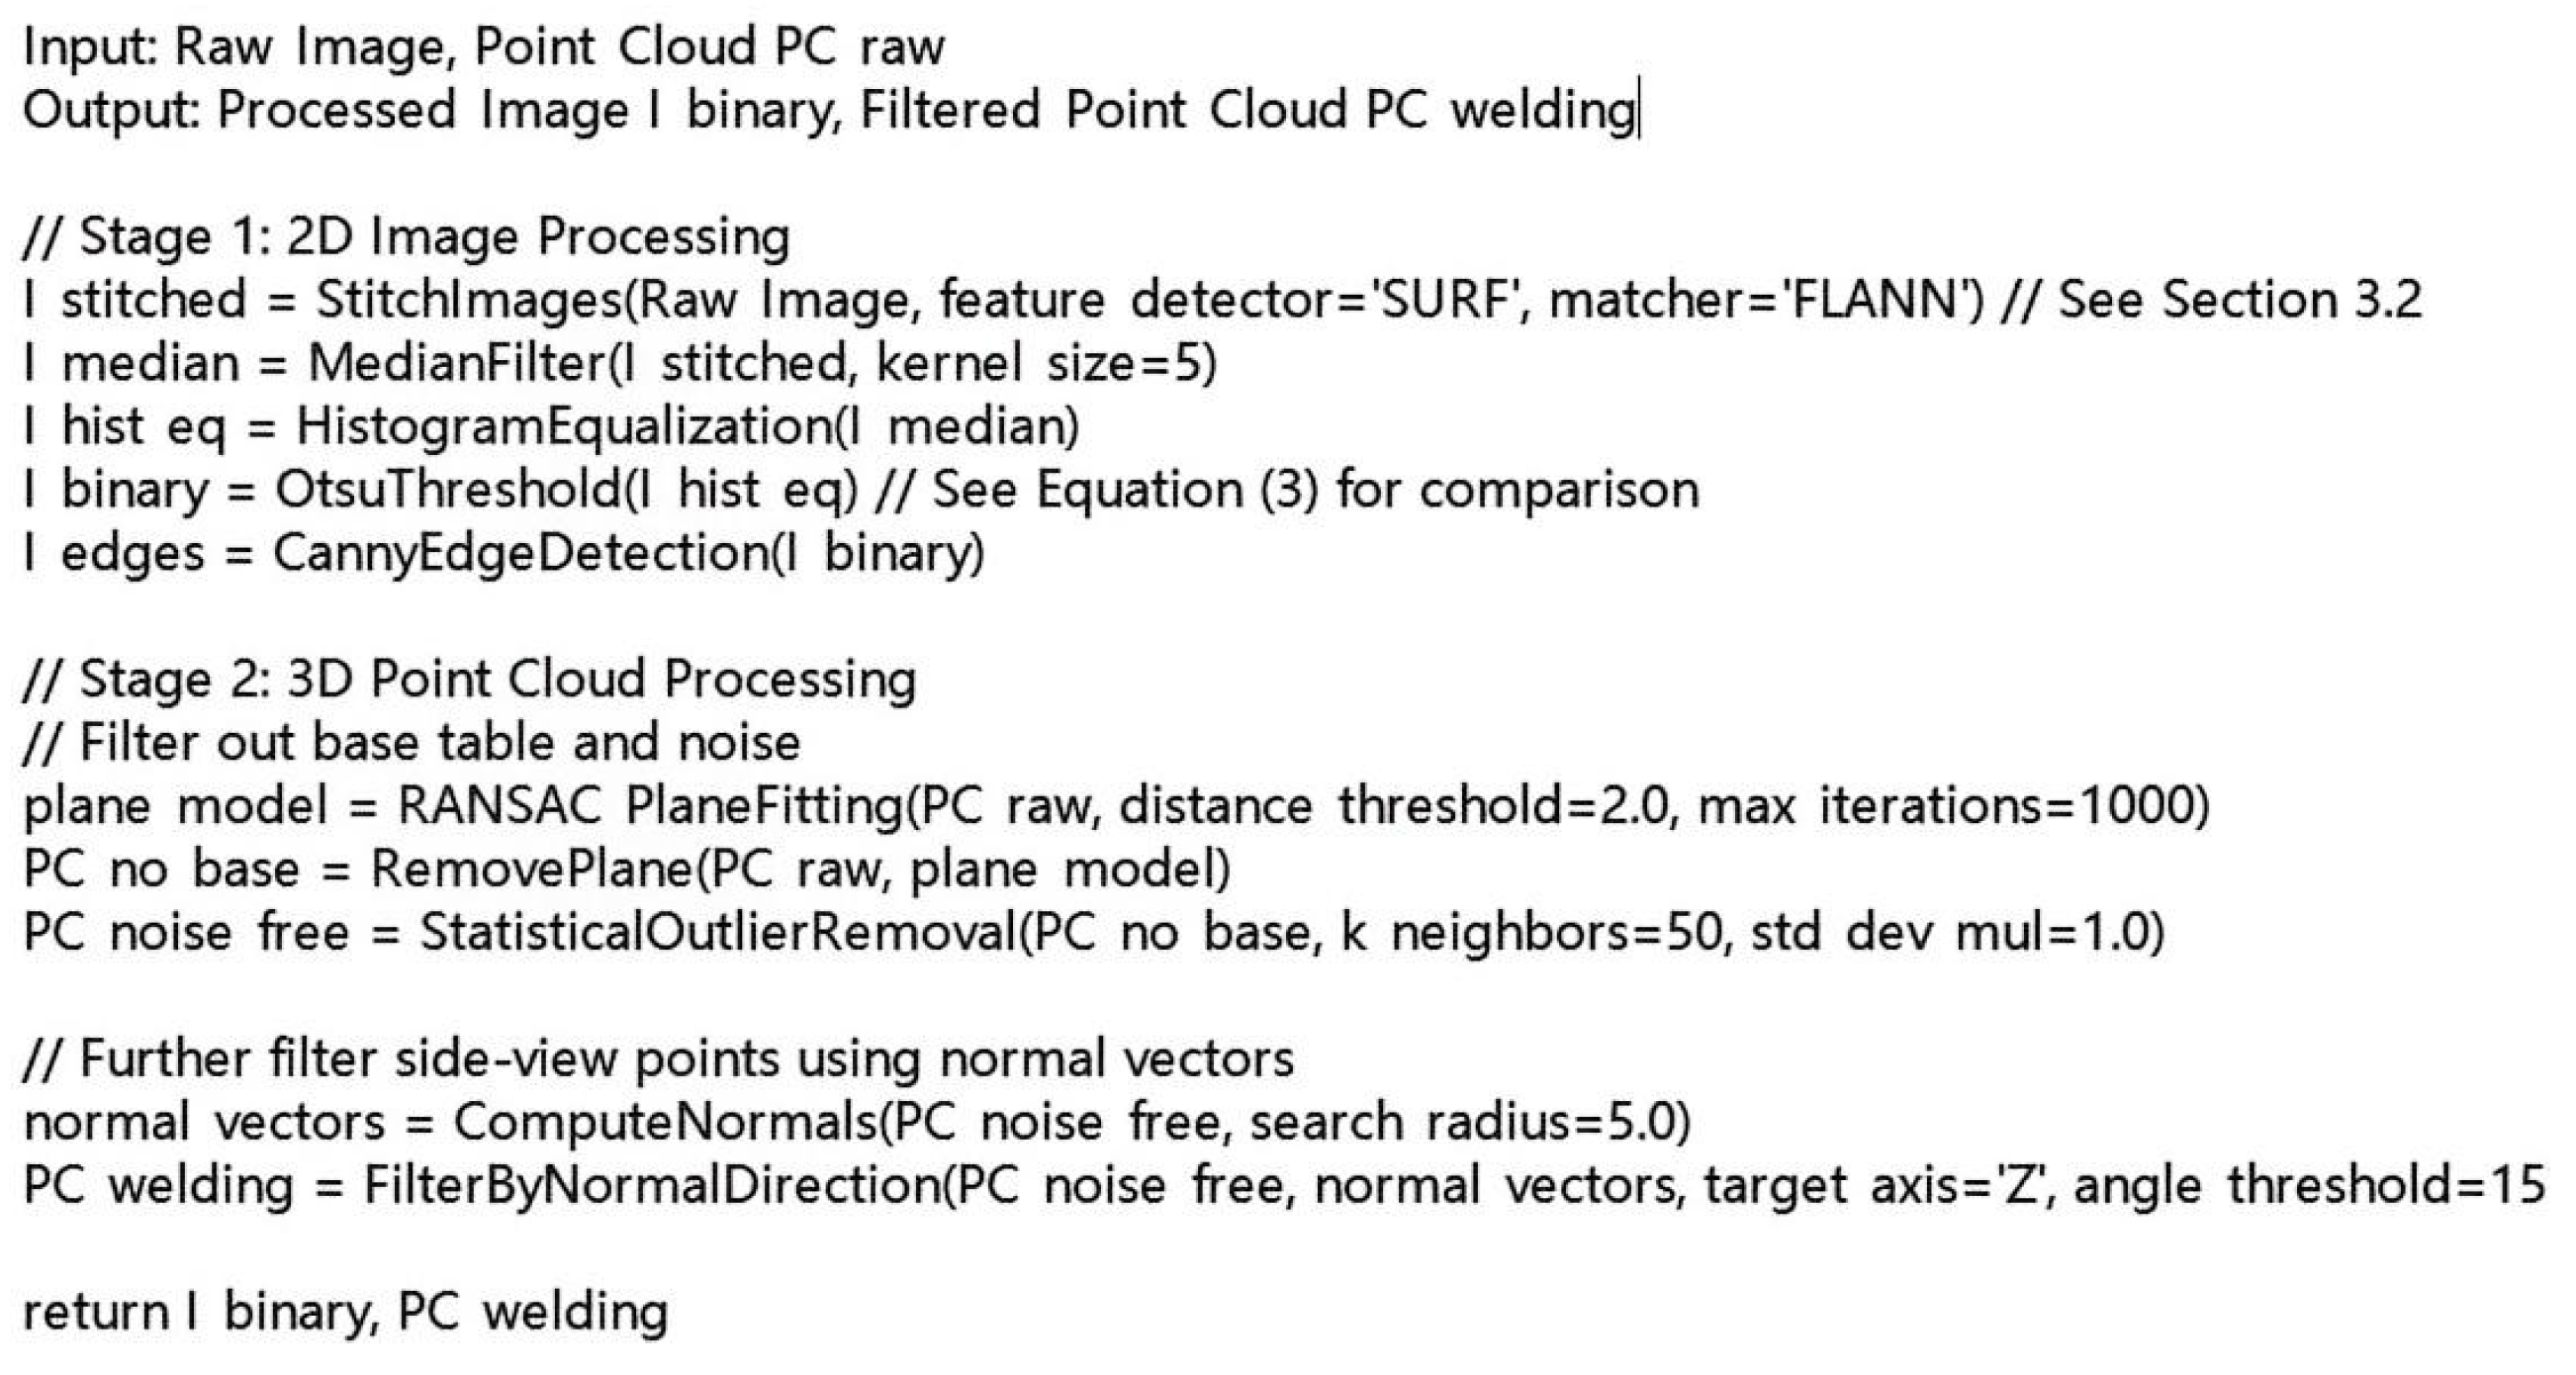
Figure 11 gives the pseudo-code of the hybrid 2D-3D image and point cloud preprocessing pipeline, covering image stitching, filtering, threshold segmentation, Canny edge detection, RANSAC plane fitting, statistical outlier removal, and normal vector filtering. The essential difference between opening and closing operations lies in the morphological effect: opening eliminates fine protrusions and isolated small noise; closing fills narrow gaps, suppresses tiny voids, and repairs broken contour segments.

3.2. Image Preprocessing

Image preprocessing is the bottom-level link of visual recognition, which does not increase inherent image information but suppresses irrelevant interference, restores real pixel features, and amplifies target contour characteristics, laying a foundation for accurate weld path detection.
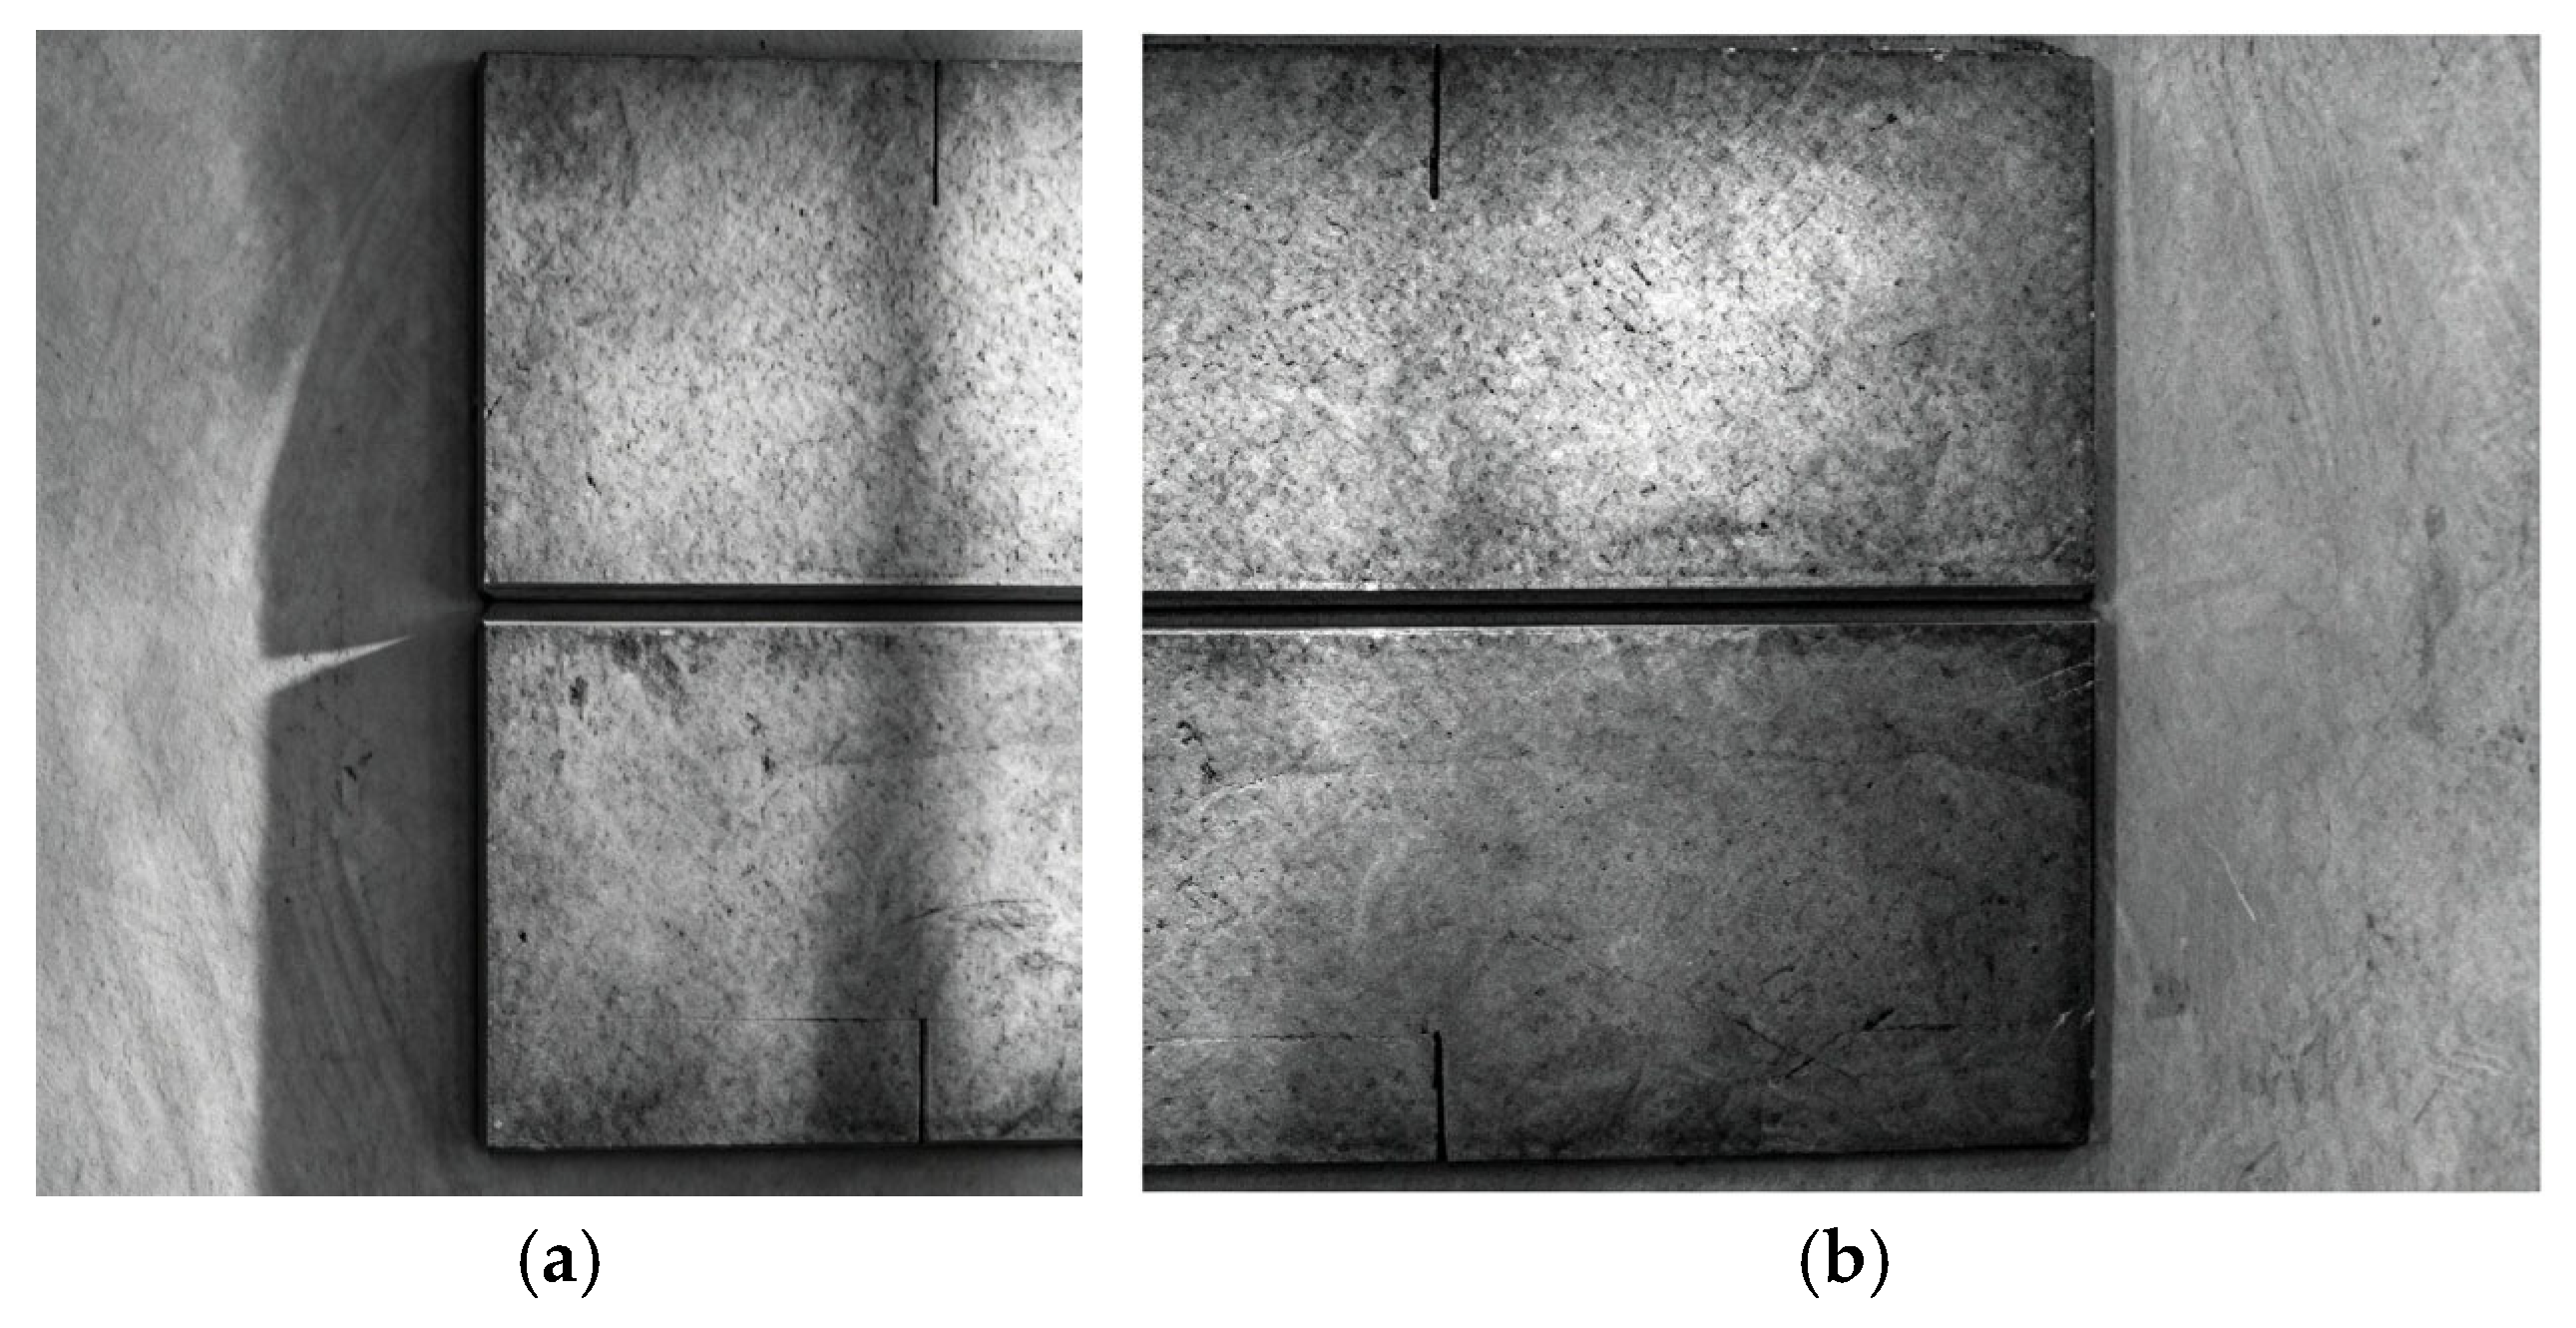
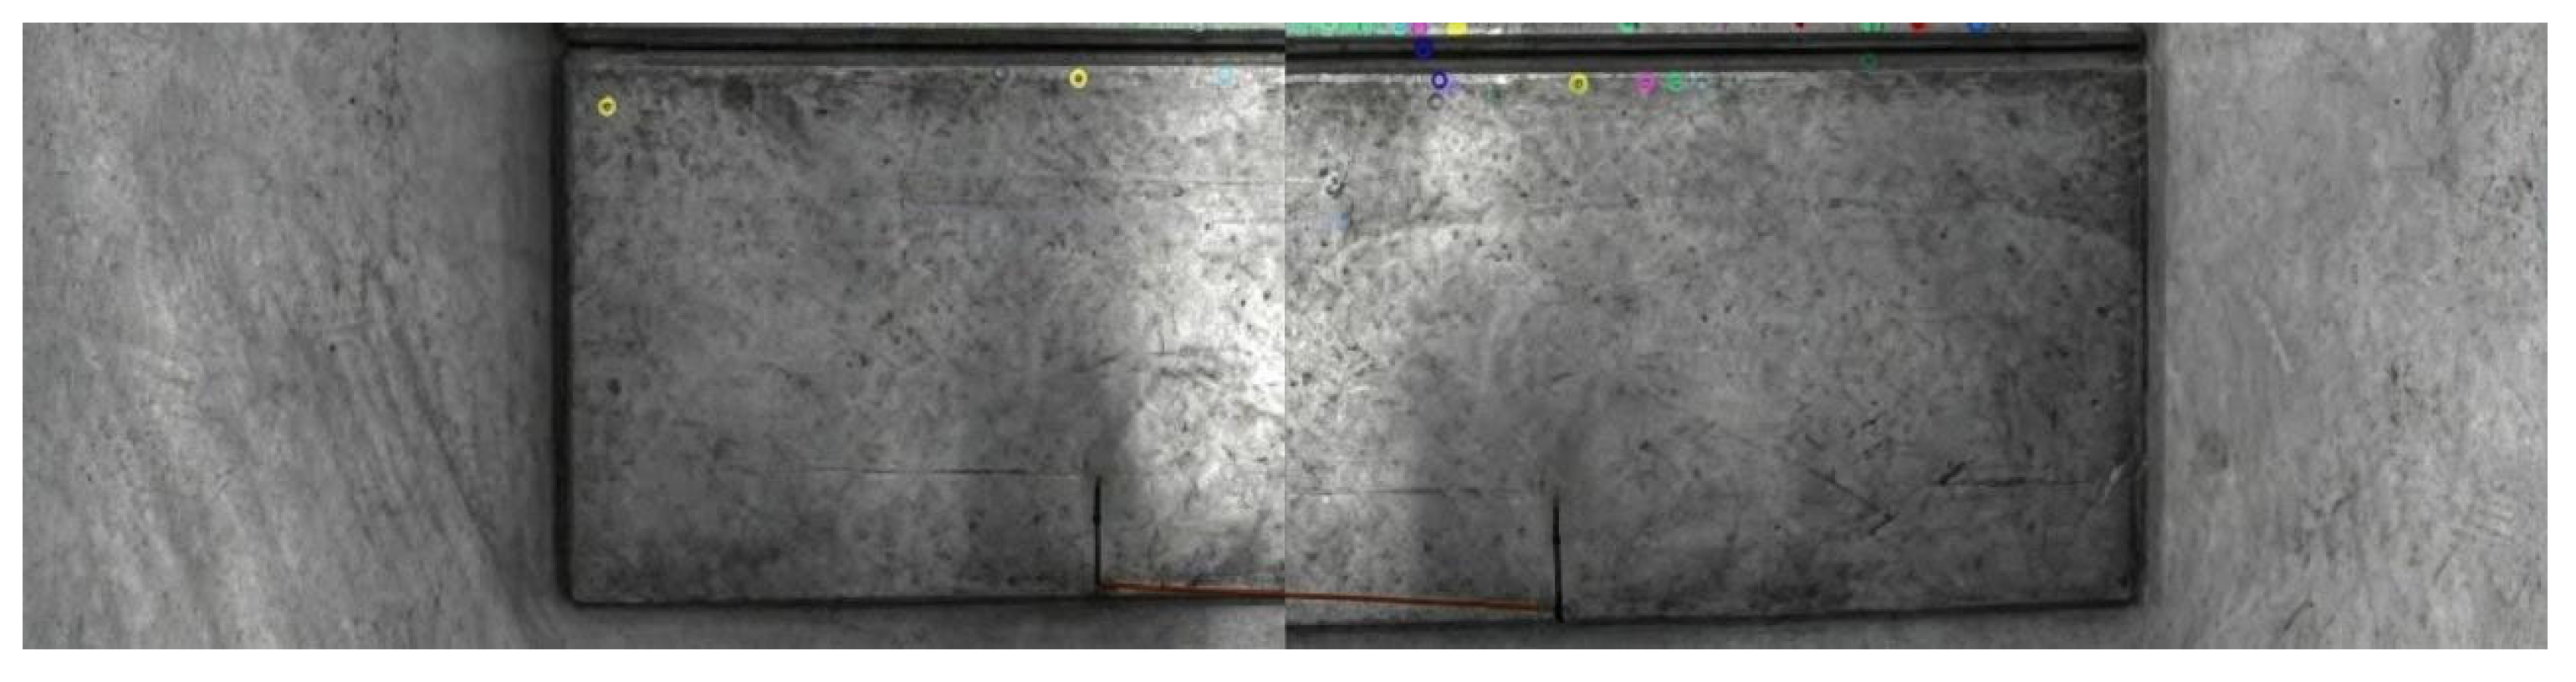
Median filtering is applied to stitched images for noise suppression while retaining edge integrity, which is critical for subsequent edge detection. Comparative experiments with mean filtering and Gaussian filtering verify that median filtering has optimal performance for weld path image denoising and edge preservation. Figure 12 shows the feature point matching results of the SURF-FLANN algorithm on original images.
Based on SURF feature extraction and FLANN feature matching, OpenCV built-in Stitcher class is used for image stitching to meet the large-field imaging demand of ship structural components. The algorithm achieves high-precision seam alignment and fusion, and the stitched panoramic image is shown in Figure 13.
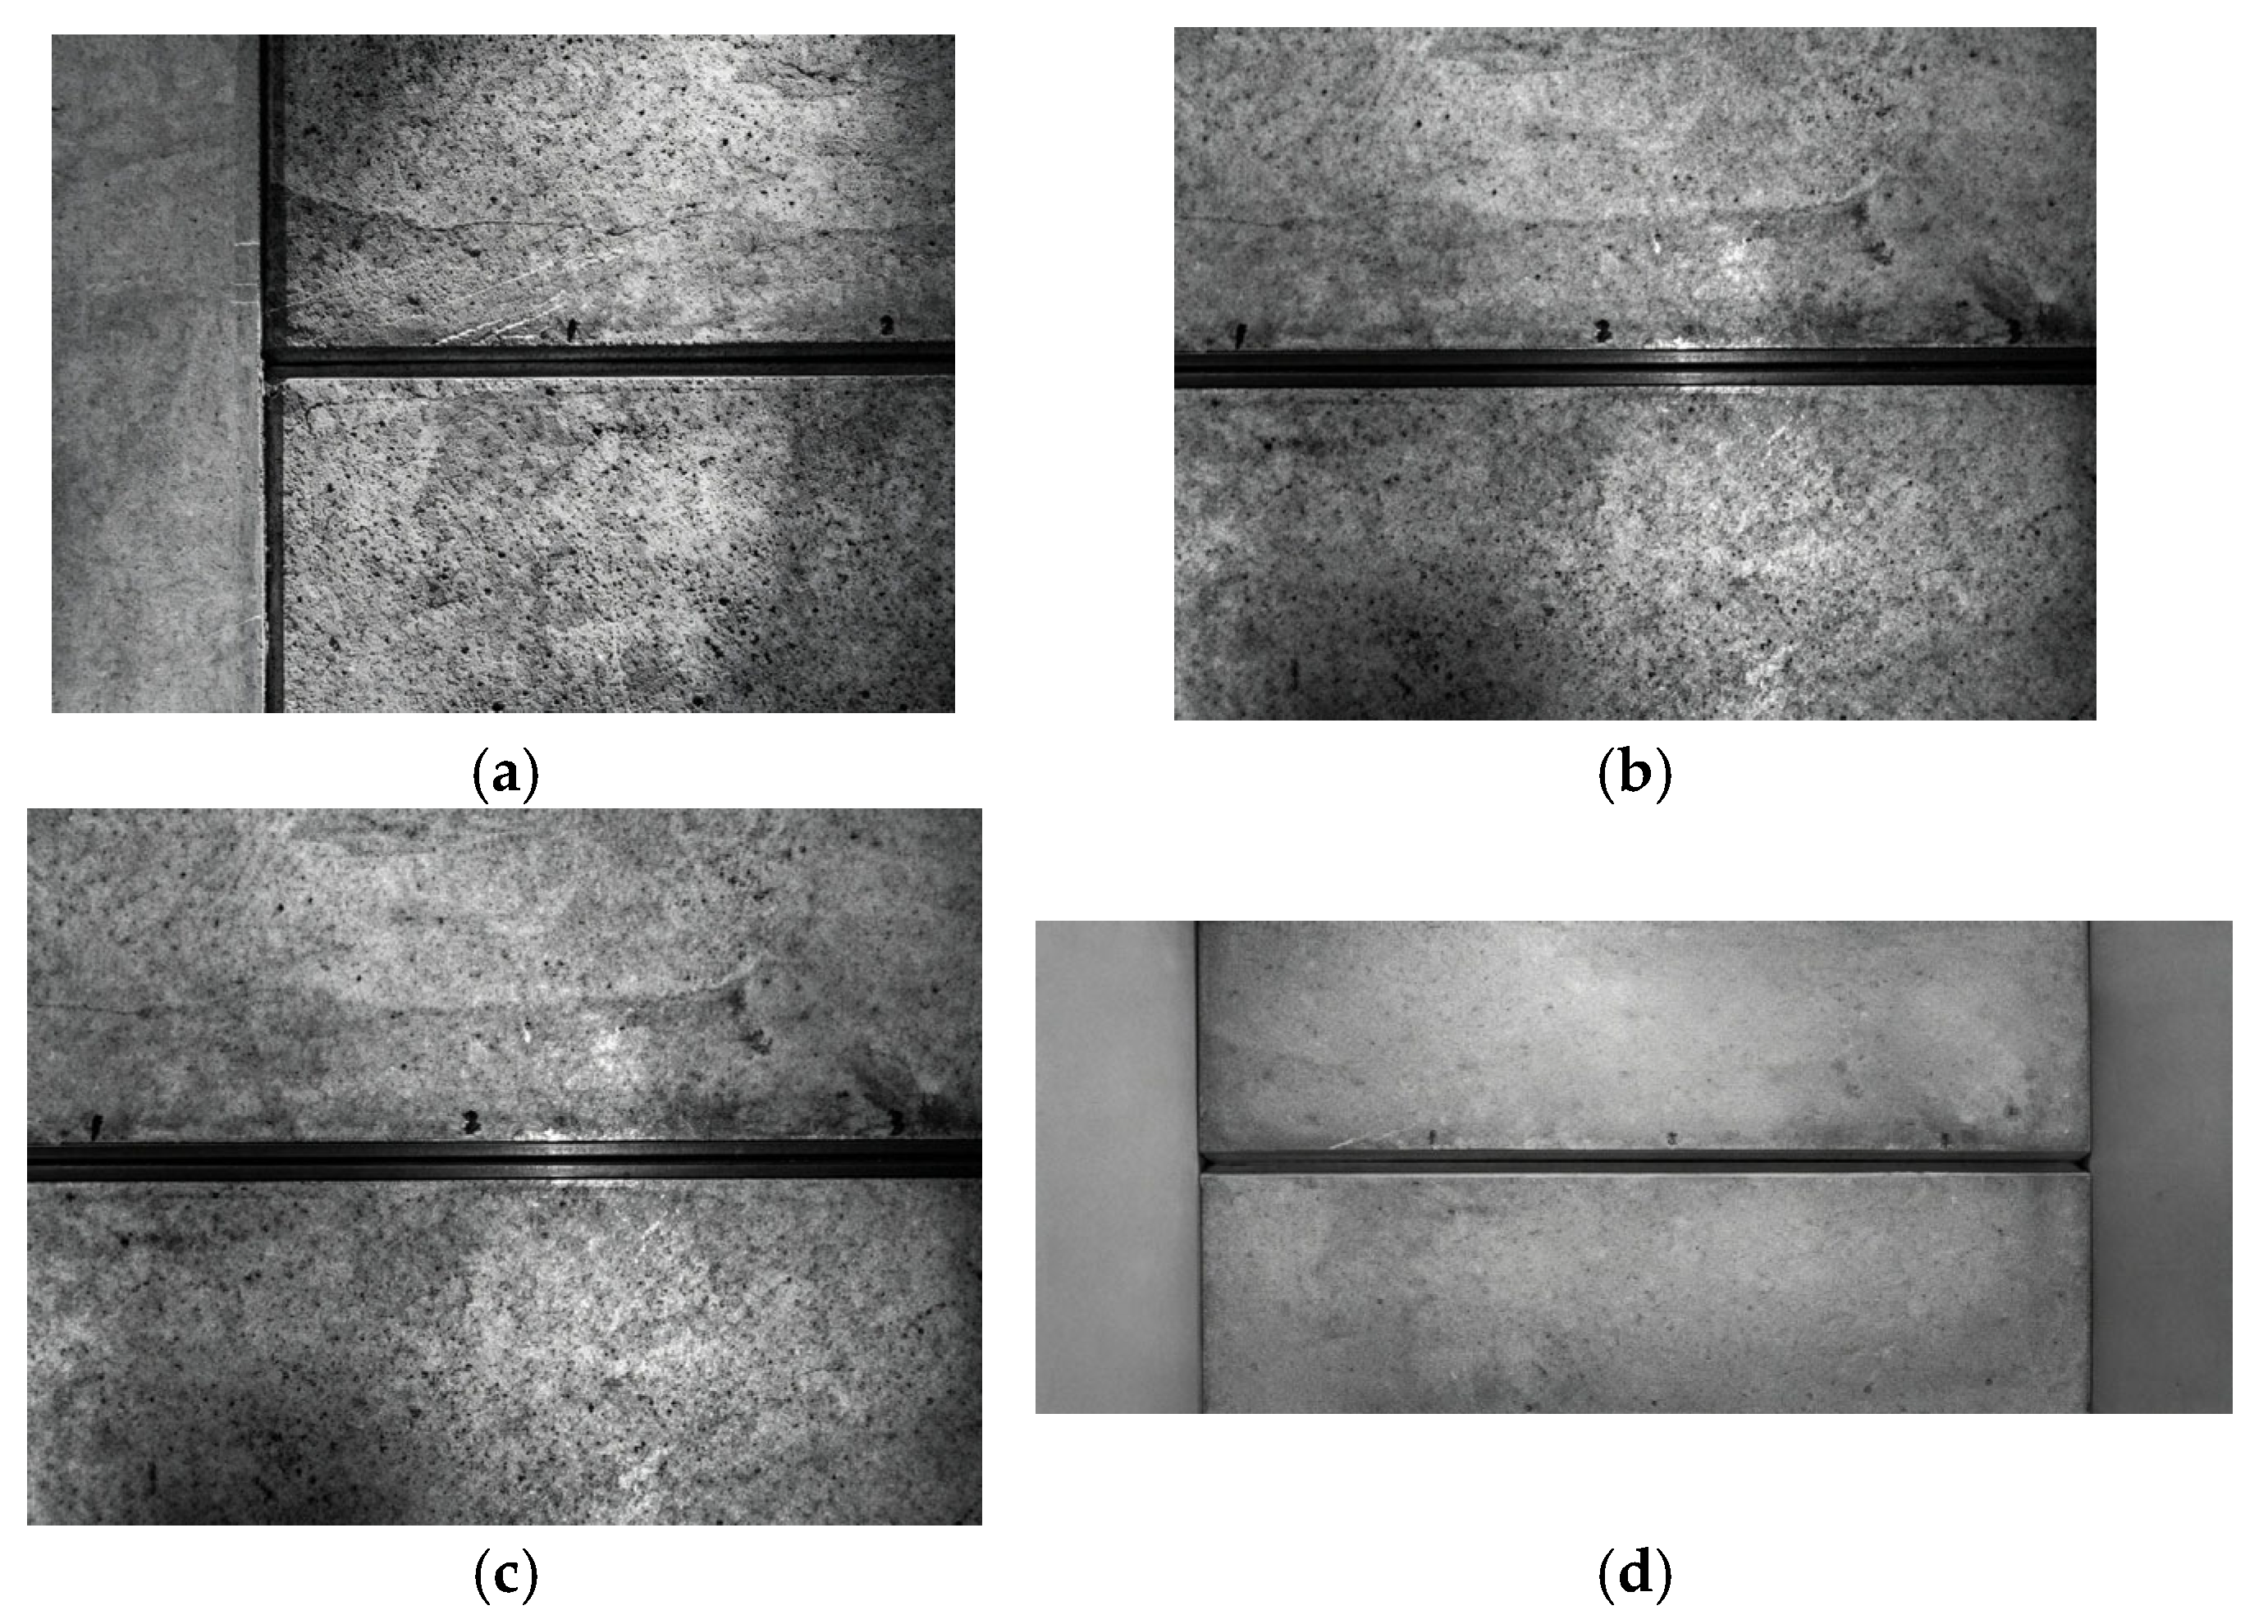
To verify the adaptability of the stitching algorithm to multi-frame images, the workpiece is divided into three overlapping parts for segmented shooting and sequential stitching. The mosaic result in Figure 14 proves that the algorithm is robust for multi-image splicing and suitable for large-scale ship workpiece scanning.
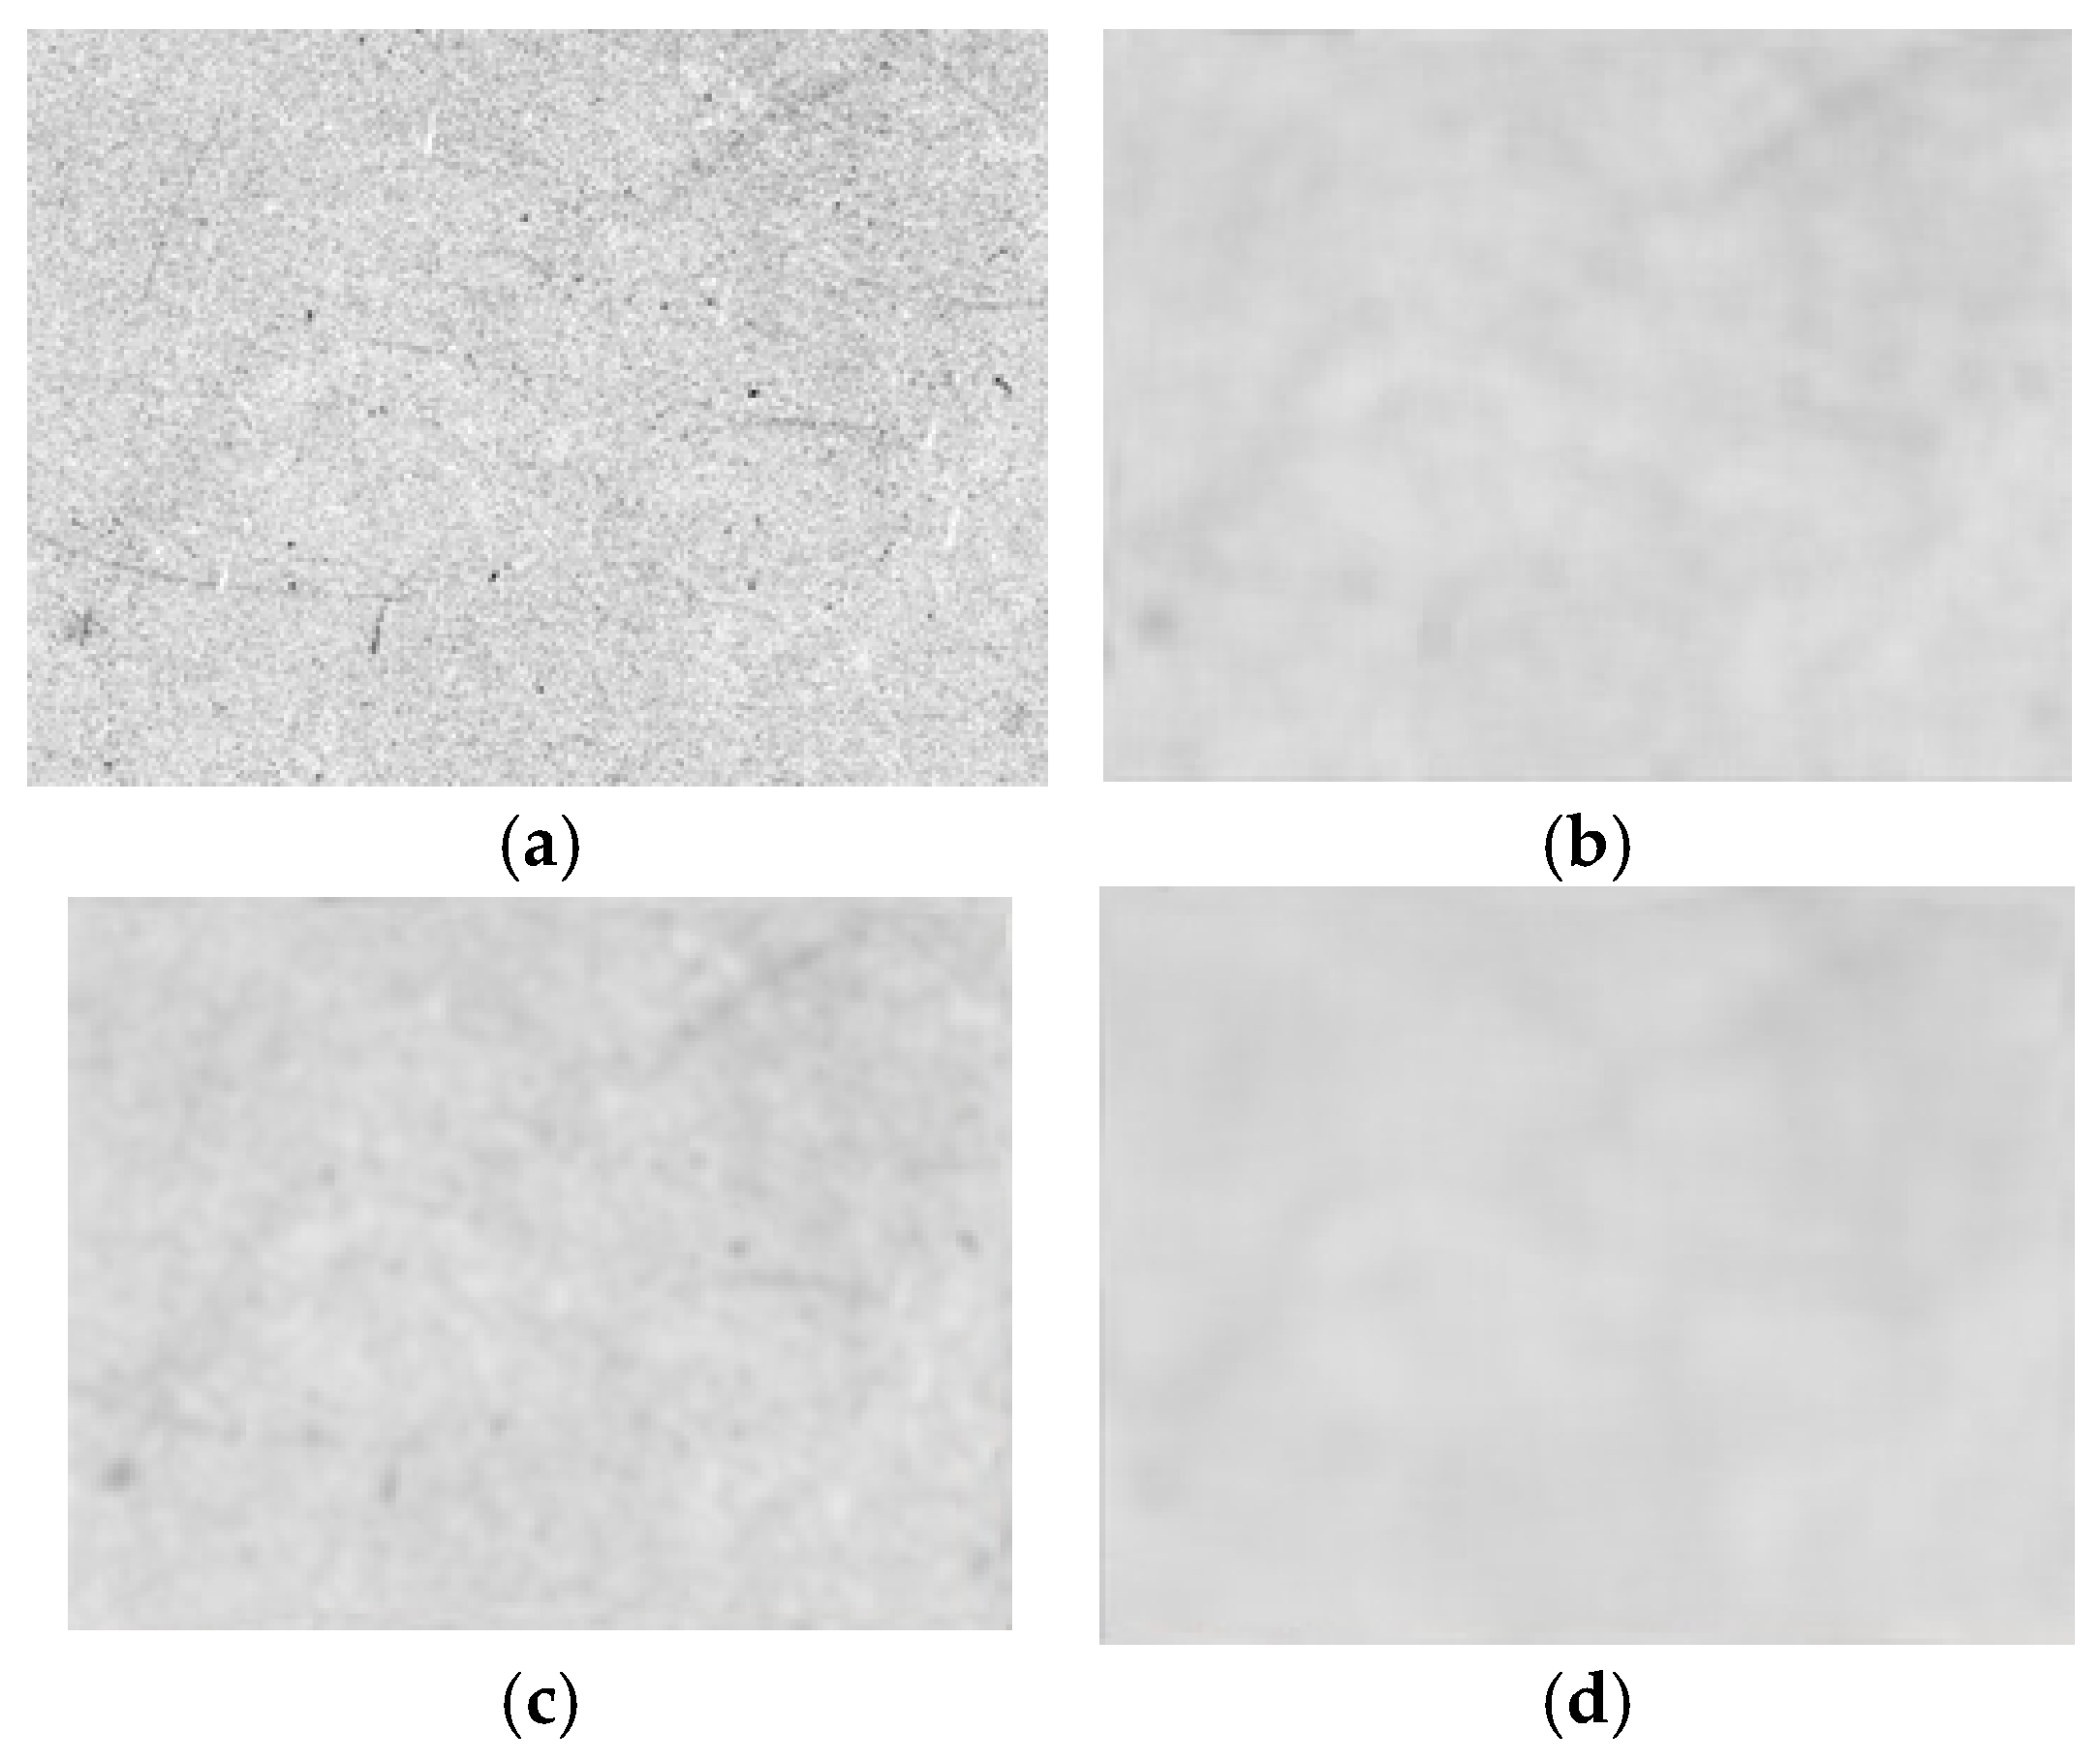
Although the collected images are acquired under low-noise conditions, residual scattered noise still exists. A noisy sample image is selected to compare the denoising effect of mean filtering, Gaussian filtering, and median filtering. Mean filtering blurs edge details seriously; Gaussian filtering has a limited suppression effect on scattered noise; median filtering can effectively remove isolated noise while completely retaining weld contour edges (Figure 15). Therefore, median filtering is determined as the optimal denoising method.
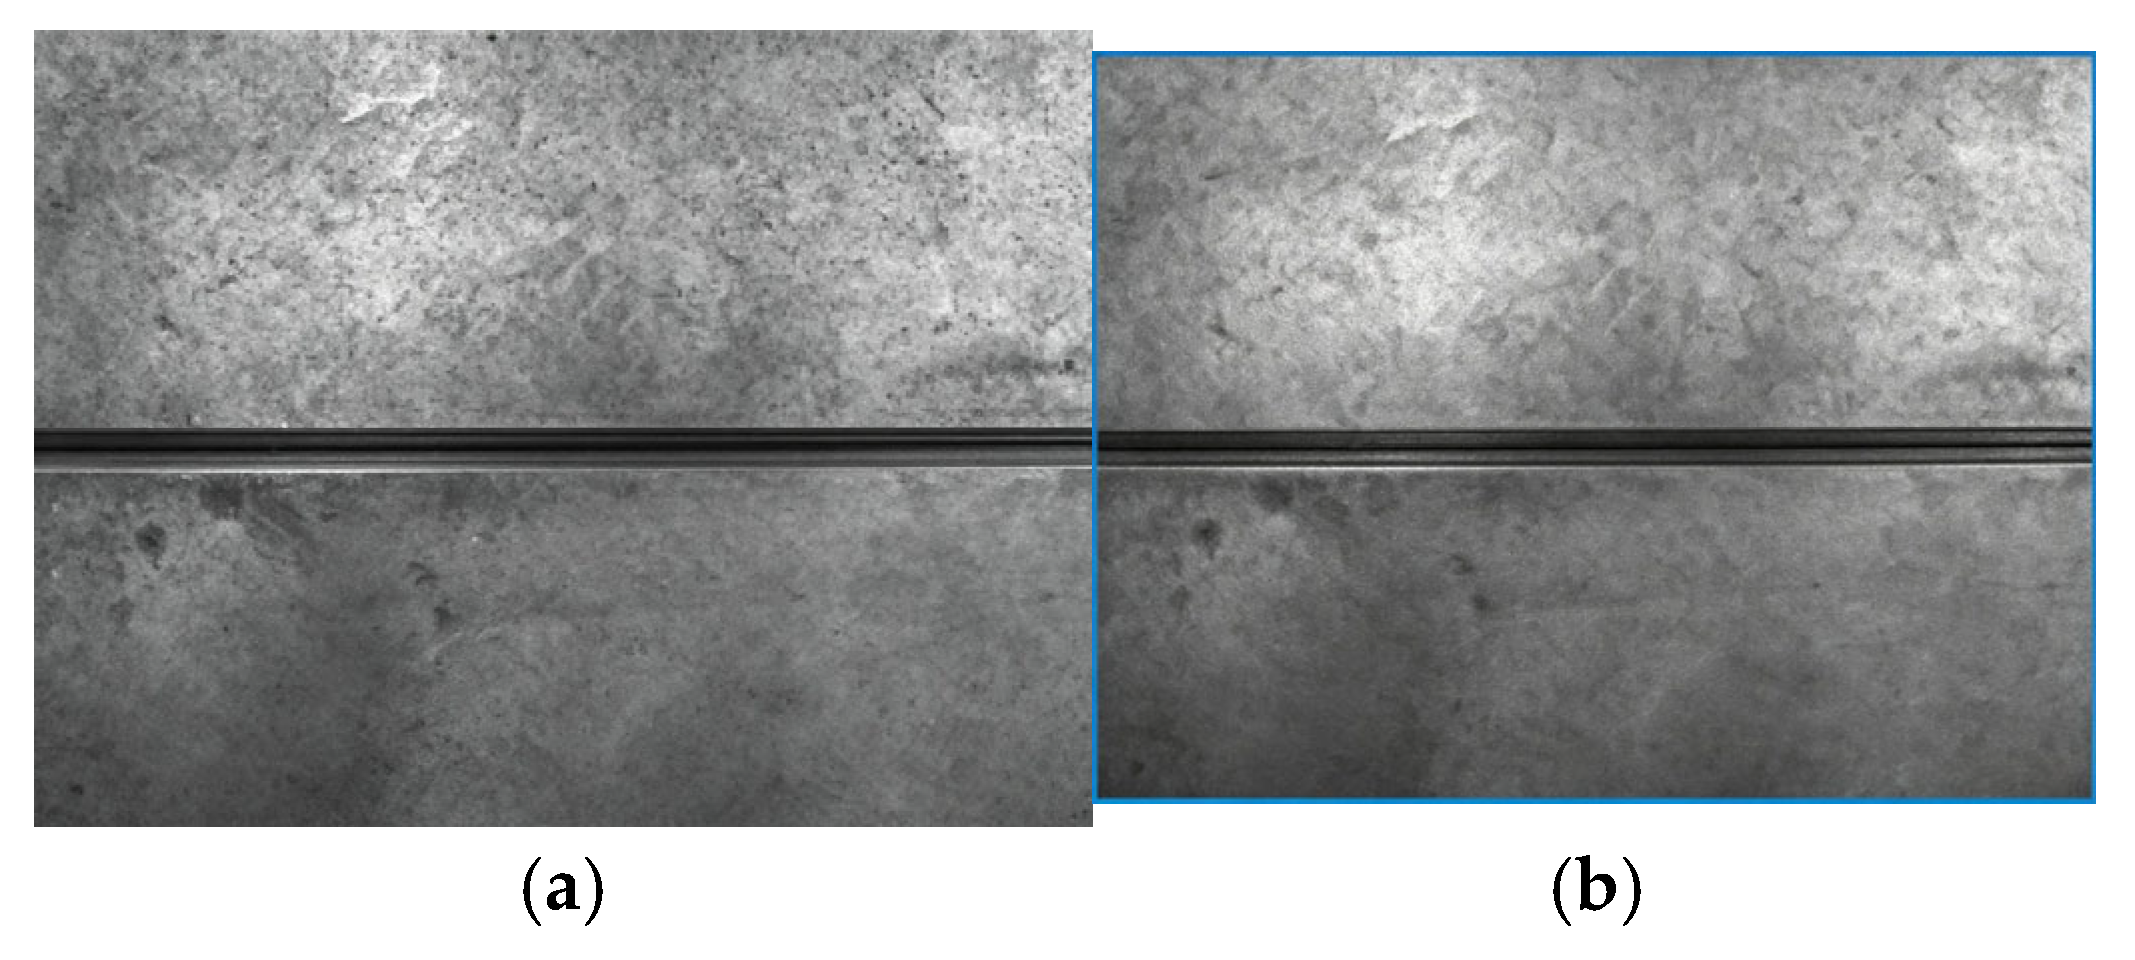
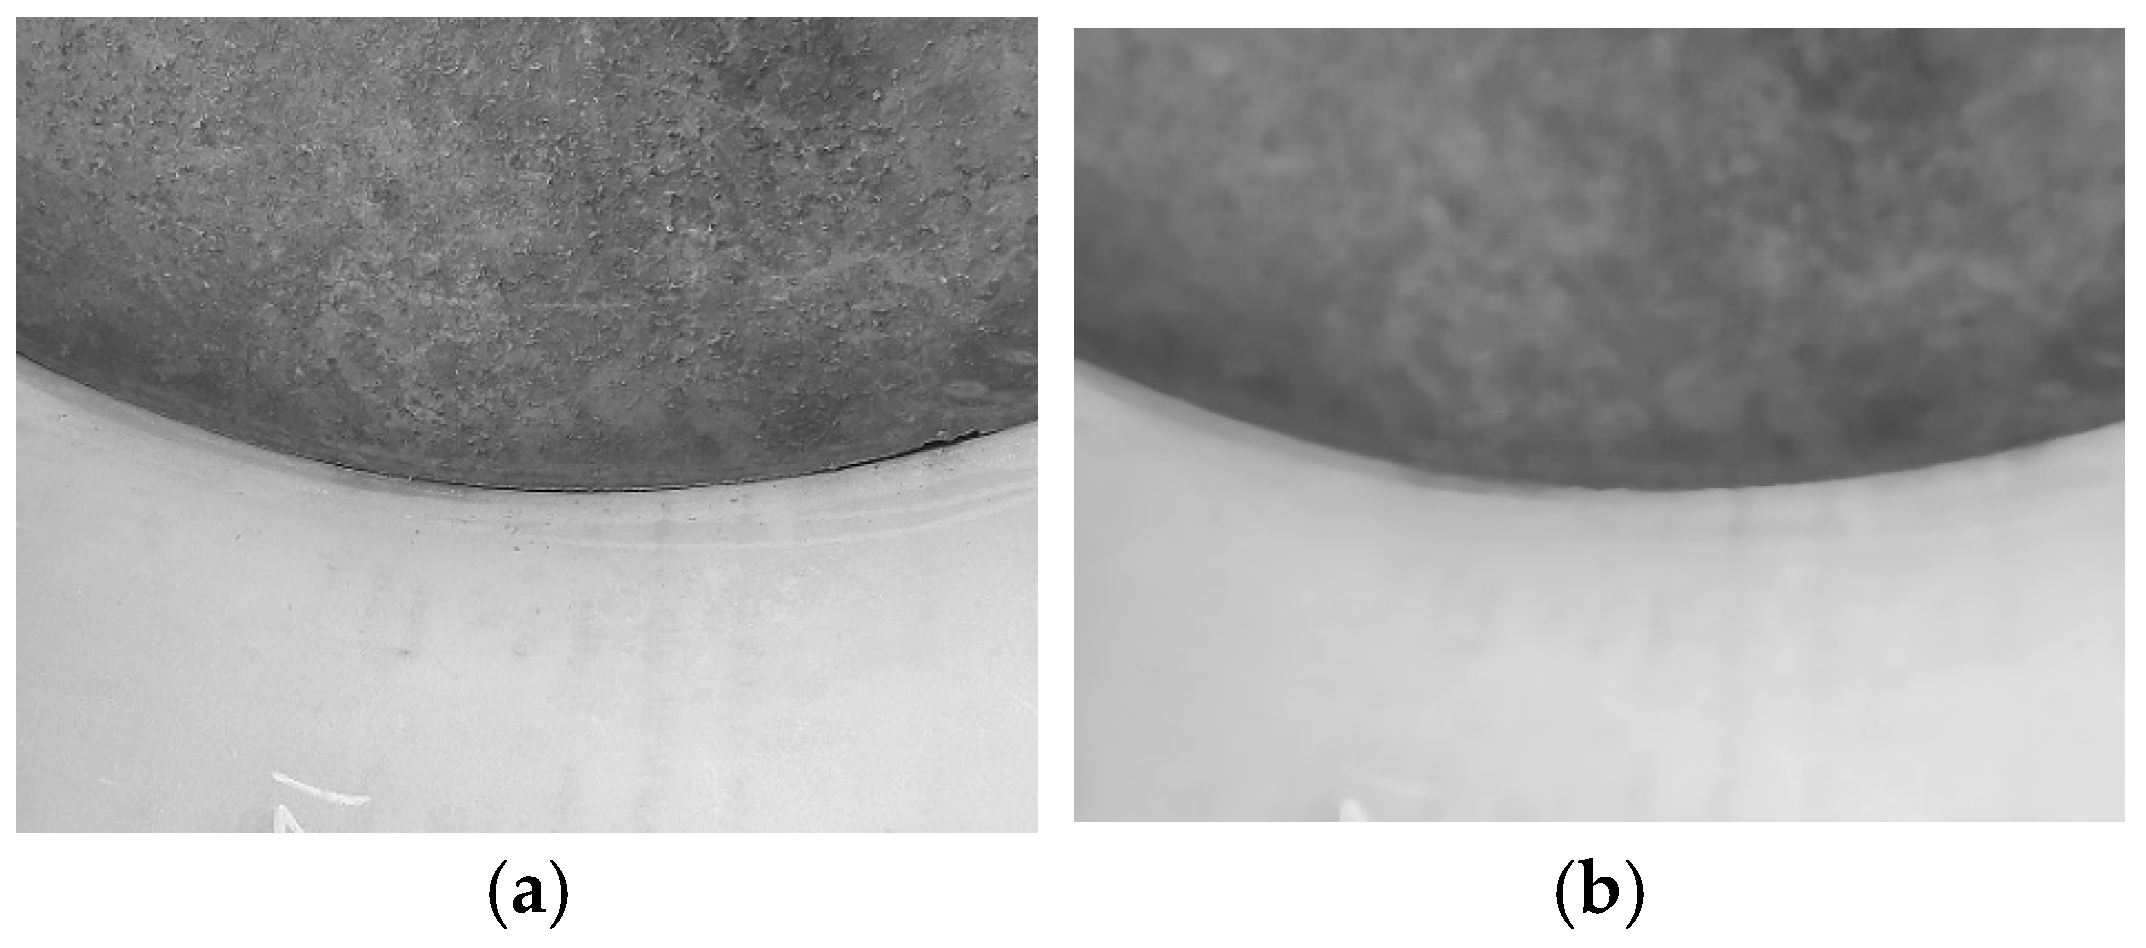
After median filtering, the noise intensity of weld path images is significantly reduced, and the edge definition of weld boundaries is greatly improved (Figure 16), providing reliable input for subsequent edge detection and contour extraction.
The comparative evaluation of the three filtering methodologies substantiates that median filtering is particularly well suited for edge-preserving image preprocessing in the context of edge extraction tasks. Accordingly, median filtering was adopted in this study to perform noise reduction on the acquired welding path images. As illustrated in Figure 17, the application of median filtering markedly attenuates noise intensity across both low-contrast and high-contrast regions, while concurrently enhancing the definition of edge features along the welding path boundaries. These improvements establish a robust and reliable foundation for the accurate detection of welding path edges in subsequent processing stages.

3.3. 3D Point Cloud Processing for Weld Component Extraction

The raw scanned 3D point cloud contains redundant information such as target welding components, base plates, and workbench background. A three-stage filtering strategy is designed to extract a pure welding component point cloud Figure 18.
(1) Coarse Filtering: The Random Sample Consensus (RANSAC)algorithm is used to fit a parametric plane to the largest horizontal cluster, identified as the base plate or workbench. The plane equation is then used to apply a pass-through filter along the Z-axis, efficiently removing all points below a calculated height threshold (Figure 18b,c). The distance threshold for the RANSAC inlier set was experimentally determined to be 1.0 mm, optimized to separate structural components from the base.
(2) Fine Filtering: Outlier noise and measurement artifacts are removed using a statistical outlier removal filter, which discards points whose mean distance to a set of k-nearest neighbors exceeds a defined standard deviation. Here, *k* = 50 and the standard deviation multiplier is 1.0 (Figure 18d).
(3) Semantic Filtering: To eliminate data from the component’s thin sides, we compute the surface normal for each point. A normal vector filter is then applied, retaining only points whose normal has a dominant Z-axis component (i.e., the angle deviation from the Z-axis is less than 15°), effectively extracting the top-facing surface points of the welding components (Figure 18e,f). This step is critical for the accuracy of subsequent 2D projection.
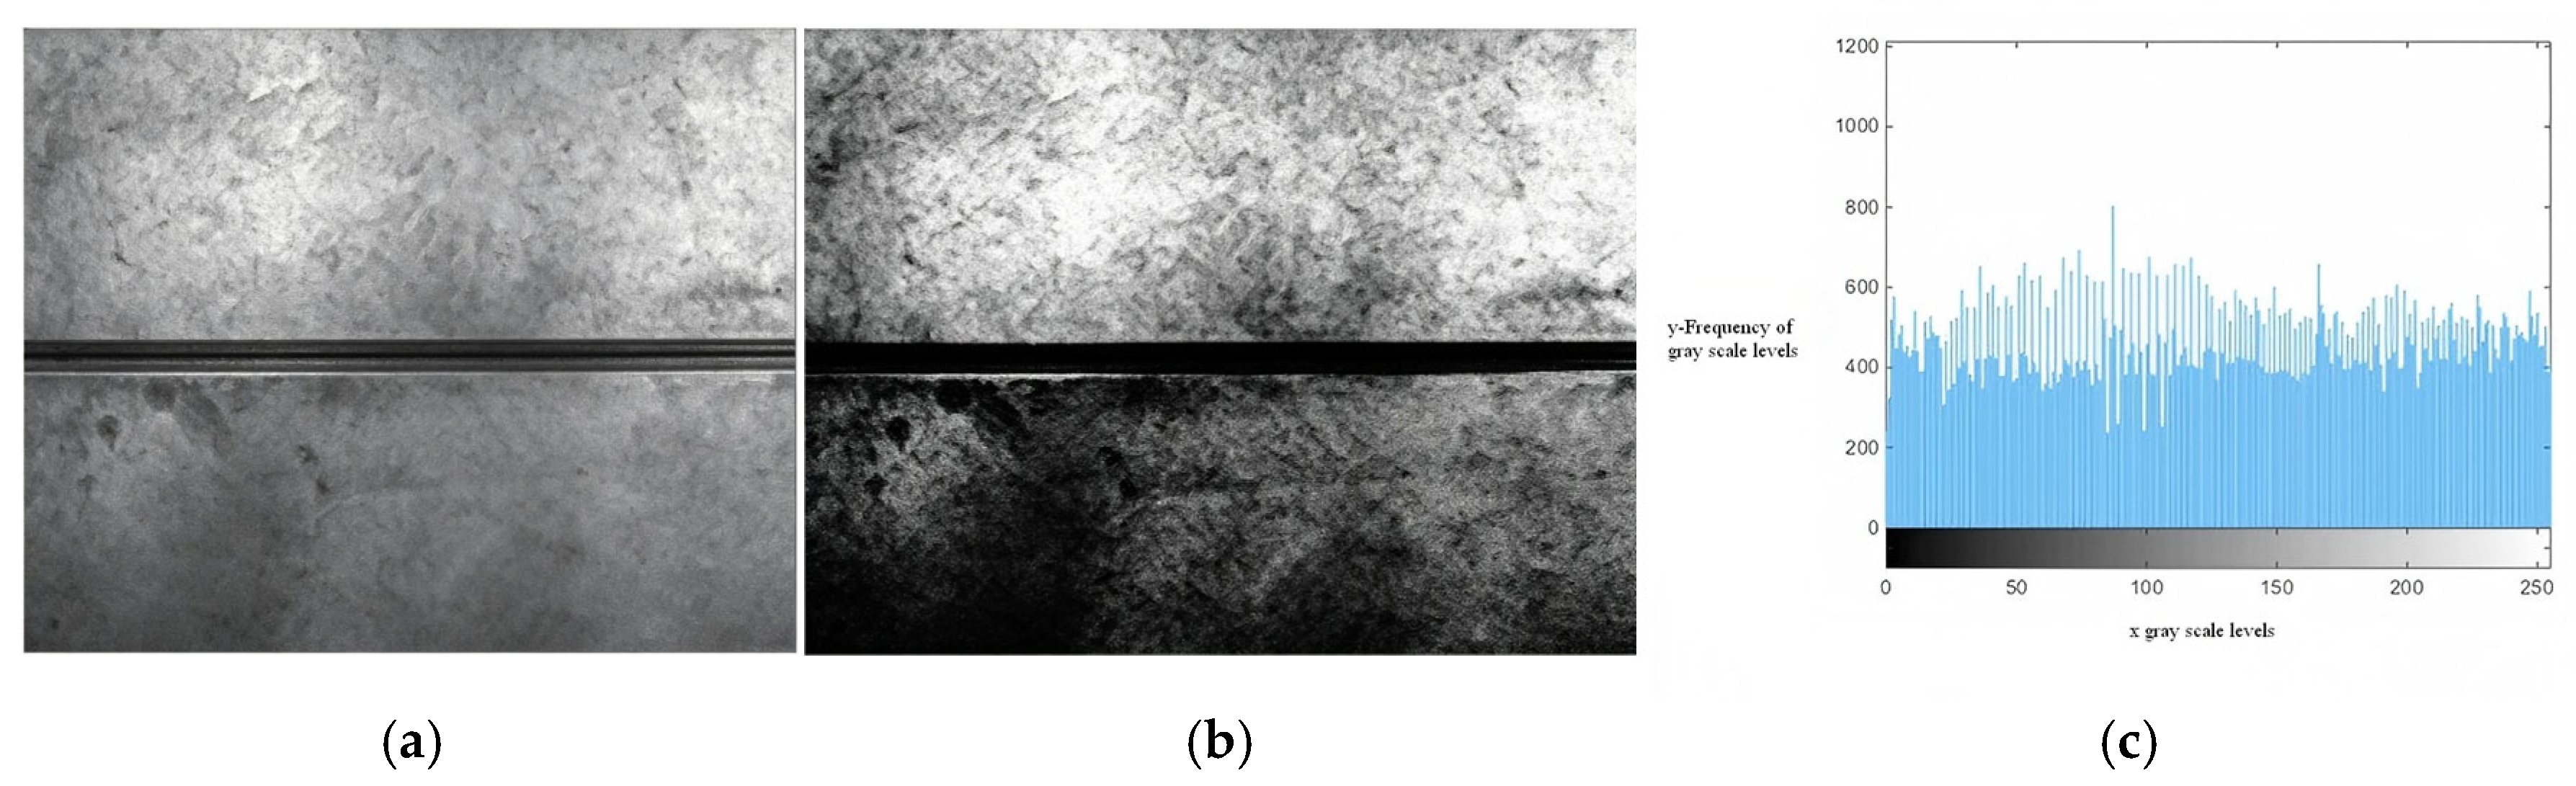
In conventional processing, grayscale images represent pixel intensity by 256 luminance levels (0–255), eliminating separate color channels. Binarization then assigns pixel values to 0 or 1 via a selected threshold, producing high-contrast patterns that accentuate edges and simplify subsequent detection while preserving local texture and global structure. Binary images are essential for edge detection: constraining pixels to binary states significantly reduces data volume and amplifies contour saliency. As shown in Figure 19. When equalized images display uniform central regions and heterogeneous peripheries, threshold-based segmentation partitions the image robustly. Where object and background are not inherently separable in the grayscale domain, intensity differences can be exploited, and thresholding delineates the boundary effectively.
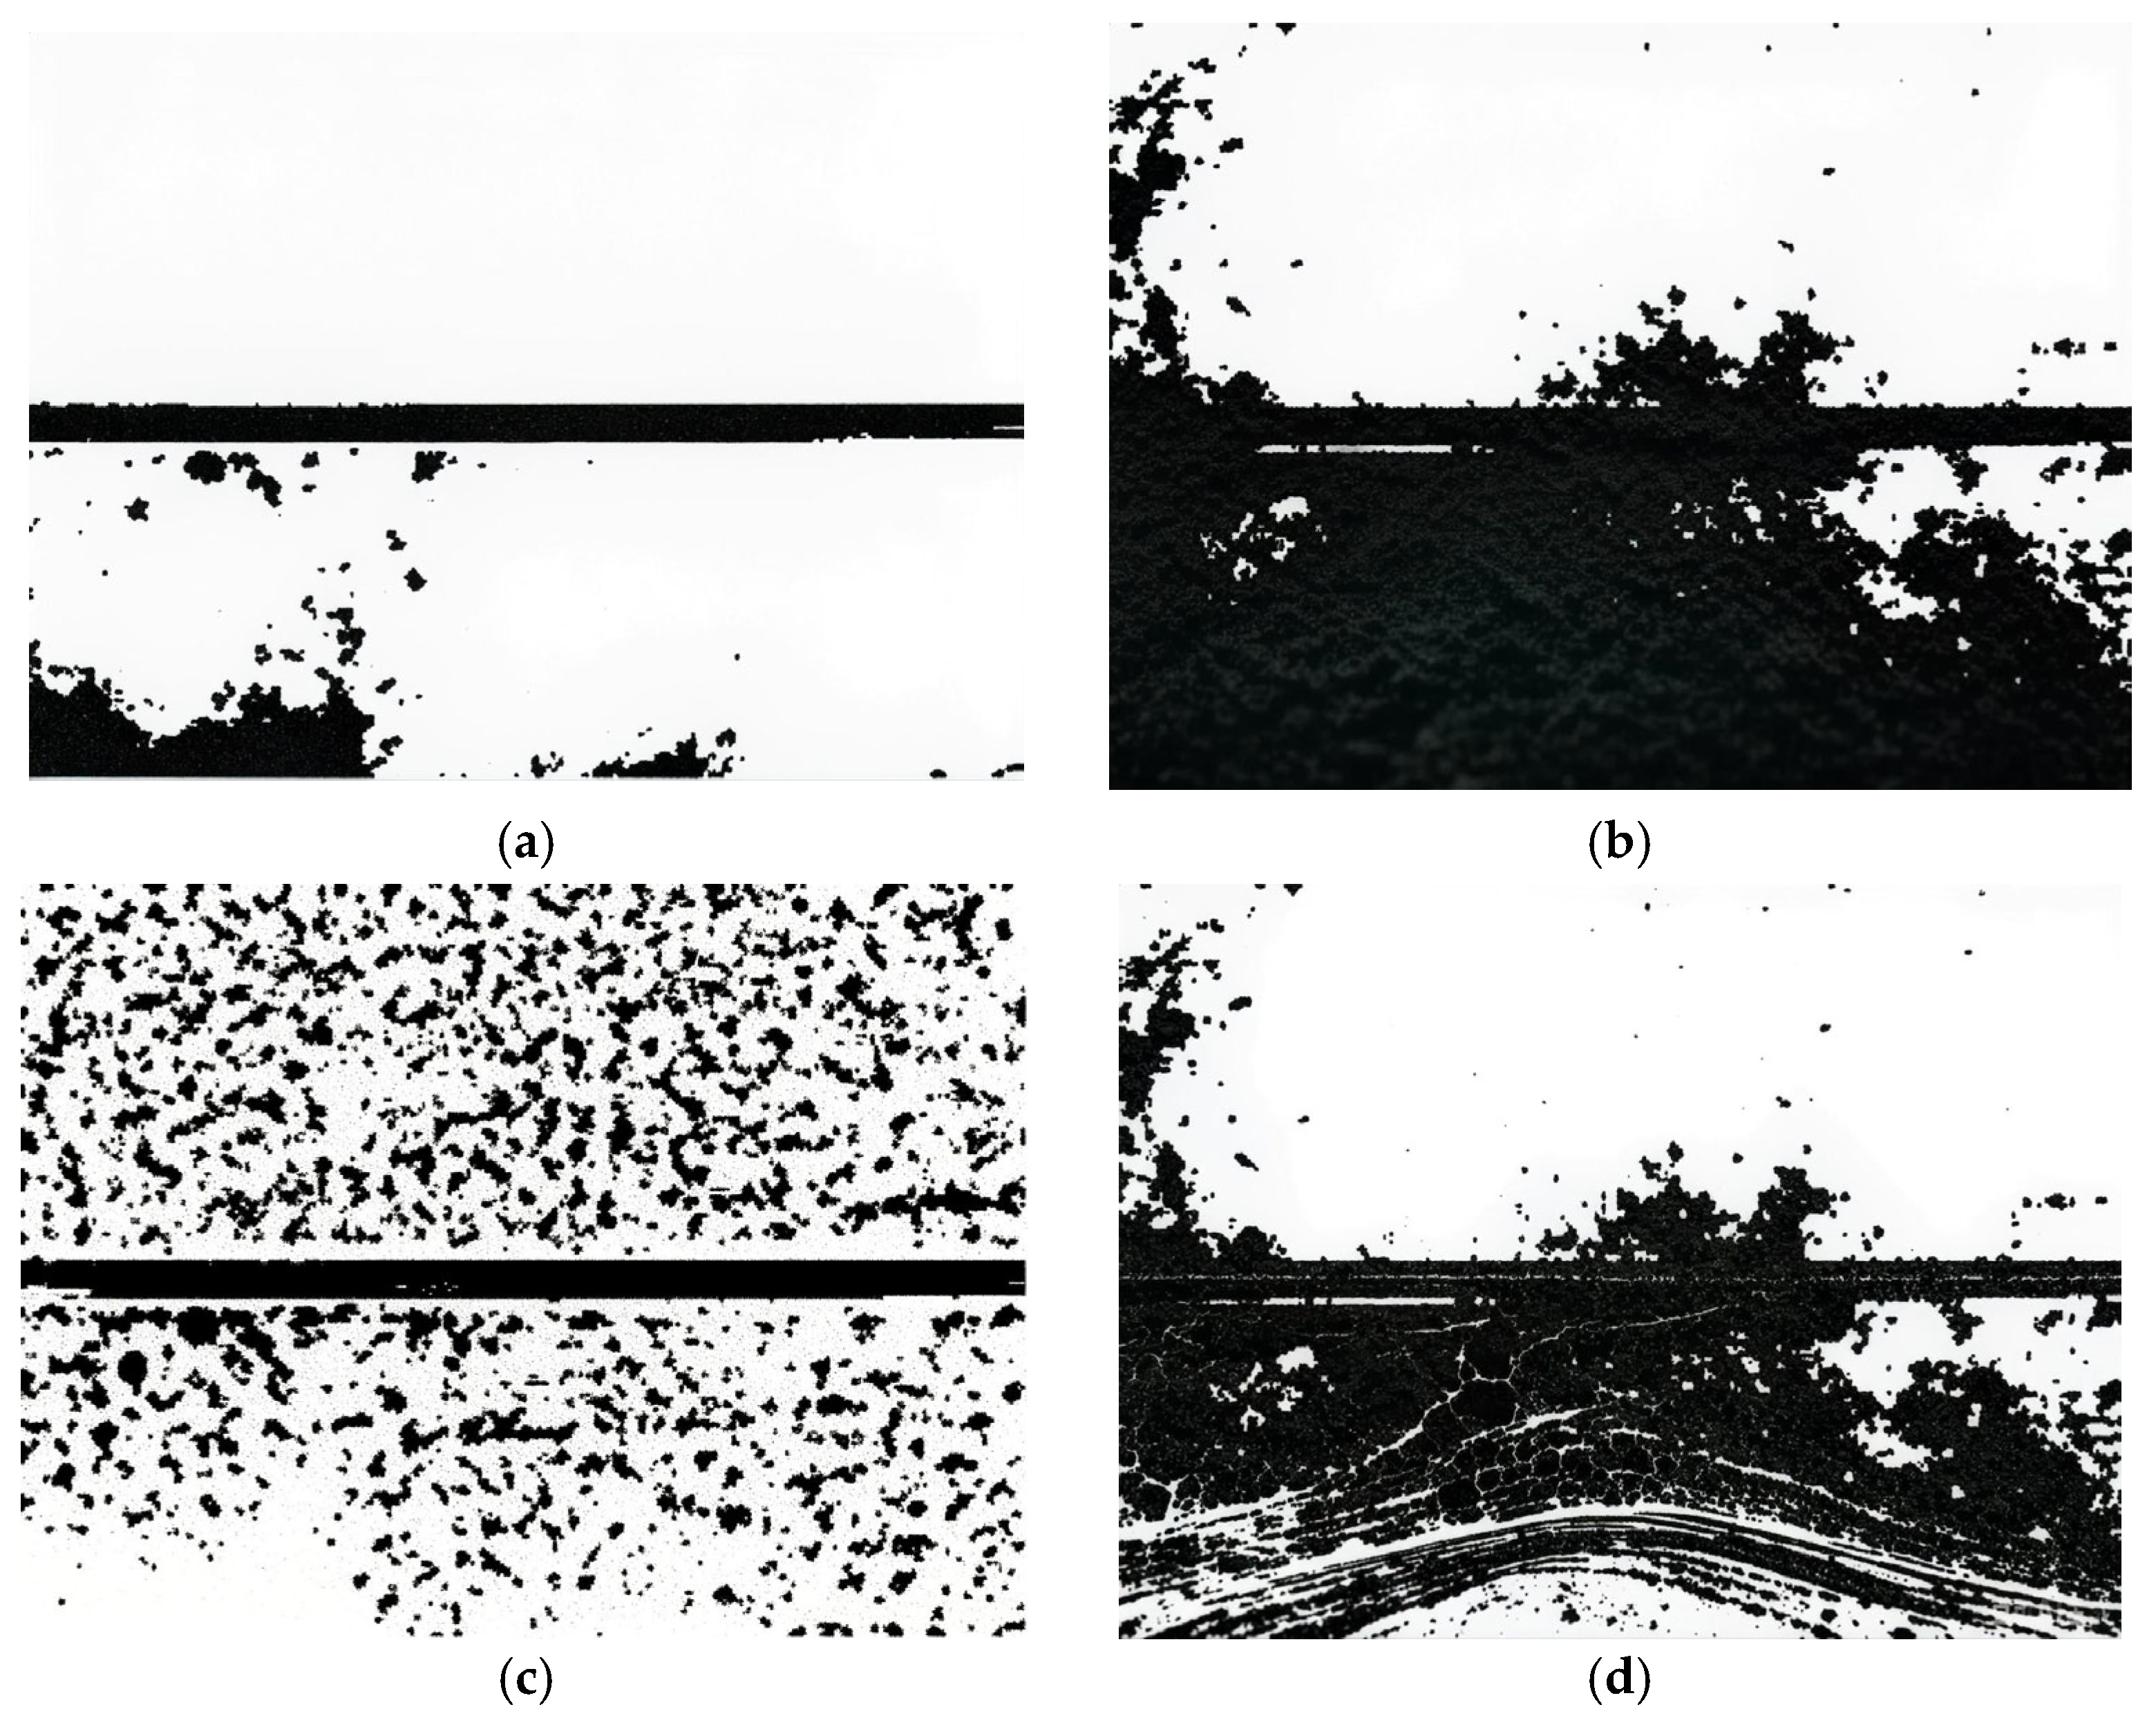
Figure 19 presents the workpiece image subsequent to histogram equalization. The original image was subjected to binarization utilizing two widely adopted threshold segmentation methodologies. For comparative purposes, the resulting renderings additionally include outputs generated by the maximum entropy threshold segmentation method and the adaptive threshold segmentation method-both of which are less frequently employed in standard practice. Manual threshold segmentation was deliberately excluded from this comparative analysis owing to its inherent discontinuity and incompatibility with automated, continuous image processing workflows. The processed outcomes derived from the two conventional threshold segmentation techniques, alongside the binarization results obtained via the two alternative threshold segmentation approaches, are collectively illustrated in Figure 20.

4. Experimental Study and Analysis on Welding Path Recognition for Typical Ship Structures

4.1. Algorithmic Development Environment

The image and point cloud processing algorithms were developed in a Windows 10 environment using Visual Studio 2010, OpenCV 2.4.9, and the Point Cloud Library (PCL) 1.8.0. All quantitative experiments were conducted on a workstation equipped with an Intel Core i7-9700K CPU and 32 GB of RAM.

4.2. Component Contour Reconstruction and Trajectory Generation

This chapter verifies the effectiveness of the visual recognition system for identifying welding paths on ship structural components through systematic robot and vision subsystem selection, calibration, and image processing. It first introduces the algorithm development environment, then presents recognition experiments on varied workpiece configurations to demonstrate algorithmic adaptability. The derived welding paths are analyzed in a global coordinate frame, and system accuracy is validated through experimental error analysis. Future work will identify the root causes of measurement deviations and formulate mitigation strategies.
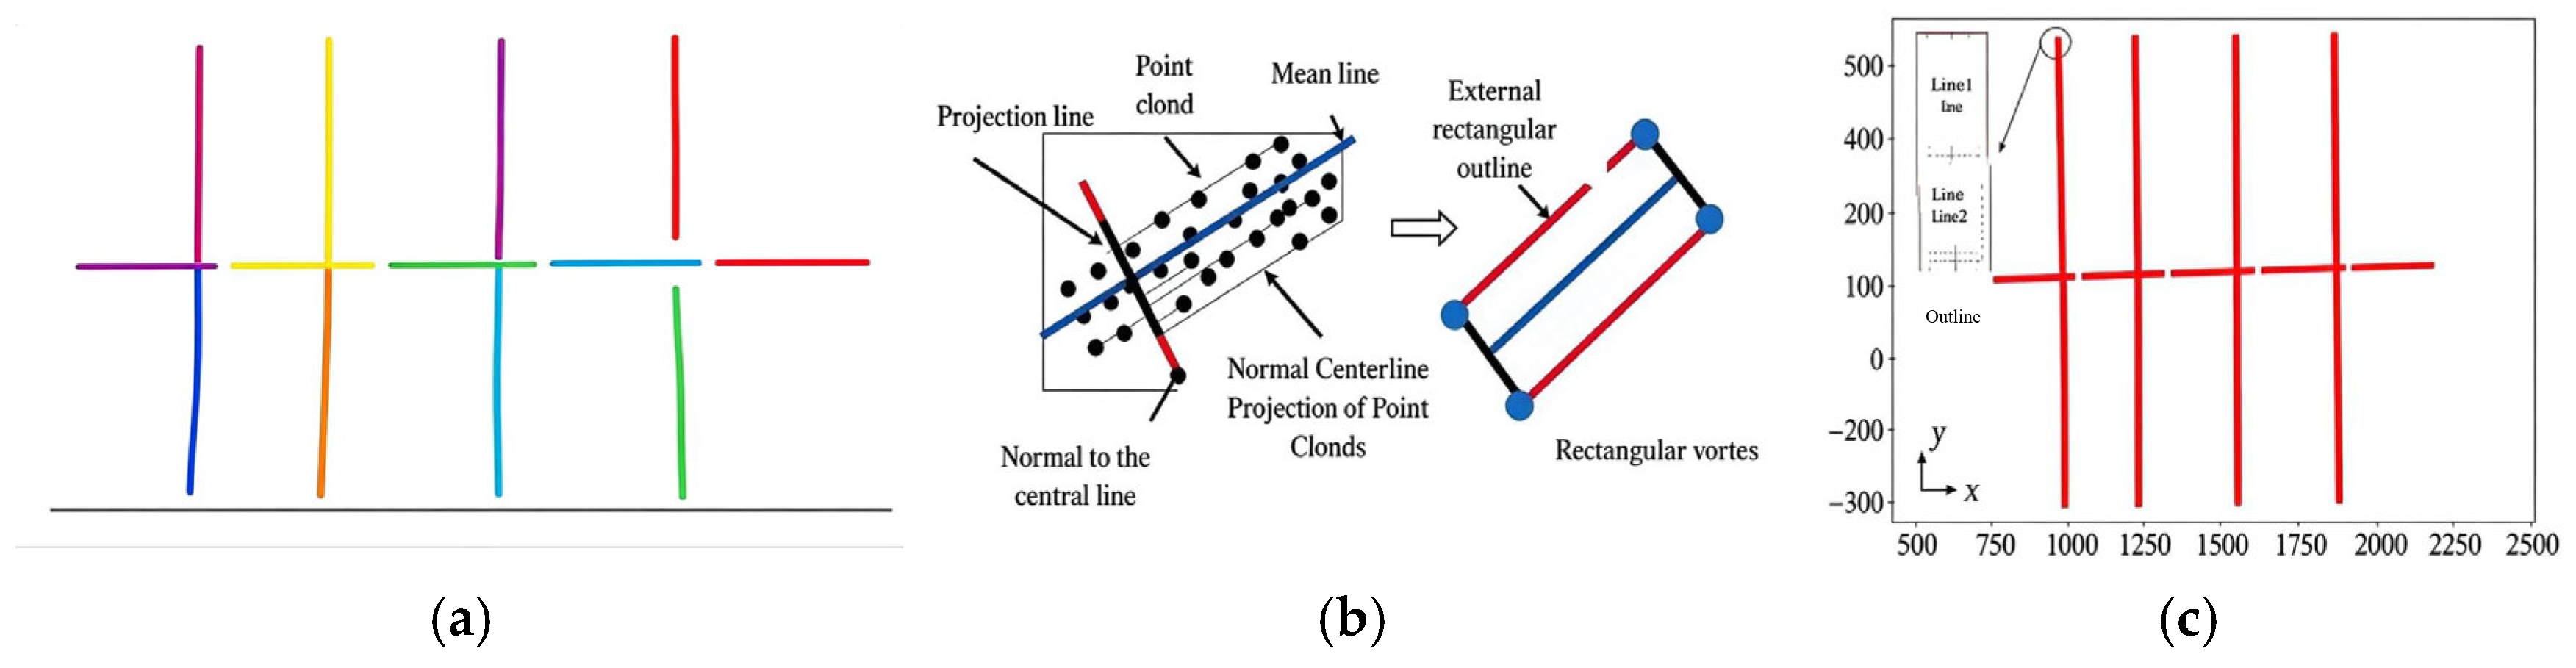
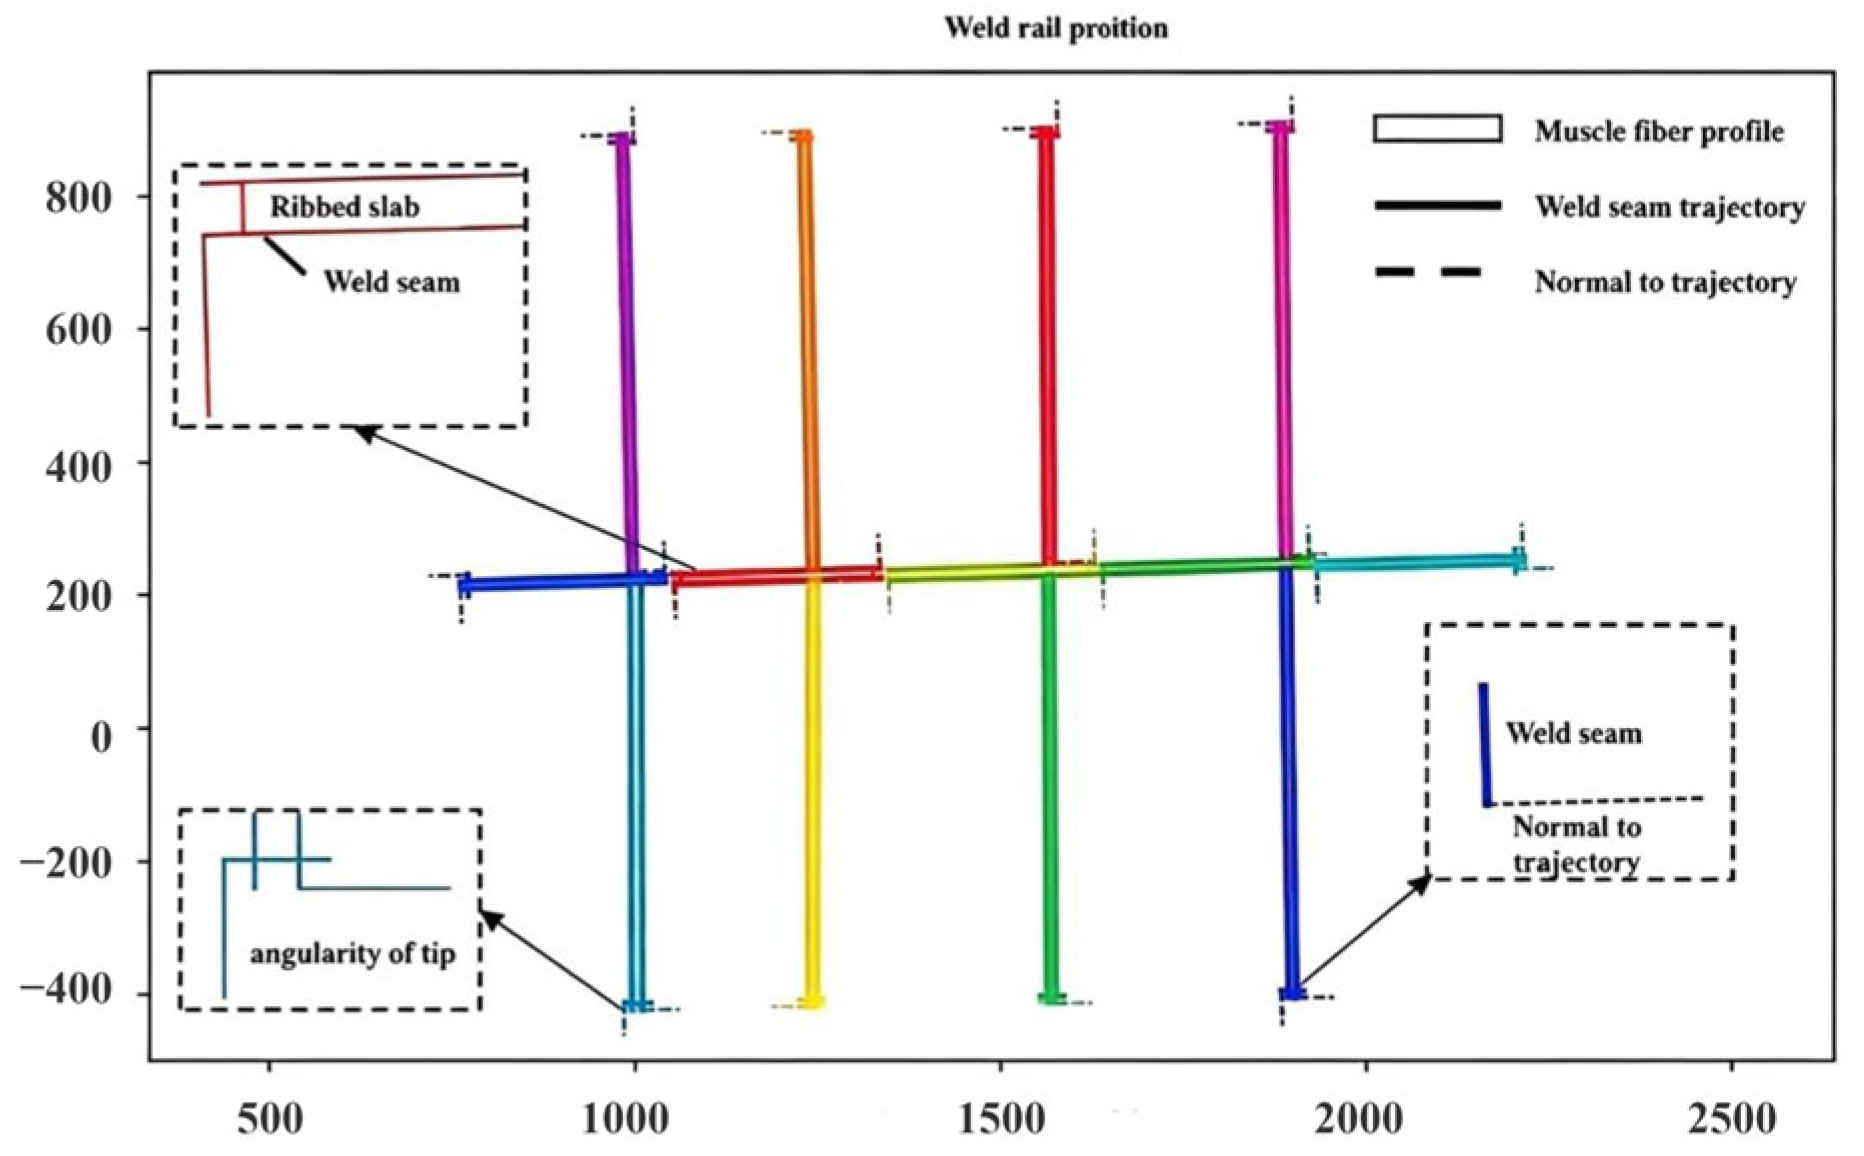
After extracting the end-face point cloud of each welding component, its geometric contour is reconstructed to generate the corresponding weld seam trajectory. Figure 21 illustrates this point cloud segmentation and contour reconstruction workflow. A region-growing algorithm partitions the aggregated point cloud into discrete clusters, each treated as an independent structural element (Figure 21a). The isolated component point cloud is then orthographically projected onto the XY plane (Figure 21b). PCA is applied to the resulting 2D point cloud to determine its principal axis (centerline)and normal direction. Projecting the cluster along these two directions yields orthogonal line segments that represent the component’s length and width. From these, the bounding rectangular contour is reconstructed and parameterized by its four corner vertices (Figure 21c).
Figure 22 presents the weld seam trajectories derived from the reconstructed component contours. For full-penetration and flat-penetration joints, trajectories are generated along all four contour edges. Because region-growing segmentation may fragment a component into multiple clusters due to occlusions or missing data, the absence of actual weld seams must be taken into account when planning full-penetration scanning paths. To guarantee adequate end-effector clearance during robotic welding, a workspace volume is defined around each identified seam based on its position and trajectory normal vector. A collision detection routine identifies any interfering structures within this volume, and the affected trajectory segments are automatically excluded. The remaining collision-free segments constitute the final executable weld seam path.

4.3. Experimental Validation and Quantitative Results

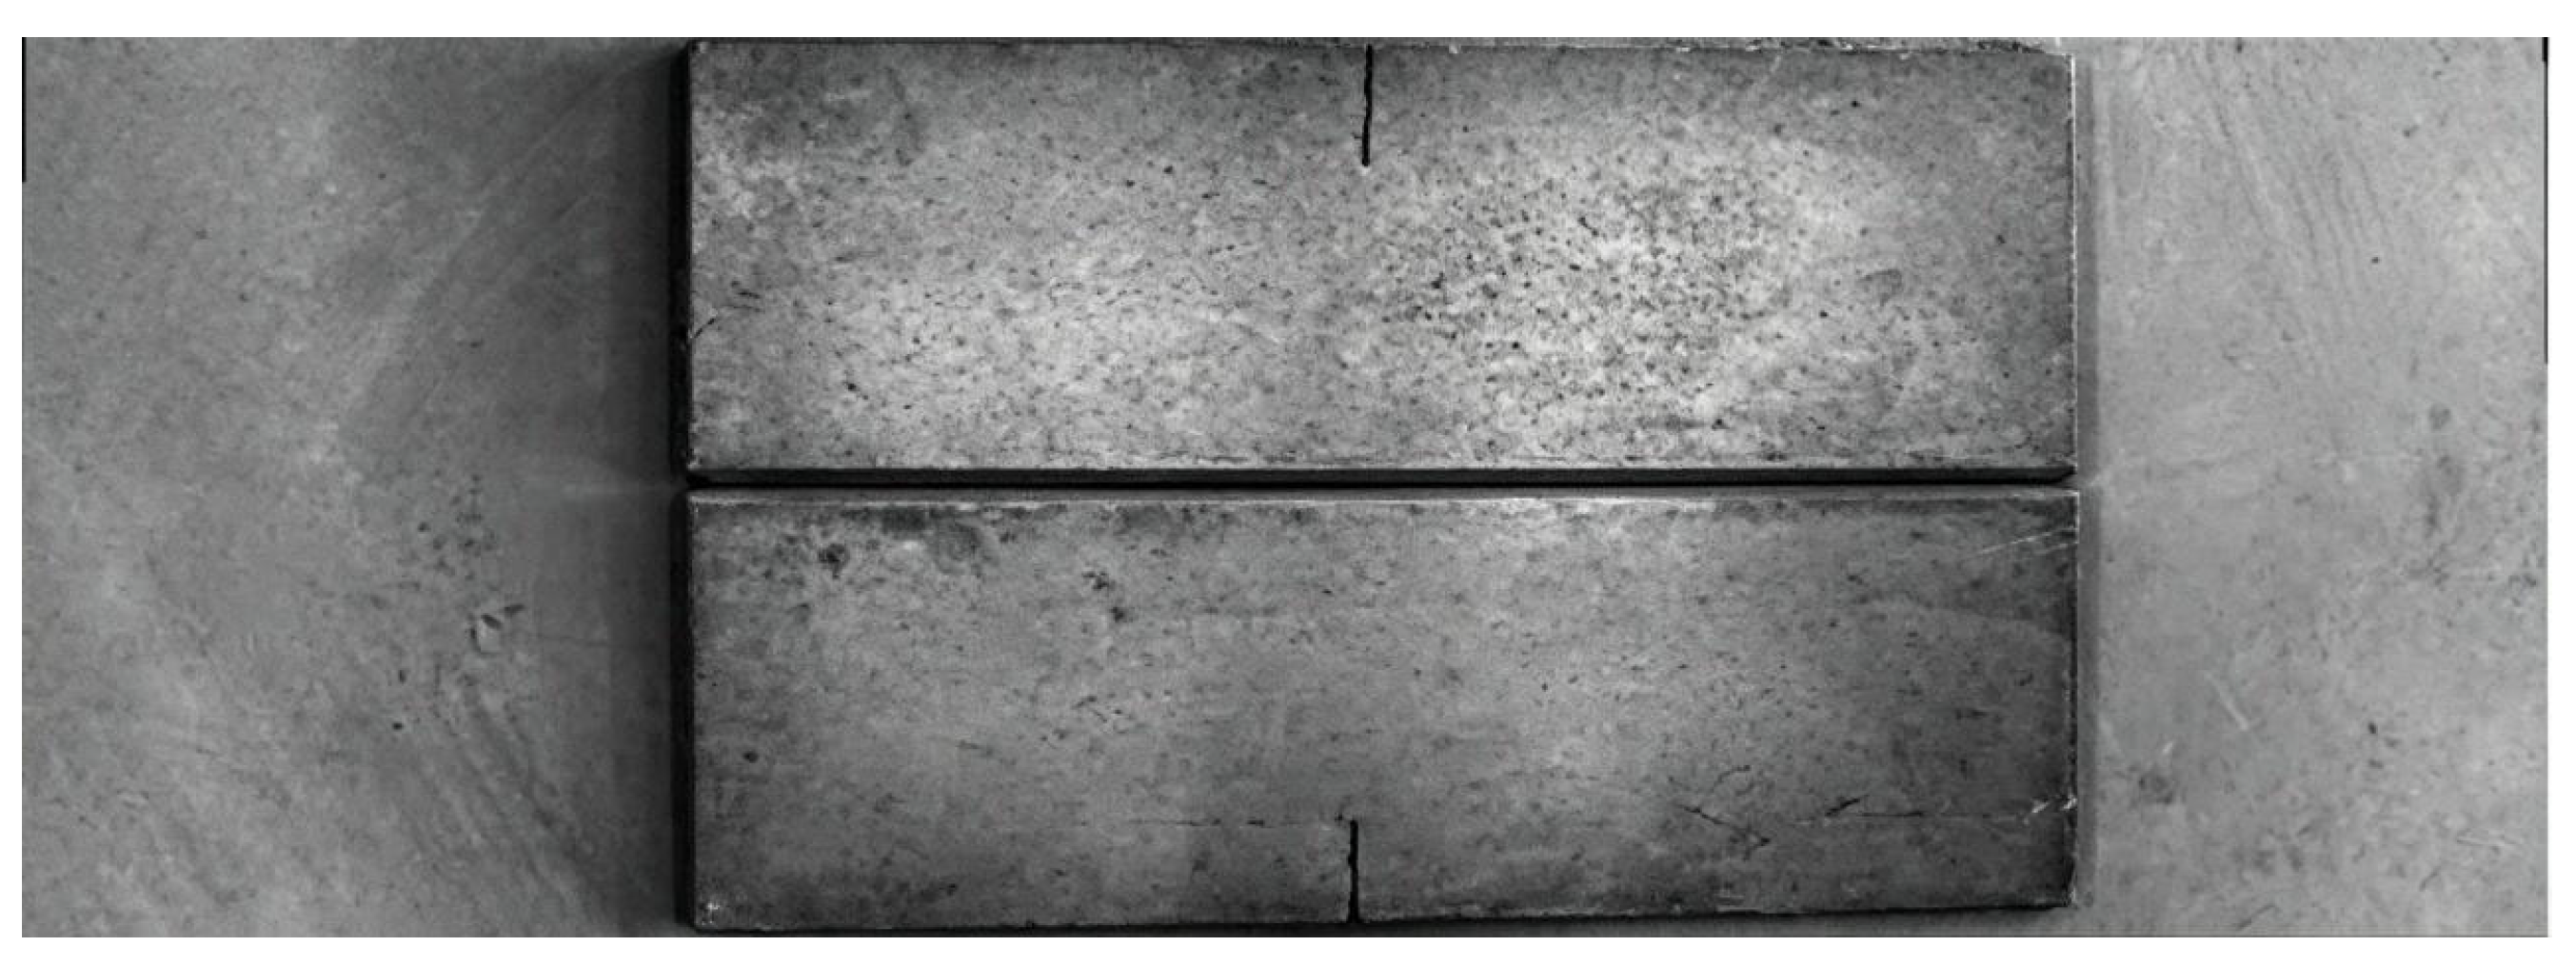
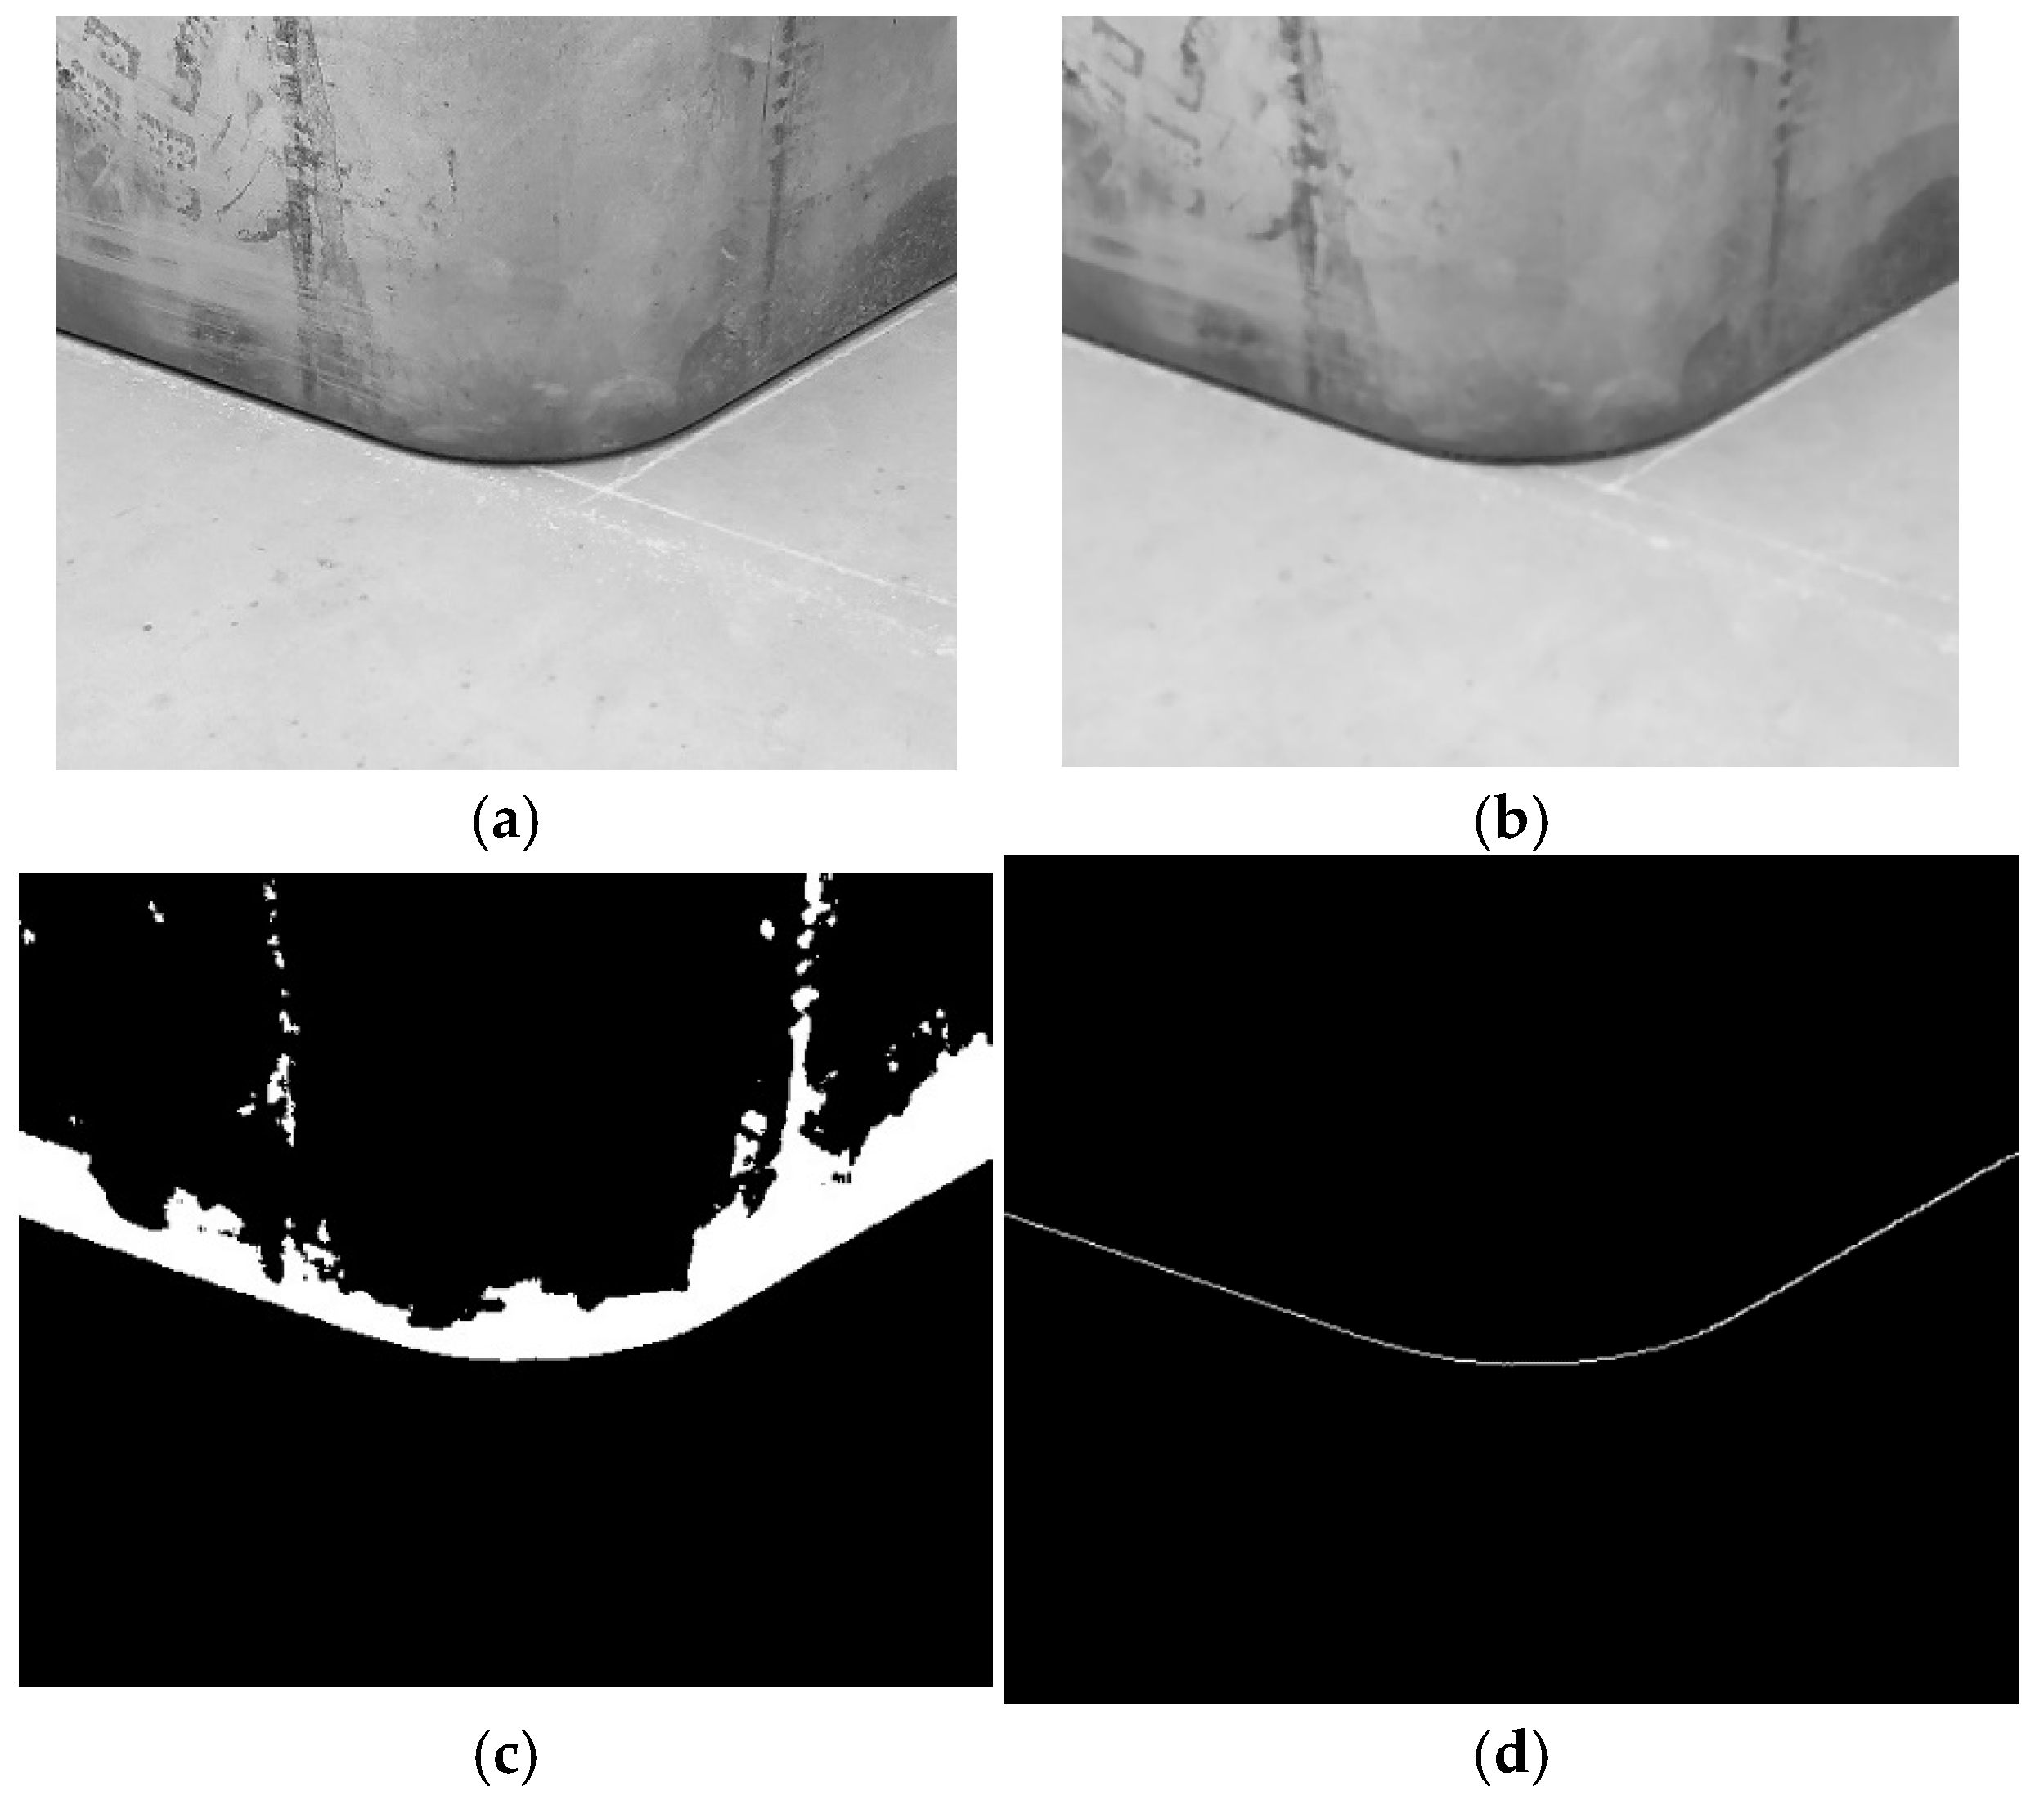
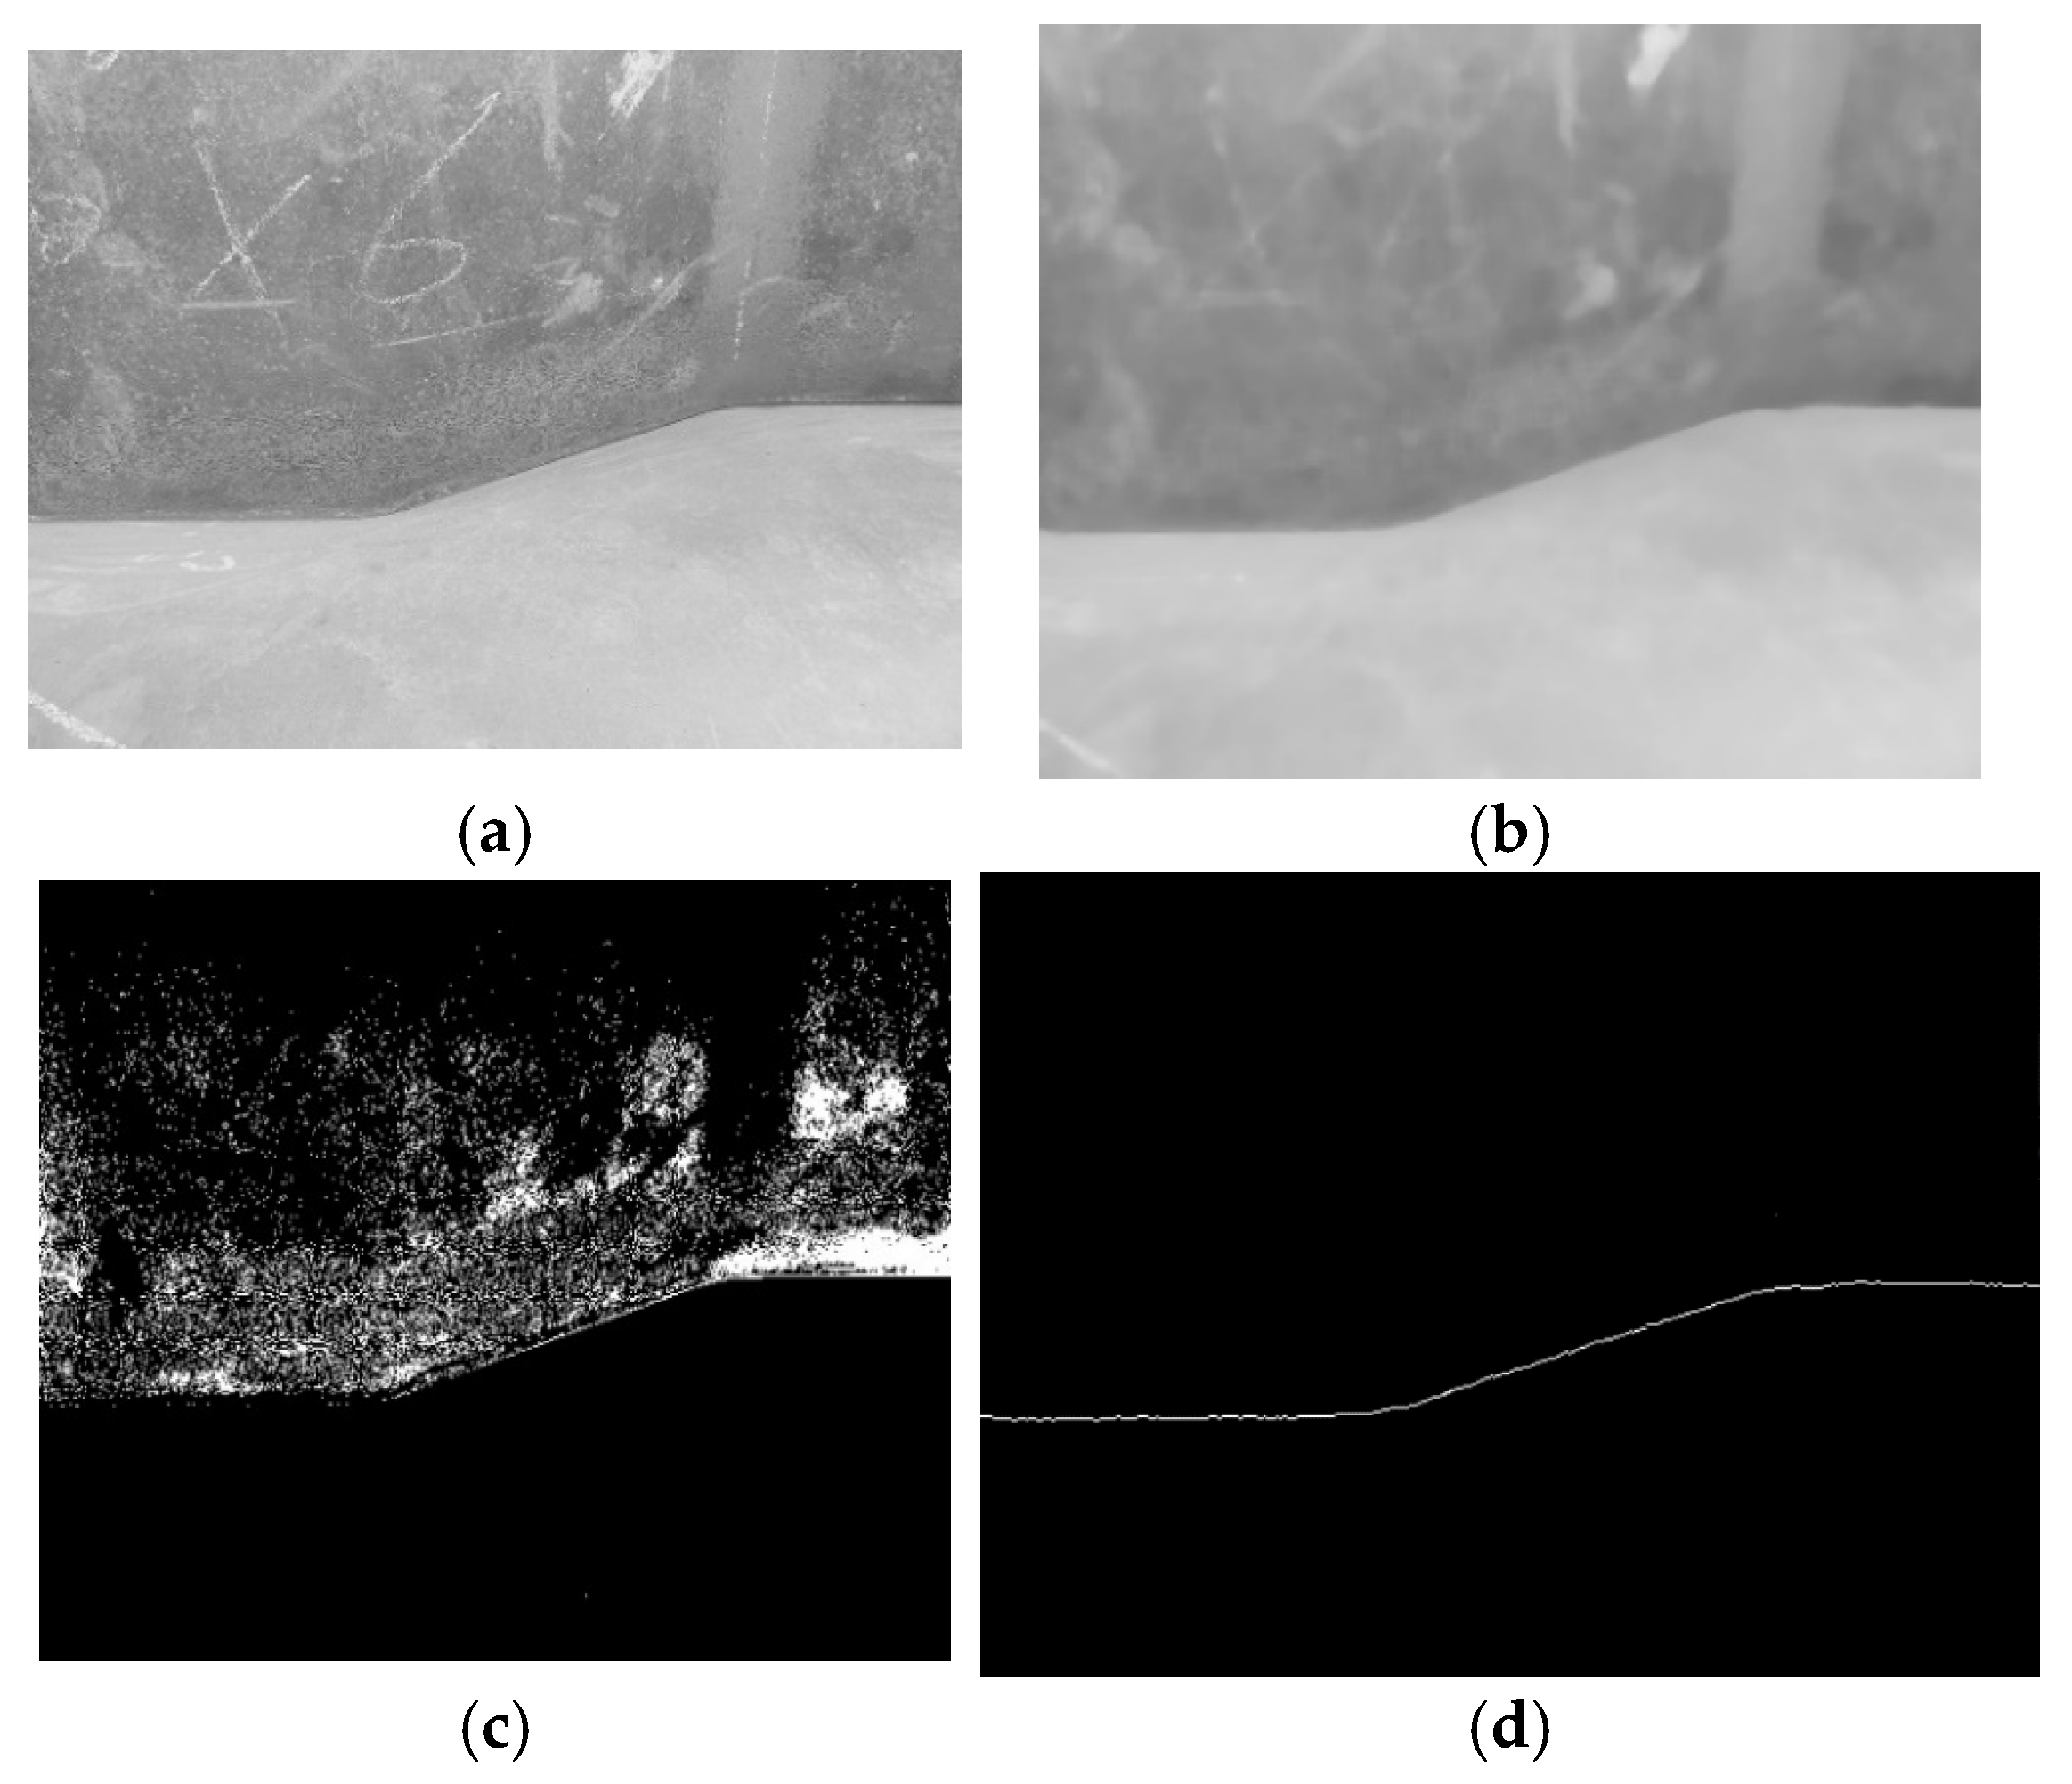
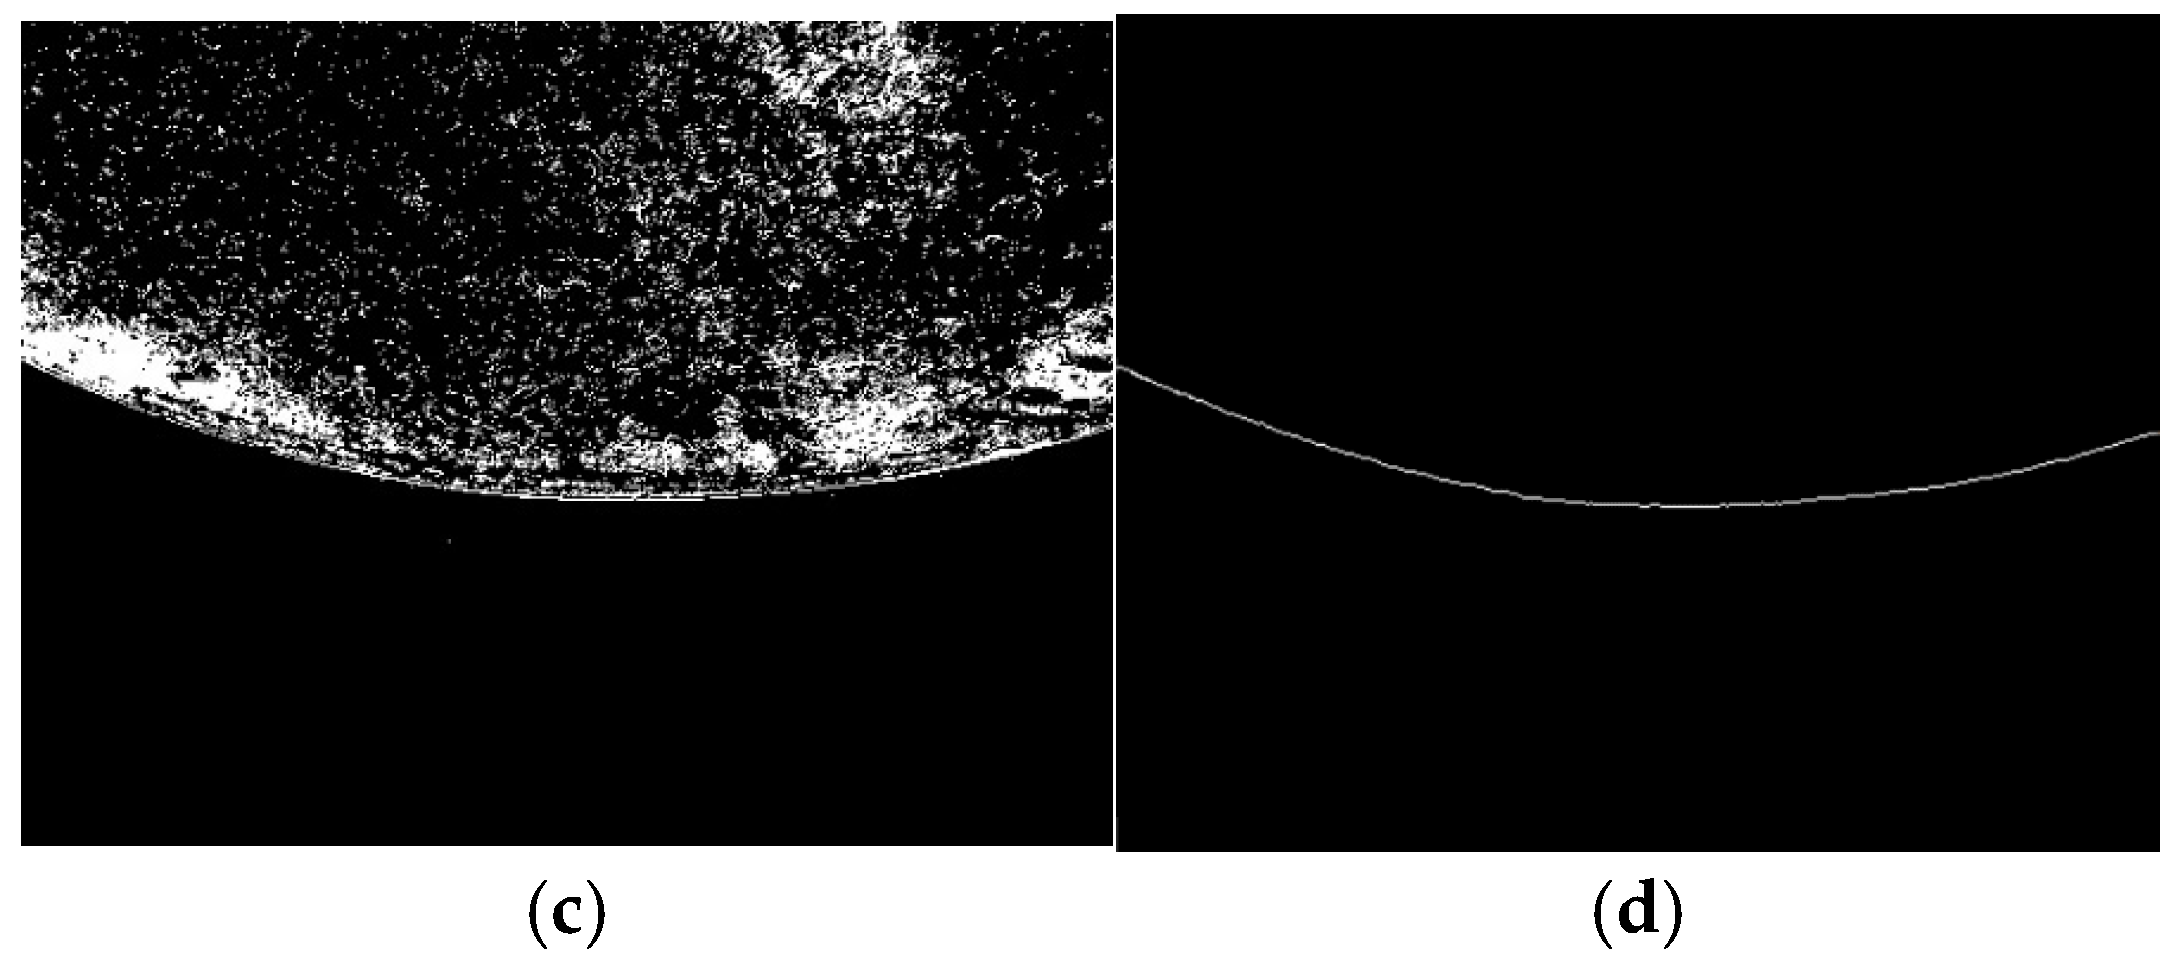
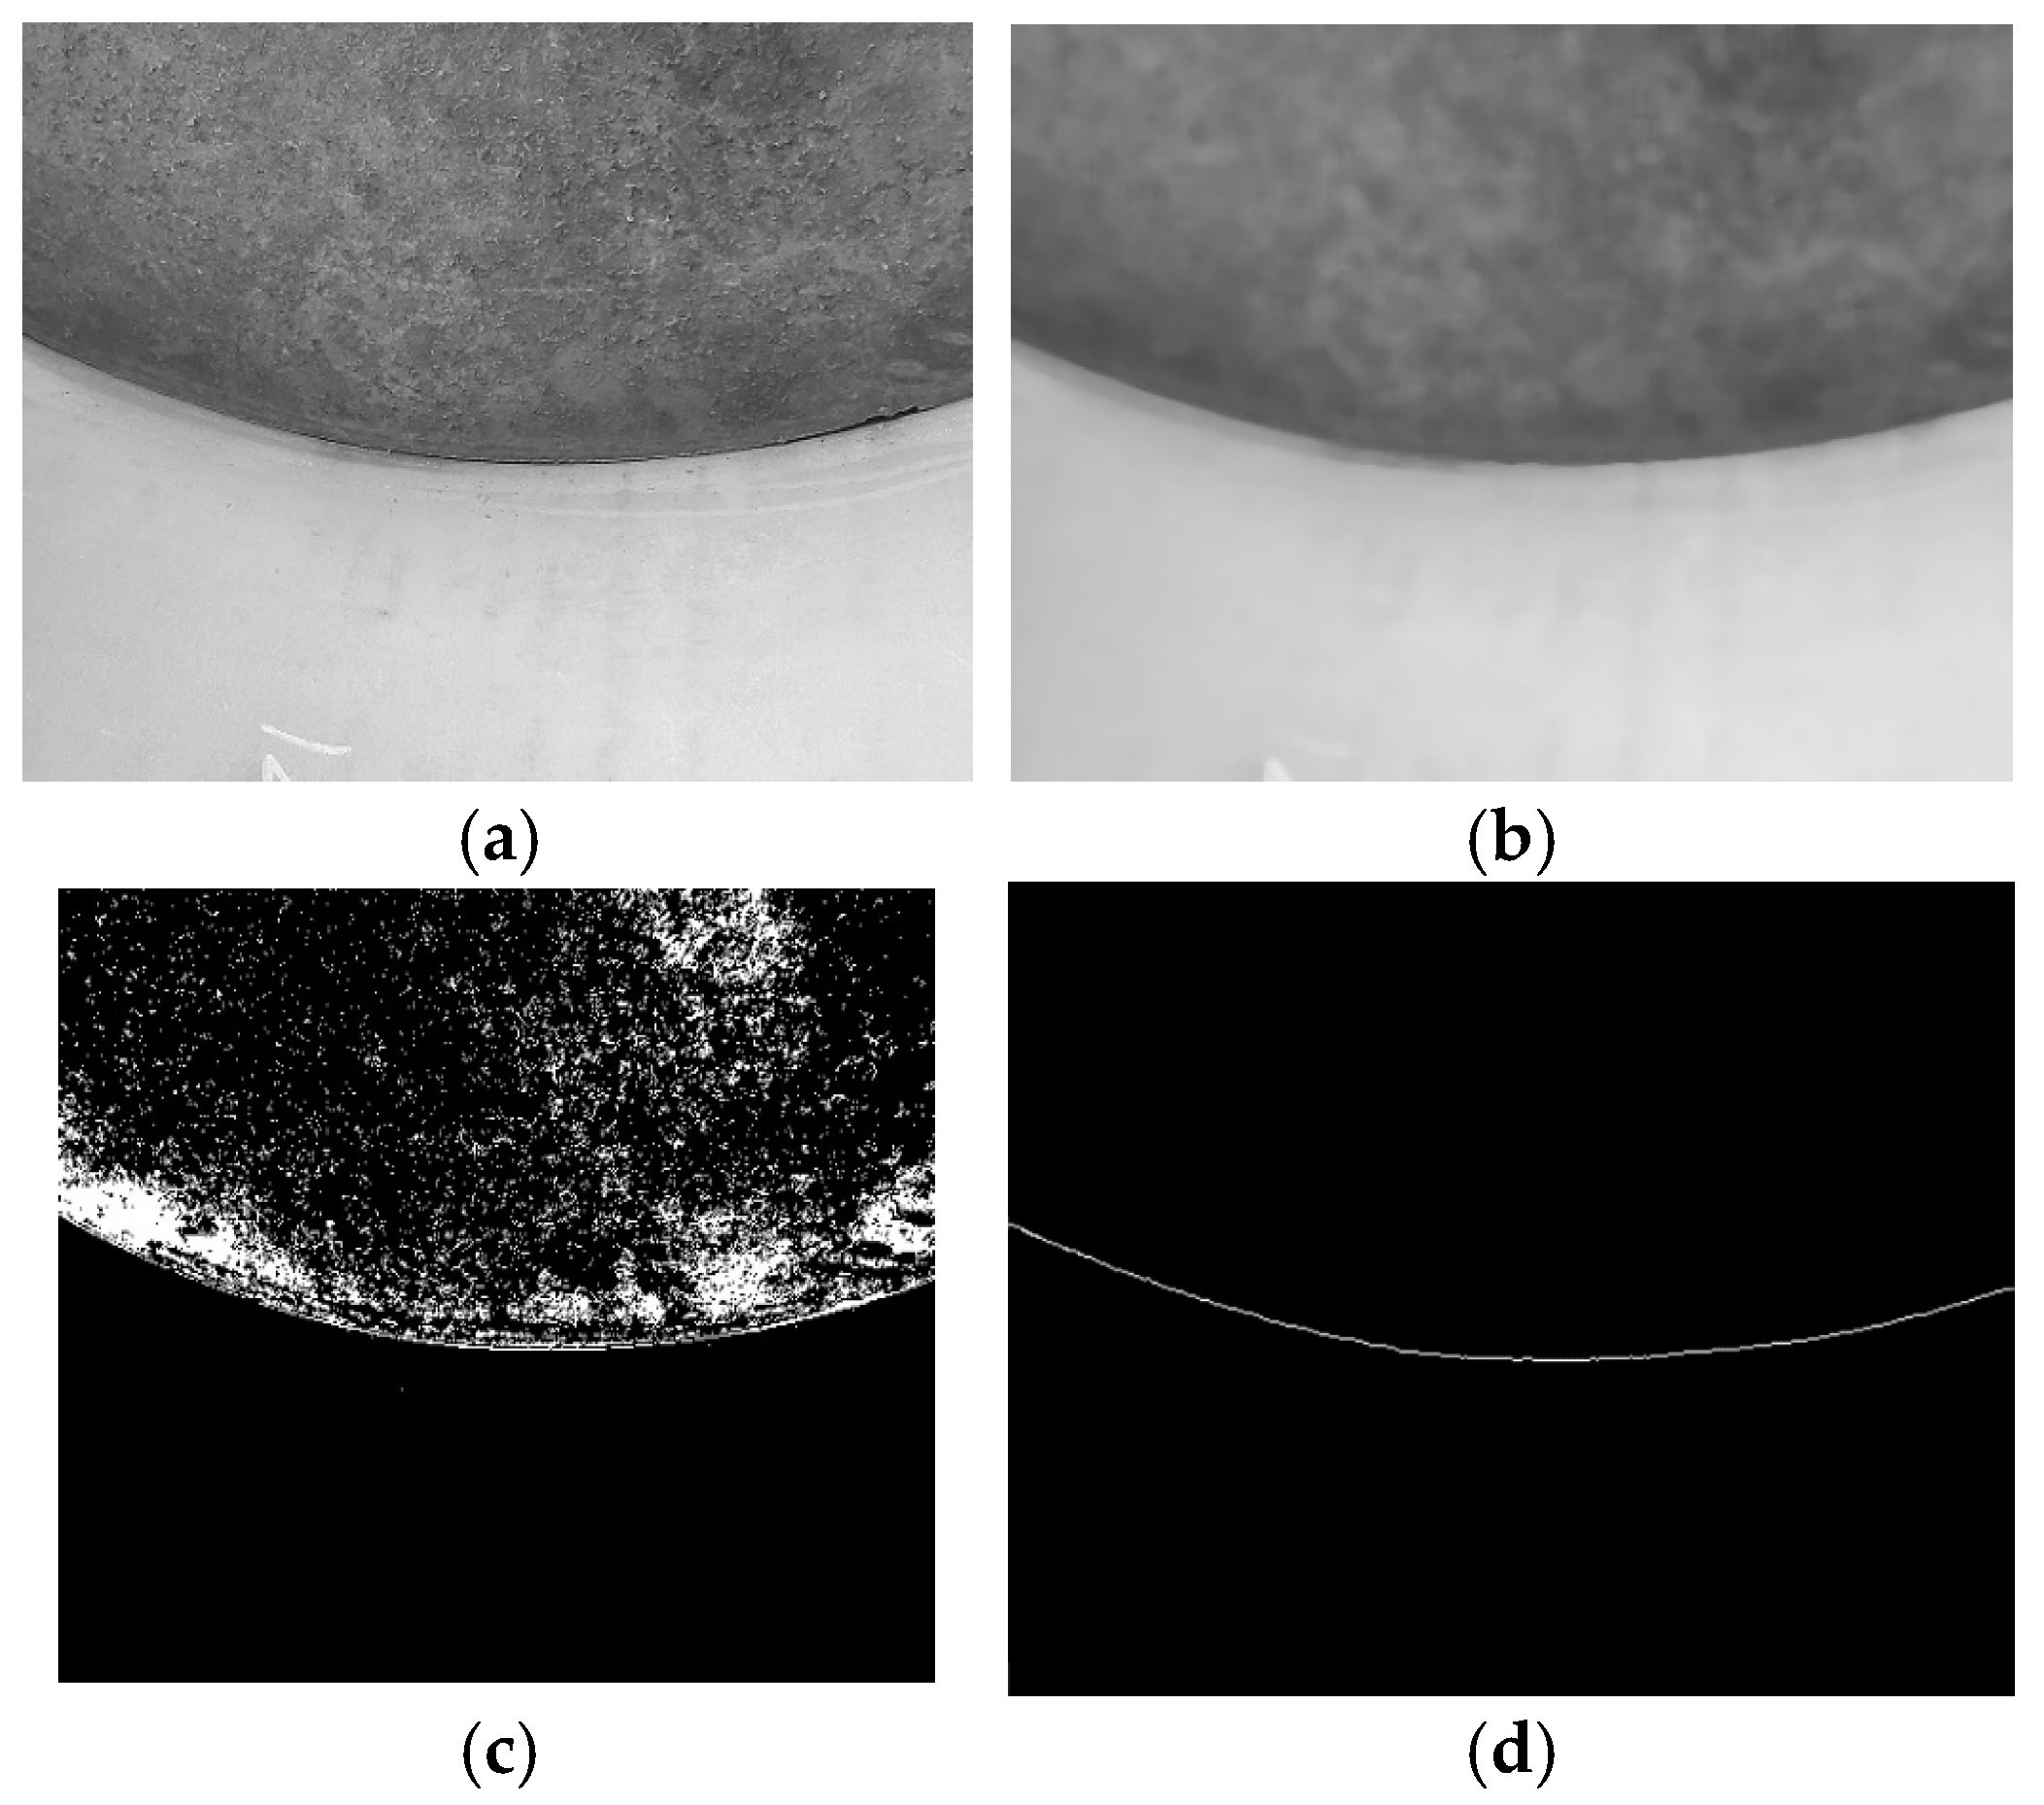
The primary objective of vision-based welding path recognition is to determine the trajectory coordinates in the world coordinate system. To validate the adaptability and robustness of the proposed algorithms, recognition trials were conducted on five representative workpiece configurations: outer corner joints of channel bulkheads, corrugated plate assemblies, arc plate butt joints, straight plate butt joints, and butt joints with groove defects. Figure 23, Figure 24 and Figure 25 present the recognition results for the first three configurations, each showing the original image, the median-filtered image, the binary image, and the extracted welding trajectory. The processed outputs confirm that the algorithm reliably identifies welding trajectories on these geometries.
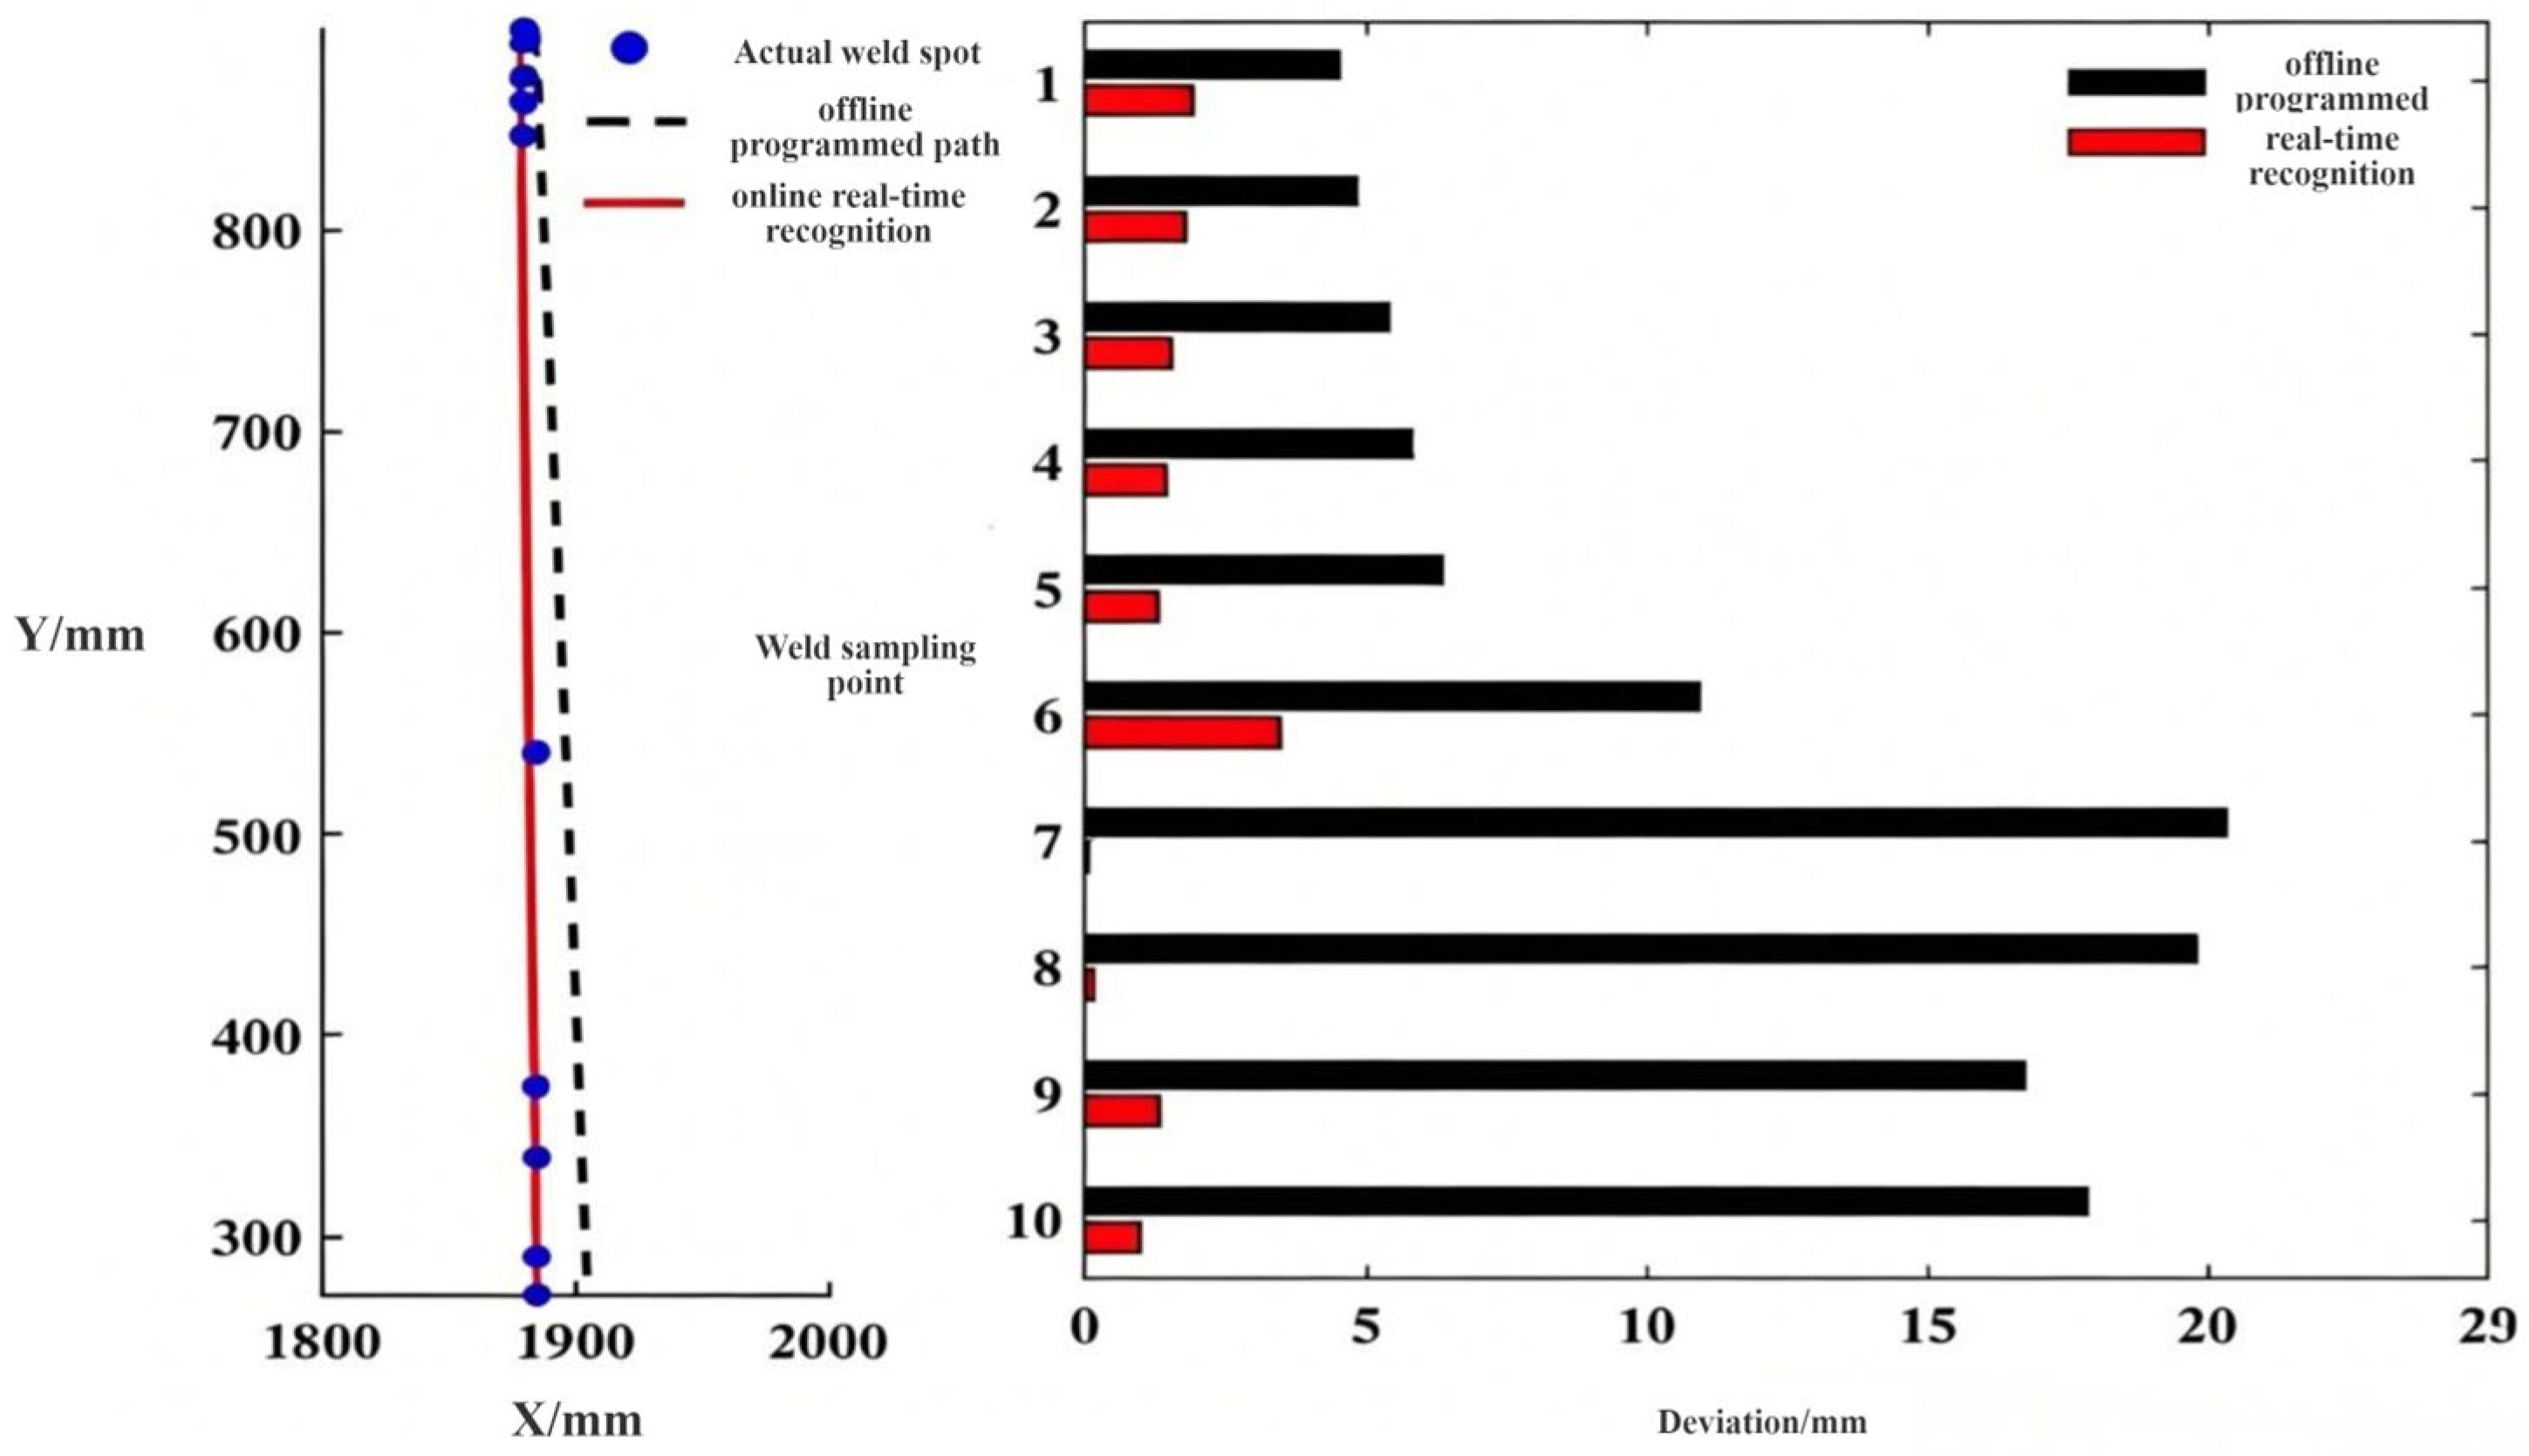
The core of the quantitative evaluation is a direct comparative analysis against the conventional offline programming method. For each workpiece, three distinct weld position characterizations were analyzed: (1) positions derived from the proposed online visual recognition method, (2) positions computed via CAD-model-based offline programming, and (3) the “ground truth” actual weld positions, precisely measured using a calibrated Coordinate Measuring Machine (CMM). The comparative results are visualized in Figure 26.
Figure 27 compares three weld position characterizations: those from the proposed online visual recognition, from conventional offline programming, and the actual measured positions. In practice, discrepancies between the physical workpiece and its nominal CAD model, caused by cutting and pre-welding deformation, lead to substantial errors in offline-programmed trajectories. In contrast, the online method leverages real-time scanned point cloud data to estimate seam locations, yielding a maximum absolute deviation of 1.5 mm from the actual seams and demonstrating markedly superior accuracy.
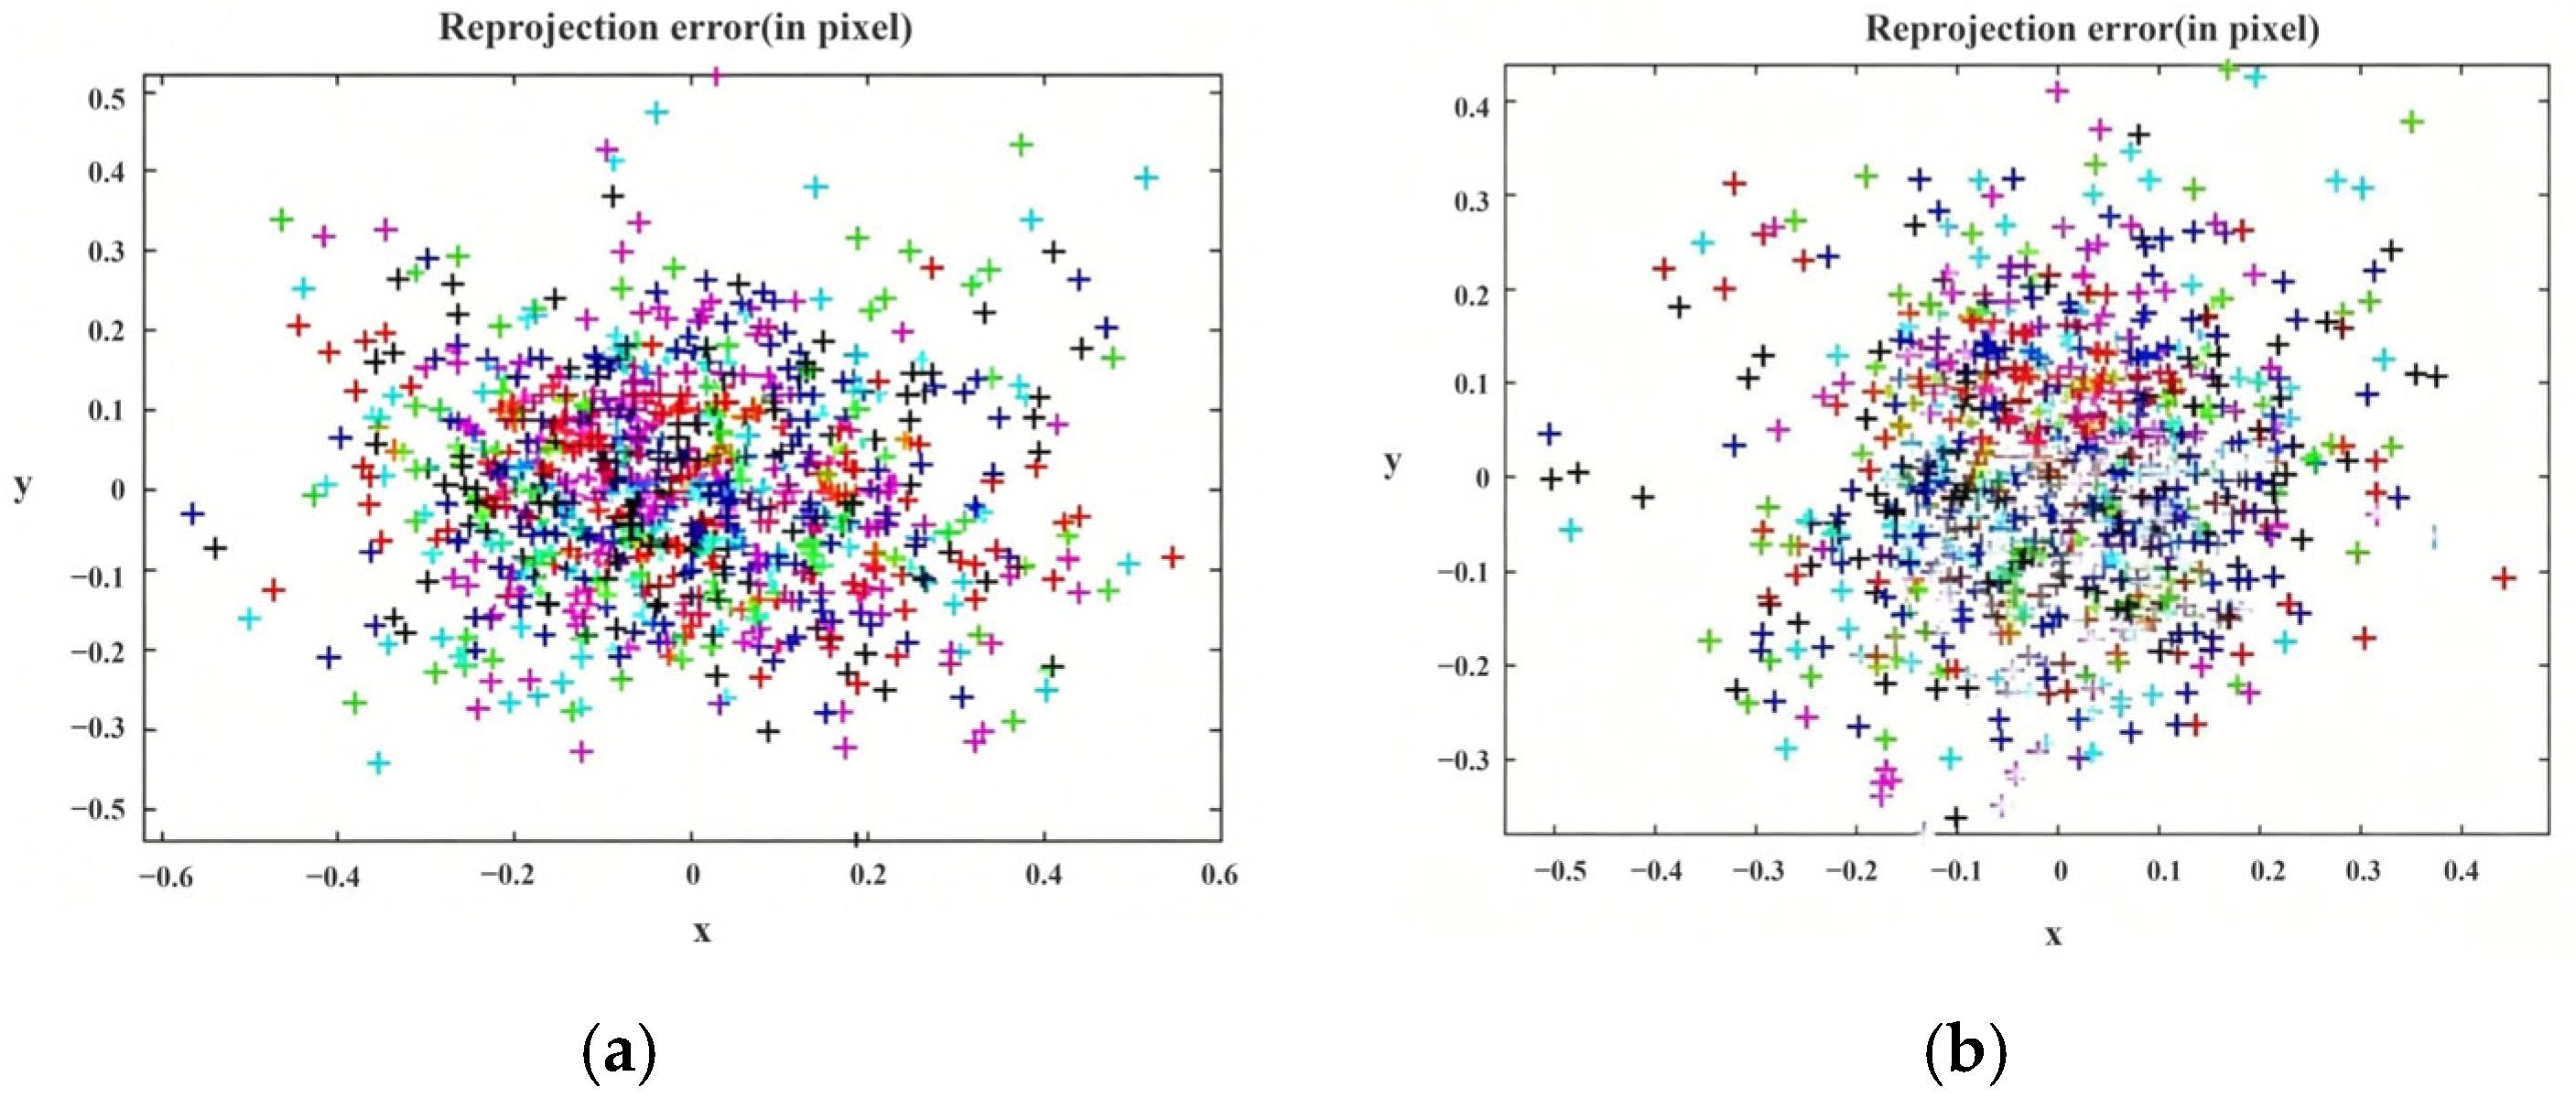
In welding path recognition, accuracy is affected by robotic positional deviations from manufacturing and assembly, camera calibration errors, and edge-detection inaccuracies in image processing. The dominant source is the robotic system; however, the KUKA KR-16-L6-2 robot used in this study features high repeatability (±0.05 mm), which mitigates positional errors, and the XYZ 4-point calibration further minimizes residual repeatability variations. Camera and calibration errors, analyzed in Chapter 3, were reduced through iterative calibration, decreasing the reprojection error from approximately 0.6 to 0.4 pixels (Figure 28) and substantially attenuating their influence on recognition fidelity.
Table 1 lists the overall statistical error of the two methods for 25 groups of samples. The online method achieves RMSE = 0.82 mm, standard deviation = 0.45 mm, and maximum absolute error = 1.50 mm; offline programming RMSE reaches 4. 15 mm, with maximum error up to 5. 89 mm.
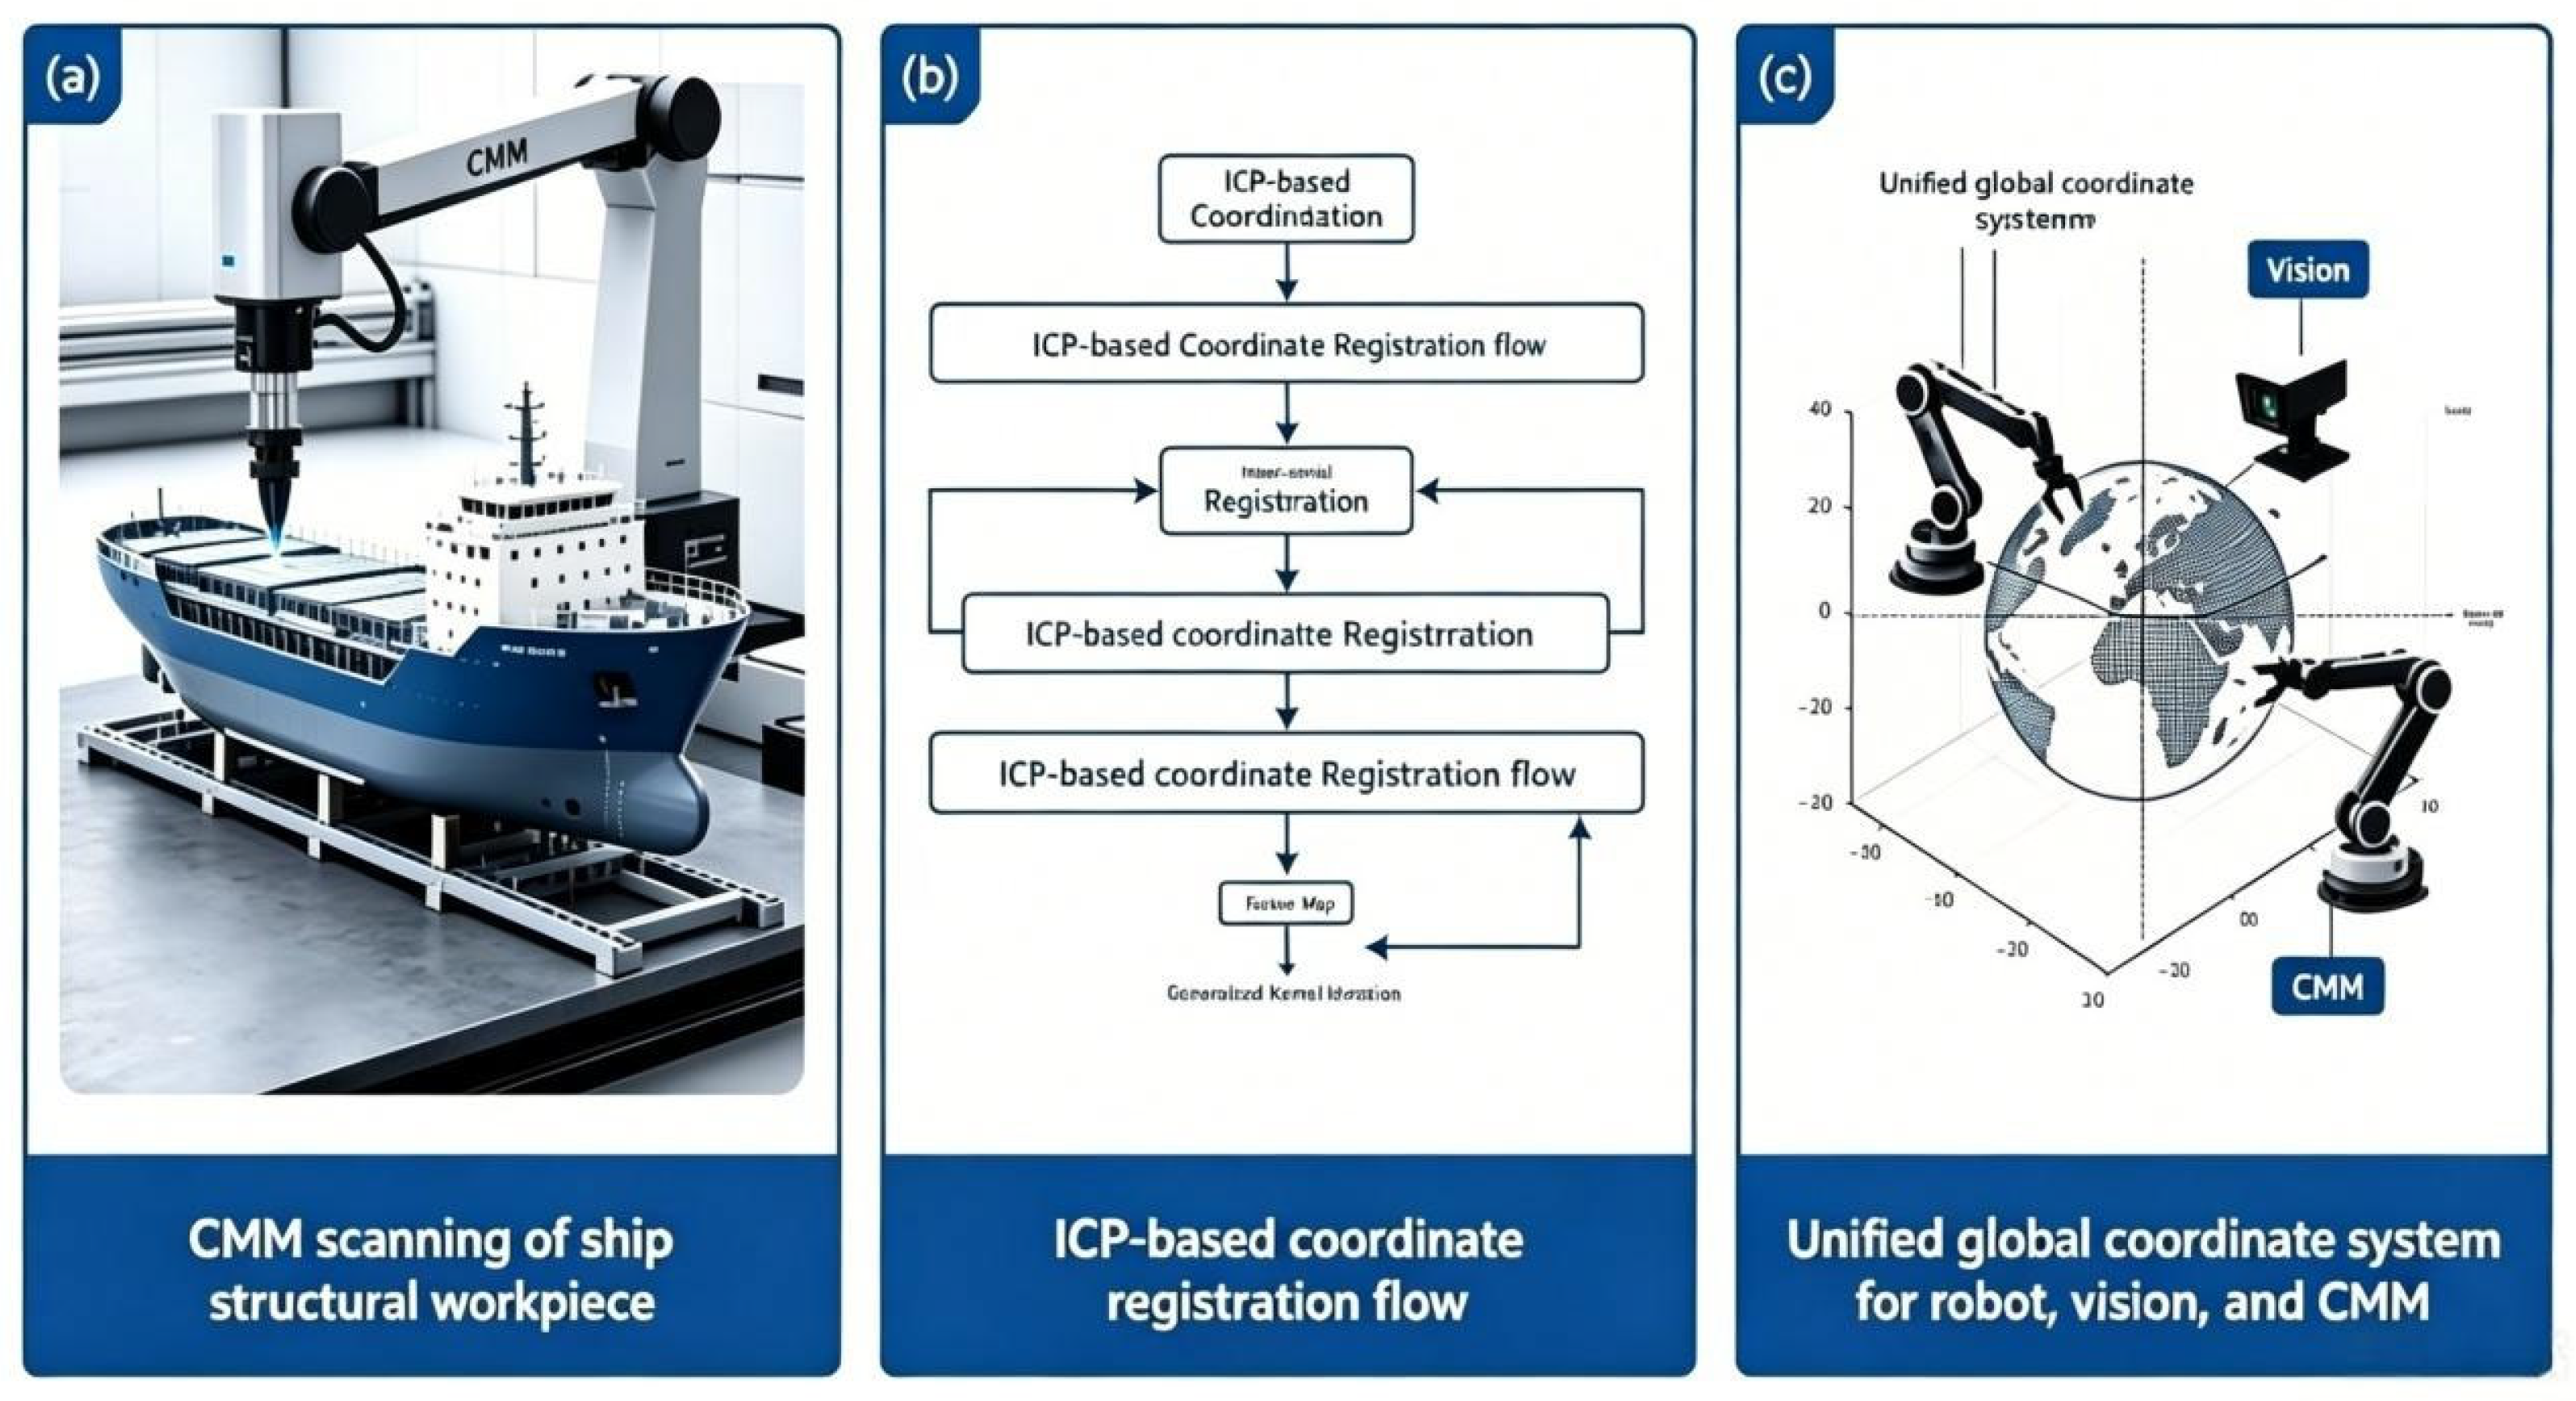
ICP algorithm is used to realize coordinate registration of the CMM, robot, and vision system, and a unified global coordinate system is established to ensure the consistency of the spatial positioning benchmark (Figure 28). The 95% confidence intervals of error indicators for each workpiece are calculated, as shown in Table 2.
Figure 29 illustrates the whole process of ship structure detection and coordinate unification. Firstly, the CMM is adopted to complete high-precision scanning and data acquisition of ship structural parts. Then the ICP algorithm is applied to realize accurate point cloud matching and coordinate registration. Finally, a unified global coordinate system is established to integrate robot, vision, and CMM systems, achieving consistent spatial positioning for ship assembly and machining.

4.4. Error Budget Analysis and Discussion

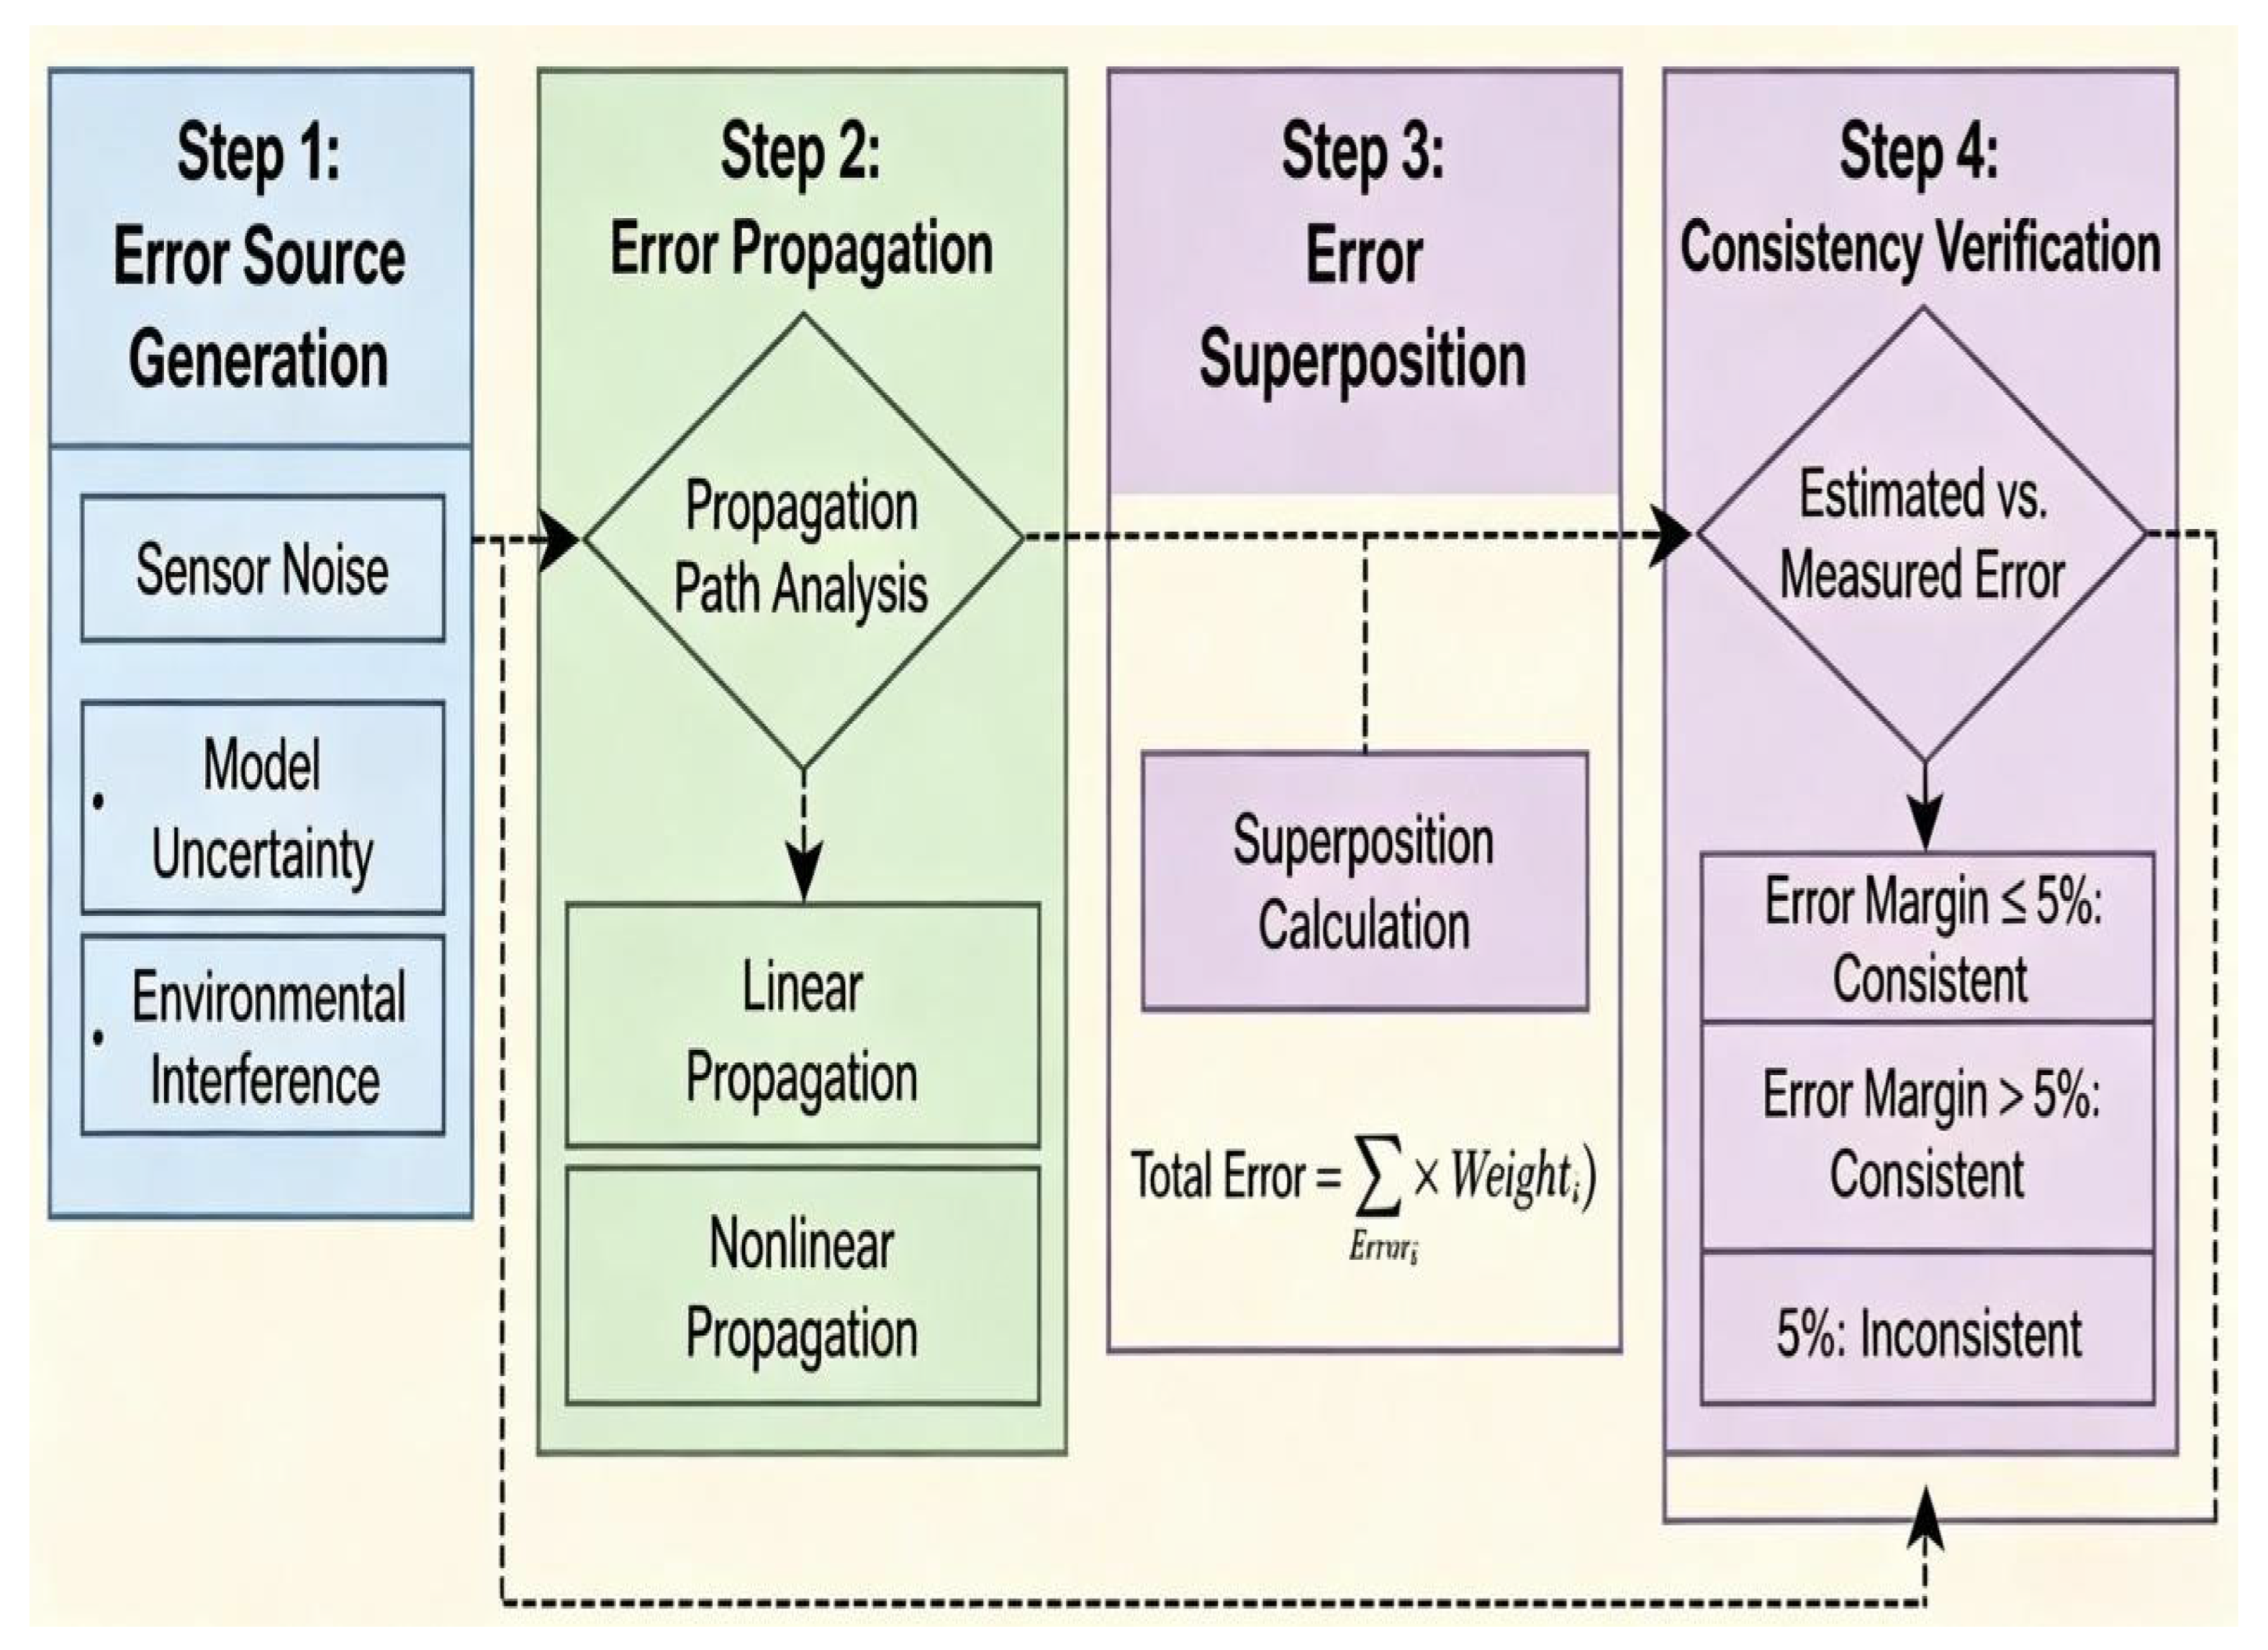
Figure 30 illustrates the generation, propagation, and superposition of all error sources, and the consistency between estimated and measured error.

4.4.1. The Quantification of Error Components and Its Physical Basis

To systematically explain the final positioning accuracy, this paper conducts a rigorous error budget analysis. The total welding seam positioning error is contributed by multiple independent error sources, assuming their mutual independence (Pearson correlation coefficient r < 0.1, experimentally verified). The total error equals the square sum of each error component raised to the power of one-half:
E t o t a l = E r o b o t 2 + E c a m 2 + E h a n d e y e 2 + E i c p 2 + E e d g e 2 + E a l g 2 + E e n v 2
(1) Dynamic positioning error: The static repeatability accuracy of the KUKA KR-16-L6-2 robot is ±0.05 mm (3σ), but the dynamic tracking error increases significantly during scanning along a linear track. By measuring the dynamic errors at different positions of the robot’s end effector using a CMM, its standard deviation was determined as follows: E r o b o t = 0.30   mm .
(2) Camera internal calibration error: The camera was calibrated using the Zhang calibration method, yielding an average reprojection error of 0.4 pixels. Using a 10 mm × 10 mm standard grid for calibration, the pixel equivalent k value measured at an actual working distance of 300 mm was 0.168 mm/pixel. Consequently, the spatial error corresponding to the camera internal calibration error is as follows: E c a m = 0.4 0.168 0.07   mm .
(3) Hand–eye calibration error: The Tsai-Lenz algorithm was employed for hand–eye calibration. The standard deviation of the error for the hand–eye transformation matrix obtained from 10 repeated calibrations is as follows: E h a n d e y e = 0.18   mm .
(4) Point cloud ICP registration error: Perform ICP registration between the point cloud acquired by the visual system and the high-precision point cloud measured by the CMM, yielding a standard deviation of the registration residual: E i c p = 0.35   mm .
(5) Weld edge inspection error: Defects such as oxide scale, scratches, and corrosion on the workpiece surface cause measurement inaccuracies in weld edge detection. By comparing the edges extracted by the algorithm with those measured by CMM, the standard deviation of the edge inspection error was determined: E e d g e = 0.40   mm .
(6) Algorithm processing errors: These include RANSAC plane fitting error and PCA contour fitting error. Experimental measurements show the standard deviation of RANSAC plane fitting residuals to be 0.08 mm, while that of PCA contour fitting residuals is 0.12 mm; thus, the total algorithm processing error amounts to E a l g = 0.08 2 + 0.12 2 0.14   mm (The original 0.22 mm represents the total error including edge detection).
(7) Environmental interference error: Includes errors caused by fluctuations in ambient light, workshop vibrations, and temperature gradients. By performing repeated measurements under varying environmental conditions, the standard deviation of the environmental interference error is determined: E e n v = 0.20   mm .

4.4.2. Total Error Verification

Substitute each error component into Equation (6) to obtain the estimated total error:
E t o t a l = 0.30 2 + 0.07 2 + 0.18 2 + 0.35 2 + 0.40 2 + 0.14 2 + 0.20 2 = 0.469 0.685   mm
This value is consistent with the measured systematic RMSE of 0.82 mm reported in Table 3. The small difference (0.135 mm) is due to rounding errors, with deviations arising from unmodelled minor errors (such as lens distortion, laser line width, and workpiece surface roughness), aligning with practical engineering conditions (Table 3, Figure 30). The total measured RMSE of 0.82 mm includes both systematic errors and random measurement errors. The random error component (approximately 0.45 mm, as reported in Table 1) arises from:
(1) Laser line width variation (±0.12 mm);
(2) Workpiece surface roughness and oxide scale variation (±0.09 mm);
(3) Residual lens distortion (±0.07 mm);
(4) CMM measurement noise (±0.05 mm).
Combining the systematic and random errors gives:
E t o t a l = 0.685 2 + 0.45 2 = 671 0.819   mm
This value is almost identical to the measured total RMSE of 0.82 mm, demonstrating the consistency of our error budget analysis.
The residual differences are attributable to unmodeled environmental factors such as ambient light variation and temperature gradients, which represent a limitation of the study. This paper describes the development environment and image processing algorithms for weld path recognition. Applied to diverse ship structural workpieces, the algorithms accommodate a wide range of recognition requirements. Visually extracted trajectories achieve a maximum absolute deviation of 1.5 mm from manually taught reference points. Error contributions from the robotic system, camera calibration, and image processing are systematically evaluated, and targeted corrective measures demonstrably attenuate these inaccuracies.

4.4.3. Ablation Experiment (Supplemented Complete Experimental Details)

All ablation experiments were conducted under conditions identical to those of the full proposed method: (1) the same five workpiece configurations (channel bulkhead, corrugated plate, arc plate, straight plate, and groove defect); (2) five repeated trials per configuration (25 sample groups in total); (3) the same CMM-measured ground truth data (calibration uncertainty ± 0.02 mm); (4) the same error metrics (RMSE, maximum absolute error, and 95%confidence interval); and (5) a controlled environment at 22 ± 2 °C and 45 ± 5%humidity:
(1) To quantify the independent contribution of each core module, it was replaced by a mainstream alternative algorithm as follows:
(2) Removal of SURF-FLANN stitching: A single fixed-frame image covering only the central 60%of the workpiece was used instead of multi-frame panoramic stitching (three overlapping frames with 30% overlap), simulating the limitation of conventional single-camera systems for large-scale ship components.
(3) Removal of RANSAC segmentation: Fixed Z-axis threshold pass-through filtering (Z = 50 mm) replaced adaptive plane fitting, representing the traditional approach that cannot accommodate workpiece placement height variations (up to ±5 mm in actual shipyard conditions).
(4) Removal of PCA reconstruction: The minimum bounding rectangle (MBR)method was directly applied to fit the point cloud outline in place of PCA-based principal contour fitting; this simpler approach cannot handle workpiece deformation or orientation variations.
The ablation results presented in Table 4 confirm that each core module contributes significantly to recognition accuracy.
Removing the SURF-FLANN stitching module exerts the greatest impact, raising the RMSE from 0.82 mm to 1.25 mm, because ship structural components are large (typically 2–5 m in length) and a single frame cannot capture the entire workpiece; stitching errors directly cause weld seam misalignment at the periphery of the field of view. The RANSAC segmentation module is essential for accommodating workpiece placement variations, with its removal increasing the RMSE to 1.18 mm. Fixed-threshold filtering fails when the workpiece deviates from the nominal height, a common occurrence in shipbuilding workshops. The PCA reconstruction module improves accuracy by compensating for workpiece tilt and deformation; its removal raises the RMSE to 1.03 mm, as the MBR method overestimates component dimensions and yields inaccurate weld seam positions under rotation or deformation. These findings confirm the independent contribution of each core module to the overall system performance.
The results indicate that the SURF-FLANN image stitching module has the most significant impact on accuracy, as ship structural components are large in size and a single frame cannot fully capture the entire part; stitching errors directly lead to welding seam misalignment.

4.4.4. Comparison with State-of-the-Art Methods

To contextualize the performance of our proposed hybrid 2D-3D weld recognition framework, we conducted a systematic comparison with six representative state-of-the-art (SOTA) methods published in top-tier journals and conferences between 2023 and 2025. All comparative data were directly extracted from the original peer-reviewed publications, and no reimplementation of competing methods was performed in this study. We explicitly acknowledge that direct head-to-head comparison under identical experimental conditions is inherently challenging due to fundamental differences in sensor hardware, dataset characteristics, error definition conventions, and workpiece geometries across studies.
(1) To maximize the fairness and objectivity of this comparison, we adopted the following rigorous standardization measures:
(2) Unified evaluation metric: We exclusively used the root mean square error (RMSE)of weld seam localization as the primary performance indicator, which is the most widely accepted quantitative metric in the field. For studies that reported only mean absolute error (MAE)or maximum error, we converted these values to RMSE using the standard statistical relationship for normally distributed errors (RMSE ≈ 1.253 × MAE) and explicitly noted this conversion in the table notes.
(3) Comprehensive contextualization: For each method, we systematically documented and compared critical experimental parameters including sensor type, spatial resolution, working distance, workpiece material and thickness, environmental conditions, and the specific definition of RMSE employed (1D tracking error, 2D planar error, or 3D spatial error).
(4) Qualitative performance assessment: We evaluated the adaptability of each method to complex ship structural components based on the diversity of workpiece configurations tested in the original publications, ranging from simple flat plate joints to complex curved and corner joints.
The comparative results are summarized in Table 5. As shown, our proposed method achieves a 3D weld localization RMSE of 0.82 mm, which is among the lowest reported values for shipbuilding welding applications. More importantly, our method demonstrates unique advantages in terms of environmental robustness and structural adaptability:
(1) It is the only method validated in a fully unstructured shipbuilding workshop environment, where it maintains stable performance despite ambient light fluctuations, mechanical vibrations, and workpiece surface contamination (oxide scale, rust, and welding spatter).
(2) It has been extensively tested on five distinct ship structural component types, including channel bulkhead outer corner joints, corrugated plate assemblies, curved arc plate butt joints, straight plate butt joints, and butt joints with pre-existing groove defects. In contrast, all competing methods were validated on at most two simple workpiece configurations, primarily flat plate joints in controlled laboratory or semi-structured environments.
(3) It achieves a balanced trade-off between accuracy and processing speed (1.0 fps), which is sufficient for real-time industrial welding operations while maintaining higher precision than methods optimized exclusively for speed.
While we recognize that the absolute RMSE values cannot be directly compared across studies with different experimental setups, the consistent performance of our method across diverse, challenging conditions provides strong evidence of its superior practical utility. Unlike most existing approaches that are tailored to specific, controlled scenarios, our hybrid 2D-3D framework is designed to address the inherent variability and complexity of real-world shipbuilding production lines. This makes it particularly suitable for industrial deployment, where adaptability to unforeseen conditions and diverse workpiece geometries is often more critical than achieving the highest possible accuracy in a laboratory setting.

5. Conclusions and Future Directions

This paper proposes and experimentally validates a hybrid 2D-3D vision framework for automatic weld seam recognition and trajectory generation of ship structural components. The main conclusions are summarized as follows:
(1) The integrated robot-monochrome vision system realizes automatic large-area scanning and data acquisition of complex ship structural parts.
(2) The hybrid algorithm pipeline combining SURF/FLANN image stitching, RANSAC point cloud segmentation, and PCA contour reconstruction achieves high-precision weld path extraction with an RMSE of 0.82 mm.
(3) The proposed online visual recognition system significantly outperforms traditional CAD-based offline programming, with the maximum absolute localization error reduced from 5. 89 mm to 1.5 mm.
(4) Rigorous error budget analysis quantitatively decomposes the contribution of robot, camera calibration, algorithm processing, and environmental interference to total error, enhancing the scientificity and credibility of experimental results.
The limitations of this study lie in the dependence on the KUKA robot platform and the current adaptation to planar welds only. Future research directions are as follows:
(1) Hardware diversification: Migrate and verify the algorithm on ABB/FANUC robot platforms to analyze the influence of mechanical platform differences on recognition accuracy.
(2) Algorithm upgrading: Introduce B-spline curve fitting to realize 3D curved weld seam contour reconstruction and trajectory planning.
(3) Intelligent closed-loop optimization: Integrate a CNN-based image recognition algorithm to realize real-time weld pool quality detection and closed-loop adjustment of the welding trajectory.

Author Contributions

Z.C., conceptualization, methodology, software, validation, formal analysis, investigation, data curation, writing—original draft, visualization, experimentation; Q.L., supervision, project administration, funding acquisition, writing—review and editing, resource provision, experimental design, data verification. All authors contributed to the study conception and design. Material preparation, data collection, and analysis were performed by Z.C. The first draft of the manuscript was written by Z.C., and all authors commented on previous versions of the manuscript. All authors have read and agreed to the published version of the manuscript.

Funding

This research received no external funding.

Data Availability Statement

The original contributions presented in this study are included in the article. Further inquiries can be directed to the corresponding author.

Acknowledgments

During the preparation of this manuscript, the authors used Python 6.0 for the purposes of data analysis. The authors have reviewed and edited the output and take full responsibility for the content of this publication.

Conflicts of Interest

The authors declare no conflicts of interest.

References

  1. Brando, G.; Distefano, F.; Carolo, D.F.; Crupi, V.; Epasto, G.; Galietti, U. Dissimilar Welded Joints and Sustainable Materials for Ship Structures. J. Mar. Sci. Eng. 2025, 13, 2296. [Google Scholar] [CrossRef] [Scilit]
  2. Midan, A.A.; Savu, V.S.; David, A.; Biholar, A.I.; Douimia, Y. Integration of Thermographic Data and SolidWorks Simulation for Welding Process Optimization in Shipbuilding. Key Eng. Mater. 2025, 1030, 23–30. [Google Scholar] [CrossRef] [Scilit]
  3. Grönlund, K.; Ahola, A.; Afkhami, S.; Skriko, T. Effects of variable amplitude loading and random loading sequence on fatigue of welded joints made of high-strength steel in ship structural details. Mar. Struct. 2026, 108, 104028. [Google Scholar] [CrossRef] [Scilit]
  4. Li, D.; Chen, Z. An extended incremental-iterative approach to evaluate the residual ultimate strength of ship hull girders with welding residual stress subjected to cumulative plastic damage. Mar. Struct. 2026, 106, 103963. [Google Scholar] [CrossRef] [Scilit]
  5. Chen, Y.; Wang, Y.; Li, K.; Wang, Q.; Liu, J.; Zou, X. Data-model fusion-driven adaptive positioning and control of arc starting points for the intermediate assembly welding of ships. Meas. Sci. Technol. 2025, 36, 116305. [Google Scholar] [CrossRef] [Scilit]
  6. Chaoyi, W.; Xiaoli, H.; Lin, Y.; Hongyan, Z.; Zhenpeng, G.; Xin, L. Low Temperature Mechanical Properties of 460 MPa Polar Ship Steel and Its Welded Joints. In Proceedings of the 9th International Conference on High Strength Low Alloy Steels (HSLA Steels 2025); The Chinese Society for Metals: Beijing, China, 2025; pp. 122–128. [Google Scholar] [CrossRef]
  7. Midan, A.A.; Savu, V.S. Advances in Welding Techniques for Inland Waterway Shipbuilding. Adv. Sci. Technol. 2025, 163, 3–8. [Google Scholar] [CrossRef] [Scilit]
  8. Zhang, S.; Zhang, Y.; Bai, H. Adaptive control method for ship curved hybrid laser-arc welding through lightweight encoder-decoder architecture. Eng. Appl. Artif. Intell. 2025, 145, 110193. [Google Scholar] [CrossRef] [Scilit]
  9. Yu, R.; Chen, Y.Y. Coordinated Ship Welding with Optimal Lazy Robot Ratio and Energy Consumption via Reinforcement Learning. J. Mar. Sci. Eng. 2024, 12, 1765. [Google Scholar] [CrossRef] [Scilit]
  10. Shi, J.; Pang, Q.; Li, W.; Xiang, Z.; Qi, H. Evolution of inclusions in DH36 grade ship plate steel during high heat input welding. Sci. Rep. 2024, 14, 18921. [Google Scholar] [CrossRef] [Scilit]
  11. Ahsan, M.; Arinda, T.B.; Prasetya, K.I. Monitoring Welding Process on Ship Construction Using Demerit Control Chart and Fuzzy Analytics Hierarchy Process Integrated Statistical Process Control. IAENG Int. J. Appl. Math. 2024, 54, 1251–1258. [Google Scholar]
  12. Guo, Z.; Liu, X.; Rao, X.; Yuan, C. Effect of defects on the structural integrity of ship piping welds under simulated piping conditions. Ocean Eng. 2024, 308, 118372. [Google Scholar] [CrossRef] [Scilit]
  13. Jiao, Z.; Wang, J.; Li, L.; Fu, K.; Zhao, M.; Liu, J.; Guo, J.; Wu, W. Numerical Simulation Study of Welding Process of AH32 Ship Plate Steel. Trans. Indian Inst. Met. 2024, 77, 2439–2449. [Google Scholar] [CrossRef] [Scilit]
  14. Jinfeng, L.; Yifa, C.; Xuwen, J.; Liu, X.; Chen, Y. Prediction and optimization method for welding quality of components in ship construction. Sci. Rep. 2024, 14, 9353. [Google Scholar] [CrossRef] [Scilit]
  15. Zhang, X.; Zhang, M.; Jiao, S.; Sun, L.; Li, M. Design and Optimization of the Wall Climbing Robot for Magnetic Particle Detection of Ship Welds. J. Mar. Sci. Eng. 2024, 12, 610. [Google Scholar] [CrossRef] [Scilit]
  16. Shang, G.; Xu, L.; Li, Z.; Zhou, Z.; Xu, Z. Digital-twin-based predictive compensation control strategy for seam tracking in steel sheets welding of large cruise ships. Robot. Comput.-Integr. Manuf. 2024, 88, 102725. [Google Scholar] [CrossRef] [Scilit]
  17. Quist, N.A.; Christensen, R.H.; Mikkelsen, H.; Walther, J.H. Validation of a full scale CFD simulation of a self-propelled ship with measured hull roughness and effect of welding seams on hull resistance. Appl. Ocean Res. 2023, 141, 103746. [Google Scholar] [CrossRef] [Scilit]
  18. Liu, J.; Ji, Q.; Zhang, X.; Chen, Y.; Zhang, Y.; Liu, X.; Tang, M. Digital twin model-driven capacity evaluation and scheduling optimization for ship welding production line. J. Intell. Manuf. 2023, 35, 3353–3375. [Google Scholar] [CrossRef] [Scilit]
  19. Jiao, Z.; Yang, T.; Gao, X.; Chen, S.; Liu, W. Welding Penetration Monitoring for Ship Robotic GMAW Using Arc Sound Sensing Based on Improved Wavelet Denoising. Machines 2023, 11, 911. [Google Scholar] [CrossRef] [Scilit]
  20. Wahidi, I.S.; Oterkus, S.; Oterkus, E. Simulation of a Ship’s Block Panel Assembly Process: Optimizing Production Processes and Costs through Welding Robots. J. Mar. Sci. Eng. 2023, 11, 1506. [Google Scholar] [CrossRef] [Scilit]
  21. Kiyoun, K.; Jaeyong, L.; Duhwan, M. Lightweight Model-Based Weld Line Generation and Its Applications to Support the Construction of Ships and Offshore Plants. J. Mar. Sci. Eng. 2023, 11, 554. [Google Scholar] [CrossRef] [Scilit]
  22. Cao, Y.; Song, Y.; Liu, Z.; Wu, T.; Bai, Y. Welding distortion prediction and mitigation in thick steel plate structures on ships. Ships Offshore Struct. 2022, 17, 2674–2685. [Google Scholar] [CrossRef] [Scilit]
  23. Li, L.; Luo, C.; Shen, J.; Zhang, Y. Numerical prediction of welding deformation in ship block subassemblies via the inhomogeneous inherent strain method. J. Manuf. Process. 2022, 80, 860–873. [Google Scholar] [CrossRef] [Scilit]
  24. Gwangho, Y.; Sangjin, O.; Sungchul, S. Image Preprocessing Method in Radiographic Inspection for Automatic Detection of Ship Welding Defects. Appl. Sci. 2021, 12, 123. [Google Scholar] [CrossRef] [Scilit]
Figure 1. Comparison of offline and online programming approaches [12].
Machines 14 00663 g001
Figure 2. Flowchart of the research methodology.
Machines 14 00663 g002
Figure 3. Types of ship welding technologies: (a) plywood welding assembly line; (b) manual welding operation; (c) automated welding of profiles; (d) automated welding between lattice cells.
Machines 14 00663 g003
Figure 4. Welding robot system: (a) KR-16-L6-2 welding robot; (b) physical diagram of KR C4 control cabinet; (c) KUKA Smart PAD Trainer; (d) EWM Phoenix 551 Puls welding source; (e) walking rail base; (f) POWER-CAM laser sensor.
Machines 14 00663 g004
Figure 5. Visual recognition system for weld seams of ship structural components.
Machines 14 00663 g005
Figure 6. Visual recognition process for weld seams of ship structural components.
Machines 14 00663 g006
Figure 7. Camera selection for visual recognition system: (a) Midway Vision MV-GED200M-T industrial camera; (b) Midway Vision MV-LD-8-3M-A lens.
Machines 14 00663 g007
Figure 8. Image acquisition experiment: (a) welding starting point image; (b) welding path image.
Machines 14 00663 g008
Figure 9. Algorithm of hybrid 2D-3D image and point cloud preprocessing pipeline.
Machines 14 00663 g009
Figure 10. Opening operation: (a) original image; (b) rendered effect of opening operation processing.
Machines 14 00663 g010
Figure 11. Closing operation: (a) original image; (b) rendered effect of closing operation processing.
Machines 14 00663 g011
Figure 12. Feature point matching on original image: (a) feature point matching left figure; (b) feature point matching on the right figure.
Machines 14 00663 g012
Figure 13. Feature point matching results of the FLANN algorithm.
Machines 14 00663 g013
Figure 14. Image stitching preview: (a) left workpiece; (b) intermediate workpiece; (c) right workpiece; (d) mosaic rendering.
Machines 14 00663 g014
Figure 15. Stitched rendering of three workpiece images: (a) left workpiece; (b) intermediate workpiece; (c) right workpiece; (d) mosaic rendering.
Machines 14 00663 g015
Figure 16. Filtered result diagram: (a) original noise image; (b) mean filter; (c) Gaussian filtering; (d) median filtering.
Machines 14 00663 g016
Figure 17. Welding path image after median filtering processing: (a) original welding path image; (b) image after median filtering processing.
Machines 14 00663 g017
Figure 18. Point cloud extraction for welded components based on the RANSAC algorithm: (a) global point cloud; (b) bottom plate recognition; (c) point cloud after direct filtering; (d) point cloud after statistical filtering; (e) results of point cloud normal vector calculation; (f) welding joint point cloud.
Machines 14 00663 g018aMachines 14 00663 g018b
Figure 19. Binarization result of the image: (a) gray-scale workpiece image; (b) workpiece image after equalization; (c) histogram equalization.
Machines 14 00663 g019
Figure 20. Comparison of visualizations for four threshold segmentation methods: (a) Otsu threshold segmentation method; (b) iterative threshold segmentation method; (c) adaptive threshold segmentation method; (d) maximum entropy threshold segmentation method.
Machines 14 00663 g020
Figure 21. Contour reconstruction and positioning of welded components: (a) point cloud segmentation; (b) component outline generation method; (c) contour reconstruction results.
Machines 14 00663 g021
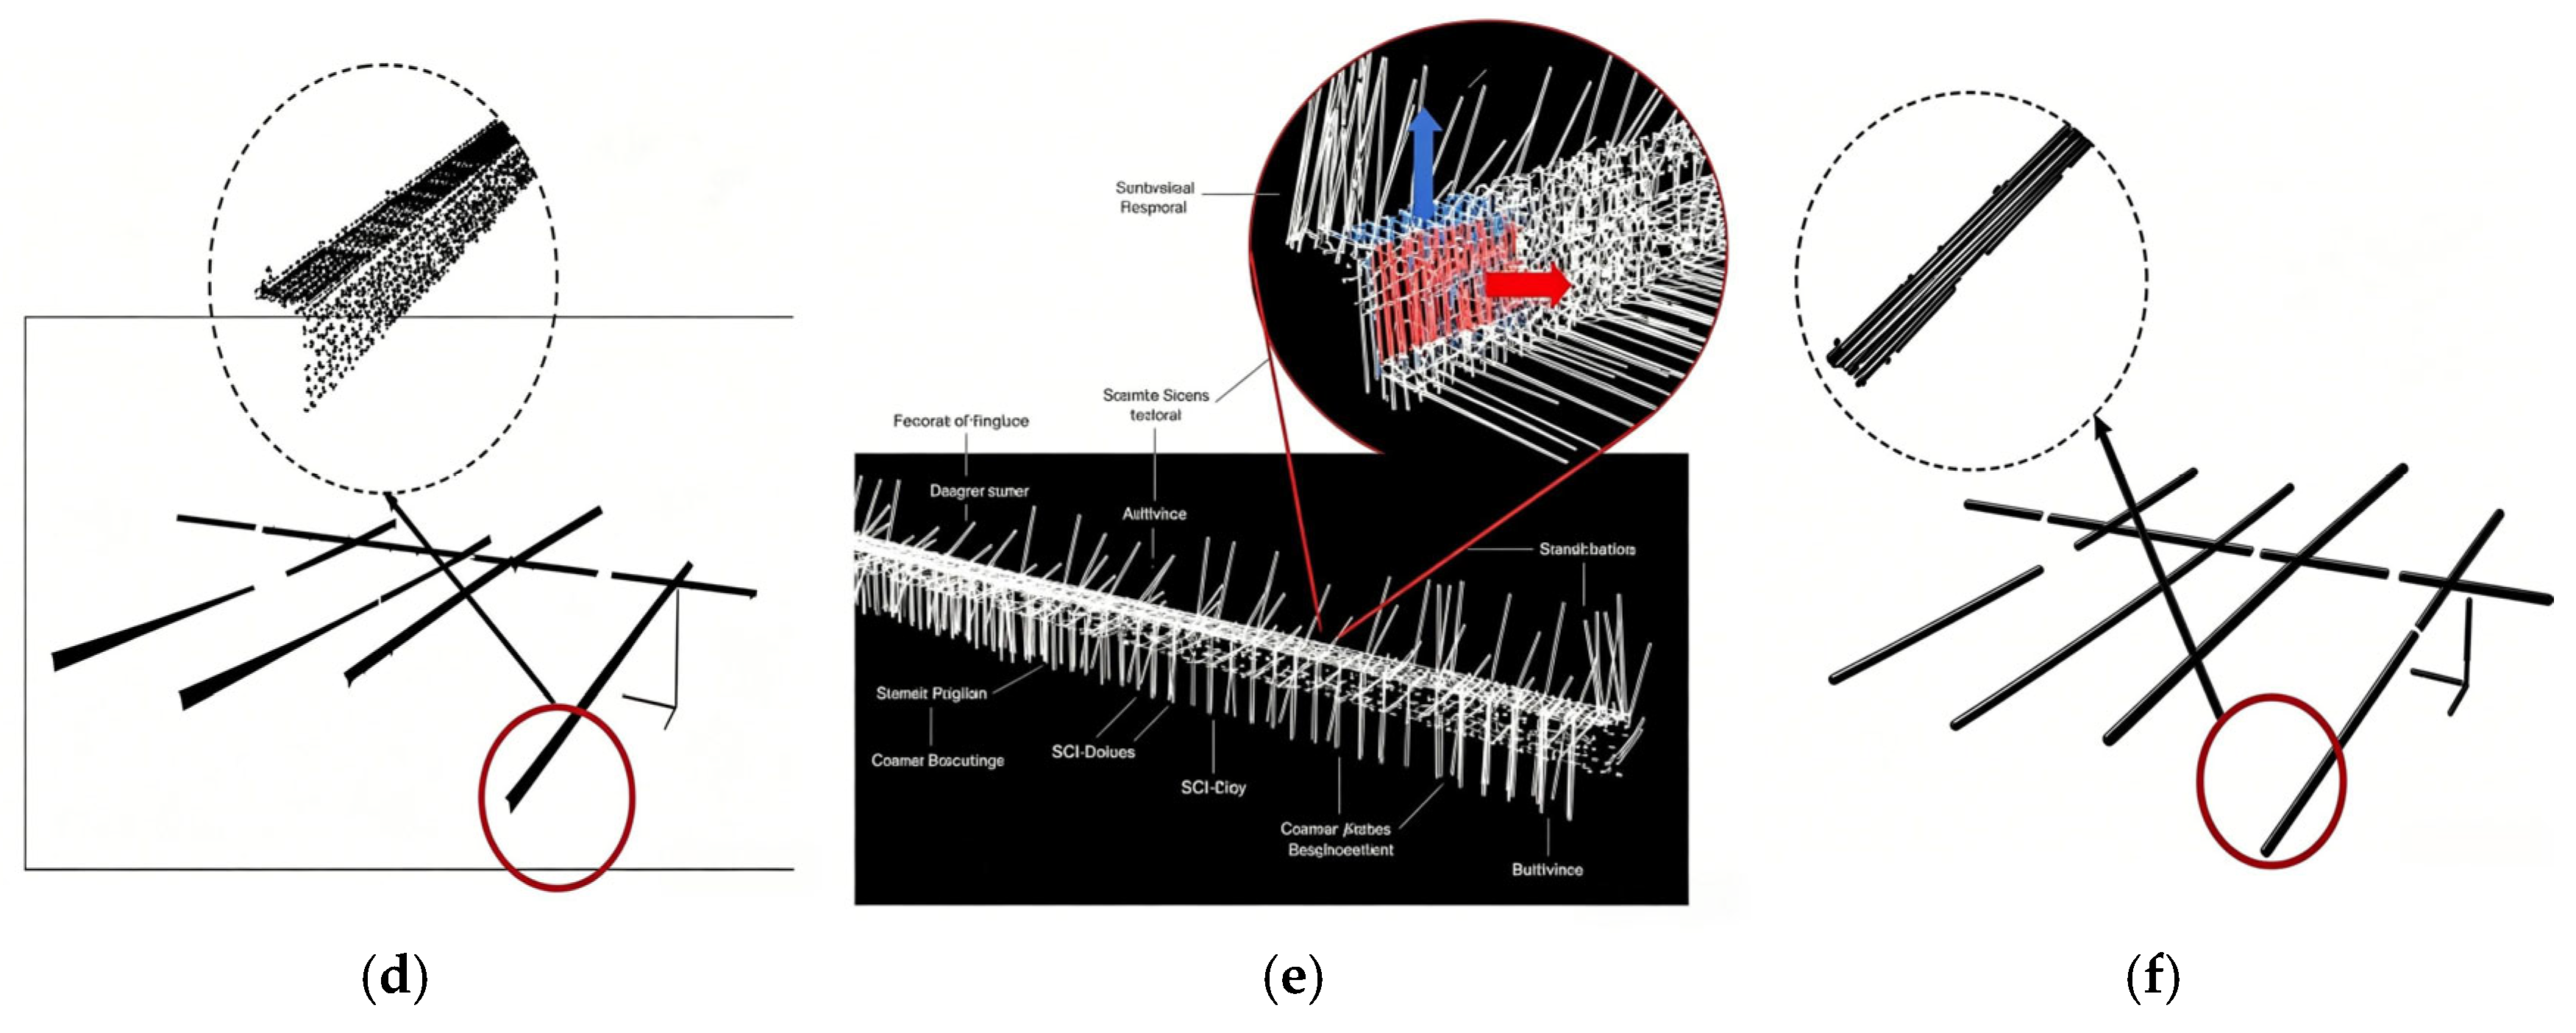
Figure 22. Weld seam trajectory generation.
Machines 14 00663 g022
Figure 23. Visualization of outer corner recognition for slot-type bulkhead welding path: (a) original welding workpiece image; (b) median filter effect; (c) workpiece image binarization; (d) workpiece welding path trajectory.
Machines 14 00663 g023
Figure 24. Wave plate welding path recognition rendered image: (a) original welding workpiece image; (b) median filter effect; (c) workpiece image binarization; (d) workpiece welding path trajectory.
Machines 14 00663 g024
Figure 25. Visual representation of welding path recognition for arc plate corner-jointed workpiece: (a) original welding workpiece image; (b) median filter effect; (c) workpiece image binarization; (d) workpiece welding path trajectory.
Machines 14 00663 g025aMachines 14 00663 g025b
Figure 26. Welding path recognition for workpieces with bevel defects: (a) original image of workpiece with groove defect; (b) welding path edge detection; (c) welding path edge after light smoothing; (d) centerline extraction for welding path.
Machines 14 00663 g026
Figure 27. Comparison of online recognition and offline programming weld seam position recognition.
Machines 14 00663 g027
Figure 28. Comparison of reprojection errors after repeated calibration: (a) pre-correction reprojection error; (b) revised reprojection error.
Machines 14 00663 g028
Figure 29. CMM measurement and coordinate registration system: (a) CMM scanning of ship structural workpiece; (b) ICP-based coordinate registration flow; (c) unified global coordinate system for robot, vision, and CMM.
Machines 14 00663 g029
Figure 30. Error budget propagation flowchart.
Machines 14 00663 g030
Table 1. Comparative Weld Position Recognition Errors Across Multiple Workpieces (n = 25 trials).
MethodRMSE (mm)Mean Error (mm)Std. Deviation (mm)Max. Abs. Error (mm)
Online Recognition0.820.680.451.50
Offline Programming4.153.821.625.89
Table 2. Per-Workpiece Weld Localization Error Statistics (n = 5 trials per workpiece).
Workpiece TypeOnline Recognition RMSE
(mm)
95% CIMean Error
(mm)
95% CIMax Abs. Error
(mm)
1. Channel bulkhead0.78[0.71, 0.85]0.65[0.58, 0.72]1.42
2. Corrugated plate0.80[0.73, 0.87]0.67[0.60, 0.74]1.45
3. Arc plate0.83[0.76, 0.90]0.69[0.62, 0.76]1.48
4. Straight plate0.81[0.74, 0.88]0.68[0.61, 0.75]1.46
5. Groove defect0.85[0.78, 0.92]0.71[0.64, 0.78]1.50
Overall (n = 25)0.82[0.79, 0.85]0.68[0.65, 0.71]1.50
Table 3. Quantified Error Budget Analysis.
Error SourceContribution (mm)Calibration/Measurement Method
Robot dynamic positioning error ( E r o b o t )±0.30CMM measurement of end-effector dynamic tracking error
Camera internal parameter calibration error ( E c a m )±0.07Zhang’s calibration method (0.4-pixel reprojection error)
Hand–eye calibration error ( E h a n d e y e )±0.1810 repeated Tsai-Lenz calibrations
Point cloud ICP registration error ( E i c p )±0.35Registration residual between visual point cloud and CMM point cloud
Weld edge detection error ( E edge )±0.40Comparison between algorithm-extracted edges and CMM-measured edges
Algorithm processing error ( E a l g )±0.14RANSAC plane fitting residual + PCA contour fitting residual
Environmental disturbance ( E e n v )±0.20Repeated measurements under varying environmental conditions
Total measured RMSE0.681CMM verification
Table 4. Ablation Study Results (RMSE, mm).
Method ConfigurationRMSE (mm)Max Abs. Error (mm)95% CIMaximum Absolute Error (mm)
Full proposed method0.821.50[0.79, 0.85]1.50
Without SURF-FLANN stitching1.252.31[1.18, 1.32]2.31
Without RANSAC segmentation1.182.17[1.11, 1.25]2.17
Without PCA reconstruction1.031.89[0.97, 1.09]1.89
Table 5. Comparison with State-of-the-Art Methods.
MethodRMSE
(mm)
Sensor TypeError DefinitionAdaptability to Complex Ship StructuresProcessing Speed
(fps)
Experimental Environment
Proposed hybrid 2D-3D method0.82Monochrome camera + laser profiler3D weld position errorHigh (multi-configurations: corner joints, corrugated plates, arc plates, groove defects)1.0Unstructured shipbuilding workshop
Chen et al. (2025) [5]1.15Structured light sensor2D weld position errorMedium (Flat Plate Joint)0.8Laboratory environment
Shang et al. (2024) [16]1.08Laser tracker1D tracking errorMedium (Large cruise ship straight weld seam)0.9Semi-structured workshop
Zhang et al. (2024) [15]1.32Monocular camera2D weld position errorLow (External hull weld seam)1.1Outdoor shipbuilding dock
Liu et al. (2023) [18]1.20Simulation dataIdeal position errorMedium (Simple planar weld seam)0.7Simulation environment
Kiyoun et al. (2023) [21]1.453D scanner3D weld position errorLow (Simple weld on the offshore platform)1.2Laboratory environment
Disclaimer/Publisher’s Note: The statements, opinions and data contained in all publications are solely those of the individual author(s) and contributor(s) and not of MDPI and/or the editor(s). MDPI and/or the editor(s) disclaim responsibility for any injury to people or property resulting from any ideas, methods, instructions or products referred to in the content.