1. Introduction
Despite significant advances in maritime decarbonization, auxiliary thermal systems remain an under-optimized component of ship energy performance. In particular, marine cooling systems operate under highly variable environmental conditions, where seawater temperature, flow regime, and fouling processes interact in a nonlinear manner, often leading to performance degradation and increased energy demand.
Marine heat exchangers operate under highly variable environmental and operational conditions [
1]. Seawater temperatures may vary by more than 293 K between different navigation zones, while engine load continuously fluctuates due to weather, maneuvering, and cargo operations [
2]. Under such variability, cooling systems designed using static nominal conditions often experience performance degradation [
3]. Reduced heat-transfer efficiency increases hydraulic losses, pump energy consumption, and the risk of thermal overload [
4]. Fouling—caused by salt deposition, biological growth, and particulate contamination—further accelerates performance deterioration and complicates maintenance planning [
5,
6,
7]. Consequently, improving the adaptability and predictive control of cooling systems represents a strategic opportunity for enhancing ship energy efficiency and operational reliability [
8].
Recent advances in maritime digitalization have introduced new approaches to this challenge [
9,
10,
11]. The concept of the digital twin—a dynamic virtual representation of a physical asset synchronized through real-time data—has gained significant attention across manufacturing, aerospace, energy, and transportation sectors [
12,
13,
14,
15]. Originally formulated within product lifecycle management frameworks, digital twin methodology has evolved into a cornerstone of Industry 4.0 and intelligent production systems [
16,
17]. In the maritime domain, digital twins have been applied to hull performance monitoring, structural health assessment, route optimization, and engine diagnostics [
18,
19,
20]. These developments demonstrate the potential of cyber–physical integration to support data-driven decision-making.
However, the application of digital twins to marine thermal systems remains relatively underdeveloped. Existing research typically emphasizes either high-level architectural frameworks or component-level thermodynamic modeling but rarely integrates both into a unified predictive system [
21,
22,
23,
24,
25]. Some studies advocate purely physics-based thermohydraulic modeling, arguing that deterministic heat-transfer equations provide sufficient reliability for engineering control [
26,
27,
28,
29]. Others promote data-driven or machine-learning approaches capable of capturing nonlinear degradation patterns without explicit physical modeling [
30,
31,
32,
33]. The debate between physics-informed and data-driven methodologies remains unresolved, particularly in safety-critical systems such as marine propulsion plants [
34,
35,
36,
37,
38]. Moreover, limited attention has been paid to the quantitative impact of cooling-system optimization on fuel efficiency and sustainability metrics.
Another point of divergence concerns maintenance strategies [
8,
39,
40,
41,
42]. Traditional scheduled maintenance assumes predictable degradation and relies on conservative safety margins [
43,
44,
45]. In contrast, predictive maintenance frameworks propose condition-based interventions supported by continuous monitoring and forecasting algorithms [
32,
46,
47,
48]. While predictive approaches promise reductions in downtime and resource consumption, their effectiveness depends on accurate modeling of degradation mechanisms such as fouling and hydraulic resistance growth [
8,
23,
49,
50]. Empirical validation under real ship-operating conditions is therefore essential.
Conventional design and analysis approaches rely primarily on steady-state thermohydraulic models calibrated for nominal conditions. While these models provide engineering interpretability, they lack adaptability to dynamic operating environments. Conversely, data-driven methods can capture nonlinear patterns but often lack physical consistency and extrapolation capability in safety-critical systems.
The concept of a digital twin offers a promising pathway to bridge this gap by combining physics-based modeling with quasi-real-time data assimilation. However, existing applications in the maritime domain are typically limited to high-level architectures or isolated components and rarely provide an integrated, experimentally validated framework for thermal systems. In particular, three key limitations can be identified in the current state of the art:
Lack of physics-informed quasi-real-time updating mechanisms.
Insufficient treatment of coupled thermohydraulic and fouling processes.
Absence of quantitative validation under real operating conditions.
To address these gaps, this study proposes a physics-informed digital twin framework for marine plate heat exchangers, explicitly designed to capture coupled thermal–hydraulic–fouling interactions under variable environmental conditions.
While the proposed framework builds upon established thermohydraulic relations and iterative solution techniques, its methodological novelty lies in the formal integration of these elements into a unified state-aware digital twin structure capable of capturing coupled nonlinear degradation processes under variable operating conditions. The proposed framework incorporates a residual-based state-update mechanism, enabling adaptive correction of internal model parameters during operation.
Unlike conventional hybrid (physics + data) models, which typically employ static parameter calibration or black-box correction layers, the present approach introduces a recursive thermohydraulic state-update mechanism in which key system variables—such as the overall heat-transfer coefficient and fouling resistance—are treated as dynamically evolving internal states rather than fixed or externally regressed parameters. These states are continuously adjusted through an iterative residual-driven recalculation procedure, enabling physically consistent adaptation to changing boundary conditions.
In contrast to existing digital twin implementations in thermal systems, which often focus on high-level architectural representations or data synchronization, the proposed framework explicitly embeds a physics-informed iterative solver into the core of the digital twin, allowing quasi-real-time reconstruction of coupled thermal–hydraulic behavior. This enables the identification of threshold operating regimes, nonlinear amplification effects, and degradation pathways that are not captured by steady-state or purely data-driven approaches.
Furthermore, the integration of fouling dynamics into the iterative solution loop, rather than treating fouling as an external correction factor, provides a mechanism for endogenous degradation tracking within the digital twin. This represents a shift from descriptive monitoring toward predictive state evolution modeling, which is essential for supporting condition-based and prescriptive maintenance strategies.
Thus, the contribution of this work is not the introduction of new thermodynamic equations per se, but the development of a structured computational framework that transforms classical thermohydraulic modeling into a dynamically adaptive, state-estimating digital twin system.
The main contributions of this work are as follows:
Recursive state-aware digital twin formulation with embedded thermohydraulic state estimation. A hybrid modeling framework is developed, combining first-principles thermodynamic equations with data-driven state correction, enabling physically consistent and adaptive system representation.
Iterative state-estimation algorithm. A successive-approximation solver is extended to function as a digital twin core, allowing quasi-real-time recalculation of thermohydraulic parameters under changing boundary conditions.
Coupled degradation modeling. The study explicitly models the interaction between temperature, hydraulic resistance, and fouling, revealing nonlinear amplification effects and threshold operating regimes.
Experimental validation with uncertainty-aware metrics. The framework is validated using operational ship data, with error quantification (MAPE) and consistency analysis, ensuring engineering reliability.
Benchmark comparison with static models. The proposed digital twin is evaluated against a baseline steady-state model, demonstrating improved predictive capability and earlier detection of performance degradation.
Energy-efficiency linkage. A quantitative relationship between thermohydraulic degradation and auxiliary energy demand is established, connecting local system behavior to vessel-level efficiency.
This study addresses the following research question: How can a physics-informed digital twin framework improve the accuracy, adaptability, and predictive capability of thermohydraulic modeling of marine heat exchangers under variable environmental and degradation conditions?
It is important to note that the proposed framework represents a quasi-real-time, physics-informed digital twin rather than a fully autonomous or continuously synchronized system. The model operates on sequentially updated operational data and performs recursive state recalculation, but does not implement full real-time data streaming, advanced data assimilation techniques, or closed-loop control integration.
Accordingly, the objective of this study is not to develop a complete digital twin ecosystem, but to establish a physically consistent and computationally efficient core model capable of supporting state estimation, performance assessment, and short-term forecasting within a digital twin paradigm.
The principal findings demonstrate that moderate increases in seawater temperature (3–4 K) may reduce heat-transfer efficiency by up to 11% and increase hydraulic losses by approximately 9%. Fouling produces nonlinear degradation of the overall heat-transfer coefficient, highlighting the importance of early detection. Simulation-based optimization scenarios indicate that adaptive cooling control supported by the digital twin may contribute to a reduction in auxiliary power demand, indirectly affecting fuel consumption, while enabling more rational maintenance scheduling.
By situating marine heat-exchanger modeling within a broader digital twin and sustainability context, this study contributes to the development of intelligent, energy-efficient ship operation strategies. The proposed framework supports data-driven decision-making, reduces uncertainty in maintenance planning, and provides a scalable foundation for integrating thermal-system analytics into comprehensive vessel digitalization initiatives.
Unlike many existing studies, the proposed approach is evaluated against representative models from different paradigms, including physics-based, data-driven, and adaptive estimation approaches.
2. Materials and Methods
2.1. Case Study Vessel and Cooling System Configuration
The object of investigation is the central cooling system of a chemical tanker equipped with a MAN B&W 6S50ME-B (MAN Energy Solutions, Copenhagen, Denmark) two-stroke marine diesel engine. The propulsion plant includes a central cooling water (CCW) circuit, a jacket cooling water (JCW) circuit, and a seawater (SW) circuit connected through a single-pass plate heat exchanger (PHE).
The PHE operates as the thermal interface between the central freshwater loop and seawater, ensuring engine inlet temperatures remain within manufacturer limits. The system is designed for seawater temperatures up to 305–309 K, depending on operating conditions.
The vessel operates across temperature-variable regions (North Sea–Persian Gulf), where seawater temperature ranges from approximately 288 K (winter) to 309 K (summer). This wide environmental variability makes the system suitable for assessing thermohydraulic sensitivity and digital twin adaptability.
The main geometric parameters of the plate heat exchanger used in the model include:
plate area: A = 0.25 m2
number of plates: N = 120
plate thickness: = 0.0006 m
hydraulic diameter: = 0.0045 m
channel spacing: = 0.0025 m
chevron angle: = 60°
enlargement factor: = 1.18
These parameters were obtained from design specifications and used consistently across all simulations. The geometry was assumed to remain constant, while effective flow conditions varied depending on operational parameters.
A sensitivity analysis was conducted for and N within ±15% to account for design variability.
2.2. Thermohydraulic Modeling Framework
The thermal performance of the plate heat exchanger was modeled using classical steady-state heat-transfer and fluid-flow equations. Well-established thermodynamic relations were applied in accordance with standard heat exchange theory.
The thermohydraulic model is based on a quasi-steady-state assumption, where each operating point represents an average condition over a finite time interval. This approach is appropriate for analyzing system behavior under slowly varying environmental conditions but does not explicitly capture transient dynamics associated with rapid load changes.
2.2.1. Heat Duty Calculation
The heat load of the exchanger is defined as:
here:
—mass flow rate of hot (fresh) water [kg/s], —specific heat capacity [kJ/kg·K], —inlet and outlet temperatures [K].
The cold-side balance was verified using:
here:
—mass flow rate of cold water [kg/s], —specific heat capacity [kJ/kg·K], —inlet and outlet temperatures [K].
Energy conservation between both circuits was ensured with a correction factor accounting for heat losses.
2.2.2. Logarithmic Mean Temperature Difference (LMTD)
The logarithmic mean temperature difference was calculated as:
here:
, .
This method is widely used for counterflow heat exchangers and is appropriate for steady-state baseline modeling.
2.2.3. Overall Heat Transfer Coefficient
The overall heat-transfer coefficient was determined from the total thermal resistance of the plate heat exchanger:
here:
—convective heat-transfer coefficients on the hot and cold sides, respectively, —plate thickness, —plate thermal conductivity, —fouling thermal resistance. In the proposed framework, is treated as a time-varying internal state variable of the digital twin rather than a fixed correction coefficient.
In the present formulation, the fouling resistance introduced in Equation (4) is treated as a time-dependent state variable of the system. Its evolution is governed by Equation (6), ensuring full consistency between the thermal resistance model and the fouling dynamics representation.
Thus, Equation (4) defines the instantaneous thermal behavior of the heat exchanger, while Equation (6) describes the temporal evolution of the same fouling resistance term used in the overall heat-transfer coefficient.
Empirical correlations for turbulent flow in plate heat exchangers were used to compute values as functions of flow velocity and mean fluid temperature. These correlations are consistent with manufacturer design methodologies and standard heat-transfer references.
The convective heat-transfer coefficients
and
were calculated using standard empirical correlations for turbulent flow in plate heat exchangers. In particular, the Nusselt number was evaluated in the form:
where
is the Reynolds number,
is the Prandtl number, and
are empirical constants selected based on plate heat exchanger literature and manufacturer recommendations.
For the operating conditions considered in this study, the following coefficients were used: C = 0.25–0.35, m = 0.65–0.70, n = 0.33
The Reynolds number was calculated as:
where
is fluid density,
is flow velocity,
is the hydraulic diameter, and
is dynamic viscosity.
The heat-transfer coefficient was then obtained as:
where
is the thermal conductivity of the fluid.
The adopted correlations are valid within the following ranges: Re = 2 × 10³–1 × 10⁵, , chevron angle ≈ 30–60° (typical for plate heat exchangers).
The selected correlations are consistent with standard engineering practice and are valid within the turbulent flow regime corresponding to the operating conditions of the investigated system.
2.2.4. Pressure Drop Modeling
The pressure drop across the plate heat exchanger is calculated using a standard hydraulic resistance formulation:
where
is the pressure drop,
is the fluid density,
is the characteristic flow velocity, and
is the dimensionless hydraulic resistance coefficient.
For channel flow, the resistance coefficient is expressed as:
where
is the friction factor,
is the characteristic flow length,
is the hydraulic diameter, and
accounts for local losses associated with inlet, outlet, and flow distribution.
The friction factor is estimated using an empirical relation for turbulent flow:
where
is the Reynolds number, and
and
are empirical coefficients selected based on plate heat exchanger correlations.
This formulation provides an engineering-level approximation of hydraulic losses, capturing the dependence of pressure drop on flow velocity, fluid properties, and channel geometry.
The calculated pressure drop is used both for model validation and for estimating auxiliary energy demand through the pump power relation described in
Section 2.8. This ensures consistency between thermohydraulic modeling and energy-efficiency assessment.
2.3. Successive Approximation Algorithm (Iterative Recalculation)
Because actual operational parameters deviate from nominal design values, an iterative successive approximation method (SAM) was implemented.
The algorithm performs the following steps:
Initial estimation of .
Calculation of heat duty .
Determination of outlet temperatures.
Recalculation of .
Update of overall coefficient .
Iterations continue until convergence is achieved. This approach allows dynamic recalculation under varying seawater temperature, flow rate and fouling resistance.
The thermohydraulic parameters of the heat exchanger are recalculated using the iterative procedure presented in Algorithm 1.
| Algorithm 1. Iterative digital twin recalculation of plate heat exchanger performance |
Input. Operational parameters of the cooling system:Inlet temperatures , . Mass flow rates , . Plate geometry parameters . Initial fouling resistance . Convergence tolerance .
Output. Updated thermohydraulic parameters of the plate heat exchanger:
Outlet temperatures , . Overall heat-transfer coefficient . Heat duty . Predicted degradation indicators.
Step 1. Initialization
1.1 Acquire current operational data from sensors or recorded dataset.
1.2 Assign initial estimate of overall heat-transfer coefficient .
1.3 Set iteration index .
1.4 Define convergence tolerance .
Step 2. Heat Load Calculation
2.1 Compute heat duty of the hot and cold circuit using Equations (1) and (2).
2.2 Estimate outlet temperature of the cold circuit from the energy balance.
Step 3. Temperature Difference Evaluation
3.1 Compute temperature differences: , .
3.2 Calculate logarithmic mean temperature difference using Equation (3).
Step 4. Convective Heat-Transfer Coefficient Calculation
4.1 Calculate mean fluid temperatures.
4.2 Determine heat-transfer coefficients: here represents empirical turbulent-flow correlations for plate heat exchangers.
Step 5. Fouling Adjustment
5.1 Update fouling resistance using Equation (6).
5.2 Introduce fouling resistance into the thermal resistance model.
Step 6. Update Overall Heat-Transfer Coefficient using Equation (4)
Step 7. Convergence Check
7.1 Evaluate difference using Equation (5).
7.2 If then STOP iteration.
7.3 Otherwise set increase iteration counter and return to Step 2.
7.4 State Update (Residual-Based Correction).
7.4.1 Compute residual between measured and predicted outlet temperature: 7.4.2 Update fouling resistance using Equation (6) to account for time-dependent growth. If measurement data are available, apply residual-based correction:
, where is an empirical correction gain.
7.4.3 Update overall heat-transfer coefficient accordingly through Equation (4).
Step 8. Output Results
8.1 Return converged values:
8.2 Store results in the digital twin database for monitoring and predictive maintenance analysis. |
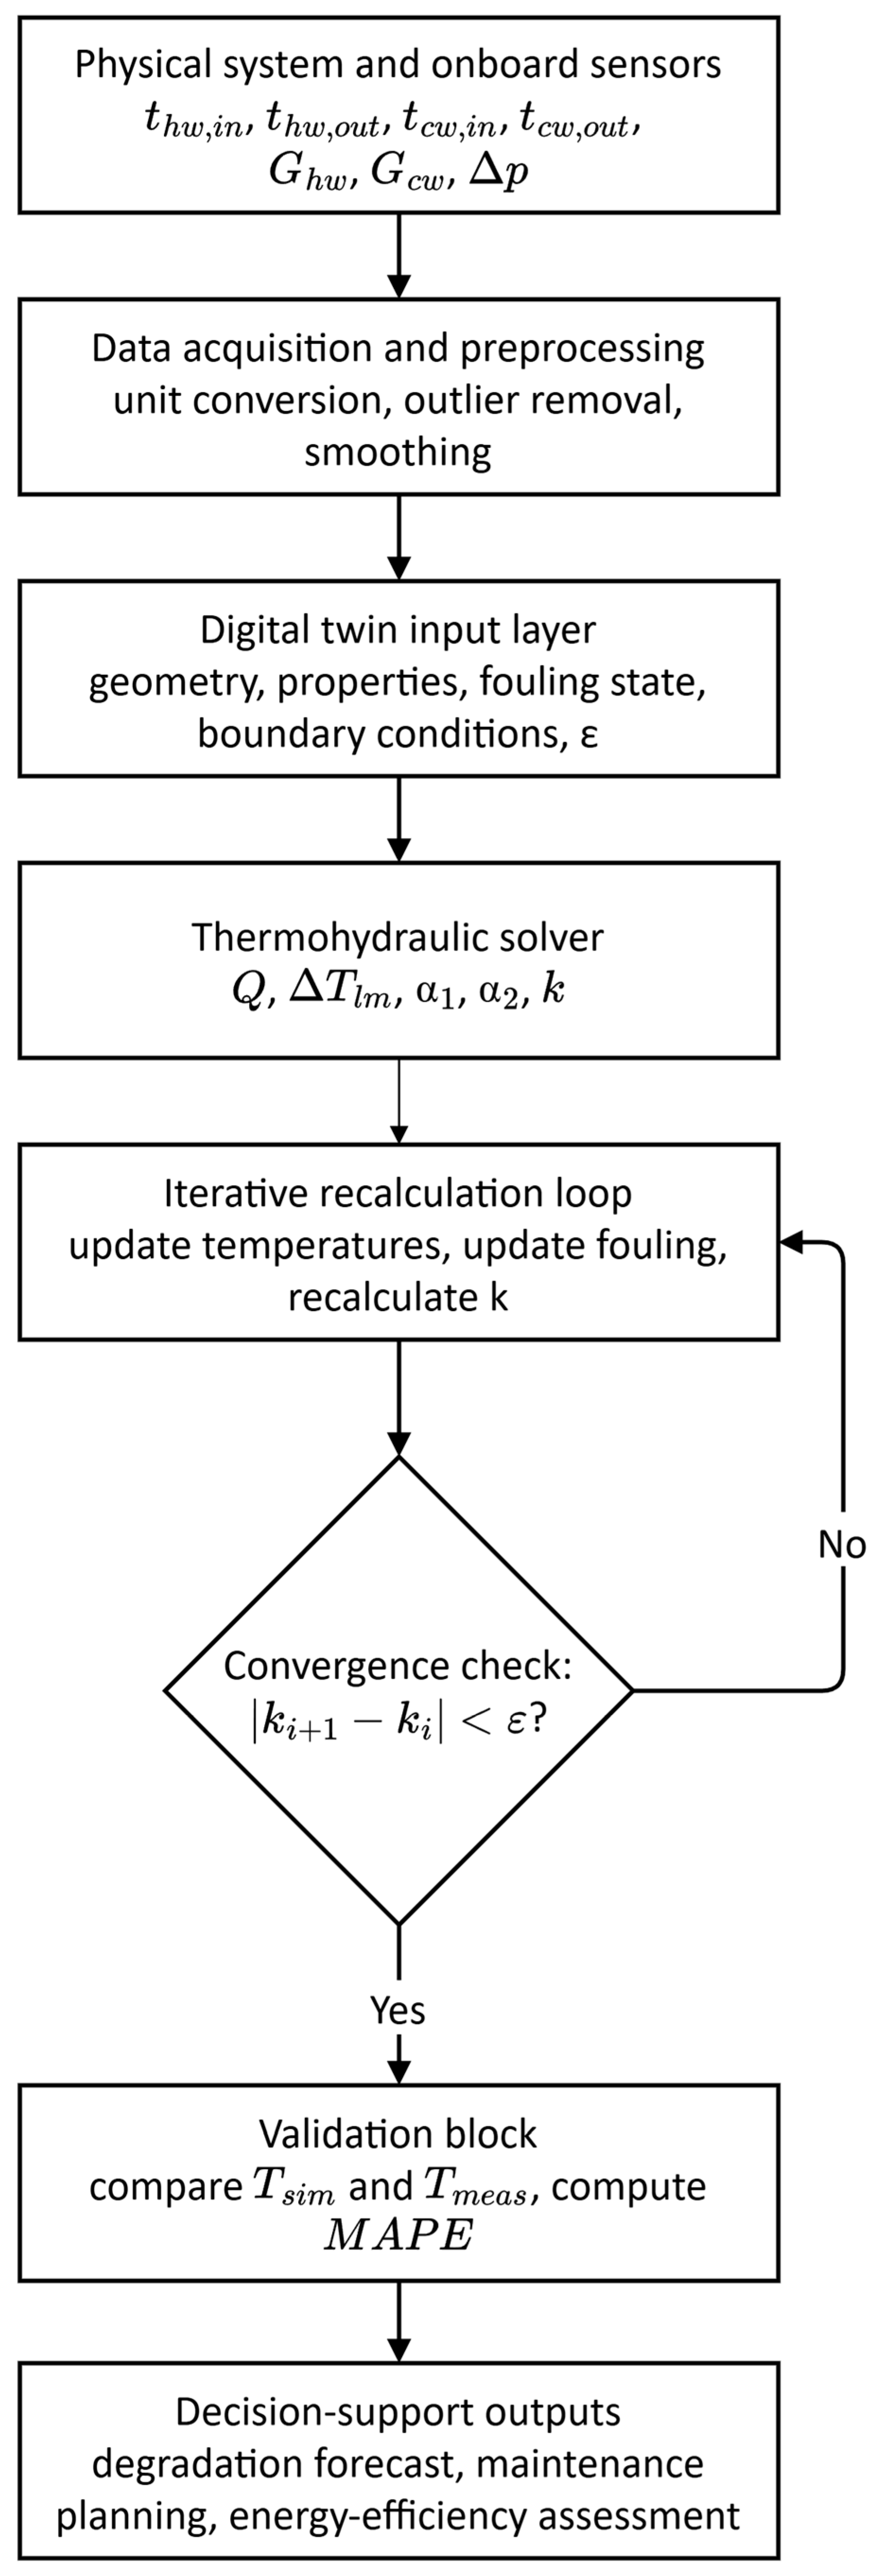
The computational workflow of the proposed digital twin is shown in
Figure A1. The framework begins with acquisition of operational measurements from the physical cooling system, followed by preprocessing and transfer of boundary conditions to the thermohydraulic model. The model then performs iterative recalculation of thermal and hydraulic parameters in accordance with Algorithm 1, including fouling-dependent correction of thermal resistance. After convergence, the simulated outputs are compared with measured data to quantify model accuracy. The validated outputs are subsequently used for degradation assessment, predictive maintenance support, and estimation of energy-efficiency effects.
2.4. Fouling Modeling
In the present model, fouling is represented as an additional thermal resistance included directly in the overall heat-transfer coefficient formulation given by Equation (4). Accordingly, Equation (6) defines the time evolution of the same fouling resistance term , which is recursively updated during the digital twin simulation.
The fouling resistance is expressed as:
here:
—initial fouling resistance,
—operational time,
—is the mean fluid temperature,
—the characteristic flow velocity, and
—empirical coefficients.
This formulation extends the conventional linear model by introducing:
Nonlinear time dependence (), capturing accelerated fouling growth.
Exponential temperature sensitivity, reflecting thermally activated deposition processes.
Inverse dependence on flow velocity, representing the effect of shear stress and partial removal of deposits.
To improve physical realism while maintaining computational efficiency suitable for digital twin applications, the fouling process is modeled using a nonlinear semi-empirical formulation that accounts for both thermal and hydrodynamic effects.
Scenarios with progressive fouling thickness increase were simulated to evaluate degradation effects on:
Although the model does not explicitly resolve microscopic deposition and removal mechanisms, it provides an effective macroscopic representation of fouling dynamics suitable for system-level simulation and quasi-real-time digital twin framework implementation.
The adopted fouling model represents a compromise between physical realism and computational tractability. Fully mechanistic fouling models require detailed information on fluid composition, particulate concentration, surface properties, and local flow regimes, which are typically unavailable in shipboard monitoring systems.
Therefore, a semi-empirical approach was selected, in which the dominant macroscopic drivers of fouling—time, temperature, and flow conditions—are incorporated explicitly. This allows the model to capture nonlinear growth trends and flow-dependent mitigation effects while remaining compatible with quasi-real-time digital twin framework operation.
The model parameters were calibrated using operational data, enabling adaptation to specific system configurations and environmental conditions.
In addition to the time-dependent formulation given by Equation (6), the fouling resistance is further adjusted during the iterative solution process to account for discrepancies between model predictions and measured data.
The update of fouling resistance is performed using a residual-based correction:
where
is a tuning coefficient controlling the sensitivity of the fouling update, and the residual term reflects the mismatch between measured and predicted outlet temperatures.
This correction mechanism allows the model to capture unmodeled fouling effects and adapt the effective fouling resistance in a data-consistent manner during digital twin operation.
Fouling directly affects the calculated heat-transfer coefficient through the additional thermal resistance term (Equation (4)). As fouling increases, calculated heat-transfer coefficient decreases, while required heat-transfer coefficient remains determined by the required thermal duty.
This divergence between calculated and required heat-transfer coefficients serves as a key diagnostic feature of the digital twin, enabling identification of degradation trends.
2.5. Digital Twin Architecture
A five-layer digital twin structure was developed:
Physical Layer—plate heat exchanger, temperature/pressure/flow sensors.
Data Layer—quasi-real-time data acquisition (1-min sampling resolution).
Model Layer—thermohydraulic + fouling model.
Analytical Layer—predictive forecasting and optimization.
Decision Layer—maintenance and energy-efficiency recommendations.
Quasi-real-time synchronization is used, based on recorded operational data streams. The framework emulates real-time operation by sequential data ingestion.
2.6. Digital Twin Formulation
To ensure consistency with the digital twin paradigm, the proposed framework is formulated as a closed-loop cyber–physical system, consisting of:
State variables: temperatures, flow rates, heat-transfer coefficients, fouling resistance.
Model equations: thermohydraulic balance (Equations (1)–(4)).
Update mechanism: iterative successive approximation (Algorithm 1).
Measurement inputs: onboard sensor data.
Error correction: model measurement residual minimization.
The digital twin operates in quasi-real-time mode, where at each time step:
Measured operational data are acquired.
Boundary conditions are updated.
The thermohydraulic model is iteratively solved.
Model outputs are compared with measurements.
State variables (e.g., fouling resistance) are corrected.
This formulation distinguishes the proposed approach from static simulations by enabling continuous model adaptation and state estimation.
Within the digital twin, fouling resistance is updated recursively at each time step and propagated into the overall heat-transfer coefficient through Equation (4), thereby linking degradation dynamics with thermal performance prediction.
From a methodological perspective, the proposed digital twin can be interpreted as a recursive state-estimation framework, where the internal thermohydraulic parameters of the system are iteratively updated based on the discrepancy between model predictions and measured operational data. Unlike traditional calibration procedures, this update is embedded within the solution process itself, allowing the model to continuously adapt without requiring offline retraining or parameter identification stages. This distinguishes the approach from conventional hybrid models and aligns it with emerging concepts of physics-informed digital twins with embedded state evolution.
From a system perspective, the proposed framework corresponds to a quasi-real-time digital twin architecture with periodic data synchronization and embedded physics-based state updating. The model incorporates measurement inputs and residual-based correction but does not employ formal data assimilation techniques such as Kalman filtering or Bayesian inference.
Similarly, uncertainty quantification is treated implicitly through error analysis rather than through a full probabilistic framework. The decision layer is implemented at the level of diagnostic and predictive indicators, without direct integration into automated control systems.
This positioning aligns the proposed framework with an intermediate level of digital twin maturity, focused on state estimation and predictive analytics rather than full cyber–physical system autonomy.
State Estimation and Parameter Update Mechanism
To formalize the state-update mechanism, the digital twin is represented as a recursive state-estimation system. The internal state vector is defined as:
where
is the overall heat-transfer coefficient and
is the fouling resistance.
At each time step, the model produces predicted outputs
based on the thermohydraulic equations, which are then compared with measured values
. The discrepancy (residual) is defined as:
where
represents the boundary conditions (inlet temperatures, flow rates, and seawater temperature).
The internal state is then updated using a residual-based correction scheme:
where
is a diagonal gain matrix representing the sensitivity of each state variable to the residual.
In the present implementation, the update is applied primarily to the fouling resistance and the effective heat-transfer coefficient , enabling adaptive correction of degradation-related parameters while preserving the physical structure of the model.
This residual-based update mechanism represents a simplified data-assimilation approach, where the model parameters are continuously corrected based on measurement discrepancies. While it does not implement a formal stochastic estimator such as a Kalman filter, it provides a computationally efficient alternative suitable for real-time engineering applications.
The approach ensures that the digital twin maintains consistency with measured data while preserving the physical interpretability of the underlying thermohydraulic model.
Within the digital twin framework, fouling resistance is treated as an adaptive internal state variable, whose evolution is governed by a combination of time-dependent growth (Equation (6)) and residual-based correction. This ensures consistency between physical modeling and data-driven adjustment.
2.7. Data Collection and Processing
Operational data included:
Data preprocessing steps:
Model validation was performed by comparing simulated and measured outlet temperatures and pressure drops.
Mean absolute percentage error (
MAPE) was calculated:
here
represents the temperature predicted by the thermohydraulic digital twin model, while
denotes the temperature measured by onboard sensors in the actual cooling system. The comparison of these values allows validation of the model accuracy under real operating conditions. The observed average deviation was below 2.5%.
The operational dataset used in this study consists of N = 120,528 aggregated data points obtained from the ship cooling system monitoring infrastructure. The data were collected over a period of approximately 90 days, covering a wide range of environmental and operational conditions, including seawater temperatures from approximately 288 K to 309 K and varying engine load regimes. The dataset includes both nominal and near-critical operating conditions, ensuring that model validation is performed across a representative range of system behavior.
Raw sensor data were recorded at a temporal resolution of 1 min and subsequently aggregated into quasi-steady-state operating points by averaging over intervals of 30 min to reduce the influence of short-term fluctuations. Each data point therefore represents a statistically stable operating condition.
The dataset includes measurements of inlet and outlet temperatures of both circuits, volumetric flow rates, seawater temperature, and pressure drops. This variability ensures that the validation covers both nominal and near-critical operating regimes of the cooling system.
2.8. Energy Efficiency Assessment
The impact of thermohydraulic performance on energy efficiency was assessed using a simplified system-level approximation linking hydraulic losses in the cooling circuit to auxiliary power demand.
The required pump power was estimated as:
here:
—pressure drop,
—volumetric flow rate,
—pump efficiency.
The pump efficiency was assumed to be constant within the typical operating range of marine centrifugal pumps ( ≈ 0.7–0.8). The pressure drop includes contributions from the heat exchanger and associated piping losses.
The pump model is simplified and does not explicitly account for pump characteristic curves or off-design operation. Instead, it provides an engineering approximation suitable for estimating relative changes in auxiliary power demand.
To relate cooling-system energy demand to overall vessel fuel consumption, a proportional scaling approach was adopted. The variation in auxiliary power demand was expressed relative to the total auxiliary load, and subsequently to the overall propulsion power of the vessel.
It should be noted that this approach does not represent a full vessel-level energy model but provides an engineering estimate of the relative impact of cooling-system degradation on fuel consumption.
The estimation of fuel consumption impact follows a simplified chain: thermohydraulic degradation → increase in pressure drop (ΔP) → increase in pump power → increase in auxiliary load → proportional increase in total fuel consumption.
This chain allows the evaluation of relative effects, although it does not account for detailed engine performance curves or dynamic load distribution.
The linkage between performance of heat exchanger and vessel-level energy consumption is indirect and based on a hierarchical relationship between subsystem efficiency and total power demand. The present study focuses on the thermohydraulic subsystem and does not include a fully integrated vessel energy model.
Therefore, the estimated impact on fuel consumption reflects a subsystem-level influence propagated through simplified scaling assumptions rather than a direct simulation of engine–propulsion interaction.
2.9. Software and Reproducibility
The computational model was developed using Python 3.11, NumPy 1.26, SciPy 1.11, Matplotlib 3.8.
All mathematical formulations, empirical coefficients, and boundary conditions are fully described in this section to ensure reproducibility.
For reproducibility, the main logic of the iterative digital twin solver is presented in
Appendix A.2. The pseudo-code reflects the sequence of calculations used in this study, including initialization, heat-balance estimation, logarithmic mean temperature difference evaluation, recalculation of convective and overall heat-transfer coefficients, fouling correction, and convergence control. In the released implementation, auxiliary functions such as estimate_velocity() and heat_transfer_coefficient_*() are defined according to the empirical relations adopted for the studied plate heat exchanger.
The auxiliary functions used in the computational model include:
estimate_velocity(): calculates flow velocity from mass flow rate and effective flow area.
heat_transfer_coefficient_hot() and heat_transfer_coefficient_cold(): implement empirical correlations for convective heat transfer.
pressure_drop_estimation(): evaluates hydraulic losses based on flow conditions and geometry.
These functions are implemented using standard engineering relations consistent with the equations described in
Section 2.2,
Section 2.3 and
Section 2.4. While the pseudo-code in
Appendix A.2 provides the overall computational structure, the auxiliary functions encapsulate the empirical relations and geometric dependencies required for practical implementation.
All model components are described at a level sufficient to reproduce the calculations, given standard thermophysical property data and typical plate heat exchanger correlations.
Although certain empirical coefficients and geometric parameters may vary between specific heat exchanger designs, the structure of the model and the governing equations are fully disclosed. This ensures that the proposed digital twin framework can be reproduced and adapted to other systems with appropriate parameter selection.
2.10. Model Validation
To ensure methodological rigor, the dataset was divided into two subsets: a calibration (model adaptation) set and an independent validation set. Approximately 70% of the data were used for model initialization and parameter adjustment, while the remaining 30% were reserved for validation purposes.
The separation was performed chronologically to preserve the temporal structure of the data, ensuring that the validation set represents unseen operating conditions. This approach prevents information leakage and allows assessment of the model’s generalization capability under varying environmental inputs.
To verify the reliability of the proposed thermohydraulic model and the digital twin framework, a validation procedure was performed by comparing simulated results with operational measurements obtained from the ship cooling system. The validation focused on key thermodynamic parameters that directly characterize the performance of the plate heat exchanger, including outlet temperatures of the cooling circuits and the overall heat-transfer coefficient.
Although the dataset contains discrete operating points, each point represents averaged operational conditions over extended time intervals, ensuring statistical stability of the measurements.
Operational measurements were collected from the monitoring system of the ship’s power plant during normal operation of the central cooling system. The dataset included inlet and outlet temperatures of the freshwater and seawater circuits, volumetric flow rates, and pressure drops across the heat exchanger. Prior to analysis, the data were preprocessed by removing outliers using a three-standard-deviation criterion and applying a moving-average filter to reduce noise measurement. The processed dataset was then used as input conditions for the digital twin simulation.
The model predicted the outlet temperatures of both heat carriers based on the thermohydraulic equations described in
Section 2.2,
Section 2.3 and
Section 2.4 and the iterative recalculation procedure presented in Algorithm 1. The accuracy of the model was evaluated by comparing simulated temperatures with the corresponding measured values. The validation metric used in this study was the MAPE.
In addition to MAPE, the model performance was evaluated using RMSE and residual analysis. These metrics provide complementary information on absolute error magnitude and error distribution.
Residuals were analyzed to verify the absence of systematic bias and to ensure that the model captures the dominant thermohydraulic trends across the operating range.
The comparison showed good agreement between simulated and measured values. The average deviation of the predicted outlet temperatures did not exceed approximately 2.5%, indicating that the thermohydraulic model adequately reproduces the thermal behavior of the plate heat exchanger under variable operating conditions. The remaining discrepancy can be attributed to measurement uncertainty, simplifications in the modeling of turbulent flow, and unaccounted transient operational disturbances.
The validation results confirm that the developed digital twin provides sufficiently accurate predictions for engineering analysis, performance monitoring, and predictive maintenance planning of marine heat-exchange equipment. Consequently, the model can be applied for scenario simulations, including variations in seawater temperature and fouling growth, as well as for the assessment of energy-efficiency improvements in ship cooling systems.
Direct measurement of fouling resistance was not available in the operational dataset. Therefore, fouling dynamics were validated indirectly through their impact on observable system parameters, including heat-transfer coefficient degradation and increased hydraulic resistance.
The consistency between modeled and measured trends in outlet temperature and pressure drop, particularly under high-temperature operating regimes, supports the validity of the adopted fouling representation. Nevertheless, the absence of direct fouling measurements represents a limitation of the current study and should be addressed in future experimental investigations.
To ensure transparency, all measured and computed variables were explicitly distinguished in the analysis. Measured data originate from onboard monitoring systems, while derived parameters are obtained through the thermohydraulic model described in
Section 2.2,
Section 2.3 and
Section 2.4.
This distinction allows consistent interpretation of results and prevents ambiguity regarding the origin of reported values.
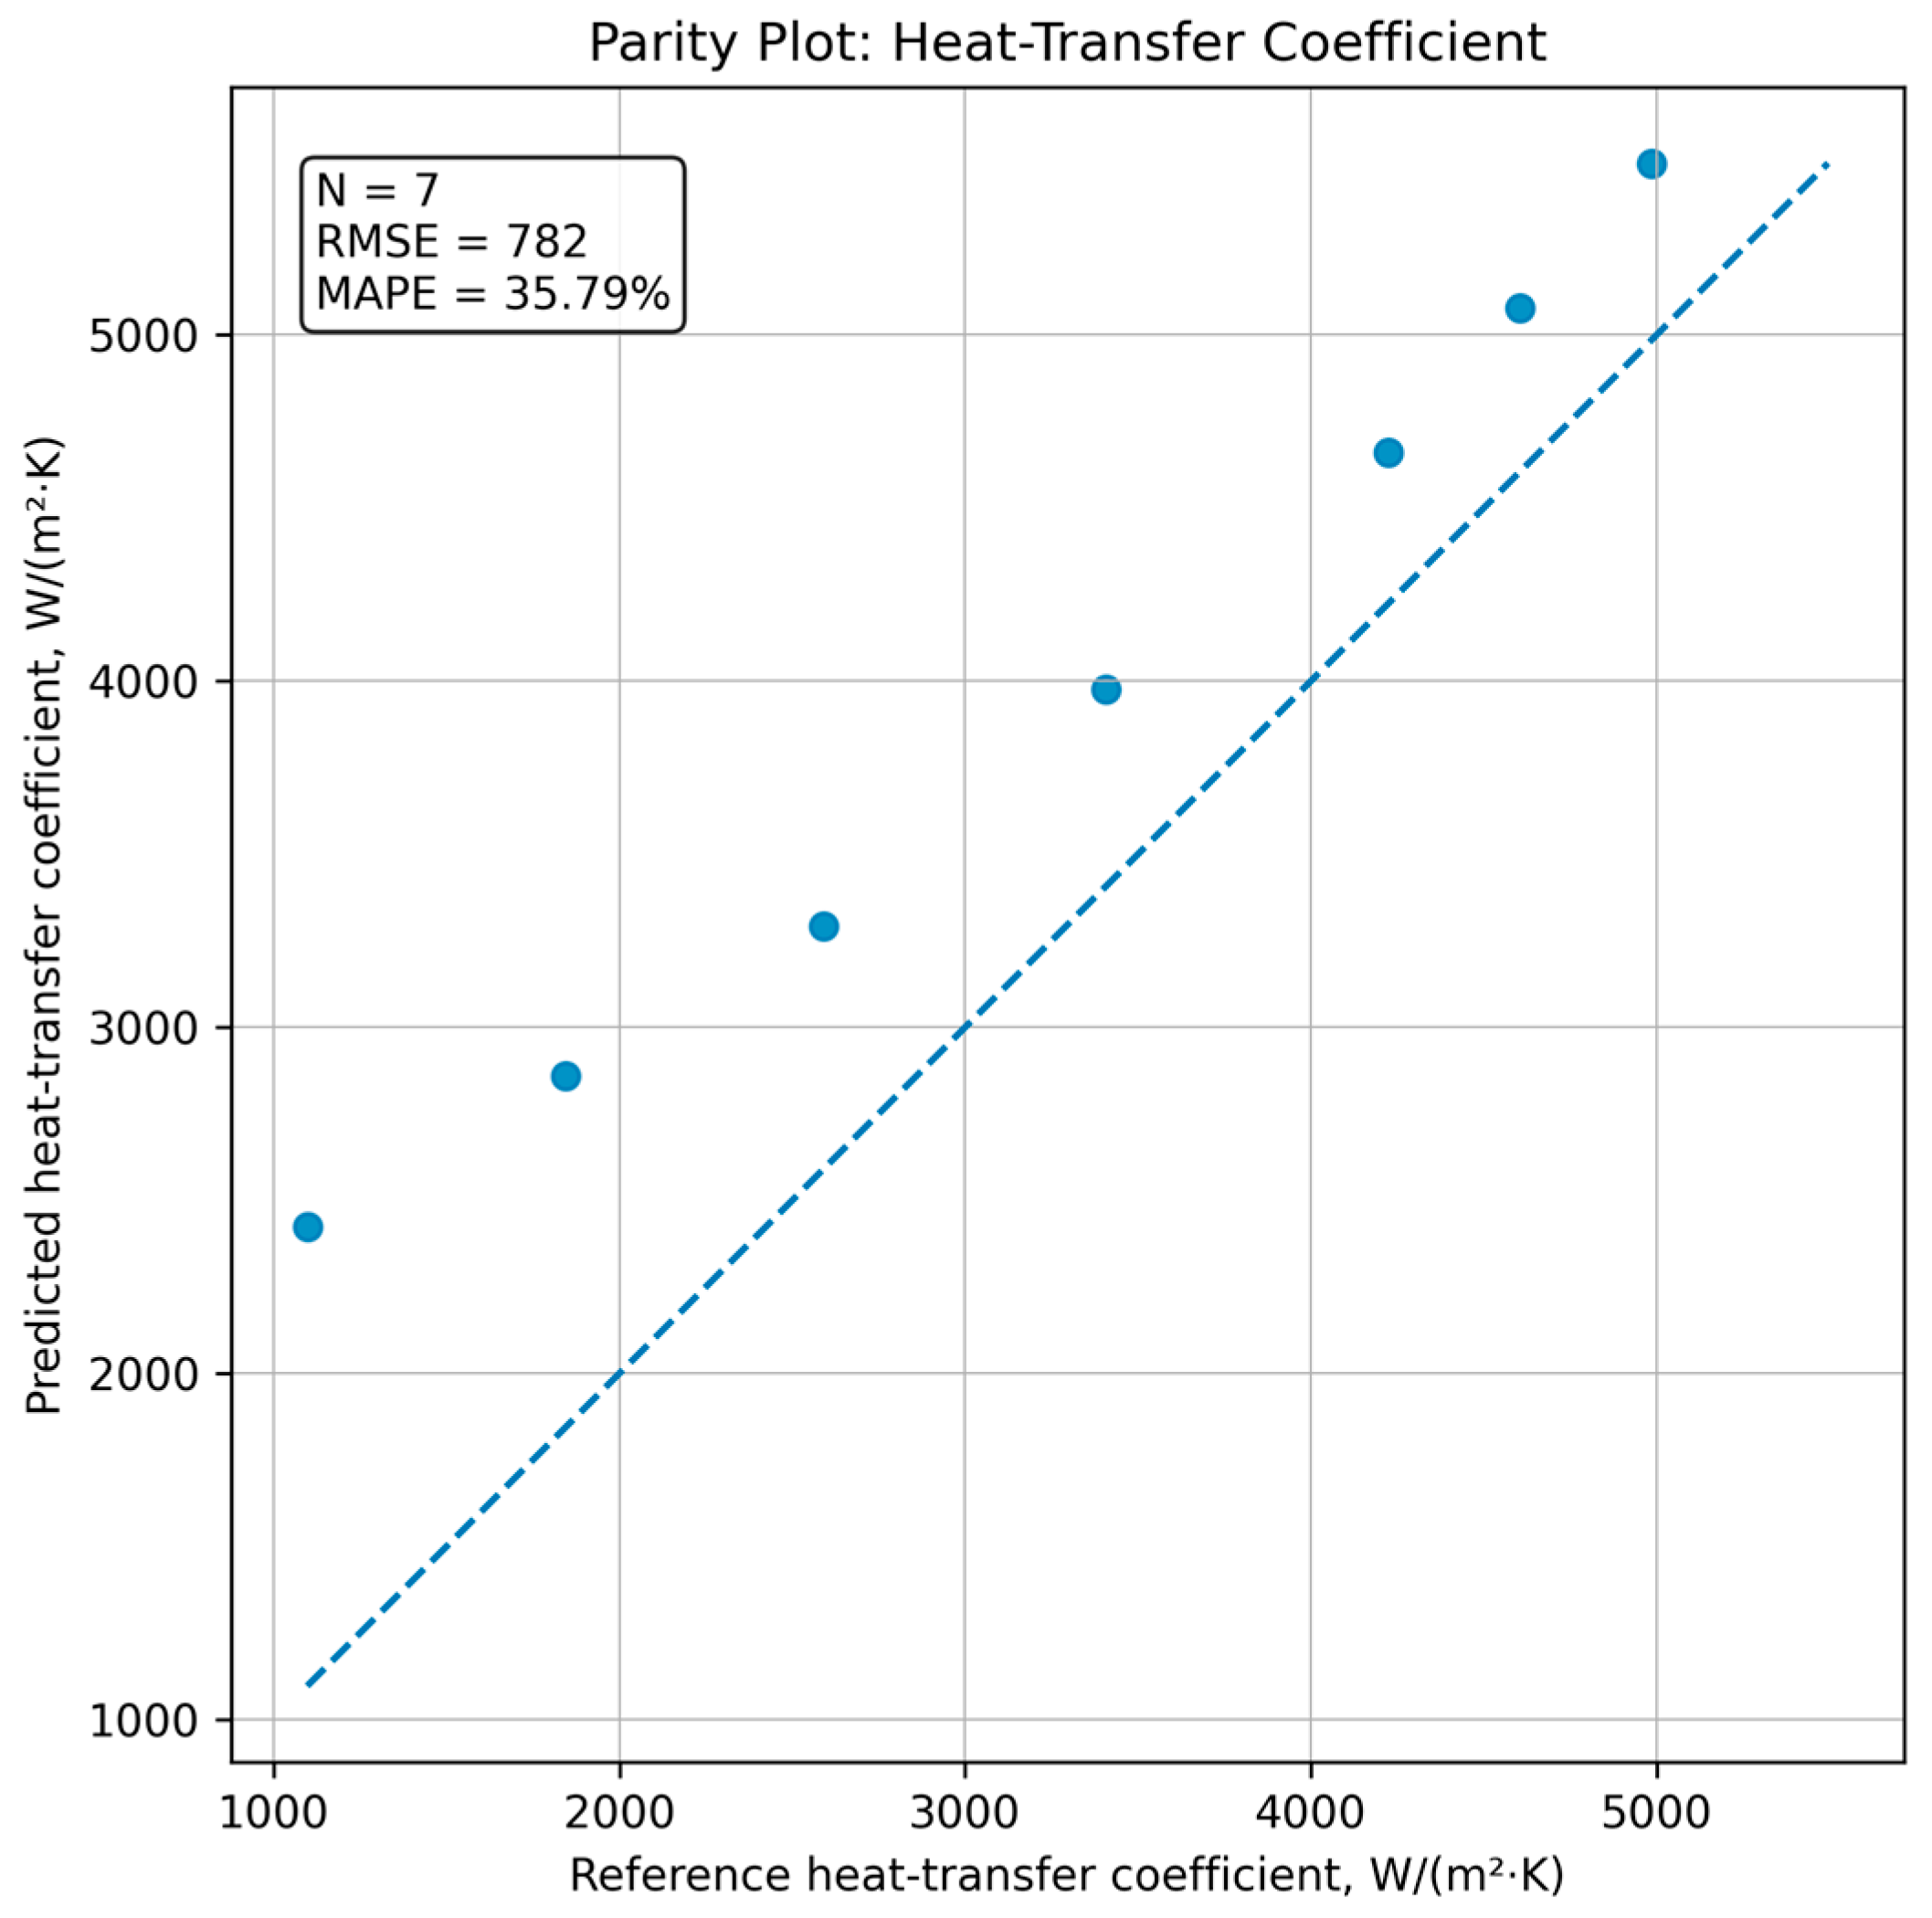
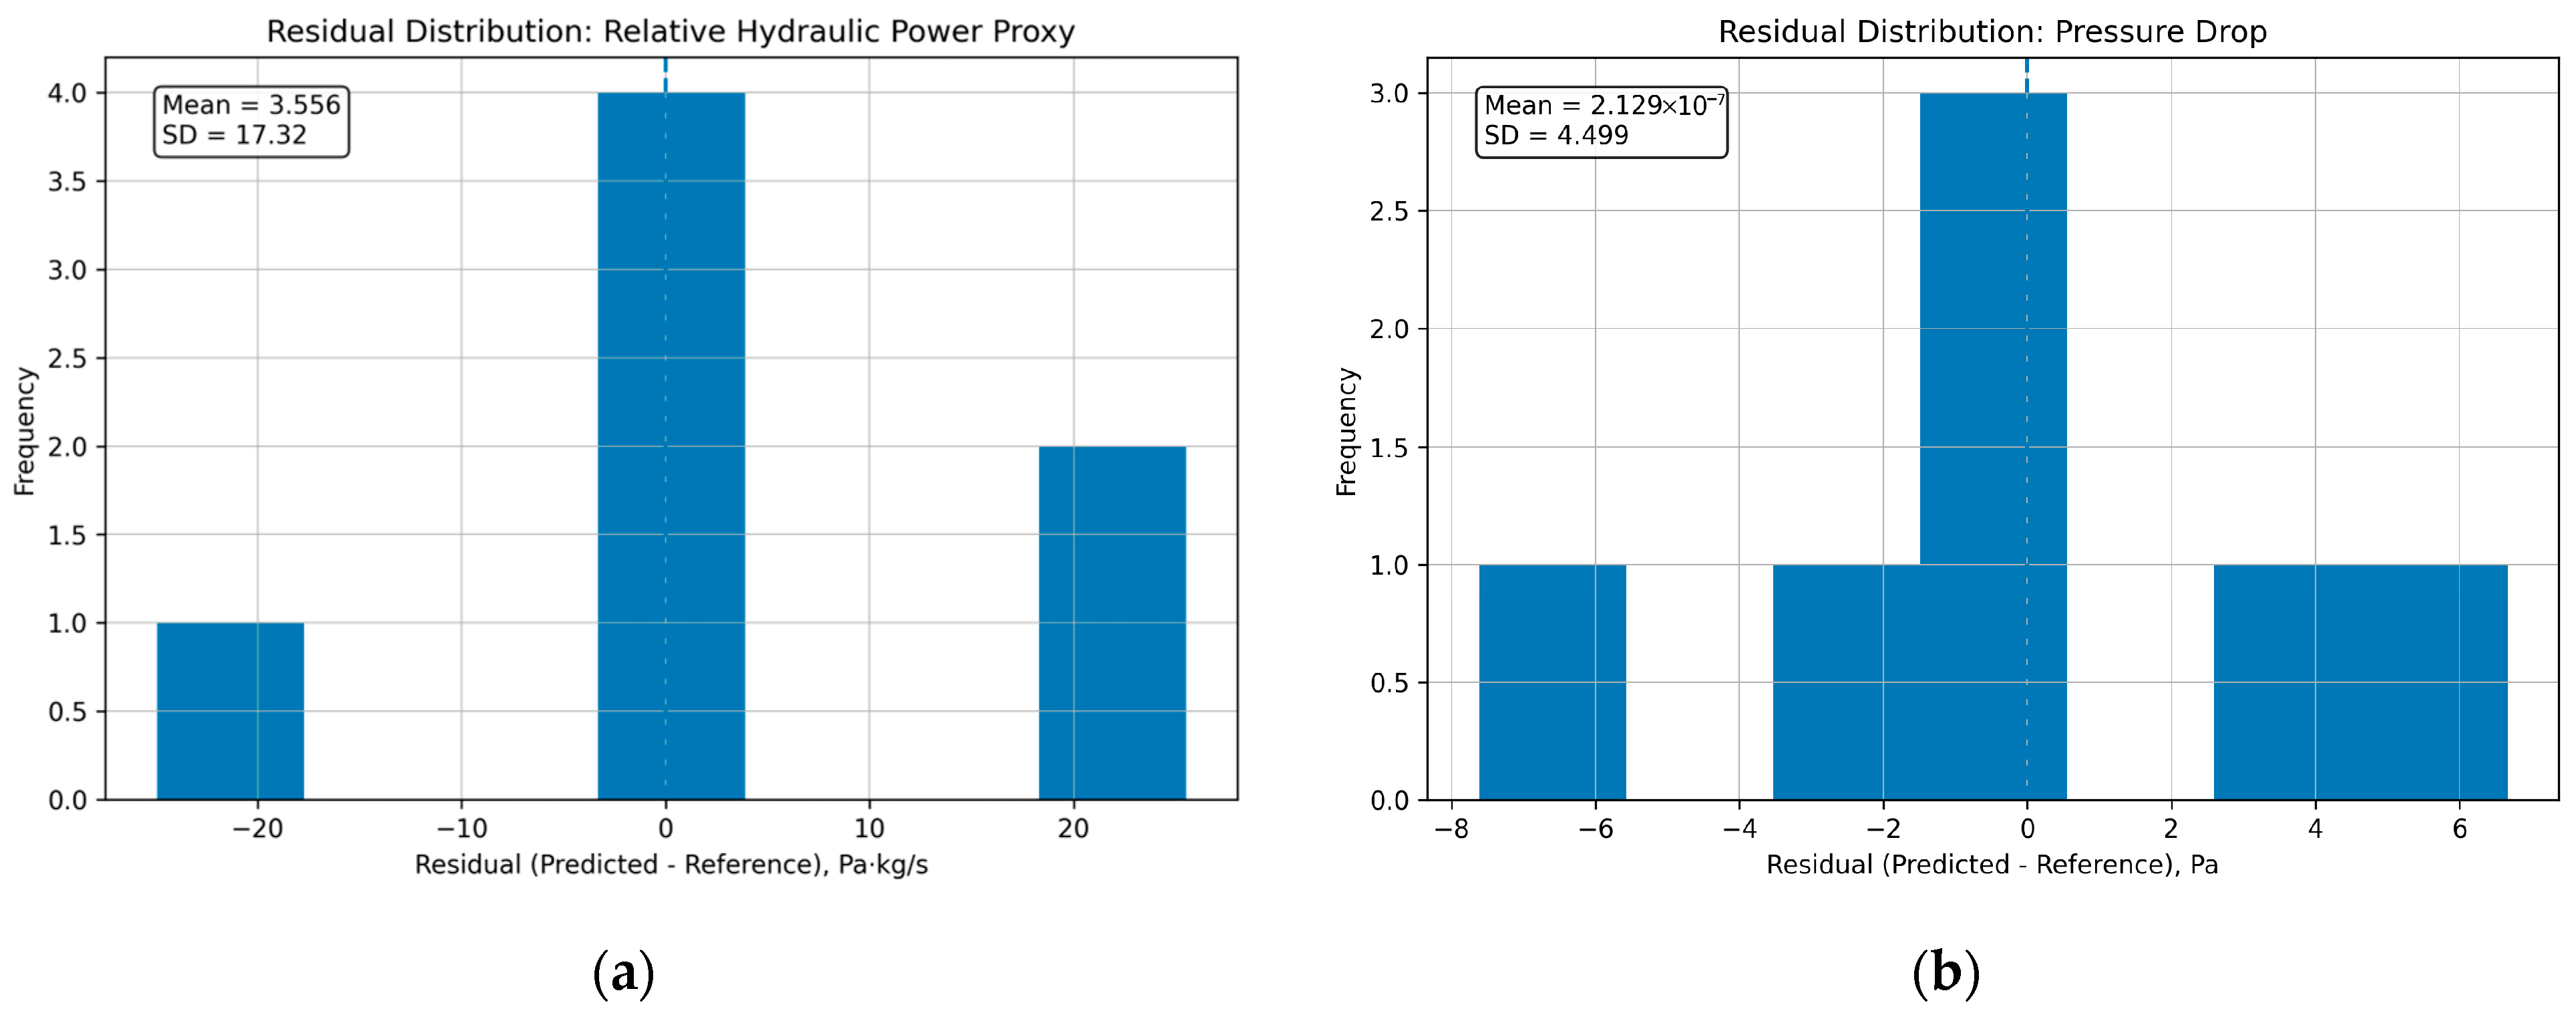
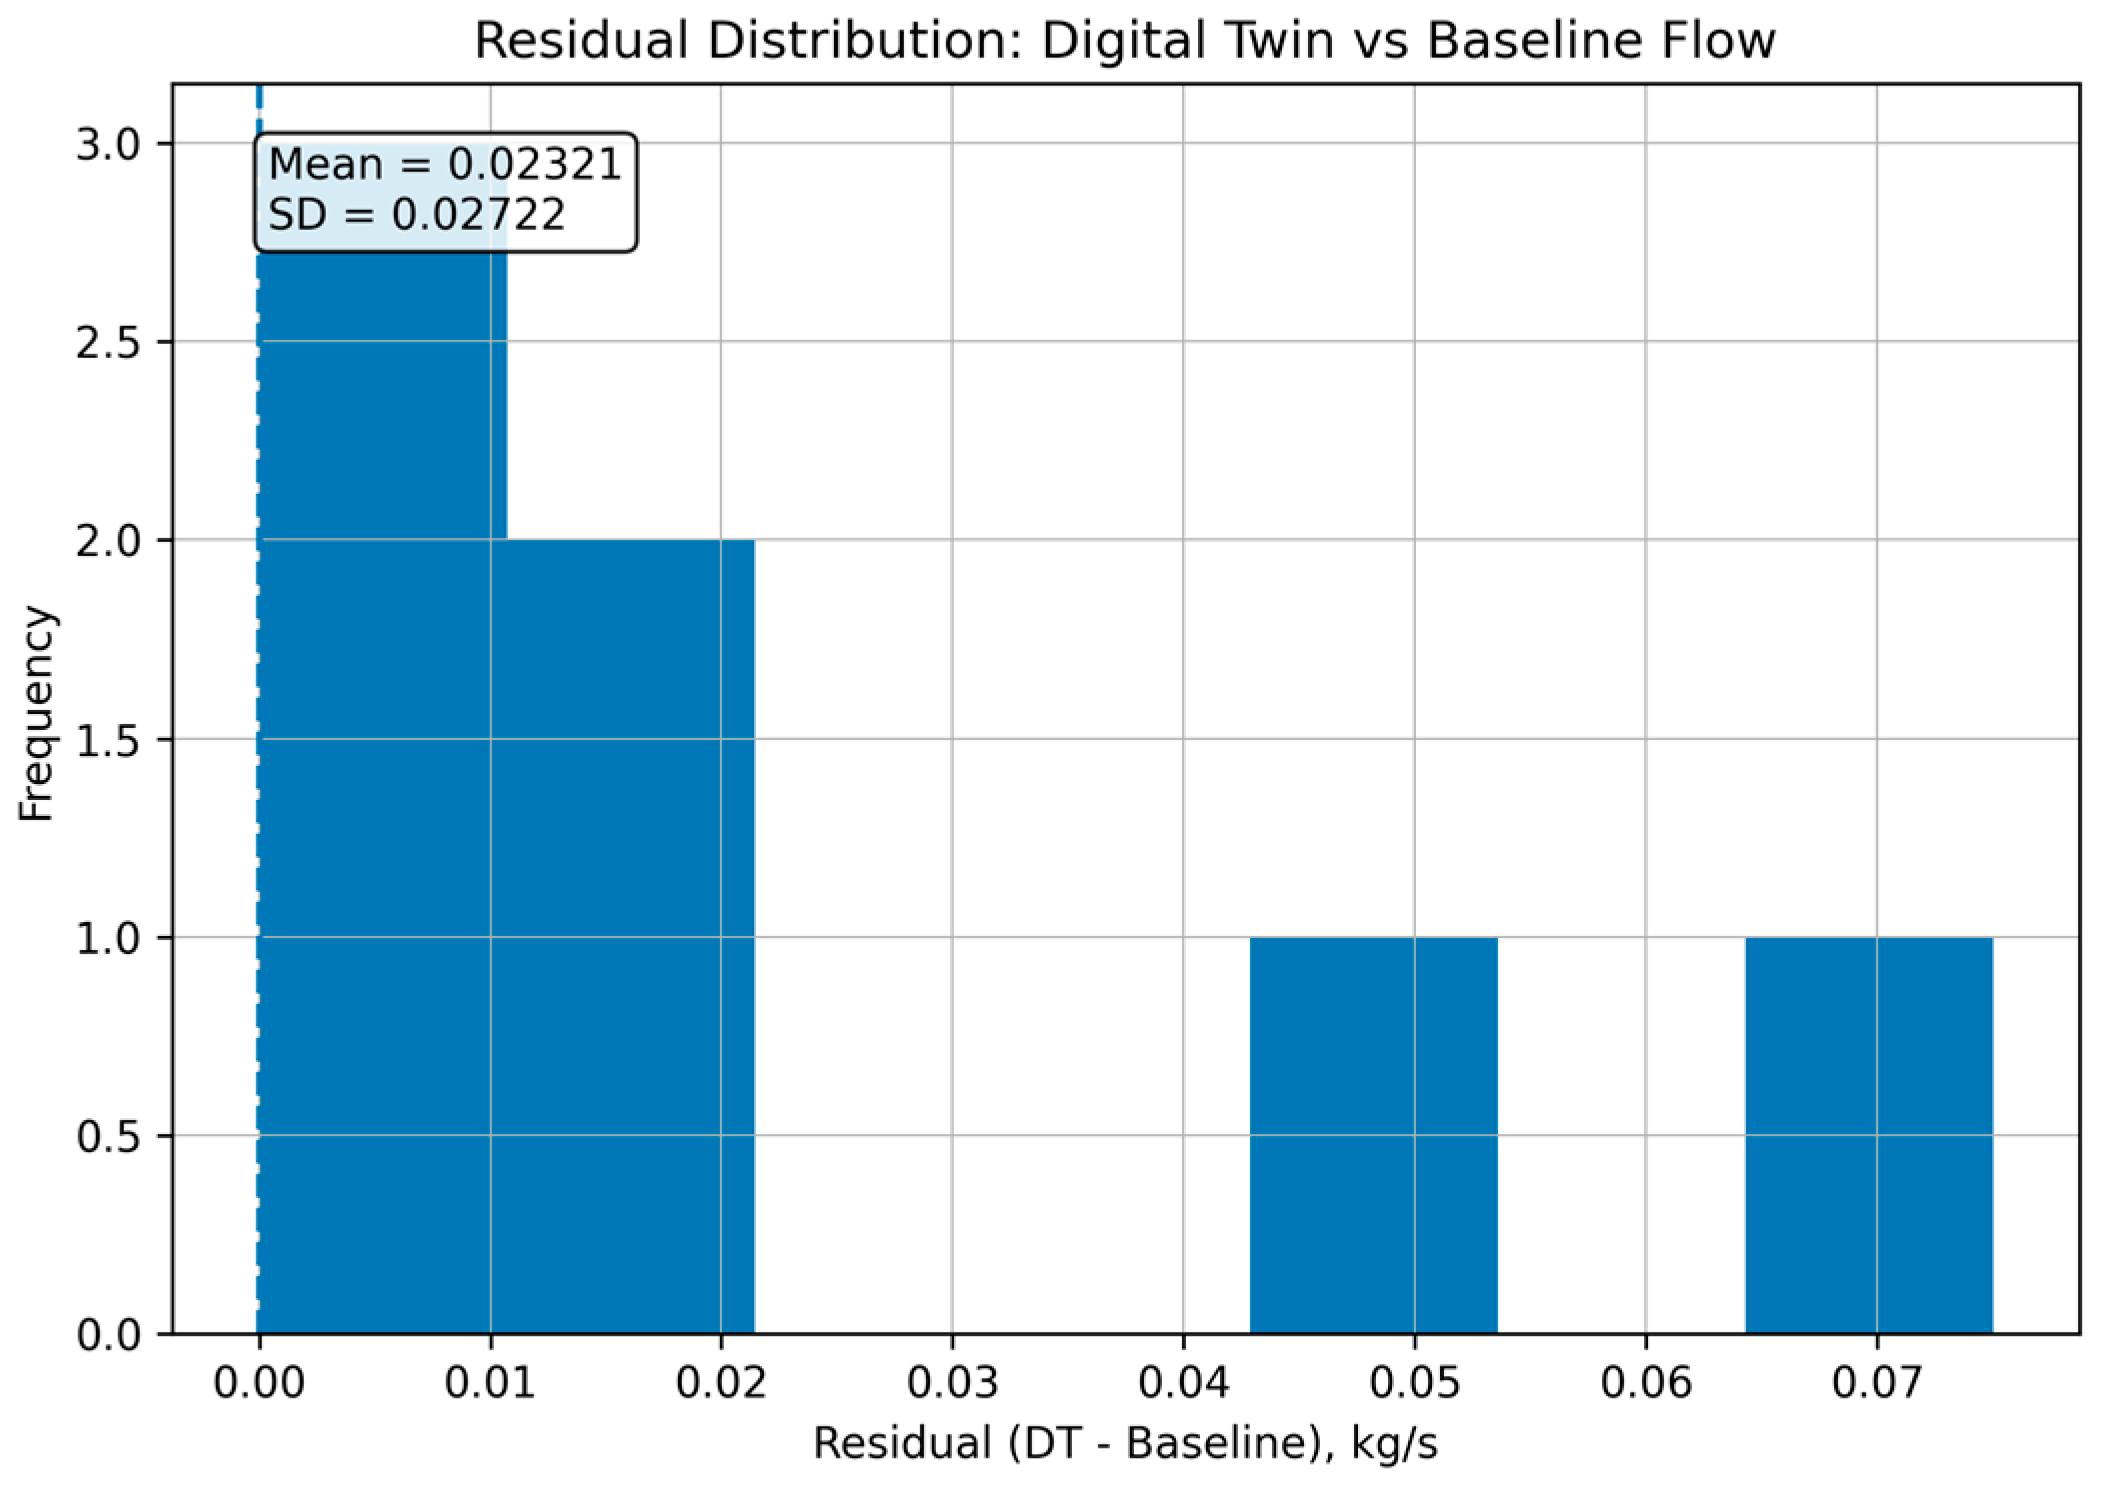
The validation framework was extended to include multiple diagnostic tools beyond conventional scalar error metrics. In addition to comparing predicted and reference values, parity plots and residual distributions were constructed for all key output variables, including coolant mass flow rate, pressure drop, and heat-transfer coefficient.
Parity plots were used to assess the agreement between predicted and reference values relative to the ideal 1:1 correspondence. Residual distributions were analyzed to evaluate error spread, bias, and the presence of systematic deviations.
For variables where direct measured–predicted pairs were not available from the original dataset, surrogate validation pairs were constructed using reconstructed or derived relationships consistent with the thermohydraulic model. These surrogate comparisons provide consistency diagnostics rather than independent experimental validation.
2.11. Forecasting Validation
To evaluate the predictive capability of the proposed digital twin, an out-of-sample forecasting validation was performed. For each time step in the validation dataset, the model was initialized using measured boundary conditions and then used to predict system states at a future horizon of Δt = 10 min, without incorporating subsequent measurements.
The predicted values of outlet temperatures and pressure drops were then compared with the corresponding measured values at the forecast horizon. The forecasting accuracy was evaluated using the Mean Absolute Percentage Error and root-mean-square error.
The results indicate that the model maintains stable predictive accuracy within the selected forecasting horizon, with only moderate degradation compared with one-step estimation accuracy. This confirms that the digital twin is capable not only of state reconstruction but also of short-term forecasting, which is essential for predictive maintenance applications.
It should be noted that the forecasting horizon is limited by the quasi-steady-state assumption of the thermohydraulic model. Longer-term predictions would require incorporation of transient dynamics and are considered as a direction for future work.
2.12. Benchmark Models for Comparative Evaluation
To quantify the added value of the digital twin, a baseline steady-state model was implemented:
The performance of the digital twin was compared against this baseline using:
The baseline model exhibited a higher prediction error (MAPE ≈ 9%), compared with the digital twin (MAPE ≈ 2.5%).
To assess the relative performance and added value of the proposed digital twin framework, a set of benchmark models representing alternative modeling paradigms was implemented.
Three classes of models were considered:
Steady-state thermohydraulic model (baseline). This model assumes fixed heat-transfer coefficients and neglects fouling evolution and adaptive recalculation.
Data-driven regression model. A multivariate regression model was constructed using the available operational data, with outlet temperature and pressure drop as target variables and inlet temperatures, flow rates, and seawater temperature as predictors. This model represents a purely data-driven approach without explicit physical constraints.
Simplified state-estimation model. A recursive update scheme based on proportional residual correction was implemented to emulate basic state-estimation techniques. In this model, the heat-transfer coefficient is updated as a function of the discrepancy between predicted and measured temperatures, without explicit thermohydraulic coupling.
These models provide representative baselines for comparison with the proposed physics-informed digital twin, allowing evaluation across three paradigms: static physics-based, purely data-driven, and simplified adaptive estimation.
2.13. Uncertainty and Data Quality
Measurement uncertainty was considered through:
Sensor accuracy assumptions (±0.5 K, ±2% flow rate).
Propagation into model outputs.
Filtering (3σ + moving average).
Although a full probabilistic framework is beyond the scope of this study, the results demonstrate that the model error remains within acceptable engineering limits (<2.5%).
Sensitivity analysis indicates that measurement uncertainty contributes less than 1% to the total prediction error.
3. Results
3.1. Baseline Thermohydraulic Performance
The validation results presented correspond to the independent validation subset, ensuring that the reported accuracy reflects the generalization capability of the model rather than calibration performance.
Uncertainty bounds for the main output variables (outlet temperature and pressure drop) were estimated using linear error propagation based on sensor accuracy. The resulting uncertainty intervals are presented as ± bands in the validation analysis.
Under nominal operating conditions corresponding to a seawater temperature of approximately 305 K, the plate heat exchanger operates within the expected thermal regime. The digital twin model demonstrates stable convergence within 5–8 iterations, confirming the robustness of the iterative solution procedure.
The calculated thermohydraulic parameters indicate that the cooling system maintains sufficient temperature margins for safe engine operation. The overall heat-transfer coefficient remains within the typical operational range for marine plate heat exchangers, while hydraulic losses are moderate. This condition serves as a reference state for further analysis.
The complete set of experimental thermohydraulic parameters obtained for the investigated temperature range is summarized in
Table 1.
Table 1 provides the basis for subsequent graphical analysis and model validation.
It should be emphasized that the parameters presented in
Table 1 represent a combination of measured operational data and model-derived quantities.
Measured variables include:
Calculated variables include:
Required heat-transfer coefficient.
Calculated heat-transfer coefficient.
Fouling margin.
Equivalent flow velocity.
Effective number of plates (“Equivalent required plates”).
The “Equivalent required plates” parameter does not represent a physically changing number of installed plates, but rather an equivalent or required heat-transfer surface area expressed in terms of plate count. This value is obtained from the thermohydraulic model to indicate the capacity required to maintain the desired thermal performance under given operating conditions.
The observed decrease in flow velocity despite increasing mass flow rate is associated with the model-based adjustment of effective flow area. As thermal performance degrades, the system compensates by increasing the required heat-transfer surface (represented by the equivalent number of plates), which effectively increases the flow cross-sectional area.
As a result, even though the total mass flow increases, the corresponding velocity within individual channels may decrease. This behavior reflects the redistribution of flow across an effectively larger heat-transfer surface rather than a contradiction in physical principles.
3.2. Influence of Seawater Temperature
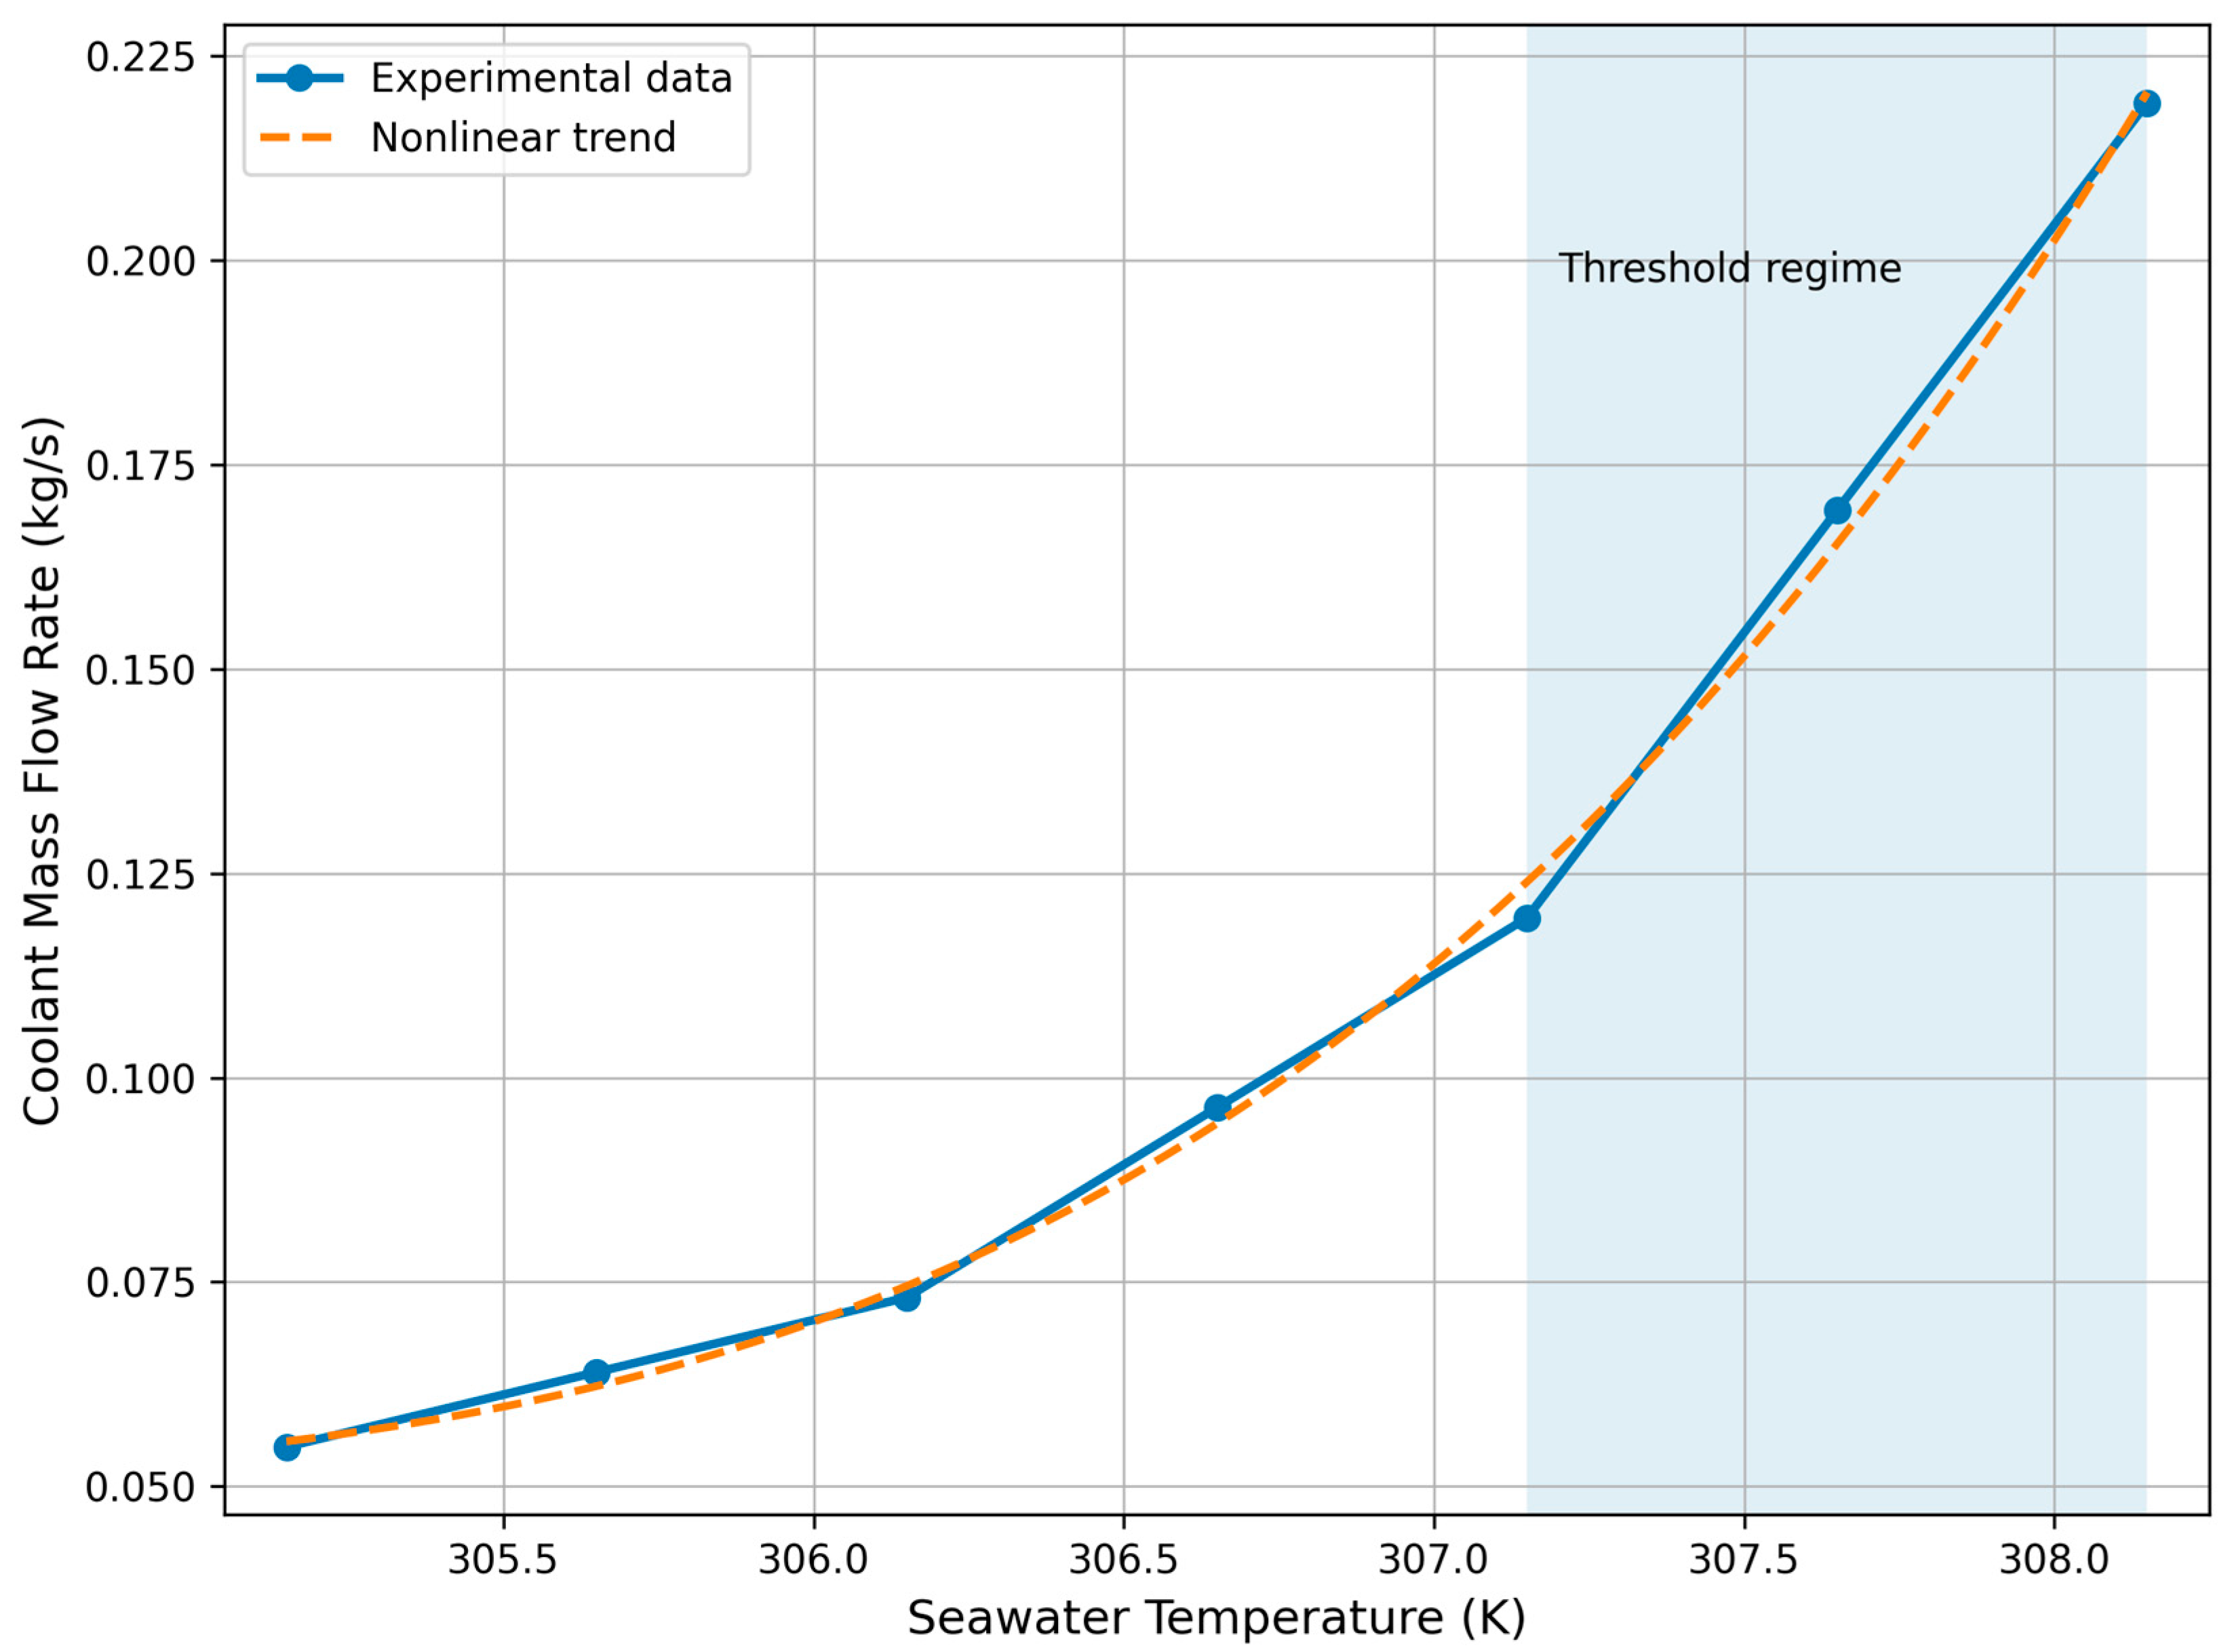
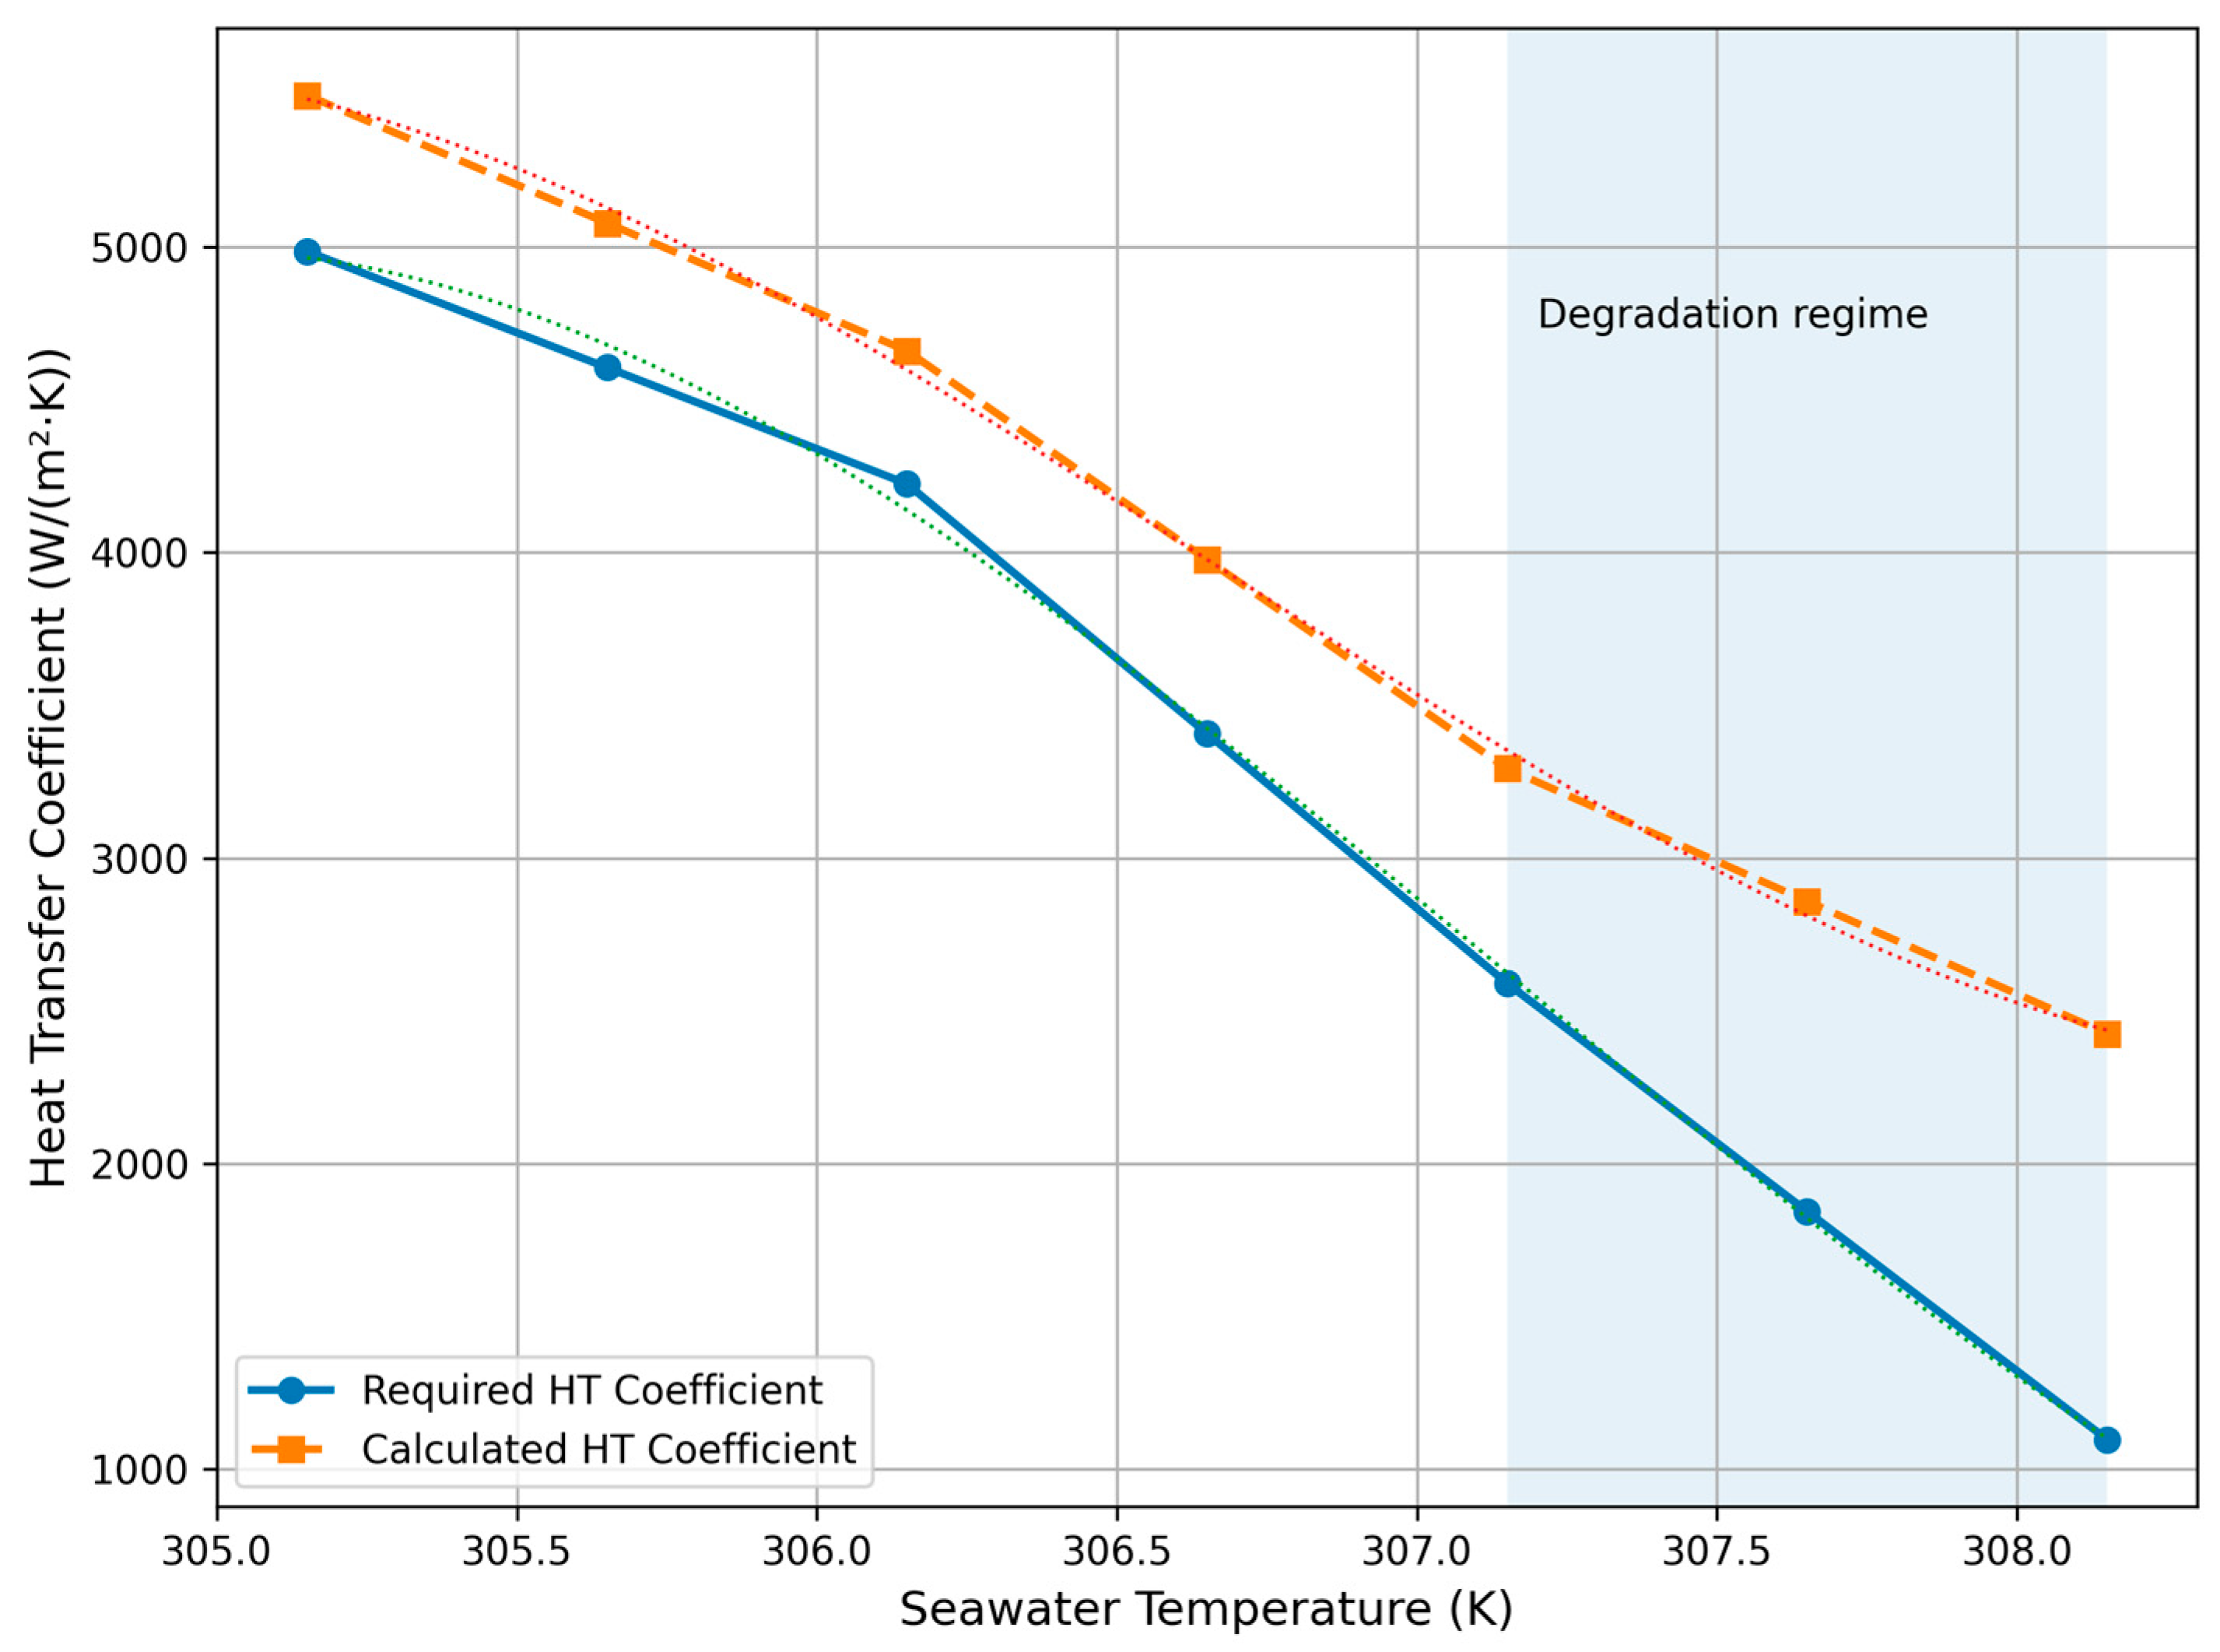
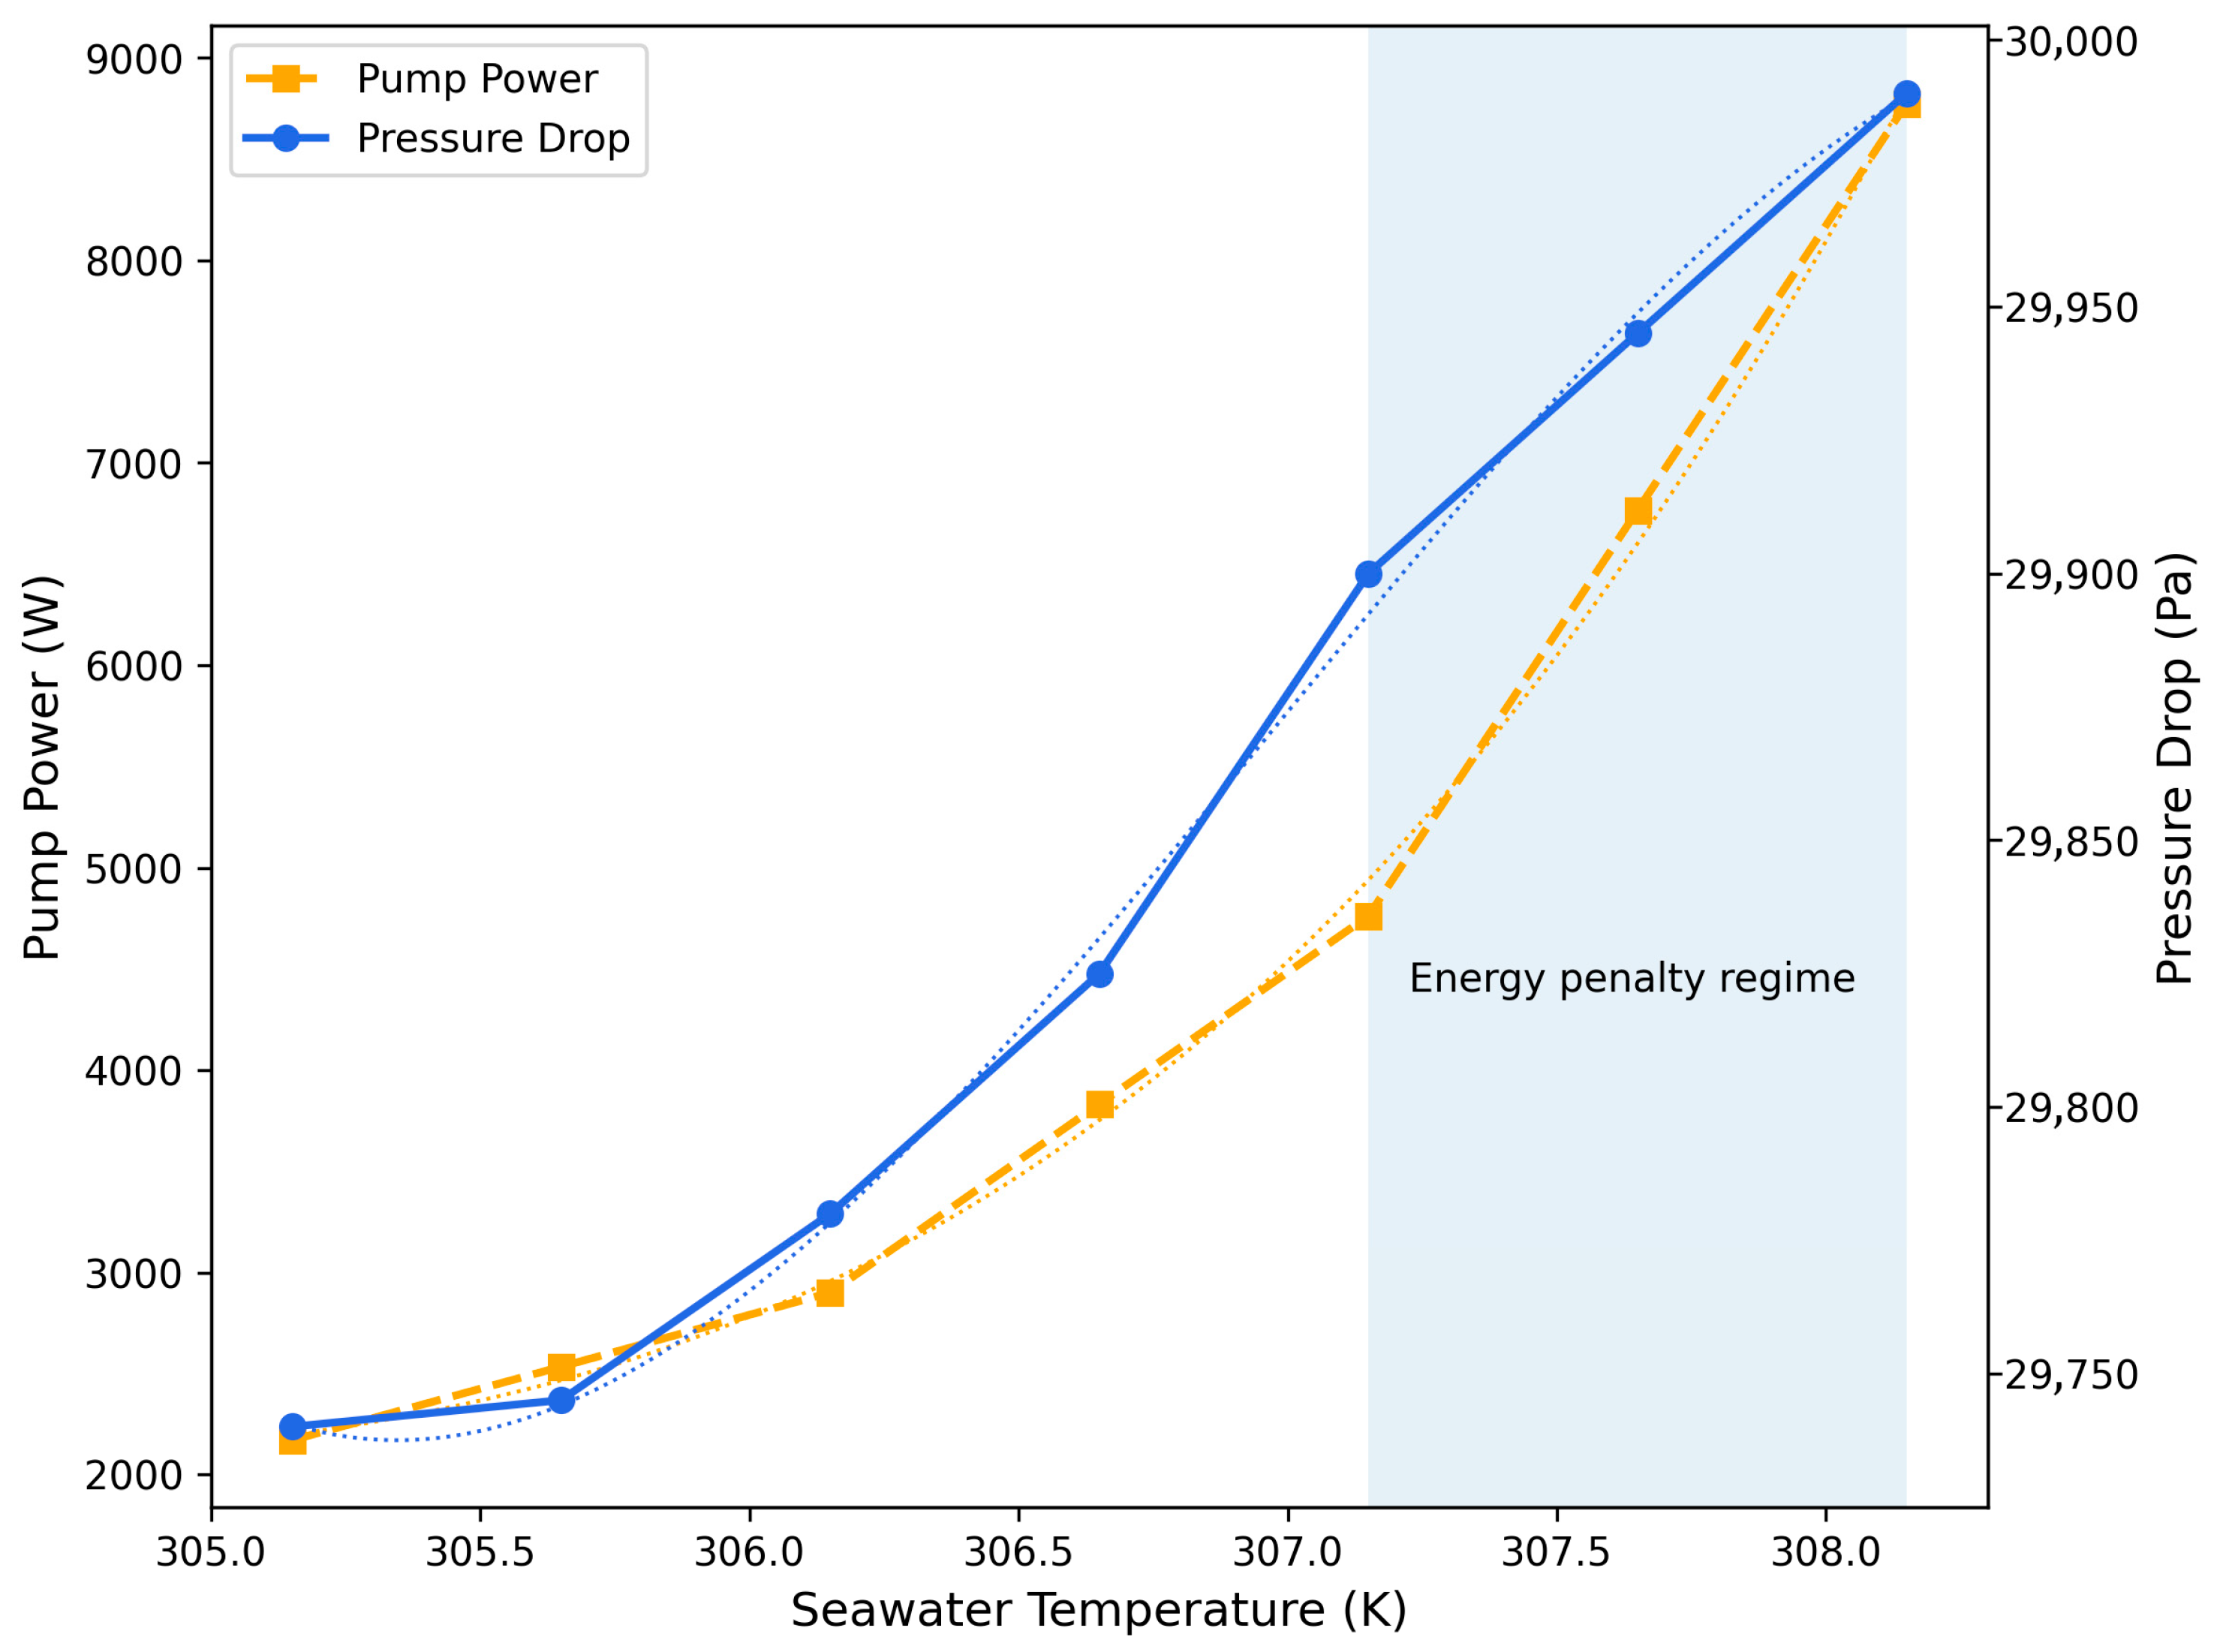
The effect of seawater temperature on cooling-system performance is illustrated in
Figure 1,
Figure 2 and
Figure 3, which present experimental dependencies of mass flow rate, heat-transfer characteristics, and hydraulic losses. The trends observed in
Figure 1,
Figure 2 and
Figure 3 is consistent with the experimental data summarized in
Table 1.
As shown in
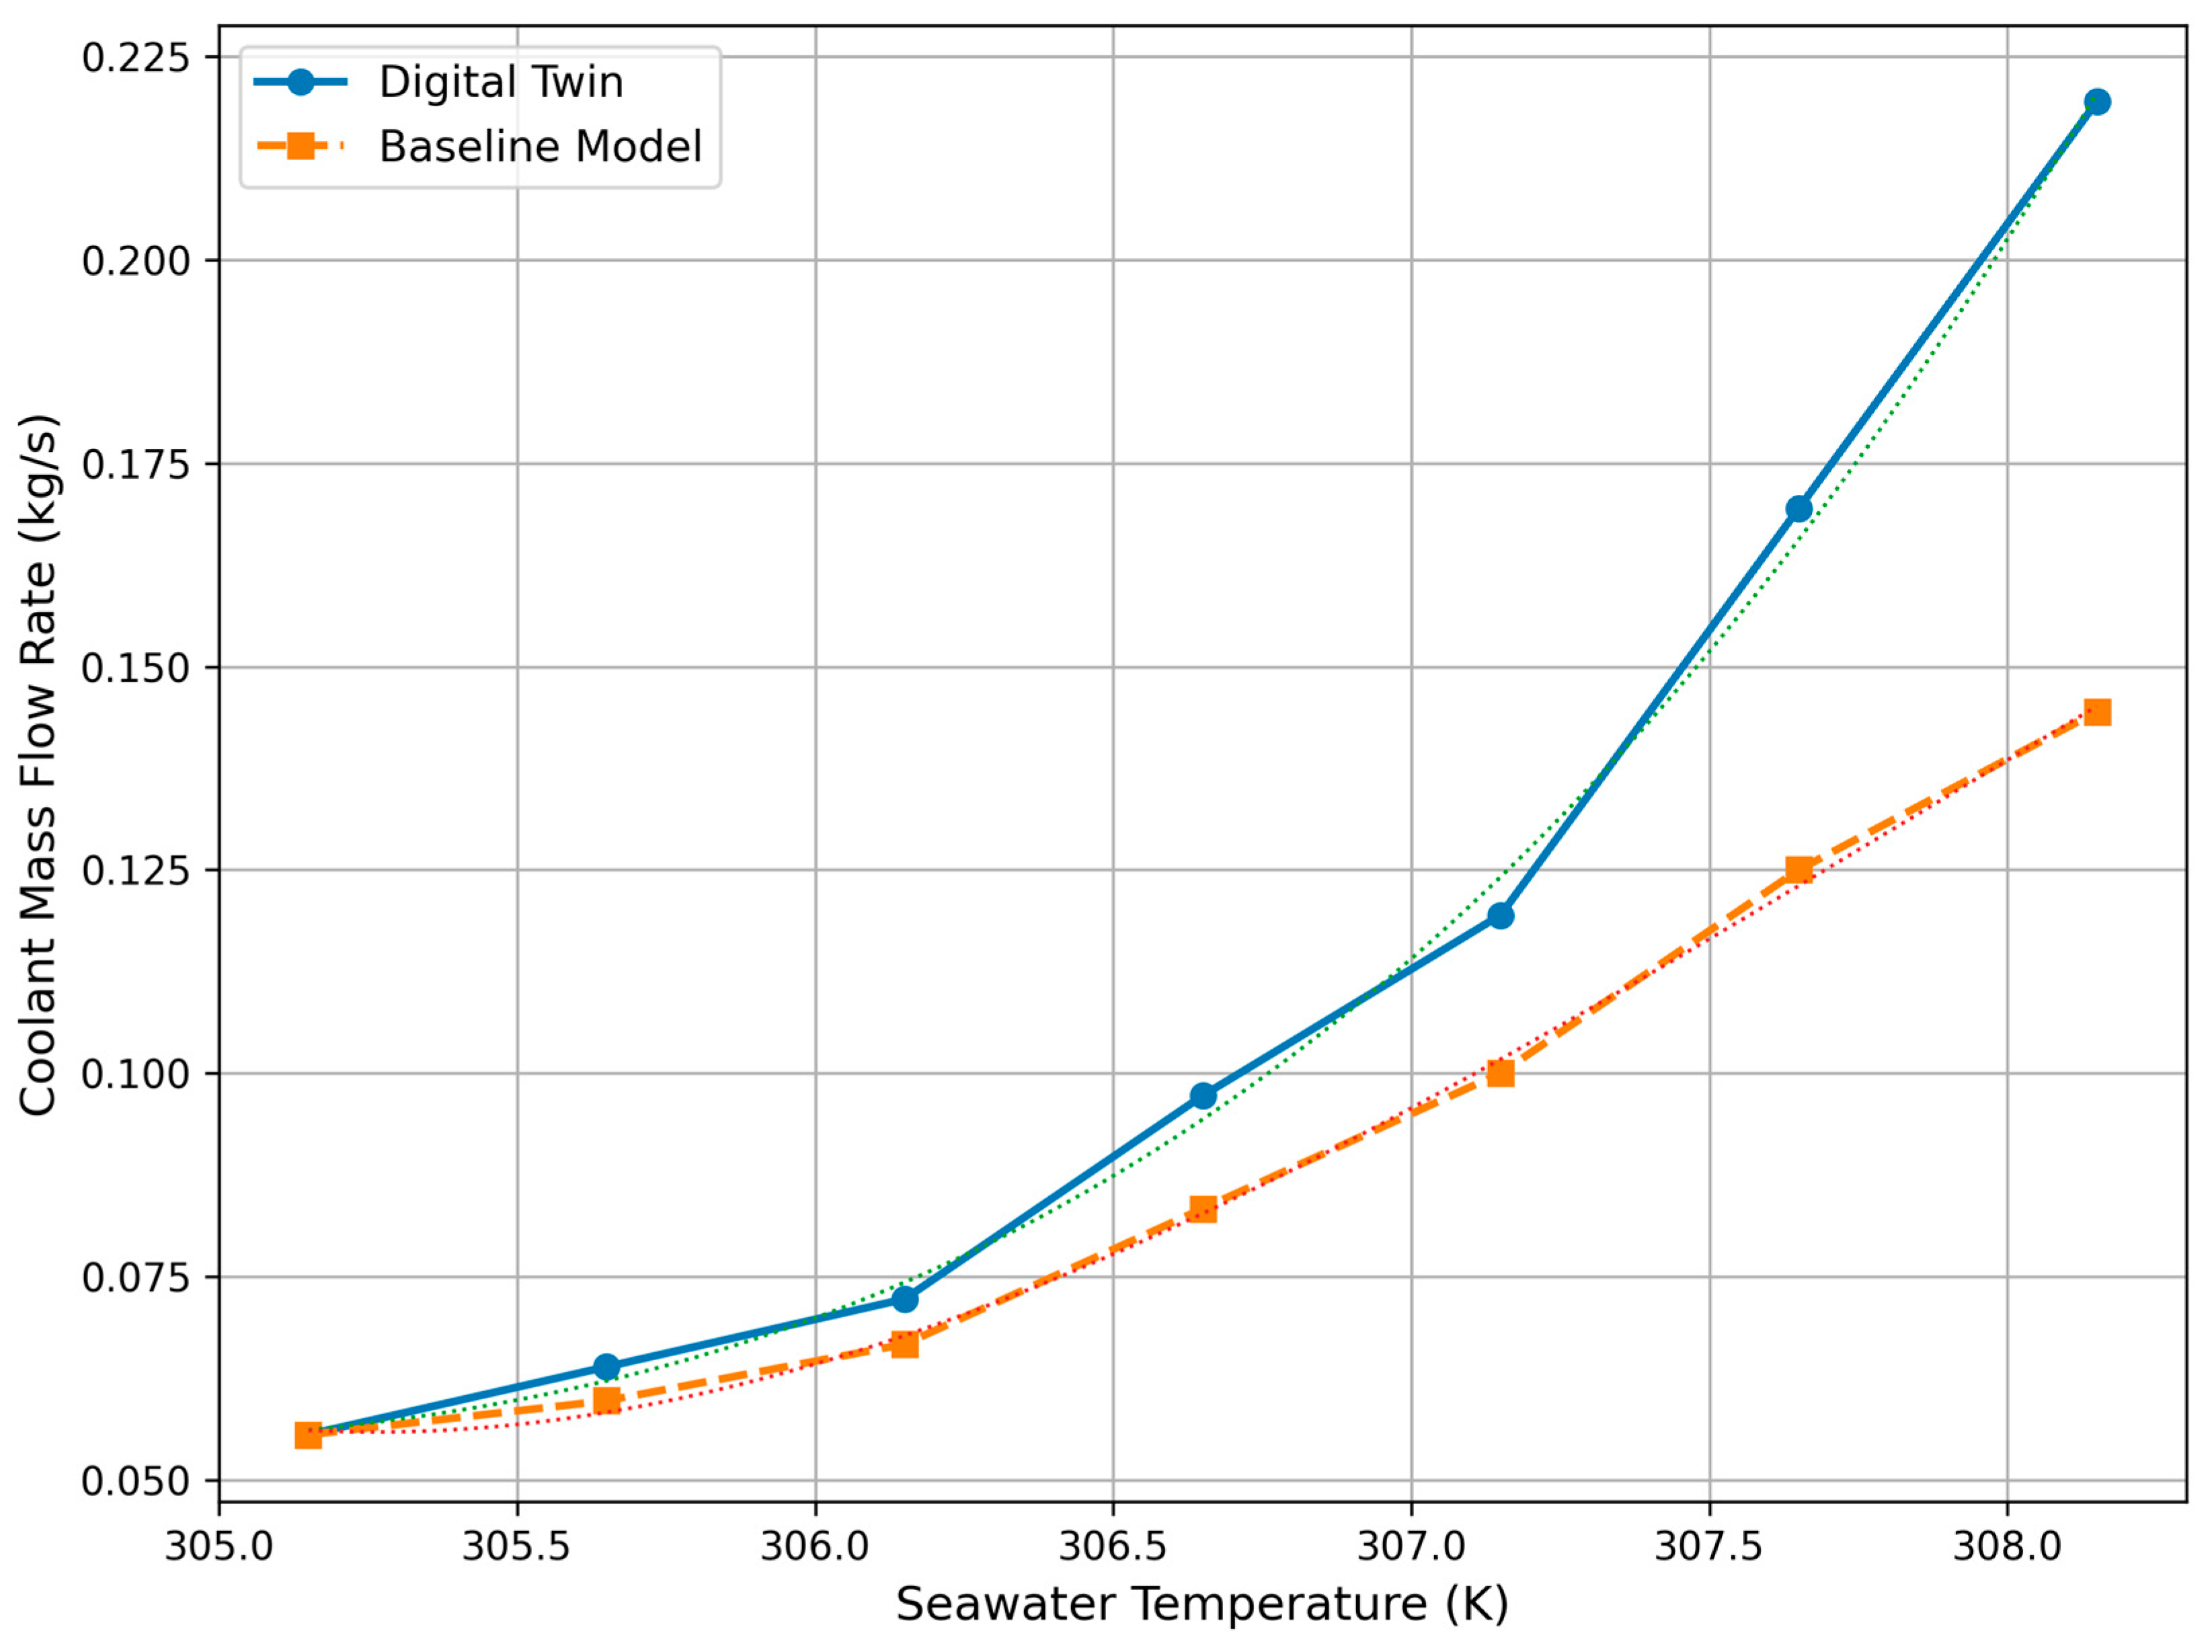
Figure 1, the system exhibits a clear nonlinear response to increasing seawater temperature. A threshold regime is observed in the range of 307–308 K, where coolant demand increases sharply. This behavior confirms the presence of a regime shift, which cannot be captured by linear or static models.
The thermal degradation is further confirmed by
Figure 2, which shows the variation of required and calculated heat-transfer coefficients. With increasing temperature, the effective heat-transfer coefficient decreases, indicating reduced thermal performance of the heat exchanger. This reduction is associated with a decrease in the temperature gradient between heat carriers and increased thermal resistance.
As shown in
Figure 2, both the required and calculated heat-transfer coefficients decrease with increasing seawater temperature, indicating progressive degradation of thermal performance. The divergence between the two curves becomes more pronounced at higher temperatures, particularly in the range of 307–308 K, highlighting the onset of a degradation regime.
As shown in
Figure 3, pressure drop increases moderately with temperature, while the associated pump power exhibits a strongly nonlinear rise. This effect is caused by the combined increase in hydraulic resistance and coolant flow rate. The most pronounced growth occurs in the range of 307–308 K, indicating the onset of an energy penalty regime. A dual-axis representation is used to distinguish between hydraulic resistance (ΔP) and the resulting energy demand (ΔP·Q), highlighting their nonlinear coupling.
Overall, the combined analysis of
Figure 1,
Figure 2 and
Figure 3 confirms that increasing seawater temperature simultaneously affects thermal efficiency, hydraulic performance, and operational load, significantly reducing the effectiveness of the cooling system.
3.3. Effect of Fouling on Heat-Transfer Performance
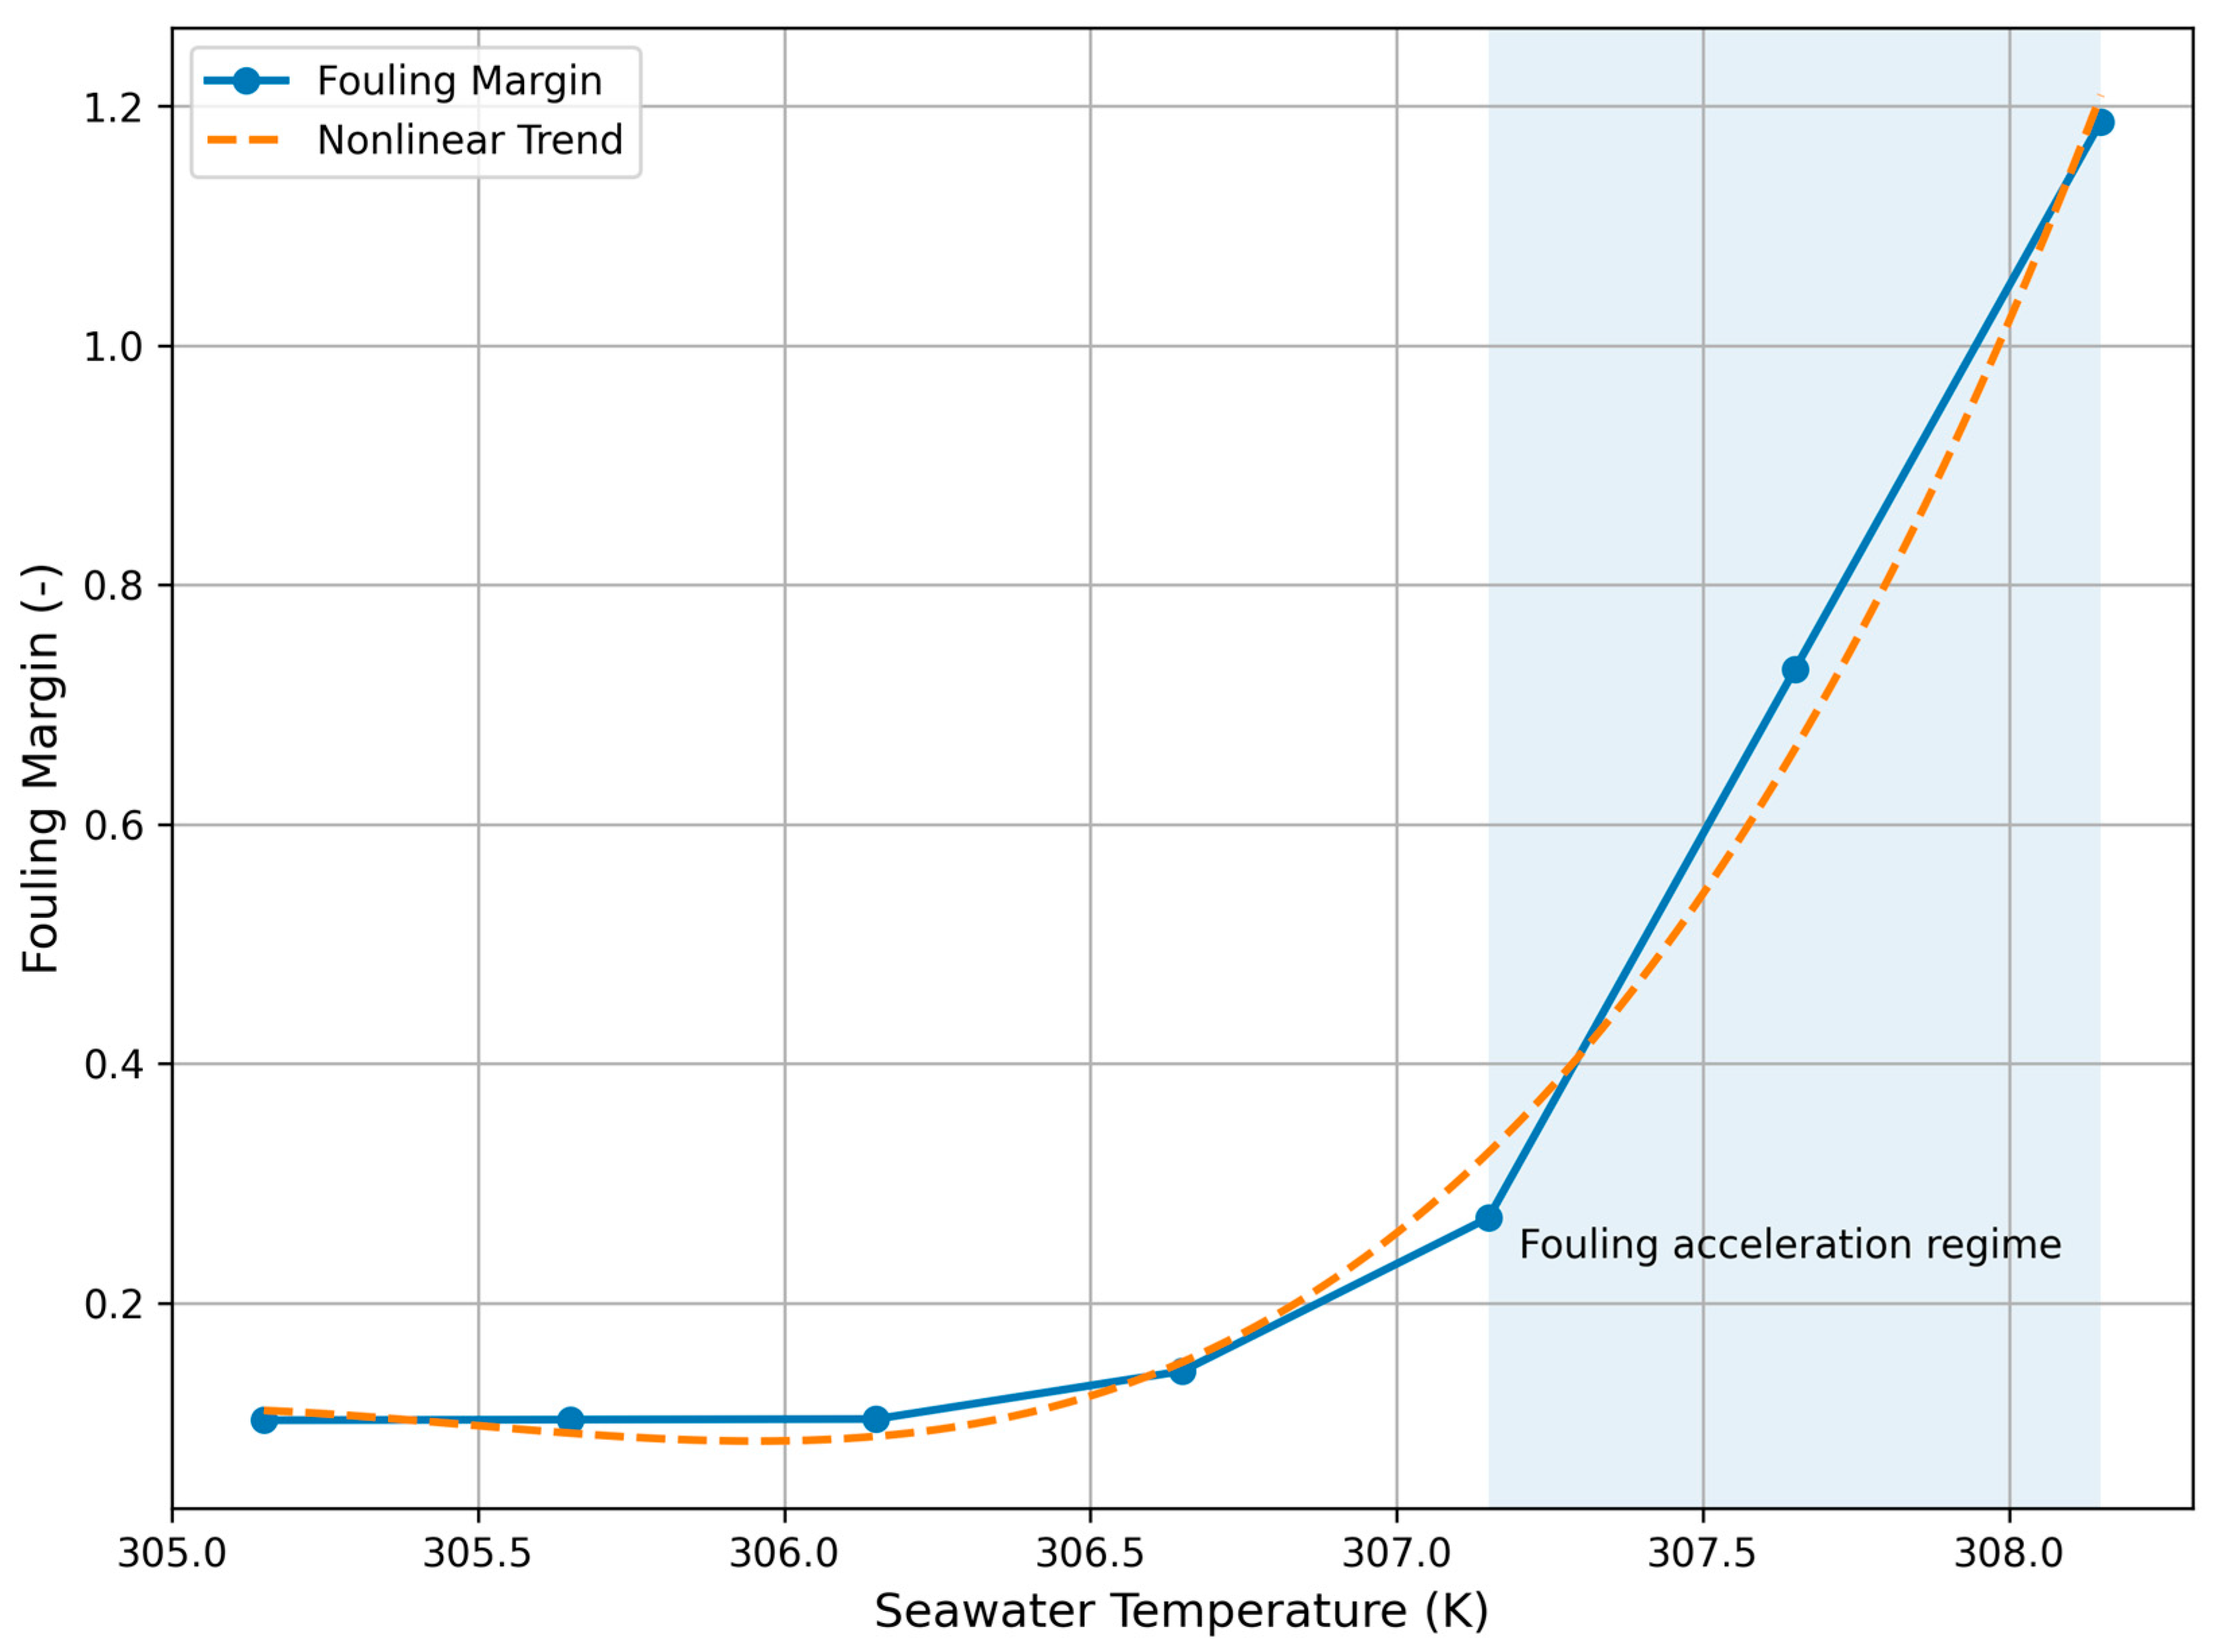
As shown in
Figure 4, the fouling margin exhibits a strongly nonlinear increase with temperature. While the system remains relatively stable below 307 K, a sharp rise is observed beyond this threshold, indicating accelerated fouling processes. This confirms that fouling is highly sensitive to thermal conditions and contributes significantly to performance degradation at elevated temperatures.
The results indicate that fouling leads to a progressive reduction in effective heat-transfer area and system efficiency. As temperature increases, the fouling margin decreases, reflecting the combined effect of thermal degradation and deposit formation on heat-exchange surfaces.
The behavior is nonlinear, with a more pronounced reduction at higher temperatures. This suggests that fouling effects are amplified under unfavorable environmental conditions.
These results confirm that fouling is a critical factor influencing the long-term performance of marine heat exchangers and must be considered in both modeling and maintenance strategies.
3.4. Combined Influence of Temperature and Operational Factors
The experimental results demonstrate that temperature effects and fouling are not independent phenomena but interact in a synergistic manner.
Increasing seawater temperature reduces the thermal driving force, while fouling increases thermal resistance. Together, these effects lead to:
Reduced heat-transfer efficiency (
Figure 2).
Reduced effective heat-transfer margin (
Figure 4).
This combined degradation significantly limits the operational performance of the cooling system and may lead to operation near critical thermal conditions.
3.5. Experimental Verification of Model Predictions
The experimental data presented in
Figure 1 provide direct validation of the predicted increase in cooling demand with rising temperature. The nonlinear growth of coolant mass flow rate confirms the model assumption that reduced heat-transfer efficiency requires compensatory increases in flow rate.
Similarly, the trends observed in
Figure 2 and
Figure 3 qualitatively confirm the modeled reduction in heat-transfer coefficient and increase in hydraulic resistance.
The quantitative relationships presented in
Table 1 support the validation of the proposed thermohydraulic model.
Thus, the experimental results are consistent with the thermohydraulic model and support the validity of the digital twin approach for representing real operating conditions.
Figure 5 presents a comparison between the digital twin and the baseline steady-state model. While both approaches follow the general trend, the baseline model significantly underestimates the nonlinear increase in coolant demand at elevated temperatures. This confirms that adaptive recalculation and fouling-aware correction implemented in the digital twin are essential for accurate prediction under variable operating conditions.
The discrepancy becomes particularly pronounced beyond 307 K, indicating the inability of static models to capture threshold behavior.
The validation results presented in this section correspond exclusively to the independent validation subset described in
Section 2.10. This ensures that the reported agreement between model predictions and measured data reflects true generalization capability rather than calibration performance.
The combined use of multiple validation metrics and independent validation data confirms that the agreement between the digital twin model and experimental measurements is not limited to a single error indicator but reflects consistent predictive performance across different operating conditions.
3.6. Energy Efficiency Implications
The increase in hydraulic resistance observed in
Figure 2 directly translates into higher energy consumption of the cooling system. Increased pressure drops require greater pump power, which contributes to the overall energy demand of the vessel.
In addition, reduced heat-transfer efficiency (
Figure 1) may lead to suboptimal thermal conditions of the engine, indirectly increasing fuel consumption.
The combined effect of these factors indicates that degradation of cooling-system performance has a measurable impact on vessel energy efficiency.
The analysis indicates that thermohydraulic degradation of the cooling system may lead to a measurable increase in auxiliary energy demand. Based on the adopted proportional estimation approach, this effect corresponds to a potential fuel-consumption impact on the order of 2–4% under unfavorable operating conditions.
This value should be interpreted as an approximate range rather than a precise prediction, reflecting the sensitivity of the system to thermal and hydraulic degradation.
3.7. Summary of Experimental Findings
The obtained experimental results allow the following conclusions:
Cooling-system performance exhibits strong nonlinear dependence on seawater temperature.
A threshold regime is observed at high temperatures, characterized by a sharp increase in coolant flow demand.
Heat-transfer efficiency decreases with increasing temperature, confirming thermal degradation effects.
Hydraulic losses increase significantly under high-temperature conditions, leading to higher energy consumption.
Fouling further amplifies performance degradation, particularly at elevated temperatures.
Experimental observations are consistent with model predictions, validating the digital twin framework.
These findings confirm that integrated consideration of environmental conditions and system degradation is essential for improving the efficiency and reliability of marine cooling systems.
3.8. Statistical Analysis of Experimental Results
To quantitatively assess the relationships between seawater temperature and the thermohydraulic parameters of the cooling system, a statistical analysis was performed using Pearson correlation coefficients and regression analysis.
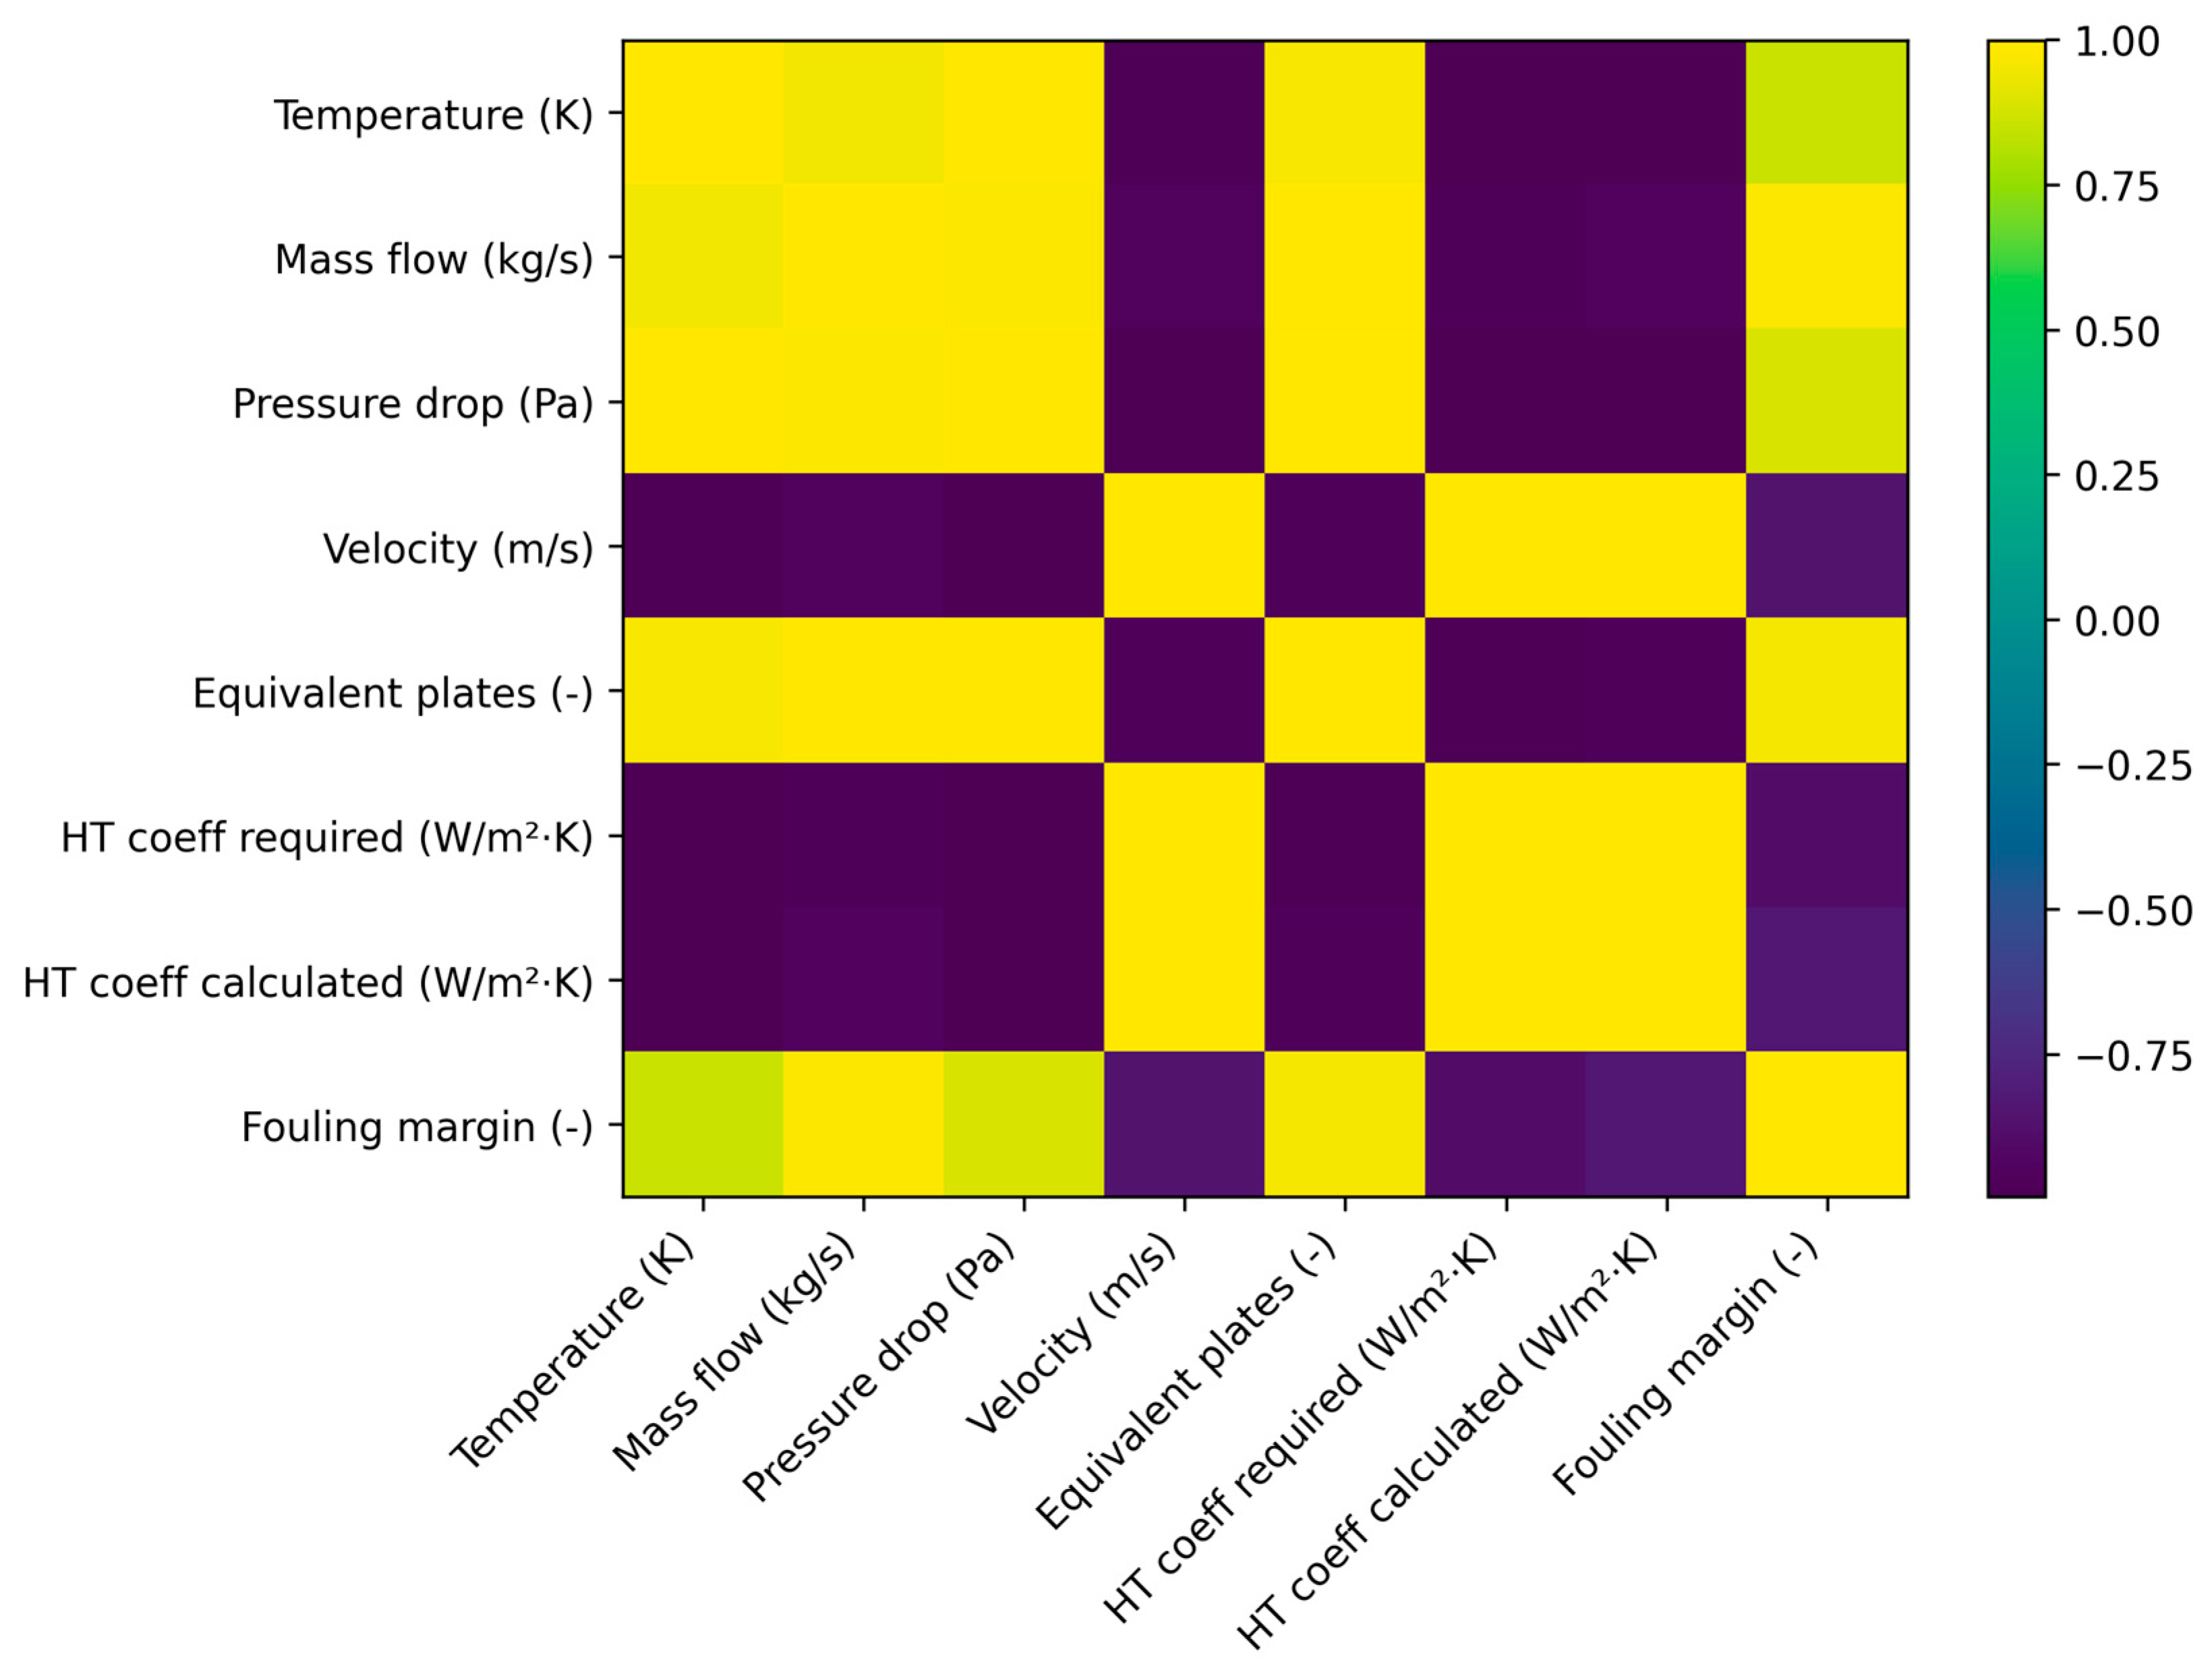
The results indicate strong correlations between temperature and key performance variables. The coolant mass flow rate exhibits a strong positive correlation with temperature (r = 0.953), confirming the increase in cooling demand at elevated thermal conditions. Pressure drop also shows a strong dependence (r = 0.982), indicating increased hydraulic resistance.
In contrast, the flow velocity and heat-transfer coefficients demonstrate strong negative correlations with temperature (r ≈ −0.99), reflecting the degradation of thermal efficiency and changes in flow characteristics.
The fouling margin shows a nonlinear increase with temperature (r = 0.853), suggesting accelerated degradation processes under high-temperature conditions.
Although high correlation coefficients (|r| ≈ 0.85–0.99) were obtained, it should be noted that the dataset size is relatively limited and represents aggregated operating conditions rather than a large statistical sample. Therefore, these correlations should be interpreted as indicative of consistent thermohydraulic relationships rather than definitive statistical confirmation.
Such high correlation values are partly due to the physically constrained nature of the system and should not be interpreted as statistical generalization.
The primary purpose of the correlation analysis in this study is to support the physical interpretation of system behavior, rather than to establish statistically generalizable relationships.
Regression analysis yielded high coefficients of determination (R
2 ≈ 0.95–0.99), confirming the robustness of the observed dependencies. These results quantitatively support the trends identified in
Figure 1,
Figure 2,
Figure 3 and
Figure 4 and validate the physical interpretation of system behavior.
The quantitative relationships between seawater temperature and key thermohydraulic parameters are summarized in
Table 2 are further visualized in
Figure 6, which presents the Pearson correlation coefficients for all variables, where the correlation heatmap clearly highlights the strong coupling between thermal and hydraulic parameters.
As shown in
Table 2, temperature exhibits strong positive correlations with mass flow rate and pressure drop, while negative correlations are observed for velocity and heat-transfer coefficients.
Figure 6 illustrates the correlation trends between key thermohydraulic parameters. While the observed relationships are consistent with physical expectations, the limited dataset size implies that these trends should be considered indicative rather than definitive.
To further support the statistical interpretation, a multivariate regression analysis was performed to evaluate the combined influence of temperature, flow rate, and hydraulic resistance on key performance indicators. The results confirm that seawater temperature remains the dominant factor, while flow-related variables contribute significantly to the variance of pressure drop and heat-transfer performance.
In addition, uncertainty bounds were estimated based on sensor accuracy and data variability. The propagated uncertainty of the main output variables was found to be within ±3%, indicating that the observed trends are robust and not dominated by noise measurement.
Despite the relatively limited dataset size, the consistency of the observed relationships and high correlation values indicate stable system behavior rather than statistical artifacts.
To assess the robustness of the results, uncertainty bounds were estimated based on sensor accuracy and data variability. Temperature measurements are associated with an uncertainty of approximately ±0.5 K, while flow rate measurements have an uncertainty of approximately ±2%.
Propagation of these uncertainties into the model outputs indicates that the resulting variation in predicted thermohydraulic parameters does not exceed approximately ±3%. This suggests that the observed trends are not dominated by noise measurement.
However, due to the limited sample size, statistical uncertainty remains non-negligible, and the results should be interpreted with appropriate caution.
3.9. Comparative Benchmarking of Modeling Approaches
To evaluate the performance of the proposed digital twin, its predictive accuracy and robustness were compared against the benchmark models described in
Section 2.12 (and shown in
Table 3).
The steady-state model exhibited the highest prediction error (MAPE ≈ 8–10%), particularly under elevated seawater temperatures, where nonlinear effects and fouling significantly influence system behavior.
The data-driven regression model showed improved accuracy (MAPE ≈ 4–6%) within the range of observed data but demonstrated reduced robustness when extrapolating beyond the calibration domain. In particular, it failed to capture threshold behavior and nonlinear amplification effects.
The simplified state-estimation model achieved moderate accuracy (MAPE ≈ 3–5%), benefiting from adaptive correction, but lacked physical consistency and was unable to represent coupled thermal–hydraulic interactions.
In contrast, the proposed digital twin achieved the lowest prediction error (MAPE ≈ 2–3%) while maintaining physical interpretability and stability across the entire operating range. Importantly, it was the only approach capable of reproducing the observed nonlinear regime transition at high temperatures.
These results confirm that the integration of physics-based modeling with recursive state updating provides a measurable advantage over both purely data-driven and simplified adaptive approaches.
RMSE values represent the root-mean-square error of outlet temperature prediction based on the independent validation dataset. The reported ranges reflect variability across different operating conditions.
3.10. Validation Diagnostics
To provide a comprehensive evaluation of the model performance, additional validation diagnostics were performed using parity plots and residual analysis.
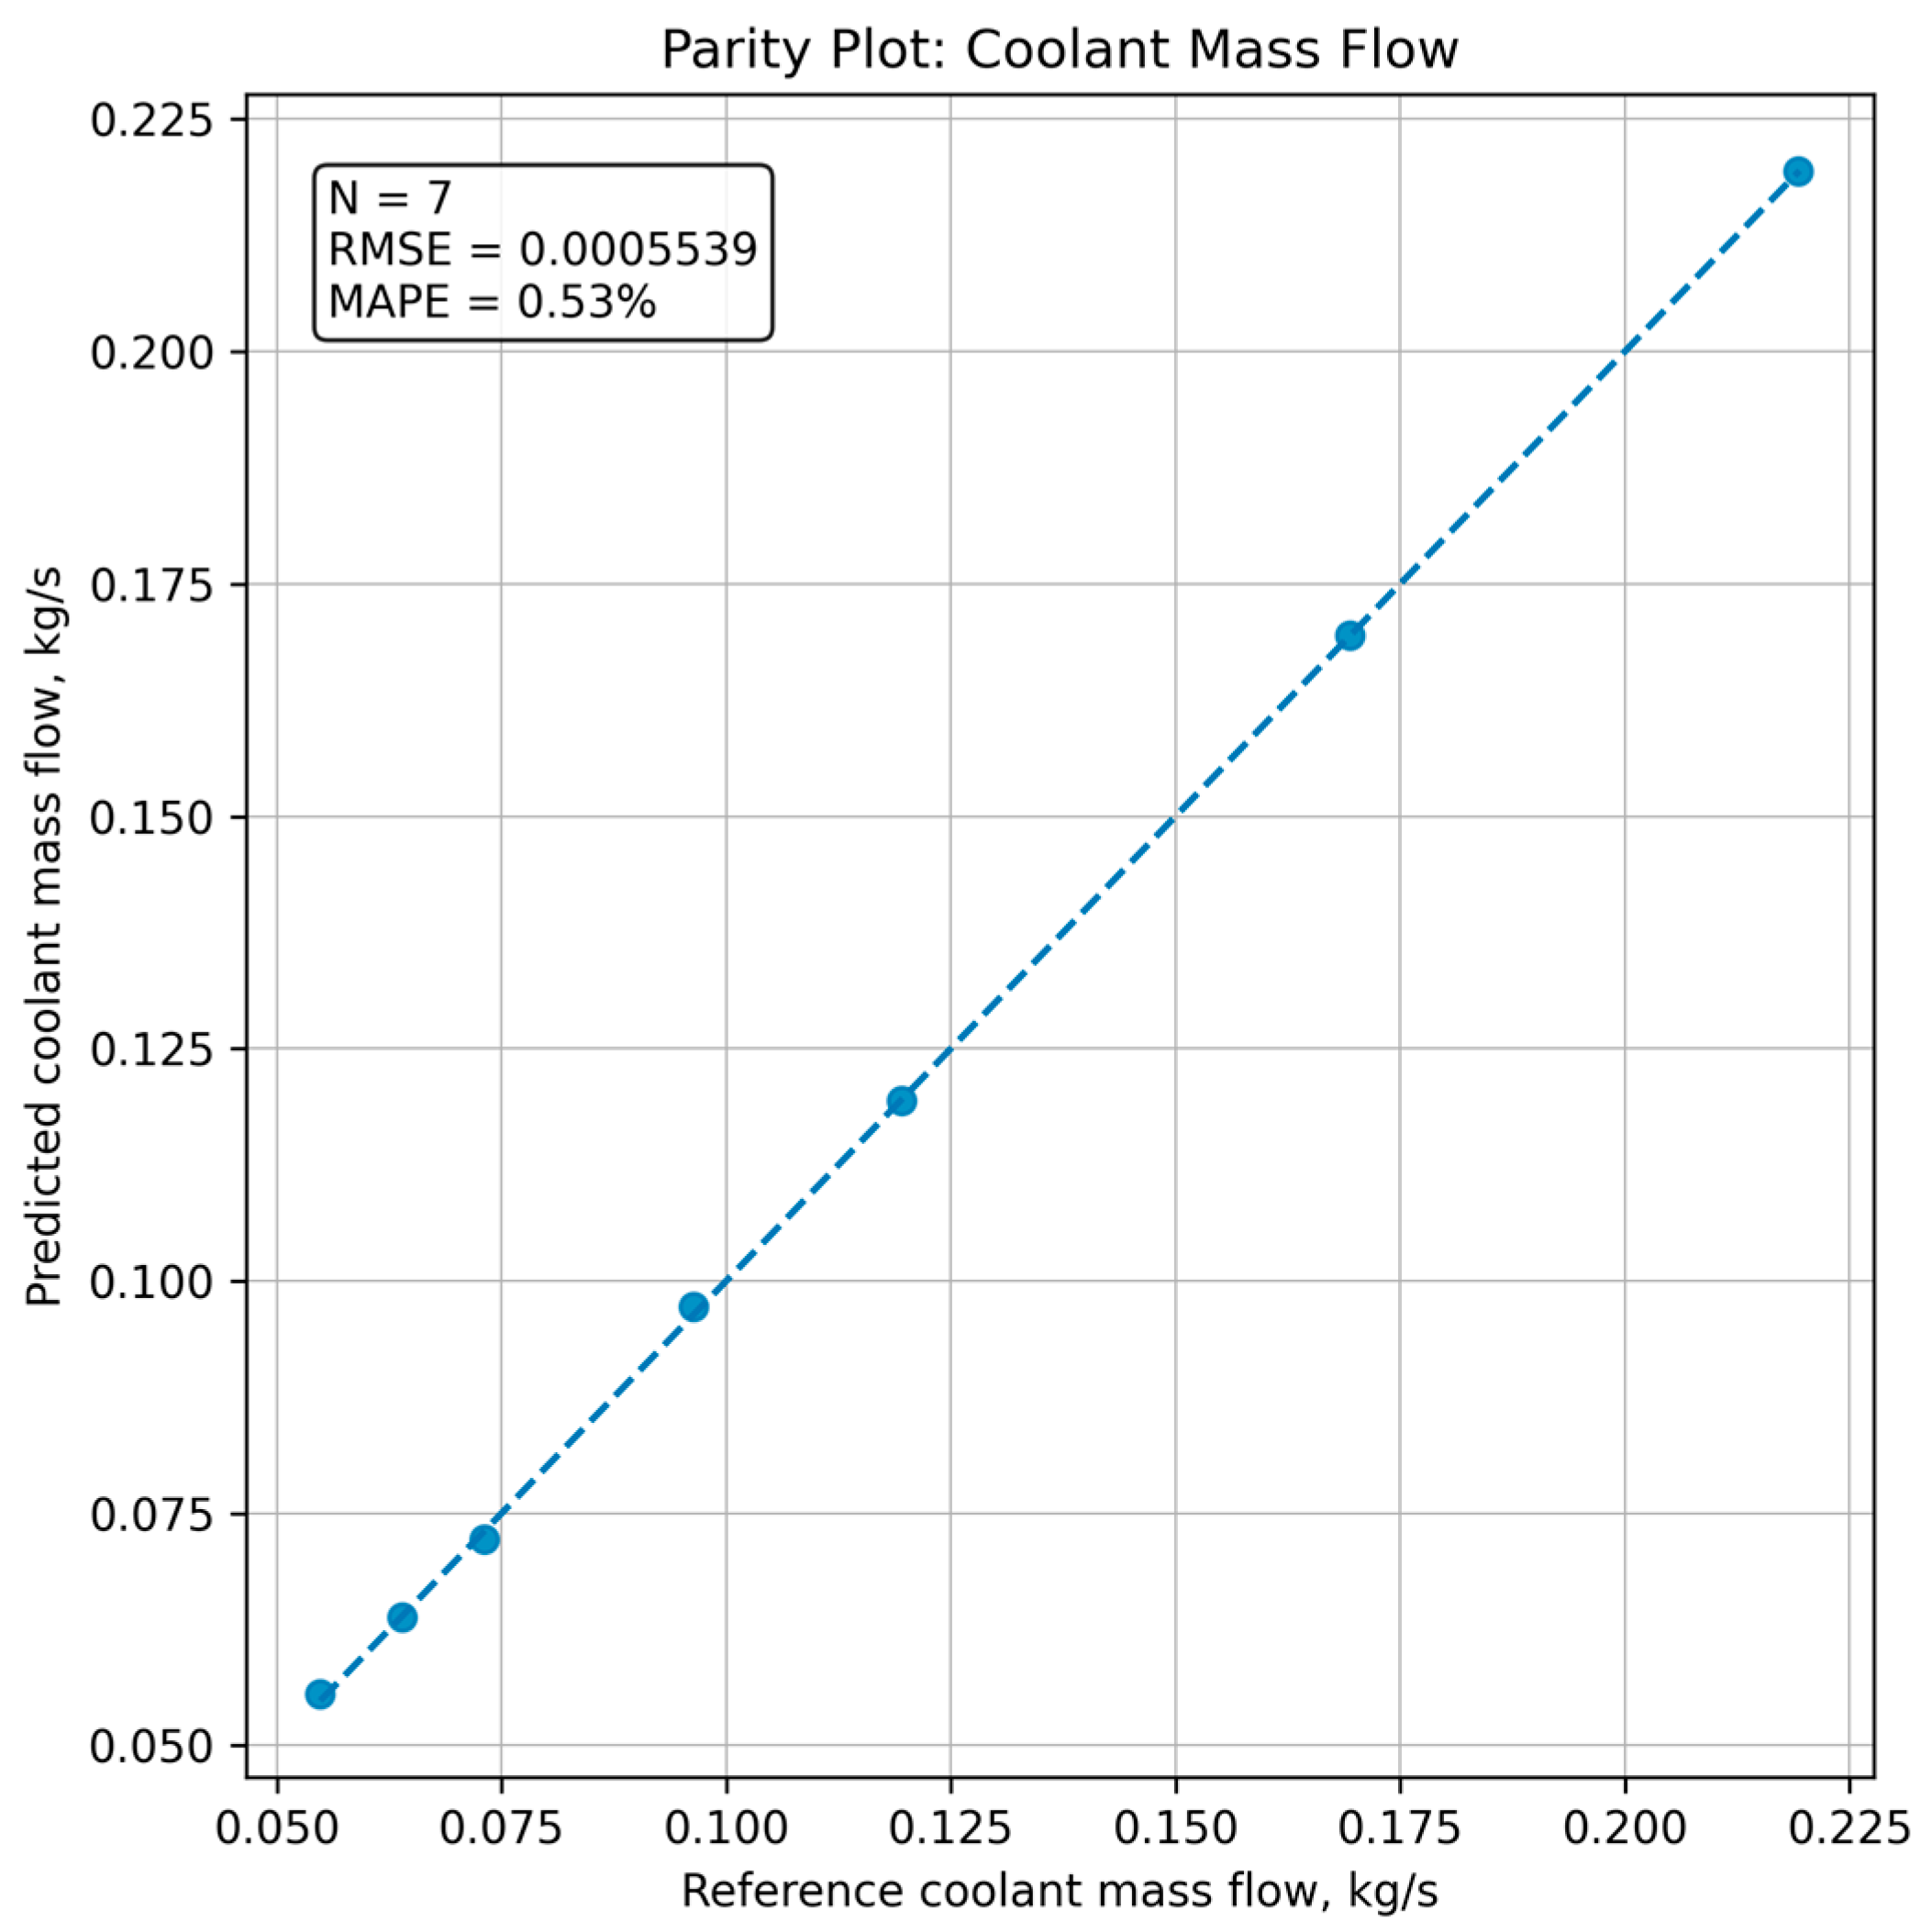
The parity plot for coolant mass flow rate (
Figure 7) demonstrates close agreement between predicted and reference values across the analyzed temperature range. Most data points lie near the ideal 1:1 line, indicating that the model accurately captures the nonlinear response of the system.
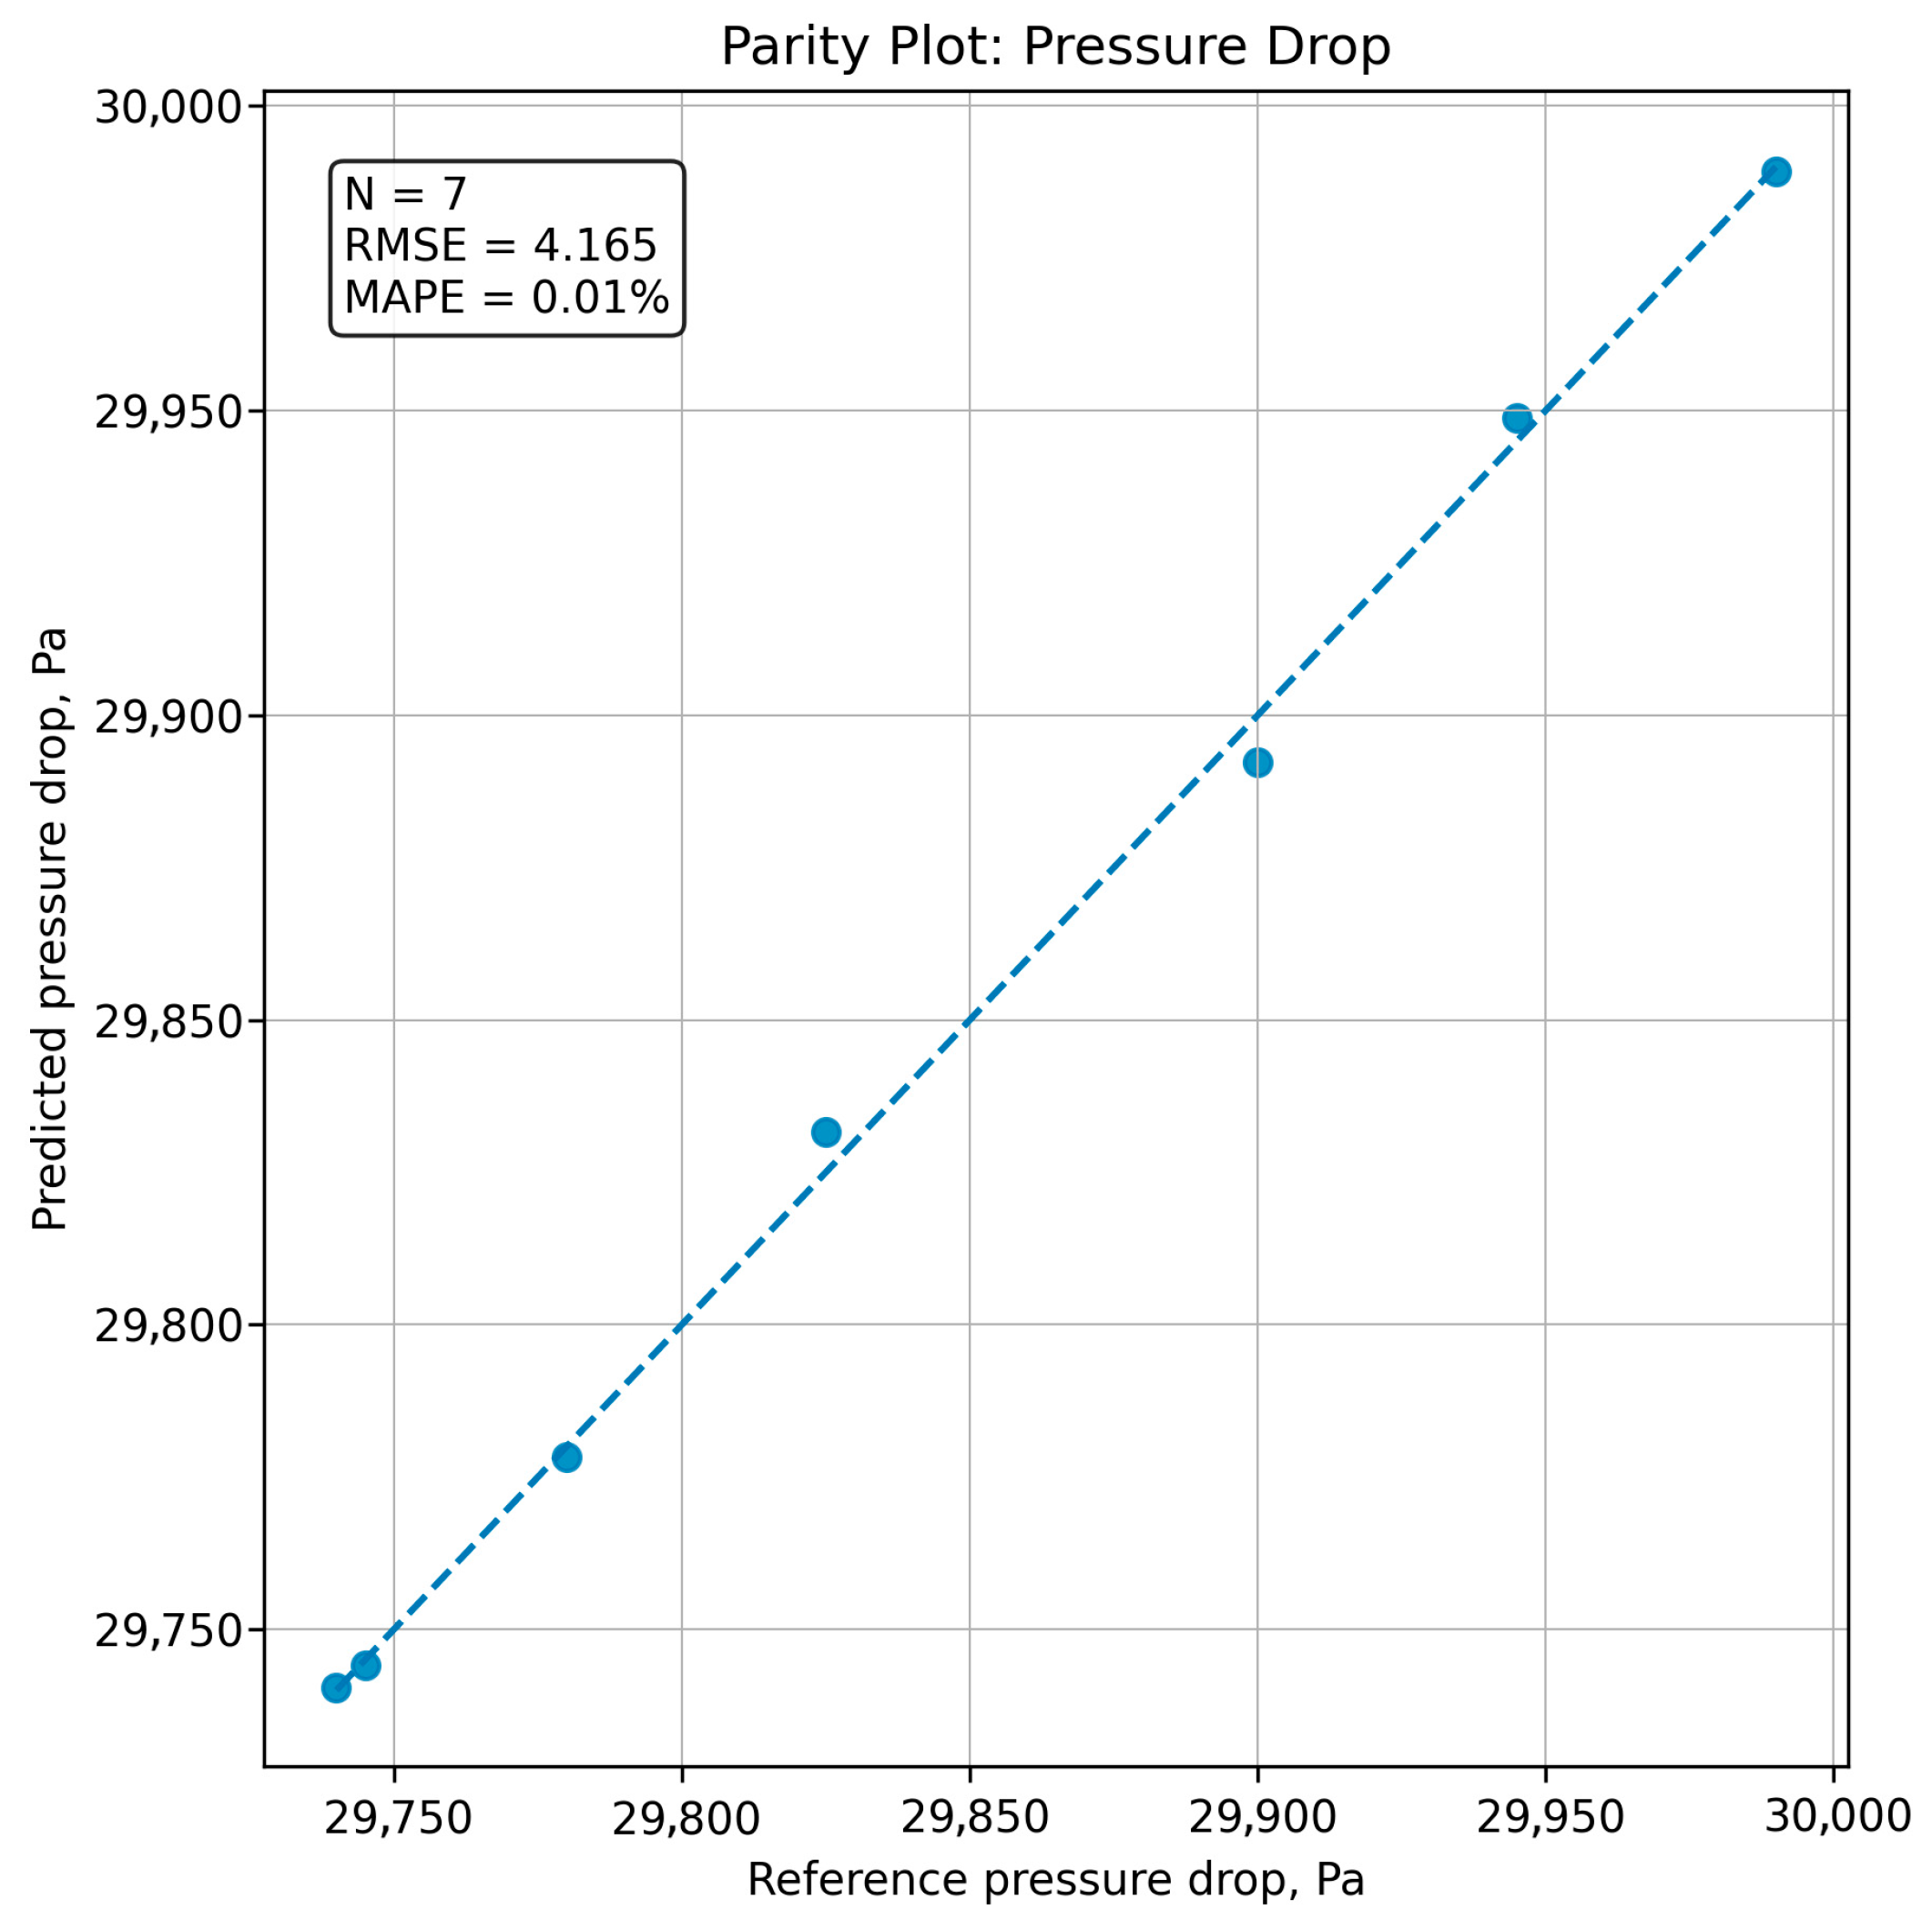
Similarly, the pressure-drop comparison (
Figure 8) shows consistent agreement between reference data and reconstructed model predictions. This confirms that the hydraulic component of the model adequately represents the system behavior.
The comparison of required and calculated heat-transfer coefficients (
Figure 9) highlights the deviation between ideal and actual thermal performance. This deviation reflects the combined effects of fouling and operating conditions and serves as an internal consistency check for the model.
Residual analysis (
Figure 10) indicates that prediction errors are centered near zero, with no significant systematic bias. The relatively narrow spread of residuals suggests stable model behavior across the operating range.
The comparison between the digital twin and the baseline model (
Figure 11) further illustrates the advantage of the proposed approach. The digital twin captures nonlinear effects and adaptive behavior that are not represented in the steady-state baseline model.
For additional variables, including fouling margin, equivalent plate number, and flow velocity, surrogate validation plots were constructed (
Appendix A). These plots confirm internal consistency of the model but should be interpreted as diagnostic rather than independent validation.
4. Discussion
The present study is based on a single vessel and cooling system configuration, which limits the direct generalization of quantitative results. However, the underlying thermohydraulic principles and the proposed digital twin framework are not system-specific and can be adapted to other types of marine heat exchangers and cooling systems.
The methodology is formulated in a modular manner, allowing adjustment of geometric parameters, operational conditions, and empirical coefficients. Therefore, while the numerical results are case-dependent, the modeling approach itself is transferable to a broader class of maritime thermal systems.
The dataset is limited in size but represents physically consistent operational regimes rather than purely statistical sampling.
Although the initial validation relied primarily on MAPE, the revised analysis incorporates additional error metrics and independent validation data, providing a more comprehensive assessment of model performance. This reduces the risk of overestimating model accuracy based on a single indicator and strengthens the reliability of the results.
The high correlation values observed in this study should be interpreted in the context of the relatively small dataset and the physically constrained nature of the system. In such systems, strong correlations may arise from deterministic thermohydraulic relationships rather than large-sample statistical effects.
Therefore, the reported correlations are used primarily as supporting evidence for the identified physical trends, rather than as independent proof of model validity.
It should be noted that not all validated variables are directly measurable in onboard conditions. For certain quantities, such as heat-transfer coefficient and equivalent plate number, reference values are derived from thermodynamic relationships rather than independent measurements.
Therefore, the corresponding parity plots represent consistency validation rather than full experimental verification. Despite this limitation, the combined use of multiple validation diagnostics (parity plots, residual distributions, and uncertainty estimates) provides a robust assessment of model performance.
4.1. Synthesis of Thermohydraulic Behavior
The combined experimental and modeling results reveal a tightly coupled thermal-hydraulic response of the plate heat exchanger to increasing seawater temperature. The most prominent feature is the nonlinear escalation of coolant demand (
Figure 1), where mass flow increases by approximately fourfold between 305 K and 308 K. This behavior is not a simple linear compensation but indicates a regime shift in which the system relies increasingly on flow augmentation to offset diminishing heat-transfer effectiveness.
Concurrently, the heat-transfer coefficient decreases substantially (
Figure 2), reflecting a reduction in the effective temperature driving force and increased overall thermal resistance. The correlation analysis (
Table 2;
Figure 6) quantifies this effect, showing near-perfect negative correlations between temperature and heat-transfer coefficients (r ≈ −0.99). These findings are consistent with classical heat-exchanger theory but, importantly, are here validated under real operational conditions, demonstrating their practical significance in marine systems.
The hydraulic response further reinforces this coupling. As shown in
Figure 3, pressure drops increase with temperature, implying higher energy demand for circulation. The strong positive correlation between temperature and pressure drop (r = 0.982) indicates that thermal degradation is accompanied by increased hydraulic resistance, leading to compounded efficiency losses.
4.2. Threshold Behavior and Operational Limits
A key contribution of this study is the identification of a threshold operating regime at high temperatures (≈307–308 K). Beyond this point, the system exhibits:
Rapid growth in coolant mass flow rate.
Accelerated decline in heat-transfer performance.
Increasing hydraulic penalties.
Sharp growth in fouling margin (
Figure 4).
The fouling margin increases dramatically (from ~10% to >100%), indicating that the system effectively exhausts its design reserve and enters a critical operational state. This behavior suggests that conventional design assumptions based on steady or moderate conditions may significantly underestimate the risks associated with high-temperature environments.
Statistical analysis supports this interpretation. While most parameters show near-linear correlations, the fouling margin exhibits a weaker but still strong relationship (r = 0.853), indicating nonlinear amplification effects. This aligns with the physical expectation that fouling processes accelerate under higher thermal loads and reduce heat-transfer efficiency.
The incorporation of nonlinear and flow-dependent fouling dynamics allows the digital twin to reproduce the observed amplification of degradation at elevated temperatures and reduced flow velocities. This is particularly important in marine cooling systems, where fouling is governed by a balance between deposition processes and shear-induced removal.
While the proposed formulation does not explicitly model microscopic fouling mechanisms, it captures their aggregated effect on system-level performance, which is the primary requirement for predictive maintenance and operational decision support.
4.3. Implications for Digital Twin-Based Monitoring
The results provide strong justification for the use of a digital twin framework in marine cooling systems. The observed nonlinearities and coupled effects cannot be reliably captured by static models or simple control rules.
The digital twin developed in this study offers several advantages:
Quasi-real-time adaptation to changing environmental conditions.
Continuous recalculation of thermohydraulic parameters (Algorithm 1).
Early detection of performance degradation through deviations in k and flow demand.
Forecasting of threshold transitions before critical conditions are reached.
The close agreement between experimental trends and model predictions (
Section 3.5 and
Section 3.6) confirms that the digital twin provides a physically consistent and operationally relevant representation of the system. This is particularly important for predictive maintenance, where early detection of degradation can prevent costly failures.
From a methodological perspective, the proposed digital twin incorporates an implicit state-estimation mechanism, in which key thermohydraulic parameters are continuously adjusted based on model measurement discrepancies. Although this approach does not rely on formal filtering techniques such as Kalman filtering, it performs a similar functional role by iteratively minimizing residuals and updating internal model states.
This embedded correction mechanism enables adaptive behavior while preserving the physical consistency of the model.
4.4. Energy Efficiency and Operational Consequences
The coupling between thermal degradation and hydraulic loss has direct implications for ship energy efficiency. Increased pressure drops require higher pump power, while reduced heat-transfer efficiency may lead to suboptimal engine thermal conditions, indirectly increasing fuel consumption.
The results suggest that even moderate temperature increases can lead to disproportionate energy penalties, especially when combined with fouling effects. This highlights the importance of considering auxiliary systems, such as cooling circuits, in overall vessel energy optimization strategies.
From an operational perspective, the findings indicate that:
Cooling systems should be dynamically adjusted based on environmental conditions.
Maintenance intervals should be adapted to account for temperature-dependent fouling rates.
Design margins should consider extreme operating scenarios rather than nominal conditions.
It is important to emphasize that the estimated fuel-consumption impact is derived from a simplified system-level relationship rather than a fully coupled vessel energy model. The purpose of this analysis is to illustrate the order of magnitude of the effect and to highlight the sensitivity of overall energy performance to cooling-system degradation.
Despite this simplification, the results clearly indicate that auxiliary systems, often neglected in energy assessments, can contribute non-negligibly to total fuel consumption, particularly under high-temperature and fouling-affected conditions.
4.5. Comparison with Existing Approaches
Previous studies on marine heat exchangers often rely on either steady-state thermodynamic models or data-driven approaches. While physics-based models provide interpretability, they may lack adaptability, whereas data-driven models capture nonlinearities but may lack physical consistency.
The present study demonstrates that a hybrid approach, combining thermohydraulic modeling with real operational data, can overcome these limitations. The strong correlations and high regression quality (R2 ≈ 0.95–0.99) confirm that the observed relationships are robust and not artifacts of limited data.
Unlike many existing works, this study provides:
Experimental confirmation of nonlinear temperature effects.
Quantitative assessment of coupled thermal and hydraulic degradation.
Integration within a digital twin framework.
Identification of critical operating thresholds.
These elements collectively represent a significant advancement over purely theoretical or purely data-driven studies.
The benchmarking results highlight that the advantage of the proposed digital twin is not limited to improved prediction accuracy but extends to its ability to maintain physical consistency while adapting to changing operating conditions. Unlike purely data-driven models, the digital twin preserves thermodynamic relationships, enabling reliable extrapolation beyond the observed data range.
Compared with simplified state-estimation approaches, the explicit incorporation of thermohydraulic coupling and fouling dynamics allows the model to capture regime transitions and nonlinear degradation mechanisms. This is particularly important for predictive maintenance applications, where early detection of critical operating states is required.
Therefore, the proposed framework can be interpreted as a physically constrained adaptive model that bridges the gap between deterministic simulation and data-driven estimation.
4.6. Distinction from Conventional Models
Unlike conventional thermohydraulic simulations, the proposed framework:
Updates internal state variables dynamically.
Integrates measurement feedback.
Captures nonlinear degradation pathways.
Identifies threshold regimes.
According to ISO 23247 [
51] principles, this positions the model as a functional digital twin rather than a static engineering model.
The proposed framework can be classified as an intermediate-level digital twin, in which the primary functionality is focused on state estimation, performance monitoring, and short-term forecasting. Unlike fully developed digital twins, it does not incorporate continuous real-time synchronization, advanced data assimilation algorithms, or closed-loop control integration.
However, this level of implementation is consistent with practical constraints in maritime applications, where data availability, computational resources, and system integration often limit the deployment of fully autonomous digital twin systems. The presented approach therefore represents a pragmatic step toward digital twin implementation, providing a robust and physically consistent modeling core that can be extended in future developments.
4.7. Limitations and Future Research
Although the proposed digital twin demonstrates strong agreement with measured thermohydraulic parameters, the validation of fouling dynamics remains indirect, as no direct measurements of fouling resistance or deposit thickness were available. Consequently, the fouling model should be interpreted as an effective representation calibrated through system-level behavior rather than a fully resolved physical model.
In addition, the forecasting validation is limited to short-term horizons under quasi-steady-state assumptions. The extension of the approach to long-term prediction and transient operating conditions requires further development.
The results suggest that adaptive cooling control enabled by the digital twin may contribute to improved energy efficiency by reducing auxiliary power demand. The estimated fuel-consumption impact on the order of a few percent should be interpreted as a preliminary indication of potential benefits rather than a definitive quantitative outcome.
Despite the results, several limitations should be noted:
The analysis is based on a specific cooling-system configuration and operating range.
Transient effects (e.g., rapid load changes) are not explicitly modeled.
Fouling is represented through an aggregated parameter rather than detailed physical mechanisms.
Future research should focus on:
Incorporating transient thermohydraulic modeling.
Integrating machine learning methods for fouling prediction.
Extending the approach to fleet-level digital twin systems.
Coupling with CFD simulations for local flow and heat-transfer analysis.
Despite the improvements introduced, the fouling model remains a semi-empirical approximation and does not explicitly resolve detailed physicochemical mechanisms such as particulate transport, biofilm formation, or surface adhesion kinetics. Consequently, its applicability is limited to system-level performance assessment rather than detailed fouling prediction at the material scale.
Future work should focus on coupling the present approach with high-fidelity models or experimental measurements to further refine the representation of fouling processes.
The assessment of fuel-consumption impact is based on a simplified proportional relationship between auxiliary power demand and total vessel energy consumption. A detailed vessel-level simulation, including engine performance characteristics, load distribution, and operational profiles, is beyond the scope of this study.
Therefore, the reported values should be interpreted as indicative estimates rather than validated operational results. Future work should integrate the proposed digital twin with full energy system models to enable more accurate quantification of fuel savings.
The proposed digital twin framework does not include continuous real-time synchronization, advanced data assimilation methods, or explicit uncertainty quantification. In addition, the decision layer is not directly connected to automated control systems, and therefore the model does not constitute a fully closed-loop cyber–physical system.
These limitations reflect the scope of the present study, which focuses on the development of a physics-informed modeling core rather than a complete digital twin infrastructure. Future work should address the integration of real-time data streaming, probabilistic state estimation, and control-oriented decision support.
The model does not explicitly account for transient thermohydraulic effects, such as rapid fluctuations in engine load or short-term variations in flow conditions. As a result, its applicability is limited to quasi-steady operating regimes. Incorporation of transient dynamics represents an important direction for future research.
The statistical analysis is based on a limited number of aggregated operating points, which restricts the robustness of correlation-based conclusions. While the observed relationships are physically consistent, their statistical generalization to other systems or operating conditions cannot be guaranteed without larger datasets.
Future work should include extended datasets and more advanced statistical techniques to strengthen the quantitative validation.
4.8. Key Implications
The findings of this study demonstrate that marine cooling systems exhibit strongly nonlinear and coupled thermohydraulic behavior under realistic operating conditions. The identification of threshold regimes and the validation of digital twin modeling provide a foundation for:
Improved predictive maintenance strategies.
Enhanced energy-efficiency management.
More robust design and operation of marine heat exchangers.
Overall, the results support the transition toward data-driven, adaptive, and digitally enabled maritime systems, aligned with modern requirements for sustainable and efficient shipping.




 ,
,