Article

A Digital Twin-Enabled Framework for Agrivoltaic System Design, Simulation, Monitoring and Control


1
School of Engineering, RMIT University, Bundoora Campus East, Bundoora, VIC 3083, Australia
2
Agriculture Victoria, Department of Energy, Environment and Climate Action (DEECA), Tatura, VIC 3616, Australia
*
Author to whom correspondence should be addressed.
These authors contributed equally to this work.
Machines 2026, 14(3), 254; https://doi.org/10.3390/machines14030254
Submission received: 27 January 2026 / Revised: 16 February 2026 / Accepted: 19 February 2026 / Published: 24 February 2026

Abstract

Agrivoltaics offer a sustainable solution to the growing competition between food and energy production. However, their adoption is often constrained by the design and operation challenges associated with optimising the complex trade-off between crop yield and photovoltaic (PV) output. Digital twins can mitigate these risks, yet most agricultural digital twins operate as fragmented digital shadows, lacking high-fidelity modelling, advanced simulation, and bidirectional control capabilities. This study presents a comprehensive, end-to-end digital twin framework to address these limitations. The framework integrates a high-resolution 3D orchard model, reconstructed via UAV photogrammetry, with a CesiumJS-based web interface linked to a modular IoT architecture built on Node-RED, Message Queuing Telemetry Transport (MQTT) protocol and InfluxDB for real-time monitoring and control. A PV simulation engine supports the design, simulation and optimisation of agrivoltaic systems. Bidirectional communication was validated through remote actuation of a physical solar tracker, demonstrating integration among the 3D environment, sensor data and control systems to achieve a closed-loop digital twin. Simulation analyses suggested that panel orientation and row spacing exert a dominant influence on crop-level light distribution. Simulation results demonstrated that a 90° azimuth configuration achieved the highest daily energy yield of 53.97 kWh but reduced peak crop-level irradiance to 205 W/m2. In contrast, the baseline 0° configuration offered a balanced output of 40.86 kWh with a peak light availability of 338 W/m2. The validated, interoperable digital twin architecture provides a reference model for the design, simulation, monitoring and control of an agrivoltaic system, reducing investment uncertainty and supporting sustainable food–energy co-production.

1. Introduction

Agrivoltaics, the co-location of photovoltaic (PV) systems with agricultural production, has emerged as a promising strategy to address pressing challenges in sustainable energy generation, food security and land-use efficiency. This dual-use approach seeks to maximise the productivity of limited land resources by producing electricity and cultivating crops on the same site [1,2,3]. In regions where arable land is scarce or increasingly vulnerable to climate change, agrivoltaics has been promoted as a means to minimise competition between food and energy systems while contributing to de-carbonisation goals and energy independence. Countries including Japan, Germany, France and the United States have piloted or commercialised agrivoltaic projects, and the concept is gaining traction globally as part of the broader sustainability transition [4,5,6,7,8,9,10,11,12,13,14].
Although agrivoltaics represents a promising framework for the integrated production of energy and food, its large-scale implementation remains constrained by several scientific, technical and operational challenges. At the system level, the design of the agrivoltaic system requires balancing competing priorities: maximising solar energy production while maintaining or enhancing crop yields. The shading effect of PV panels can influence the microclimate by reducing heat stress and evapotranspiration; however, it may also lower photosynthetically active radiation (PAR), potentially decreasing crop productivity. Conflicting evidence in the literature reflects this complexity [15], while some field studies report improvements in water-use efficiency and yields for certain crops under partial shading, others report yield penalties, particularly in temperate regions or for light-demanding crops. Further, disagreements exist over the economic feasibility of different system configurations, such as vertical bifacial systems compared with conventional ground-mounted panels or single-axis tracking arrays [16,17]. These inconsistencies underscore the context-dependent nature of agrivoltaics and the need for robust, site-specific approaches to system design and management.
This gap in the literature highlights the need for end-to-end frameworks that unify the distinct stages of agrivoltaic system development: design, simulation, monitoring and control. Current approaches often address one or two of these components in isolation but fail to provide a comprehensive solution that supports simulation analysis and operational decision-making. Without such integration, it is challenging to anticipate trade-offs, evaluate alternative system layouts, or dynamically respond to environmental variability.
Digital twin technology offers a compelling way to address these limitations. A digital twin is a high-fidelity virtual representation of a physical system that is continuously synchronised with real-world data through bidirectional communication, enabling remote monitoring and providing control functions that directly influence the physical system [18,19]. A fundamental distinction must be made between a digital shadow and a digital twin based on the nature of data integration. A digital shadow is characterised by a unidirectional data flow from the physical object to its digital representation; while it allows for real-time monitoring, changes in the digital state do not influence the physical entity. In contrast, a digital twin establishes a fully integrated, bidirectional data flow where the digital model and physical system are mutually synchronised, enabling the digital system to exert direct control or actuation back onto the physical counterpart [19,20]. In industries such as manufacturing, aerospace and urban infrastructure, digital twins have already been used to optimise design, streamline operations and reduce costs [21,22,23,24,25]. However, their application remains limited within agricultural and agrivoltaic contexts. The existing efforts often remain limited to data visualisation or one-way monitoring, and many so-called digital twins are, in practice, digital shadows that lack simulation capacity and system feedback [18]. This underdevelopment presents both a challenge and an opportunity to advance agrivoltaic research and practice.
The method presented in this study introduces and validates a digital twin-enabled framework for an orchard-based agrivoltaic system, covering the full system life cycle from initial design to real-time operation. For the design and simulation phase, high-fidelity three-dimensional models generated using unmanned aerial vehicle (UAV) photogrammetry were integrated with geographic information systems (GIS). This allows precise characterisation of orchard geometry, including canopy structures and terrain variability, which is critical for accurate irradiance modelling. Combined with the open-source PV energy systems simulation library, pvlib, the framework supports the design of PV layouts, configuration of panel parameters, and simulation of both power output and crop-level irradiance distribution. For monitoring and control, Internet of Things (IoT) devices were incorporated and connected via the Message Queuing Telemetry Transport (MQTT) protocol to enable real-time, bidirectional communication with a solar tracker system prototype. This integration supports continuous monitoring of environmental and operational data and facilitates adaptive control of the PV infrastructure, thereby bridging the gap between predictive modelling and field-based decision-making.
The principal contribution of this work is to demonstrate the technical feasibility and practical value of an end-to-end digital twin tailored to an agrivoltaic system. By combining UAV-based photogrammetry, GIS integration, PV simulation, and IoT-enabled monitoring and real-time control, the framework offers a replicable methodology for both researchers and practitioners. The system was validated within an orchard setting, highlighting its potential to improve design fidelity, operational responsiveness and system optimisation. Beyond the immediate case study, this approach establishes a foundation for scaling agrivoltaics through integrated digital solutions, enhancing the resilience and sustainability of agricultural and energy systems.

2. Literature Review

2.1. Agrivoltaics

Agrivoltaics, also known as agri-PV or dual-use solar, is an innovative land-use system that jointly combines agricultural production with PV energy generation on the same land [26]. This dual-use strategy directly addresses the escalating competition for land between food production and energy generation, a critical global challenge [27]. The fundamental principle is to create a mutually beneficial relationship in which both the agricultural and energy components can benefit, or at least in which the agricultural activity is not significantly compromised while enabling substantial energy generation.
Agrivoltaic systems can offer benefits from economic, environmental and social dimensions, contributing to a more sustainable and resilient future. One of the primary advantages is the increased land-use efficiency, often measured as an equivalent ratio that quantifies the combined productivity of agriculture and energy relative to their separate production on distinct land plots [28]. Studies have indicated that agrivoltaics can increase global land productivity by 35 to 73% by minimising agricultural displacement for energy production [29]. These systems can also play a significant role in regulating microclimatic conditions. For example, agrivoltaics implementations have been shown to reduce ambient air temperatures by approximately 0.5 to 6 °C, while simultaneously enhancing relative humidity levels by up to 8.9%. Moreover, these systems improve soil moisture retention, with observed increases ranging from 26 to 29%. In terms of solar radiation dynamics, agrivoltaics can reduce incident solar irradiance by 30 to 42%, mitigating plant stress and lowering evapotranspiration rates by 31%, thereby enhancing crop resilience and resource-use efficiency [30,31,32,33,34,35].
Agrivoltaic systems are developed in a range of configurations that integrate PV energy generation with agricultural production. The configuration of an agrivoltaic system is determined by the type of agricultural activity, local climatic conditions and the desired balance between energy yield and agricultural output. From a classification perspective, agrivoltaic systems can be categorised according to several principal parameters. The application distinguishes systems designed for crop cultivation, such as those supporting vegetables or grains, from those intended for livestock farming, such as grazing areas beneath elevated PV modules. System type differentiates open-field installations, where crops grow directly under or between PV rows, from closed-field configurations such as greenhouses integrated with semi-transparent solar panels. The farming category refers to the nature of agricultural production, distinguishing systems established for field crops like wheat or maize from those designed for perennial cultivation, such as orchards or vineyards. PV structures encompass configurations that employ fixed-tilt frames, manually adjustable mounting systems that can be repositioned seasonally, and dynamic solar-tracking systems that automatically follow the sun’s path to optimise energy capture. Finally, operational flexibility describes whether the system uses a fixed arrangement or an adaptive structure capable of dynamic motion to balance light distribution and power generation [36].
Despite all the technological advances, several critical challenges persist:
  • Divergent stakeholder priorities: Agrivoltaics bridge land use between farmers and solar developers; however, their priorities often diverge, as farmers focus on maximising crop yield and land productivity, while developers prioritise solar energy generation and economic returns [37]. This divergence shapes system design, policy and operational outcomes. Aligning the divergent priorities of farmers and solar developers in agrivoltaic systems requires careful system design, supportive policy, and active stakeholder engagement to achieve both robust crop yields and efficient solar energy generation [38,39].
  • Agronomic uncertainty: Agrivoltaics alter light, temperature, humidity and soil moisture, leading to variable impacts on crop growth and yield. Shading typically reduces photosynthetically active radiation by 20 to 40%, which can decrease yields by 3 to 62%, depending on crop type, panel density and local climate [7,40].
  • Operational challenges: Integrating PV systems into agricultural operations introduces operational challenges for machinery access, irrigation and ongoing maintenance. Panel layout and system design must be carefully planned to avoid disrupting essential farm activities [41,42].
  • Economic challenges: Agrivoltaic systems face substantial financial hurdles, primarily due to high upfront costs, potential reductions in crop yields, and heavy reliance on policy support. High initial investment, uncertain profitability, and policy dependence are the most significant economic barriers [16,17].
  • Site-specific complexities: The requirement for highly customised system design and management based on local climate, soil, crop type and infrastructure in agrivoltaic system makes it location-dependent [43]. While this adaptability is a strength, it introduces disadvantages that hinder widespread adoption, including design and implementation challenges, uncertain performance and yield, gaps in knowledge and expertise and regulatory and economic uncertainty [10,44].
In summary, the deployment of an agrivoltaic system is constrained by economic feasibility, site-specific optimisation, limited empirical validation and operational reliability. Addressing these intertwined limitations is essential for scaling agrivoltaic systems, improving agronomic and energy outcomes and ensuring long-term sustainability.
These challenges highlight the need for a simulation-driven, digital approach to test potential PV configurations before physical deployment, which can do the following:
  • Configuration of PV system parameters, including the number of panels, orientation, tilt, and azimuth.
  • Computation of PV system power and energy generation.
  • Computation of crop-level irradiance to evaluate crop microclimate impacts.
  • Evaluation of the trade-off between energy yield and crop-level irradiance across varying design configurations.
  • Providing decision-support capabilities for farmers, solar engineers, policymakers and researchers in the planning, design and evaluation of agrivoltaic systems.
PV simulation and analytical tools, including PVsyst, Aurora Solar, SAM (NREL), Helioscope, SPADE and others, offer the capability to model system performance, evaluate crop–PV interactions, optimise configurations and assess financial and operational outcomes (Table 1).
Although these tools are robust for energy-focused PV design, none fully address the combined requirements of dynamic PV configuration, panel-level and crop-level irradiance computation, multi-criteria assessment for energy and crop yield, and multi-stakeholder decision support necessary for orchard agrivoltaics. Digital twin technology can serve as a potential solution for the design and operation of agrivoltaic systems. Creating a virtual model that replicates the physical environment enables the simulation of different PV configurations and agricultural layouts under varying environmental conditions. This capability supports data-driven design optimisation before deployment and facilitates continuous operational monitoring, predictive maintenance and performance adjustment throughout the system’s life-cycle.

2.2. Digital Twins

A digital twin is a real-time, bidirectional digital replica of a tangible system or process, representing its status, properties, dynamics and behaviour through synchronisation with its physical counterpart. Driven by advances in sensing, data analytics and computational technologies, digital twin applications are experiencing growing adoption across industries. Leading companies, including Siemens and Tesla, integrate them into their operations to enhance system performance, enable predictive maintenance, and foster innovation across diverse operational domains [50]. A digital twin differs from a digital shadow in terms of interactivity and system integration, while a digital shadow refers to a unidirectional flow of data from the physical entity to its digital representation, allowing monitoring and historical tracking, it lacks the capability to influence or control the physical system based on digital inputs. In contrast, a digital twin supports bidirectional communication, enabling simulation-driven decision-making in which digital outcomes can inform and alter physical processes in real time [19,20]. Digital twins also play a critical role in advancing autonomous systems, enabling machines to learn from simulated environments before acting in the real world. In the agricultural domain, digital twins offer predictive analytics, resource optimisation, and real-time decision support in areas such as crop health monitoring, irrigation management, and disease prevention [51]. These systems often integrate IoT networks, remote sensing data, weather inputs, and artificial intelligence (AI) models to create dynamic, adaptive models of agricultural systems [19,52]. However, many of the existing implementations remain at the digital shadow level, able to collect and visualise data but lacking the capability to transmit commands or exert control from the digital system to the physical counterpart.
A summary of the existing digital twin development approaches is presented in Table 2, outlining the aim, utilised technologies and key findings.
Furthermore, a summary of the existing approaches to digital twin development in agricultural technology is presented in Table 3, outlining the aim, utilised technologies and key findings.
Digital twin technology has rapidly gained interest in agriculture for its potential to enable real-time monitoring, predictive analysis and intelligent control. However, most digital twin implementations remain at an experimental, prototype, or pilot stage, or have been developed in controlled testing environments, highlighting the lack of a framework for developing digital twins.
A key limitation of most of the existing frameworks is the lack of bidirectional communication. These systems function as digital shadows rather than true digital twins, as they merely collect sensor data and present it on dashboards without enabling feedback or control over physical processes [18,19,20]. Consequently, they cannot support dynamic decision-making or system actuation, which are essential for precision farming and intelligent resource management in agriculture. Although communication protocols such as MQTT and Representational State Transfer (REST) application programming interfaces (APIs) are often cited, few studies demonstrate their robust implementation for real-time control or closed-loop operation.
Additionally, most reported systems fall short of building complete, end-to-end digital twin architectures, while some research focuses on sensor networks or dashboard interfaces and others on static 3D modelling or simulation, relatively few integrate these components into a cohesive platform [19]. The lack of integration between real-time IoT data, spatially accurate environmental models, simulation engines and actuator control systems severely limits operational value and scalability. Even among advanced projects, predictive and decision-support capabilities are often lacking [52]. Furthermore, implementations are frequently tightly coupled with specific crops or environments, limiting generalisability. Simulation-only systems are often presented as digital twins, even though they lack integration with real-time data or connected IoT devices, while these tools can be useful for early-stage design and analysis, they fall short of supporting responsive, data-driven management, which is a defining capability of a true digital twin.
A foundational step in digital twin development is creating a virtual replica of the physical asset or process. For applications where the asset is defined by its large-scale physical environment, such as in agriculture or urban infrastructure, this virtual model must be embedded within an accurate geospatial context [53,54]. CesiumJS is an example of a widely used web-based visualisation environment that allows for the rendering of photogrammetric reconstructions, terrain data and dynamic elements in an interactive 3D interface. Its strengths lie in its compatibility with geospatial standards, time-dynamic visualisation capabilities and support for environmental simulations such as sun-path and shadow analysis, which are particularly valuable in agricultural contexts when planning PV panel placement. However, CesiumJS functions primarily as a front-end visualisation tool. It does not inherently provide the backend infrastructure required for real-time IoT data integration, bidirectional communication, predictive modelling or control logic, which are fundamental to digital twin functionality.
Similarly, enterprise platforms such as Dassault Systèmes’ 3DExperience and its module 3DExperienCity extend visualisation and simulation capabilities to larger-scale, multi-system environments [25]. These platforms provide advanced 3D modelling, collaboration and immersive interaction features, making them well-suited for integrating complex geospatial and system-level models. Yet, as with CesiumJS, they operate as interface and simulation environments and must be complemented by backend architecture, such as IoT middleware, time-series databases, and communication protocols, to achieve a full digital twin implementation. Their value lies in providing robust visualisation and interaction layers, but they are insufficient to deliver the closed-loop, data-driven management required of true digital twins.
While the existing research on digital twins in agriculture has made significant progress in demonstrating technical feasibility, it often lacks practical deployment, full system integration and operational completeness. This gap highlights the need for more in-depth research and implementation in real-world settings, with a focus on developing a standardised and modular digital twin framework. This framework should be real-world-validated, interoperable, and designed to support real-time sensor data, spatial accuracy, simulation-based optimisation, and bidirectional control, which are essential for the adoption of digital twins in sustainable orchard-based agrivoltaics.

2.3. Summarised Research Gaps

Despite the growing interest in digital twins and agrivoltaics, a critical gap remains at their intersection. Current research on agricultural digital twins is fragmented, often limited to controlled environments such as greenhouses, or focused on isolated tasks such as monitoring. These systems frequently function as digital shadows rather than true digital twins, relying on simplified 2D models or static visualisations that fail to capture the complex 3D spatial information in the real-world orchard.
Even when techniques such as drone photogrammetry are employed, the resulting high-fidelity 3D models are typically used in isolation for mapping and not integrated into interactive platforms that integrate real-time sensor data. This lack of integration limits the ability of the existing frameworks to support the full agrivoltaic system life cycle. The absence of a unified, modular framework integrating system design, simulation, real-time monitoring, and bidirectional control remains a critical gap in the field. To date, no known studies have integrated high-fidelity photogrammetric models, IoT sensor data and closed-loop actuation mechanisms into a single, cohesive platform for managing agrivoltaic systems [18,63,64,65,66].
The lack of an end-to-end reference framework integrating system design, simulation, real-time monitoring and bidirectional control presents a significant obstacle to adoption among researchers and industry stakeholders. It hinders innovation and prevents the agricultural sector from leveraging the full potential of digital twin technology. A comprehensive guide or reference framework is needed to make the benefits of digital twin technology in agrivoltaics more accessible, repeatable and scalable. Therefore, this study aims to design, implement and validate a novel end-to-end digital twin framework that provides an integrated solution for the design, simulation, monitoring and control of agrivoltaic systems. To address these gaps, this study explores the following research questions:
  • What is an effective and replicable methodology for developing a high-fidelity digital twin framework that supports the interactive design and simulation of agrivoltaic systems within complex orchard environments?
  • What is an effective approach to integrating real-time sensor data for monitoring and enabling bidirectional communication to support end-to-end digital twin frameworks for agrivoltaic systems?

3. Materials and Methods

This study develops and validates an end-to-end digital twin framework for orchard-based agrivoltaic system optimisation, serving both as a functional implementation and as a comprehensive reference model for future applications. The methodology covers stages from data acquisition and 3D model generation to real-time digital twin integration, agrivoltaic system simulation and bidirectional control, addressing the two research questions established in Section 2.3.
  • Digital Model Development and Front-End Interface Setup
    This foundational component focuses on creating a photorealistic and geospatially accurate 3D representation of the physical orchard. It involves a systematic workflow using unmanned aerial vehicle (UAV) photogrammetry to capture high-resolution imagery, which was then processed into a textured 3D mesh. This digital replica was subsequently imported and geolocated within the Cesium platform (version 1.13), which serves as the interactive front-end for visualisation and user interaction.
  • Agrivoltaic System Design and Simulation Framework Integration
    This analytical component integrates a validated PV simulation engine-pvlib (version 0.15) with the 3D geospatial environment. It enables users to interactively design and place virtual PV arrays within the digital orchard model. The core function of this layer is to perform detailed sun-shading and irradiance simulations, enabling quantitative analysis of various agrivoltaic system configurations to optimise the critical trade-offs between energy yield and crop-level irradiance.
  • Data Management Layer Implementation
    This component serves as the foundational data infrastructure and communication framework of the digital twin, enabling seamless data flow and interaction between its constituent elements. It encompasses the entire data pipeline, including real-time data acquisition from an IoT network, efficient transmission via an AWS-hosted MQTT broker, and persistent storage in an InfluxDB time-series database (version 3.0.3). This layer was designed to support the continuous synchronisation and bidirectional communication required to link the physical orchard with its digital counterpart.
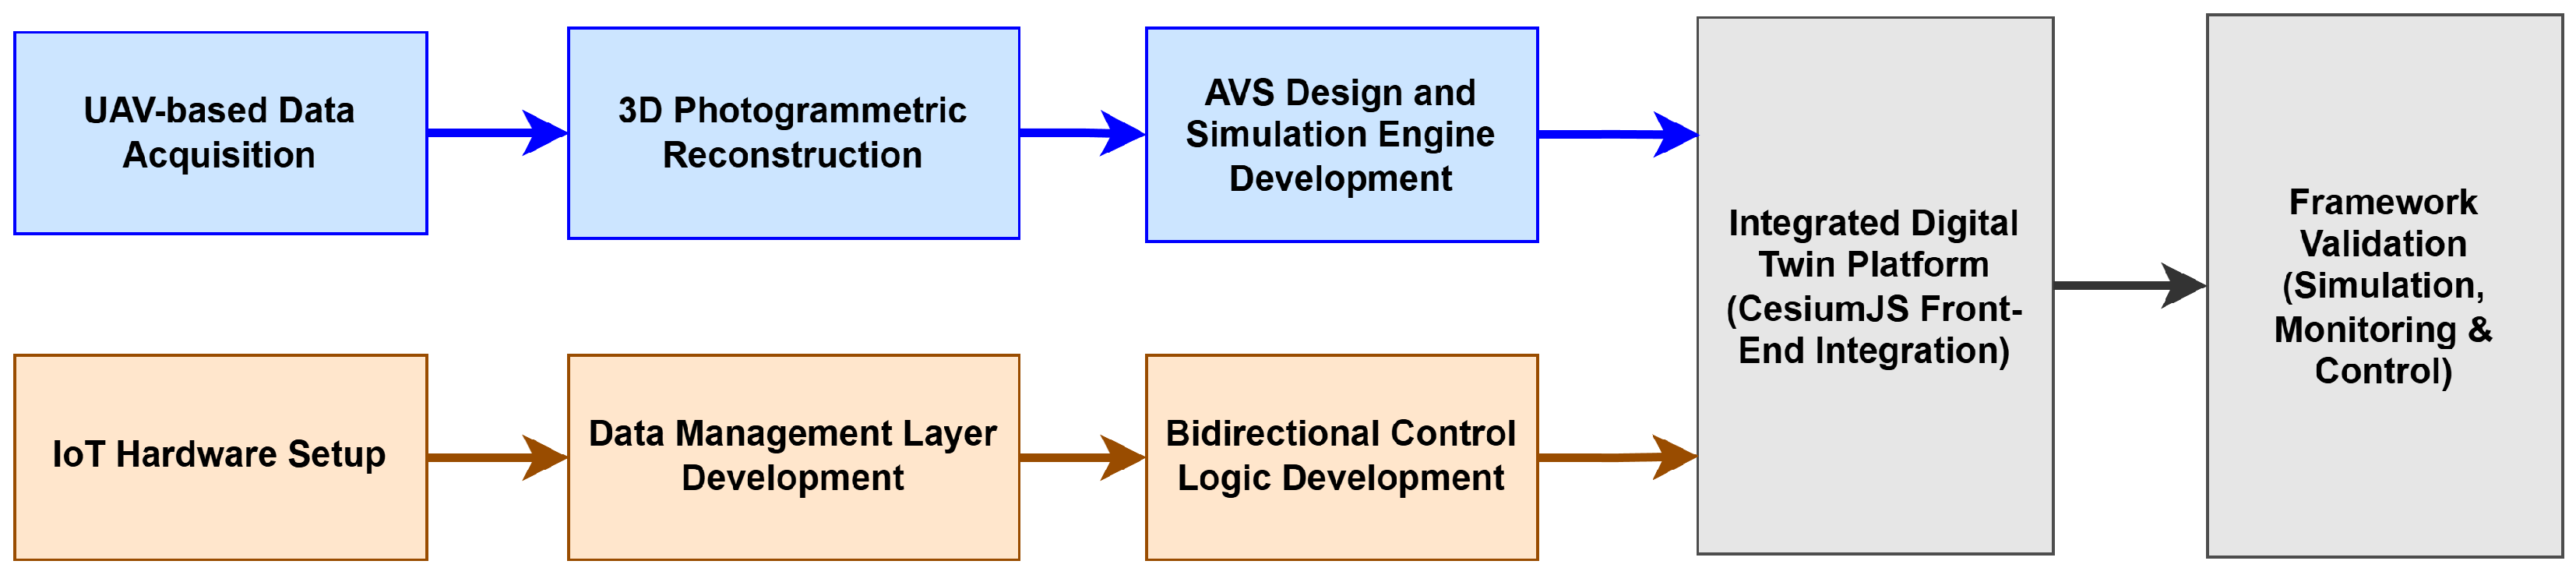
Figure 1 presents a high-level overview of the complete methodological workflow, illustrating the key development stages and their integration into the final digital twin framework.
The methodological workflow is structured into two parallel streams that converge to enable simulation–control coupling. The first stream focuses on the digital environment, starting with UAV-based data acquisition to generate a georeferenced 3D model, which serves as the spatial foundation for the agrivoltaic design and simulation engine. The second stream establishes physical connectivity through the IoT hardware setup and the development of bidirectional control logic. These streams are integrated within the CesiumJS platform, where the data management layer facilitates the exchange of information. In this integrated architecture, simulation outputs provide the analytical basis for operational decision-making, allowing the user to manually adjust the setpoints of the physical trackers via the dashboard interface. Simultaneously, real-time sensor data from the hardware is fed back into the digital twin to synchronise the virtual and physical states. This synchronisation ensures that the design, monitoring and control phases function as a cohesive, interoperable system rather than as isolated components.

3.1. Digital Model Development and Front-End Interface Setup

A critical step in developing the orchard agrivoltaics digital twin was generating an accurate, georeferenced 3D model of the orchard environment that reflects the complex spatial characteristics of the terrain and tree canopies. This was achieved through a photogrammetric workflow supported by the drone-based image acquisition and photogrammetric processing software Bentley iTwin Capture (version 24.1.7).

3.1.1. Aerial Survey Planning and Image Acquisition

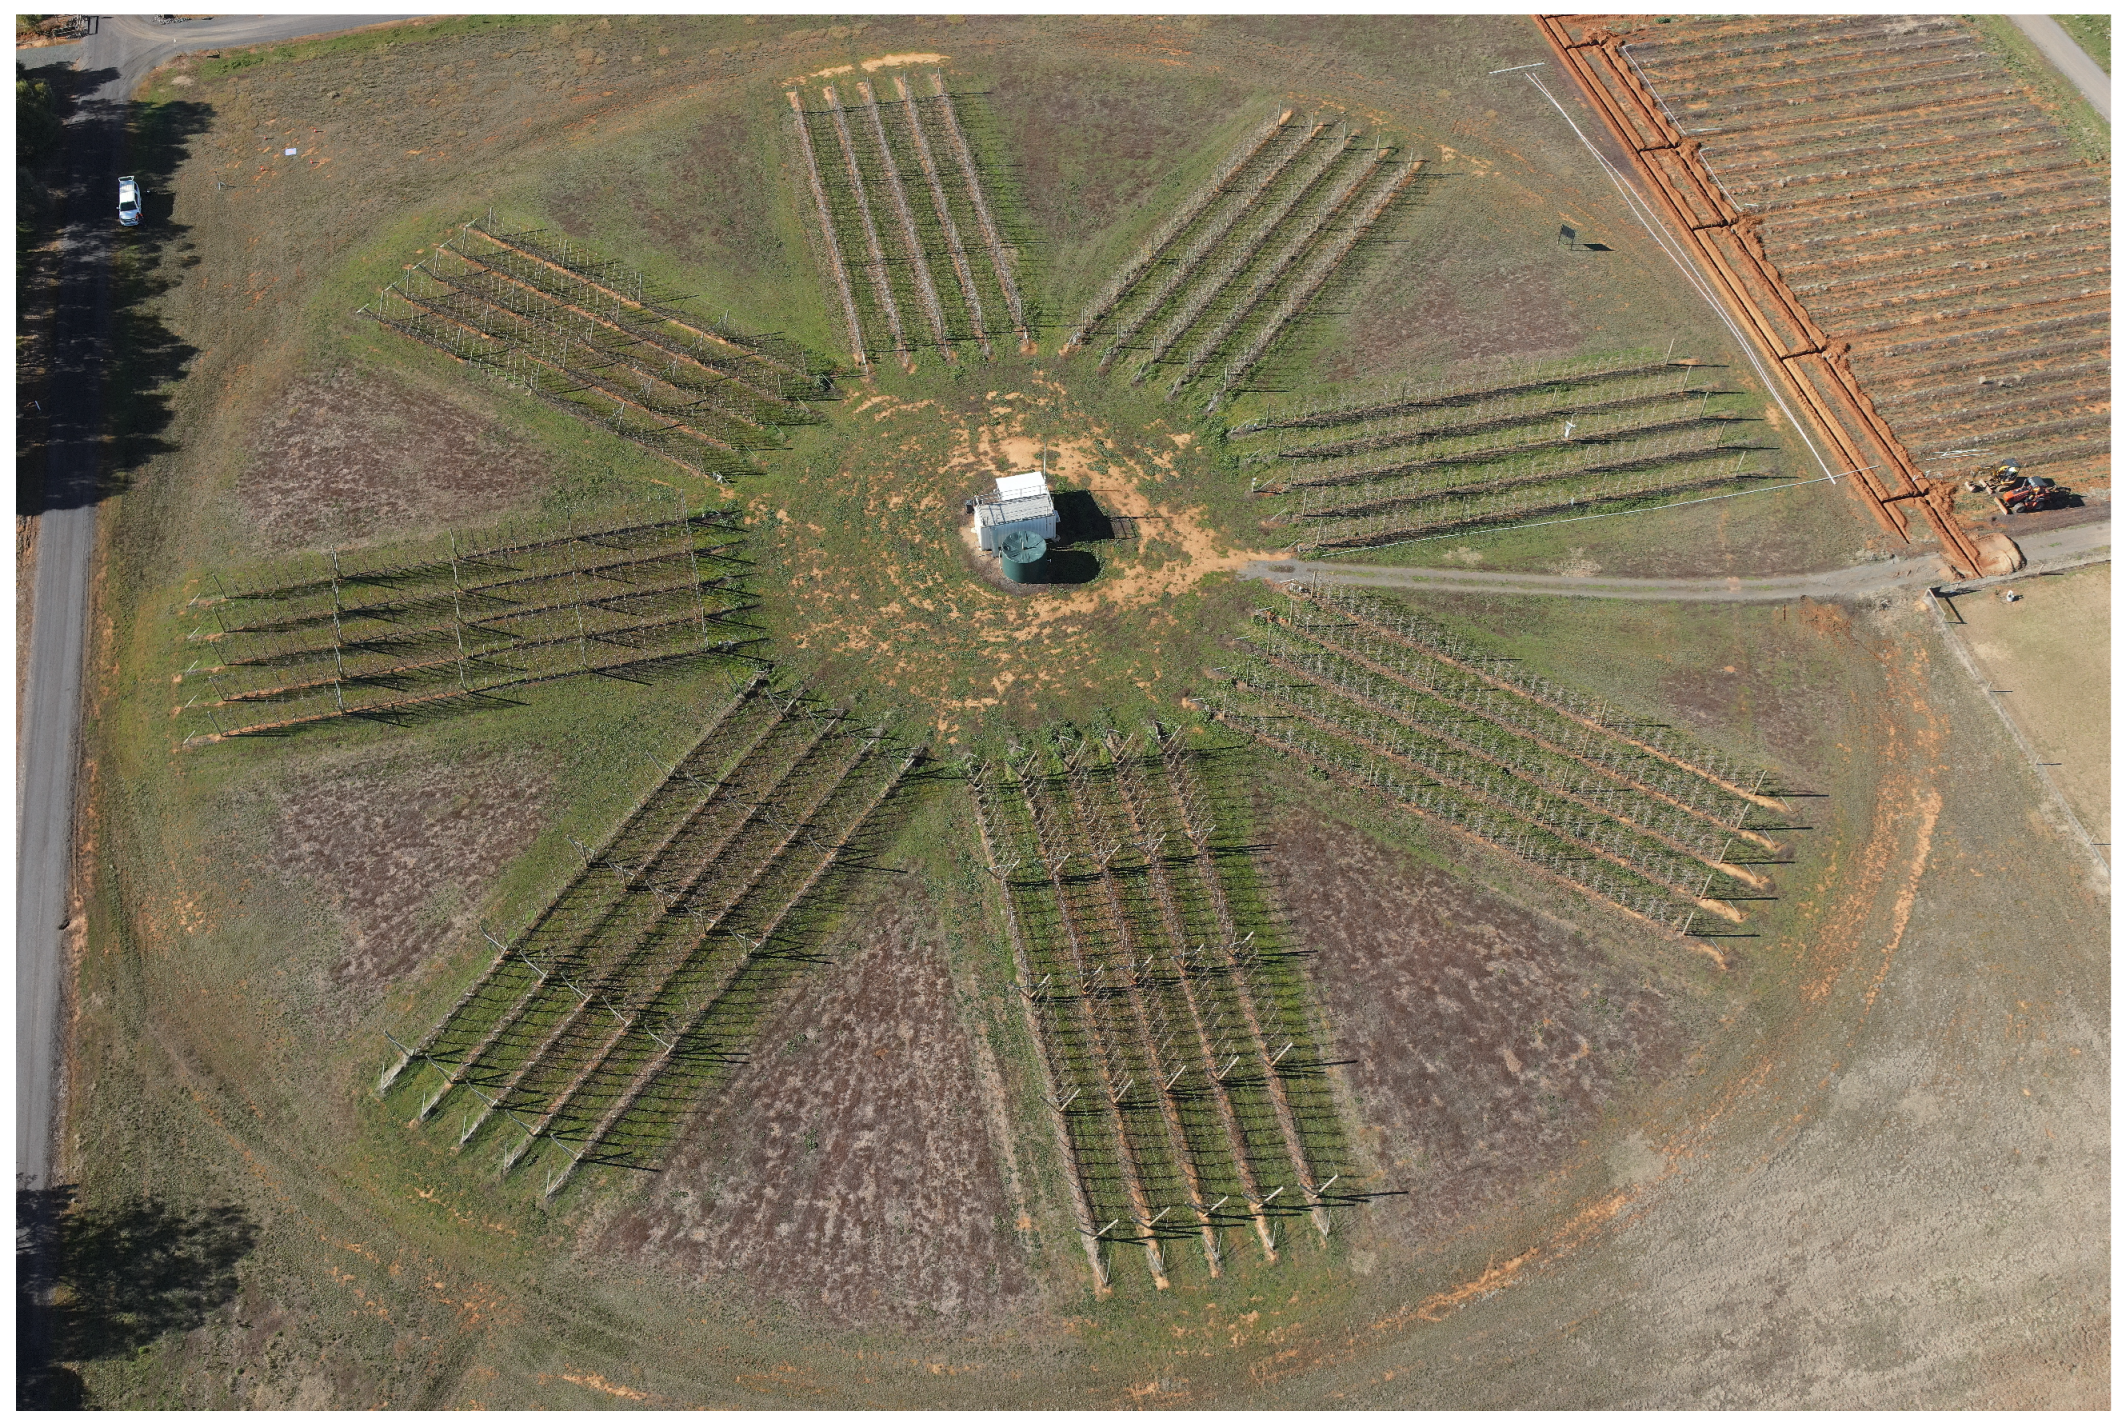
The study was conducted at the Sundial Orchard, shown in Figure 2, a research facility operated by Agriculture Victoria and located in the Goulburn Valley region of northern Victoria, Australia.
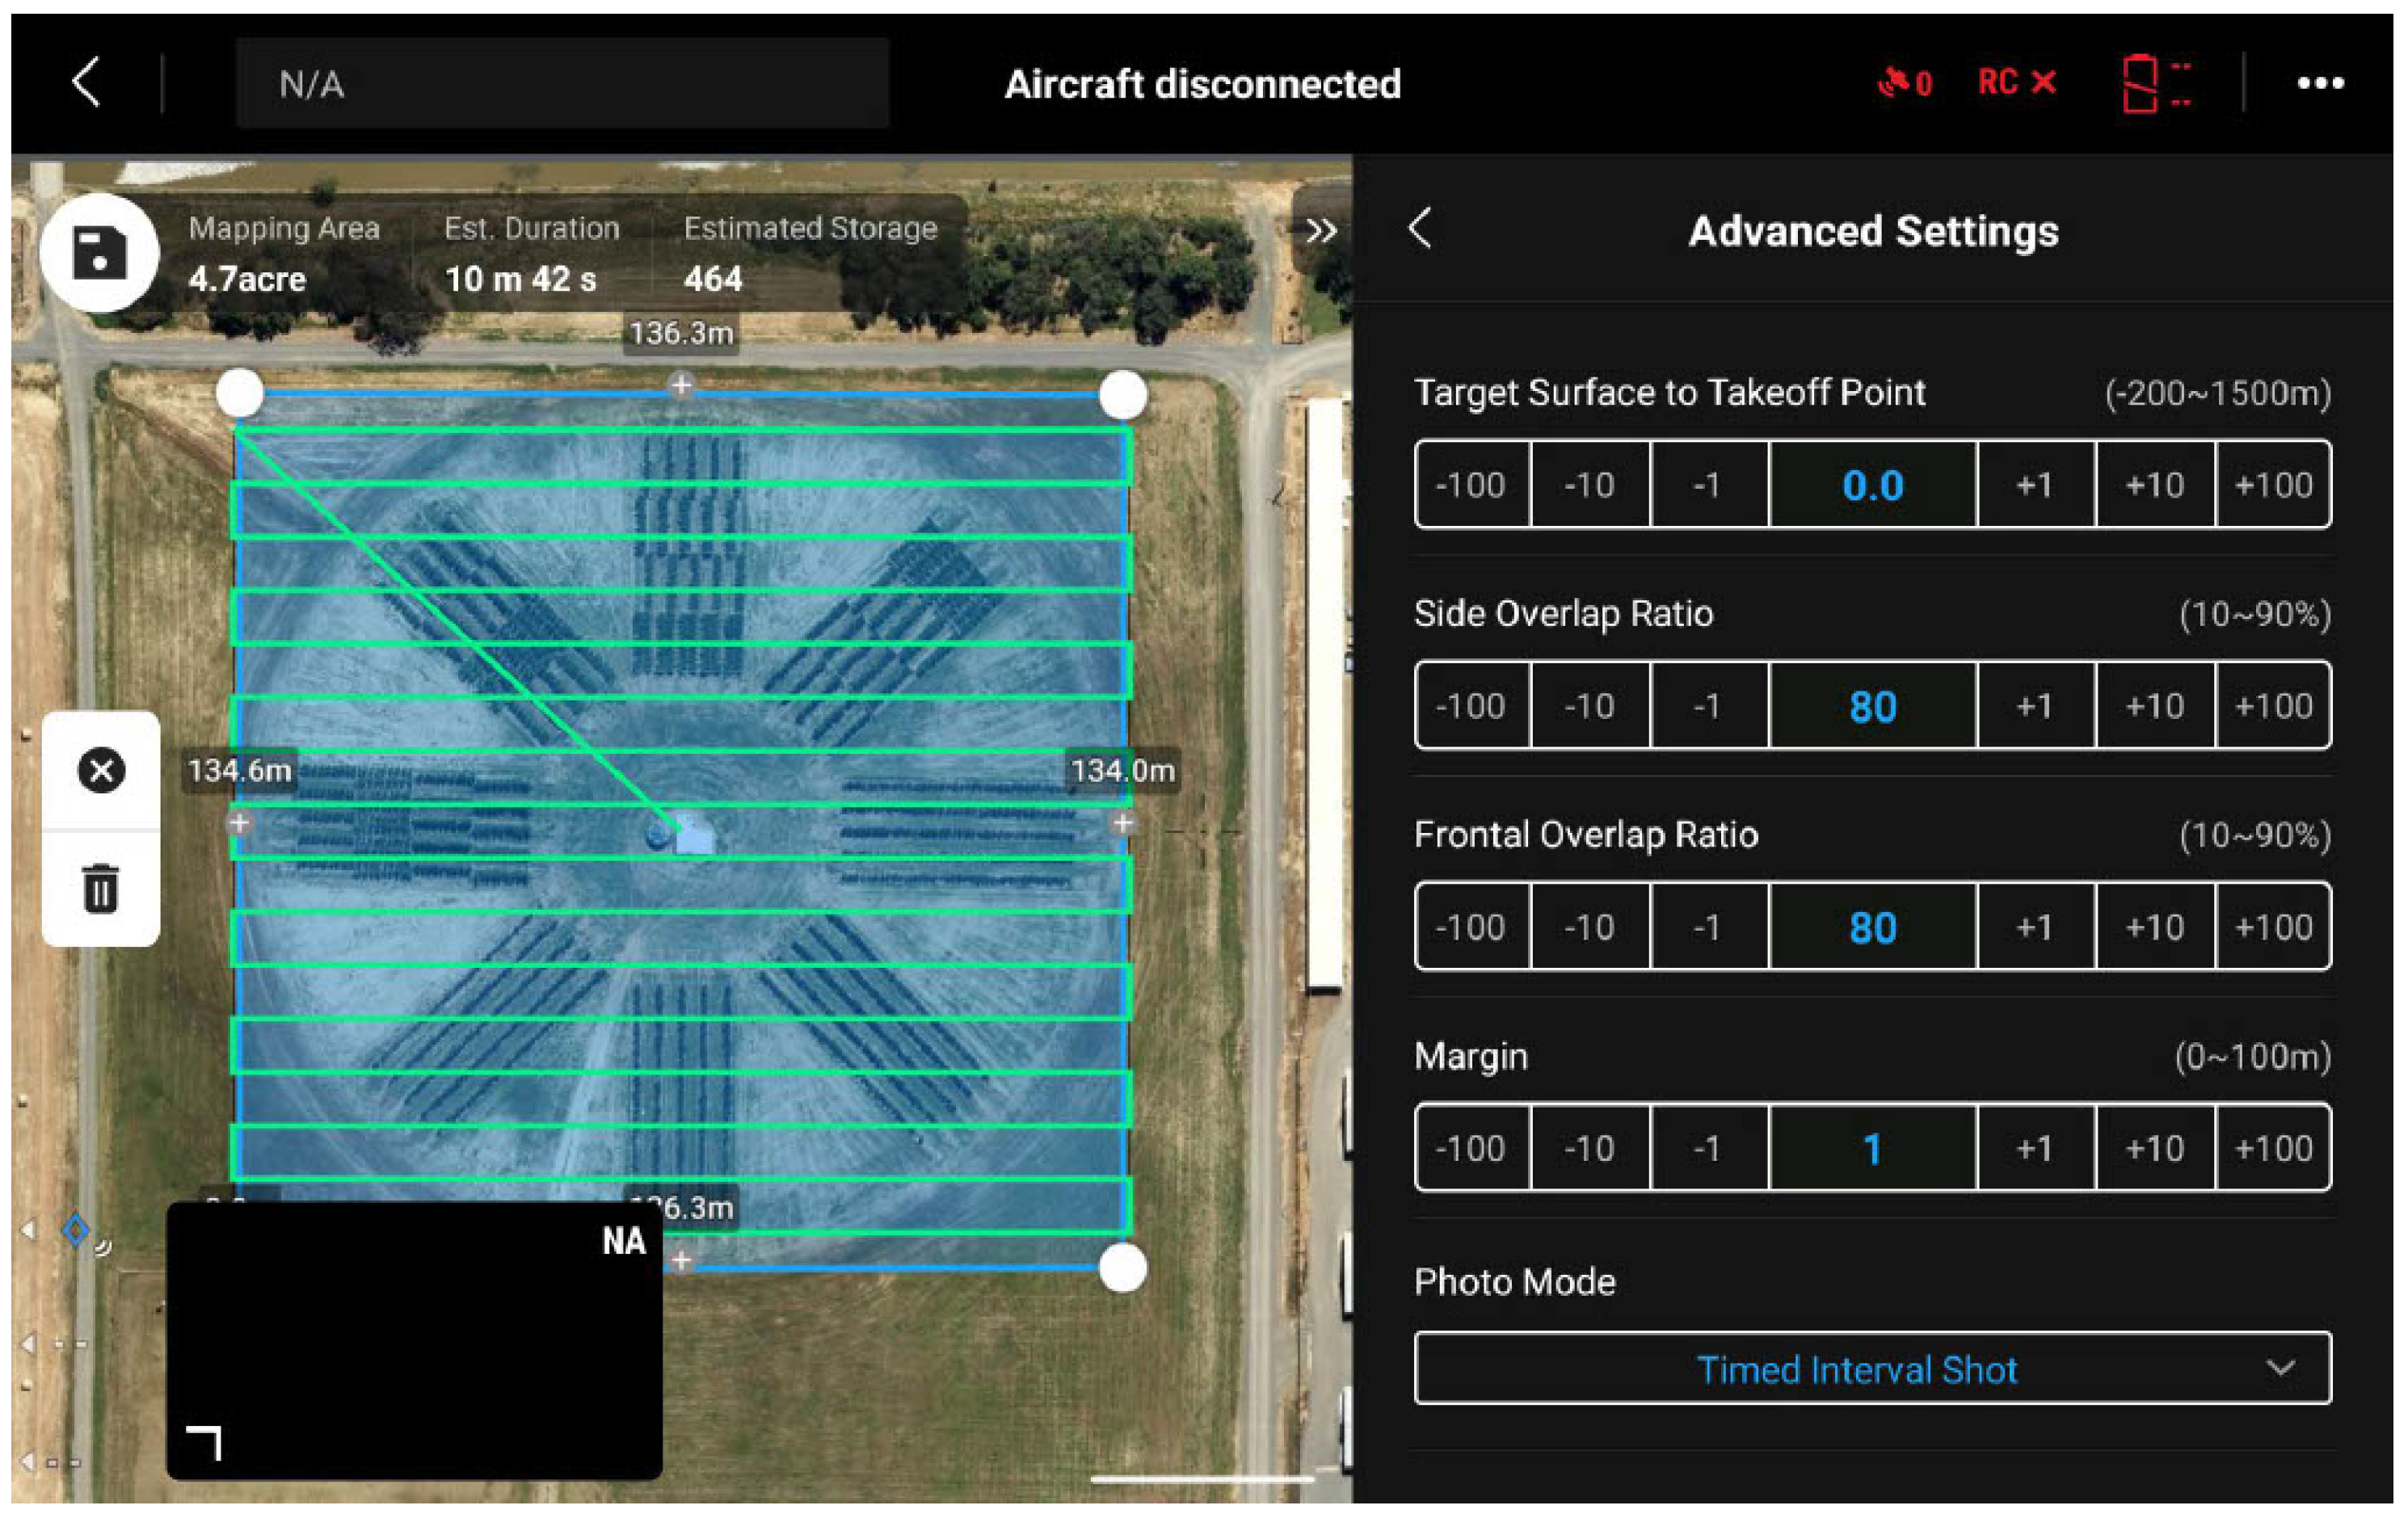
To facilitate automated flight path planning and ensure adequate image overlap for reliable photogrammetric reconstruction, flight planning and UAV-based image acquisition were conducted using a DJI surveying and mapping platform (Figure 3). The system comprised a DJI Matrice 350 RTK (DJI, Shenzhen, China) unmanned aerial vehicle equipped with a Zenmuse P1 45-megapixel full-frame photogrammetry camera with a 35 mm fixed-focus lens (DJI, Shenzhen, China) and a Zenmuse L2 LiDAR sensor (DJI, Shenzhen, China).
The flight plan specified waypoint coordinates, altitude, camera triggering intervals and speed to maximise consistency and quality of imagery. Key planning parameters included forward and side overlaps of 80%, to ensure robust feature matching during reconstruction. Georeferenced images were captured during acquisition to ensure accurate reconstruction of the orchard using photogrammetry.
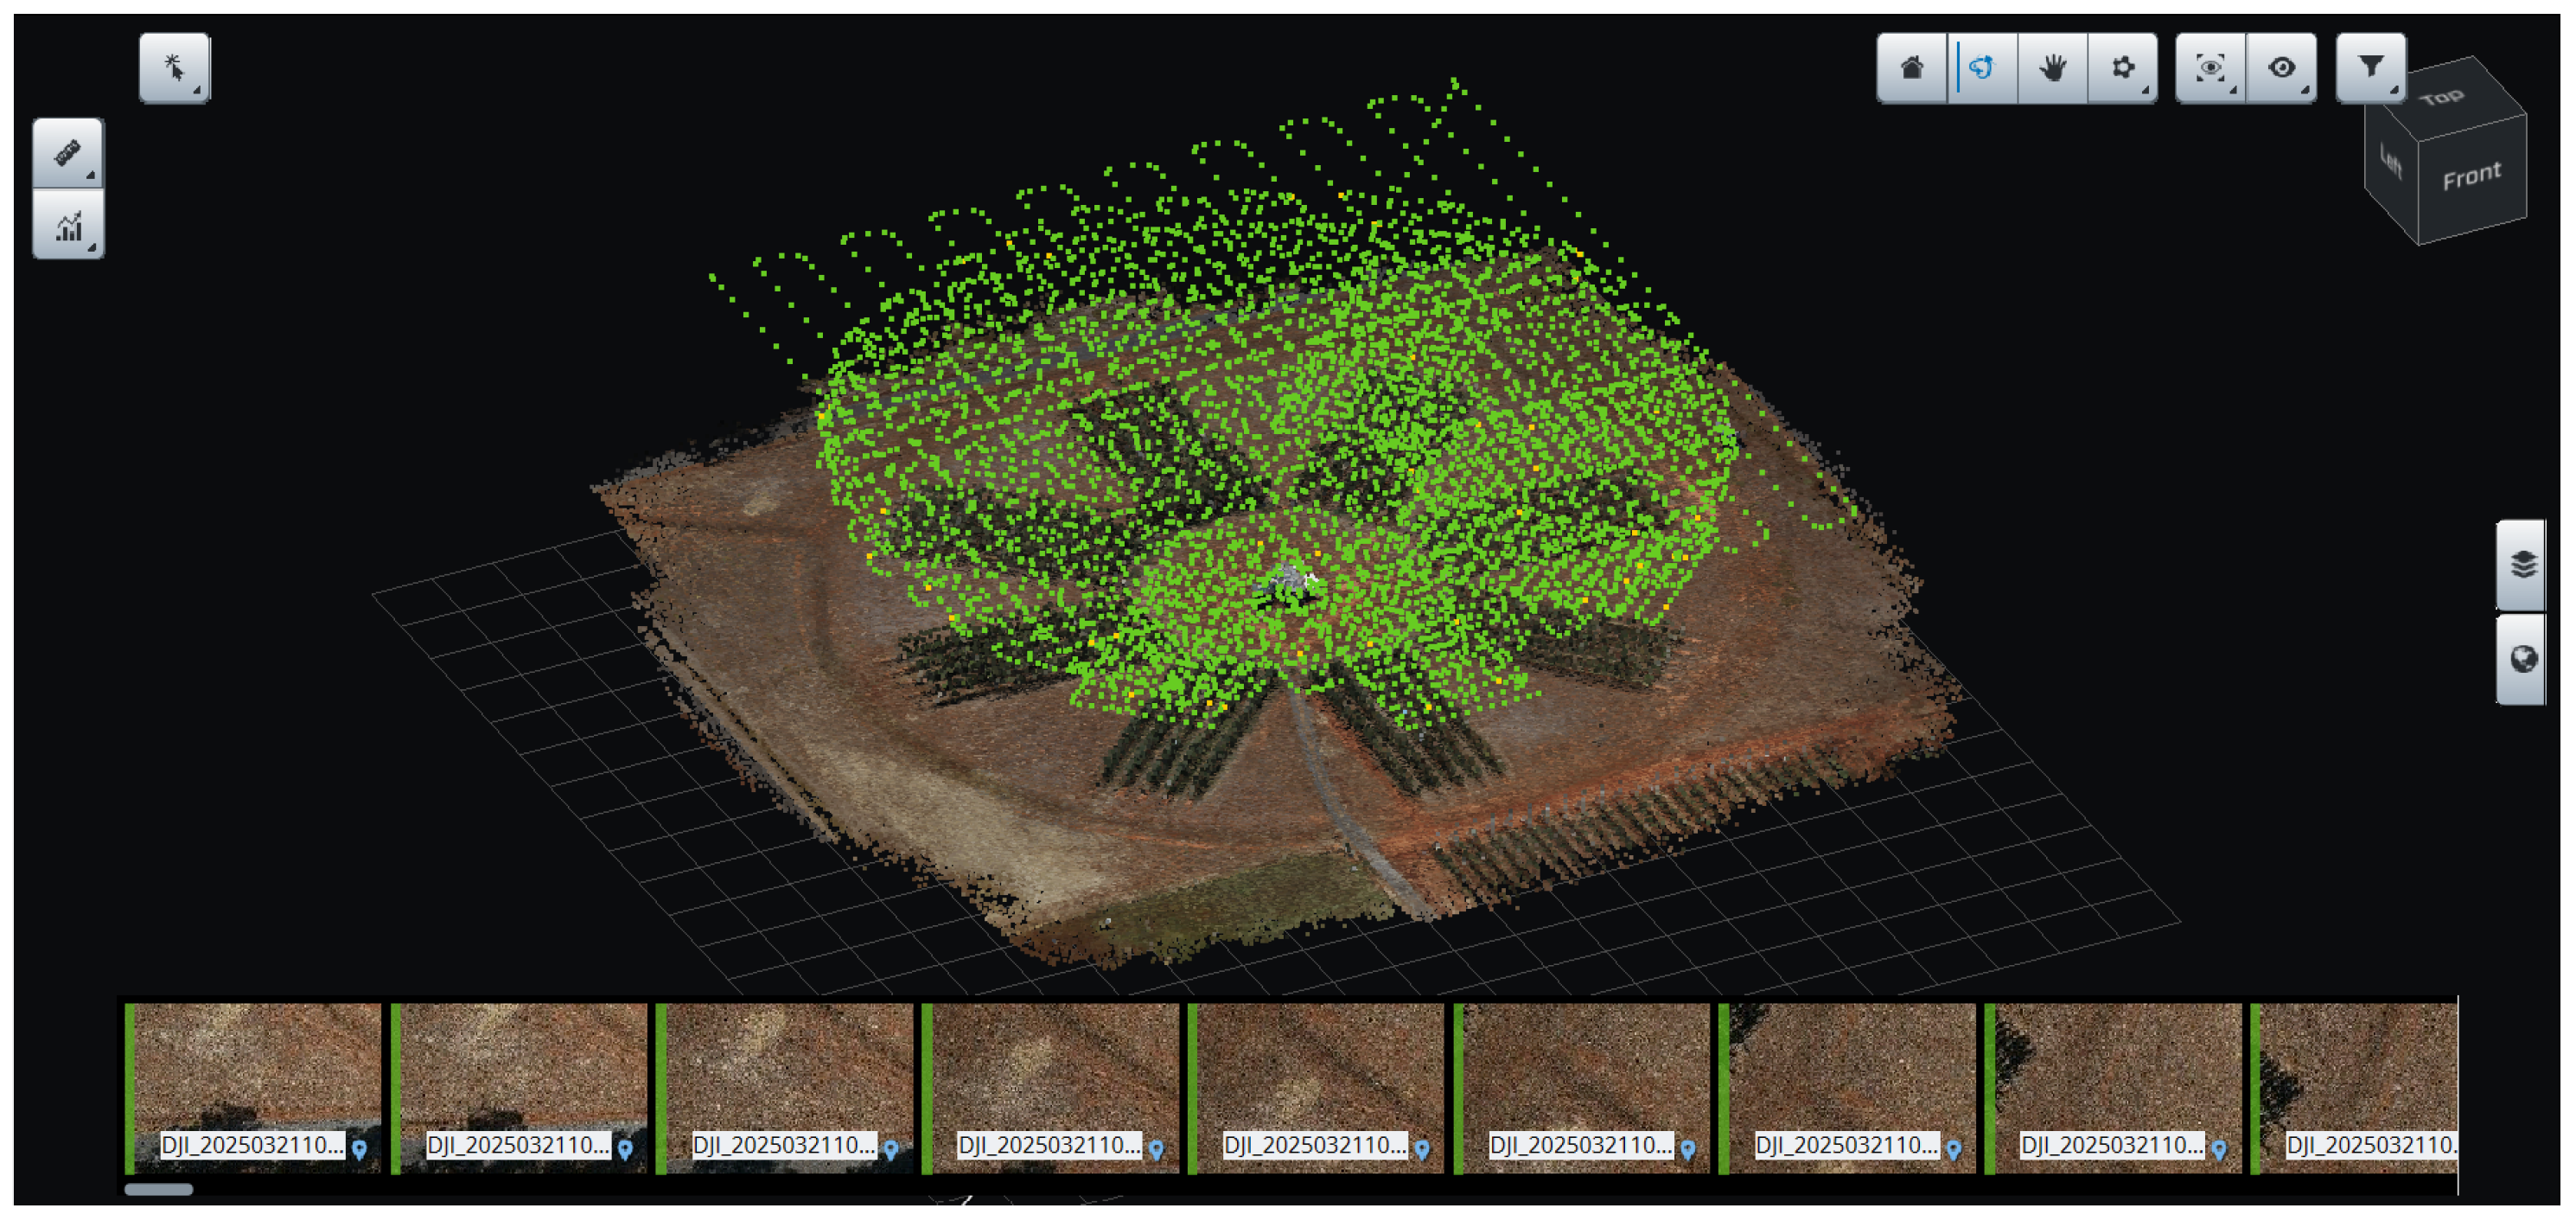
As indicated in Figure 3 and Figure 4, the UAV operations were performed in multiple flight paths to create an accurate representation of the orchard. A combination of nadir and oblique grid patterns was used for the drone flight path and camera orientation during image acquisition. The UAV was operated from the north to the south side of the orchard and from the east to the west side of the orchard, capturing images at multiple camera angles, including 90° (vertical), 75°, and 60°. This was performed at 15 m and 20 m above ground level. Furthermore, orbit flight paths were conducted over each crop area to enable accurate, detailed canopy and structural modelling in the orchard. The acquisition phase for the 4.7-acre orchard involved approximately 3000 images (100 GB), requiring roughly 40 min of flight time. This highlights a manageable data-to-area ratio for medium-scale operations, though larger farms would require tiered data management. This UAV-based image acquisition was carried out over two distinct seasons for the project, capturing variations in canopy structure between the fruiting and dormant stages. This indicates the seasonal changes in canopy coverage, and temporal comparisons can support tracking of tree development.

3.1.2. Photogrammetry Reconstruction

The acquired images were imported into Bentley iTwin Capture Modeller, which was used to set up the photogrammetric reconstruction pipeline. The pipeline began with aero-triangulation, a photogrammetric process that determines the three-dimensional position and orientation of images by identifying common features across overlapping images. The camera GPS coordinates, obtained from georeferenced data, were used, along with feature matches derived from aero-triangulation, to generate an accurate dense point cloud. Then, the 3D reconstruction step was initiated using the 3D tiling technique, which divided the orchard 3D model into smaller spatial units for reconstruction. This approach significantly reduced processing time and optimised memory usage. The reconstruction of the Sundial Orchard involved processing approximately 100 GB of raw imagery. The aero-triangulation and 3D tiling stages were completed within approximately 42 h using a dedicated workstation, highlighting that while the process is computationally intensive, the use of spatial tiling effectively manages memory constraints. This computational investment is necessary to achieve the high-fidelity geometric reconstruction of the orchard. By capturing specific canopy volumes and terrain variability, the framework ensures that the subsequent irradiance simulations accurately represent real-world shading dynamics in complex agricultural environments.
Figure 4 depicts the 3D mesh model generated using the georeferenced images during the 3D reconstruction stage of the project. The final output, a georeferenced 3D mesh model of the orchard, was exported in the Cesium 3D Tiles format for integration into the Cesium platform. This mesh provided the high-fidelity virtual foundation necessary for developing the interactive digital twin.

3.1.3. Front-End Interface Setup

The front-end interface of the digital twin was developed using CesiumJS, an open-source JavaScript library for creating high-precision web-based 3D globes and maps. This platform was selected for its open-source nature. Additionally, its architecture is specifically designed to efficiently stream and render large 3D datasets over the internet, a critical requirement for delivering a high-fidelity digital twin.
To address the challenge of rendering the large, high-resolution 3D mesh model in a web browser, the model was exported from Bentley iTwin Capture into the Cesium 3D Tiles format. This step converts the single large-scale model into a hierarchical set of smaller tiles. This format utilises level-of-detail rendering, which is essential for the framework’s performance, enabling efficient, real-time exploration of the large-scale orchard model without exceeding computational or memory constraints on user devices.
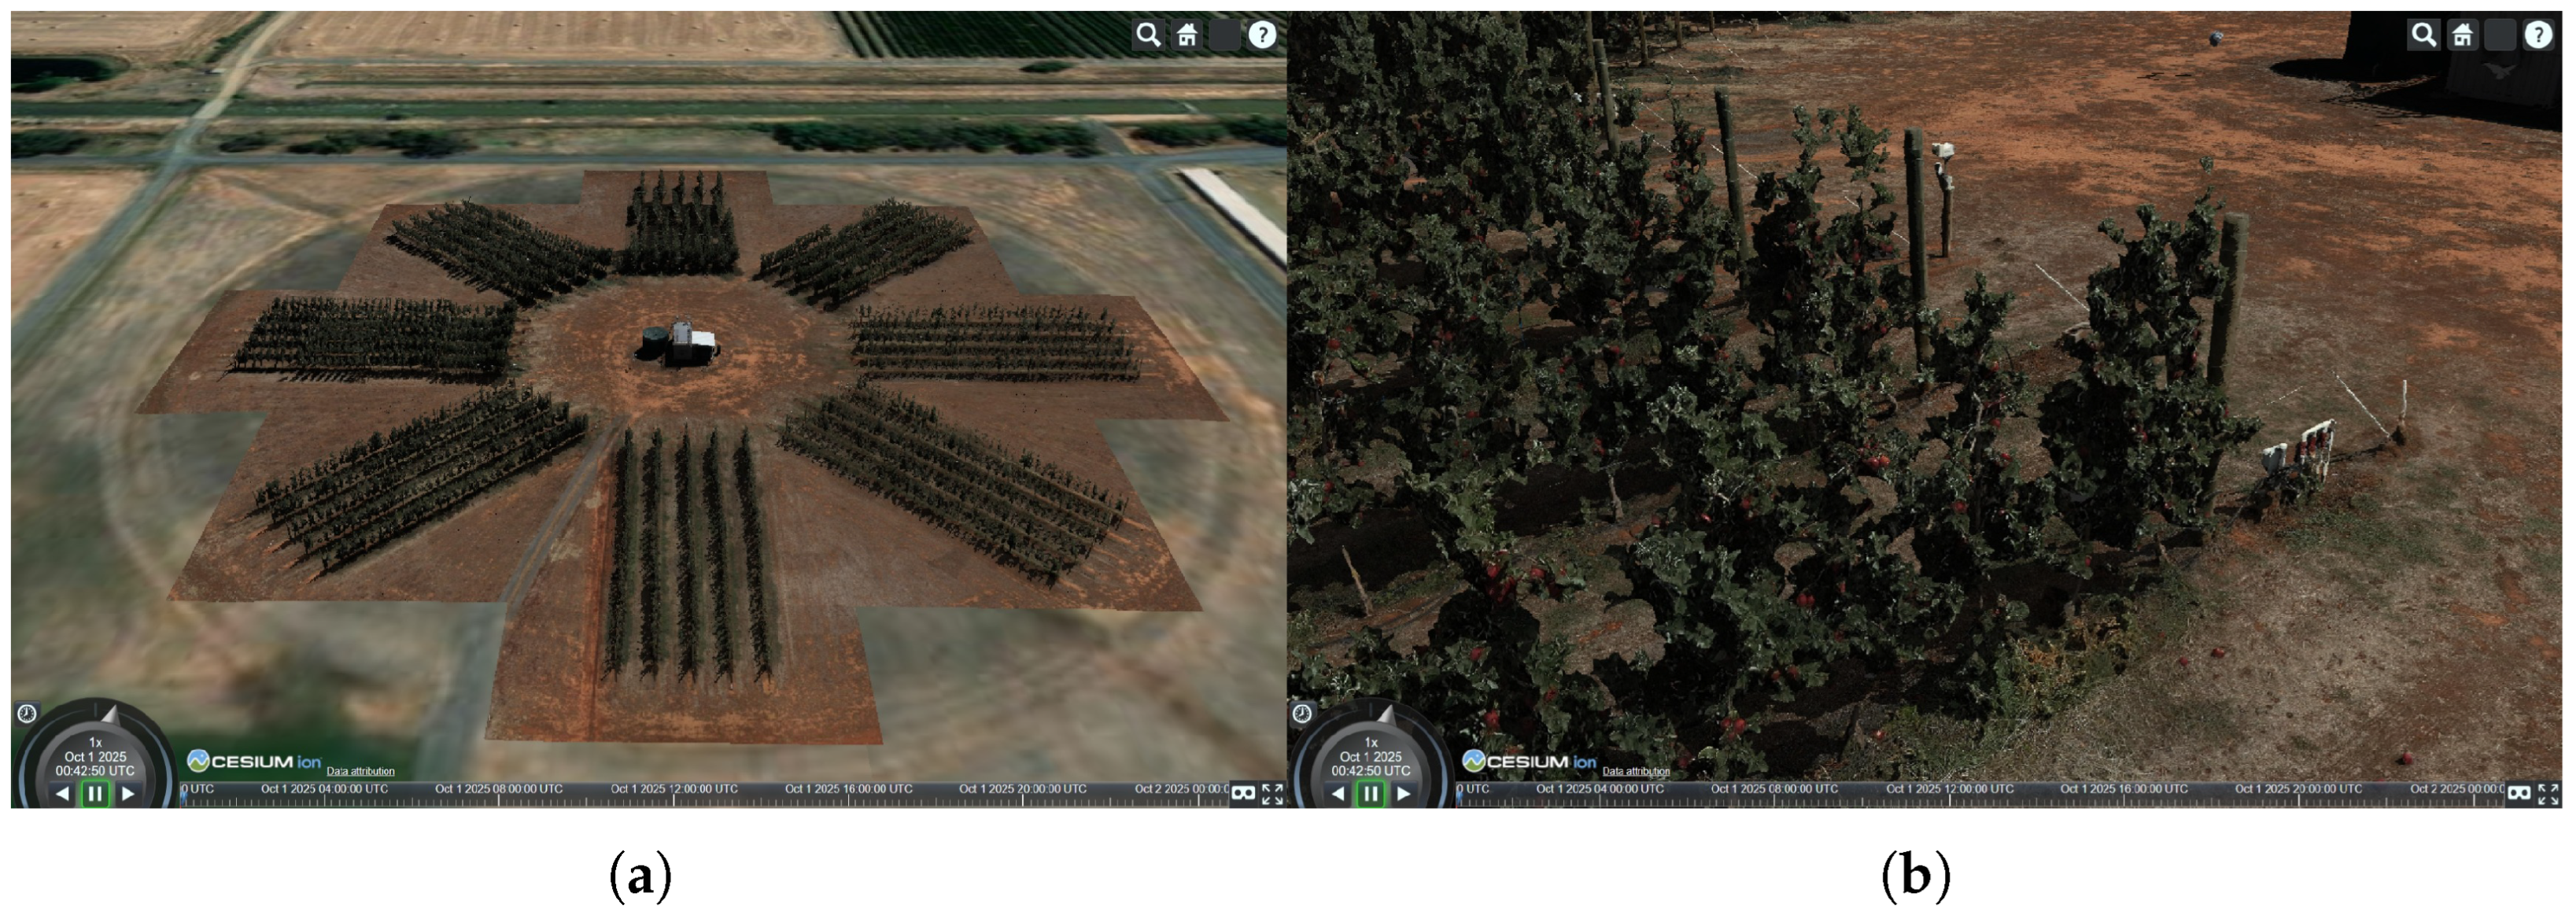
The export process from Bentley iTwin Capture was utilised to generate a self-contained CesiumJS web package. This package bundled the 3D tileset of the orchard with all the necessary HTML, CSS and JavaScript files to create a functional web-based interface. This application provided the core visual foundation, which was then customised and extended to integrate sensor data and simulation outputs, forming the complete interactive digital twin platform. Figure 5a presents the 3D model of the orchard rendered within the Cesium web interface. Figure 5b presents a zoomed-in view of a specific area within the orchard model, highlighting finer details rendered in the Cesium interface.

3.2. Agrivoltaic System Design and Simulation

A custom web-based platform was developed to enable integrated site setup, PV array placement and irradiance simulation within a unified workflow. The agrivoltaic system design and simulation framework can be divided into front-end development for PV system design and back-end development for simulating irradiance at the crop level and energy generation.

3.2.1. Front-End Development

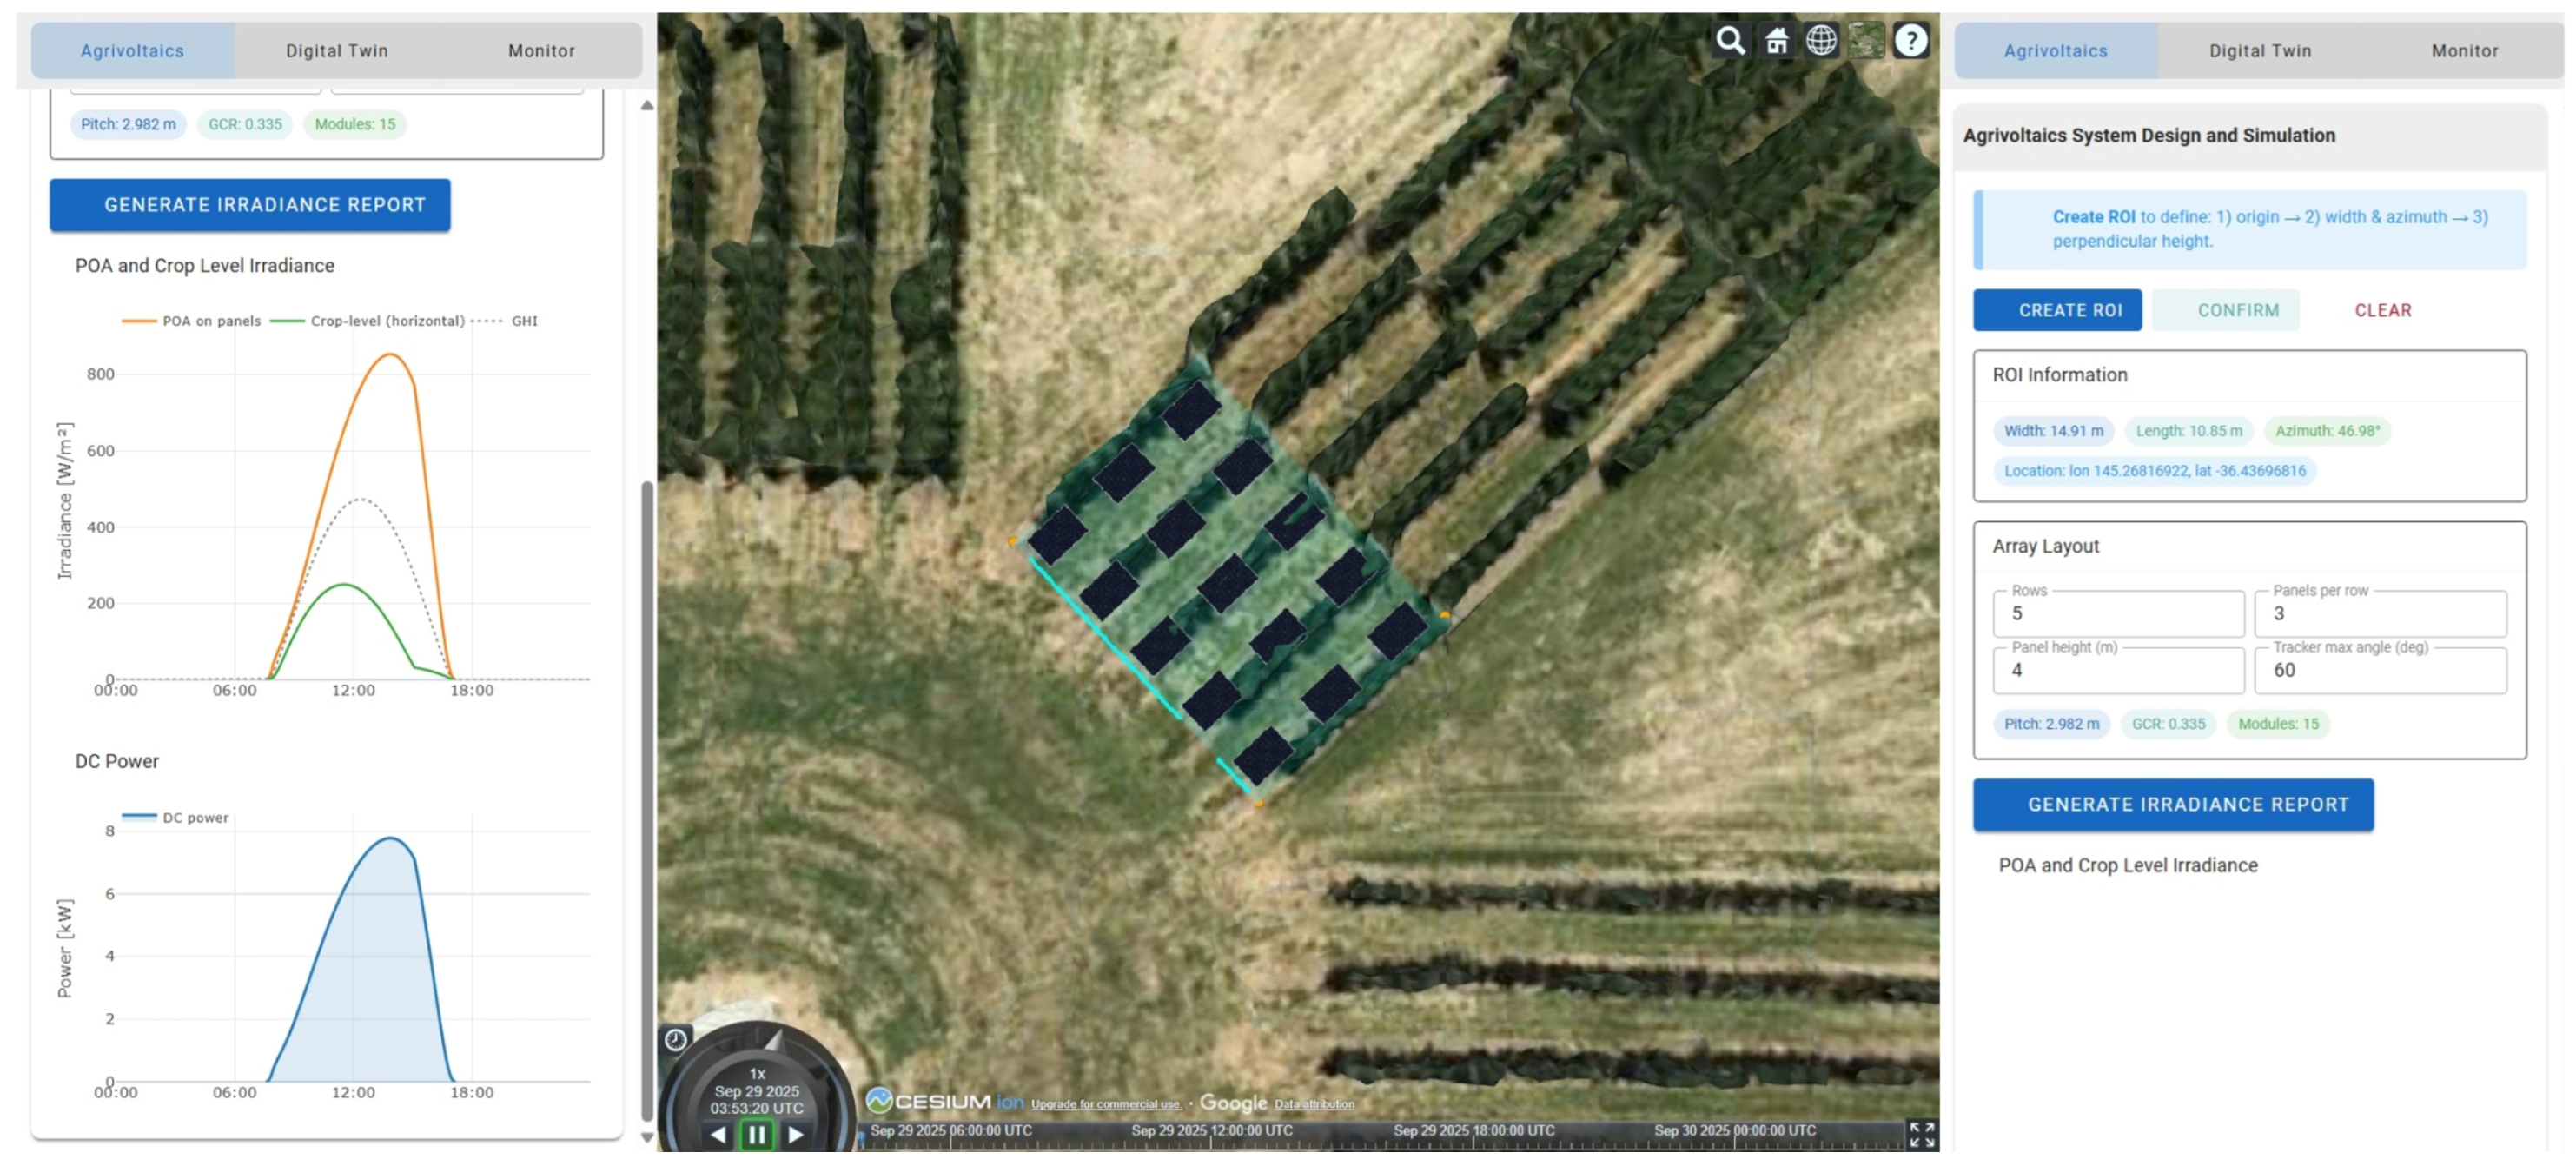
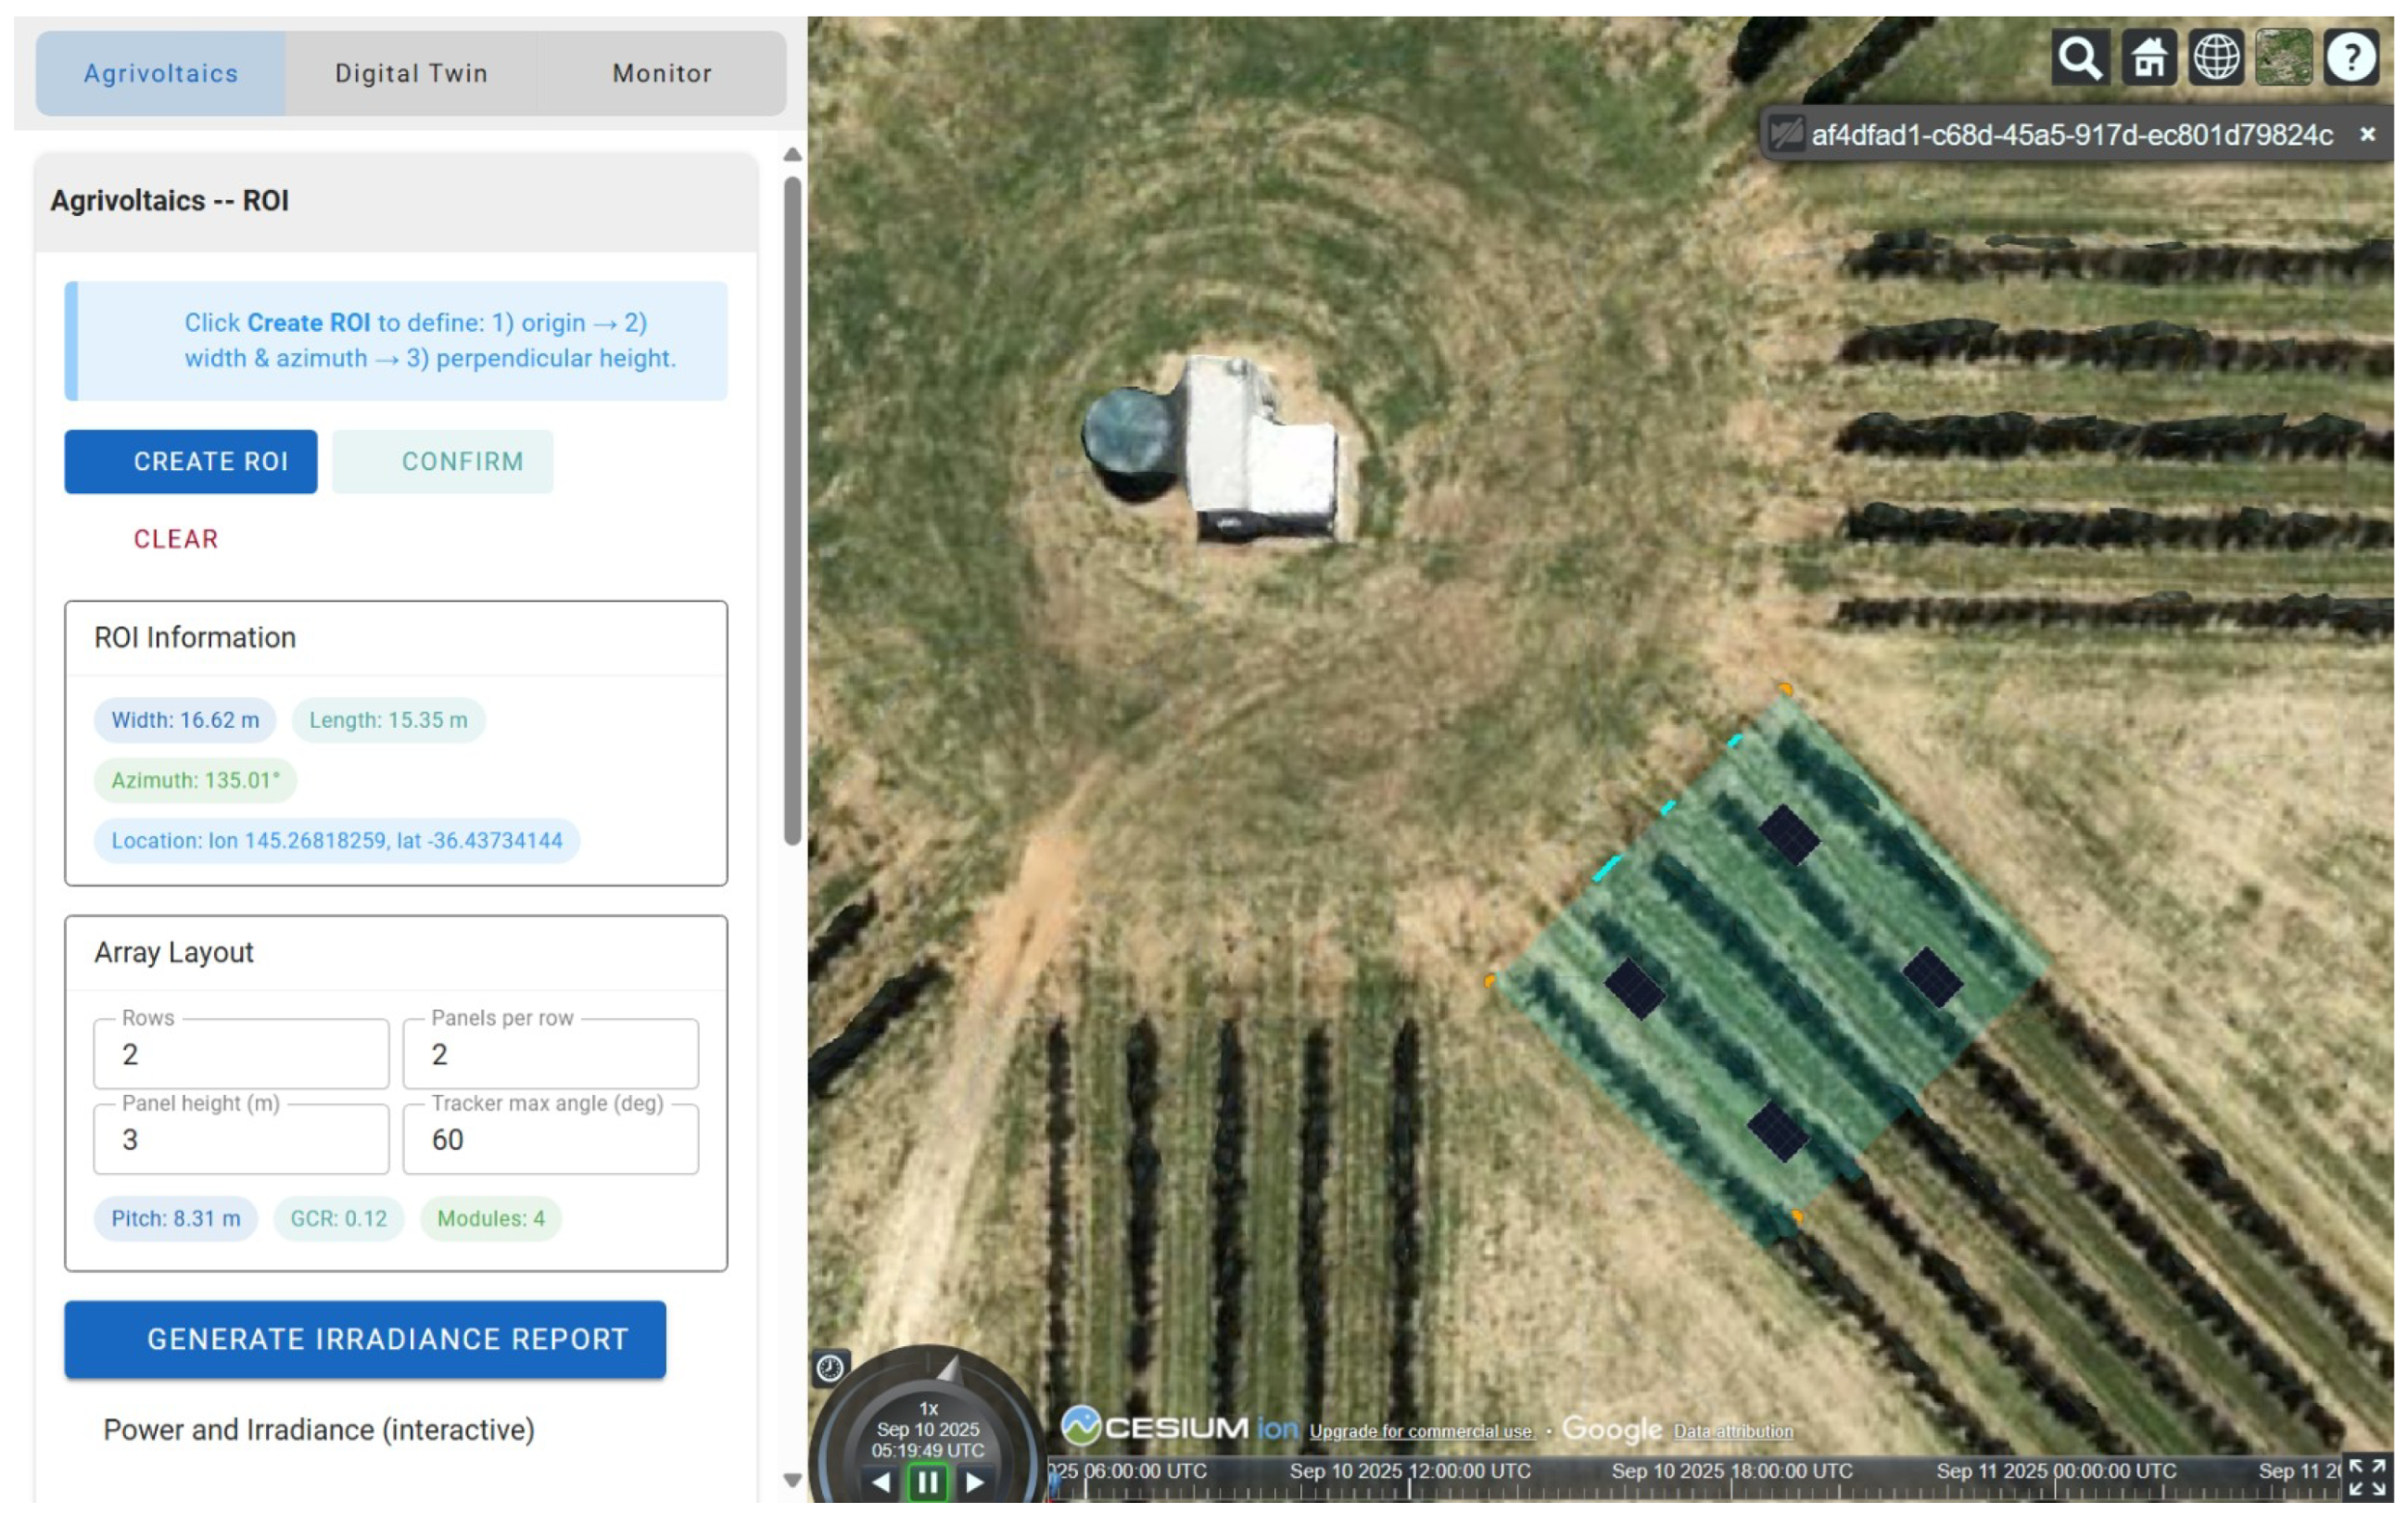
The front-end was implemented, integrating a custom user interface and a Cesium web application (Figure 6). Both components are interconnected to support interactive design, real-time feedback and synchronised system updates. The interface employed event handlers for key user actions such as defining a region of interest (ROI), updating PV configuration and simulating power generation and irradiance.
To begin with the PV design, users define the ROI within the Cesium environment through a three-point click interaction: the first two clicks specify the width and azimuth, and the third determines the length. The corresponding ROI data, such as location, azimuth, and dimensions, are stored for subsequent simulation. Once confirmed, a 3D PV array model is automatically generated and displayed within the ROI.
The custom configuration panel enables users to define PV system parameters, including the number of rows, modules per row, tracker tilt angle and nominal module height. These inputs are dynamically linked to the Cesium environment, ensuring that the 3D PV system model updates instantaneously to reflect the selected configuration. The system also calculates and displays derived metrics such as row pitch and ground coverage ratio (GCR), allowing users to iteratively refine and optimise the array layout before running simulations.

3.2.2. Back-End Development

The back-end architecture was implemented in Python (version 3.12) using the FastAPI framework to ensure high-performance, asynchronous handling of simulation requests. This specific stack was selected to support the modularity of the reference architecture, as Python’s extensive ecosystem of scientific libraries allows for the seamless integration of diverse environmental and energy models. Leveraging the pvlib library, the system computes solar position, irradiance on tilted planes and PV system output under user-defined configurations. For simulations, the framework allows evaluation of different system parameters and design configurations, enabling assessment of their impact on both energy generation and crop-level irradiance. Results are returned in structured JSON format, including plane-of-array (POA) irradiance and crop-level irradiance, power generation profiles and energy generation. By running multiple simulations and testing different parameters, the framework shows how design choices can influence both the energy produced by the panels and the light reaching the crops. This iterative process allows for effective refinement of system configurations without the risks and costs linked to physical deployment.
Simulations were conducted under a defined set of assumptions to evaluate system performance under ideal conditions [26]. Specifically, all simulations were performed for a single clear-sky day. The selection of 1 July 2025 (winter in the Southern Hemisphere) served as a baseline ’worst-case’ scenario for shadow length and inter-row shading, providing a clear demonstration of the framework’s geometric simulation capabilities under simplified atmospheric conditions. The assumptions are listed as follows:
  • Clear-sky irradiance conditions.
  • PV modules: 660 W bifacial units with rear-side irradiance capture explicitly included.
  • Single-axis tracking with backtracking to reduce shading losses.
  • Inter-row shading effects are used to partially account for mutual shading between adjacent PV rows.
  • Constant ground albedo, disregarding seasonal or crop-related variations that could influence diffuse irradiance beneath the panels.
  • Isotropic treatment of sky diffuse irradiance, without applying directional or atmospheric corrections.
When the simulate function is triggered, the current ROI and array parameters are transmitted to the API. Simulation outputs are rendered on the front-end as interactive plots.

3.2.3. Framework for Analysis of Agrivoltaic System Configurations

To assess the impact of varying PV configurations on power generation and crop-level irradiance, a series of simulations was conducted using the developed digital twin framework. The analysis began with a baseline configuration that served as the reference model for subsequent comparisons. In this baseline setup, PV modules were oriented along a north–south axis (axis azimuth = 0°), mounted at a height of 4 m, and arranged into five arrays consisting of three panels each. The system operated with a single-axis tracking mechanism featuring backtracking control and a maximum tracking angle of 60°.
Building upon this baseline, a series of configuration variants was simulated to examine the effects of geometric and operational parameters on system performance. The first set of variations explored changes in the axis azimuth, specifically 45°, 90° and 135° to analyse the influence of orientation on solar exposure and shading dynamics. The second set of simulations introduced adjustments to the PV system design, including an increased module mounting height of 5 m, conversion to a fixed-tilt configuration and an expanded array layout comprising seven rows. These comparative analyses provided insights into how structural and control modifications influence both energy yield and light availability at the crop level.
In this study, crop-level irradiance is utilised as a primary physical proxy for agricultural impact, while this provides a high-resolution map of light availability, it is acknowledged as a simplification that does not account for the complex, multi-year physiological responses of perennial crops to altered microclimates.

3.3. Data Management Layer Implementation

The data management layer serves as the core component of the digital twin framework, establishing a data pipeline to enable continuous, bidirectional information flow between the physical orchard and its virtual counterpart. The implementation of this layer is critical for maintaining state synchronisation and for allowing the closed loop to control that defines a digital twin.

3.3.1. IoT Architecture and Implementation

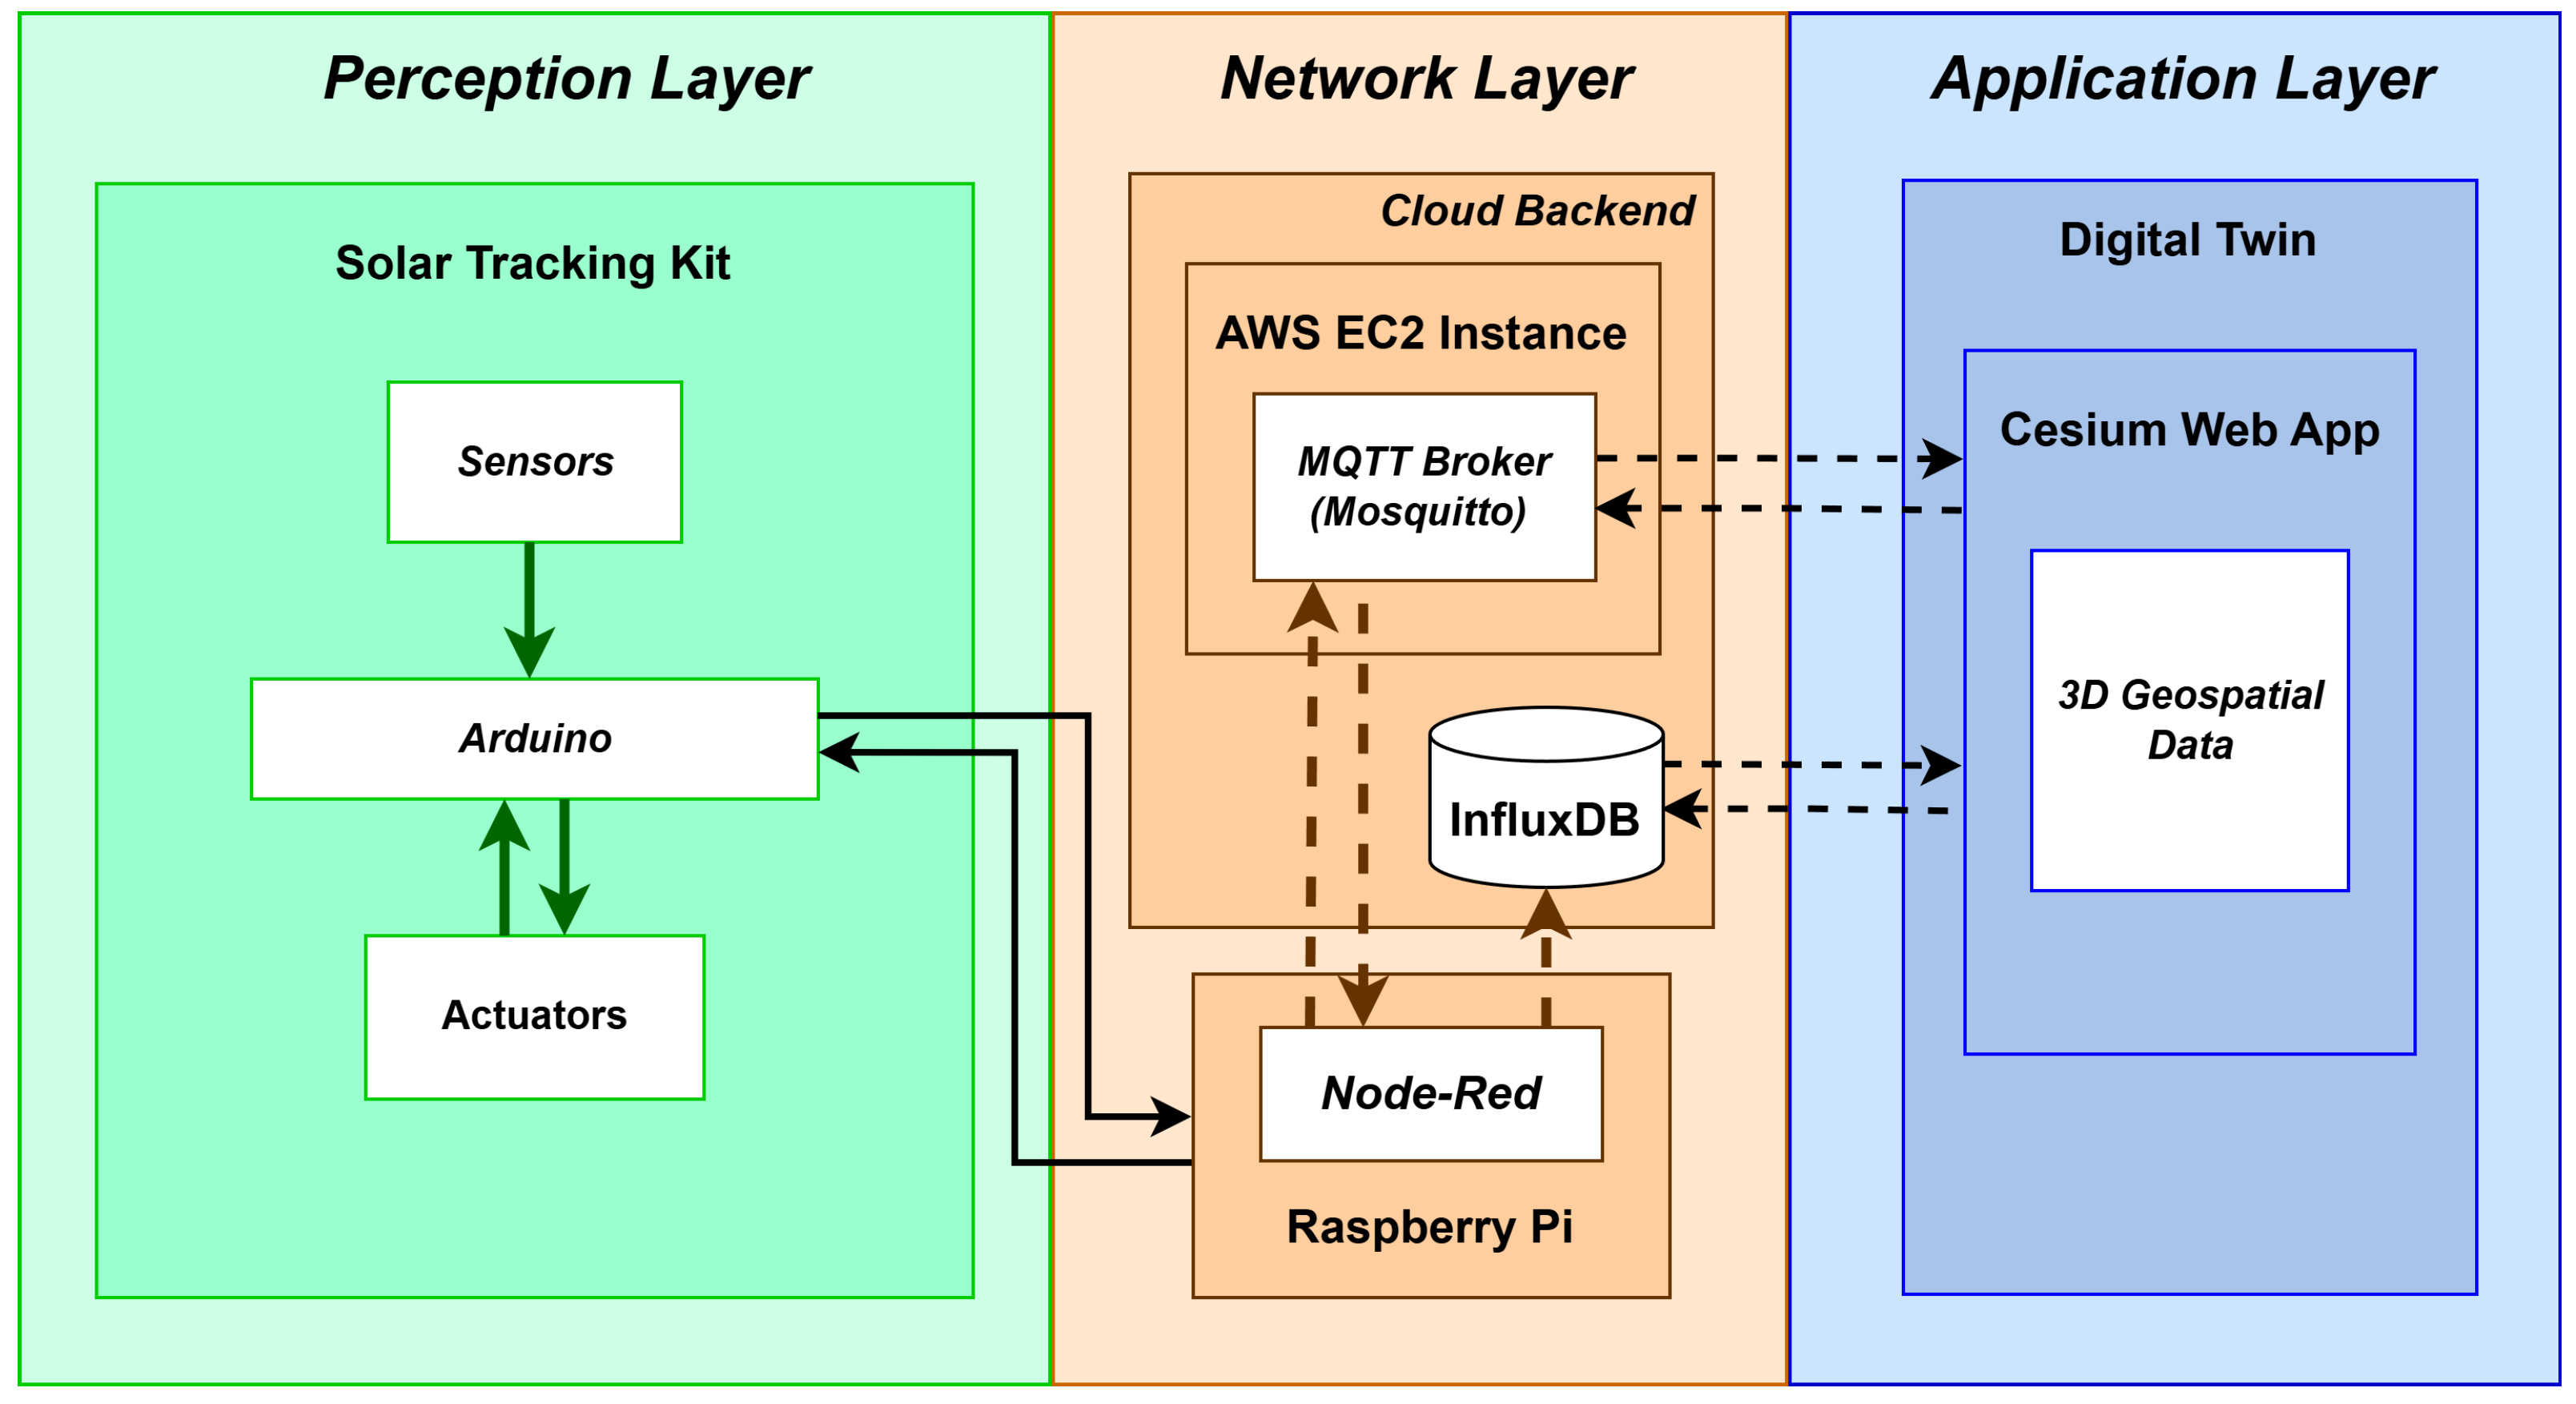
The technical implementation of the data management layer is structured around a three-layer IoT network architecture: the perception layer, the network layer and the application layer. This architecture, depicted in Figure 7, provides a modular separation of components, detailing the flow of data from physical sensing and actuation to cloud-based processing and user applications.
  • The Perception Layer
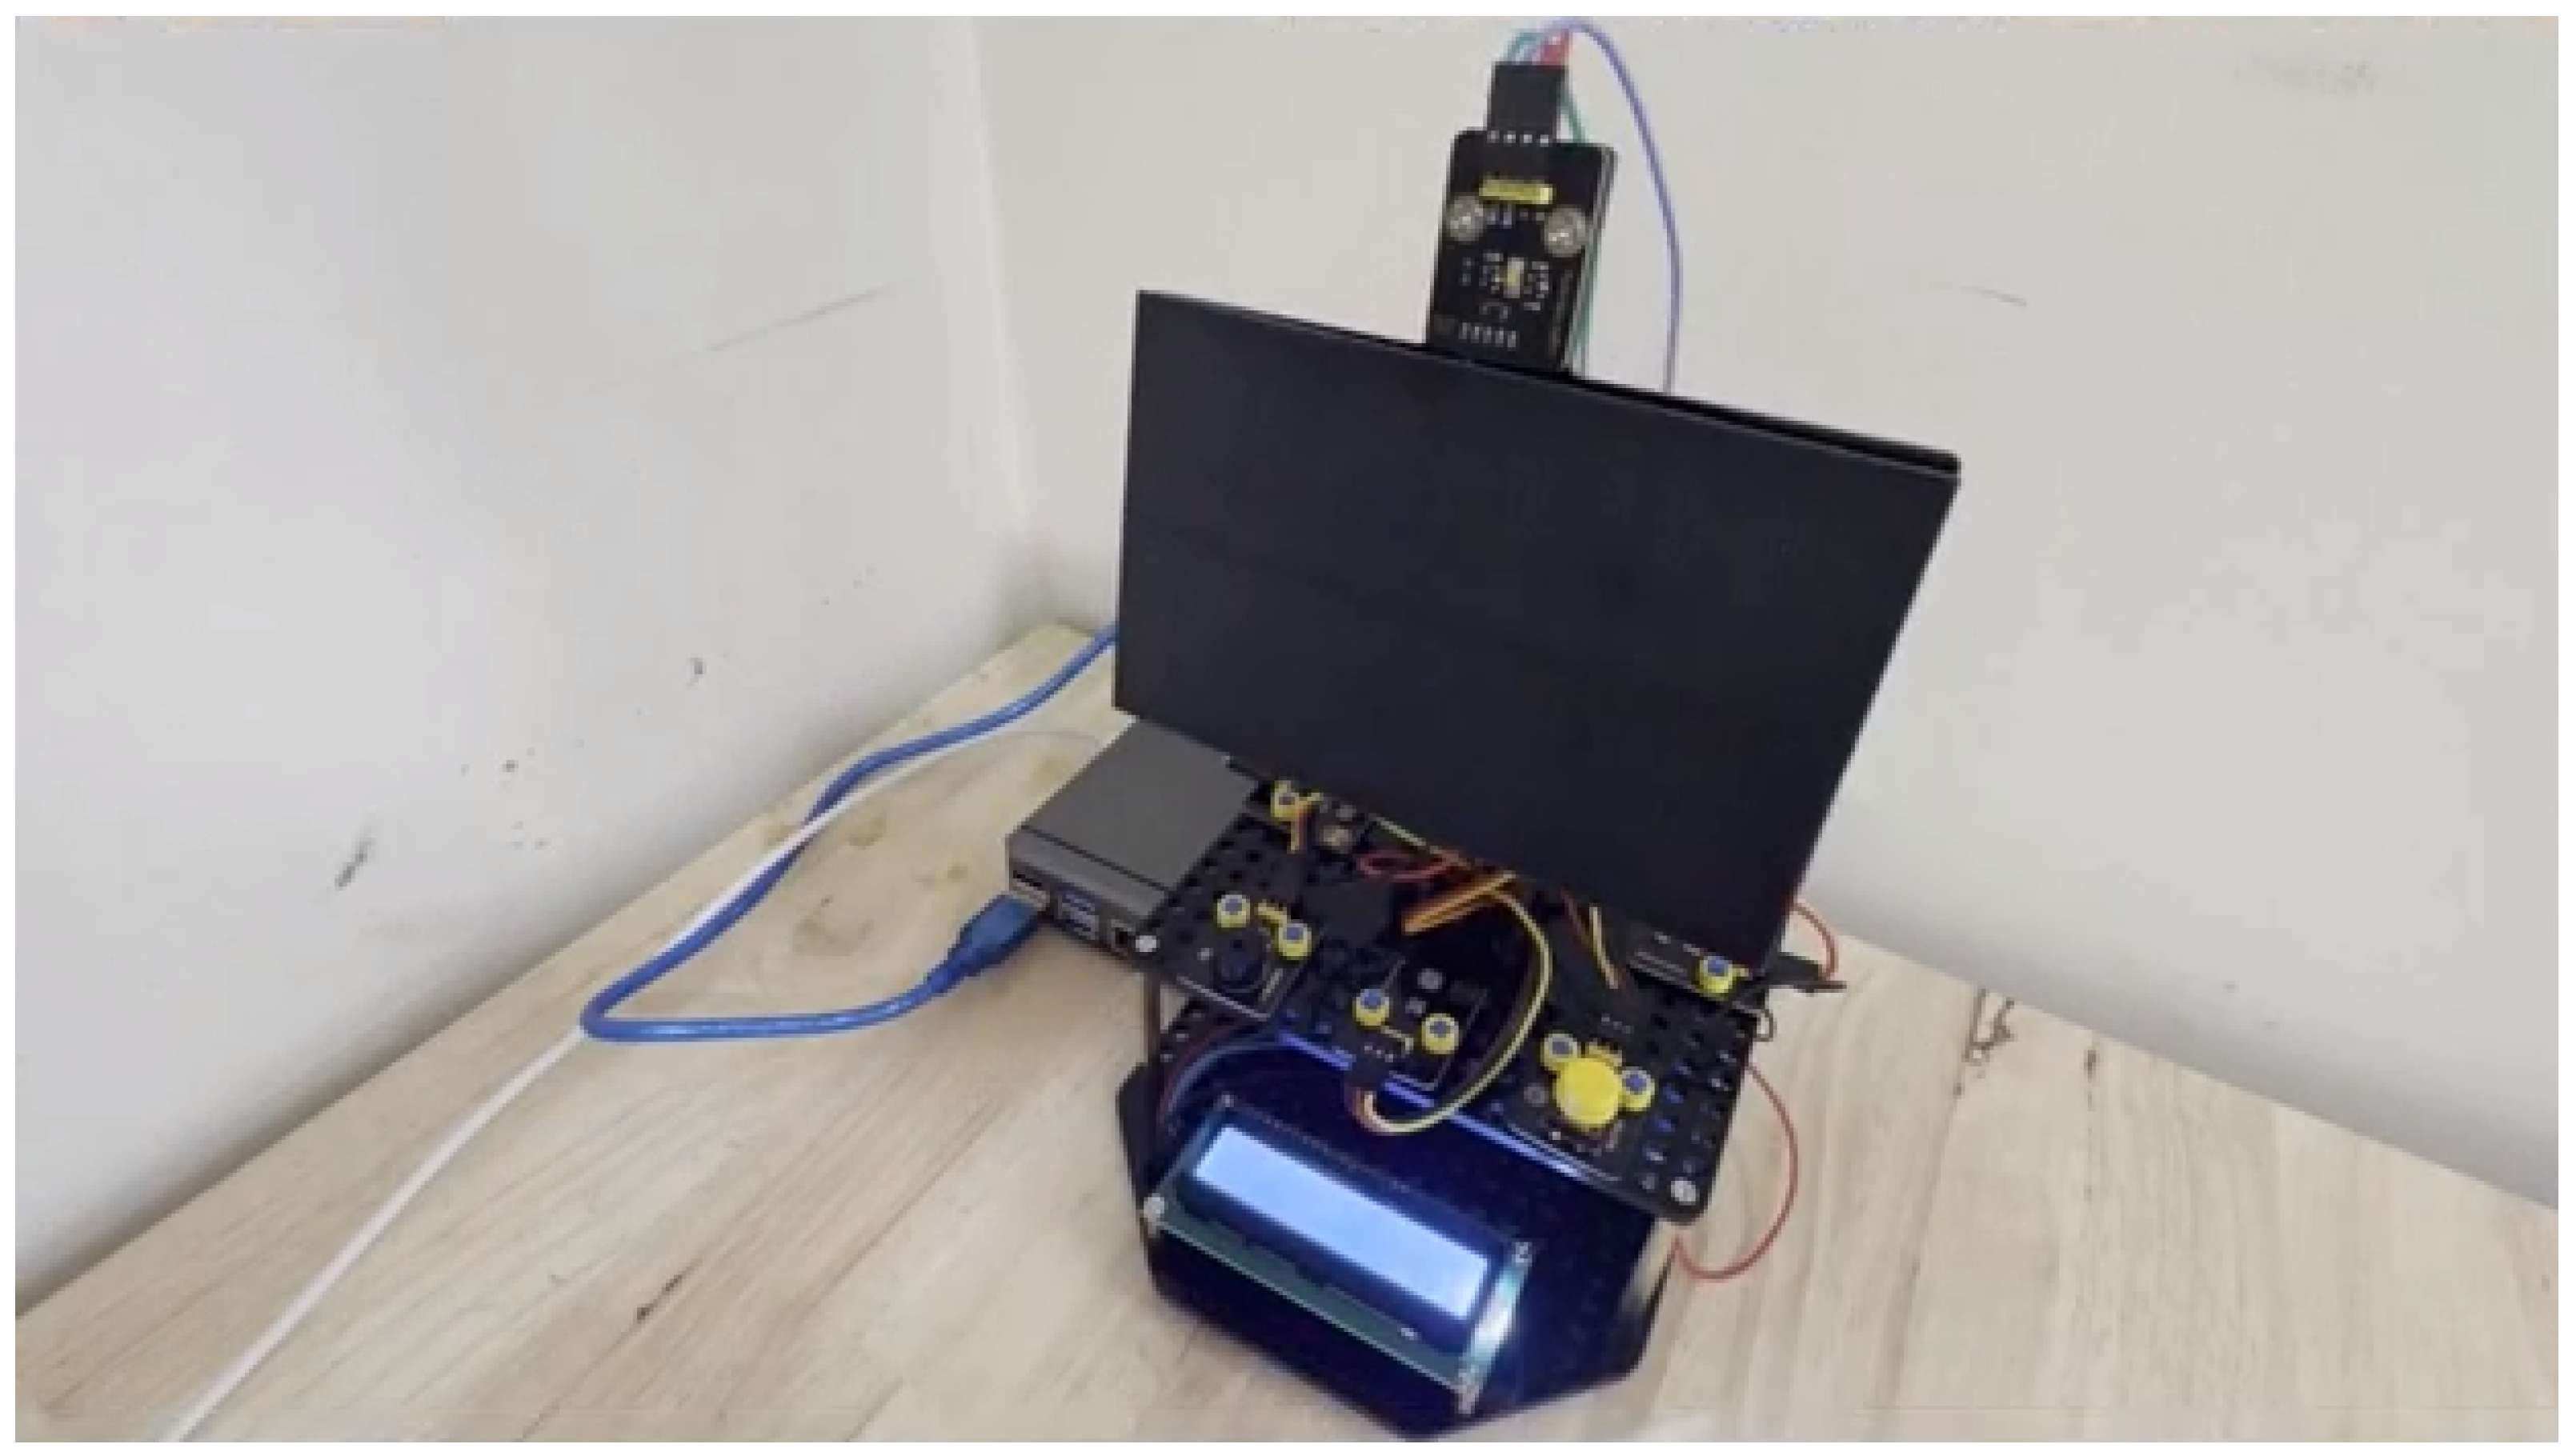
    This layer consists of the physical hardware that directly interacts with the physical world. For this study, the primary component was a Keyestudio KS0530 Solar Tracking Kit (Keyestudio, Shenzhen, China), integrated and tested in a lab environment (Figure 8). This kit is controlled by an Arduino UNO-compatible board (Keyestudio UNO Board). The selection of these specific hardware components and logic flows serves to validate the framework’s modularity and technical feasibility. Utilising standardised communication protocols ensures that the logic verified in this prototype can be applied to industrial trackers without structural changes to the data-flow architecture. This modular approach allows the framework to serve as a verified template for scaling to industrial infrastructure. Actuation is provided by two servo motors that control the panel’s dual-axis movement (azimuth and tilt). The autonomous tracking logic is driven by four photo-resistors (LDRs) arranged in a quadrant. The Arduino processes analogue voltage differences from these sensors to determine the direction of the brightest light source and position the servos accordingly.
  • The Network Layer
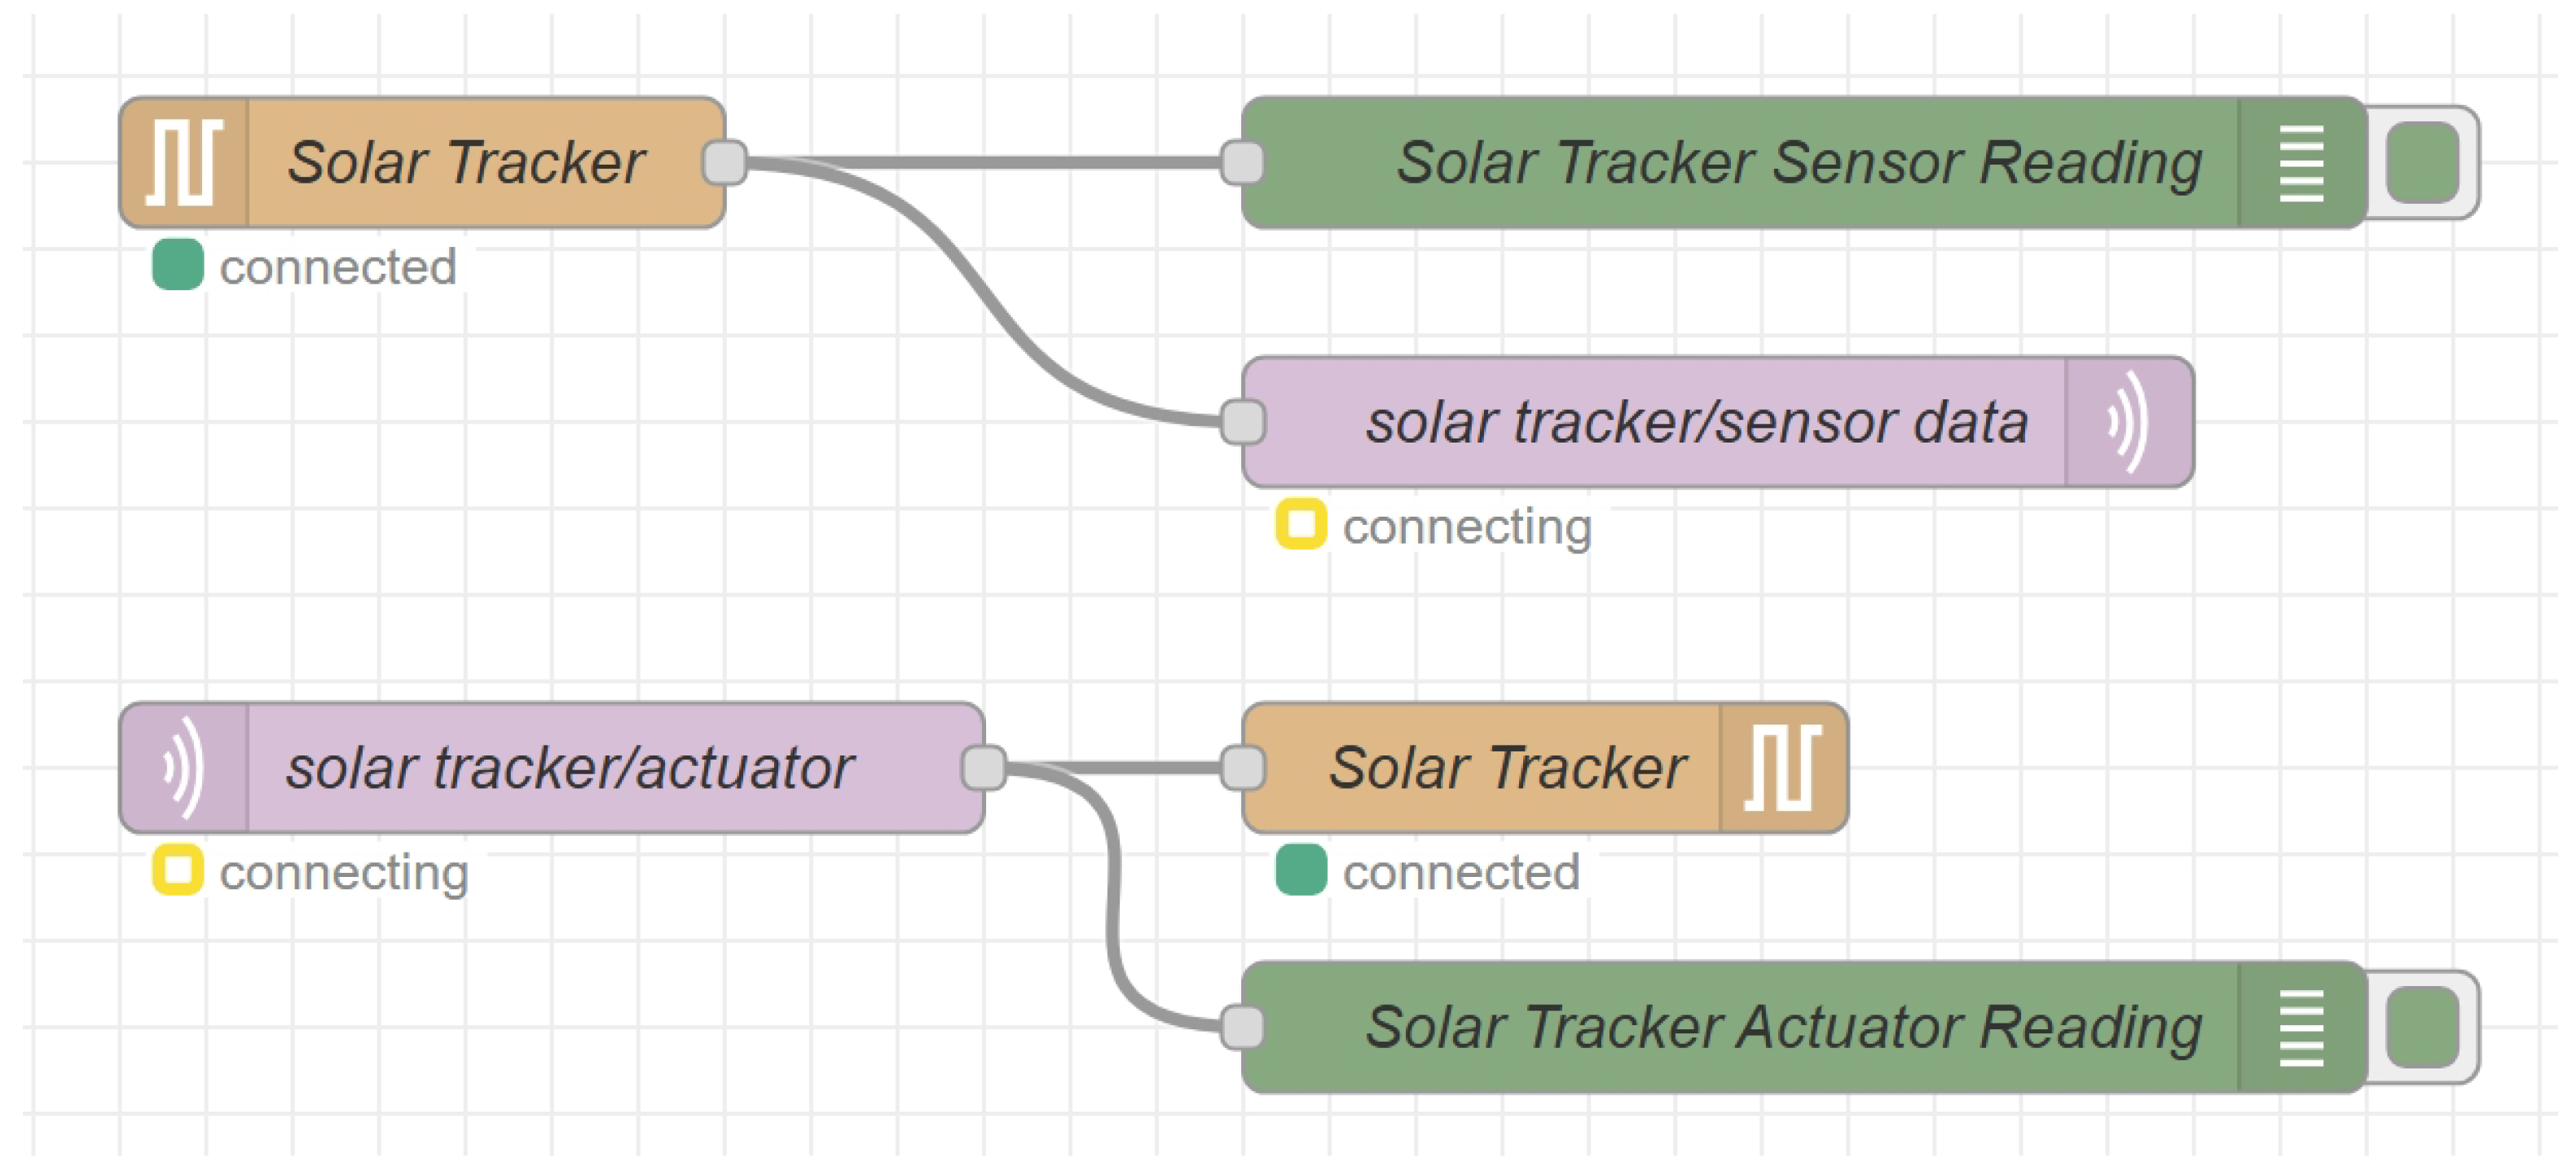
    This layer is responsible for data aggregation, preliminary edge processing, and reliable transmission. At its core is a Raspberry Pi single-board computer that serves as the IoT gateway. The flow-based orchestration tool Node-RED (version 4.0) was deployed on the Raspberry Pi to manage data logic. Custom-designed Node-RED flows periodically poll the connected sensors, format the data into a standardised JSON structure and publish it to an MQTT broker hosted on an AWS EC2 instance. The MQTT protocol was selected for its lightweight publish–subscribe architecture, which is highly efficient for resource-constrained networks [67]. Beyond efficiency, MQTT was chosen for its role as a cross-platform communication standard. This ensures that the framework remains interoperable with a wide variety of industrial IoT gateways and cloud services, allowing the digital twin to maintain a consistent data-flow logic regardless of the specific hardware sensors or actuators deployed in the field.
  • The Application Layer
    This layer is the end-user interface where data is consumed and commands are initiated. It was implemented on the custom Cesium web application. The application incorporates a client-side JavaScript MQTT client that subscribes to relevant topics from the MQTT broker, enabling the real-time display of sensor data on the dashboard. User interactions with dashboard controls trigger the publication of structured command messages to the MQTT broker on designated control topics.

3.3.2. Bidirectional Communication and Data Persistence

Bidirectional communication enables a closed loop between virtual monitoring and physical actuation. The implementation is detailed in the Node-RED flow shown in Figure 9. The Raspberry Pi gateway (network layer) continuously receives the current state from the Arduino (perception layer) and publishes it. The Cesium web application (application layer) receives and displays this data. Conversely, when a user issues a command from the dashboard, the application layer publishes a command message. The network layer receives this command, relays it to the perception layer for physical execution, and publishes the new state back, completing the cycle.
To support historical analysis, all data transmitted through the network layer was persistently stored in a designated bucket within the InfluxDB database. InfluxDB was chosen for its high-performance handling of time-series data, enabling efficient querying for trend analysis and historical data playback within the digital twin interface [67].

4. Results

This section presents the results obtained from the successful implementation and validation of the end-to-end digital twin framework. The outcomes are detailed in sequence, following the methodology’s core stages. Section 4.1 and Section 4.2 present the framework’s capabilities for high-fidelity design and simulation, thereby addressing the first research question. Section 4.3 presents the validation of the system’s real-time monitoring and control functionalities, addressing the second research question.

4.1. High-Fidelity Digital Model Deployment

A key outcome of this research was the creation and deployment of a high-fidelity, georeferenced 3D model of the orchard environment. Using a systematic UAV-based photogrammetric workflow, approximately 3000 geo-located high-resolution images were processed to generate a geometrically precise and photorealistic representation of the orchard’s topography and canopy structure. In this context, ’high-fidelity’ refers to the centimetre-level geospatial accuracy of the 3D orchard reconstruction, which provides a more realistic input for irradiance modelling compared to traditional 2D or simplified 3D geometries.
To facilitate efficient web-based visualisation, the reconstructed mesh was converted into the Cesium 3D Tiles format. This conversion transformed the large, monolithic mesh into a high-performance, hierarchical dataset optimised for real-time rendering. The hierarchical level-of-detail structure ensures that only the relevant portions of the model are streamed and rendered based on the user’s current view, enabling smooth, responsive interaction in standard web browsers.
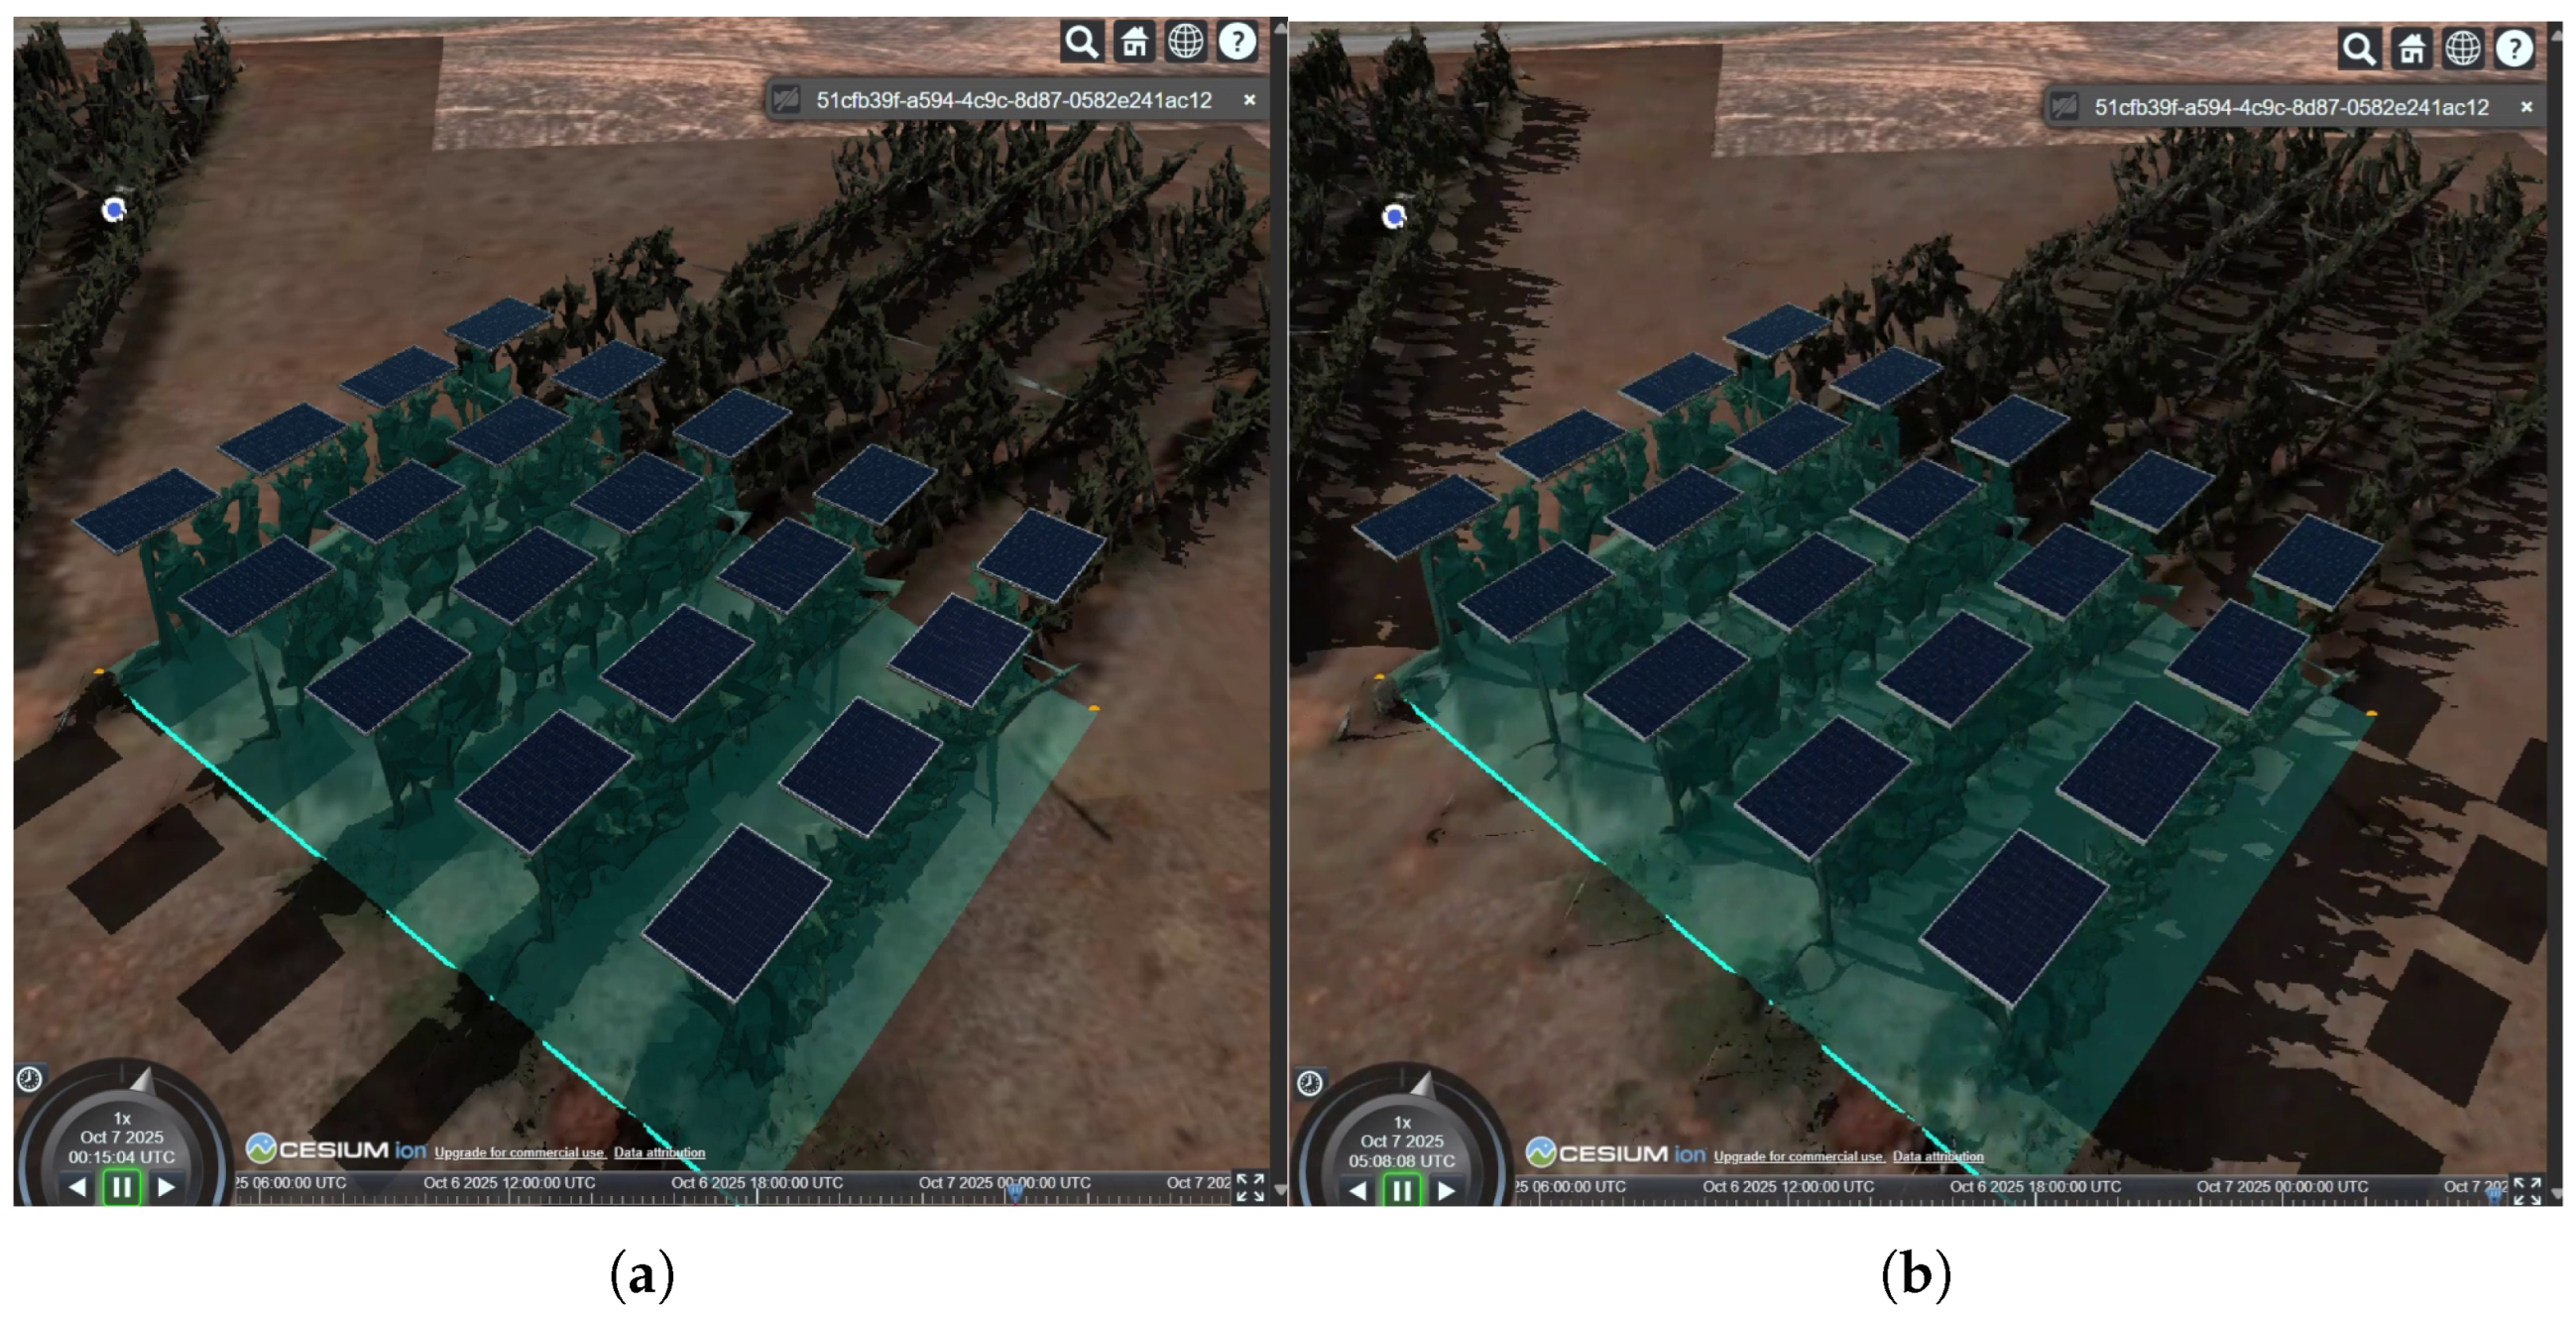
The optimised 3D tileset was then integrated into a custom CesiumJS-based web application, combining the high-fidelity 3D model with GIS data to support analytical and visual capabilities. This integration enables dynamic shadow analysis, as illustrated in Figure 10, demonstrating both the model’s photorealism and its ability to represent individual canopy geometries in detail. The developed framework provides the foundation for further simulation and control functionalities, discussed in the following sections.

4.2. Simulation Analysis of Agrivoltaic Configurations

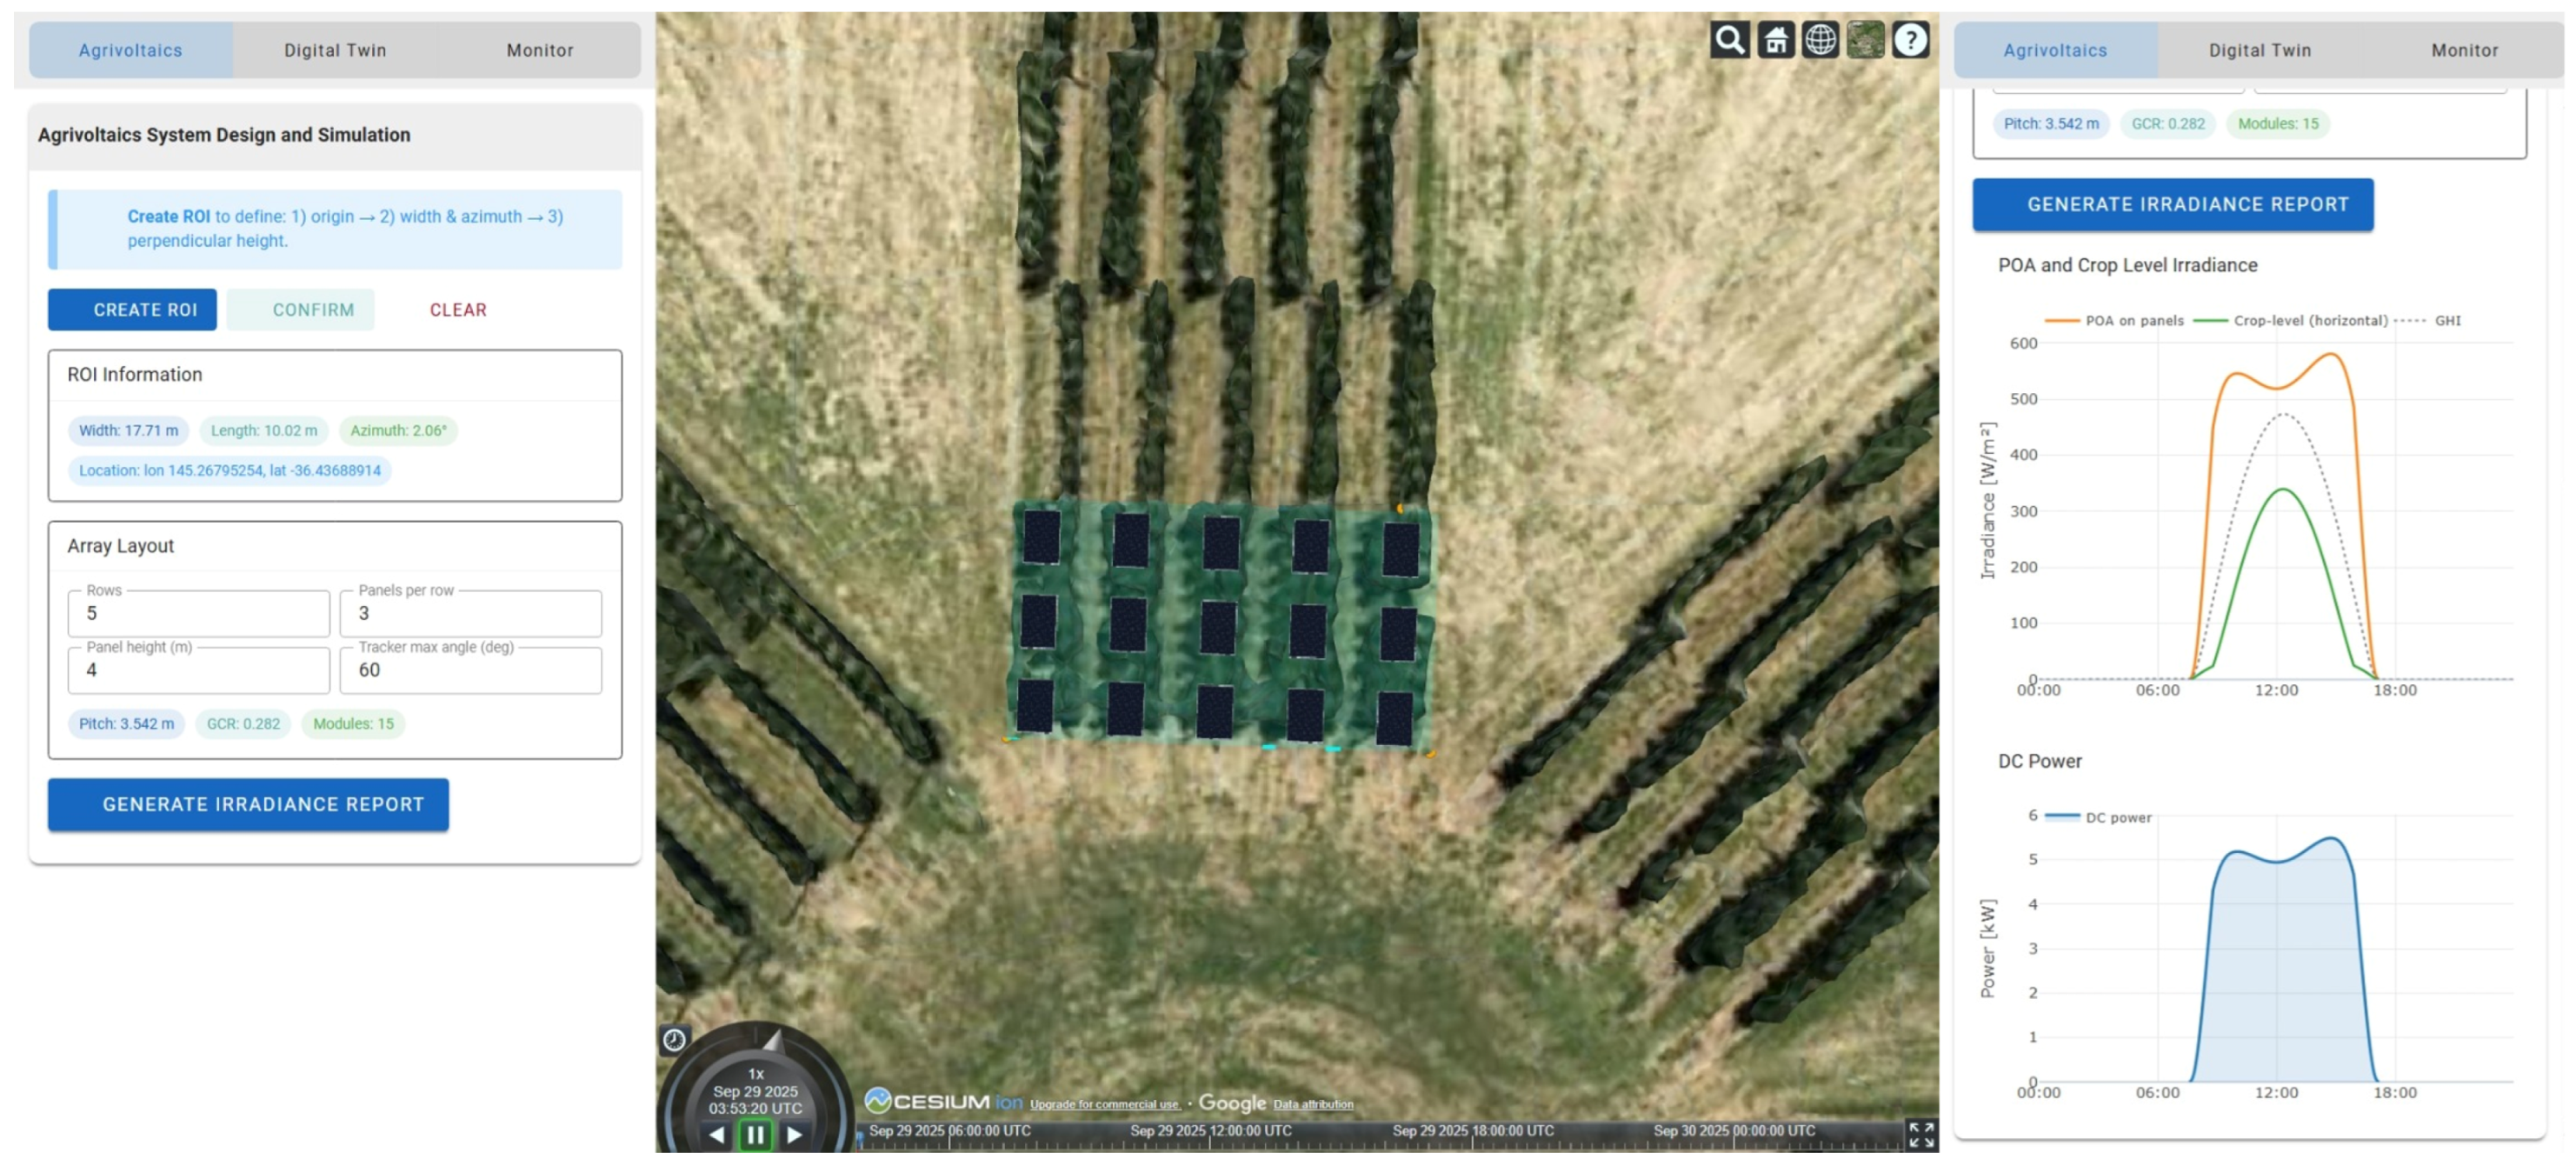
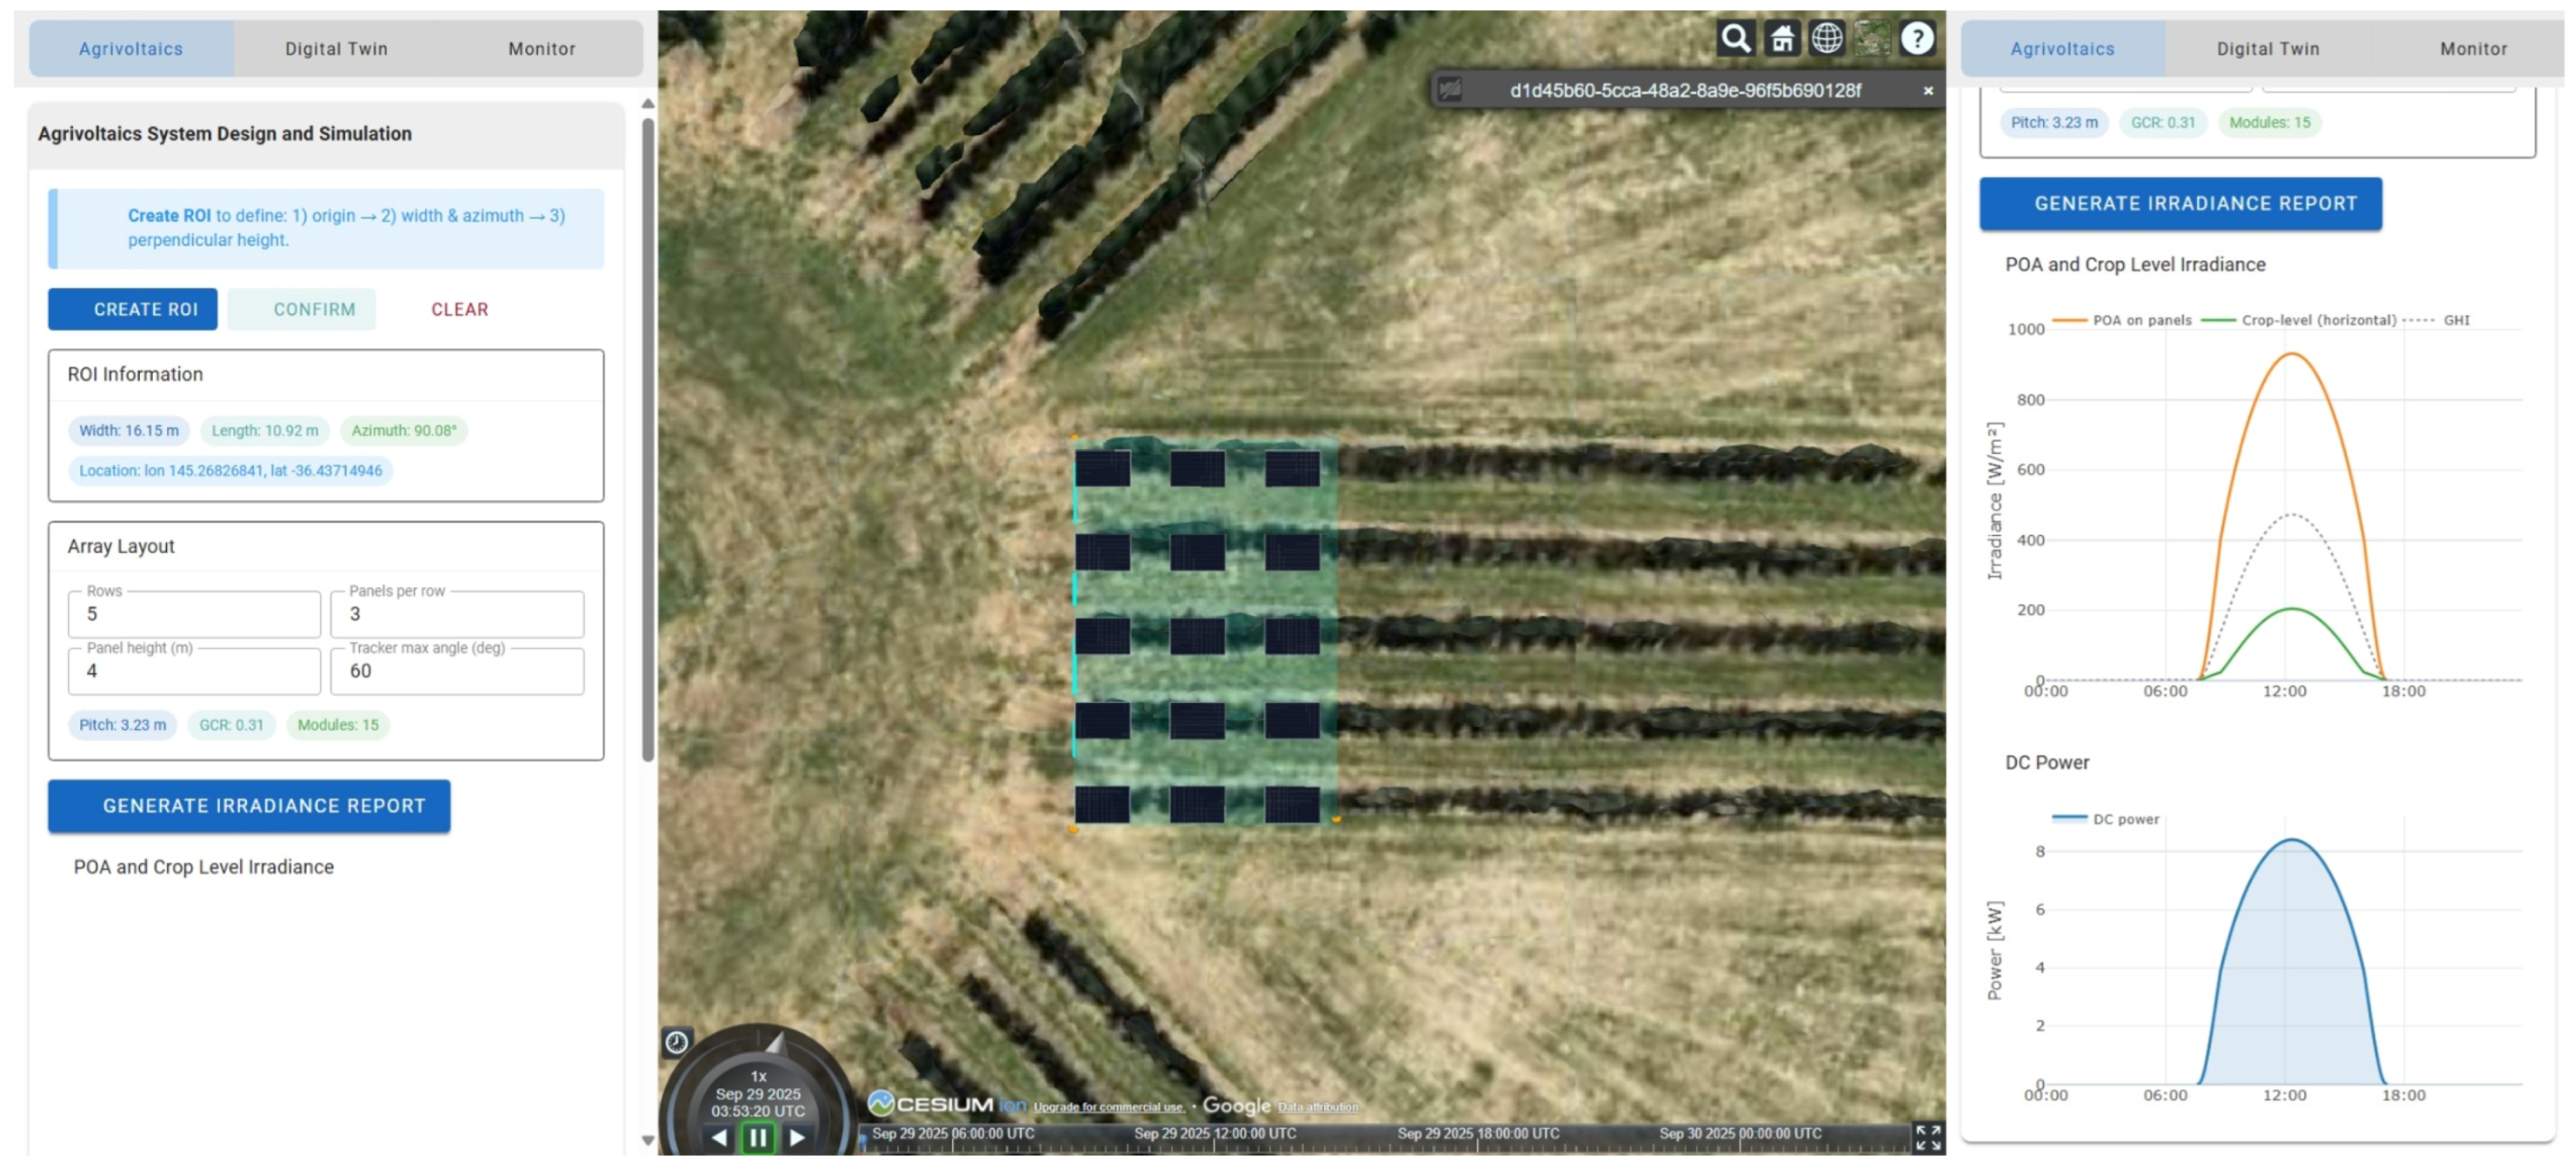
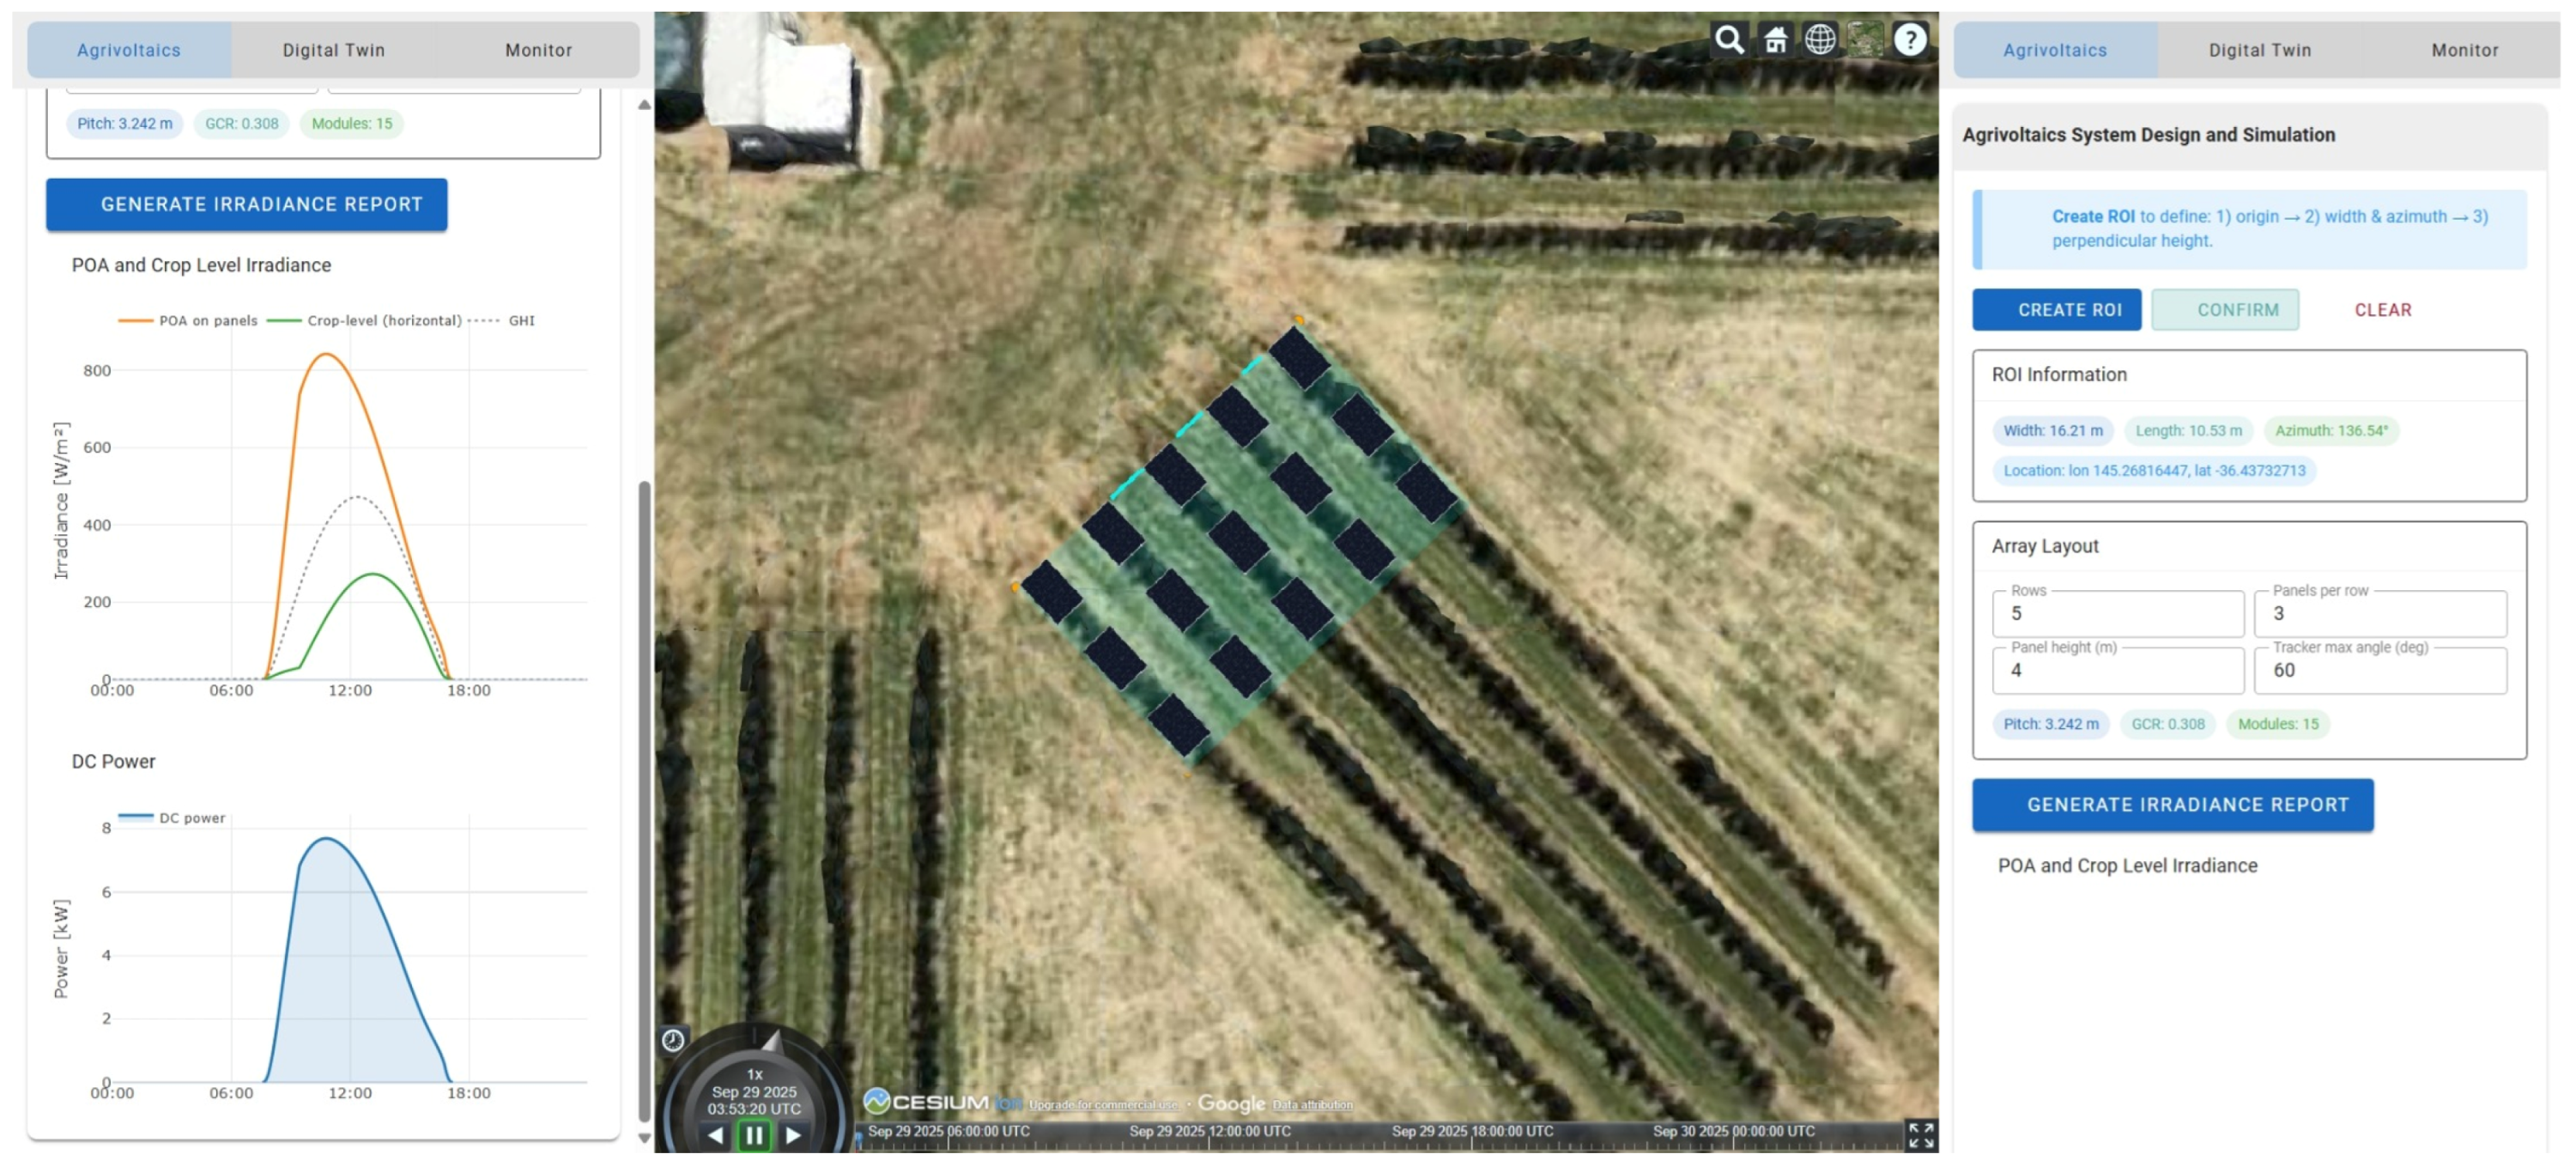
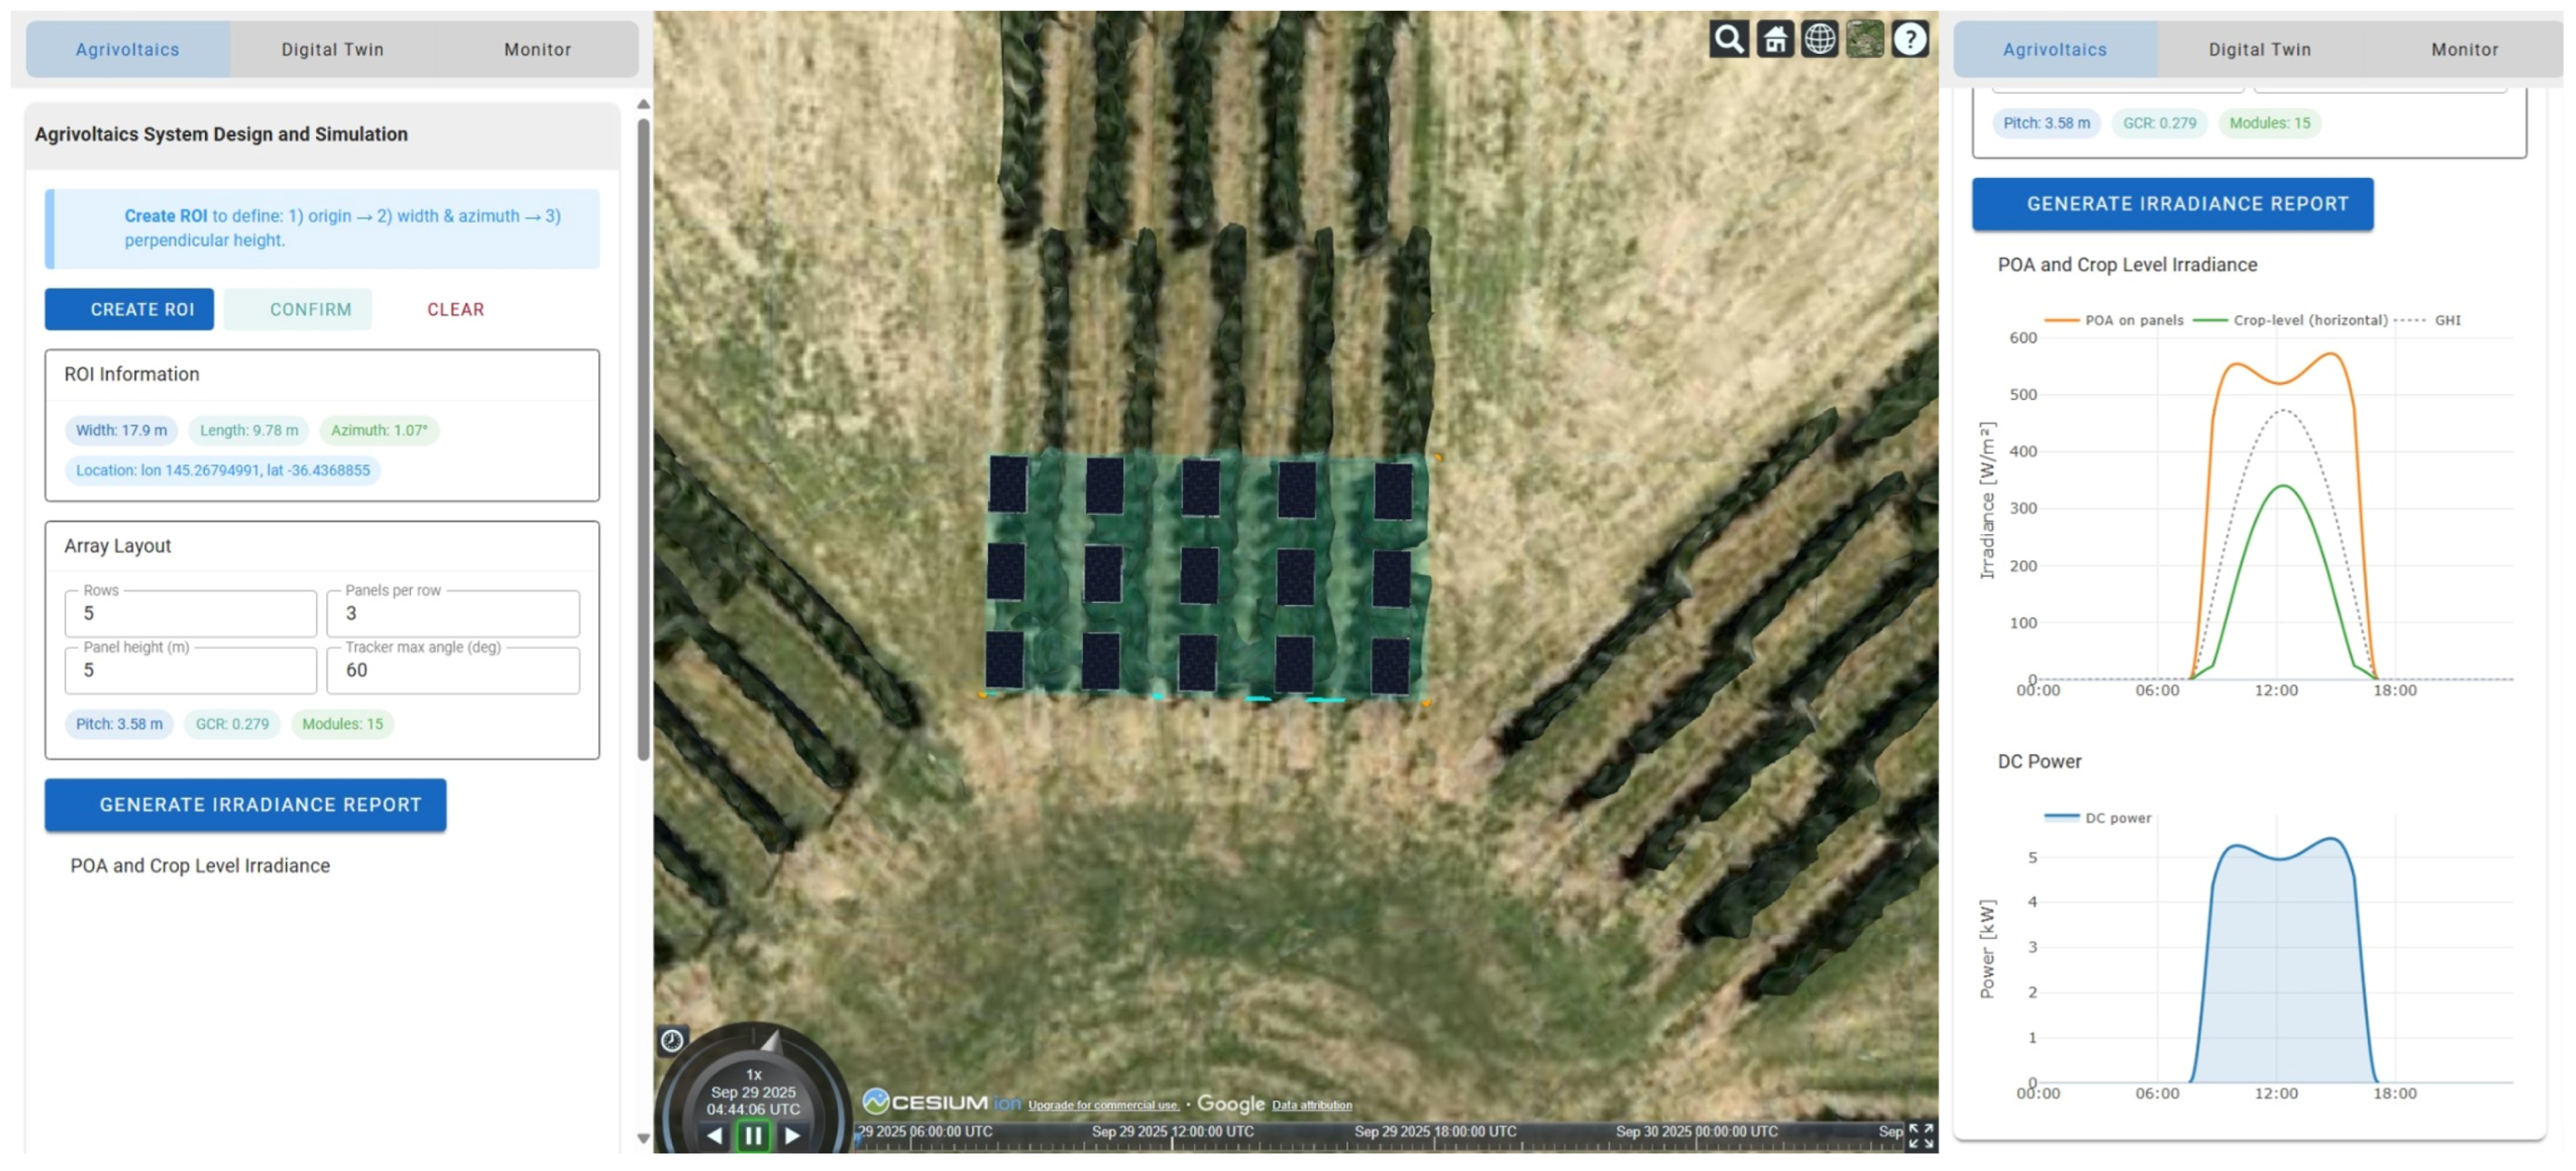
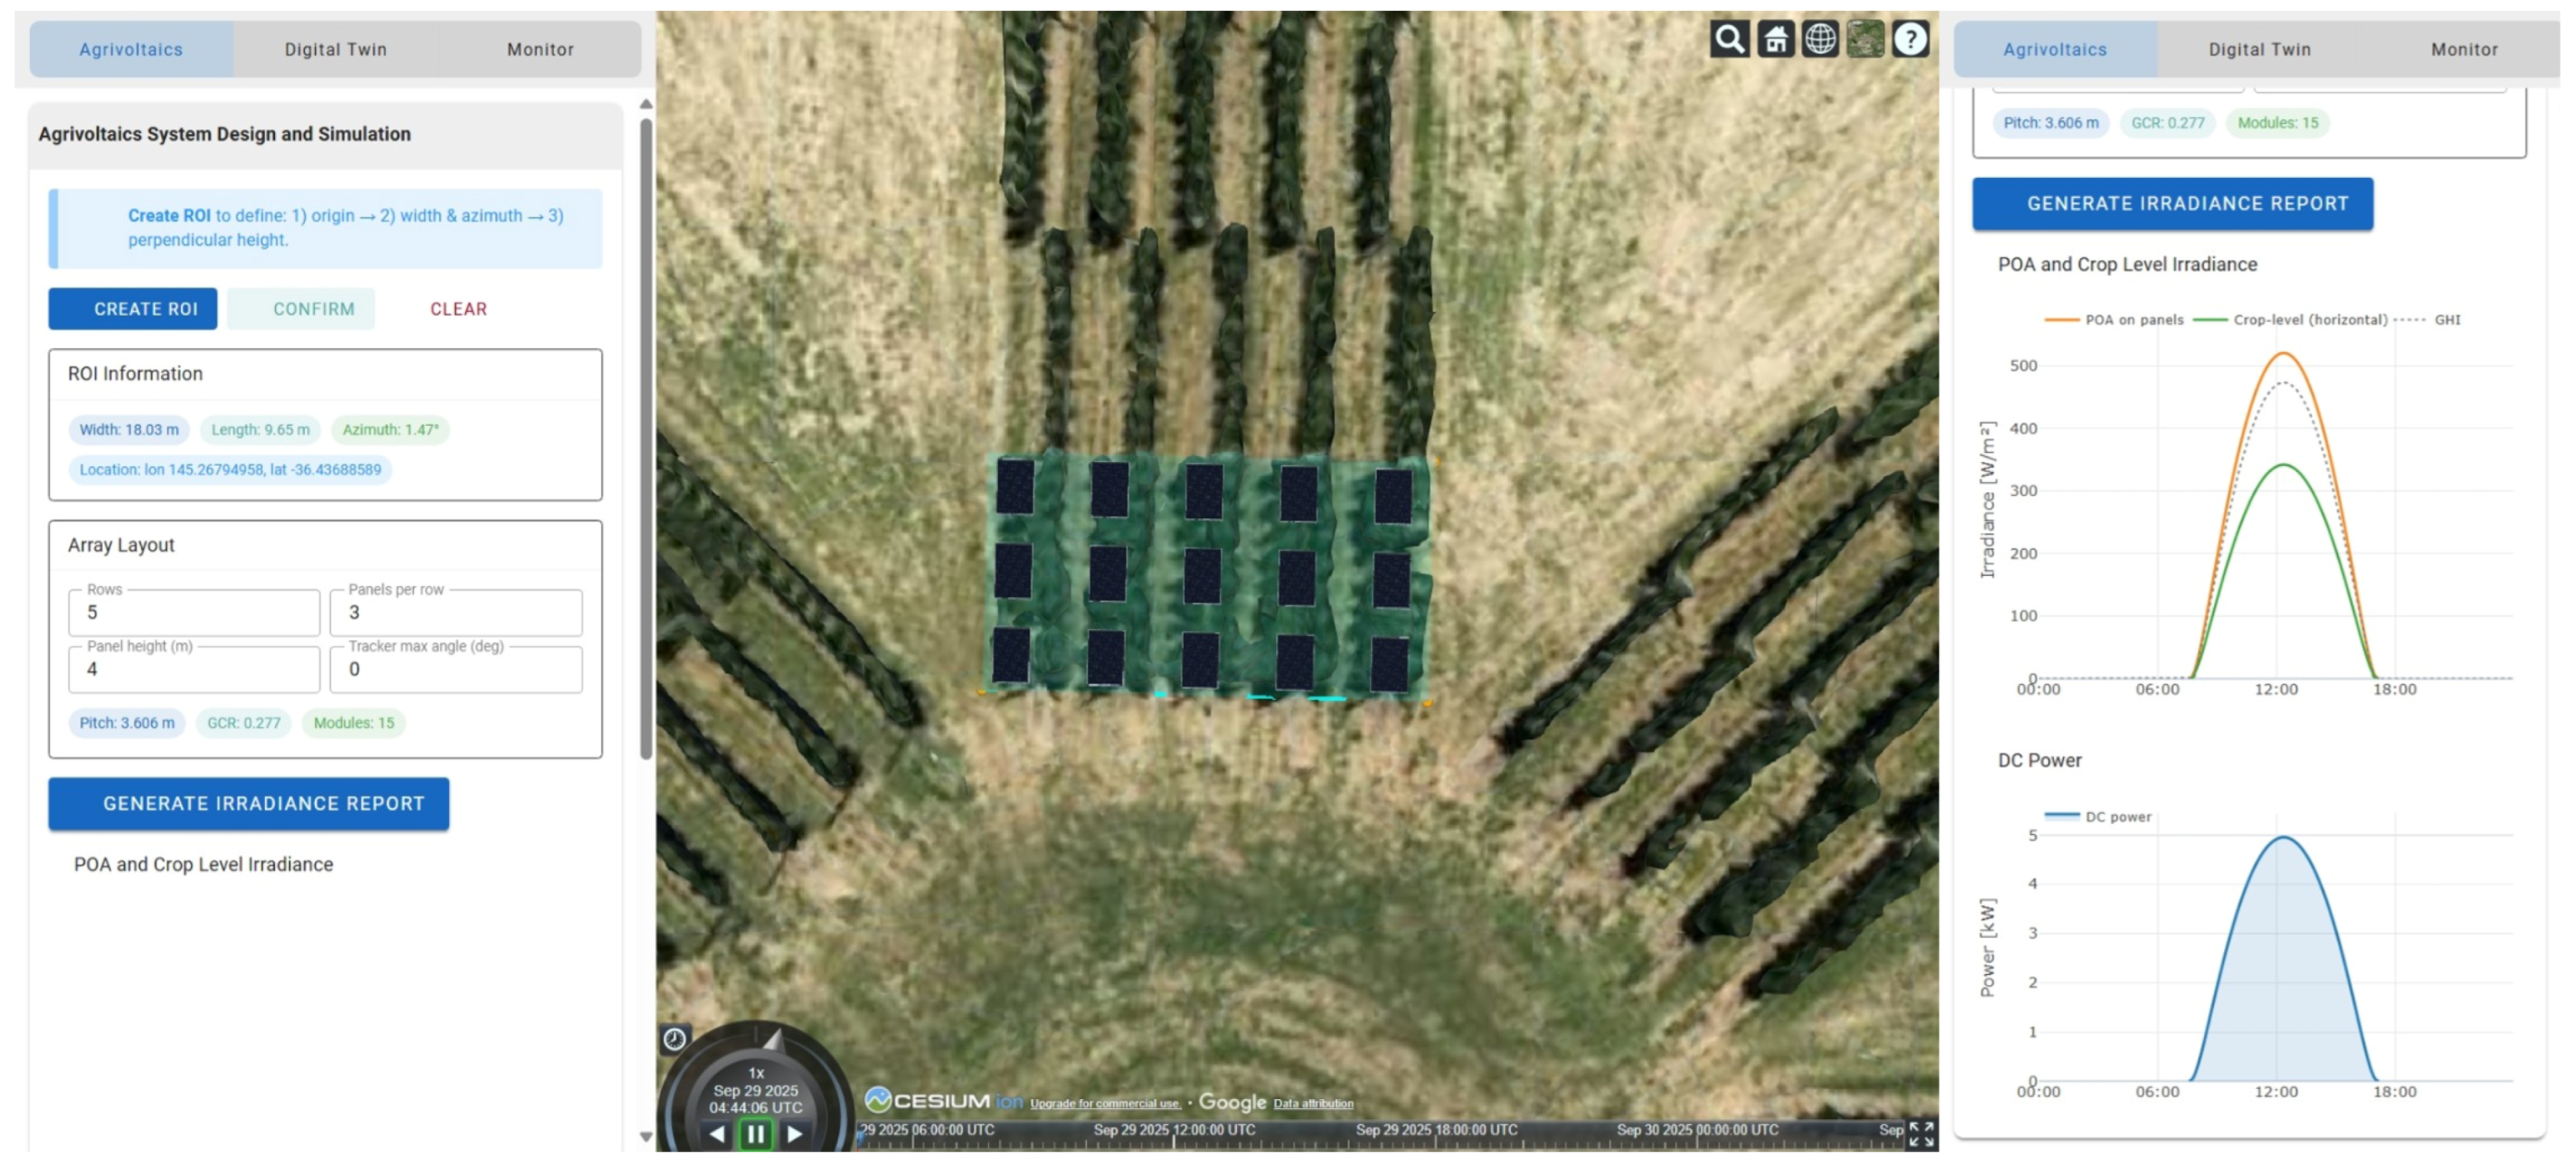
Table 4 presents the simulated performance of the baseline configuration and its variations as discussed in Section 3.2.3. The analysis compares key metrics, including peak power output, total daily energy generation and the corresponding crop-level irradiance for each configuration.
Table 4. Comparison of PV configurations showing energy generation and crop-level irradiance under different design parameters.
ConfigurationPeak Power Output (kW and Time)Daily Energy Output (kWh)Peak Crop-Level Irradiance (W/m2 and Time)
Baseline axis azimuth 0° (Figure 11)>5 (09:55 and 12:45)40.86338 (12:22)
Axis azimuth 45° (Figure 12)7.78 (13:44)45.47249 (11:28)
Axis azimuth 90° (Figure 13)8.41 (12:25)53.97205 (12:25)
Axis azimuth 135° (Figure 14)7.69 (10:48)44.24273 (13:01)
Panel height: 5 m (Figure 15)>5 (09:55 and 12:45)40.76341 (12:22)
Tilt system: fixed tilt (Figure 16)4.96 (12:22)28.69342 (12:22)
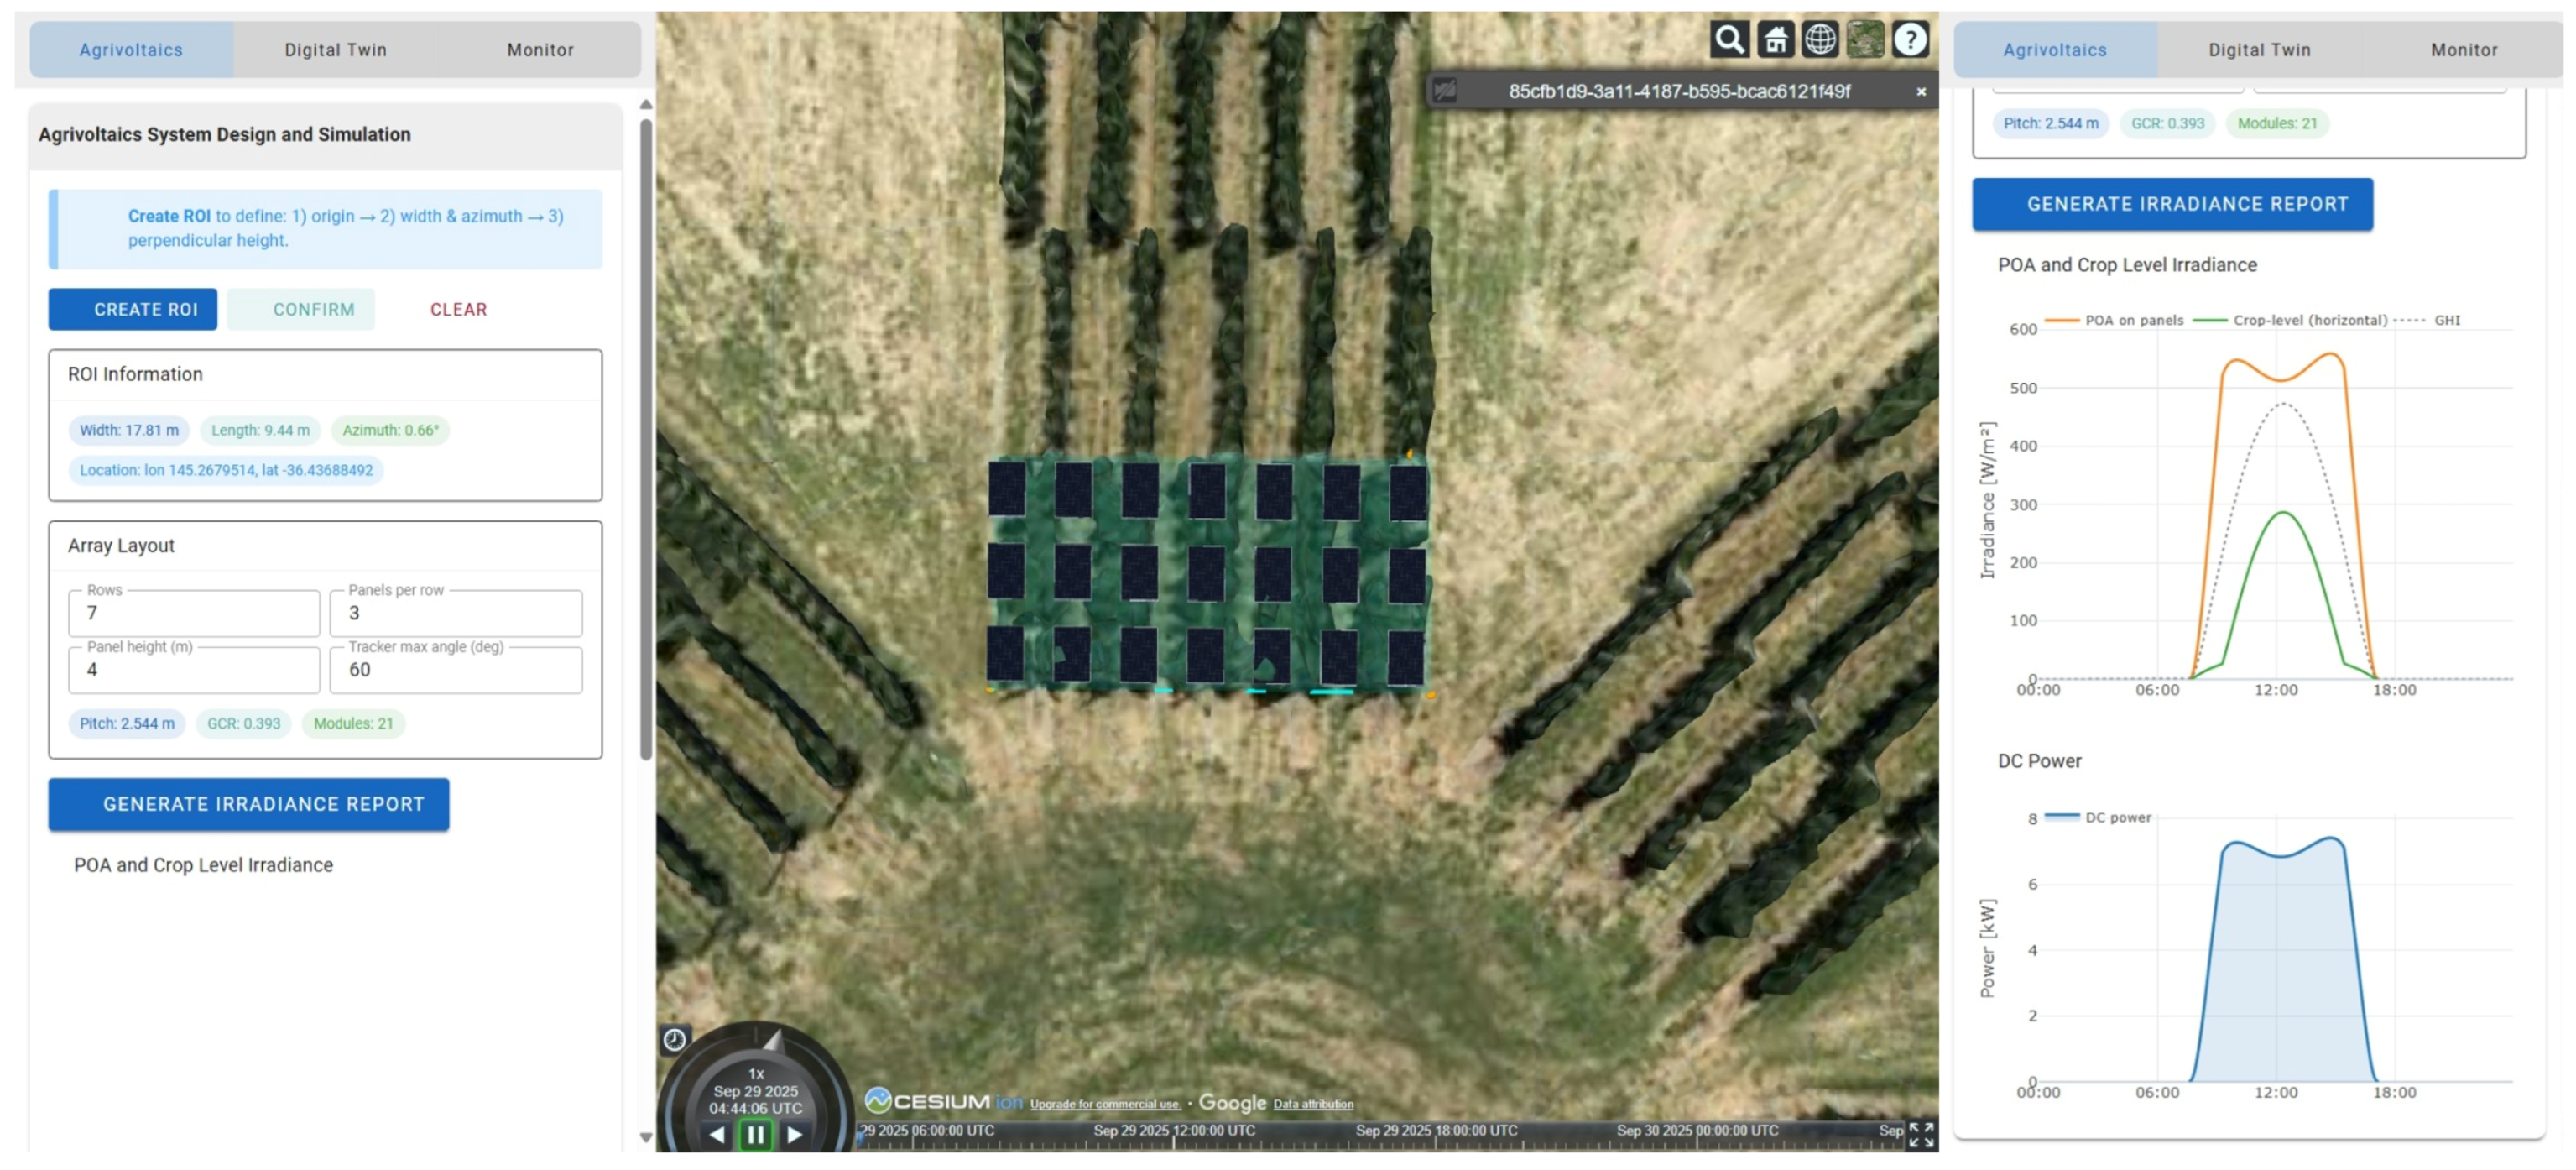
Array configuration: 7 arrays, 3 PV panels per array (Figure 17)>7 (09:58 and 14:41)53.95287 (12:22)
Figure 11. Simulation results of baseline agrivoltaic system configuration. The POA (orange line), crop-level (green line) irradiance profile and power generation profile (blue line), and theoretical clear-sky global horizontal irradiance (black dashed line) are shown in the chart.
Machines 14 00254 g011
Figure 12. Simulation of an agrivoltaic system with axis azimuth of 45°.
Machines 14 00254 g012
Figure 13. Simulation of an agrivoltaic system with axis azimuth of 90°.
Machines 14 00254 g013
Figure 14. Simulation of an agrivoltaic system with axis azimuth of 135°.
Machines 14 00254 g014
Figure 15. Simulation of an agrivoltaic system with an elevated panel height of 5 m.
Machines 14 00254 g015
Figure 16. Simulation of an agrivoltaic system with fixed tilt mount.
Machines 14 00254 g016
Figure 17. Simulation of an agrivoltaic system with seven arrays.
Machines 14 00254 g017
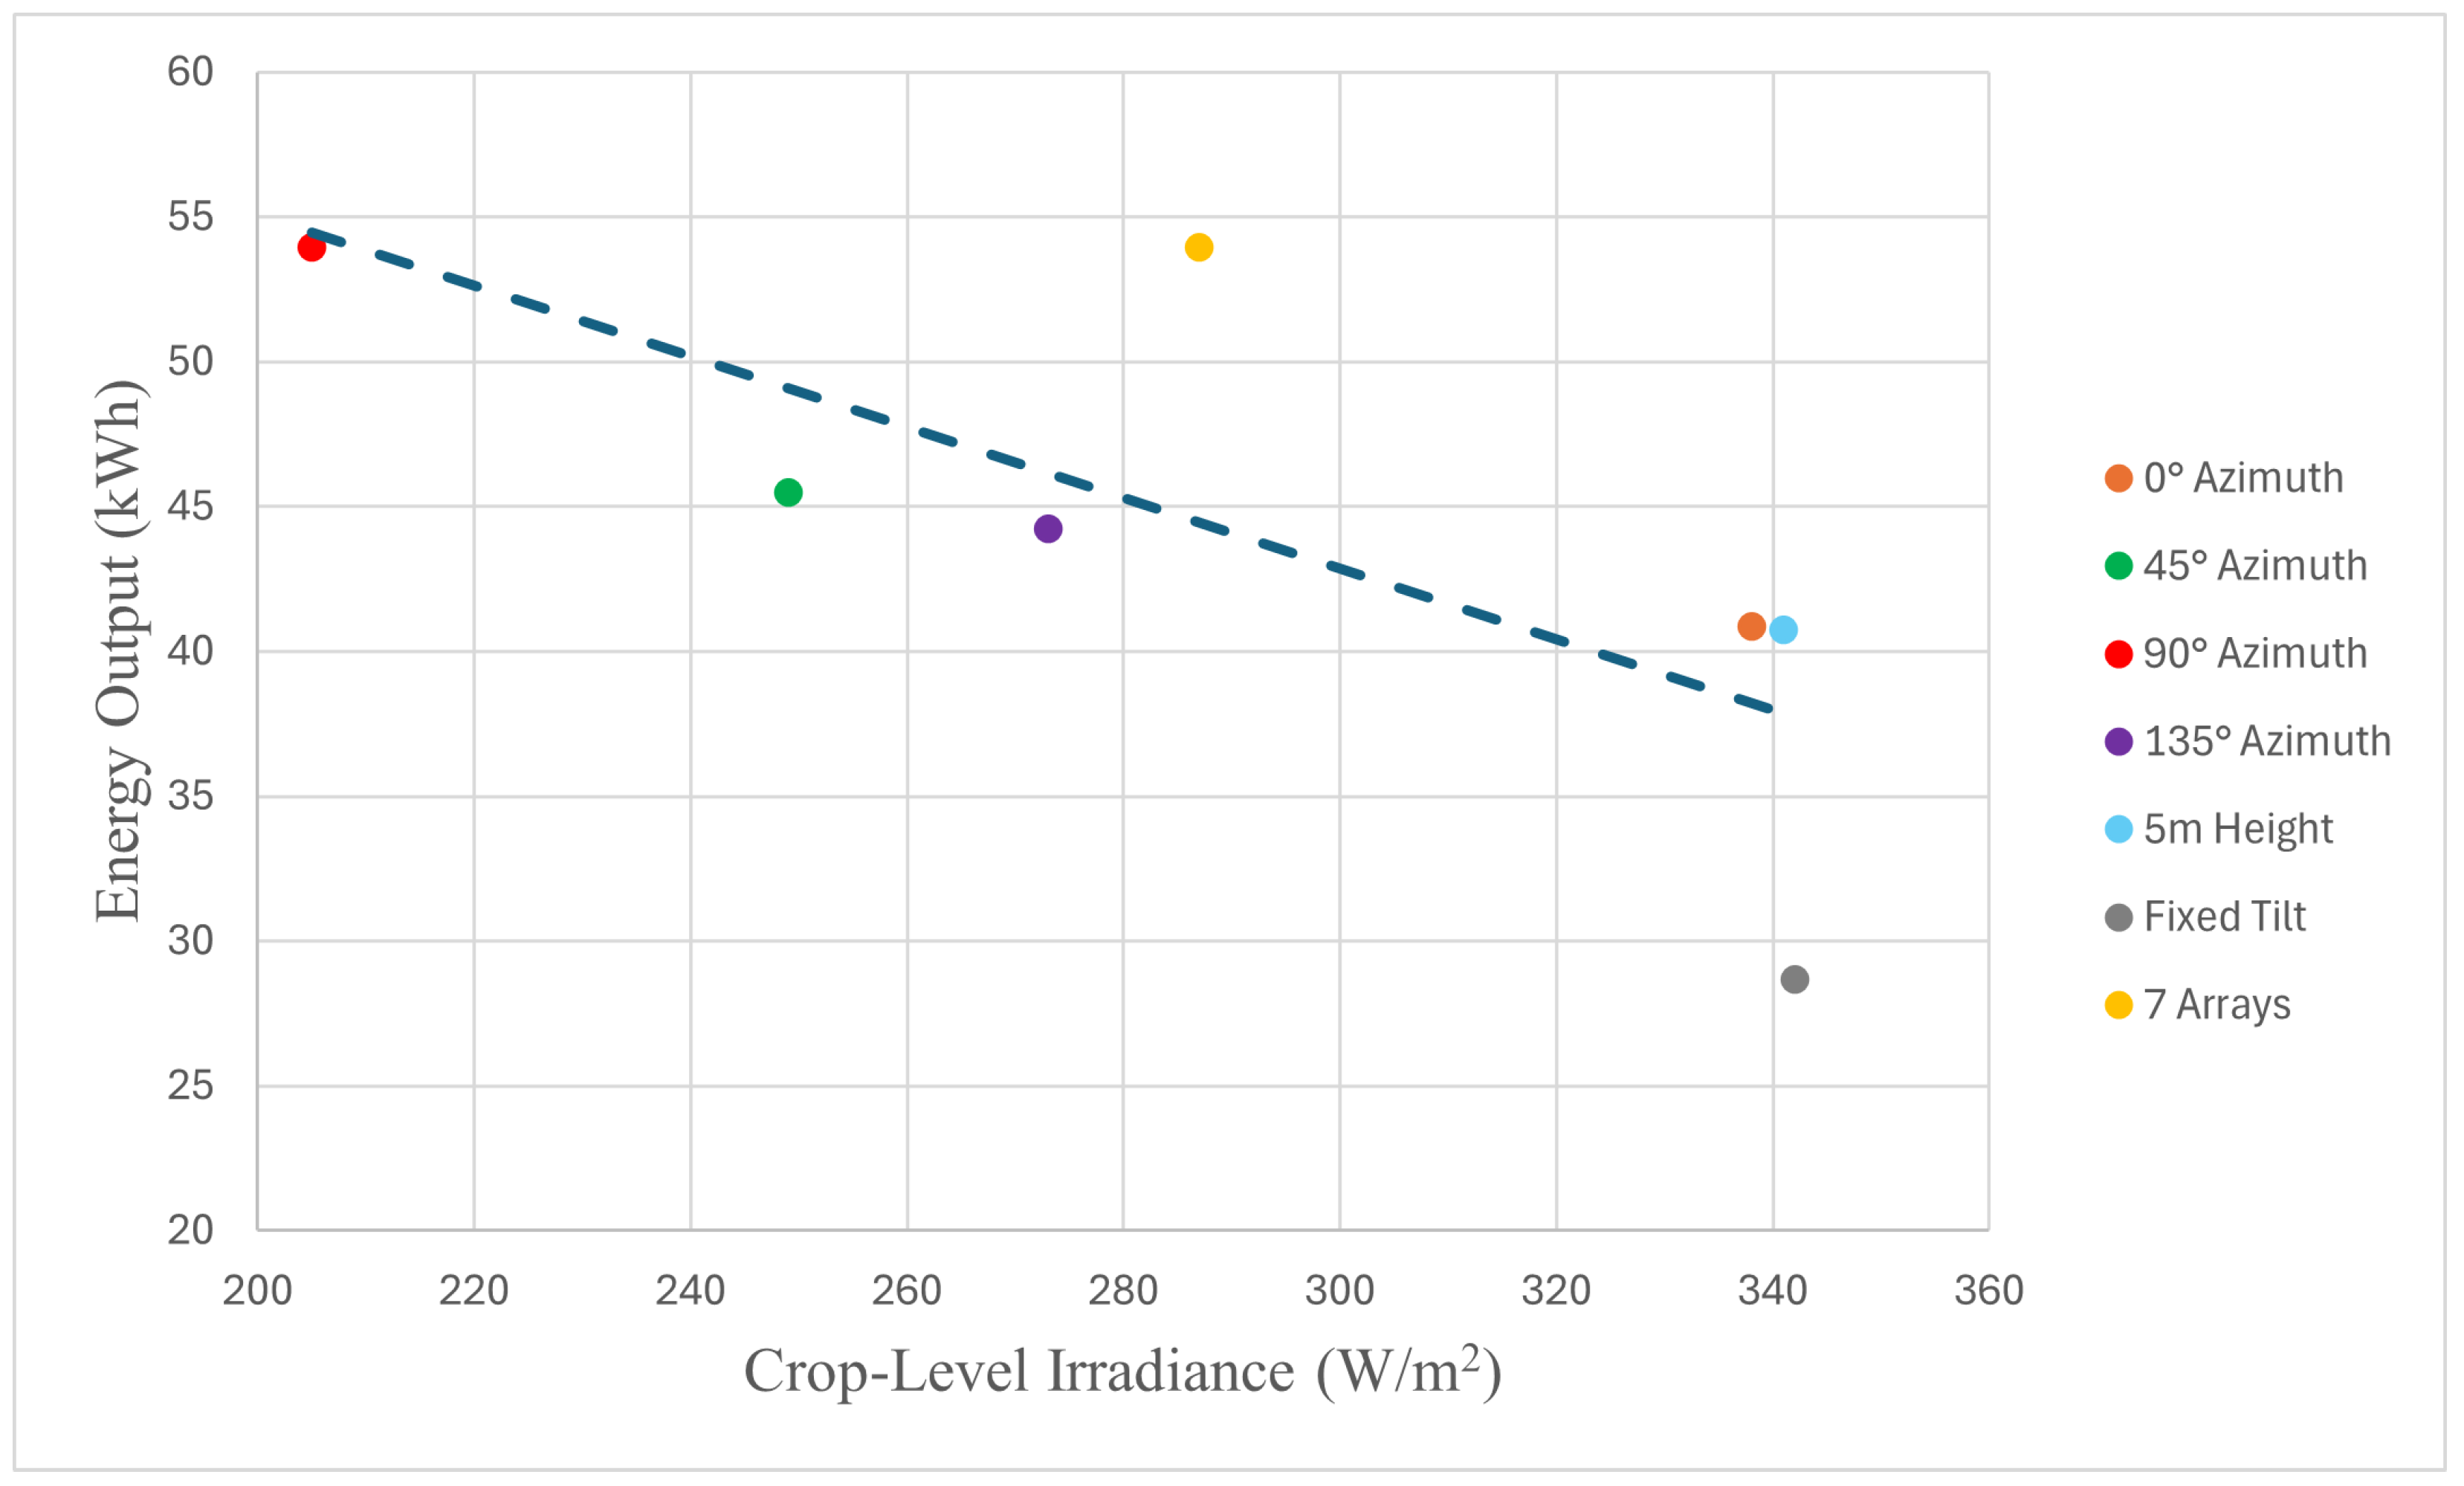
Figure 18 illustrates the direct trade-off between energy generation and crop-level irradiance by plotting simulated energy output against crop-level irradiance for the tested configurations. Among all configurations, the 90° azimuth produced the highest total energy output (53.97 kWh), representing a 32% increase in daily energy generation compared to the baseline configuration. The 45° and 135° azimuth orientations also exhibited distinct peaks, occurring in the afternoon and morning, respectively. In contrast, the 0° azimuth configuration maintained a more uniform power output throughout the day. Regarding crop-level irradiance, the 0° azimuth configuration achieved the highest irradiance, while the 90° azimuth orientation yielded the lowest, resulting in a 39% reduction in peak light availability relative to the baseline. Therefore, if a balance between consistent power output and relatively higher light availability for crops is desired, the 0° azimuth configuration provides an optimal trade-off by maintaining energy generation at 40.86 kWh while preserving 98% of the peak crop-level irradiance.
Adjusting the panel height from 4 m to 5 m had a negligible effect on total energy generation (40.86 kWh vs. 40.76 kWh) but resulted in a slight increase in crop-level irradiance. This finding indicates that elevated panel height can modestly improve light penetration for understorey crops while maintaining energy output. Furthermore, switching from a single-axis tracking configuration (maximum tilt 60°) to a fixed-tilt system substantially reduced energy generation, from 40.86 kWh to 28.69 kWh. This reduction underscores the superior performance of tracking systems with backtracking capability compared to fixed installations, as the fixed tilt system exhibited a 30% energy generation penalty compared to the tracking baseline.
Finally, expanding the PV array configuration from five to seven arrays (each comprising three panels) increased the total energy output proportionally, from 40.68 kWh to 53.95 kWh. However, this modification also led to a noticeable reduction in crop-level irradiance, highlighting the trade-off between maximising energy yield and maintaining adequate light availability for plant growth. The comparative analysis of these seven configurations effectively serves as a geometric sensitivity assessment, quantifying how specific variations in orientation, mounting height and array density impact the energy–irradiance trade-off.

4.3. Performance Validation of Monitoring and Control

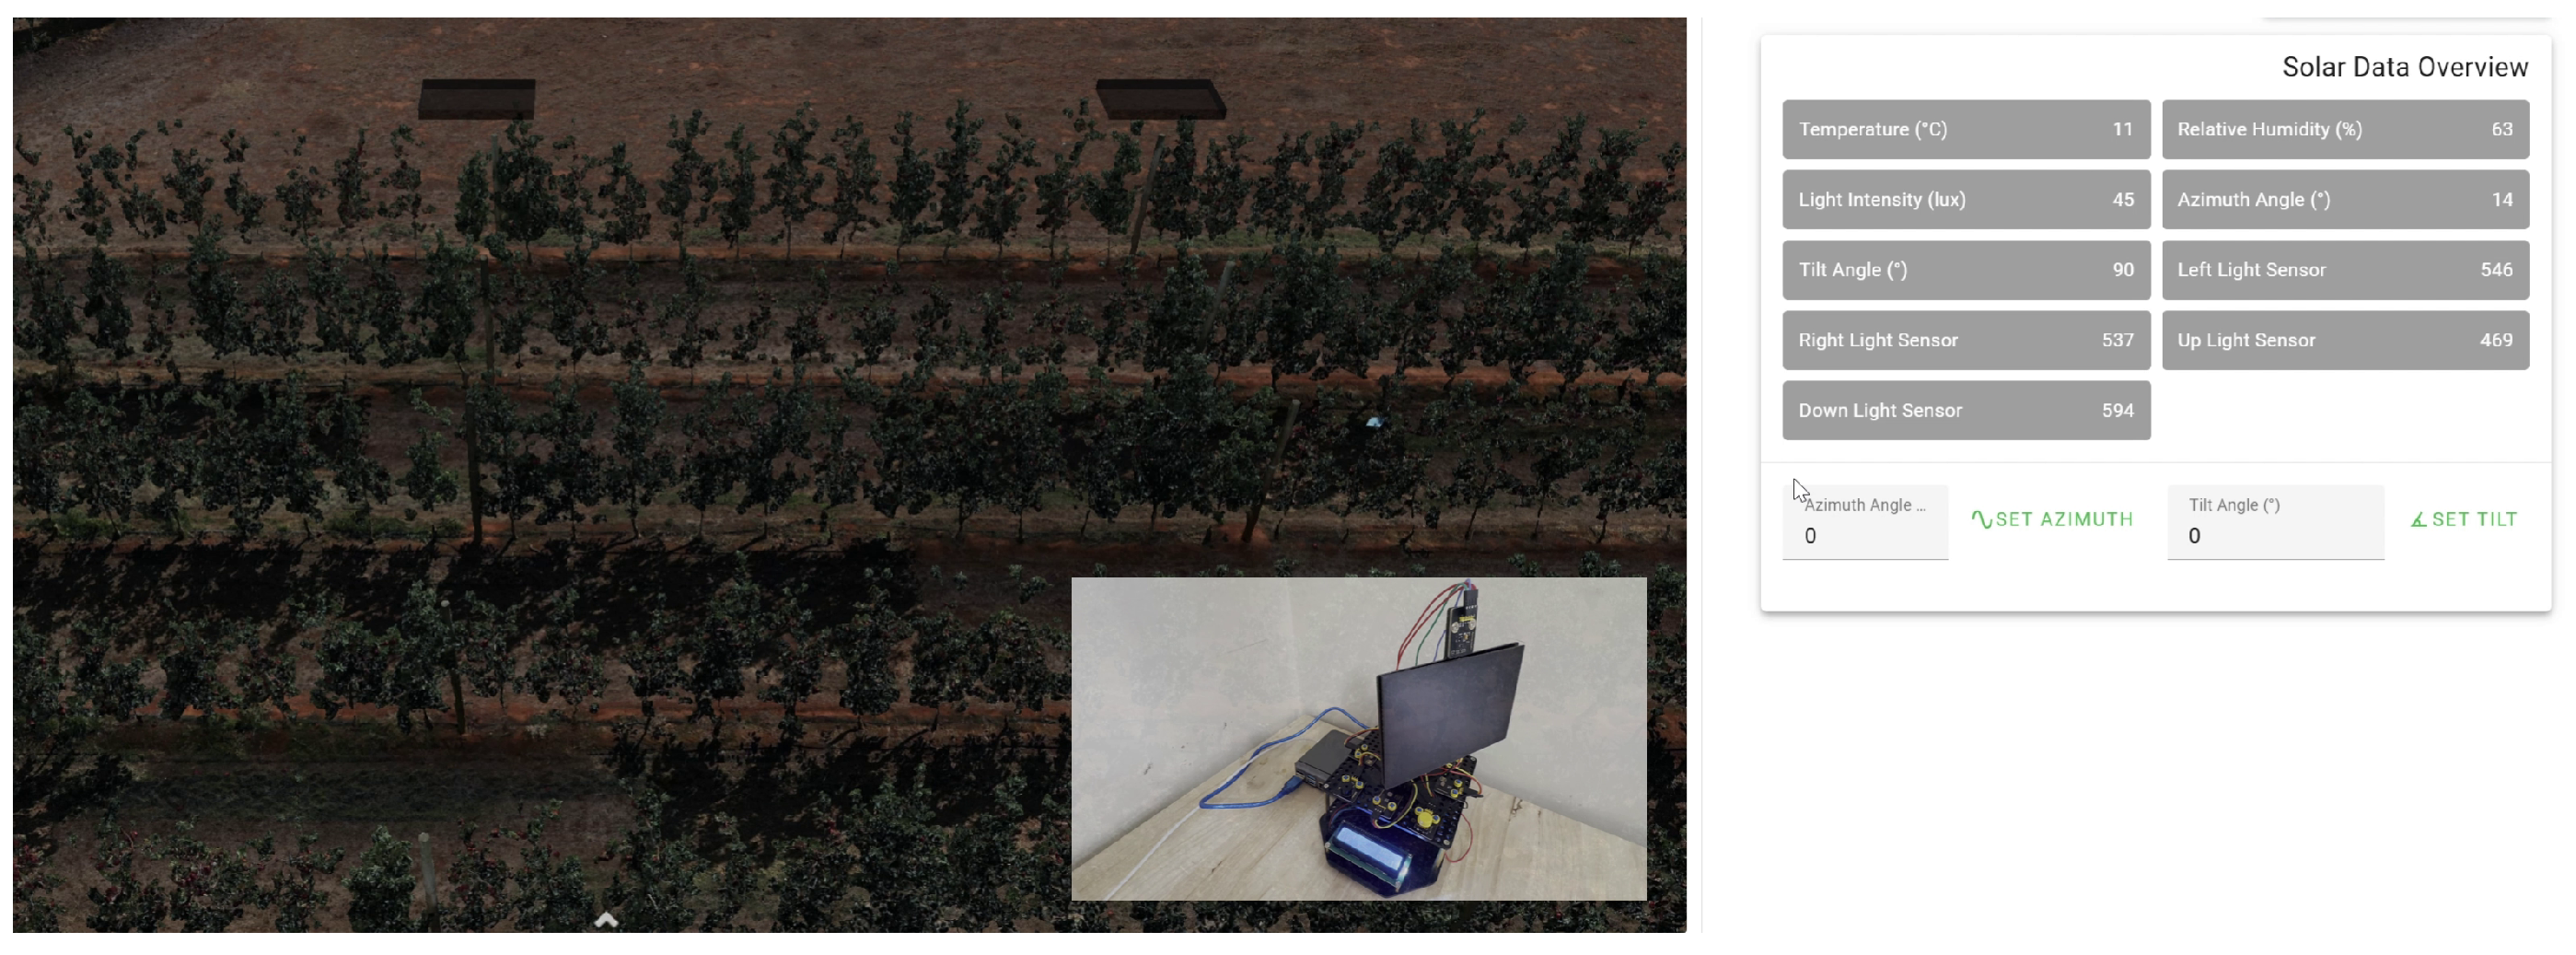
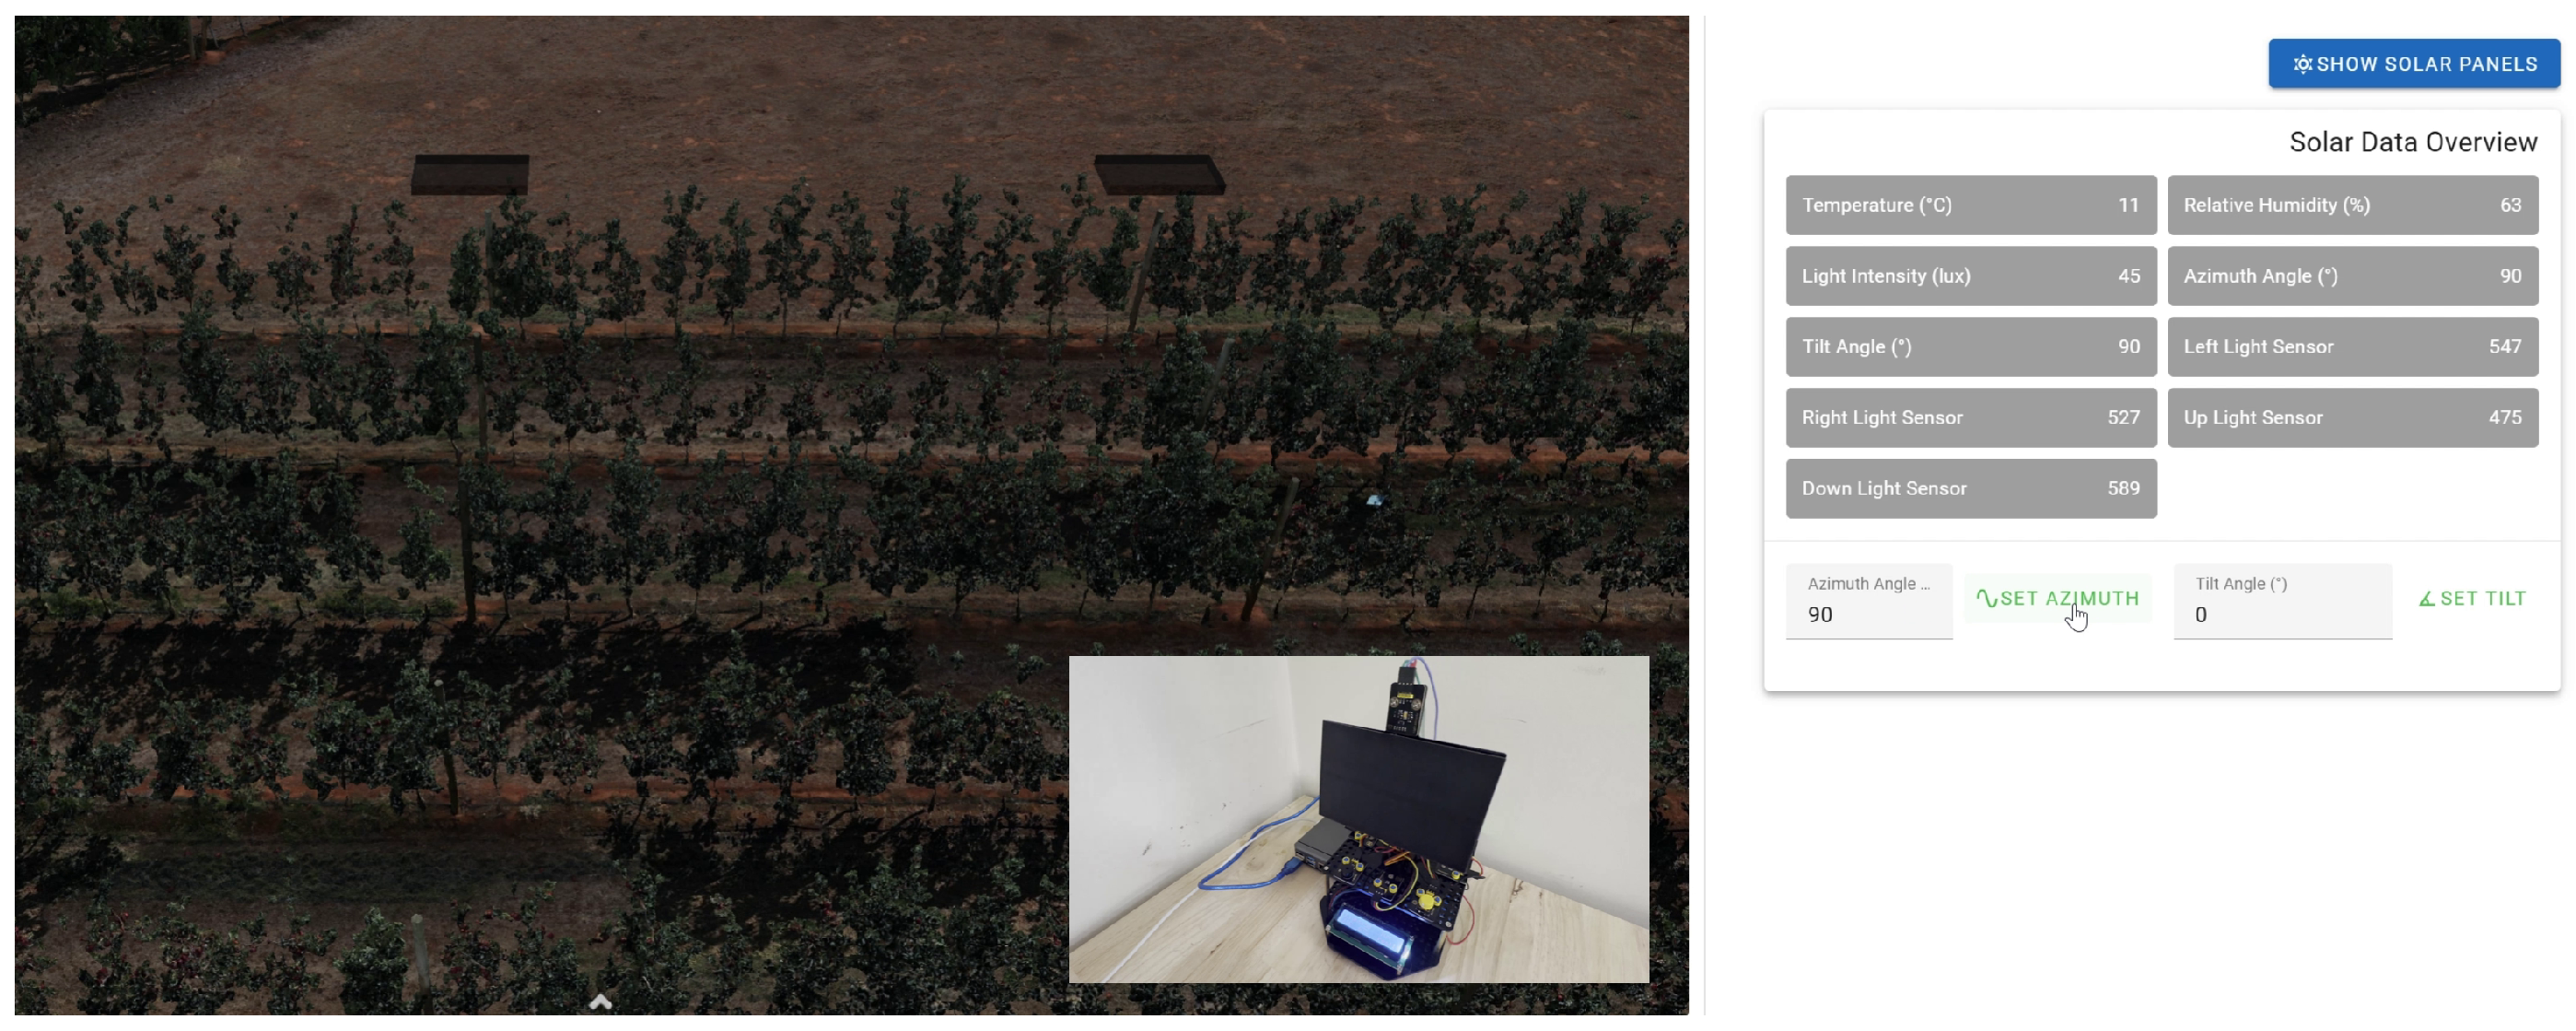
A key validation of the framework, confirming its function as a true digital twin rather than a digital shadow, was the successful demonstration of bidirectional communication and physical actuation. The closed-loop control of the solar tracking kit was implemented and verified, demonstrating that commands issued within the virtual environment were accurately executed on the physical system, as shown in Figure 19 and Figure 20. In this framework, the system distinguishes between automated tracking logic, which manages the physical hardware under standard operations, and manual user control, which is initiated through the digital twin interface. A clear hierarchy is established where the manual user control is granted higher priority, allowing it to override the autonomous sensor-based tracking for targeted operational tasks or simulation-driven adjustments.
The resulting state changes were then transmitted back to the digital twin, completing the feedback loop and validating real-time synchronisation between the virtual and physical layers. The validation test was conducted as follows:
  • The Arduino read the initial azimuth and tilt angles of the physical solar panel and transmitted them to the MQTT broker via the Raspberry Pi. The digital twin dashboard, subscribed to the broker, displayed the current state of the system (e.g., azimuth: 90°, tilt: 30°).
  • A new command was issued from the dashboard by adjusting the numeric input spinners to new values (e.g., azimuth: 120°, tilt: 45°). This action published an MQTT message to the designated control topic.
  • The Raspberry Pi gateway received the message and relayed the command to the Arduino, which physically adjusted the solar panel’s orientation and tilt.
  • The encoders on the solar tracking kit confirmed the new physical state, and these updated values were published back to the MQTT broker.
  • The dashboard updated automatically to display the new, confirmed angles (azimuth: 120°, tilt: 45°), successfully closing the control loop.
This validation confirms that the manual user control successfully overrides the automated tracking logic, ensuring that the digital twin acts as the primary authority in the synchronised closed-loop system. This test confirmed the framework’s ability to not only monitor the physical system but also to remotely control it, establishing a fully synchronised and interactive relationship between the physical system and its virtual counterpart. The entire bidirectional cycle, from command initiation to feedback confirmation, was completed with minimal latency, demonstrating the system’s suitability for remote operations, such as dynamically adjusting solar panel angles to optimise the trade-off between energy generation and crop light exposure in an agrivoltaic system. This result establishes a foundational capability for future simulation-driven optimisation and automation.

5. Discussion

This study presents the successful design, implementation, and validation of an end-to-end digital twin framework, marking a significant advancement from fragmented conceptual models to a functional and comprehensive system for agrivoltaic management. By unifying high-fidelity 3D modelling, physics-based simulation, and real-time IoT connectivity, the framework addresses the core scientific and technical challenges associated with balancing food and energy production. The following sections interpret these findings across three primary domains: the technical methodology behind the digital orchard reconstruction, the quantitative evaluation of agrivoltaic design trade-offs, and the validation of bidirectional communication for closed-loop system control.

5.1. Evaluation of Digital Model Development

The study successfully established a centimetre-level, georeferenced 3D representation of an orchard environment using a systematic UAV-based photogrammetric workflow. This model was processed into a high-performance, hierarchical 3D tileset, which enabled smooth, real-time exploration within a web-based CesiumJS interface. The necessity for such high-fidelity modelling stems from the unique complexity of orchard environments. Unlike traditional 2D GIS or simplified 3D geometries, photogrammetry-derived models capture critical site-specific parameters, including canopy geometry, porosity, and height. These features are fundamental to achieving the precision required for accurate light interception and microclimate simulations, while the existing research in agricultural technology has explored 3D modelling, these efforts are often fragmented or used in isolation for mapping. This study advances the field by integrating these high-fidelity spatial models into a unified, interactive platform that supports real-time data fusion. Unlike systems based on simplified models, this framework ensures that subsequent irradiance simulations accurately represent real-world shading dynamics in complex agricultural settings.
From an engineering perspective, the use of 3D tiling (Cesium 3D Tiles) is a significant architectural choice. It allows the framework to stream large-scale datasets to low-power user devices by rendering only the visible level-of-detail. This effectively decouples backend computational intensity from the frontend user experience, providing a practical pathway for farmers and researchers to interact with complex spatial data via standard web browsers. A critical constraint identified was the computational cost associated with high-fidelity reconstruction. The initial 3D processing required a 42 h window for a 4.7 acre area, which precludes continuous, daily updates of the physical orchard’s state. Furthermore, while the model is geometrically precise, it remains a periodic snapshot rather than a dynamic, growing representation. Subsequent development will investigate optimising the 3D reconstruction pipeline to shorten the design–build–test cycle and support more frequent synchronisation. There is also an opportunity to automate the tracking of tree development by comparing temporal photogrammetric datasets across different seasons.

5.2. Evaluation of Design and Simulation Outcomes

The simulation analysis quantified the substantial influence of system geometry and orientation on both photovoltaic performance and crop-level light availability. Configurations with an east–west orientation (90° azimuth) achieved the highest daily energy yield of 53.97 kWh. This represented a 32% increase in daily energy generation compared to the baseline north–south (0° azimuth) configuration, which provided a more balanced output of 40.86 kWh while preserving 98% of the peak crop-level irradiance. These results occur because the 90° orientation likely improves solar exposure during morning and afternoon hours, though at the cost of a 39% reduction in peak light availability relative to the baseline. Furthermore, the study identified a 30% energy penalty when switching from a single-axis tracking system to a fixed-tilt mount, reinforcing that mechanical tracking provides a significantly higher performance-to-shading efficiency than static changes in panel height. Unlike industry-standard tools like PVsyst, SAM, or HelioScope, which often lack automated crop-level irradiance analysis or dynamic scene generation, this framework addresses the site-specific complexities of orchards by allowing for real-time configuration within a high-fidelity 3D environment.
From a practical engineering standpoint, this framework serves as a vital de-risking mechanism by quantifying energy–irradiance trade-offs before physical deployment. Stakeholders can leverage these insights to align the divergent priorities of farmers and solar developers through data-driven financial modelling, effectively shortening the design–build–test cycle. However, a significant limitation of the current study is that the simulation outputs, including energy yield and crop irradiance, have not yet been validated against empirical field data; this lack of quantitative field validation represents the most critical constraint in the current work. Additionally, while the study utilised a clear-sky day as a computational baseline, it is acknowledged that seasonal variability and diffuse light conditions significantly impact cumulative irradiance and crop yields. Consequently, the current conclusions regarding “optimal” orientation should be viewed strictly as a geometric proof-of-concept rather than a definitive seasonal recommendation. Future research will involve deploying PAR sensors to calibrate the predictive engine against empirical ground-truth data. Furthermore, subsequent development will focus on the modular integration of standard crop-growth modelling engines, such as APSIM or DSSAT, to move beyond irradiance proxies and provide predictive insights into multi-year physiological processes and cumulative stress impacts on perennial crops.

5.3. Evaluation of Monitoring and Control Operational Implications

The framework was successfully validated as a true digital twin, moving beyond a “digital shadow” by demonstrating reliable bidirectional communication and physical actuation. Experimental tests confirmed that control commands initiated within the virtual dashboard were accurately relayed and executed by the physical tracking hardware with minimal latency, ensuring real-time synchronisation between the virtual and physical layers. This closed-loop functionality is facilitated by a modular three-layer IoT architecture comprising perception, network, and application layers, which ensures a clear separation of hardware interaction and data processing. The adoption of the MQTT protocol was critical due to its lightweight publish–subscribe model, which provides the high efficiency required for resource-constrained agricultural networks while serving as a cross-platform communication standard. By utilising Node-RED as a flow-based orchestration tool, the system transitions from a passive data logger into an active control node capable of executing manual user overrides that supersede autonomous tracking logic for specific operational requirements. This integration of high-fidelity 3D photogrammetric models with closed-loop actuation represents a significant advancement over the agricultural digital twins, which the current literature identifies as being largely limited to one-way data collection and visualisation.
From a practical engineering standpoint, the developed architecture provides a scalable reference model that can be adapted for industrial-scale agrivoltaic infrastructure, as the communication logic remains technology-agnostic and standardised via MQTT. This capability improves operational responsiveness by allowing stakeholders to dynamically adjust solar panel angles to protect crops during extreme weather or to optimise light exposure based on real-time microclimate data. By shortening the design–build–test cycle through virtual experimentation, the framework acts as a significant de-risking mechanism for sustainable food–energy co-production. However, a key limitation is that the bidirectional control subsystem has currently only been functionally validated in a laboratory environment using a prototype solar tracking kit, and full-scale field deployment will require substantial environmental hardening, such as IP67-rated enclosures, to withstand the moisture and temperature fluctuations inherent in orchard settings. Furthermore, the computational intensity required for high-fidelity 3D updates restricts the model to periodic updates, although these are well-aligned with the seasonal growth stages of perennial orchards. Future research will focus on transitioning the perception and network layers to industrial-grade hardware and exploring long-range wireless protocols such as LoRaWAN or 5G to manage communication across expansive farm acreage. Subsequent development will also explore the implementation of predictive tracking algorithms that incorporate real-time microclimate inputs and advanced sensing modalities for crop health monitoring.

6. Conclusions

The global drive to increase food production while reducing carbon emissions has intensified land-use competition, for which agrivoltaics, the co-location of agriculture and solar energy, offers a promising solution. However, its adoption remains limited due to the financial risks associated with balancing crop productivity and energy yield, while digital twin technology can address these challenges through virtual simulation and predictive analysis, its use in agrivoltaics has been constrained by the absence of an integrated, practical framework that connects sensing, modelling and control. This research bridges that gap by developing and validating a comprehensive end-to-end digital twin framework that successfully addresses the formulated research questions. This was achieved by providing a blueprint that integrates a high-fidelity 3D model with real-time monitoring and bidirectional control. This integration transforms the system from a passive monitoring tool into a true digital twin capable of real-time interaction and actuation. The framework’s value for interactive design and simulation was further demonstrated through simulations that quantified the impact of AVS design parameters, showing that panel orientation and row spacing have the most significant influence on crop-level light conditions, while panel height primarily affects operational factors. This critical interpretation of the simulation results reveals that the relationship between PV design and crop health is non-linear. Specifically, the 90° azimuth configuration was found to increase daily energy output to 53.97 kWh (representing a 32% increase) while significantly reducing peak crop-level irradiance to 205 W/m2 (a 39% reduction). Furthermore, the analysis revealed that switching from a single-axis tracking system to a fixed-tilt mount resulted in a substantial energy generation loss, dropping from 40.86 kWh to 28.69 kWh. These findings underscore that optimising a single metric is insufficient in complex orchard environments. By quantifying these trade-offs before physical deployment, the framework serves as a de-risking mechanism for stakeholders, allowing for the identification of design thresholds that balance energy revenue with agronomic productivity.
While the bidirectional control logic was successfully validated, the current limitations include the laboratory scale of the physical hardware and the computational intensity required for high-fidelity 3D updates. Future research will focus on transitioning the perception and network layers to industrial-grade hardware and IP67 rated enclosures to ensure reliability in real-world orchard settings. Additionally, investigating long-range wireless network connectivity protocols will be essential to manage the communication requirements associated with large-scale distributed trackers. Subsequent studies will also explore optimising the 3D reconstruction pipeline to support more frequent synchronisation between the virtual and physical environments. The broader implication of this work lies in its contribution to a foundational paradigm shift in precision agriculture, demonstrating a clear pathway from passive, data-centric monitoring towards active, model-driven, closed-loop management. By enabling virtual experimentation, the framework allows stakeholders to mitigate investment risks and shorten the design–build–test cycle. The developed technology-agnostic architecture provides a validated and replicable methodology for creating integrated agricultural digital twins. This offers researchers, engineers and solar solution providers a data-driven reference model to design, manage and optimise systems that sustainably enhance both food production and renewable energy generation.

Author Contributions

Conceptualisation, C.-T.C., T.Y.P., A.R., G.W., A.L.A., K.R.M. and C.A.L.; methodology, C.-T.C., T.Y.P., A.R., G.W., A.L.A., K.R.M. and C.A.L.; software, G.W. and D.M.; validation, E.E., D.M., G.W., C.-T.C., T.Y.P. and A.R.; formal analysis, E.E., D.M., G.W., C.-T.C., T.Y.P. and A.R.; investigation, E.E., G.W. and D.M.; resources, C.-T.C., T.Y.P., A.R., G.W., A.L.A., K.R.M. and C.A.L.; data curation, G.W., D.M., A.L.A., K.R.M. and C.A.L.; writing—original draft preparation, E.E., D.M., G.W., C.-T.C., T.Y.P. and A.R.; writing—review and editing, E.E., D.M., G.W., C.-T.C., T.Y.P. and A.R.; visualisation, E.E., D.M., G.W., C.-T.C., T.Y.P. and A.R.; supervision, C.-T.C., T.Y.P., A.R. and G.W.; project administration, C.-T.C., T.Y.P., A.R., G.W., A.L.A., K.R.M. and C.A.L.; funding acquisition, C.-T.C., T.Y.P. and A.R. All authors have read and agreed to the published version of the manuscript.

Funding

The project was funded by the Food Agility Cooperative Research Centre project number FA135.

Data Availability Statement

The data presented in this study are available on request from the corresponding author. The data are not publicly available due to the large file sizes of the high-fidelity 3D orchard models and commercial sensitivities regarding specific orchard locations.

Acknowledgments

Memko Systems provided specialised knowledge in digital twin development and technical software support, particularly through their expertise with the Dassault Systèmes 3DEXPERIENCE platform (version R2025x). Their technical guidance on bidirectional data integration and simulation workflows was instrumental in the successful implementation of the digital twin framework.

Conflicts of Interest

The authors declare no conflicts of interest. The funders had no role in the design of the study; in the collection, analyses, or interpretation of data; in the writing of the manuscript; or in the decision to publish the results.

Abbreviations

The following abbreviations are used in this manuscript:
APIApplication programming interface
GISGeographic information systems
IoTInternet of Things
MQTTMessage Queuing Telemetry Transport
PARPhotosynthetically active radiation
POAPlane-of-array
PVPhotovoltaic
ROIRegion of interest
UAVUnmanned aerial vehicle

References

  1. Cho, J.; Park, S.; Park, A.; Lee, O.; Nam, G.; Ra, I. Application of Photovoltaic Systems for Agriculture: A Study on the Relationship between Power Generation and Farming for the Improvement of Photovoltaic Applications in Agriculture. Energies 2020, 13, 4815. [Google Scholar] [CrossRef] [Scilit]
  2. Thompson, E.P.; Bombelli, E.L.; Shubham, S.; Watson, H.; Everard, A.; D’Ardes, V.; Schievano, A.; Bocchi, S.; Zand, N.; Howe, C.J.; et al. Tinted Semi-Transparent Solar Panels Allow Concurrent Production of Crops and Electricity on the Same Cropland. Adv. Energy Mater. 2020, 10, 2001189. [Google Scholar] [CrossRef] [Scilit]
  3. Liu, Q.; Chen, T.; Zhang, N.; Ye, Z.; Jiang, K.; Lin, Z.; Gao, Y.; Guo, Y.; Weng, A. Green Energy Meets Urban Agriculture: Unveiling the Carbon Reduction Potential of Rooftop Agrivoltaics. J. Clean. Prod. 2024, 480, 144110. [Google Scholar] [CrossRef] [Scilit]
  4. Sarr, A.; Soro, Y.M.; Tossa, A.K.; Diop, L. Agrivoltaic, a Synergistic Co-Location of Agricultural and Energy Production in Perpetual Mutation: A Comprehensive Review. Processes 2023, 11, 948. [Google Scholar] [CrossRef] [Scilit]
  5. Chopdar, R.K.; Sengar, N.; Giri, N.C.; Halliday, D. Comprehensive Review on Agrivoltaics with Technical, Environmental and Societal Insights. Renew. Sustain. Energy Rev. 2024, 197, 114416. [Google Scholar] [CrossRef] [Scilit]
  6. Zainol Abidin, M.A.; Mahyuddin, M.N.; Mohd Zainuri, M.A.A. Solar Photovoltaic Architecture and Agronomic Management in Agrivoltaic System: A Review. Sustainability 2021, 13, 7846. [Google Scholar] [CrossRef] [Scilit]
  7. Widmer, J.; Christ, B.; Grenz, J.; Norgrove, L. Agrivoltaics, a Promising New Tool for Electricity and Food Production: A Systematic Review. Renew. Sustain. Energy Rev. 2024, 192, 114277. [Google Scholar] [CrossRef] [Scilit]
  8. Wagner, M.; Lask, J.; Kiesel, A.; Lewandowski, I.; Weselek, A.; Högy, P.; Trommsdorff, M.; Schnaiker, M.A.; Bauerle, A. Agrivoltaics: The Environmental Impacts of Combining Food Crop Cultivation and Solar Energy Generation. Agronomy 2023, 13, 299. [Google Scholar] [CrossRef] [Scilit]
  9. Time, A.; Gomez-Casanovas, N.; Mwebaze, P.; Apollon, W.; Khanna, M.; DeLucia, E.H.; Bernacchi, C.J. Conservation Agrivoltaics for Sustainable Food-Energy Production. Plants People Planet 2024, 6, 558–569. [Google Scholar] [CrossRef] [Scilit]
  10. Ghasemi, S.; Sadeghkhani, I. Toward Sustainable Energy-Agriculture Synergies: A Review of Agrivoltaics Systems for Modern Farming Practices. Sol. RRL 2025, 9, 202500041. [Google Scholar] [CrossRef] [Scilit]
  11. Toledo, C.; Scognamiglio, A. Agrivoltaic Systems Design and Assessment: A Critical Review, and a Descriptive Model Towards a Sustainable Landscape Vision (three-Dimensional Agrivoltaic Patterns). Sustainability 2021, 13, 6871. [Google Scholar] [CrossRef] [Scilit]
  12. Carrausse, R.; Arnauld de Sartre, X. Does Agrivoltaism Reconcile Energy and Agriculture? Lessons from a French Case Study. Energy Sustain. Soc. 2023, 13, 8. [Google Scholar] [CrossRef] [Scilit]
  13. Schindele, S.; Trommsdorff, M.; Schlaak, A.; Obergfell, T.; Bopp, G.; Reise, C.; Braun, C.; Weselek, A.; Bauerle, A.; Högy, P.; et al. Implementation of Agrophotovoltaics: Techno-Economic Analysis of the Price-Performance Ratio and Its Policy Implications. Appl. Energy 2020, 265, 114737. [Google Scholar] [CrossRef] [Scilit]
  14. Tajima, M.; Iida, T. Evolution of Agrivoltaic Farms in Japan. In AIP Conference Proceedings; AIP Publishing LLC: Melville, NY, USA, 2021; Volume 2361, p. 030002. [Google Scholar]
  15. Yue, S.; Wu, W.; Yuan, B.; Ye, D.; Bai, W. Large-Scale Photovoltaic Farms Significantly Change the Vegetation Diversity and Biomass through Influencing Soil Moisture and Physiochemical Properties. Vadose Zone J. 2025, 24, e70002. [Google Scholar] [CrossRef] [Scilit]
  16. Trommsdorff, M.; Hopf, M.; Hörnle, O.; Berwind, M.; Schindele, S.; Wydra, K. Can Synergies in Agriculture through an Integration of Solar Energy Reduce the Cost of Agrivoltaics? An Economic Analysis in Apple Farming. Appl. Energy 2023, 350, 121619. [Google Scholar] [CrossRef] [Scilit]
  17. Maity, R.; Sudhakar, K.; Abdul Razak, A.; Karthick, A.; Barbulescu, D. Agrivoltaic: A Strategic Assessment Using Swot and Tows Matrix. Energies 2023, 16, 3313. [Google Scholar] [CrossRef] [Scilit]
  18. Purcell, W.; Neubauer, T. Digital Twins in Agriculture: A State-Of-The-Art Review. Smart Agric. Technol. 2023, 3, 100094. [Google Scholar] [CrossRef] [Scilit]
  19. Zhang, R.; Zhu, H.; Chang, Q.; Mao, Q. A Comprehensive Review of Digital Twins Technology in Agriculture. Agriculture 2025, 15, 903. [Google Scholar] [CrossRef] [Scilit]
  20. Errandonea, I.; Beltrán, S.; Arrizabalaga, S. Digital Twin for Maintenance: A Literature Review. Comput. Ind. 2020, 123, 103316. [Google Scholar] [CrossRef] [Scilit]
  21. Yasin, A.; Pang, T.Y.; Cheng, C.T.; Miletic, M. A Roadmap to Integrate Digital Twins for Small and Medium-Sized Enterprises. Appl. Sci. 2021, 11, 9479. [Google Scholar] [CrossRef] [Scilit]
  22. De Almeida, S.T.; Mo, J.P.T.; Bil, C.; Ding, S.; Cheng, C.T. Accurate Edm Calibration of a Digital Twin for a Seven-Axis Robotic Edm System and 3d Offline Cutting Path. Micromachines 2025, 16, 892. [Google Scholar] [CrossRef] [Scilit]
  23. Gu, W.; Duan, L.; Liu, S.; Guo, Z. A Real-Time Adaptive Dynamic Scheduling Method for Manufacturing Workshops Based on Digital Twin. Flex. Serv. Manuf. J. 2024, 1–33. [Google Scholar] [CrossRef] [Scilit]
  24. Chang, X.; Jia, X.; Liu, K.; Hu, H. Knowledge-Enabled Digital Twin for Smart Designing of Aircraft Assembly Line. Assem. Autom. 2021, 41, 441–456. [Google Scholar] [CrossRef] [Scilit]
  25. Walker, A. Singapore’s Digital Twin—From Science Fiction to Hi-Tech Reality. Infrastruct. Glob. 2023, 4, 2023. [Google Scholar]
  26. Trommsdorff, M.; Campana, P.E.; Macknick, J.; Fernandez Solas, A.; Gorjian, S.; Tsanakas, I.; Amaducci, S.; Baumgartner, F.; Berger, K.; Diaz Berrade, J.; et al. Dual Land Use for Agriculture and Solar Power Production: Overview and Performance of Agrivoltaic Systems; Techreport IEA-PVPS T13-29-2025; International Energy Agency: Paris, France, 2025. [Google Scholar] [CrossRef] [Scilit]
  27. Coşgun, A.E.; Endiz, M.S.; Demir, H.; Özcan, M. Agrivoltaic Systems for Sustainable Energy and Agriculture Integration in Turkey. Heliyon 2024, 10, e32300. [Google Scholar] [CrossRef] [Scilit] [PubMed]
  28. Mazzeo, D.; Di Zio, A.; Pesenti, C.; Leva, S. Optimizing Agrivoltaic Systems: A Comprehensive Analysis of Design, Crop Productivity and Energy Performance in Open-Field Configurations. Appl. Energy 2025, 390, 125750. [Google Scholar] [CrossRef] [Scilit]
  29. Pearce, J.M. Agrivoltaics in Ontario Canada: Promise and Policy. Sustainability 2022, 14, 3037. [Google Scholar] [CrossRef] [Scilit]
  30. Jung, D.; Schönberger, F.; Spera, F. Effects of Agrivoltaics on the Microclimate in Horticulture: Enhancing Resilience of Agriculture in Semi-Arid Zones. In AgriVoltaics Conference Proceedings; TIB Open Publishing: Hannover, Germany, 2023; Volume 2. [Google Scholar] [CrossRef]
  31. Abidin, M.A.Z.; Jamrus, N.F.; Azman, N.I.; Razak, N.I.A.; Omar, N.F. Evaluating the Impact of Agrivoltaic Systems on Microclimate and Andrographis Paniculata Growth. In IOP Conference Series: Earth and Environmental Science; IOP Publishing: Bristol, UK, 2024; Volume 1426, p. 012013. [Google Scholar]
  32. Gigant, P.; Godard, C.; Guellim, A.; Thuel, B.; Heraud, S. Case Study of Impact Evaluation of Agrivoltaic Structure Sizing on Water Availability for Wheat: Microclimate Simulations for Agrivoltaics System Performance Assessment. In AgriVoltaics Conference Proceedings; TIB Open Publishing: Hannover, Germany, 2023; Volume 2. [Google Scholar] [CrossRef]
  33. Abidin, M.A.Z.; Mahyuddin, M.N.; Zainuri, M.A.A.M. Optimal Efficient Energy Production by Pv Module Tilt-Orientation Prediction without Compromising Crop-Light Demands in Agrivoltaic Systems. IEEE Access 2023, 11, 71557–71572. [Google Scholar] [CrossRef] [Scilit]
  34. Akbar, A.; ibne Mahmood, F.; Alam, H.; Aziz, F.; Bashir, K.; Butt, N.Z. Field Assessment of Vertical Bifacial Agrivoltaics with Vegetable Production: A Case Study in Lahore, Pakistan. Renew. Energy 2024, 227, 120513. [Google Scholar] [CrossRef] [Scilit]
  35. Ferrara, G.; Boselli, M.; Palasciano, M.; Mazzeo, A. Effect of Shading Determined by Photovoltaic Panels Installed above the Vines on the Performance of Cv. Corvina (Vitis vinifera L.). Sci. Hortic. 2023, 308, 111595. [Google Scholar] [CrossRef] [Scilit]
  36. Willockx, B.; Herteleer, B.; Ronsijn, B.; Uytterhaegen, B.; Cappelle, J. A Standardized Classification and Performance Indicators of Agrivoltaic Systems. In Proceedings of the the 37th European Photovoltaic Solar Energy Conference and Exhibition (EU PVSEC), Virtual, 7–11 September 2020. [Google Scholar]
  37. Asa’a, S.; Reher, T.; Rongé, J.; Diels, J.; Poortmans, J.; Radhakrishnan, H.S.; van der Heide, A.; Van de Poel, B.; Daenen, M. A Multidisciplinary View on Agrivoltaics: Future of Energy and Agriculture. Renew. Sustain. Energy Rev. 2024, 200, 114515. [Google Scholar] [CrossRef] [Scilit]
  38. Kumdokrub, T.; You, F. Techno-Economic and Environmental Optimization of Agrivoltaics: A Case Study of Cornell University. Appl. Energy 2025, 384, 125436. [Google Scholar] [CrossRef] [Scilit]
  39. Vezzoni, R. Farming the Sun: The Political Economy of Agrivoltaics in the European Union. Sustain. Sci. 2025, 20, 1519–1534. [Google Scholar] [CrossRef] [Scilit]
  40. Schweiger, A.H.; Pataczek, L. How to Reconcile Renewable Energy and Agricultural Production in a Drying World. Plants People Planet 2023, 5, 650–661. [Google Scholar] [CrossRef] [Scilit]
  41. Navarro-González, F.J.; Manzano, J.; Pardo, M.A. Sizing Optimisation under Irradiance Uncertainty of Irrigation Systems Powered by Off-Grid Solar Panels. Comput. Electron. Agric. 2025, 232, 110034. [Google Scholar] [CrossRef] [Scilit]
  42. Alhejji, A.; Kuriqi, A.; Jurasz, J.; Abo-Elyousr, F.K. Energy Harvesting and Water Saving in Arid Regions Via Solar Pv Accommodation in Irrigation Canals. Energies 2021, 14, 2620. [Google Scholar] [CrossRef] [Scilit]
  43. Al Mamun, M.A.; Dargusch, P.; Wadley, D.; Zulkarnain, N.A.; Aziz, A.A. A Review of Research on Agrivoltaic Systems. Renew. Sustain. Energy Rev. 2022, 161, 112351. [Google Scholar] [CrossRef] [Scilit]
  44. Campana, P.E.; Stridh, B.; Amaducci, S.; Colauzzi, M. Optimisation of Vertically Mounted Agrivoltaic Systems. J. Clean. Prod. 2021, 325, 129091. [Google Scholar] [CrossRef] [Scilit]
  45. PVsyst SA. PVsyst: Photovoltaic Software, Version 8.0.18; PVsyst SA: Geneva, Switzerland, 2025. Available online: https://www.pvsyst.com/ (accessed on 30 September 2025).
  46. Aurora Solar Inc. Aurora Solar. Cloud-Based Software. 2025. Available online: https://aurorasolar.com/ (accessed on 30 September 2025).
  47. National Renewable Energy Laboratory. System Advisor Model (SAM), Version SAM 2025.04.16; National Renewable Energy Laboratory: Golden, CO, USA, 2025. Available online: https://sam.nrel.gov/ (accessed on 30 September 2025).
  48. Aurora Solar Inc. HelioScope. Cloud-Based Software. 2025. Available online: https://helioscope.aurorasolar.com/ (accessed on 30 September 2025).
  49. Sandbox Solar. Spade Agrivoltaics Design Software. Cloud-Based Software. 2025. Available online: https://spadesolar.com/ (accessed on 30 September 2025).
  50. Pang, T.Y.; Pelaez Restrepo, J.D.; Cheng, C.T.; Yasin, A.; Lim, H.; Miletic, M. Developing a Digital Twin and Digital Thread Framework for an ‘industry 4.0’shipyard. Appl. Sci. 2021, 11, 1097. [Google Scholar] [CrossRef] [Scilit]
  51. Tagarakis, A.C.; Benos, L.; Kyriakarakos, G.; Pearson, S.; Sørensen, C.G.; Bochtis, D. Digital Twins in Agriculture and Forestry: A Review. Sensors 2024, 24, 3117. [Google Scholar] [CrossRef] [Scilit] [PubMed]
  52. Verdouw, C.; Tekinerdogan, B.; Beulens, A.; Wolfert, S. Digital Twins in Smart Farming. Agric. Syst. 2021, 189, 103046. [Google Scholar] [CrossRef] [Scilit]
  53. De Raat, G.A.; Bakker, J.D.; Luiten, G.T.; Paulissen, J.H.; de Vogel, B.Q.; Scholten, H.; de Graaf, S. Predictive Twin for Steel Bridge in the Netherlands. In Life-Cycle of Structures and Infrastructure Systems; CRC Press: Boca Raton, FL, USA, 2023; pp. 1003–1010. [Google Scholar]
  54. Diakite, A.A.; Ng, L.; Barton, J.; Rigby, M.; Williams, K.; Barr, S.; Zlatanova, S. Liveable City Digital Twin: A Pilot Project for the City of Liverpool (NSW, Australia). Isprs Ann. Photogramm. Remote Sens. Spat. Inf. Sci. 2022, 10, 45–52. [Google Scholar] [CrossRef] [Scilit]
  55. Mahmoodian, M.; Shahrivar, F.; Setunge, S.; Mazaheri, S. Development of Digital Twin for Intelligent Maintenance of Civil Infrastructure. Sustainability 2022, 14, 8664. [Google Scholar] [CrossRef] [Scilit]
  56. White, G.; Zink, A.; Codecá, L.; Clarke, S. A Digital Twin Smart City for Citizen Feedback. Cities 2021, 110, 103064. [Google Scholar] [CrossRef] [Scilit]
  57. Ahmed, T.; Hasan, M. Weather-Driven Agricultural Decision-Making Under Imperfect Conditions. In Proceedings of the 33rd ACM International Conference on Advances in Geographic Information Systems; Association for Computing Machinery: New York, NY, USA, 2025; pp. 927–930. [Google Scholar]
  58. Li, B.; Thompson, M.; Partridge, T.; Xing, R.; Cutler, J.; Alhnaity, B.; Meng, Q. AI-Powered Digital Twin for Sustainable Agriculture and Greenhouse Gas Reduction. In 2024 IEEE 21st International Conference on Smart Communities: Improving Quality of Life using AI, Robotics and IoT (HONET); IEEE: Piscataway, NJ, USA, 2024; pp. 55–60. [Google Scholar]
  59. Kim, H.J.; Lee, M.H.; Yoe, H. Research on the Design and Application of Digital Twin-Based Smart Agricultural Systems. In 2023 Congress in Computer Science, Computer Engineering, & Applied Computing (CSCE); IEEE: Piscataway, NJ, USA, 2023; pp. 1770–1773. [Google Scholar]
  60. Ghandar, A.; Ahmed, A.; Zulfiqar, S.; Hua, Z.; Hanai, M.; Theodoropoulos, G. A Decision Support System for Urban Agriculture Using Digital Twin: A Case Study with Aquaponics. IEEE Access 2021, 9, 35691–35708. [Google Scholar] [CrossRef] [Scilit]
  61. Angin, P.; Anisi, M.H.; Göksel, F.; Gürsoy, C.; Büyükgülcü, A. Agrilora: A Digital Twin Framework for Smart Agriculture. J. Wirel. Mob. Netw. Ubiquitous Comput. Dependable Appl. 2020, 11, 77–96. [Google Scholar]
  62. Howard, D.A.; Ma, Z.; Aaslyng, J.M.; Jørgensen, B.N. Data Architecture for Digital Twin of Commercial Greenhouse Production. In 2020 RIVF International Conference on Computing & Communication Technologies (RIVF); IEEE: Piscataway, NJ, USA, 2020; pp. 1–7. [Google Scholar]
  63. Zohdi, T.I. A Digital-Twin and Machine-Learning Framework for the Design of Multiobjective Agrophotovoltaic Solar Farms. Comput. Mech. 2021, 68, 357–370. [Google Scholar] [CrossRef] [Scilit]
  64. Mengi, E.; Samara, O.A.; Zohdi, T.I. Crop-Driven Optimization of Agrivoltaics Using a Digital-Replica Framework. Smart Agric. Technol. 2023, 4, 100168. [Google Scholar] [CrossRef] [Scilit]
  65. Pylianidis, C.; Osinga, S.; Athanasiadis, I.N. Introducing Digital Twins to Agriculture. Comput. Electron. Agric. 2021, 184, 105942. [Google Scholar] [CrossRef] [Scilit]
  66. Peladarinos, N.; Piromalis, D.; Cheimaras, V.; Tserepas, E.; Munteanu, R.A.; Papageorgas, P. Enhancing Smart Agriculture by Implementing Digital Twins: A Comprehensive Review. Sensors 2023, 23, 7128. [Google Scholar] [CrossRef] [Scilit] [PubMed]
  67. Yasin, A.; Delaney, J.; Cheng, C.T.; Pang, T.Y. The Design and Implementation of an Iot Sensor-Based Indoor Air Quality Monitoring System Using Off-The-Shelf Devices. Appl. Sci. 2022, 12, 9450. [Google Scholar] [CrossRef] [Scilit]
Figure 1. High-level methodological workflow of the study. The process is divided into two parallel development streams: one focusing on 3D model reconstruction and AVS simulation engine development, and the other involving the IoT hardware setup and bidirectional control logic. These streams converge to form the final integrated digital twin platform, which is subsequently validated.
Machines 14 00254 g001
Figure 2. Drone capture photograph of the sundial orchard, a scientific research facility managed by Agriculture Victoria in the Goulburn Valley, northern Victoria.
Machines 14 00254 g002
Figure 3. Flight path planning using the DJI surveying and mapping system, the flight path was designed at various heights, angles and overlaps.
Machines 14 00254 g003
Figure 4. Photogrammetric model of the orchard generated using Bentley iTwin Capture Modeller, based on UAV imagery captured from multi-directional flight paths and varied camera angles for accurate spatial representation.
Machines 14 00254 g004
Figure 5. Cesium web application front-end interface with the photogrammetric orchard model (a). The same model zoomed to the tree level, illustrating the increased level of detail available through Cesium web application tiled streaming (b).
Machines 14 00254 g005
Figure 6. At the front-end interface, the Cesium interface (right) provides spatial context and visual confirmation, and the custom user interface (left) allows users to define the panel height and maximum tracking angle, with real-time visual feedback.
Machines 14 00254 g006
Figure 7. IoT network architecture of the proposed framework. The perception layer contains physical sensors and actuators. The network layer manages data processing, transmission and persistence (Raspberry Pi, Node-RED, MQTT Broker, InfluxDB). The application layer provides the user interface and control.
Machines 14 00254 g007
Figure 8. The solar tracking kit comprises a solar panel with adjustable orientation and tilt mechanisms, controlled by an Arduino microcontroller and a four-quadrant photoresistor array for light sensing.
Machines 14 00254 g008
Figure 9. Node-RED flow illustrating the bidirectional communication between the physical solar tracking system and the digital twin. The node colours represent specific functions within the orchestration layer: orange nodes indicate the serial communication interface with the hardware (Arduino), purple nodes denote MQTT publish/subscribe actions for cloud data transmission, and green nodes represent debug or display outputs for monitoring the data payload. Sensor data from the Arduino is published via the Raspberry Pi to the MQTT broker and visualised in the Cesium web application. User commands from the Cesium web application are sent back through the MQTT broker to control the solar panel’s orientation, enabling real-time synchronisation within the digital twin framework.
Machines 14 00254 g009
Figure 10. Shadow analysis in the Cesium web application, leveraging the high-fidelity model and GIS data to simulate shadow behaviour across different times of day: (a) simulation showing shadows at 09:15 UTC; and (b) simulation showing shadows at 13:00 UTC illustrating the progression across the orchard.
Machines 14 00254 g010
Figure 18. Scatter plot illustrating the trade-off between simulated energy generation (kWh) and crop-level irradiance (W/m2) for the configurations listed in Table 4. The trend line highlights the negative correlation between the two variables.
Machines 14 00254 g018
Figure 19. The monitoring dashboard in the front-end interface shows the sensor data in real time.
Machines 14 00254 g019
Figure 20. Control commands can be sent from the front-end interface to control IoT devices, for instance, the azimuth angle.
Machines 14 00254 g020
Table 1. Summary of the existing PV design and simulation tools with control support comparison.
ToolTool Context: Common Use/DefinitionKey FunctionalitiesReal-Time Control SupportLimitations for Orchard-Scale Agrivoltaics
PVsyst [45]Industry standard software for detailed PV system energy yield simulation and financial analysis.Graphical user interface (GUI)-based PV system simulation; 3D shading using DAE/PVC; CLI for batch runs.None. Primarily for retrospective or planning assessment.PVC scenes cannot be generated dynamically; per-panel irradiance only via GUI; limited automated crop-level irradiance analysis.
Aurora Solar [46]Cloud-based platform for rapid residential and commercial solar design, sales and remote site analysis for installers.High-resolution 3D PV design; GPU-accelerated panel-level shading and irradiance calculation.None. Focuses on design, sales, and ROI projections.No detailed crop-level irradiance mapping; cannot assess crop microclimate directly.
SAM (NREL) [47]System Advisor Model developed by NREL for techno-economic analysis of renewable energy projects and financing structures.System performance and financial modelling; numeric/tabular array layout inputs.None. Uses performance models to estimate annual output.Shading approximated using factors or horizon profiles; POA irradiance only for panels; no ground-level or dynamic per-panel modelling.
HelioScope [48]A solar design and engineering software focused on quickly optimising PV array layout, performance modelling and irradiance simulation.Rapid PV project design; panel-level shading and irradiance simulation.None. Focused on layout engineering and sales proposals.Limited under-panel irradiance modelling; requires integration with agrivoltaic-specific models.
SPADE [49]An analytical tool often used in research for advanced solar geometry and irradiance calculations, often utilising ray-tracing techniques.Analytical or ray-tracing-based solar simulations.None. Theoretical ray-tracing without physical system integration.Limited applicability to orchard-scale, real-time, multi-panel, crop-level irradiance simulations.
Table 2. Summary of the existing approaches for digital twin development.
StudyAim/ObjectivesTechnologiesKey Findings/Results
Walker [25], 2023To create a comprehensive, city-scale 3D digital twin for urban planning, infrastructure management and disaster resilience (Virtual Singapore).3D geospatial modelling, tiled datasets, IoT sensor data integration, simulation tools, Dassault Systèmes’ 3DEXPERIENCity platform.Enabled large-scale, real-time simulations for energy management, environmental monitoring and planning. Demonstrated scalability, interoperability and practical deployment at the national level.
De Raat et al. [53], 2023To develop a predictive digital twin to assist asset managers in assessing the end-of-service life phase of infrastructure, especially steel bridges.Cesium, Microsoft Azure cloud storage and TimescaleDB for data management, Bridge Weight in Motion (BWIM) analysis tool, ProbEye for parameter estimation and Continuous Automated Analysis tool.Ability to provide the current state, potential risks, leading to better decision-making and cost reductions on infrastructure maintenance.
Diakite et al. [54], 2022To develop a demonstration digital twin for cities using the existing data and open-source technologies to address urban challenges by enabling smarter planning, energy management, transportation and liveability.Lidar sensors, Cesium, CityGML, 3DCityDB, Python, SQL.Demonstrated the creation of a full-stack digital twin using open-source software, integrating the existing 3D geospatial data into a database and connecting IoT sensors.
Mahmoodian et al. [55], 2022To focus on the development of a digital twin for intelligent maintenance of civil infrastructure, aiming to address the inefficiencies and high costs associated with traditional maintenance practices.Tilt sensors, strain gauges, vibrometers, Finite Element Analysis (FEA), Ansys Workbench, Ansys Twin Builder, and ThingWorx PTC as the IoT platform.The proposed digital twin offers benefits such as time and cost savings through sensor-based data acquisition and improved data accuracy through objective real-time data analysis compared to subjective expert judgements.
White et al. [56], 2021To develop an open and public digital twin smart city model for urban planning and policy decisions, focusing on citizen feedback and interaction.Unity software to load digital twin model and to facilitate crowd simulations, OpenStreetMap, SUMO simulator to simulate urban mobility, and dublinked open data source.An online-based feedback mechanism for citizen approval and comments for urban planning. The ability to simulate events such as flooding to inform about evacuation policy and sandbag placement. Crowd simulations, simulating sunlight blockage due to buildings.
Table 3. Summary of digital twin applications in agricultural technology.
StudyAim/ObjectivesTechnologiesKey Findings/Results
Ahmed and Hasan [57], 2025To create a modular digital twin framework (CEREALIA) for detecting inconsistencies in agricultural weather data streams.Nine neural network models (e.g., ResNet, LSTM, Transformers), NVIDIA Jetson Orin edge platform and Docker containers.Successfully detected sensor anomalies and imputed missing values, significantly improving the accuracy of fruit surface temperature predictions under imperfect conditions.
Li et al. [58], 2024To develop a digital twin platform integrated with AI for tracking and predicting livestock greenhouse gas (GHG) emission trends.AI and machine learning models, Sentinel-5P satellite data, Google Earth Engine and interactive Leaflet maps.Achieved predictive tracking of methane trends by correlating animal biodata and farm conditions with atmospheric GHG concentrations.
Kim et al. [59], 2023To build a smart agricultural greenhouse system that utilises digital twins for real-time environmental monitoring and productivity enhancement.IoT sensors (temp, humidity, light, CO2), Python-based preprocessing, SQL databases and machine learning algorithms.Reported a 20% increase in crop productivity compared to physical greenhouses by utilising optimal temperature search algorithms within the virtual model.
Ghandar et al. [60], 2021To develop a novel decision support system for urban agriculture, specifically using aeroponics, using digital twin technology and machine learning.DHT22 temperature and humidity sensor, DS18B20 water temperature sensor, PH sensor, LDR shield light intensity sensor, Raspberry Pi, ESP8266, MQTT, MongoDB, Thingspeak for visualisation, water pump, air pump, Scikit-learn, machine learning algorithms, linear regression, support vector regression and decision trees.A model-based digital twin approach combined with machine learning is effective for predicting production and performing predictive decision analytics.
Angin et al. [61], 2020To propose a low-cost, high-precision IoT-based smart agriculture framework to address the growing high-yield crop production needs.Wireless Sensor Network, image processing, cloud servers to run computer vision algorithms, machine learning.Accurate plant disease detection from leaf images using MobileNet Convolutional Neural Network (CNN) model.
Howard et al. [62], 2020To develop a digital twin for the commercial greenhouse production process and to estimate future states of the greenhouse by leveraging past and real-time data from sensors and databases.AnyLogic platform for developing the digital twin, a multi-agent system to model greenhouse process flow, and an AI-based simulation model for the greenhouse production flow.Integration with several digital twins, such as greenhouse climate and energy systems, for decision-making. Integration with Enterprise Resource Planning (ERP) systems for procurement, sales, production and distribution data.
Disclaimer/Publisher’s Note: The statements, opinions and data contained in all publications are solely those of the individual author(s) and contributor(s) and not of MDPI and/or the editor(s). MDPI and/or the editor(s) disclaim responsibility for any injury to people or property resulting from any ideas, methods, instructions or products referred to in the content.