1. Introduction
Hopper scales function as the cornerstone of mass measurement in industrial production and logistics, operating at the intersection of high-precision metering and harsh physical impacts. While their accuracy is pivotal for quality assurance, cost control, and automation, the cumulative wear of weighing units presents a persistent, often undetected threat to production continuity [
1,
2]. In operational environments, these scales are subjected to severe dynamic impact loads exerted by falling materials. Consequently, the core load-bearing components of the weighing unit—typically employing a rocker-column structure for load transmission—are prone to cumulative wear during prolonged service. The physical degradation of the contact interface inevitably alters the system’s boundary constraints and dynamic characteristics, potentially leading to continuous drift in metrological performance or even catastrophic functional failure.
Numerous studies have addressed the impact of dynamic interference on weighing systems. In the realm of signal processing and error compensation, Boschetti et al. [
3] proposed model-based dynamic compensation methods to mitigate the effects of environmental vibrations. Similarly, Zhang et al. [
4] conducted in-depth research on sensor response characteristics under dynamic weighing conditions. Wang and Wang [
5] further explored velocity compensation methods to enhance accuracy in dynamic weighing. However, these approaches primarily focus on eliminating instantaneous dynamic interference via filtering to extract static weight values. They often overlook a fundamental issue: the evolution of the weighing unit’s own wear status during long-term service and its consequent impact on the system’s vibration response signature.
In the field of mechanical dynamics, wear-induced contact stiffness degradation is recognized as a key factor driving nonlinear vibration. Fundamental research [
6,
7,
8,
9] has demonstrated that the physical wear of contact interfaces significantly alters system dynamic responses. Building on this, recent tribological studies have further elucidated the specific link between wear evolution and structural dynamics. Xu et al. [
10] established a coupling model for lubricated rolling-sliding contacts, demonstrating that wear-induced roughness changes directly alter the contact resonance frequency. Similarly, Kalifa et al. [
11] proposed an analytical model for pin-on-disc systems, quantifying how the cumulative wear depth degrades the torsional stiffness. Basit et al. [
12] extended this to multi-contact mechanisms, revealing the nonlinear mapping between incremental wear and vibration response. However, these pioneering works predominantly focus on high-speed rotating machinery or continuous sliding-friction systems. The evolution mechanism of contact stiffness in dynamic weighing units under micro-amplitude fretting conditions remains unexplored.
In the specific domain of dynamic weighing, current research efforts are heavily concentrated on signal processing algorithms to reject environmental interference. For instance, He et al. [
13] applied a combined Kalman-EEMD algorithm to filter out motion artifacts in livestock weighing. Xiong et al. [
14] and Zengin and Akdemir [
15] utilized VMD and FIR-Kalman filtering techniques to suppress road excitation and circuit noise, achieving high-precision weight estimation. Critically, these approaches treat vibration signals solely as noise to be eliminated. They overlook that the vibration signature itself contains vital information, such as contact wear and stiffness degradation, about the structural health of the weighing equipment. Consequently, while measurement accuracy has been significantly improved, the capability for condition-based maintenance of the weighing unit itself is still lacking.
In response to these gaps, a wear-state assessment method tailored to industrial weighing units is proposed. Unlike previous studies that primarily address static weighing difference compensation, the present work emphasizes the evolutionary mechanisms underlying system dynamics, aiming to provide effective diagnostic criteria and theoretical support for Condition-Based Maintenance (CBM).
2. Theoretical Framework and Feature Extraction
2.1. System Description and Load Analysis
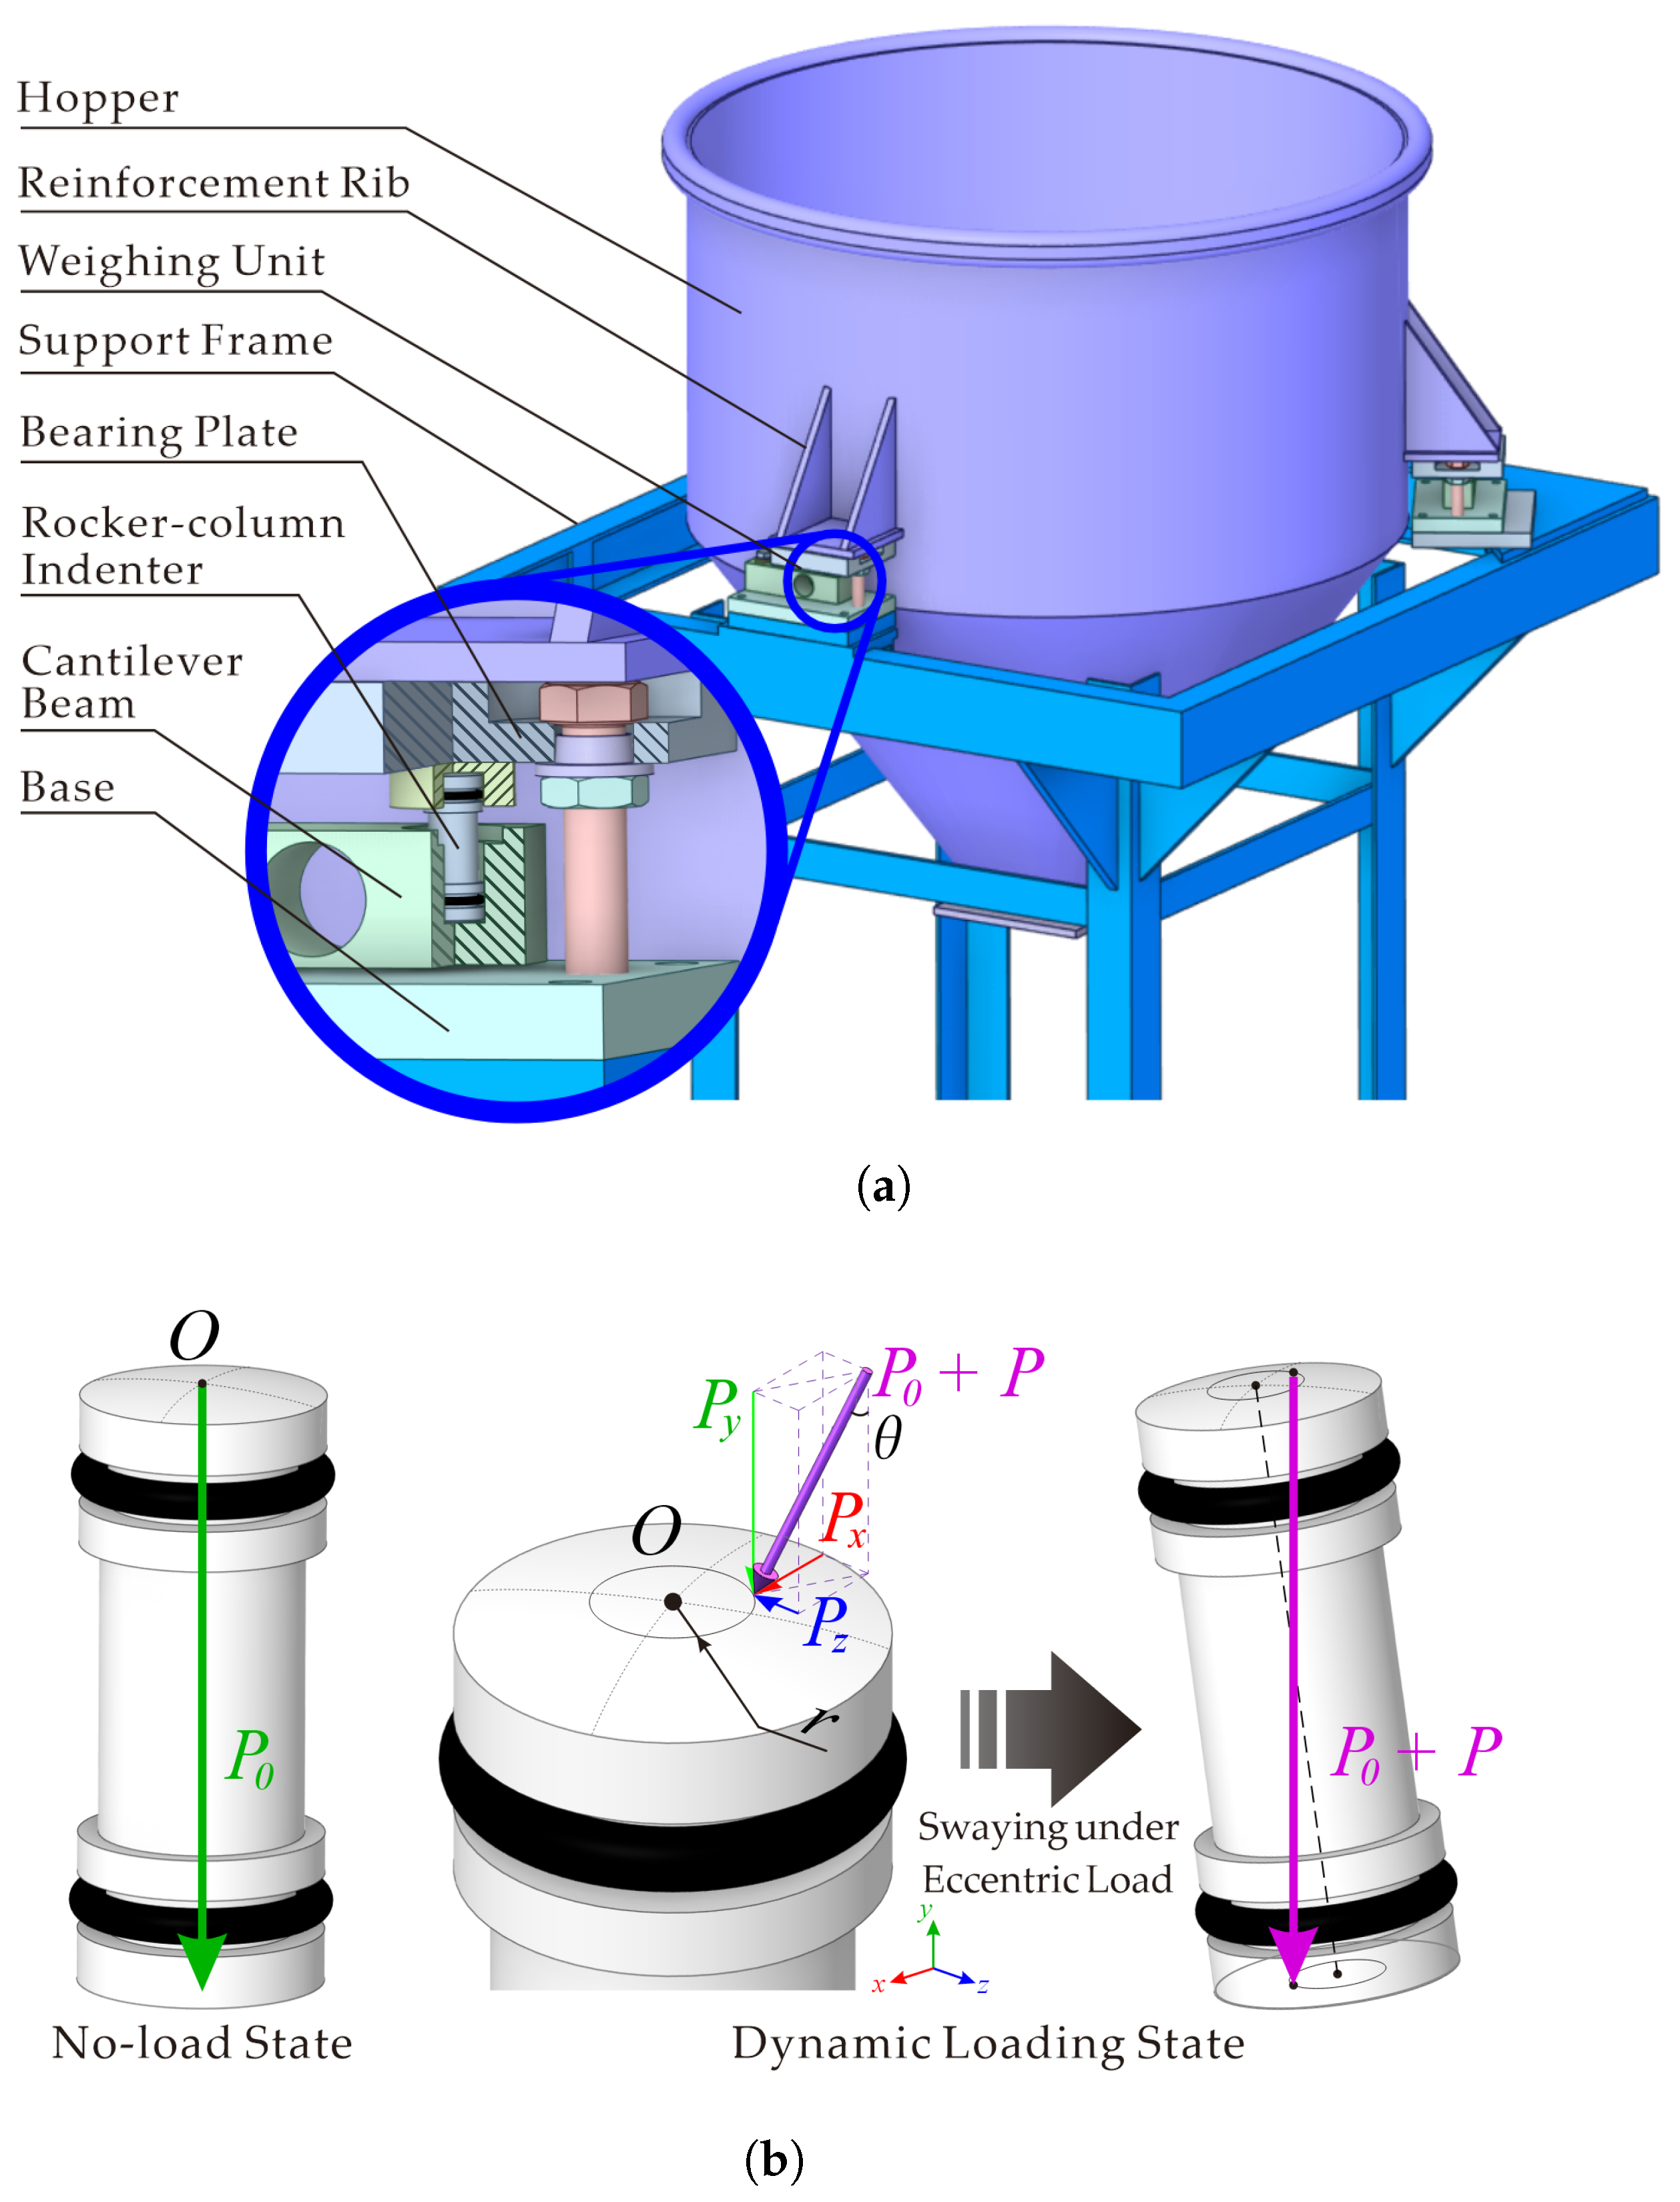
The installation structure of the hopper weighing system is illustrated in
Figure 1a. During the loading and weighing process, the impact of falling materials and the inherent structural asymmetry of the hopper inevitably generate complex alternating loads on the hopper structure and the weighing units.
Figure 1b depicts the force analysis of the weighing unit. In the static state, the hopper’s dead weight
acts vertically on the center point
O of the spherical surface of the rocker-column indenter (hereinafter referred to as the “indenter”). During dynamic loading, the resultant force of the three-dimensional dynamic impact
P and the static weight
acts on a surface area with a radius
r near the center
O. The component forces along the coordinate axes are denoted as
,
, and
.
The indenter contacts the bearing plate and the cantilever beam through its upper and lower spherical surfaces. This rocker-column design allows for micro-amplitude swaying around the contact center when subjected to lateral parasitic forces, thereby achieving self-alignment. As the core force-transmission component, the wear state of its contact interface significantly alters the system’s contact stiffness and boundary constraints.
2.2. Fretting Contact Mechanics Model
In fretting contact mechanics, the geometric parameters of the contact interface directly determine the constraint state. Based on Hertzian contact theory [
16], the contact radius
(mm) between the indenter and the bearing plate can be expressed as
where
is the vertical load (N),
is the equivalent elastic modulus (Pa), and
is the equivalent radius of curvature (mm). The reciprocal of
equals the sum of the reciprocals of the curvature radii of the two contact surfaces (
and
). Since the contact surface of the bearing plate is planar (
),
simplifies to the radius of the indenter sphere
.
According to the Cattaneo–Mindlin theory, under the action of alternating lateral forces, the fretting contact area comprises a slip zone and a stick zone [
17,
18]. The radius of the stick zone,
(mm), is positively correlated with the contact constraint capability and is defined as:
where
is the friction coefficient (dimensionless), and
(N) represents the time-varying total lateral force, which is the resultant vector of the parasitic loads
and
.
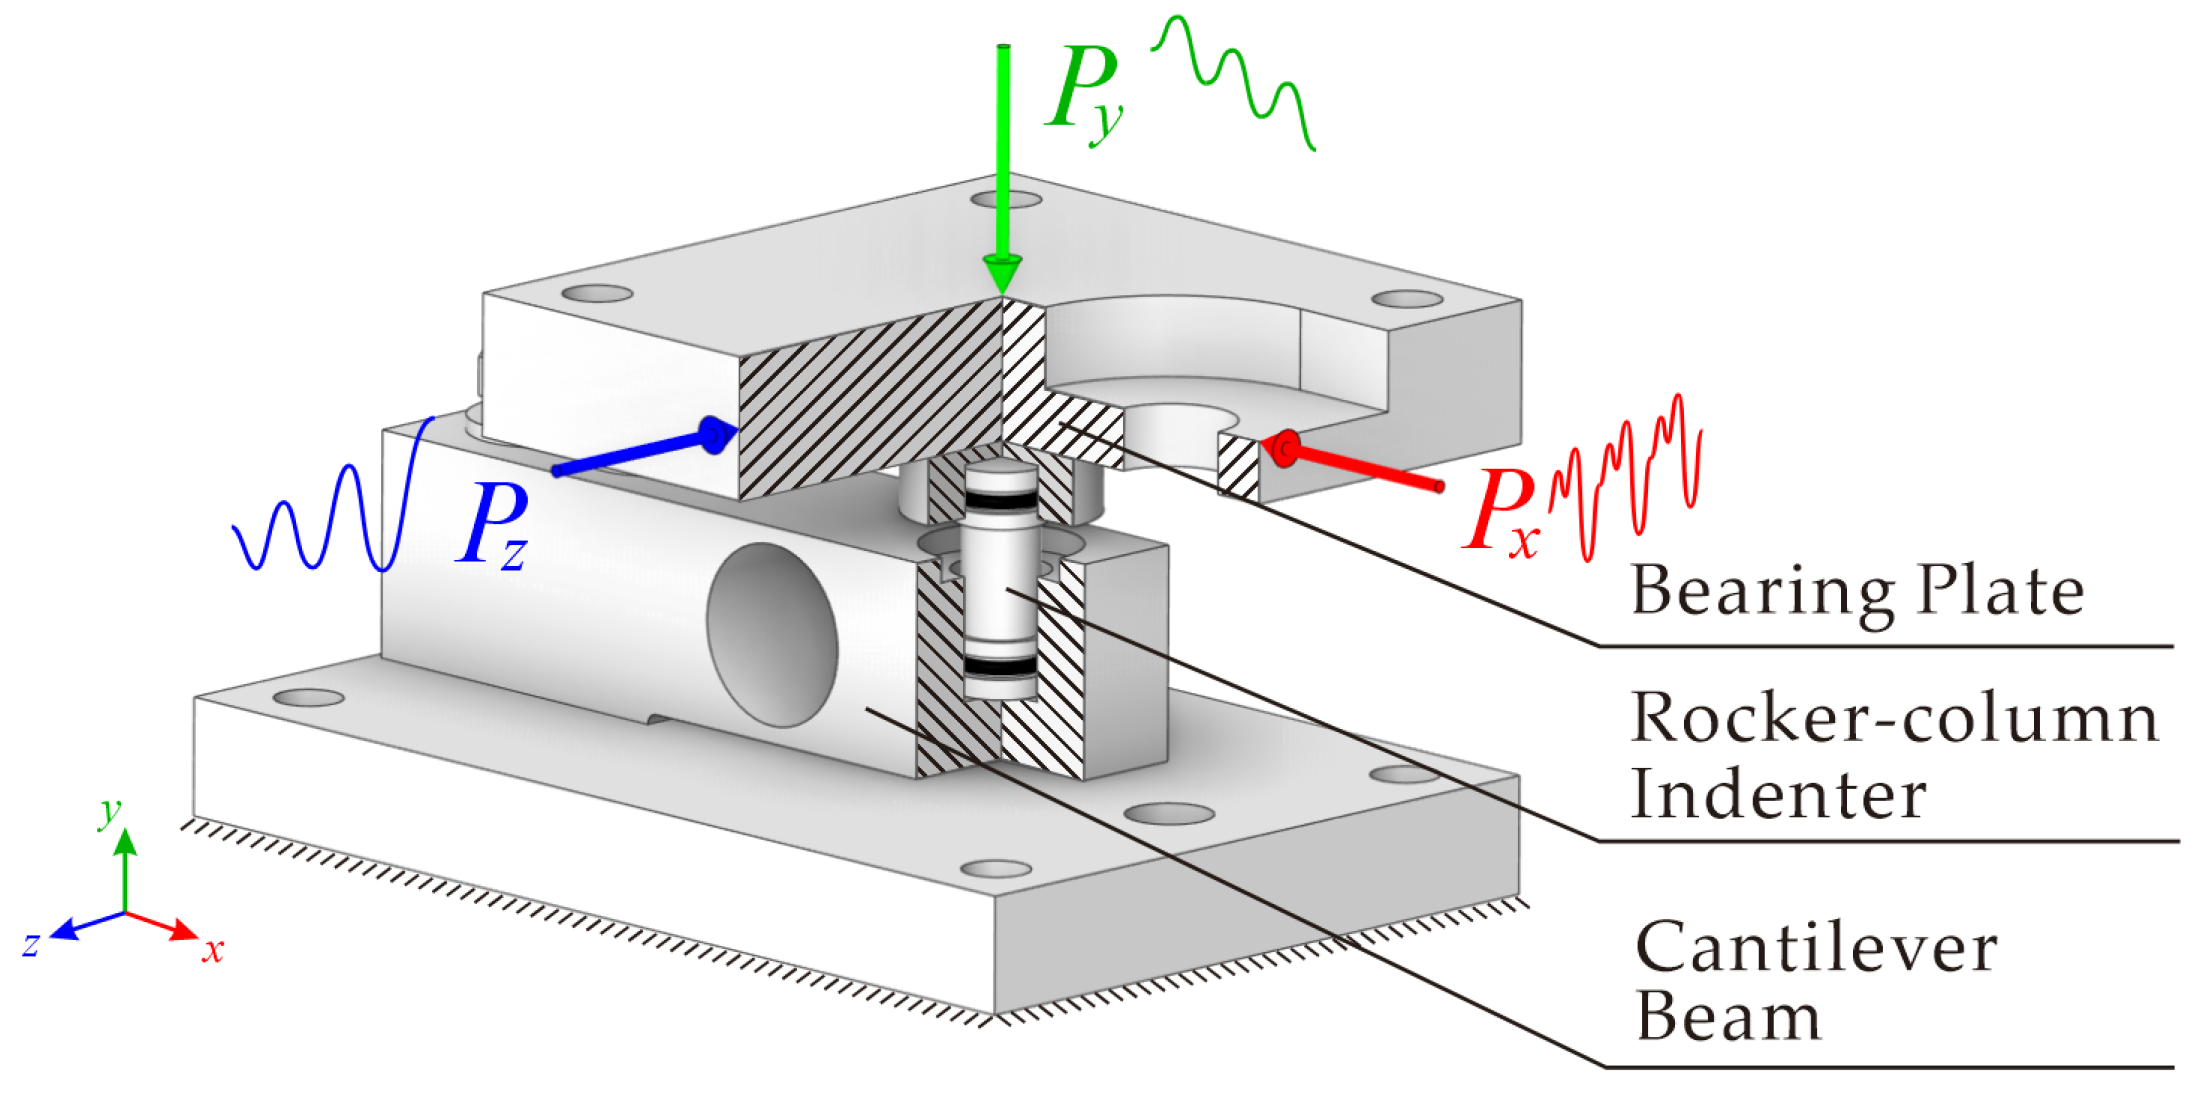
To bridge the gap between complex operational conditions and numerical simulation, an equivalent mechanical model was established (
Figure 2). This model abstracts the weighing unit shown in
Figure 1 into a simplified boundary value problem based on Hertzian and fretting contact theories. Specifically, the contacts between the base and foundation, as well as between the bearing plate and the hopper, are treated as planar contacts. A vertical normal force
is applied to the bearing plate to simulate the superposition of the hopper’s dead weight, material impact, and accumulation effects. Simultaneously, lateral forces
and
are applied to the distal ends of the bearing plate to simulate the lateral driving forces induced by material impact. This abstraction provides a clear boundary condition for subsequent finite element analysis [
19,
20].
2.3. Vibration Feature Indicators
To quantitatively analyze the impact of wear states on the system’s vibration response, time-domain statistical indicators were introduced [
21].
The Root Mean Square (RMS) reflects the average energy level of the vibration signal and is widely used to assess the overall vibration intensity of the system. For acceleration data containing
N sampling points, it is calculated as the square root of the mean of the squared acceleration amplitudes:
where
is the acceleration amplitude (g) of the
i-th sampling point, and
N is the total number of sampling points.
The Kurtosis indicator is highly sensitive to impulsive components in the signal. Its value increases significantly in the presence of transient shocks, making it suitable for detecting early-stage impact faults. Kurtosis (
K, dimensionless) is expressed as:
where
(g) is the mean value of the signal.
The Margin Factor (
L, dimensionless) represents the ratio of the signal peak to the square root amplitude. It is particularly effective in detecting wear-induced impacts and is defined as:
3. Coupled DEM–FEM Modeling Strategy
3.1. Global-to-Local DEM–FEM Coupled Model
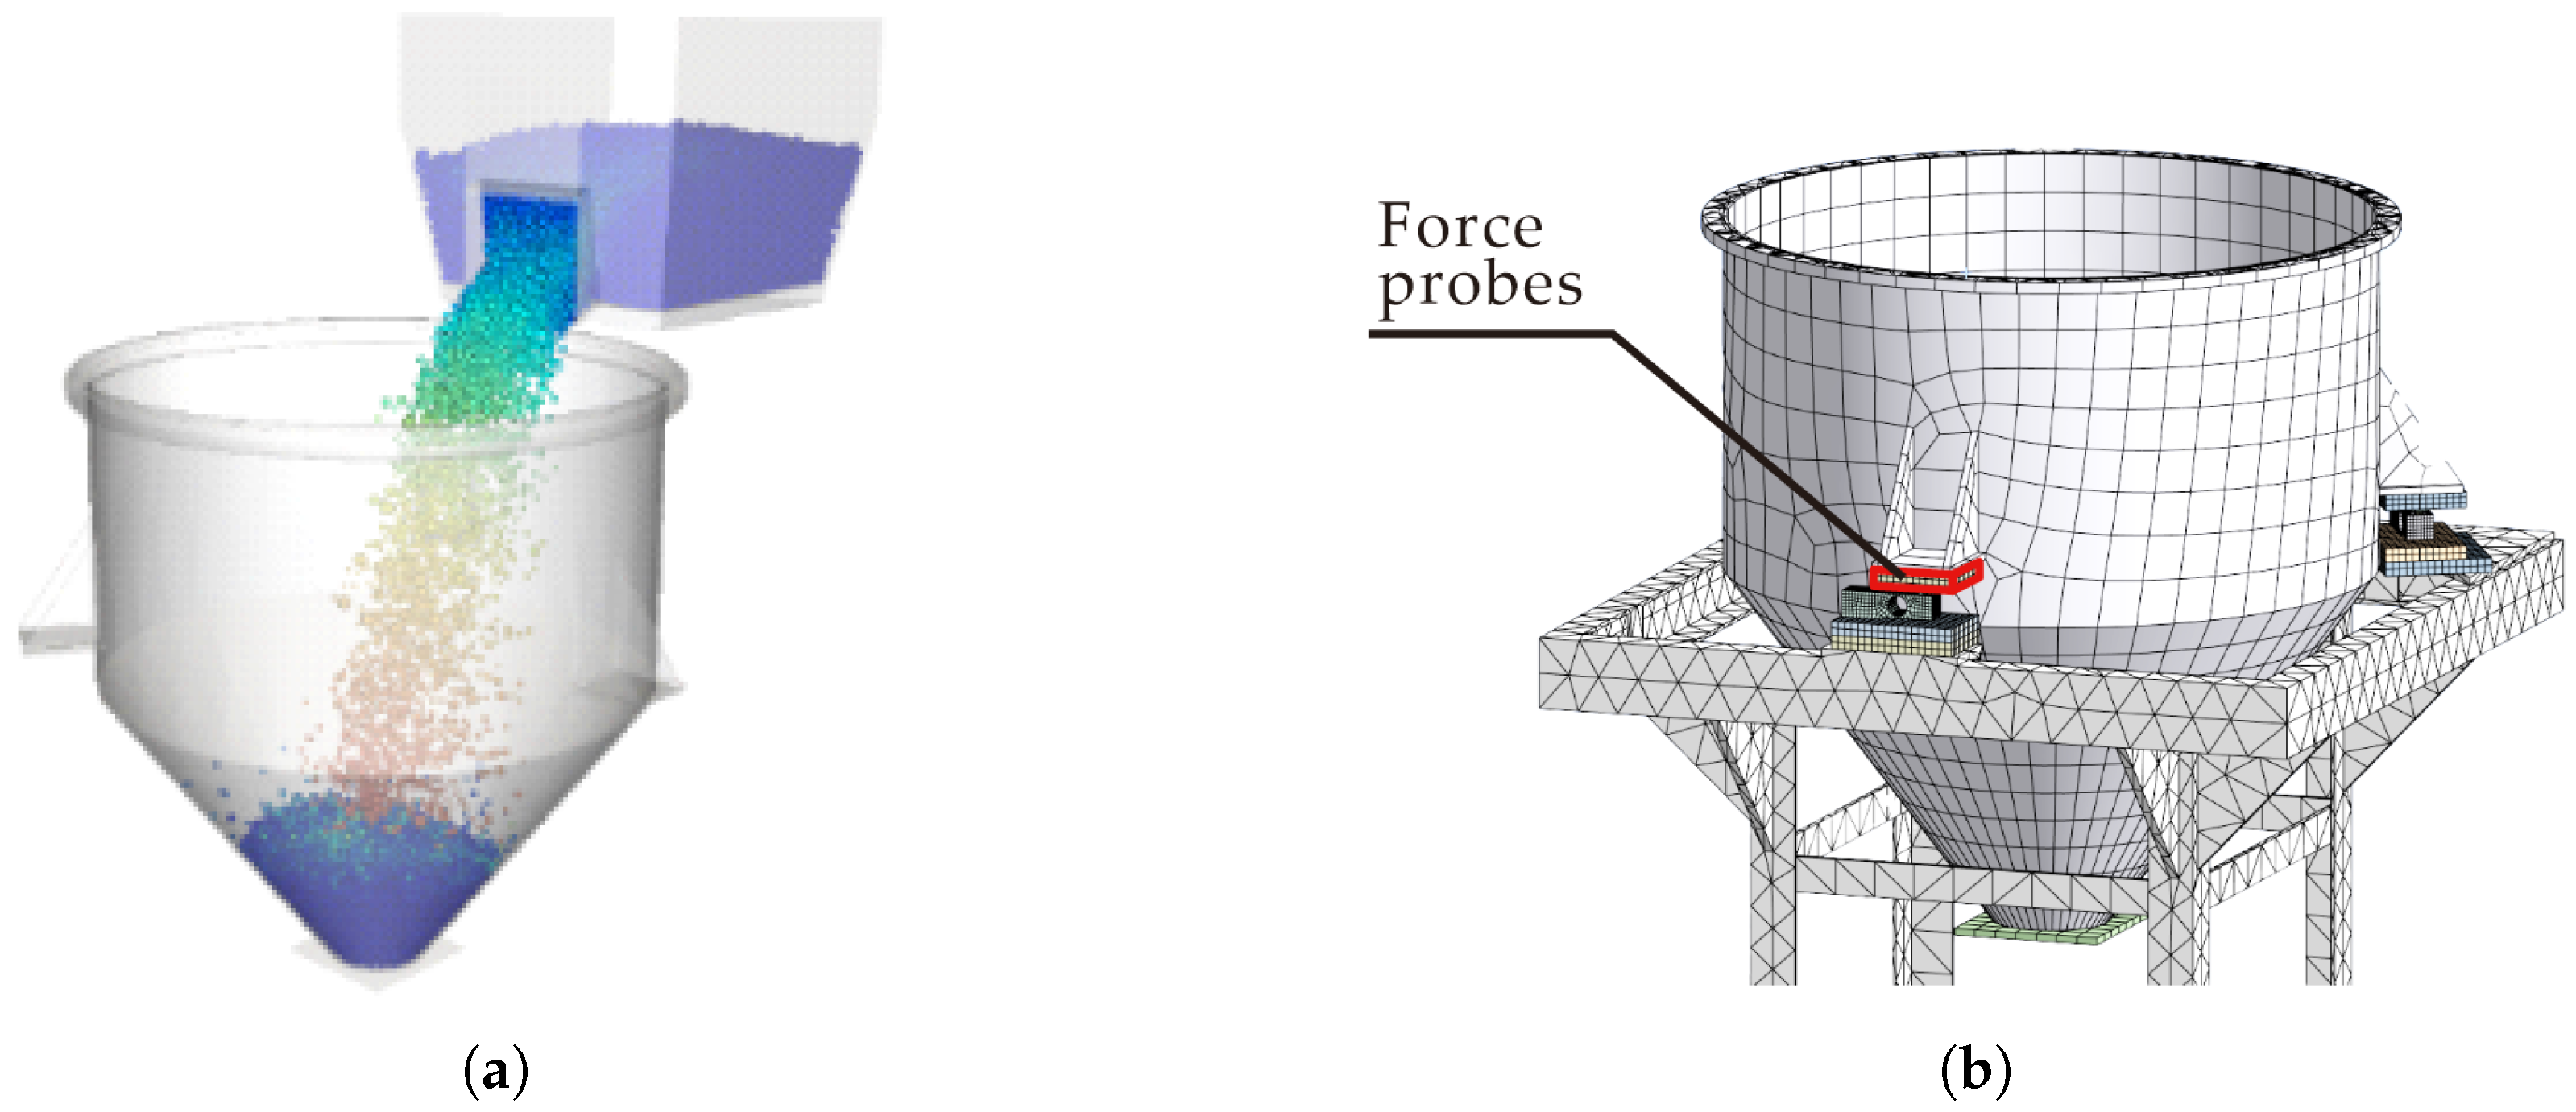
Directly simulating massive particle collisions within a structural finite element model is computationally prohibitive. Therefore, a global DEM–FEM coupled model was established to capture the macro-scale response. The material particle flow was simulated using the Discrete Element Method (DEM), where the time-varying wall pressure data were calculated and mapped onto the inner surface of the hopper in the global FEM model (
Figure 3) using a unidirectional node-to-surface coupling algorithm. This unidirectional coupling strategy has been shown to be effective for analyzing multi-scale granular-structural systems [
22,
23].
Because the hopper system operates on the meter scale while the indenter wear occurs on the sub-millimeter scale, a “Global-to-Local” modeling strategy was utilized to balance computational efficiency and local physical fidelity. Specifically, the three-dimensional dynamic load spectra acting on the weighing units were extracted from the global FEM model and applied as transient boundary conditions to the refined local sub-model to ensure accurate simulation results. This scale-bridging methodology has been widely validated in complex engineering systems. For instance, Knee and Ginga [
24] successfully applied this strategy to the stress analysis of commercial lithium batteries, bridging macro-deformation and micro-stress fields. Similarly, Chaudry et al. [
25] utilized a two-scale coupling approach to investigate granular crash absorbers in shipbuilding, effectively balancing computational cost with local physical fidelity.
The entire process of materials falling, filling, and impacting the hopper was simulated using Ansys Rocky (DEM). Based on actual experimental conditions, the material particles were modeled as spheres with diameters ranging from 9 mm to 25.5 mm, following a distribution consistent with the experimental pebbles. The particle density was set to 2500 kg/m
3, Young’s modulus to 30 GPa, and Poisson’s ratio to 0.25. The contact interactions were governed by the Hertzian Spring Dashpot model for normal force and the Mindlin-Deresiewicz model for tangential force [
20]. The rolling resistance was simulated using a Hysteretic Spring model. The restitution coefficient and friction coefficient were configured based on standard material properties [
26].
A unidirectional coupling technique was employed to transfer data between the computational domains. At each data exchange interval, the wall pressure data calculated in the DEM model were mapped onto the inner surface of the hopper in the global FEM model (
Figure 3b). Considering the relatively low-frequency swaying nature of the rocker-column structure, the data exchange interval was set to 0.01 s to balance computational efficiency with sampling resolution. To ensure computational accuracy, the hopper and weighing units in the global FEM model were meshed using hexahedron-dominated structured grids, while the support frame employed tetrahedral grids. The global model comprises 159,889 nodes and 71,129 elements. Virtual force probes were placed at the contact interface to record the three-dimensional dynamic load spectra
,
, and
.
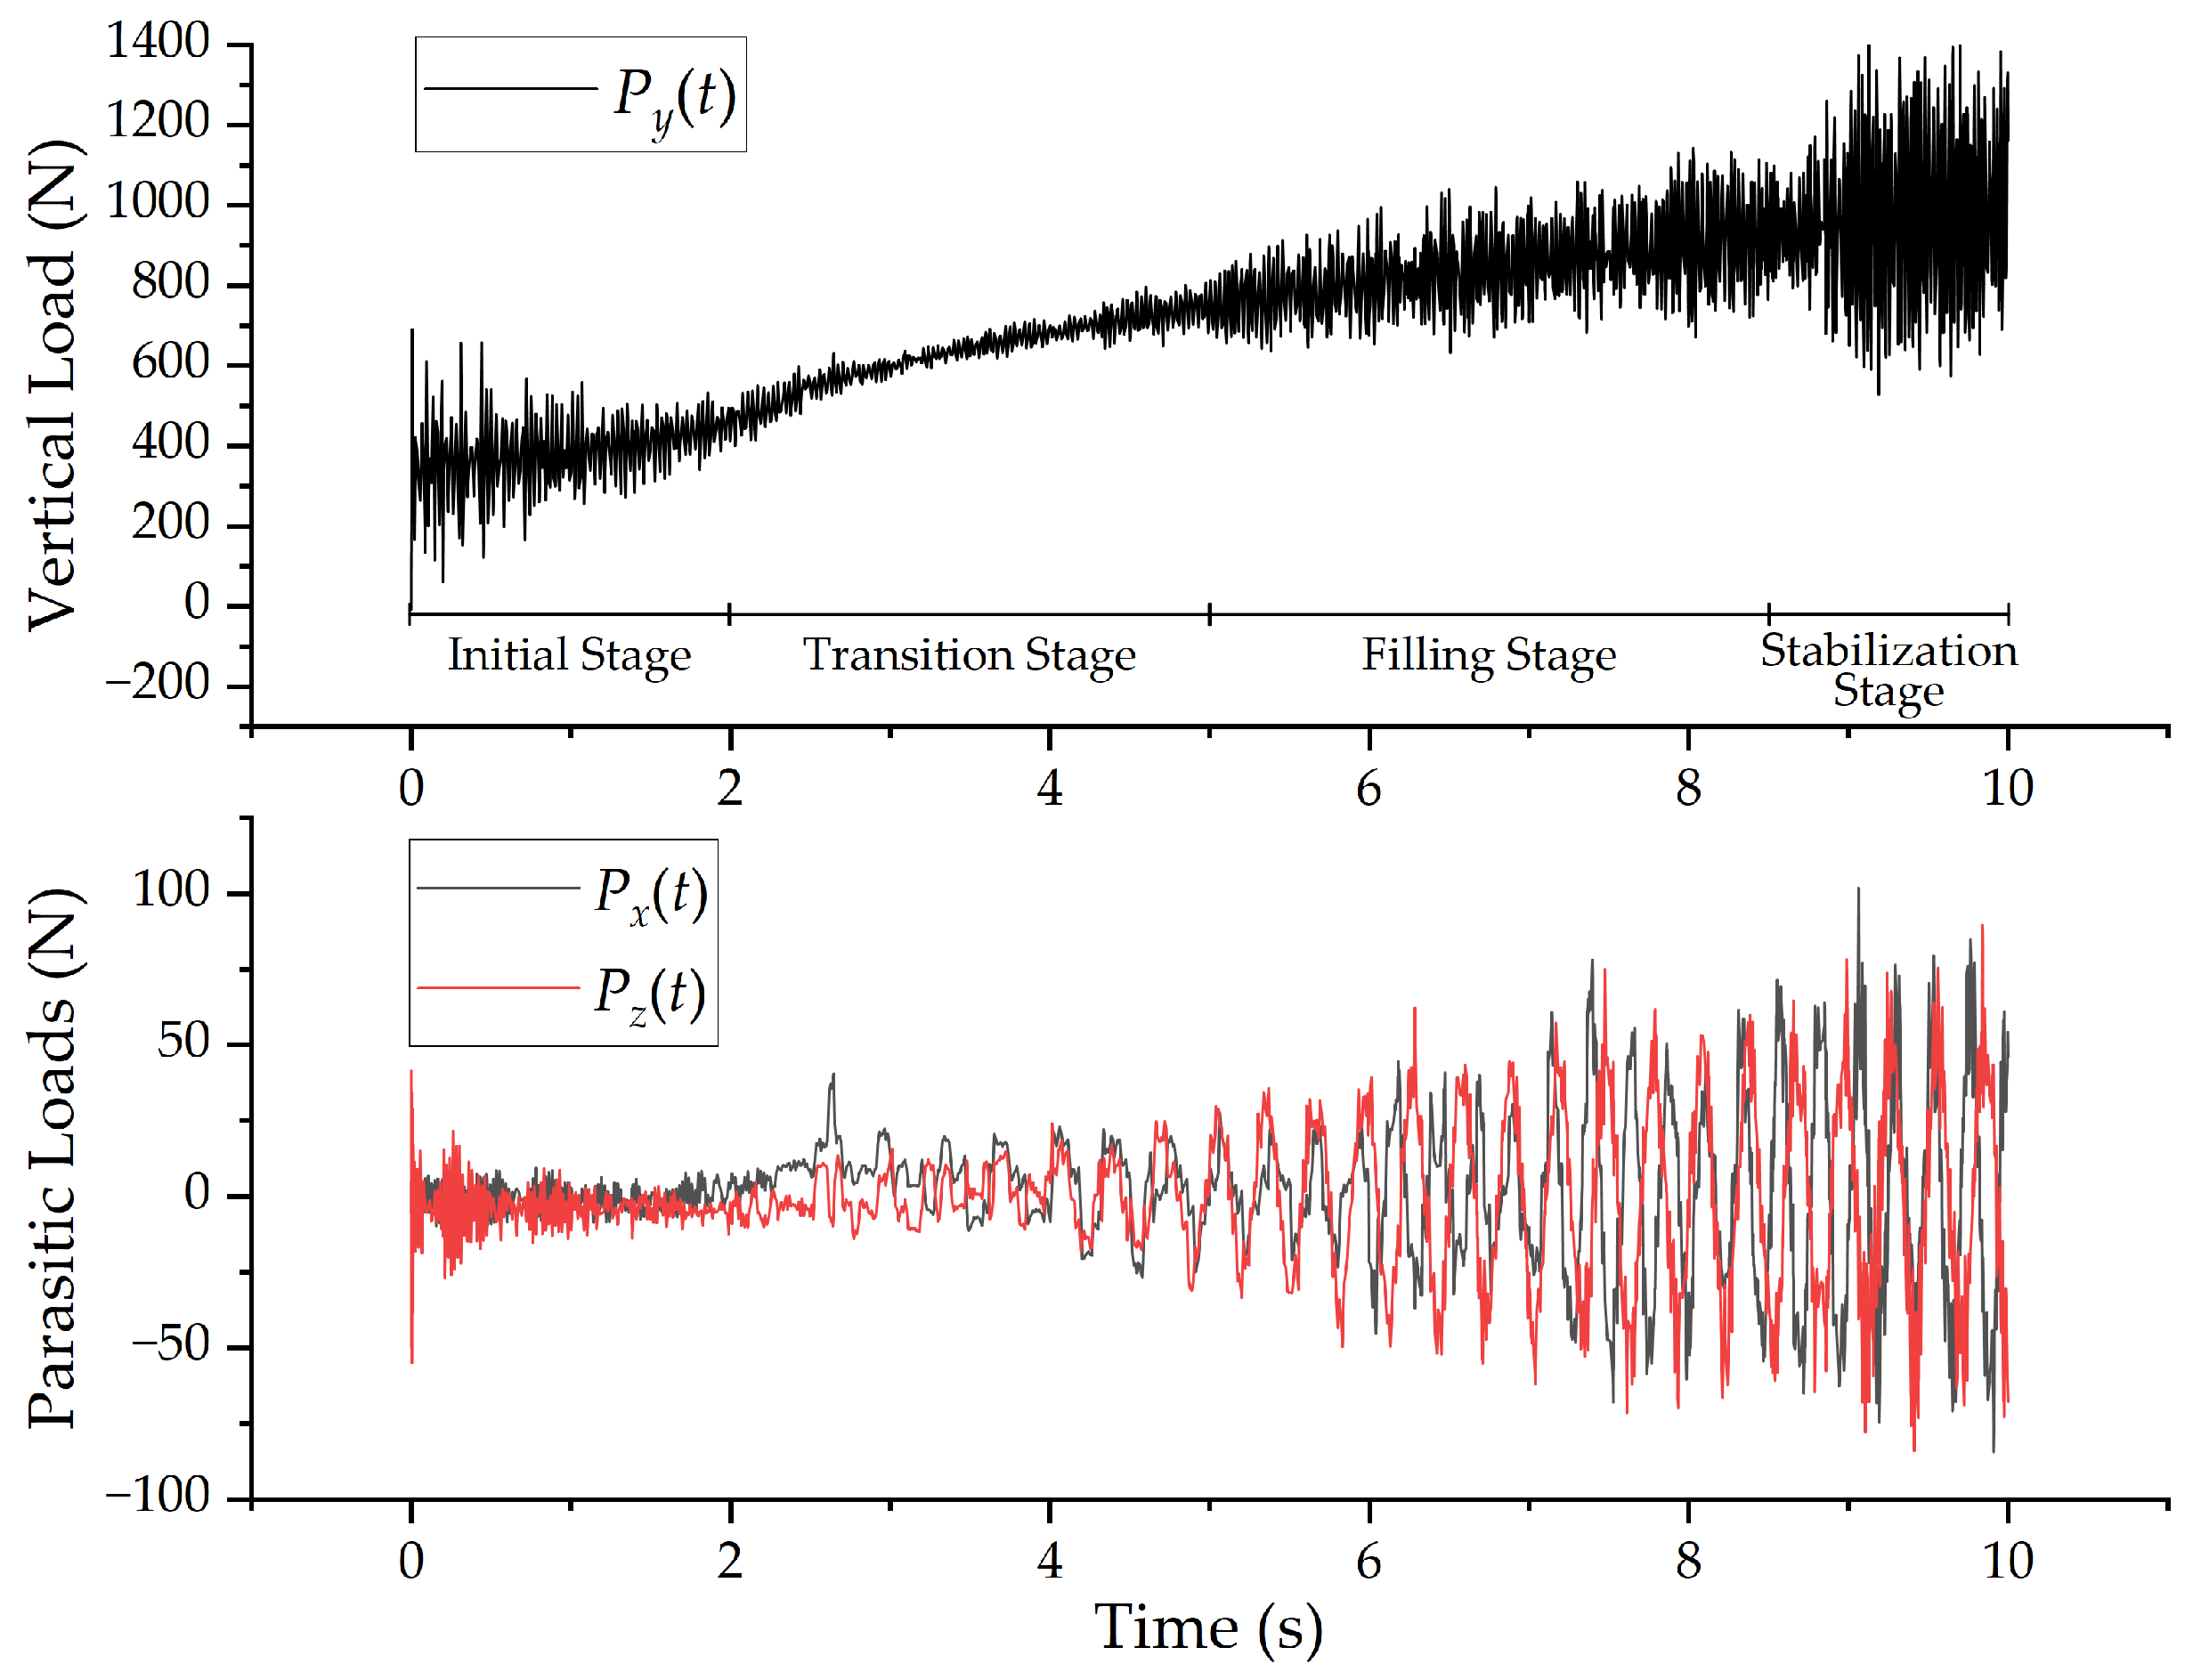
The simulated dynamic load spectrum was analyzed to interpret the physical process of material filling (
Figure 4). As the silo gate opens, the vertical load
dominates, rising from approximately 330 N (hopper dead weight) to 1000 N. The lateral loads
and
oscillate around zero with increasing amplitude. The process exhibits four distinct stages:
- 1.
Initial Stage: Particles impact the hopper surface directly, causing dense high-frequency peaks and momentary negative rebounds in .
- 2.
Transition Stage: As particles accumulate, they buffer the impact on the metal wall. The shocks attenuate rapidly, and the mean value of rises smoothly.
- 3.
Filling Stage: The mean increases slowly with moderate fluctuations. and show quasi-periodic oscillations superimposed with high-frequency jitter, reflecting the coupling of random impacts with structural vibration.
- 4.
Stabilization Stage: With increased mass, perturbations intensify. exhibits significant amplitude fluctuations, and lateral loads show denser high-amplitude peaks.
This dynamic load spectrum was then applied as the boundary condition for the transient dynamic analysis of the local weighing unit model.
3.2. Local Fretting Finite Element Model
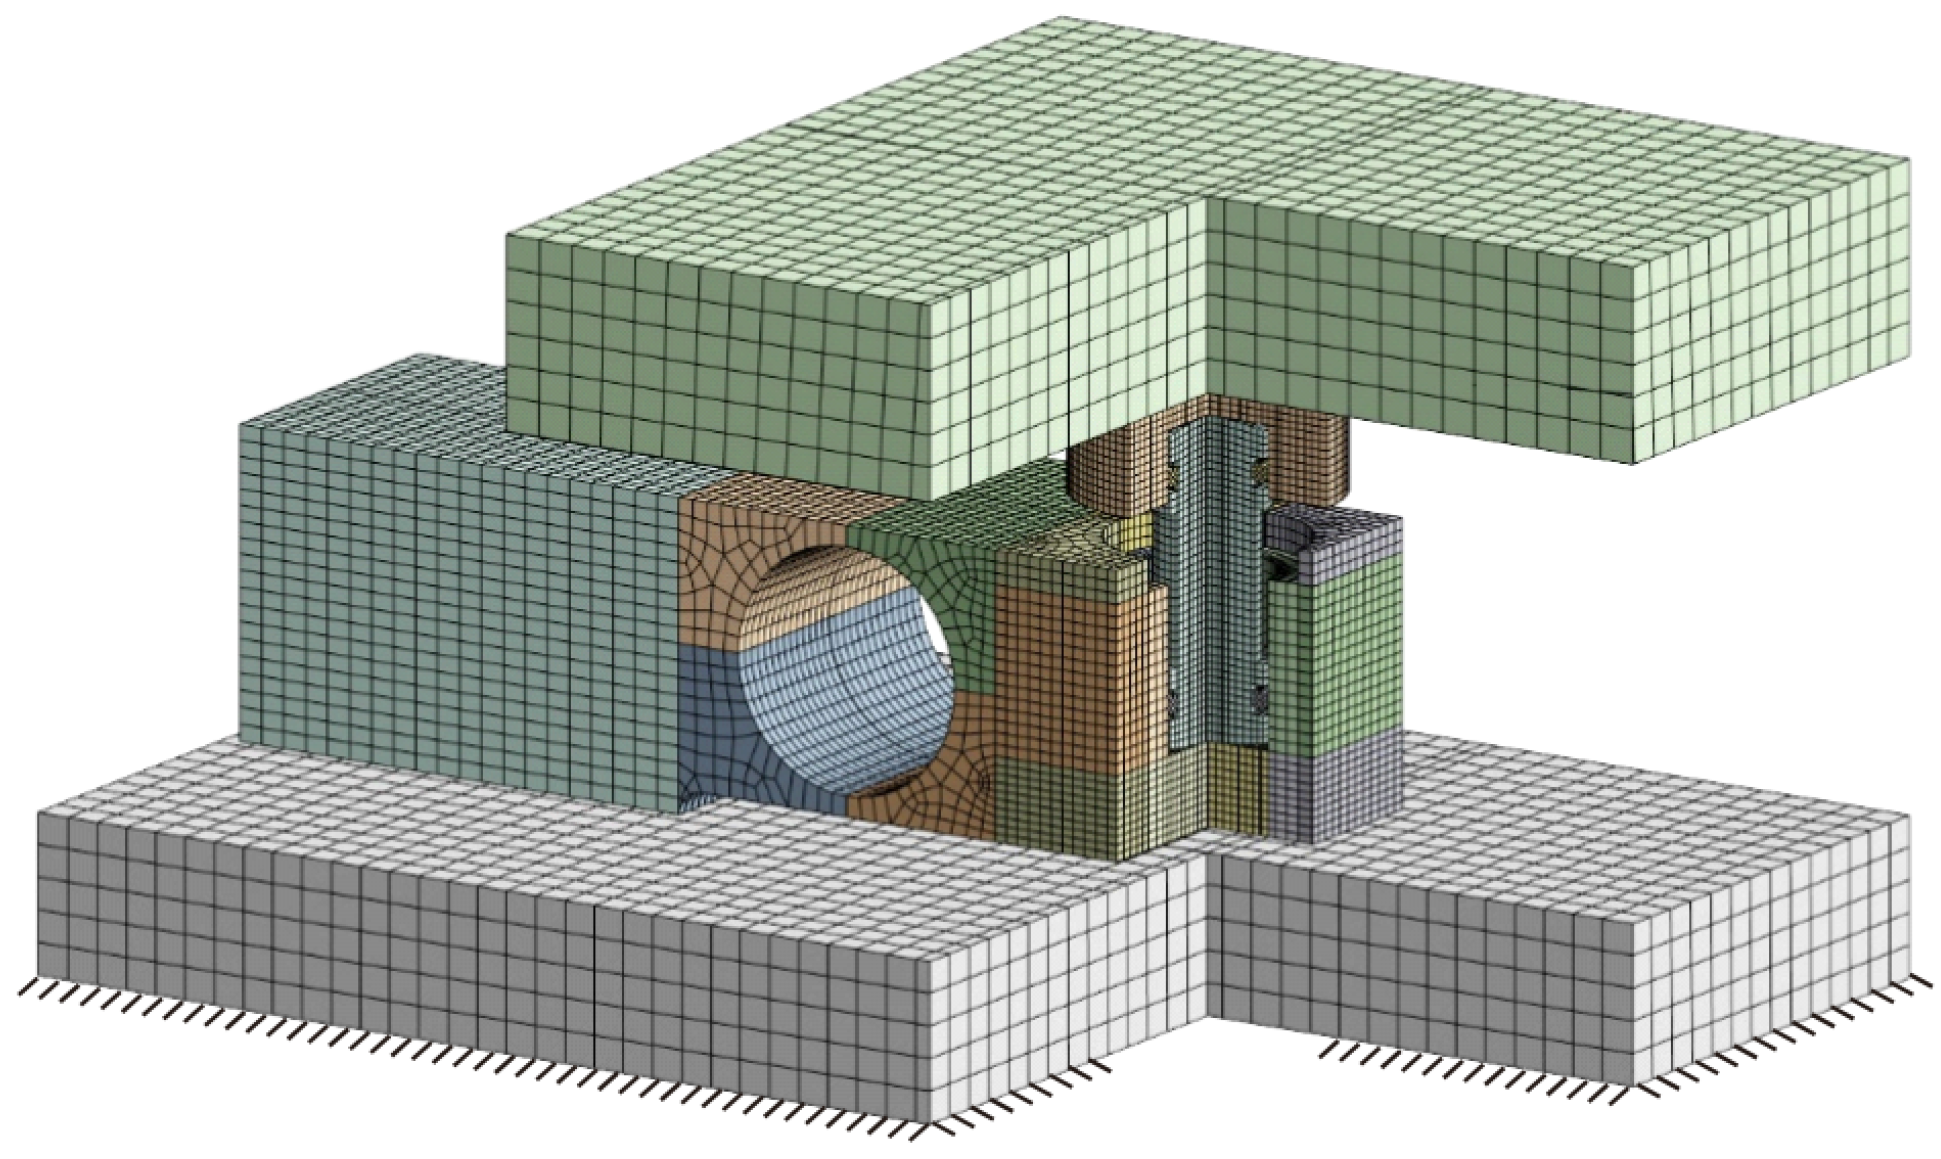
To balance computational efficiency with solution accuracy, a refined local fretting FE model of the weighing unit was established (
Figure 5). The geometric dimensions were consistent with the actual hardware, with the initial spherical height
H of the unworn indenter set to 0.8 mm.
All metal components were assigned the material properties of AISI 304 stainless steel, with a Young’s modulus of 193 GPa and a Poisson’s ratio of 0.31 [
27]. The mesh was meticulously designed with hexahedron-dominated elements, comprising 171,528 nodes and 64,325 elements. Crucially, the contact regions at both ends of the indenter were locally refined with a mesh size of 1 mm to accurately capture the contact stress distribution and geometric changes. A surface-to-surface contact algorithm with the Augmented Lagrange method was applied to simulate the contact interface.
The load spectra obtained from the global model were applied to the bearing plate, while the bottom surface of the base was fixed. This setup allows for precise transient dynamic analysis under realistic loading conditions.
4. Experimental Setup and Model Validation
4.1. Experimental Platform Design
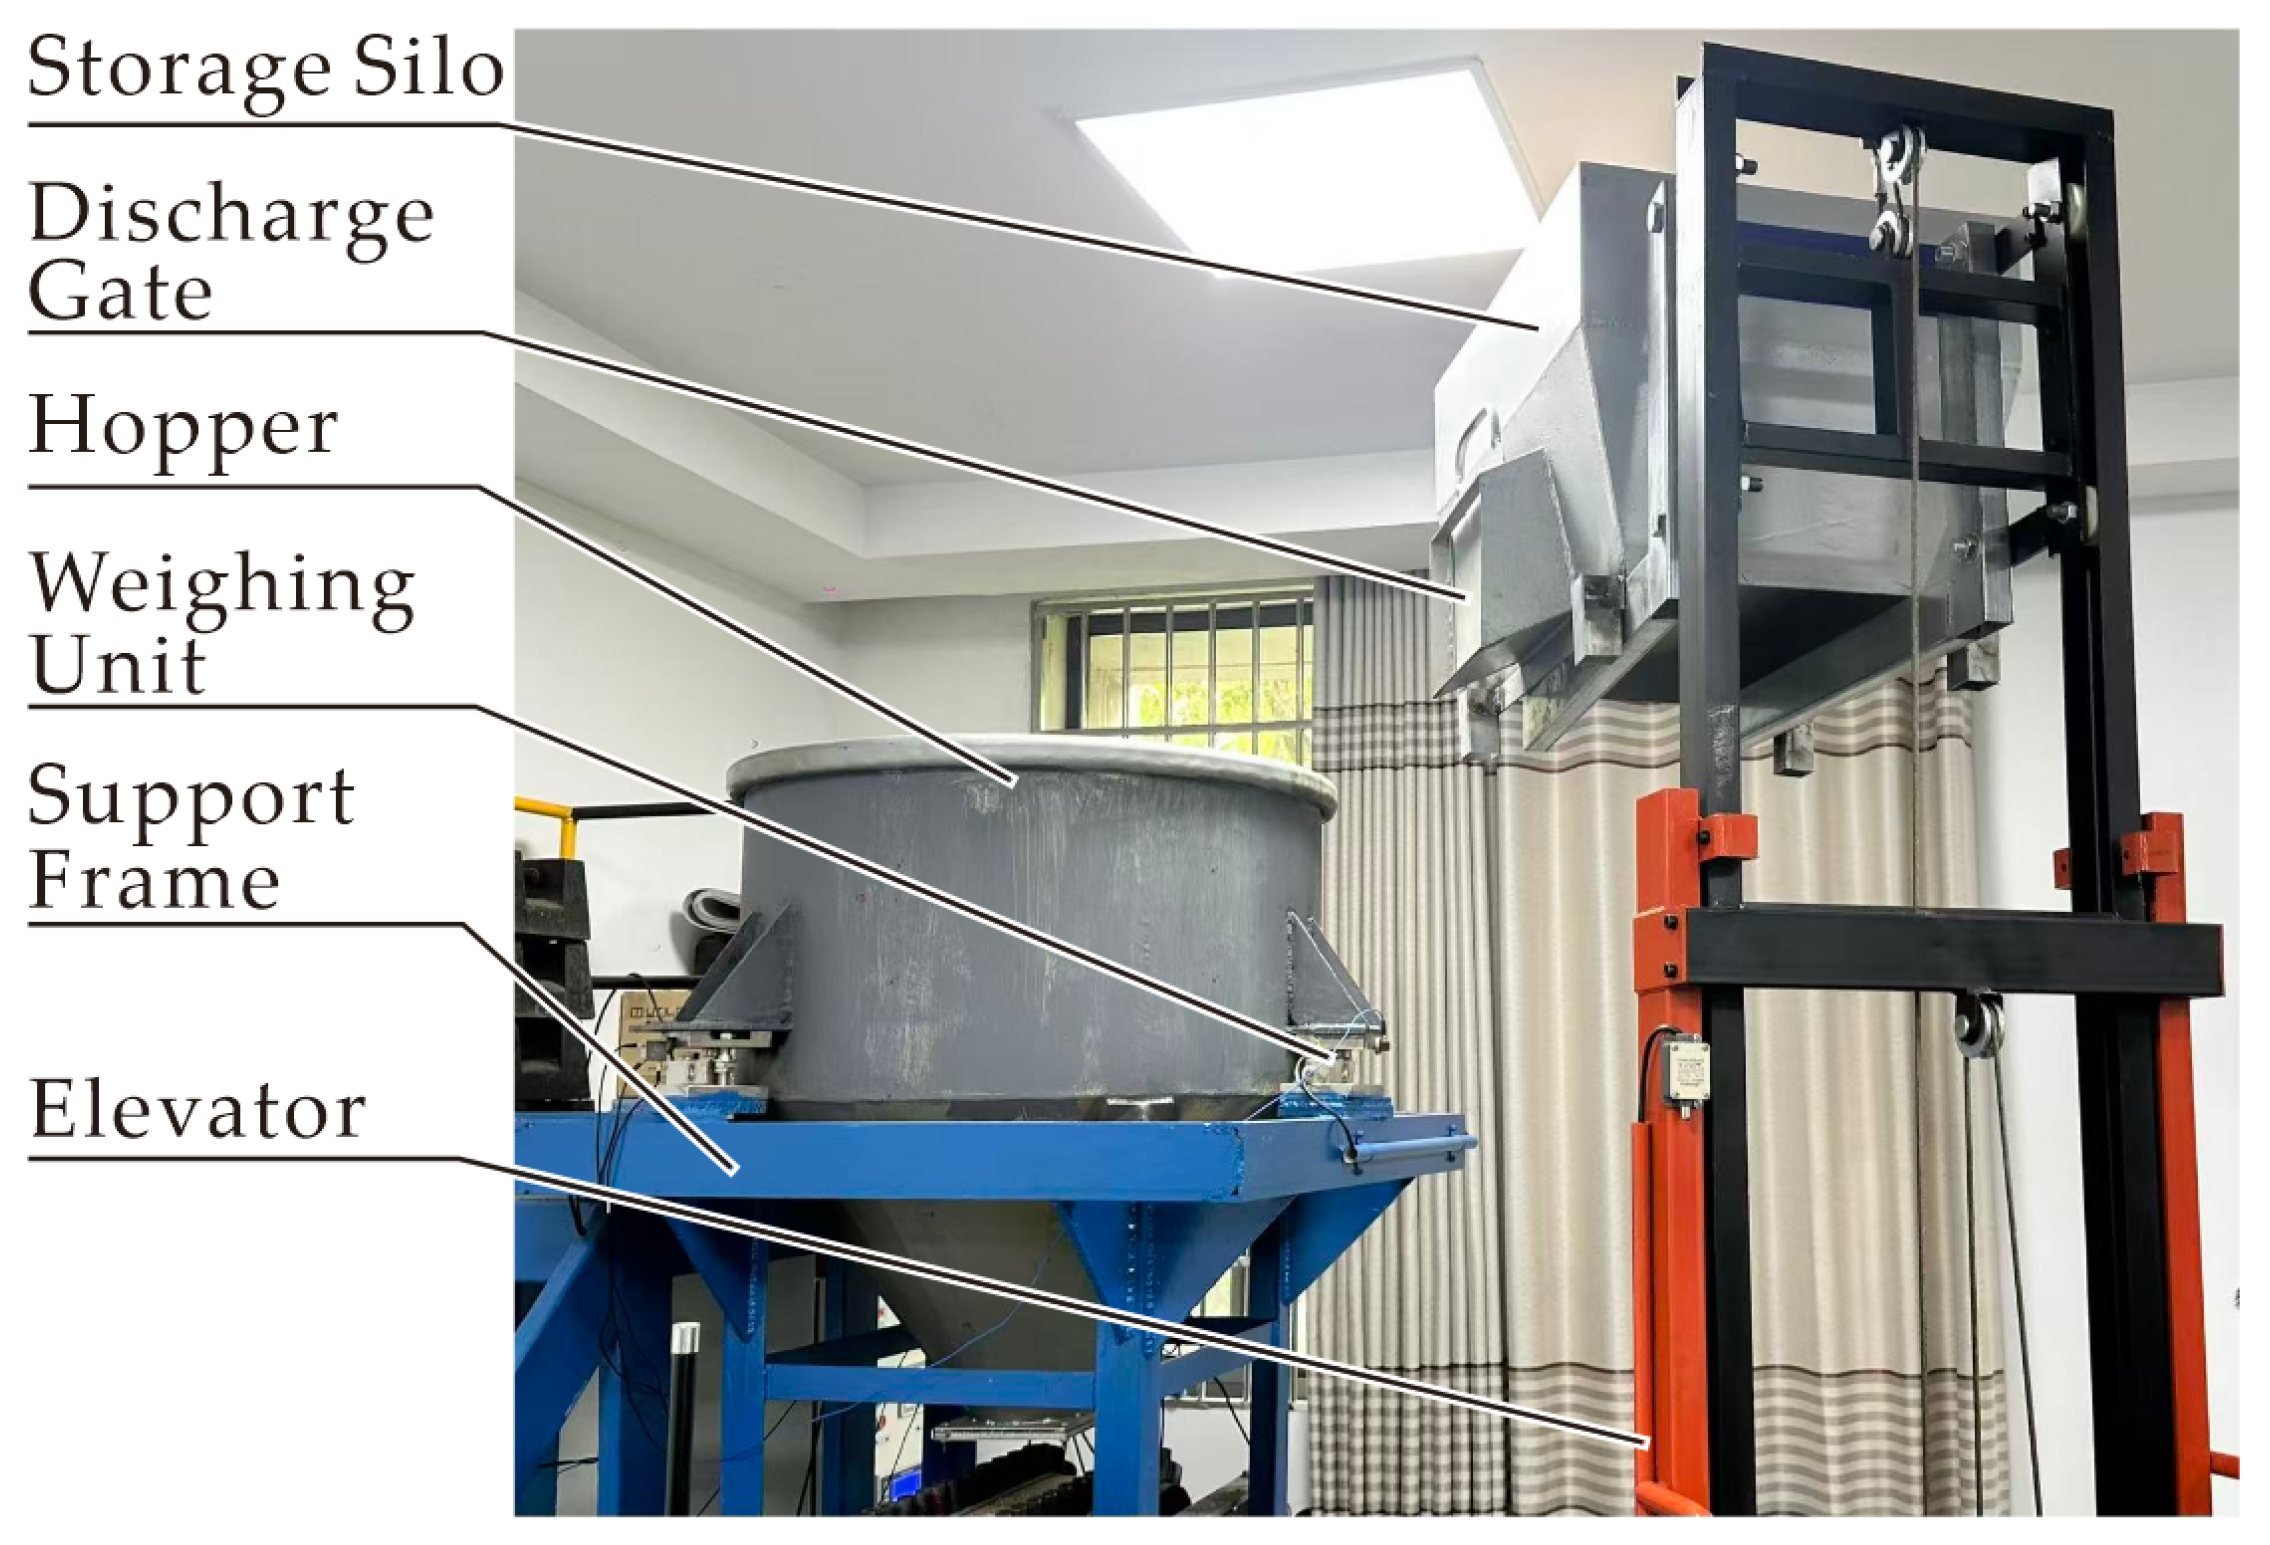
To evaluate the dynamic response under realistic material impact, a dedicated experimental platform was fabricated (
Figure 6). The system comprises a storage silo, a discharge gate, an elevator, a receiving hopper, three rocker-column weighing units, and a support frame.
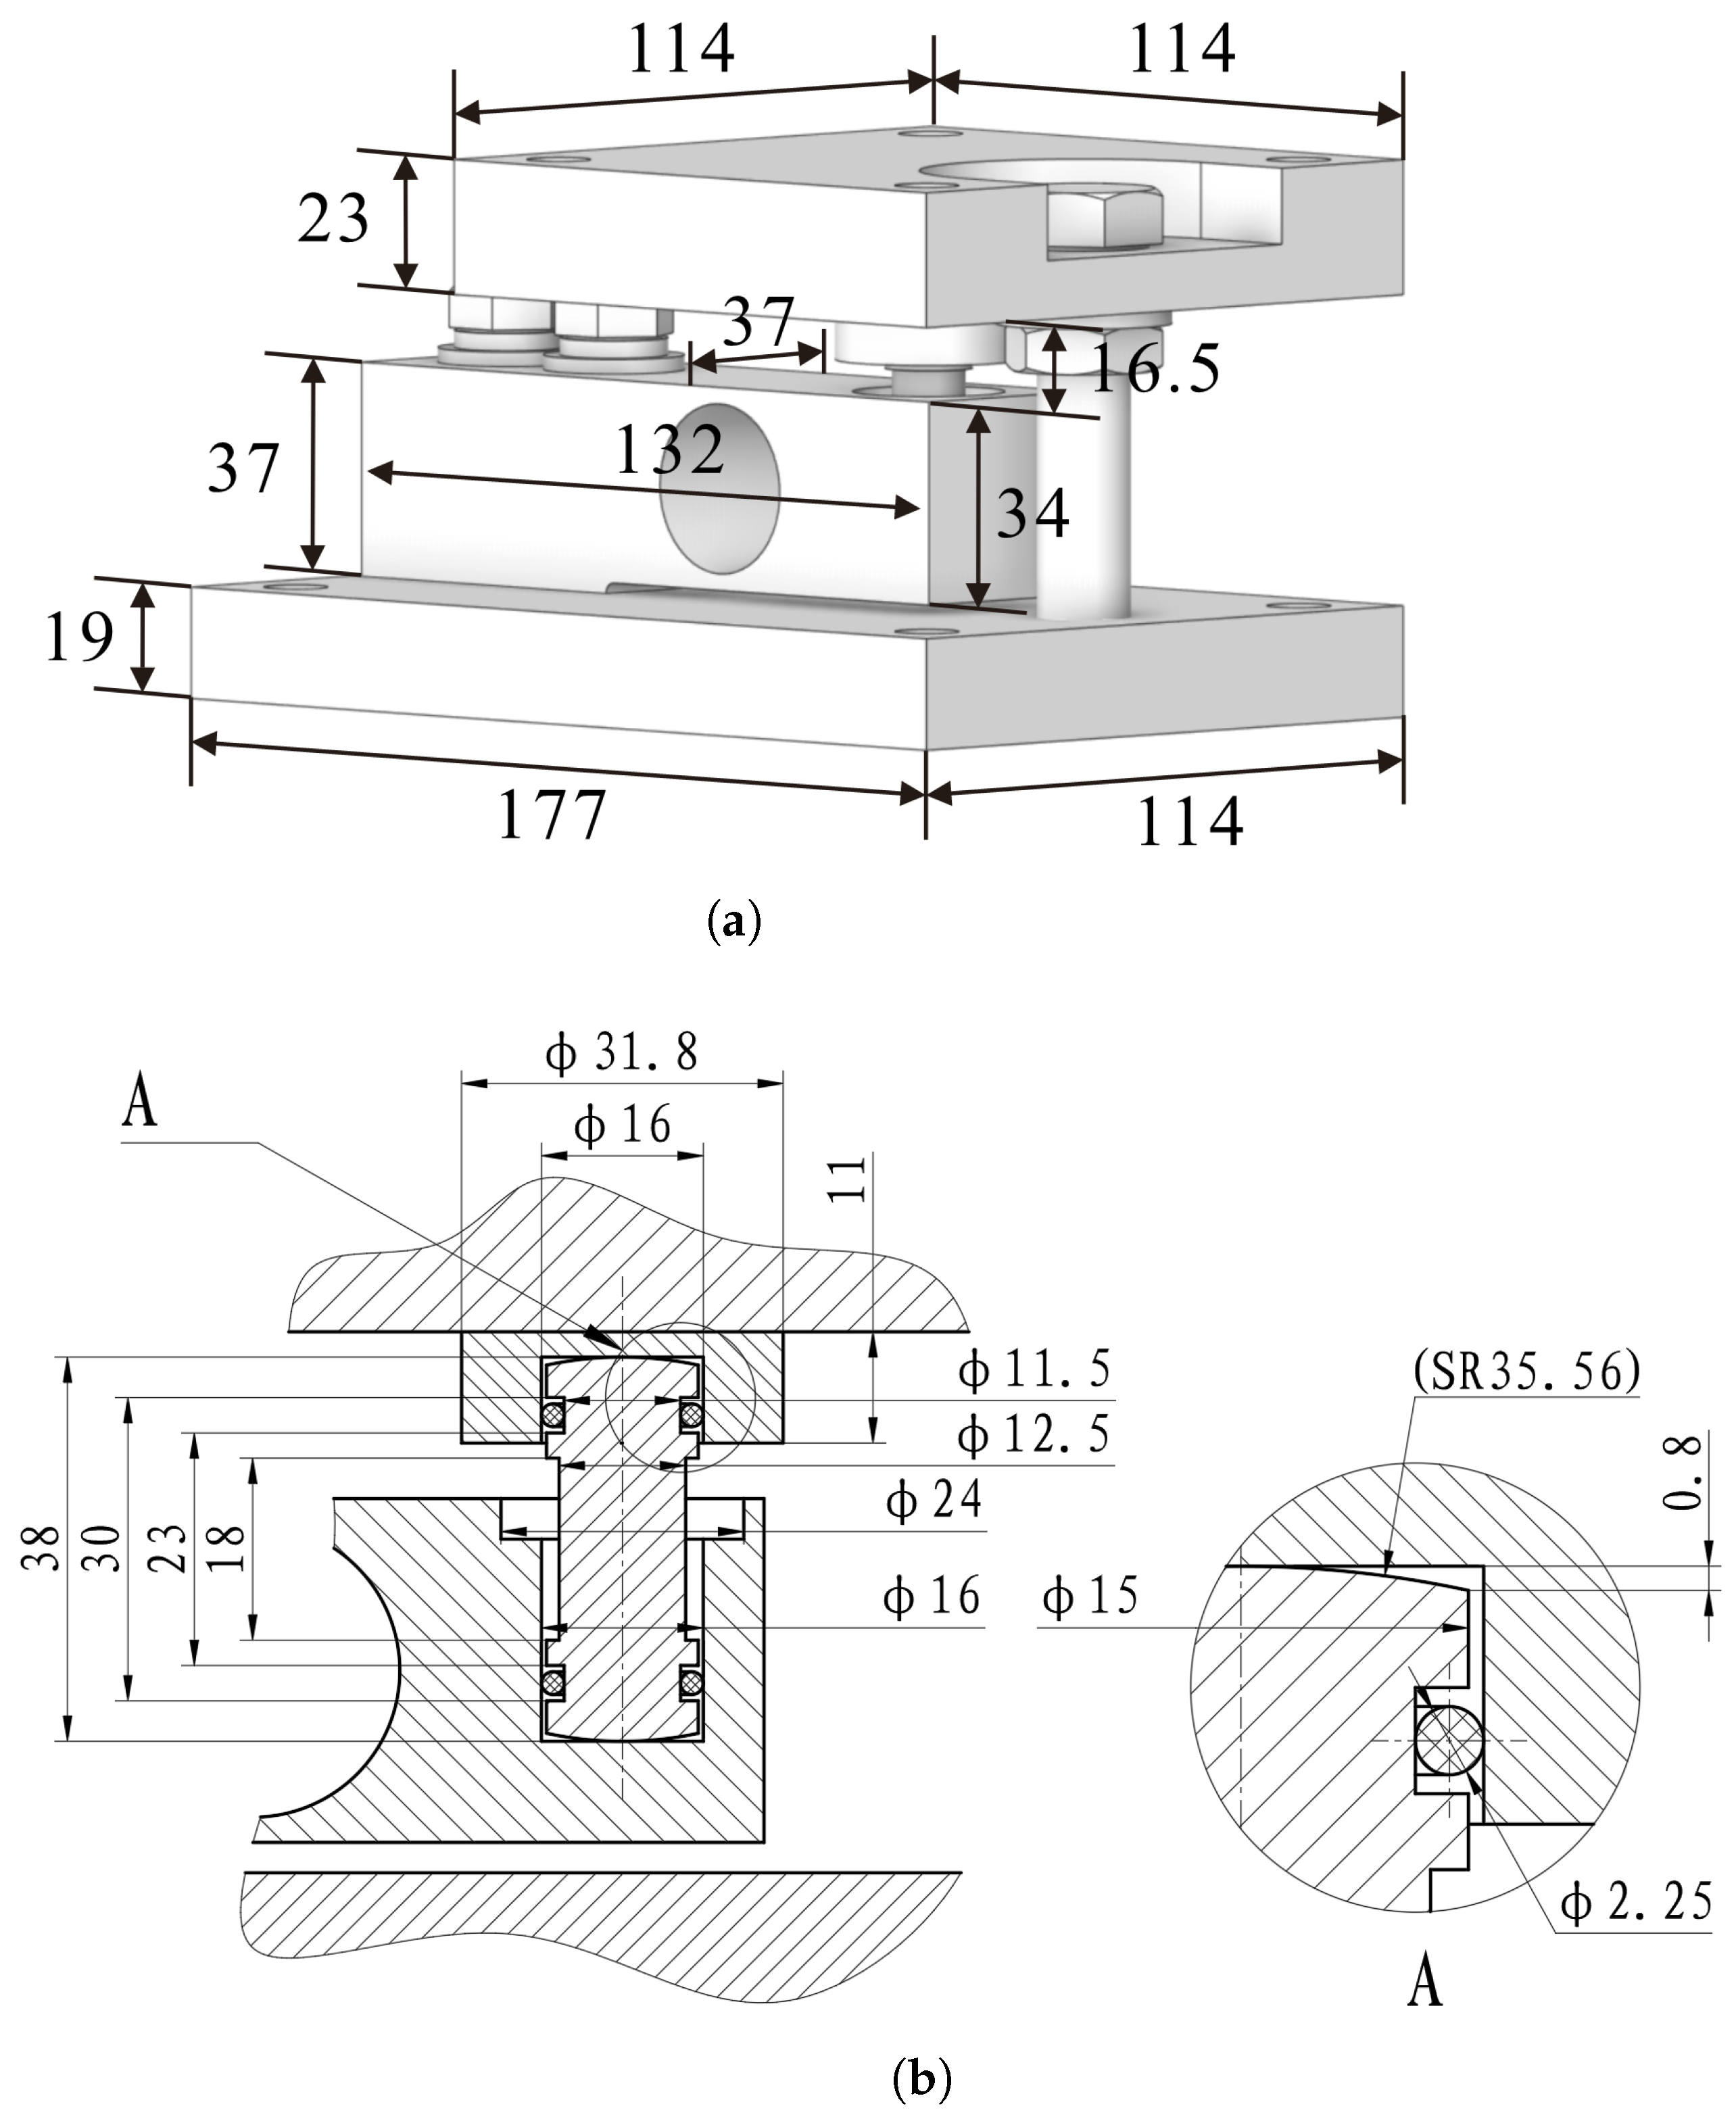
The weighing units employed are of the rocker-column type (Sensor Model: CZL-YB-4D), with dimensions detailed in
Figure 7. The hopper is supported by three such units distributed at
intervals. To protect the contact spherical surfaces from dust, Nitrile Butadiene Rubber (NBR) O-rings were embedded at both ends of the indenter. Given the low hardness of NBR, its constraint effect on the micro-amplitude swaying is negligible.
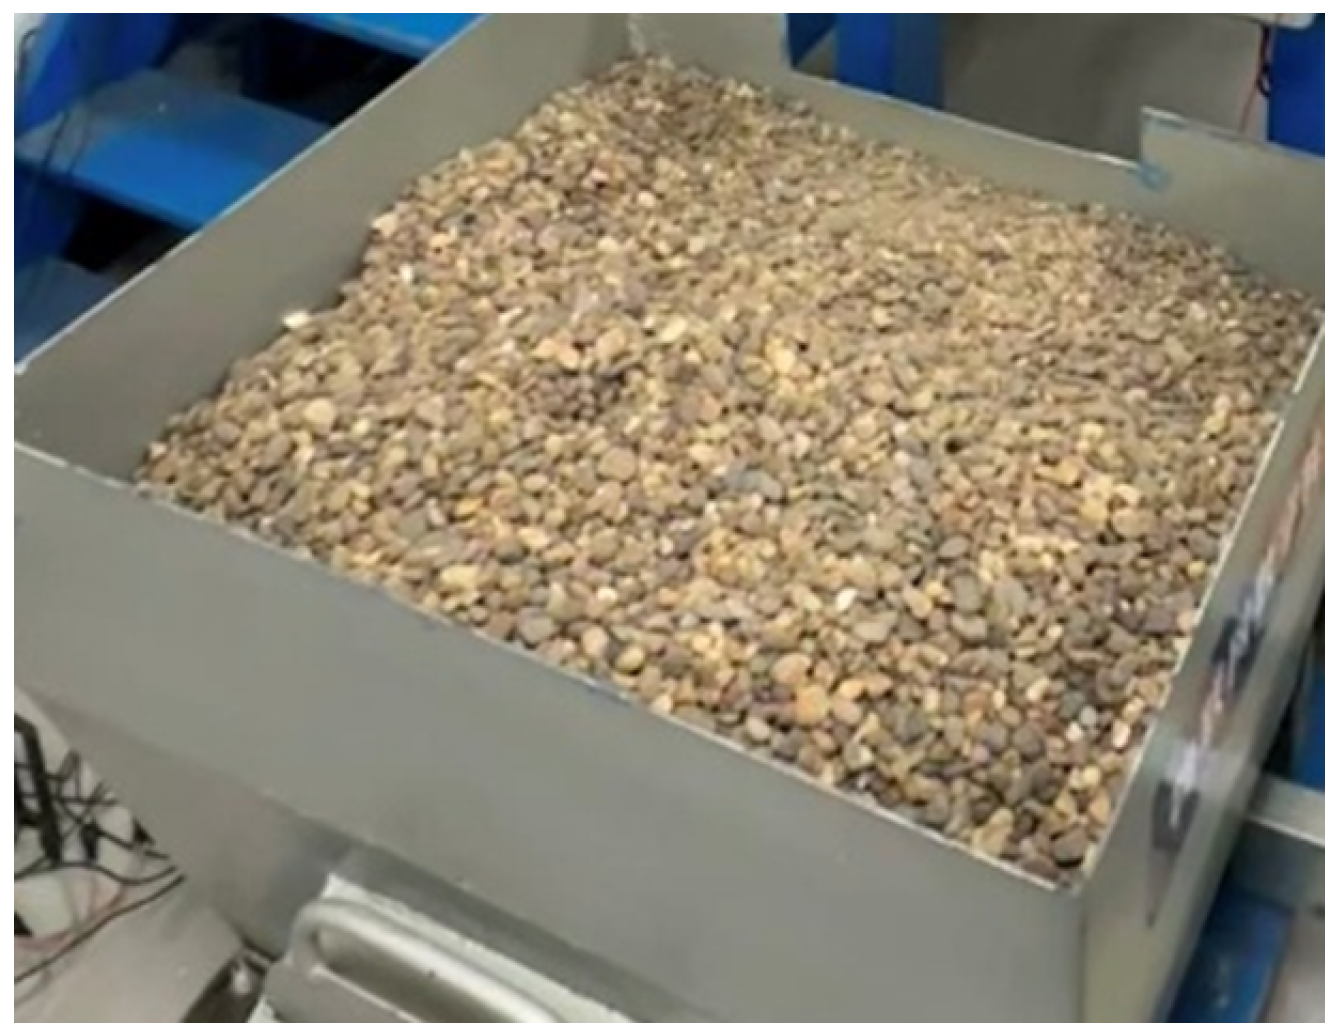
The test material consisted of pebbles with stable physical properties and uniform characteristics. The total mass was 200 kg, with particle sizes ranging from 9 mm to
mm (
Figure 8).
4.2. Data Acquisition and Signal Processing
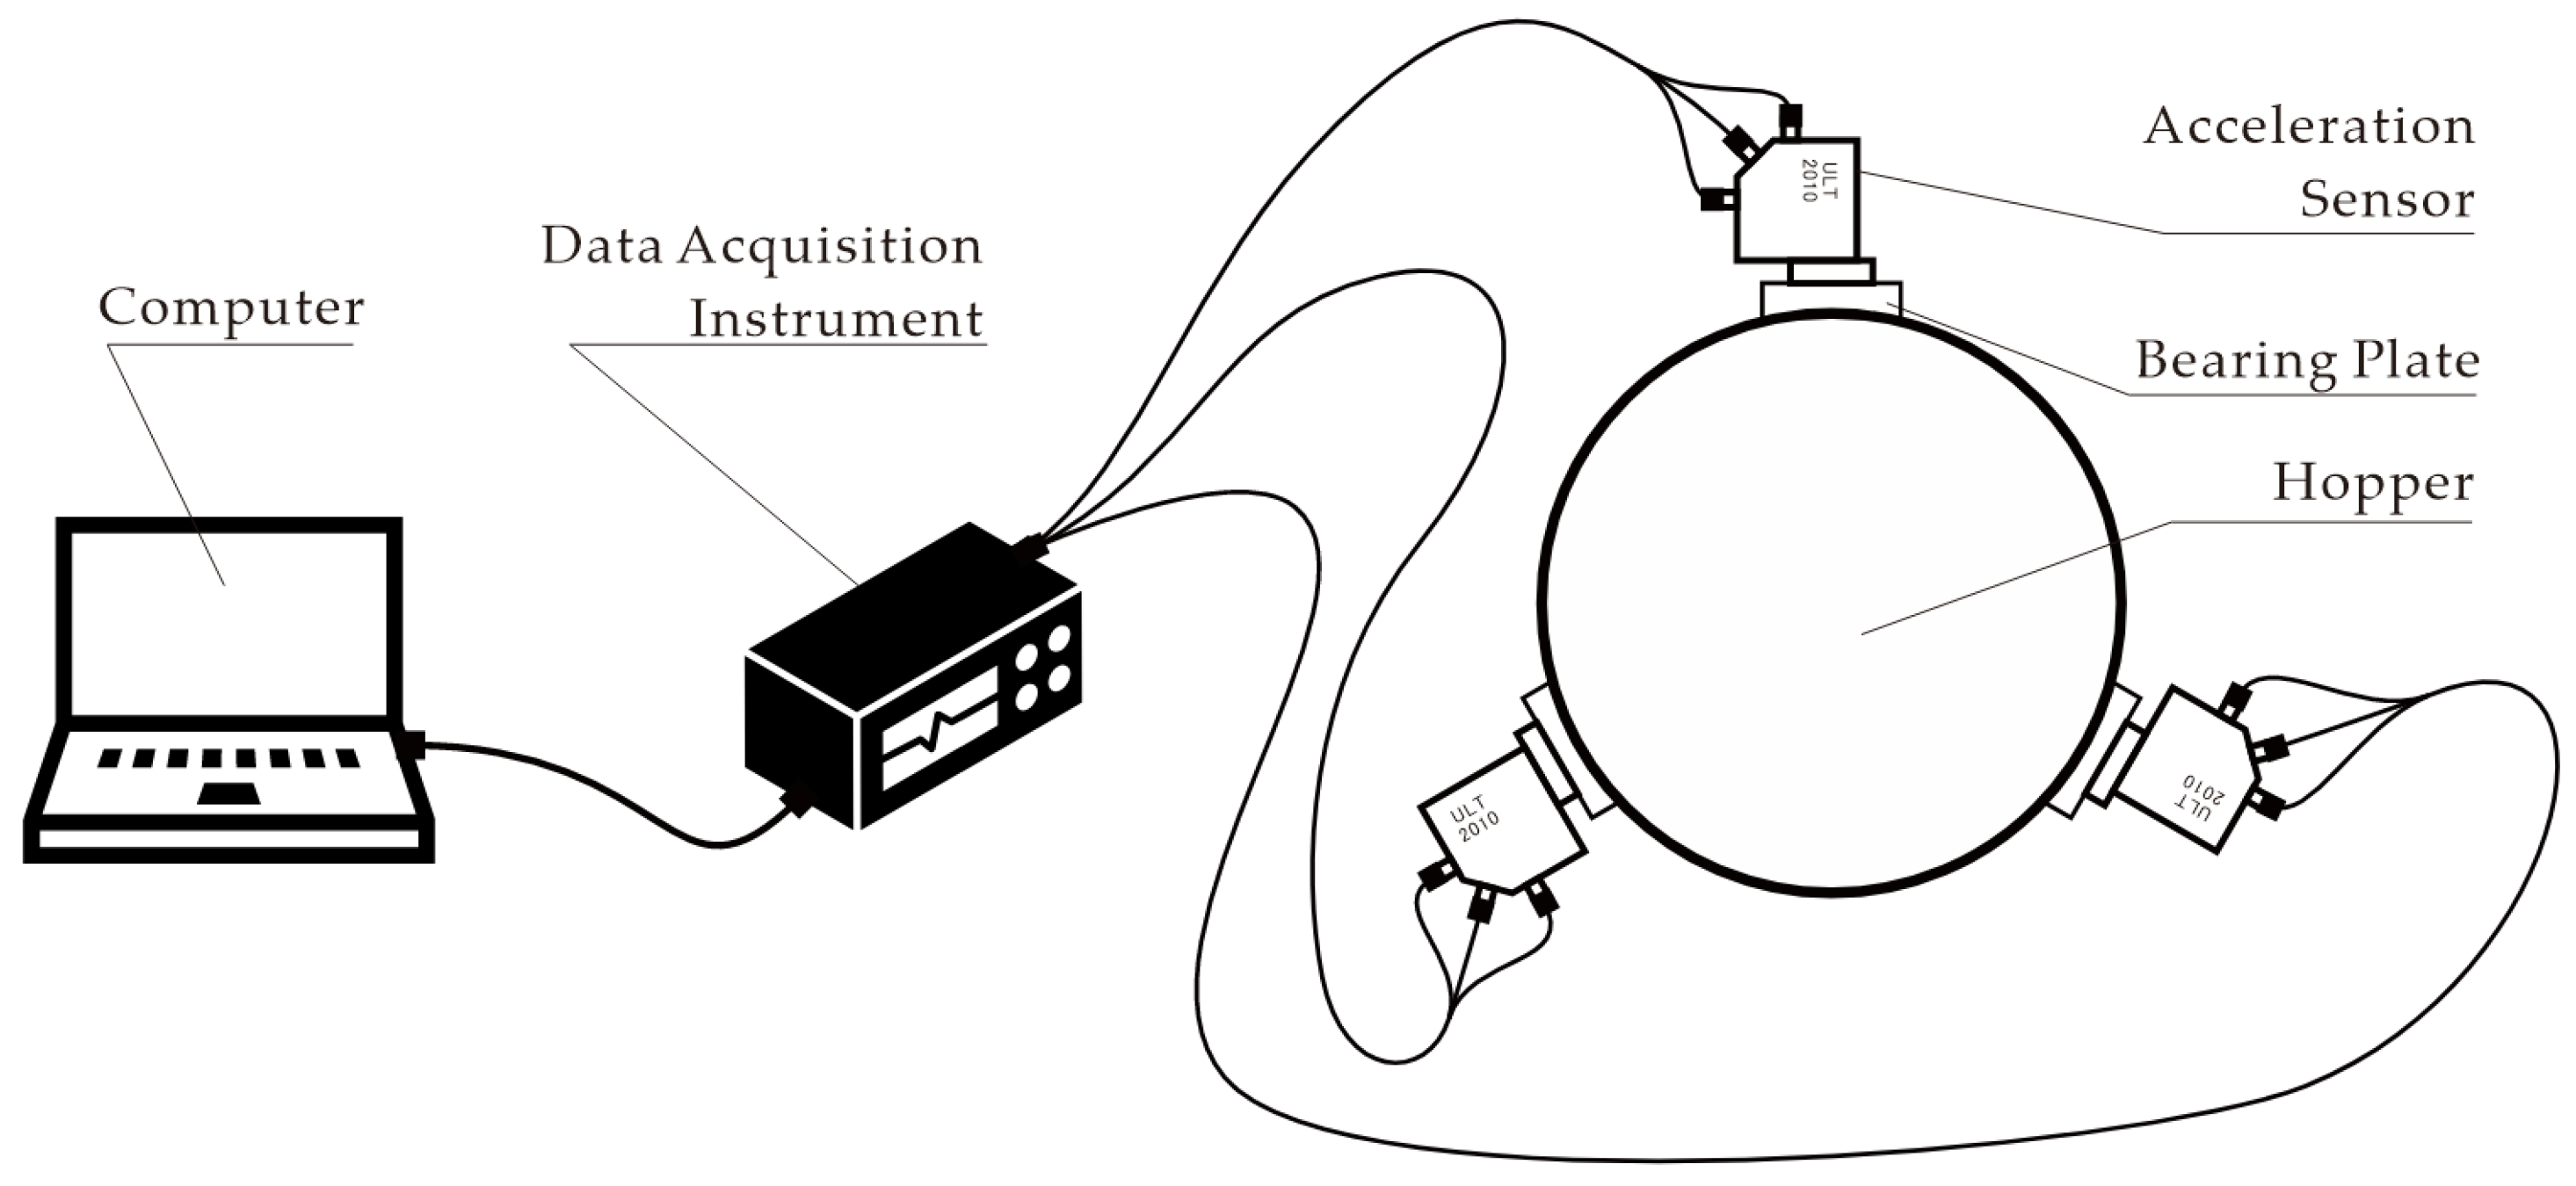
The vibration measurement system was configured to capture high-fidelity acceleration data. The spatial arrangement and signal flow of the measurement equipment are schematically illustrated in
Figure 9.
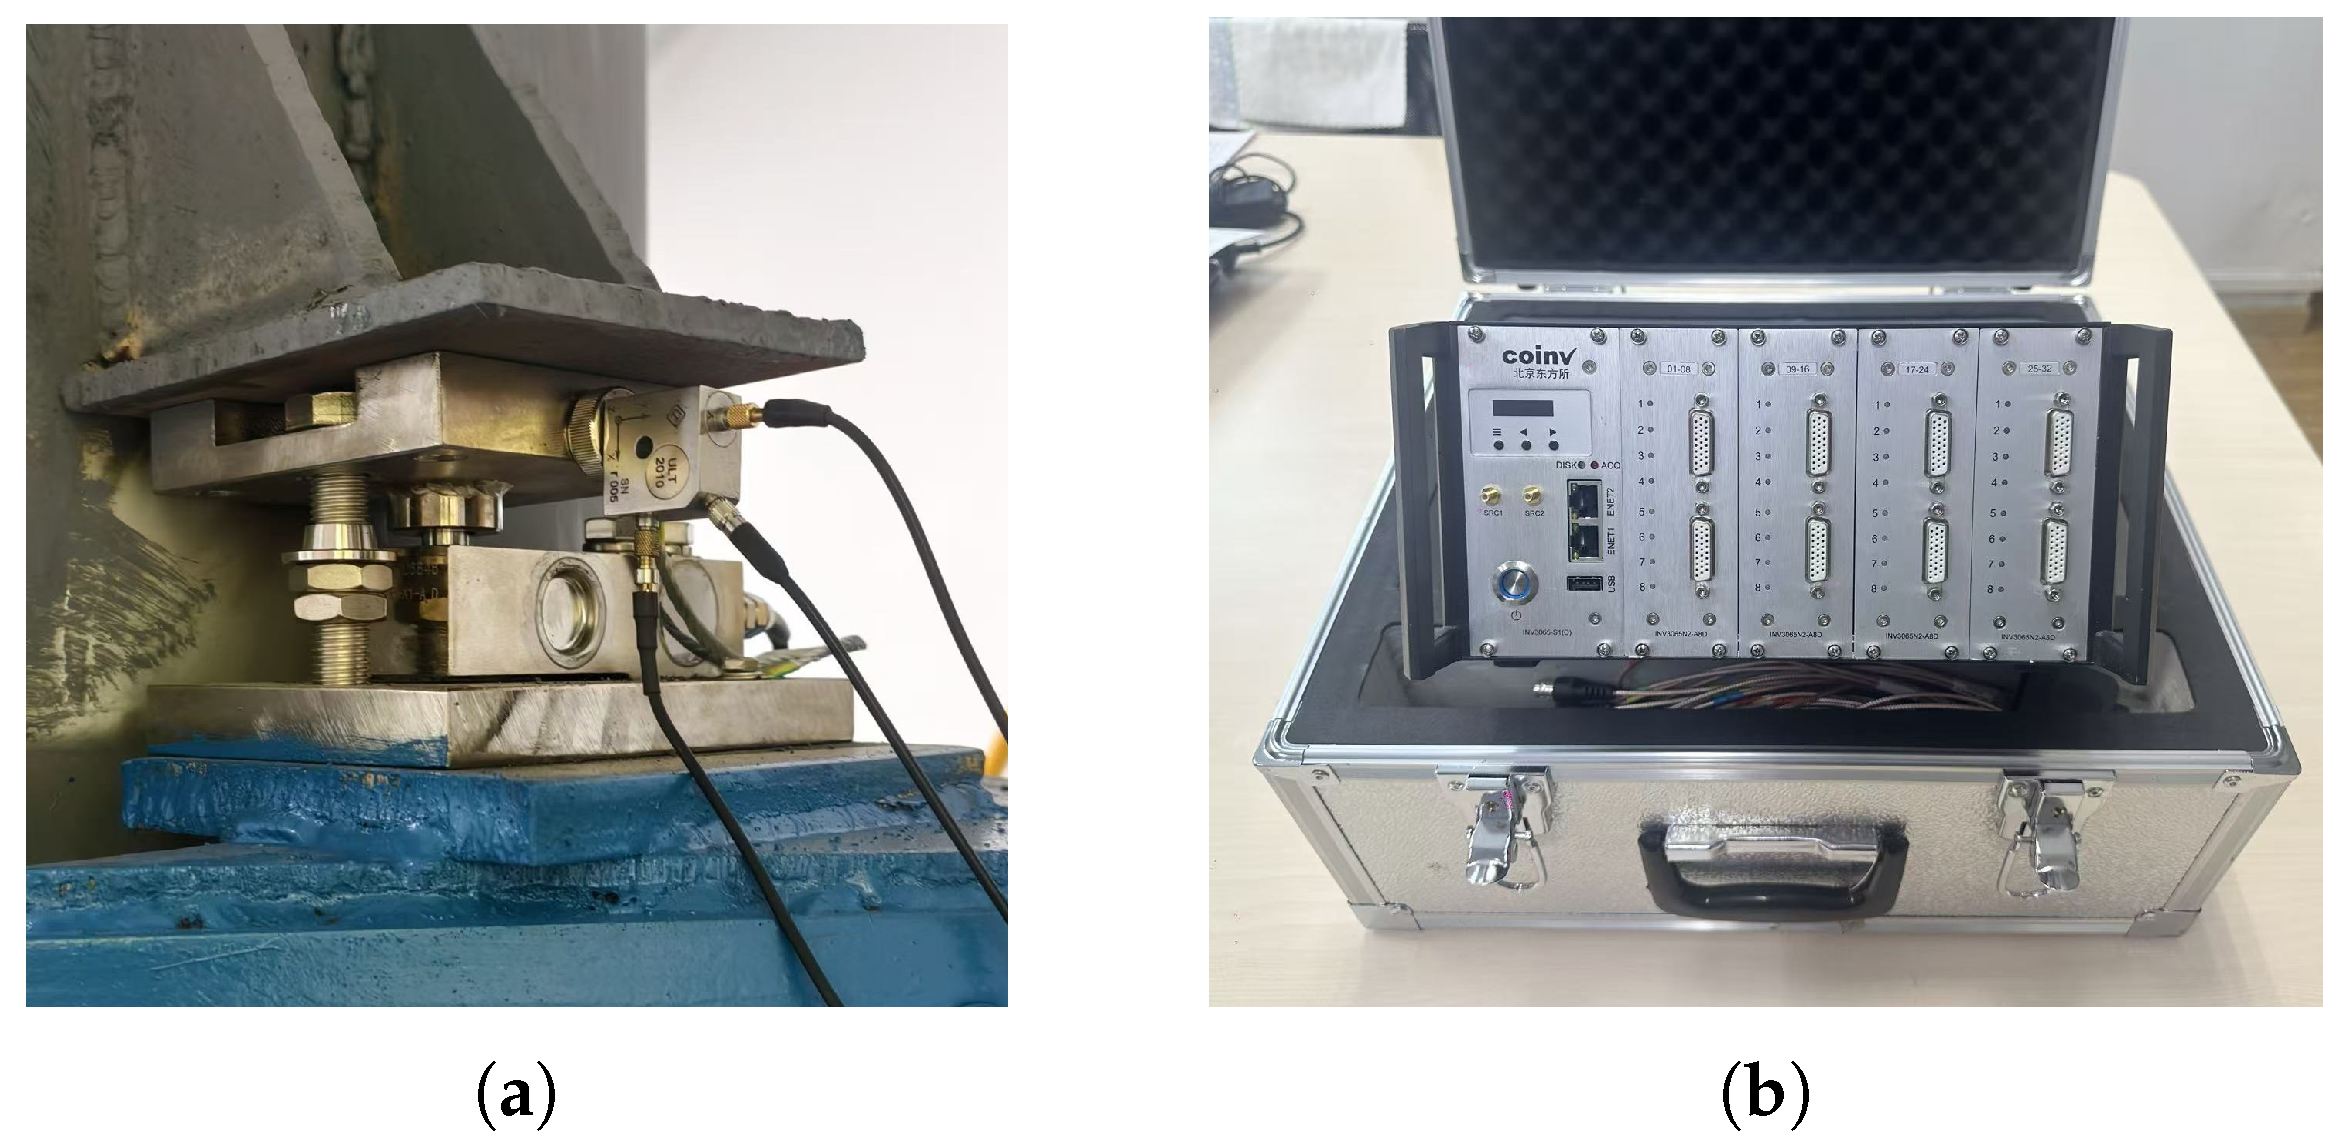
Three triaxial piezoelectric acceleration sensors (Model: ULT2010) were magnetically mounted on the bearing plates of the weighing units (
Figure 10a). The detailed performance specifications of these sensors are summarized in
Table 1. The analog signals were transmitted via low-noise shielded cables to a multi-function data acquisition (DAQ) instrument (Model: INV3065N2,
Figure 10b), which interfaced with a computer via the TCP/IP protocol for real-time recording.
To bridge the gap between high-frequency experimental noise and the specific frequency bandwidth of the numerical simulation, a signal preprocessing pipeline was implemented:
- 1.
High-Rate Sampling: The raw signals were sampled at kHz. This oversampling strategy was employed to prevent aliasing and preserve sufficient transient information for subsequent digital filtering.
- 2.
Data Cleaning: Linear trends and DC offsets were removed via detrending. A low-pass Butterworth filter was then applied to eliminate high-frequency environmental interference unrelated to the structural dynamics.
- 3.
Resampling and Alignment: The processed data were decimated to 100 Hz to match the simulation’s time step, ensuring a consistent frequency bandwidth for quantitative comparison. Temporal synchronization was achieved by anchoring the first prominent acceleration spike generated during the initial material-hopper contact.
4.3. Model Validation and Quantitative Comparison
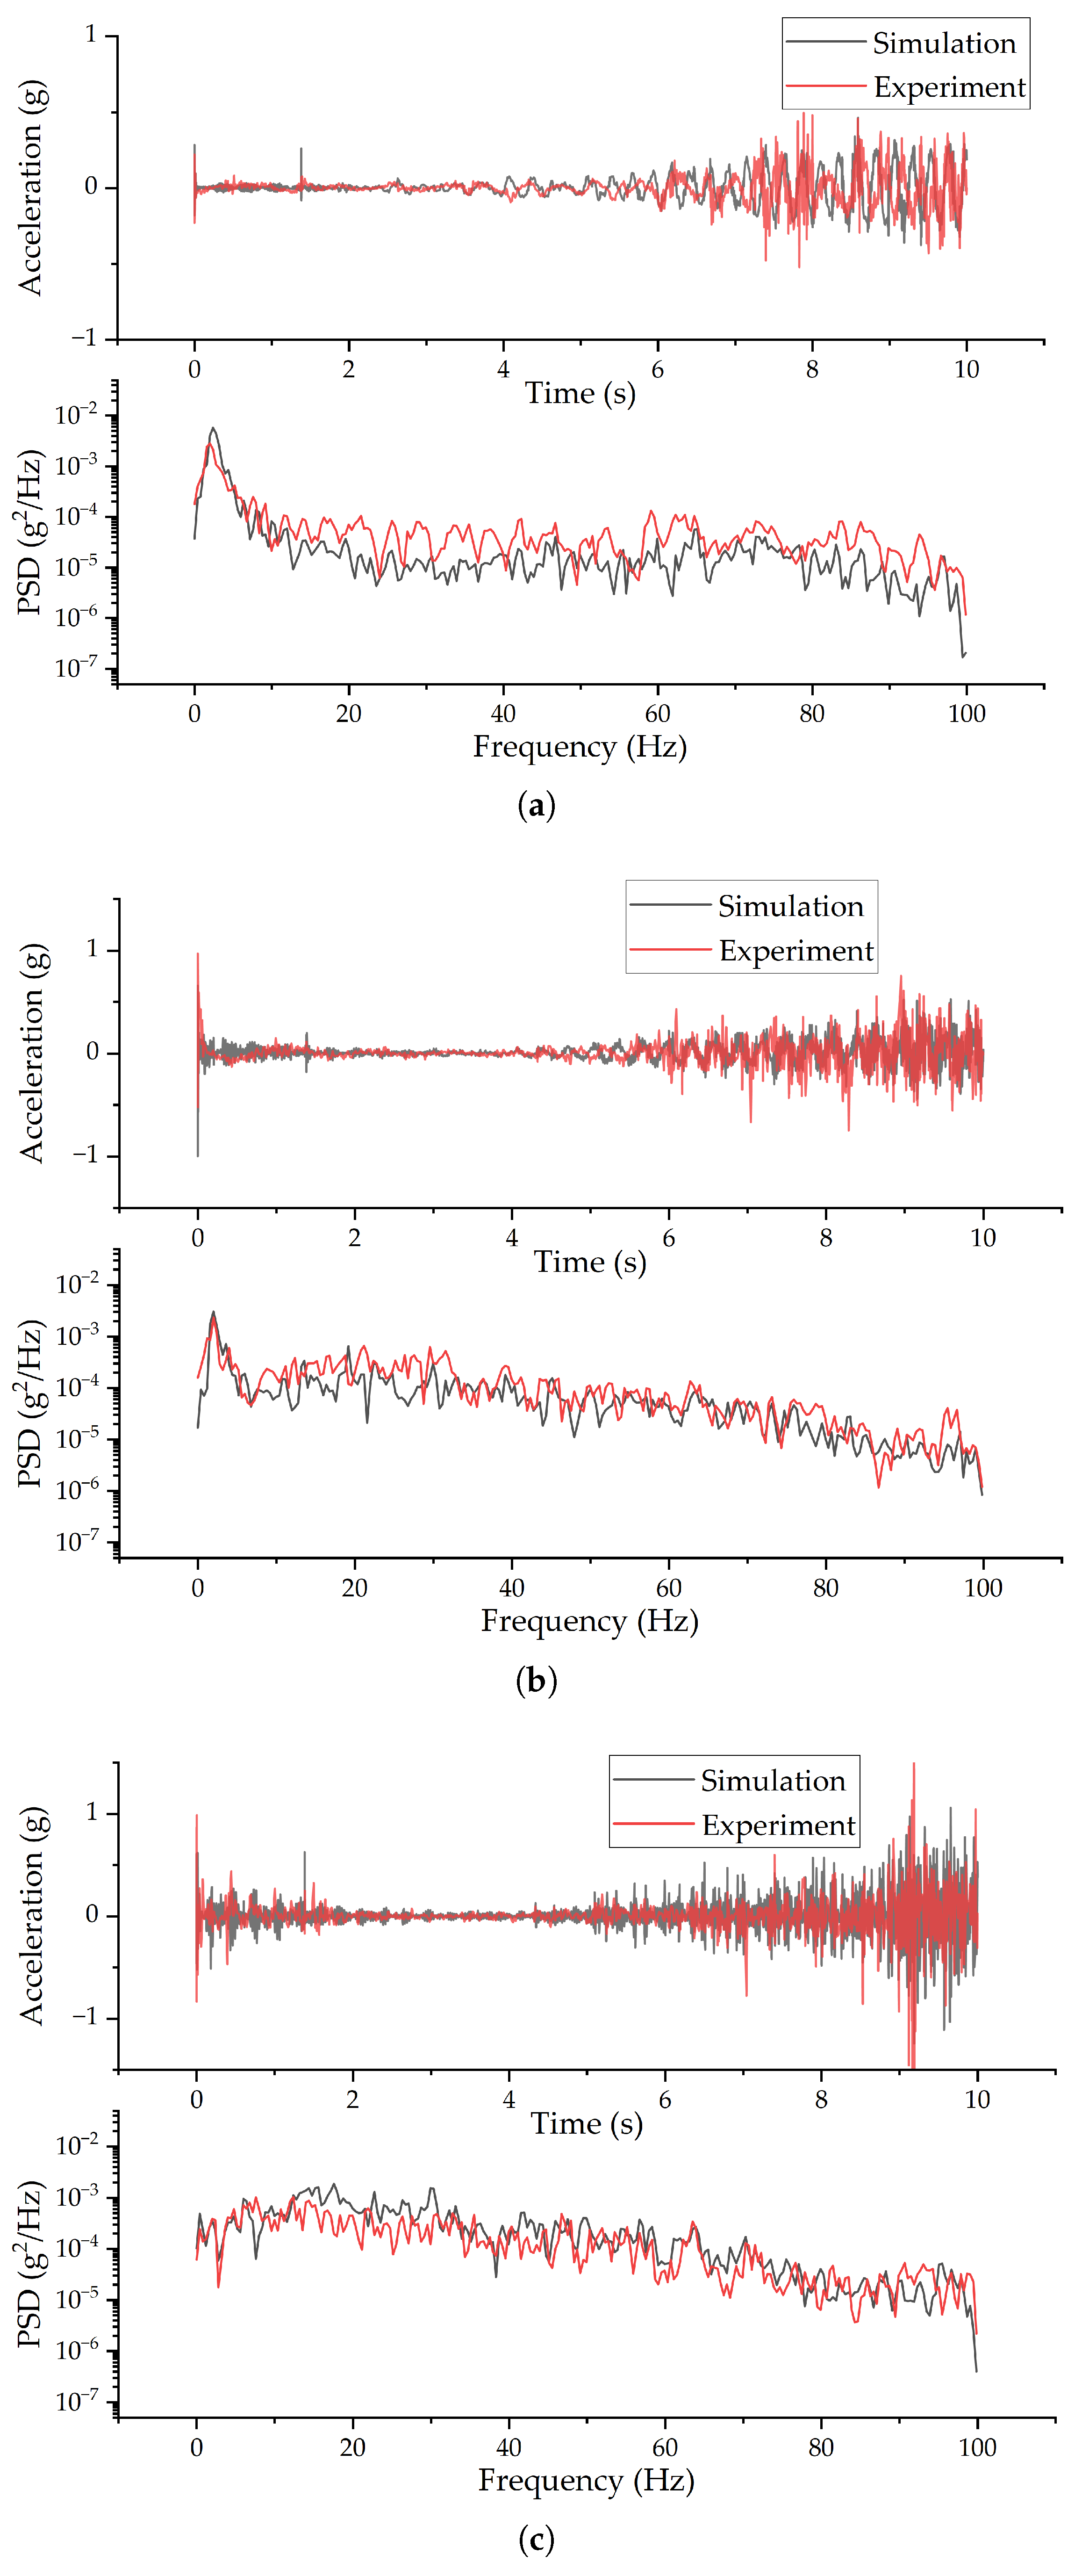
To validate the accuracy of the proposed DEM–FEM coupled model, the simulated vibration signals were compared with the experimental data in both time and frequency domains (
Figure 11).
Time-Domain Statistical Consistency: Due to the inherent stochasticity of granular flow, the exact impact moments of individual particles vary between simulation and experiment. Therefore, the time-domain validation focuses on statistical energy consistency. As detailed in
Table 2, the relative errors of the Root Mean Square (RMS) values for all three axes are below
, indicating that the simulation accurately captures the overall energy intensity of the system under impact.
Frequency-Domain Spectral Consistency: To quantify the similarity of the frequency response, the Spectral Correlation Coefficient (SCC) between the experimental and simulated Power Spectral Density (PSD) curves was computed. As shown in
Table 2, the SCC values for the X (Tangential) and Z (Normal) axes exceed 0.95, while the Y-axis value is approximately 0.86, demonstrating a high correlation in spectral shape. Specifically, both the experiment and the simulation exhibit a distinct low-frequency peak corresponding to the rocker-column swaying mode in the tangential direction, whereas the vertical direction shows a consistent broadband energy distribution.
These multi-dimensional quantitative indicators confirm that the established coupled model is reliable for investigating the dynamic evolution of wear states.
5. Results and Discussion
Theoretical analysis based on Equations (1) and (2) indicates that wear flattens the indenter’s geometry, significantly increasing the contact radius and the stick zone . This geometric evolution amplifies the frictional resistance torque at the contact interface, theoretically altering the system’s boundary constraints from a flexible rolling state to a highly constrained state.
To quantify the impact of wear, the validated coupled model was used to predict the system response under different wear severities. Following the contact mechanics principles outlined by Alcalá et al. [
28], this study adopts wear depth (
H) as the primary intrinsic state variable to govern the contact stiffness evolution. The wear evolution process was discretized into four characteristic geometric states based on the Truncation Model theory pioneered by Spedding et al. [
29] and validated by Ghosh and Sadeghi [
30] for deep wear scars:
mm (Baseline): Represents the intact spherical geometry of a new indenter.
mm and mm (Intermediate): Represent transitional stages where the contact area expands non-linearly.
mm (Severe): Represents the critical failure state where the spherical crown is nearly worn off.
The global load spectra (
) extracted from
Figure 4 were applied as boundary conditions to the bearing plate to calculate the transient dynamic response.
5.1. Time-Domain Response Analysis
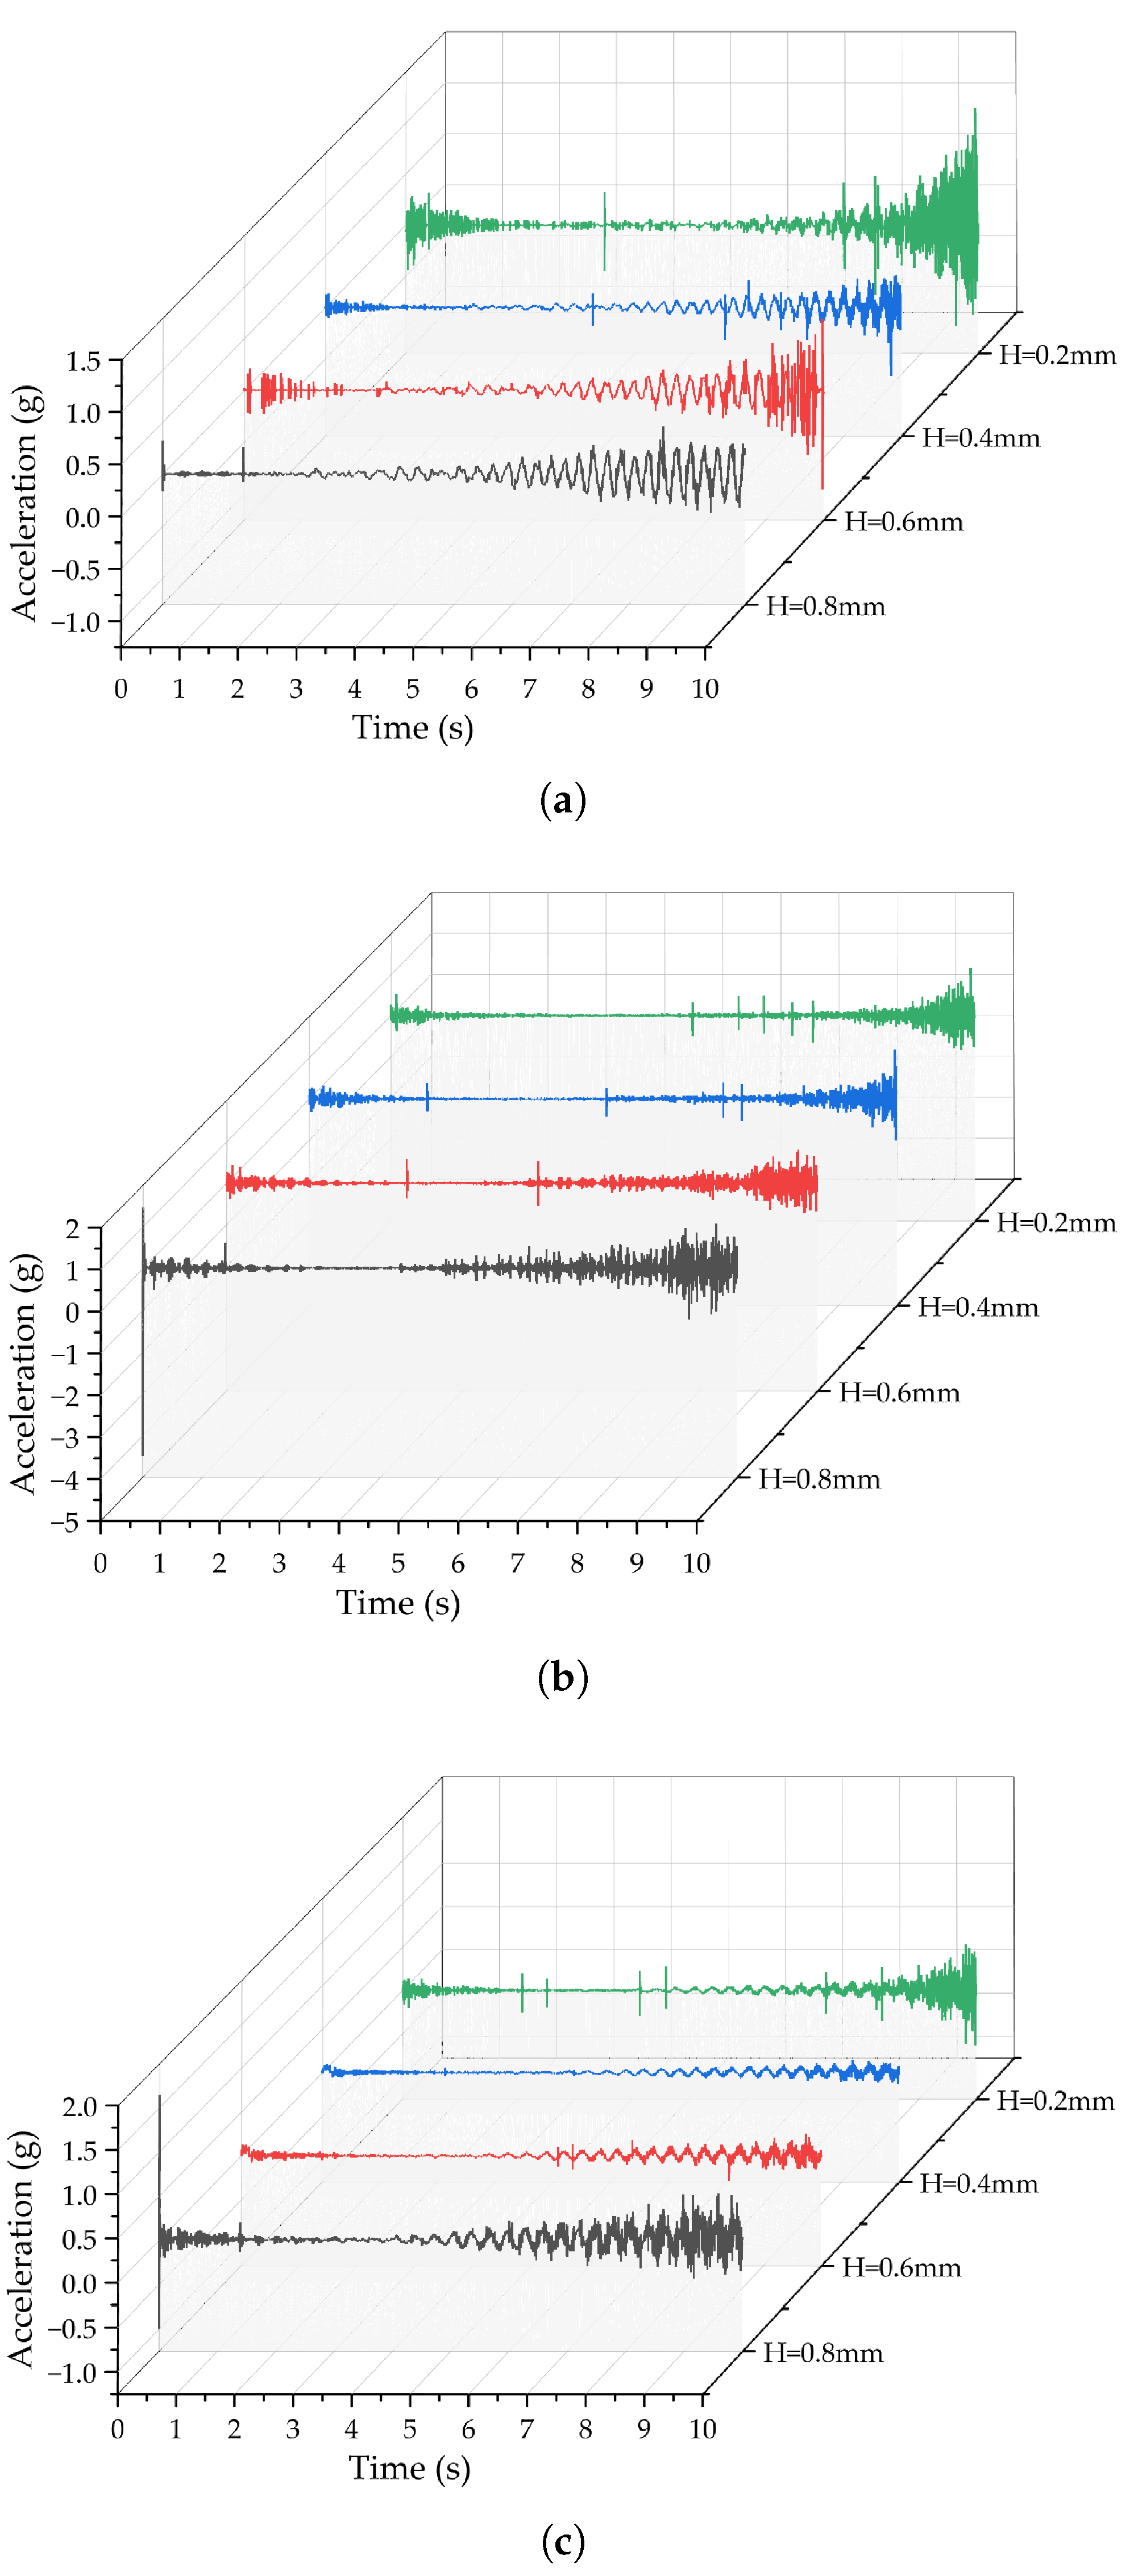
The vibration acceleration waveforms of the bearing plate under different wear states are presented in
Figure 12.
In the unworn state (
mm), the X-axis and Z-axis waveforms exhibit distinct low-frequency periodic fluctuations. Notably, the oscillation envelope amplitude increases gradually with the accumulation of material mass in the hopper. This behavior confirms that the force-regulating mechanism of the rocker-column indenter effectively converts the lateral impact energy into micro-amplitude swaying structural displacements. In contrast, the Y-axis vibration is dominated by medium-to-high frequency components, evolving synchronously with the vertical load spectrum
and reflecting the typical impact stages (initial shock, transition, accumulation, and stabilization) shown in
Figure 4.
As wear intensifies (decreasing
H), the contact area expands non-linearly. When the parasitic lateral load is insufficient to overcome the increased static friction torque, the swaying degrees of freedom are constrained. Consequently, the low-frequency fluctuations in
Figure 12a,c gradually diminish. The Y-axis vibration amplitude also decreases due to the restricted swaying motion, while the density of discrete transient impact pulses increases across all three axes, indicating a gradual failure of the system’s flexible buffering mechanism.
In the severe wear state ( mm), the vibration morphology undergoes a fundamental transition. The self-alignment function of the indenter fails, and the flexible swaying mechanism is replaced by rigid contact. Random shocks from falling materials are directly transmitted to the weighing unit, manifesting as dense, high-frequency impact pulses across all three axes, which exhibit a clear divergent trend in the late loading stage. This signifies that the system is subjected to severe, rigid excitation, leading to a degradation in metrological accuracy.
5.2. Frequency-Domain Feature Analysis
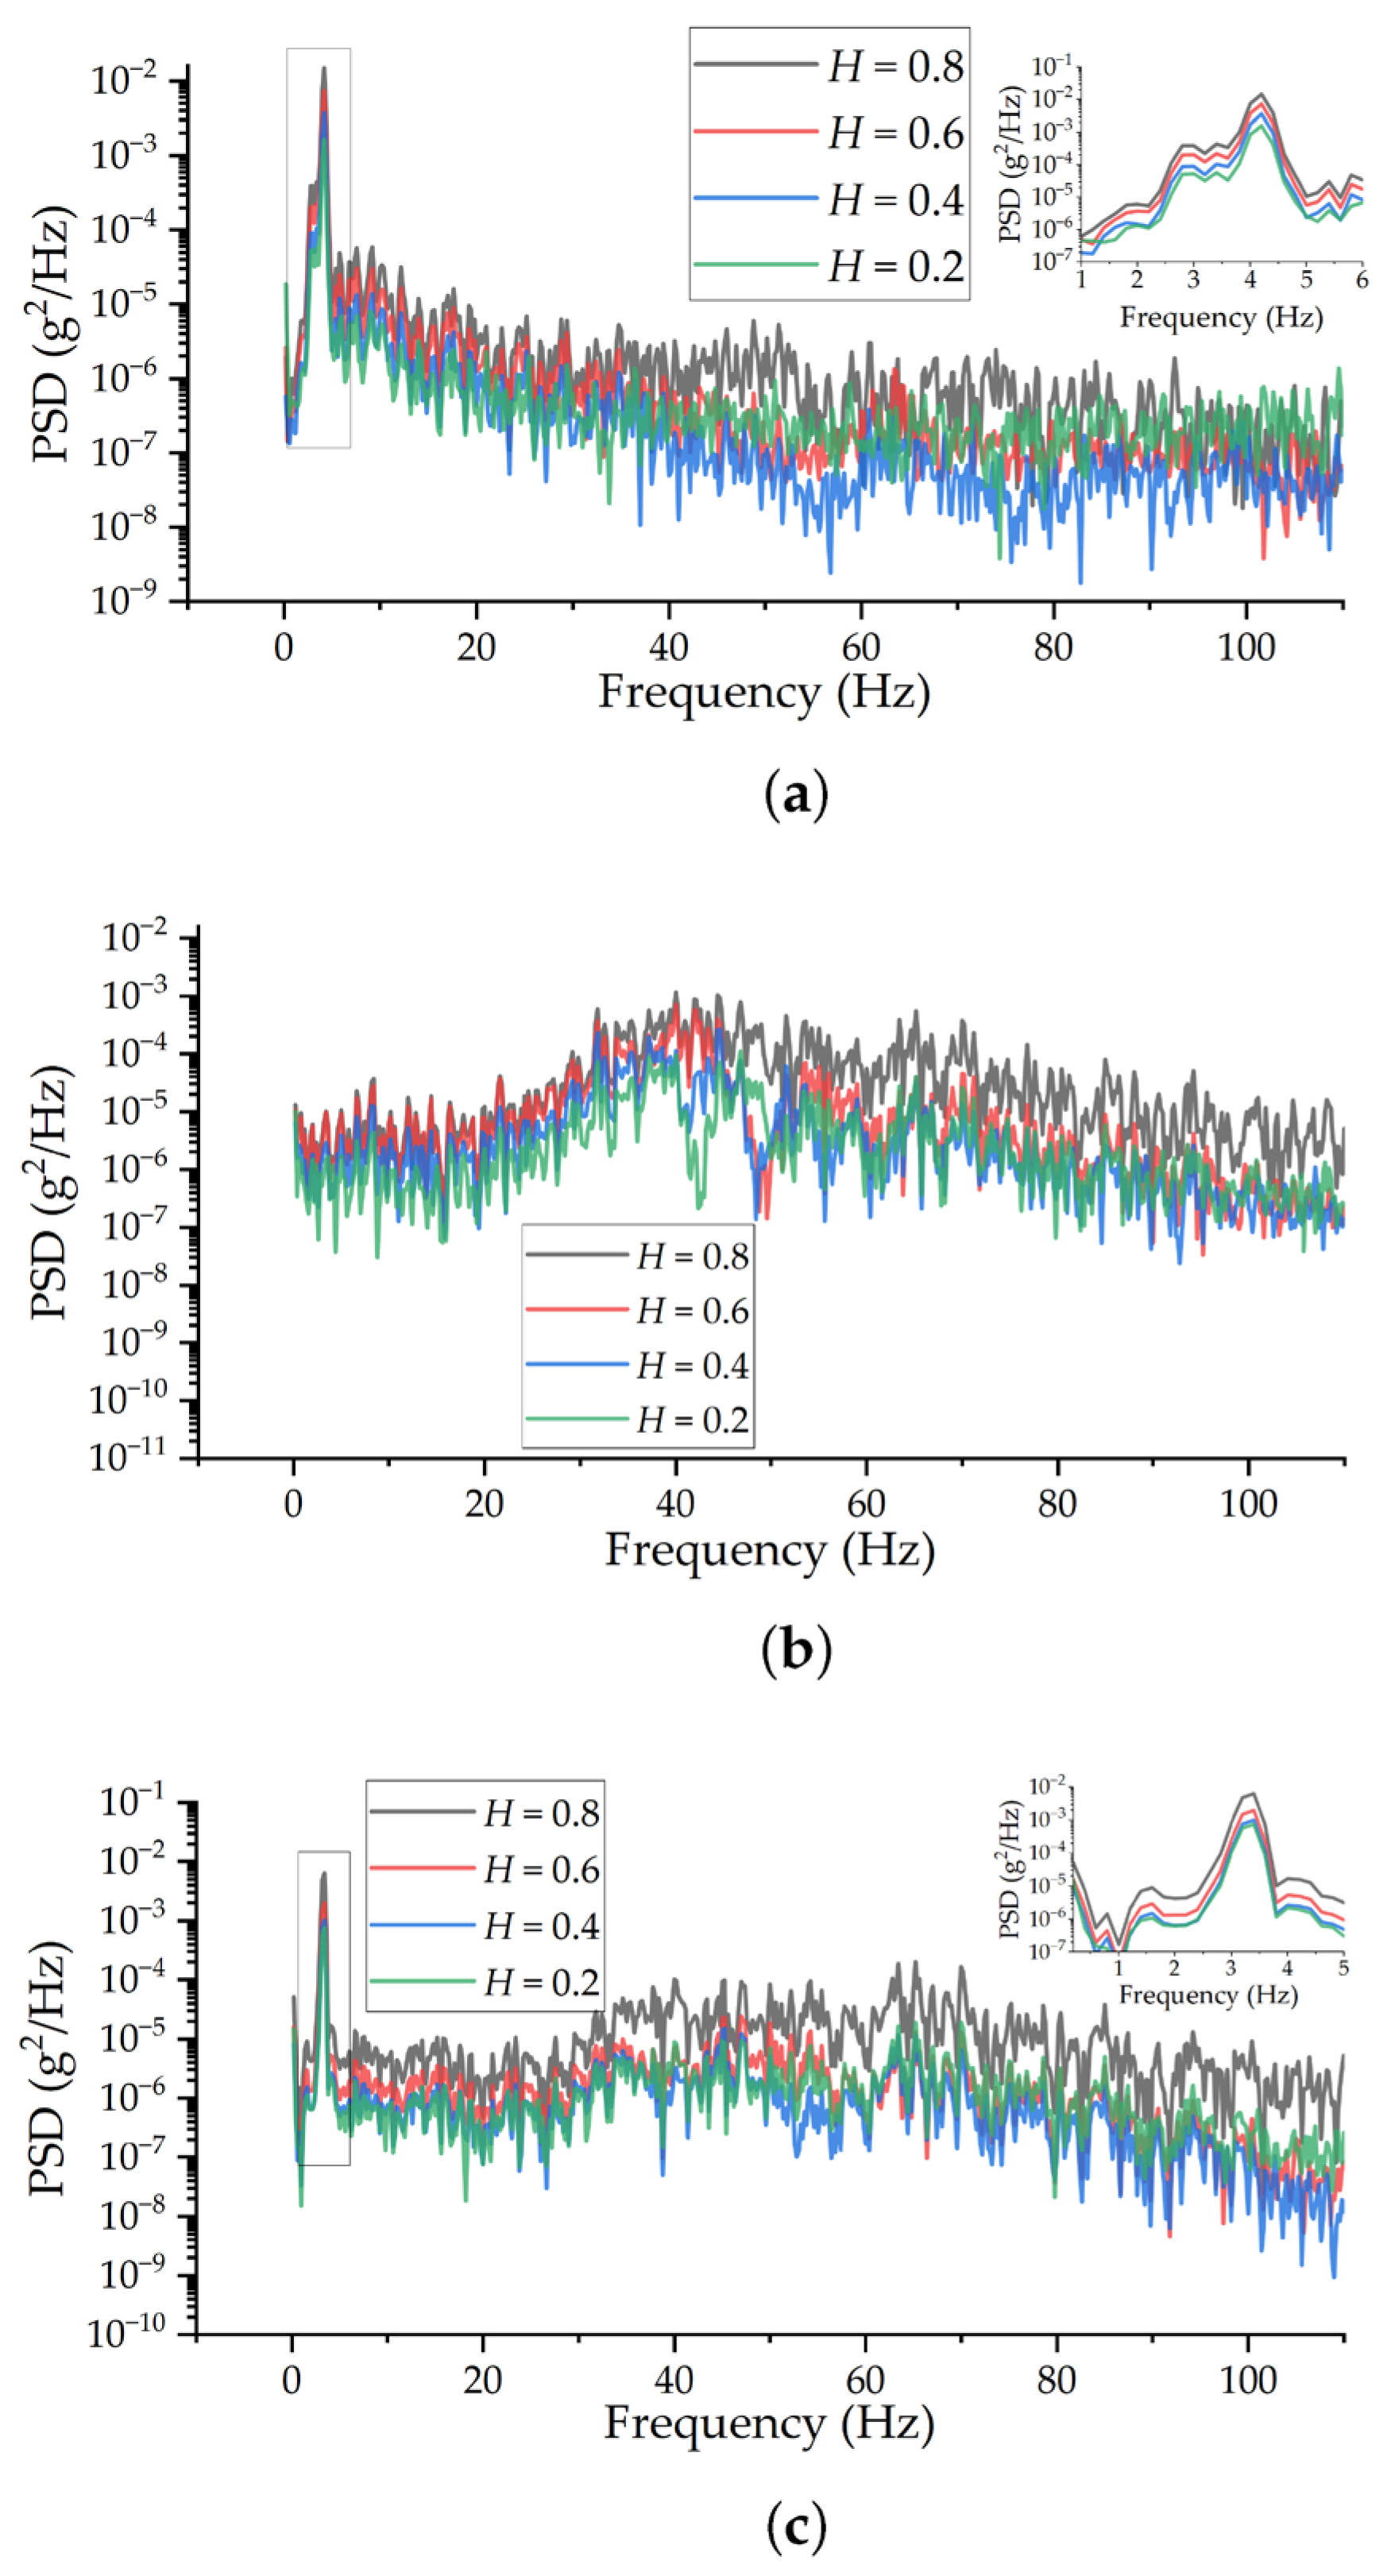
To reveal the distribution law of vibration energy across frequency bands, a Power Spectral Density (PSD) analysis was performed on the acceleration signals (
Figure 13).
General Observations: The overall trends of the PSD curves remain consistent across different wear states, indicating that the fundamental frequency characteristics of the system have not undergone a radical change. However, in the medium-to-low frequency range (below 50 Hz), the energy density exhibits a distinct hierarchical stratification. The unworn state ( mm) corresponds to the highest overall energy level, followed by intermediate wear states ( and 0.4 mm), while the severe wear state ( mm) shows the lowest energy in this band. This suggests that within the primary structural response frequency range, increased contact friction from wear acts as a damping mechanism, dissipating and suppressing the system’s vibrational energy.
Figure 13a,c reveal that for the X and Z axes, significant energy main peaks exist in the low-frequency region. A zoomed-in view of the sub-5 Hz band shows that the amplitude of this main peak attenuates monotonically as the spherical height
H decreases. This confirms that the wear-induced contact constraint restricts the low-frequency swaying of the indenter, reducing the sway amplitude and weakening the frequency-domain energy density. In contrast,
Figure 13b shows that the Y-axis PSD is more prominent in the medium-to-high frequency range and lacks a significant low-frequency main peak. This aligns with the characteristics of the vertical load, which is dominated by broadband random excitations caused by material impact rather than structural swaying.
Energy Migration Phenomenon: At certain frequencies, the PSD curves for , 0.6, and 0.4 mm exhibit interlacing and overlapping, caused by discrete high-frequency pulse disturbances during the transition wear stage. Crucially, when wear reaches the severe state ( mm), a distinct phenomenon emerges: as frequency increases, the broadband noise floor elevates significantly. The signal energy in all three axes rebounds, eventually surpassing that of the mm state. This spectral shift characterizes the energy migration phenomenon, where vibration energy transfers from a low-frequency, swaying-dominated mode to a high-frequency, rigid-impact-dominated broadband mode.
5.3. Statistical Indicators and Wear State Identification
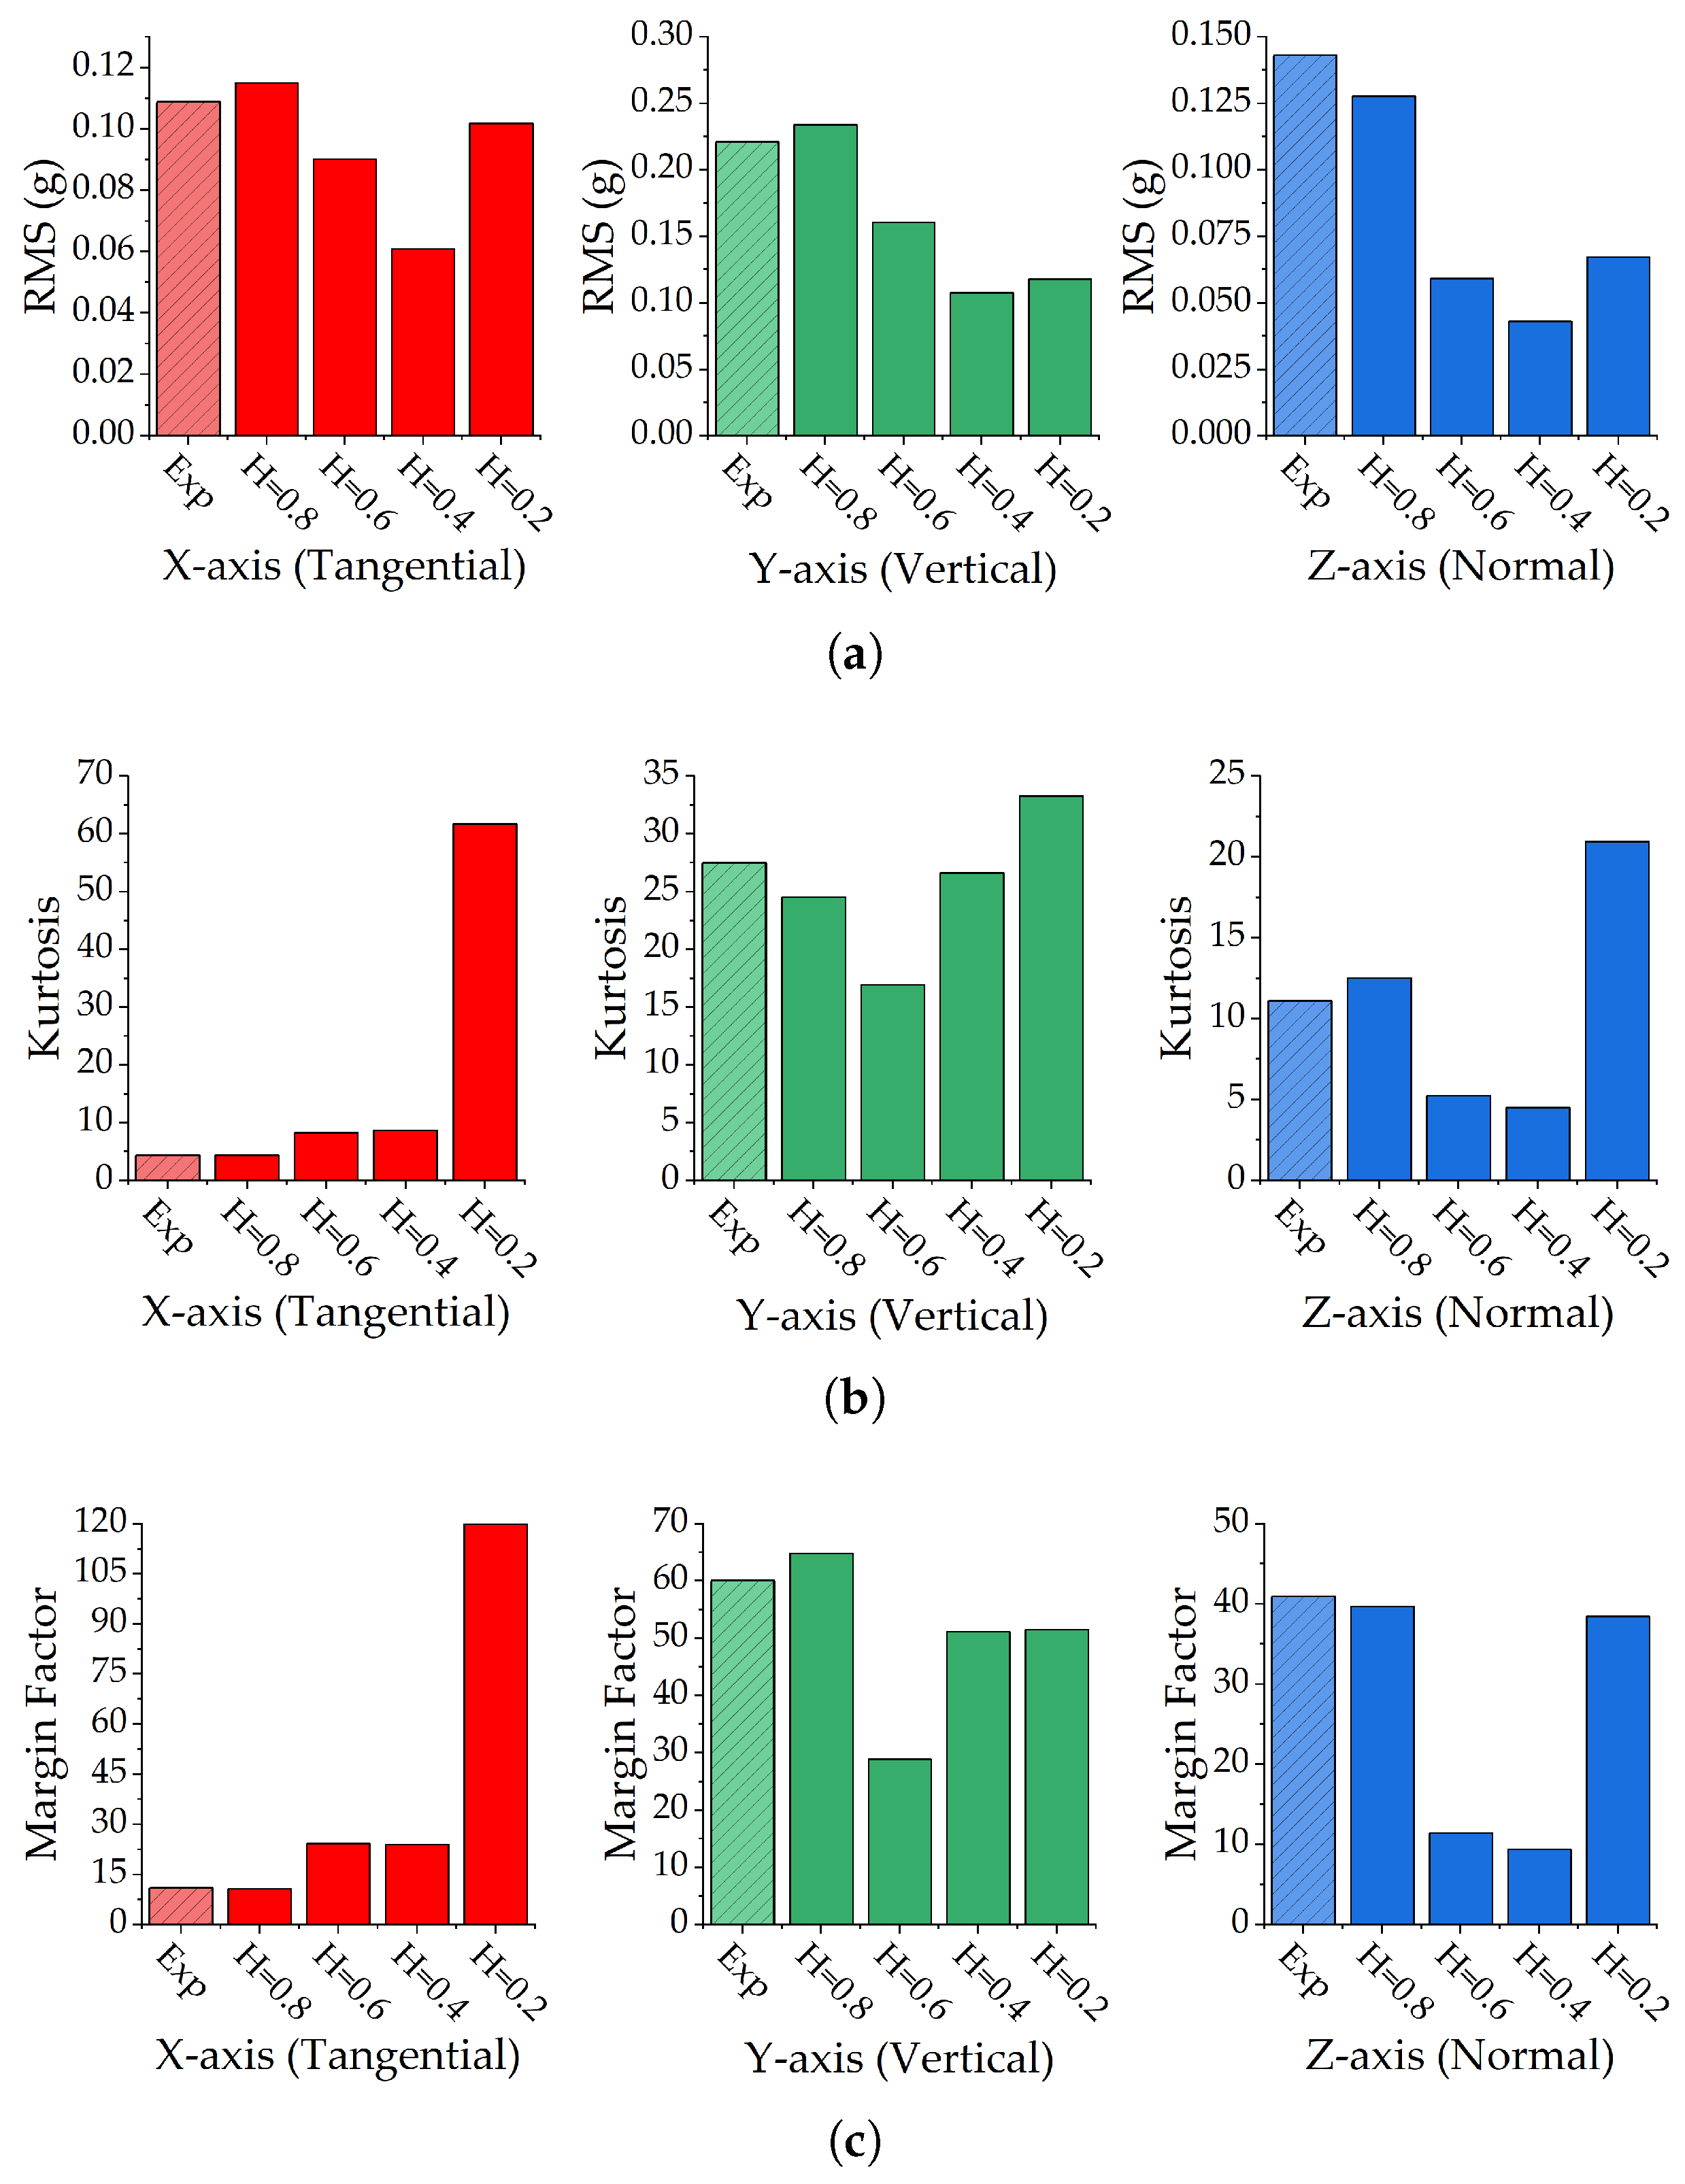
To identify sensitive indicators for online monitoring, the evolution of Root Mean Square (RMS), Kurtosis, and Margin Factor was analyzed (
Figure 14).
Before analyzing the wear evolution, the simulation credibility was verified by comparing the statistical indicators of the baseline simulation (
mm) with the experimental data. The results in
Figure 14 show high consistency across all axes, with a maximum relative error of less than 12.77%. This confirms that the coupled model accurately reflects the statistical characteristics of the real system and is valid for the subsequent wear evolution analysis.
5.3.1. Analysis of Energy-Based Indicators (RMS)
As shown in
Figure 14a, the RMS value exhibits a non-monotonic V-shaped trend with wear progression. Taking the X-axis as an example, as the spherical height degrades from
mm to
mm, the RMS value drops from 0.11 g to 0.06 g (a decrease of 47.0%). This suppression occurs because the increasing friction constrains the macroscopic swaying. However, at
mm, the RMS rebounds to 0.10 g. This resurgence is attributed to the system entering a rigid-impact state, in which high-frequency vibration energy accumulates in the broadband. This non-monotonic behavior suggests that simple energy-based indicators like RMS are insufficient for diagnosing early-stage wear, as they cannot distinguish between an intact swaying state and a severe impact state based solely on energy levels.
5.3.2. Analysis of Feature-Based Indicators (Kurtosis and Margin)
Figure 14b,c reveal that the Kurtosis and Margin Factor for the Y and Z axes also follow a V-shaped trend similar to RMS. In the unworn state (
mm), the high indicators arise from the transient force fluctuations caused by contact nonlinearity and swaying. As wear increases to intermediate levels (
mm), the expanded contact area constrains motion, smoothing the signal and reducing these indicators. It is only at the severe wear stage (
mm) that rigid collisions trigger a rise in these values.
In contrast, the X-axis indicators demonstrate superior monotonic sensitivity. From the intact state to severe wear, the X-axis Kurtosis surges from 4.39 to 61.66 (a 14-fold increase), and the Margin Factor climbs from 10.75 to 119.87 (an 11-fold increase).
5.3.3. Discussion on Directional Sensitivity Based on Structural Dynamics
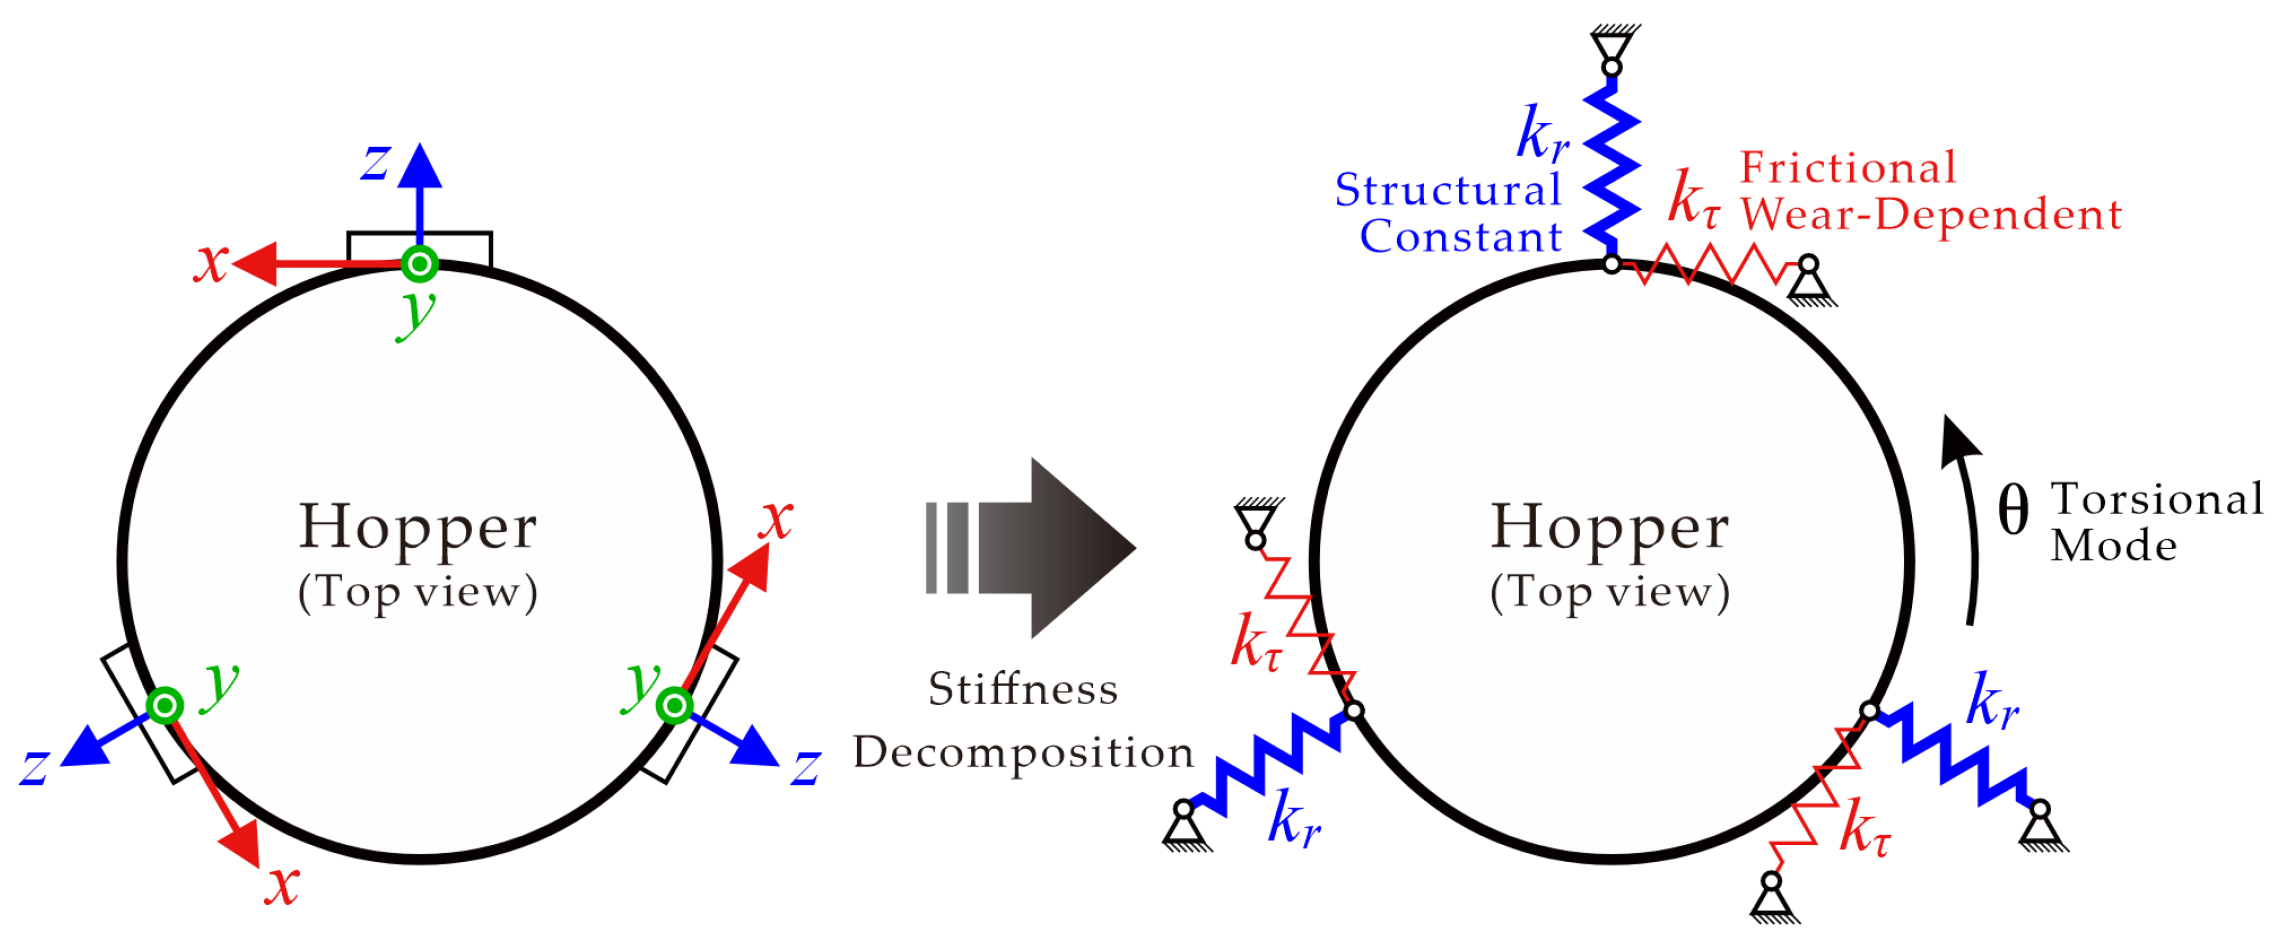
The superior monotonic sensitivity of the X-axis (Tangential) indicators compared to the V-shaped trend of the Z-axis (Radial) can be theoretically explained by the system’s structural dynamics and kinematic constraints (
Figure 15).
- 1.
Stiffness Decomposition: The equivalent stiffness at each support node consists of a structural component (
, radial) derived from the frame rigidity and geometric interlocking, and a contact component (
, tangential) derived from the frictional interface. Since the indenter is structurally compressed in the radial direction but allows for rolling in the tangential direction,
. According to relevant dynamic models [
31],
consists of a gravitational restoring term and a friction-dependent term. Wear-induced flattening increases the friction contribution, causing a nonlinear variation in
.
- 2.
Signal Composition and Masking Effect:
Z-axis (Structural Masking): The Z-axis vibration is dominated by the translational mode, which is constrained by the triangular geometric interlocking. Consequently, the equivalent stiffness is governed by . The subtle changes in contact friction () are effectively masked by the dominant structural stiffness (). In the unworn state ( mm), geometric nonlinearity induces transient impact responses under lateral excitation, resulting in initially high indicators. As wear progresses to the intermediate stage, the expanded contact area increases damping and suppresses these transients, causing a dip. Ultimately, in the severe wear state ( mm), the failure of the self-aligning mechanism exposes the system to direct rigid impacts, causing the indicators to rebound and completing the non-monotonic V-shaped trend.
X-axis (Direct Friction Observation): The X-axis aligns with the rotational mode, which lacks structural geometric constraints and relies solely on contact friction () for restoration. Therefore, the vibration signal in this direction is a direct physical manifestation of the tribological state. It evolves monotonically from smooth harmonic swaying in the unworn state, to stick-slip oscillation in the transition stage, and finally to rigid impact in the severe wear state.
This analysis confirms that the X-axis indicators are the physically intrinsic observables of the tribological state of the weighing unit.
5.3.4. Comparison with Existing Studies
In contrast to previous studies that focus on data-driven classification algorithms for rotating machinery (e.g., Feng et al. [
7], Sánchez et al. [
32]), the present study emphasizes a mechanism-driven approach tailored for transient impact systems. Whereas prior works often treat vibration solely as a signal source for machine learning classifiers, the findings here reveal a physical link between wear evolution and changes in dynamic constraints. Specifically, the transition from swaying-dominated to impact-dominated modes is identified as the physical precursor to metrological failure. This mechanism accounts for the superior performance of specific indicators (Tangential Kurtosis/Margin) over general energy indicators in this application context.
6. Conclusions
This study addressed the challenge of wear state assessment in industrial hopper scales by establishing a validated global-to-local coupled DEM–FEM model. A comprehensive simulation framework was developed to simulate material-structure interactions, thereby overcoming the limitations of traditional simplified load models. Through this approach, the mechanism by which spherical wear of the indenter induces transitions in system dynamics was elucidated, providing a quantitative physical basis for Condition-Based Maintenance (CBM).
Specifically, the key findings are as follows:
Model Fidelity: A global-to-local coupled simulation strategy integrating particle dynamics and structural finite element analysis was established. Validated against experimental data, the model accurately reproduces the dynamic load spectrum and vibration response under transient material impact.
Dynamic Transition Mechanism: The rocker-column weighing unit undergoes a vibration mode transition driven by wear. As the contact geometry flattens, increased friction torque suppresses low-frequency swaying, shifting the system towards a high-frequency, rigid-impact-dominated state.
Energy Migration in Frequency Domain: The Power Spectral Density analysis confirmed that the fundamental frequency characteristics remain stable, but the energy distribution shifts. Specifically, the low-frequency swaying energy (<5 Hz) attenuates monotonically, while the high-frequency broadband noise floor elevates significantly in the severe wear stage.
Diagnostic Criteria and Sensitivity: The RMS value exhibits a non-monotonic V-shaped trend, limiting its diagnostic utility. In contrast, the Kurtosis and Margin Factor of the tangential vibration (X-axis) demonstrate excellent monotonic sensitivity, increasing by 14 and 11 times, respectively. This directional sensitivity is attributed to the specific geometric constraints of the hopper system.
Practical Implementation Strategy: For industrial applications, it is recommended to deploy uniaxial piezoelectric accelerometers oriented tangentially (along the X-axis) on the weighing unit support. A site-specific baseline should be established during the stable operation phase. When the tangential Kurtosis or Margin Factor deviates by an order of magnitude relative to the baseline, it indicates a critical transition to the rigid impact state, serving as an early warning for maintenance.
Future Directions: While this study establishes the fundamental mechanism, subsequent research will broaden the scope to include: (1) generalization to diverse industrial scenarios, such as different material properties (e.g., fine powders vs. irregular ores) and varying hopper geometries; (2) scalability to other weighing structures, including S-type and canister load cells; and (3) in situ validation under actual industrial operating conditions to account for uneven wear patterns and environmental factors.
Author Contributions
Conceptualization, Y.Z. and X.W.; methodology, Y.Z.; software, Y.Z.; validation, Y.Z., X.W., X.S. and Z.W.; formal analysis, Y.Z.; investigation, Y.Z. and Z.W.; resources, X.W. and X.S.; data curation, Y.Z.; writing—original draft preparation, Y.Z.; writing—review and editing, X.W. and Z.W.; visualization, Y.Z.; supervision, X.W.; project administration, X.W. and Z.W.; funding acquisition, X.W. All authors have read and agreed to the published version of the manuscript.
Funding
This study was funded by the National Natural Science Foundation of China, grant number 52375117.
Institutional Review Board Statement
Not applicable.
Informed Consent Statement
Not applicable.
Data Availability Statement
The data presented in this study are available on request from the corresponding author. The data are not publicly available due to privacy restrictions regarding the industrial partner’s equipment specifics.
Acknowledgments
The authors would like to thank the technical staff at Xiangtan Iron & Steel Group Co., Ltd. for their support in providing the experimental site and equipment.
Conflicts of Interest
Author Xu She was employed by the company Xiangtan Iron & Steel Group Co., Ltd. The remaining authors declare that the research was conducted in the absence of any commercial or financial relationships that could be construed as a potential conflict of interest.
Abbreviations
The following abbreviations and symbols are used in this manuscript:
| DEM | Discrete Element Method |
| FEM | Finite Element Method |
| RMS | Root Mean Square |
| PSD | Power Spectral Density |
| CBM | Condition-Based Maintenance |
| NBR | Nitrile Butadiene Rubber |
| H | Wear height of the spherical indenter (mm) |
| Vertical dynamic load (N) |
| Lateral dynamic loads (N) |
| Contact radius (mm) |
| Radius of the stick zone (mm) |
| Tangential contact stiffness (N/m) |
| Radial structural stiffness (N/m) |
| K | Kurtosis indicator (dimensionless) |
| L | Margin Factor (dimensionless) |
References
- Norden, K.E. Handbook of Electronic Weighing; John Wiley & Sons: Hoboken, NJ, USA, 2008. [Google Scholar]
- Ma, B.; Chen, J.; Qiu, Y.; Shen, D. Analysis and research on error calculation model of OIML R 76 and reality application. Meas. Sens. 2025, 38, 101364. [Google Scholar] [CrossRef]
- Boschetti, G.; Caracciolo, R.; Richiedei, D.; Trevisani, A. Model-based dynamic compensation of load cell response in weighing machines affected by environmental vibrations. Mech. Syst. Signal Process. 2013, 34, 116–130. [Google Scholar] [CrossRef]
- Zhang, W.; Li, C.-L.; Di, X.-F.; Chen, M.; Tao, S. Research on automotive dynamic weighing method based on piezoelectric sensor. In MATEC Web of Conferences; EDP Sciences: Les Ulis, France, 2017; Volume 139, p. 00203. [Google Scholar]
- Wang, D.; Wang, K. The method of the velocity compensation in dynamic weighing system. In Proceedings of the 2010 IEEE International Conference on Intelligent Systems and Knowledge Engineering, Hangzhou, China, 15–16 November 2010; pp. 488–491. [Google Scholar]
- Zhao, G.; Zhang, Z.; Zhu, W.; Yuan, W. Nonlinear contact stiffness and damping identification of a tenon connection structure based on its dynamic characteristics. J. Sound Vib. 2023, 562, 117726. [Google Scholar] [CrossRef]
- Feng, K.; Zheng, J.; Ni, Q. Friction, Vibration and Dynamic Properties of Transmission System Under Wear Progression; MDPI: Basel, Switzerland, 2023. [Google Scholar]
- Feng, K.; Smith, W.A.; Borghesani, P.; Randall, R.B.; Peng, Z. Use of cyclostationary properties of vibration signals to identify gear wear mechanisms and track wear evolution. Mech. Syst. Signal Process. 2021, 150, 107258. [Google Scholar] [CrossRef]
- Wang, Y.; Zhao, S.; Zhang, P.; Long, H.; Sun, Y.; Zhao, N.; Yang, X. The pin tool wear identification with vibration signal of friction stir lap welding based on a new pin tool wear division model. Measurement 2025, 242, 116131. [Google Scholar] [CrossRef]
- Xu, C.; Fan, Q.; Zhang, Q.; Tong, Y.; Wang, S.; Wu, T. Vibration-Based Wear Evolution Characterisation of Lubricated Rolling-Sliding Contact. Lubricants 2025, 13, 78. [Google Scholar] [CrossRef]
- Kalifa, M.; Khan, M.; He, F.; Basit, K.; Doganay Kati, H. Analytical Modeling and Experimental Validation of Wear and Frictional Noise Under Lubricated Conditions. J. Tribol. 2026, 148, 011706. [Google Scholar] [CrossRef]
- Basit, K.; Shams, H.; Khan, M.A.; Mansoor, A. Vibration analysis approach to model incremental wear and associated sound in multi-contact sliding friction mechanisms. J. Tribol. 2023, 145, 091109. [Google Scholar] [CrossRef]
- He, Z.; Wang, K.; Chen, J.; Xin, J.; Du, H.; Han, D.; Guo, Y. Study of Channel-Type Dynamic Weighing System for Goat Herds. Electronics 2023, 12, 1715. [Google Scholar] [CrossRef]
- Xiong, L.; Zhang, T.; Yuan, A.; Zhang, Z. Research on Filtering Algorithm of Vehicle Dynamic Weighing Signal. World Electr. Veh. J. 2024, 15, 254. [Google Scholar] [CrossRef]
- Zengin, S.; Akdemir, B. Combination of FIR and Kalman Filters to Increase Measurement Accuracy in Dynamic Weighing. Gazi Univ. J. Sci. 2025, 38, 1835–1844. [Google Scholar] [CrossRef]
- Lai, Z.; Yang, X.; Yao, J. Vibration analysis of the oscillation support of column load cells in low speed axle-group weigh-in-motion system. Acta IMEKO 2020, 9, 63–68. [Google Scholar] [CrossRef]
- Johnson, K.L. Contact Mechanics; Cambridge University Press: Cambridge, UK, 1992. [Google Scholar]
- Popov, V.L.; Heß, M. Method of Dimensionality Reduction in Contact Mechanics and Friction; Springer: Berlin/Heidelberg, Germany, 2015. [Google Scholar]
- Waterhouse, R.B. Fretting Fatigue; Applied Science Publishers: London, UK, 1981. [Google Scholar]
- Cai, M.; Zhang, P.; Xiong, Q.; Cai, Z.; Luo, S.; Gu, L.; Zeng, L. Finite element simulation of fretting wear behaviors under the ball-on-flat contact configuration. Tribol. Int. 2023, 177, 107930. [Google Scholar] [CrossRef]
- De Silva, C.W. Vibration and Shock Handbook; Taylor & Francis: Boca Raton, FL, USA, 2005. [Google Scholar]
- Wu, B.; Wang, X.; Liu, X.; Xu, G.; Zhu, S. Numerical simulation of erosion and fatigue failure the coal gangue paste filling caused to pumping pipes. Eng. Fail. Anal. 2022, 134, 106081. [Google Scholar] [CrossRef]
- Ge, H.; Quezada, J.C.; Le Houerou, V.; Chazallon, C.; Sha, A. From macro to micro investigation of three-dimensional particle-scale responses of asphalt mixtures under non-uniform rolling tire loads via coupled FEM-DEM simulations. Road Mater. Pavement Des. 2025, 1–30. [Google Scholar] [CrossRef]
- Knee, W.; Ginga, N.J. Multiscale Quasi-Static Finite Element Analysis of Commercial Lithium Primary Batteries. In Proceedings of the ASME International Mechanical Engineering Congress and Exposition, Portland, OR, USA, 17–21 November 2024; Volume 88643. [Google Scholar]
- Chaudry, M.A.; Woitzik, C.; Düster, A.; Wriggers, P. A multiscale DEM–FEM coupled approach for the investigation of granules as crash-absorber in ship building. Comput. Part. Mech. 2022, 9, 179–197. [Google Scholar] [CrossRef]
- Carmichael, R.S. Handbook of Physical Properties of Rocks; CRC Press: Boca Raton, FL, USA, 2017. [Google Scholar]
- Shigley, J.E.; Mischke, C.R.; Budynas, R.G. Mechanical Engineering Design; McGraw-Hill: New York, NY, USA, 2004. [Google Scholar]
- Alcalá, J.; Giannakopoulos, A.E.; Suresh, S. Continuous measurements of load-penetration curves with spherical microindenters and the estimation of mechanical properties. J. Mater. Res. 1998, 13, 898–912. [Google Scholar] [CrossRef]
- Spedding, T.A.; King, T.G.; Watson, W.; Stout, K.J. The Pearson system of distributions: Its application to non-Gaussian surface metrology and a simple wear model. J. Lubr. Technol. 1980, 102, 495–500. [Google Scholar] [CrossRef]
- Ghosh, A.; Sadeghi, F. A novel approach to model effects of surface roughness parameters on wear. Wear 2015, 338, 73–94. [Google Scholar] [CrossRef]
- Cao, S.; Ozbulut, O.E.; Dang, X.; Tan, P. Experimental and numerical investigations on adaptive stiffness double friction pendulum systems for seismic protection of bridges. Soil Dyn. Earthq. Eng. 2024, 176, 108302. [Google Scholar] [CrossRef]
- Sánchez, R.-V.; Macancela, J.C.; Ortega, L.-R.; Cabrera, D.; Márquez, F.P.G.; Cerrada, M. Evaluation of Hand-Crafted Feature Extraction for Fault Diagnosis in Rotating Machinery: A Survey. Sensors 2024, 24, 5400. [Google Scholar] [CrossRef]
Figure 1.
Schematic diagram of the hopper weighing system. (a) Structural composition and installation. (b) Force states of the indenter under different loading conditions.
Figure 1.
Schematic diagram of the hopper weighing system. (a) Structural composition and installation. (b) Force states of the indenter under different loading conditions.
Figure 2.
Fretting contact mechanics model of the hopper scale weighing unit.
Figure 2.
Fretting contact mechanics model of the hopper scale weighing unit.
Figure 3.
Global DEM–FEM coupled model. (a) Discrete Element Model for particle flow, where particle colors indicate velocity magnitudes (from blue to red representing low to high speeds). (b) Finite Element Model for structural response.
Figure 3.
Global DEM–FEM coupled model. (a) Discrete Element Model for particle flow, where particle colors indicate velocity magnitudes (from blue to red representing low to high speeds). (b) Finite Element Model for structural response.
Figure 4.
Simulated load spectrum at a single measurement point (, , ).
Figure 4.
Simulated load spectrum at a single measurement point (, , ).
Figure 5.
Refined local fretting finite element model of the weighing unit. Different colors denote distinct geometric partitions used to facilitate structured meshing, without representing physical properties.
Figure 5.
Refined local fretting finite element model of the weighing unit. Different colors denote distinct geometric partitions used to facilitate structured meshing, without representing physical properties.
Figure 6.
Experimental platform of the hopper weighing system.
Figure 6.
Experimental platform of the hopper weighing system.
Figure 7.
Geometric dimensions and structural details of the weighing unit. (a) Overall dimensions. (b) Detailed view of the rocker-column indenter, where detail “A” provides an enlarged view of the indenter’s spherical contact region.
Figure 7.
Geometric dimensions and structural details of the weighing unit. (a) Overall dimensions. (b) Detailed view of the rocker-column indenter, where detail “A” provides an enlarged view of the indenter’s spherical contact region.
Figure 8.
Pebble material particles used for impact loading experiments.
Figure 8.
Pebble material particles used for impact loading experiments.
Figure 9.
Schematic diagram of the measurement equipment and data acquisition signal flow.
Figure 9.
Schematic diagram of the measurement equipment and data acquisition signal flow.
Figure 10.
Hardware components of the vibration measurement system. (a) Sensor installation on the bearing plate. (b) Data acquisition instrument (INV3065N2).
Figure 10.
Hardware components of the vibration measurement system. (a) Sensor installation on the bearing plate. (b) Data acquisition instrument (INV3065N2).
Figure 11.
Comparison between simulation and experimental acceleration data. (a) X-axis (Tangential). (b) Y-axis (vertical). (c) Z-axis (normal).
Figure 11.
Comparison between simulation and experimental acceleration data. (a) X-axis (Tangential). (b) Y-axis (vertical). (c) Z-axis (normal).
Figure 12.
Time-domain vibration acceleration waveforms of the bearing plate under different wear states. (a) X-axis (Tangential). (b) Y-axis (vertical). (c) Z-axis (normal).
Figure 12.
Time-domain vibration acceleration waveforms of the bearing plate under different wear states. (a) X-axis (Tangential). (b) Y-axis (vertical). (c) Z-axis (normal).
Figure 13.
Power Spectral Density (PSD) distribution under different wear states. (a) X-axis (Tangential). (b) Y-axis (vertical). (c) Z-axis (normal).
Figure 13.
Power Spectral Density (PSD) distribution under different wear states. (a) X-axis (Tangential). (b) Y-axis (vertical). (c) Z-axis (normal).
Figure 14.
Evolution of statistical indicators with wear progression. (a) RMS. (b) Kurtosis. (c) Margin Factor.
Figure 14.
Evolution of statistical indicators with wear progression. (a) RMS. (b) Kurtosis. (c) Margin Factor.
Figure 15.
Kinematic constraint and stiffness decomposition model of the hopper system. (Left) Physical layout showing the triangular arrangement of weighing units and local coordinate systems. (Right) Equivalent dynamic model where the support stiffness is decomposed into a radial structural component and a tangential contact component .
Figure 15.
Kinematic constraint and stiffness decomposition model of the hopper system. (Left) Physical layout showing the triangular arrangement of weighing units and local coordinate systems. (Right) Equivalent dynamic model where the support stiffness is decomposed into a radial structural component and a tangential contact component .
Table 1.
Specifications of the triaxial piezoelectric acceleration sensor (ULT2010).
Table 1.
Specifications of the triaxial piezoelectric acceleration sensor (ULT2010).
| Parameter | Value |
|---|
| Frequency Range | –5000 Hz |
| Measurement Range | g |
| Sensitivity | 100 mV/g |
| Resolution | g |
| Mass | 20 g |
| Installation Method | Magnetic Base |
Table 2.
Quantitative comparison of experimental and simulated vibration characteristics.
Table 2.
Quantitative comparison of experimental and simulated vibration characteristics.
| Metric | X-Axis | Y-Axis | Z-Axis |
|---|
| RMS (Experiment) [g] | 0.115 | 0.234 | 0.127 |
| RMS (Simulation) [g] | 0.109 | 0.221 | 0.143 |
| Relative Error [%] | 5.22 | 5.56 | 12.59 |
| Freq./Band (Exp.) [Hz] | | – | |
| Freq./Band (Sim.) [Hz] | | – | |
| Spectral Correlation (SCC) | 0.958 | 0.863 | 0.955 |
| Disclaimer/Publisher’s Note: The statements, opinions and data contained in all publications are solely those of the individual author(s) and contributor(s) and not of MDPI and/or the editor(s). MDPI and/or the editor(s) disclaim responsibility for any injury to people or property resulting from any ideas, methods, instructions or products referred to in the content. |