Article

Bearing Fault Diagnosis Based on Golden Cosine Scheduler-1DCNN-MLP-Cross-Attention Mechanisms (GCOS-1DCNN-MLP-Cross-Attention)

1
School of Mechanical Engineering, Hebei University of Architecture, Zhangjiakou 075051, China
2
Fuzhou Education Development Research Center, Fuzhou 344000, China
3
Hebei Technology Innovation Center for Intelligent Production Line of Prefabricated Building Components, Zhangjiakou 075051, China
4
State Key Laboratory of Precision Manufacturing for Extreme Service Performance, Light Alloy Research Institute, Central South University, Changsha 410083, China
5
School of Mechanical and Electrical Engineering, Changsha University, Changsha 410199, China
*
Author to whom correspondence should be addressed.
Machines 2025, 13(9), 819; https://doi.org/10.3390/machines13090819
Submission received: 23 July 2025 / Revised: 1 September 2025 / Accepted: 4 September 2025 / Published: 6 September 2025

Abstract

In contemporary industrial machinery, bearings are a vital component, so the ability to diagnose bearing faults is extremely important. Current methodologies face challenges in feature extraction and perform suboptimally in environments with high noise levels. This paper proposes an enhanced, multimodal, feature-fusion-bearing fault diagnosis model. Integrating a 1DCNN-dual MLP framework with an enhanced two-way cross-attention mechanism enables in-depth feature fusion. Firstly, the raw fault time-series data undergo fast Fourier transform (FFT). Then, the original time-series data are input into a multi-layer perceptron (MLP) and a one-dimensional convolutional neural network (1DCNN) model. The frequency-domain data are then entered into the other multi-layer perceptron (MLP) model to extract deep features in both the time and frequency domains. These features are then fed into a serial bidirectional cross-attention mechanism for feature fusion. At the same time, a GCOS learning rate scheduler has been developed to automatically adjust the learning rate. Following fifteen independent experiments on the Case Western Reserve University bearing dataset, the fusion model achieved an average accuracy rate of 99.83%. Even in a high-noise environment (0 dB), the model achieved an accuracy rate of 90.66%, indicating its ability to perform well under such conditions. Its accuracy remains at 86.73%, even under 0 dB noise and variable operating conditions, fully demonstrating its exceptional robustness.

1. Introduction

In the modern industrial system, rotating machinery occupies a pivotal position. As the rolling bearing is a core component, its operating condition plays a decisive role in the system’s overall safety and reliability [1,2]. Condition monitoring and fault diagnosis of rolling bearings have therefore been the focus of research in recent decades [3,4].
Presently, the identification of faults in rolling bearings is predominantly predicated on signal processing methodologies, incorporating machine learning and deep learning algorithms. These methodologies entail the analysis of measured signals within the time domain, frequency domain, and time–frequency domain, thereby enhancing the efficacy of fault diagnosis [5]. As is well documented in the relevant literature, the following tools are commonly used: the fast Fourier transform (FFT) [6], the wavelet packet transform (WPT) [7], empirical mode decomposition (EMD) [8], and the Hilbert–Huang transform (HHT) [9]. However, the employment of signal processing-based methodologies frequently necessitates a sophisticated comprehension of signal analysis, thereby impeding the efficacy of fault diagnosis due to the inevitable presence of human interference.
Machine learning methods have been extensively utilized in the field of bearing fault diagnosis, with prominent examples including support vector machines (SVMs) [10], random forests (RFs) [11], and k-nearest neighbor algorithms (KNNs) [12]. However, it should be noted that conventional machine learning algorithms also impose limitations on the diagnostic capabilities of the model, primarily due to their relatively shallow structure.
In recent years, deep learning algorithms, including convolutional neural networks (CNNs) and multi-layer perceptrons (MLPs), have been extensively employed in the field of bearing fault diagnosis. The 1DCNN has been developed to simplify the structure of CNNs, with the objective of maximizing classification accuracy. The 1DCNN is combined with the self-correcting CEEMD algorithm, as proposed by Gao et al. [13]. This algorithm is an enhanced signal processing algorithm, derived from the CEEMD. This algorithm represents an enhanced signal processing technique, founded upon CEEMD, which incorporates the concepts of fuzzy entropy and kurtosis with a view to attenuating noise and identifying impulse signals, thereby enhancing the accuracy of classification. Guo et al. [14] employed motor speed signals and CNN models for the purpose of diagnosing a range of motor faults. Li et al. [15] combined the 1DCNN with gated recurrent units (GRUs). The 1DCNN has the capacity to automatically extract features from data, whilst GRUs can also perform this function. The GRU compensates for the deficiencies of CNN in processing time-series data, thereby ensuring the comprehensiveness of the extracted features and enhancing the accuracy of circuit fault diagnosis. He et al. [16] integrated 1DCNN with transfer learning (TL) to formulate a 1DCNN-TL model to predict the inlet gas volume fraction of a rotary vane pump, achieving a satisfactory fit. Mystkowski, Arkadiusz et al. [17] applied a multi-layer perceptron (MLP) with two hidden layers to detect faults in rotary weeders, achieving favorable results in both laboratory conditions and real-world tests. Zou, Fengqian et al. [18] proposed a depth-optimized 1DCNN that automatically extracts features from background noise while maintaining high accuracy even in noisy conditions. Xie, Suchao et al. [19] developed a multi-scale multi-layer perceptron (MSMLP) and used complementary integrated empirical modal decomposition (CEEMD) for fault diagnosis. However, the aforementioned studies are limited in scope as they begin from a single scale, such as the time or frequency domain, and the added noise is regular. In contrast, this study aims to address these limitations by expanding the scope to include multiple scales and by introducing a more diverse range of added noises.
In recent years, scholars have utilized fusion models for the purpose of fault diagnosis. For instance, Sinitsin et al. [20] combined CNN and MLP to form a CNN-MLP model for the diagnosis of bearings. Similarly, Song et al. [21] combined CNN and BiLSTM to construct the CNN-BiLSTM algorithm, which they then tuned using the improved PSO algorithm. In a recent study, Bharatheedasan, Kumaran et al. [22] explored the potential of combining a multi-layer perceptron (MLP) with long short-term memory (LSTM) to predict bearing life. Similarly, Wang, Hui et al. [23] investigated the efficacy of integrating multi-head attention with convolutional neural network (CNN) and optimizing the CNN structure using the attention mechanism to enhance the recognition rate of fault diagnosis. Qing et al. [24] embedded Transformer in the dual-head integration algorithm (DHET) and used the dual-input time–frequency architecture to effectively capture the long-range dependencies in the data. Cui, Long et al. [25] introduced the self-attention mechanism into the bearing fault diagnosis. The study proposed a self-attention-based signal converter, which was able to learn the feature extraction capability from a large amount of unlabeled data by using a comparison learning method with only positive samples. In addition, Peng et al. [26] embedded the attention mechanism in a traditional residual network to evaluate the bearing state.
Notably, these studies were conducted in a laboratory setting with experimental conditions that excluded noise effects. The studies mainly focus on attention mechanisms within a single scale. In real industrial scenarios, the models may be disturbed by irregular random noise, which may significantly limit their effectiveness in applications. Therefore, the method proposed in this paper can maintain high accuracy under laboratory conditions and effectively deal with strong noise. Therefore, this method has the potential to achieve good performance in the face of a large amount of noise while maintaining high accuracy in the laboratory environment. The main contributions of this paper include the following:
  • The innovation of this work lies not in the individual components but in the integration strategy of dual MLP and 1DCNN and application scenarios under high noise. Our dual MLP extracts high- and low-frequency information from the data, solving the problem that the current Transformer-based models have a weak ability to capture local minute details and are vulnerable to noise interference at low signal-to-noise ratios.
  • The enhanced 1DCNN+dual MLP multimodal feature extraction structure has been designed to extract time- and frequency-domain features from the original data in depth.
  • A refined cross-attention mechanism is utilized to comprehensively capture signal characteristics from both the temporal and frequency domains. This approach demonstrates exceptional performance under diverse noise conditions.
  • The development of the GCOS learning rate scheduler constitutes a significant advancement in the field of automatic learning rate adjustment. This tool has been designed to address the challenge of manually selecting the learning rate by automatically adjusting it.
  • The experimental verification of the model’s performance was conducted in two distinct settings: the laboratory environment and a high-noise environment.

2. Materials and Methods

2.1. 1DCNN-MLP Parallel Two-Stream Cross-Attention Fusion Mechanism

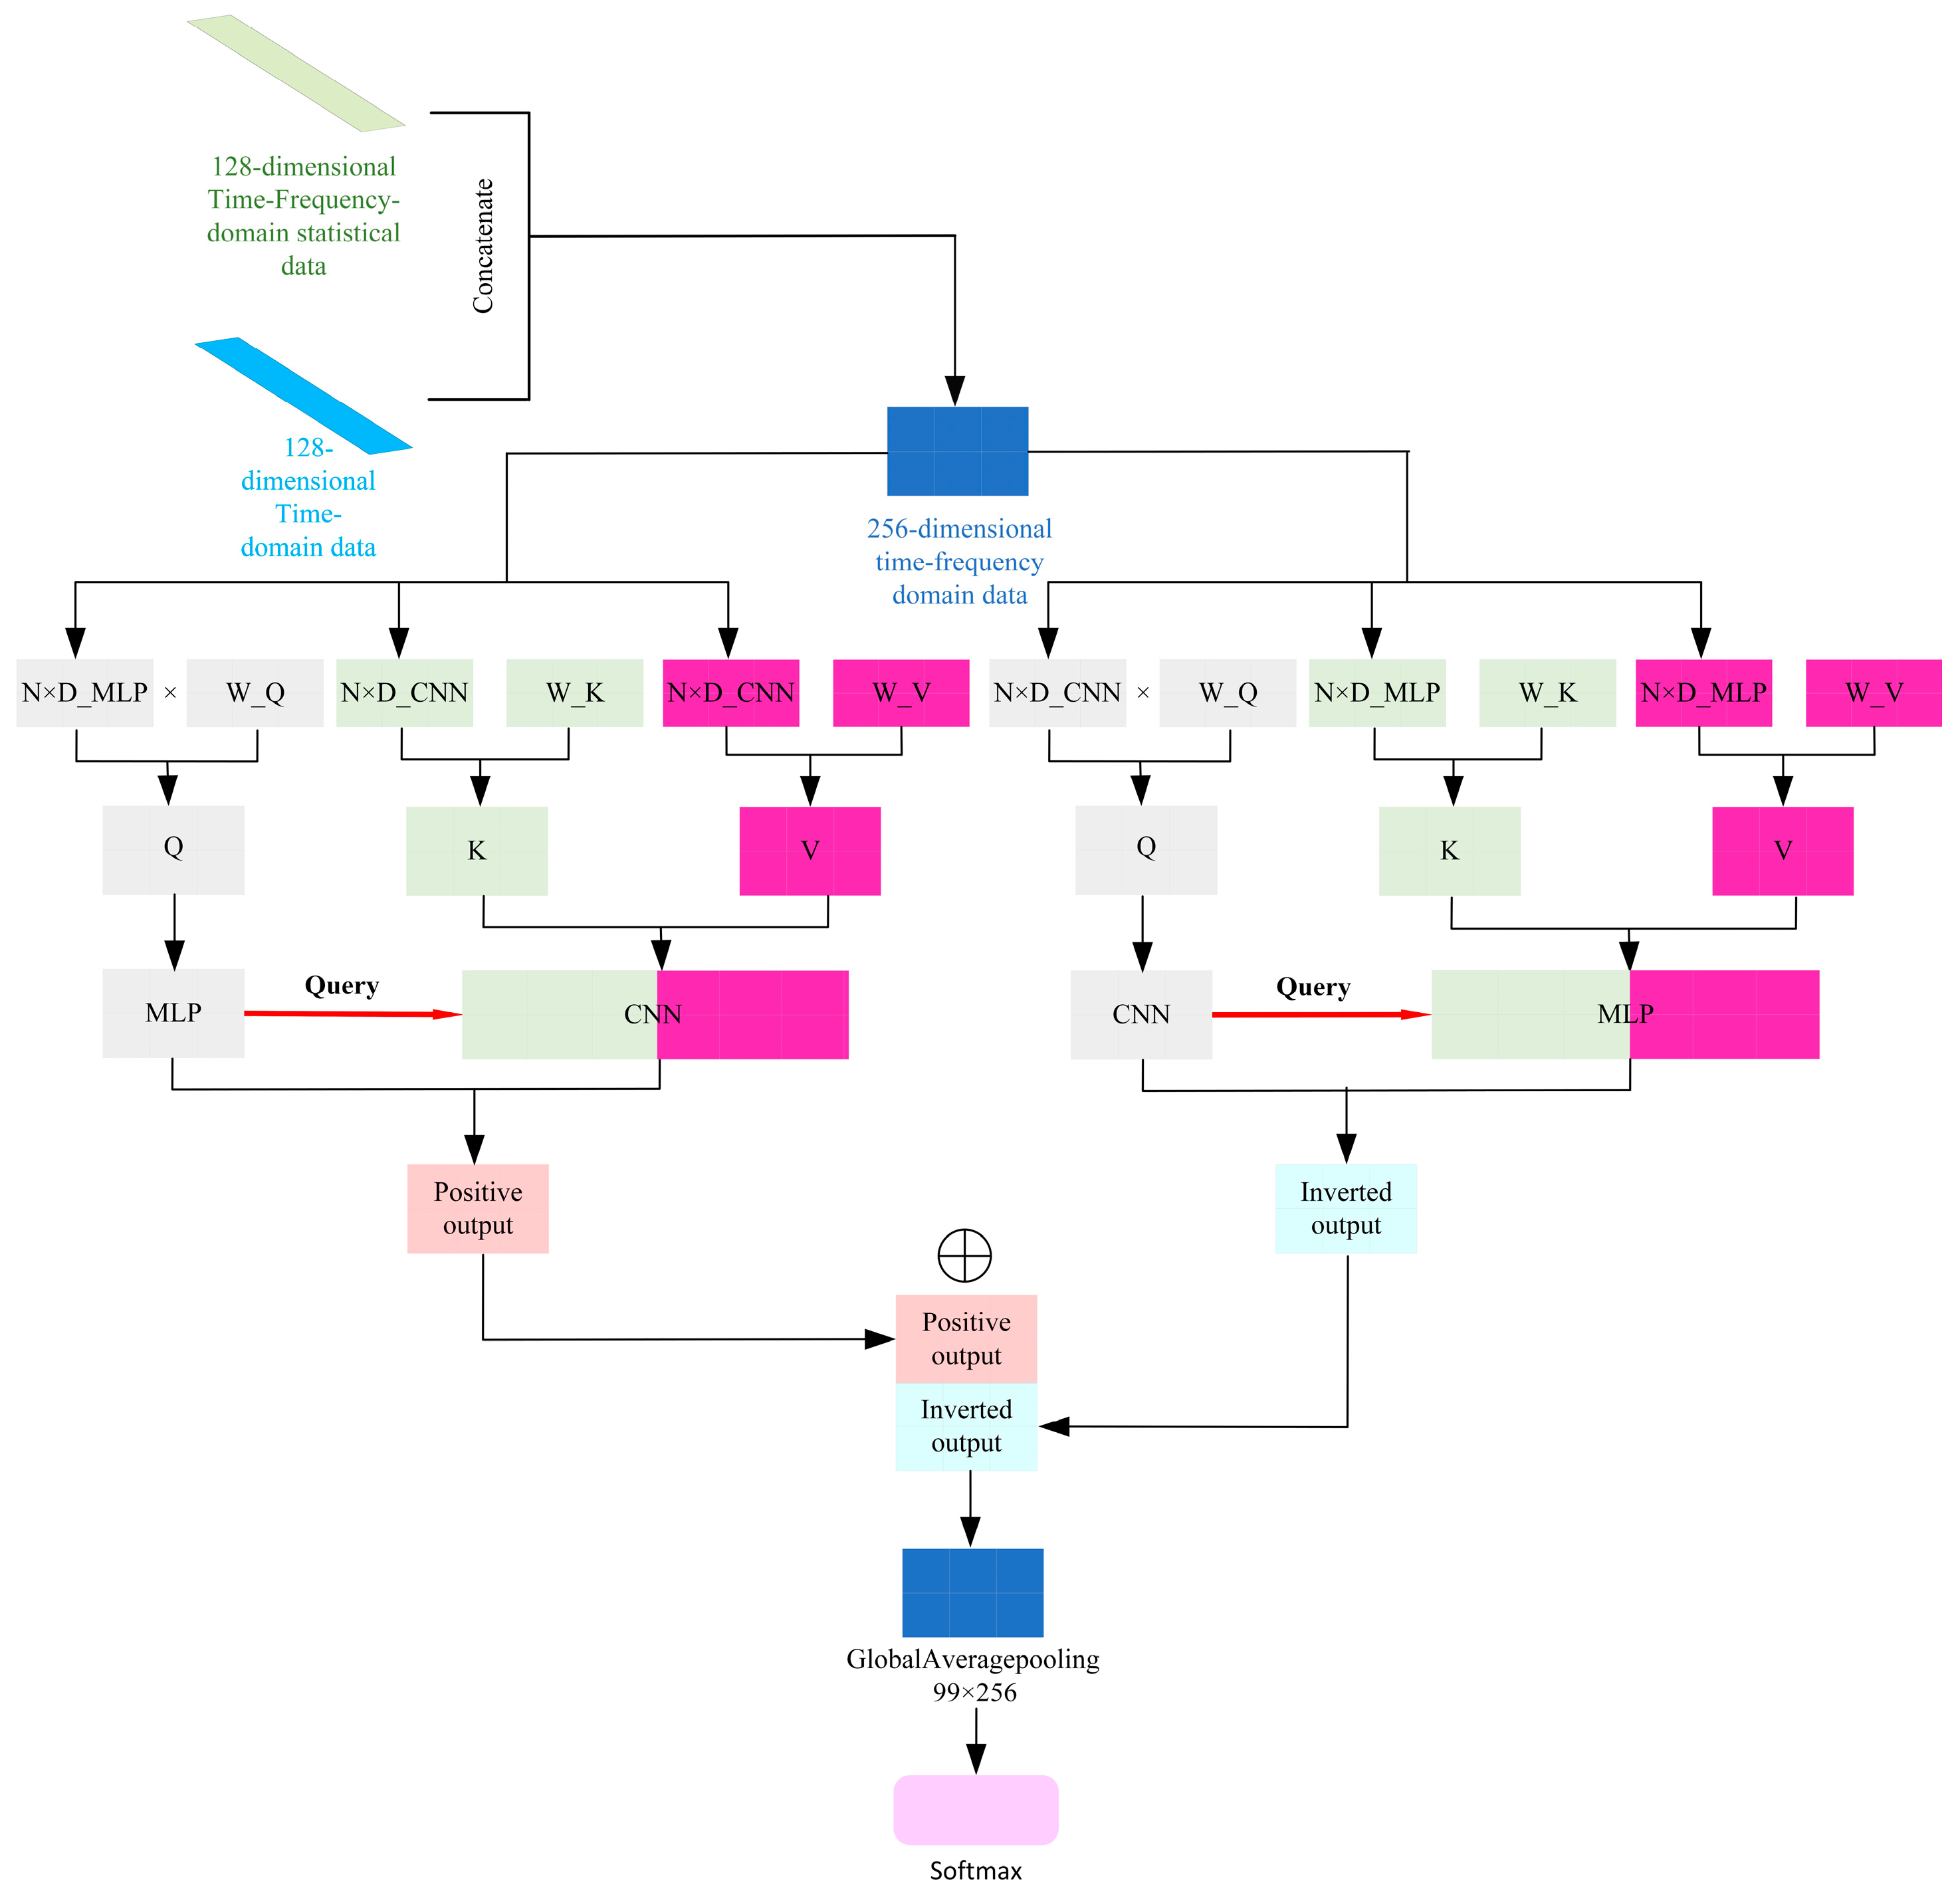
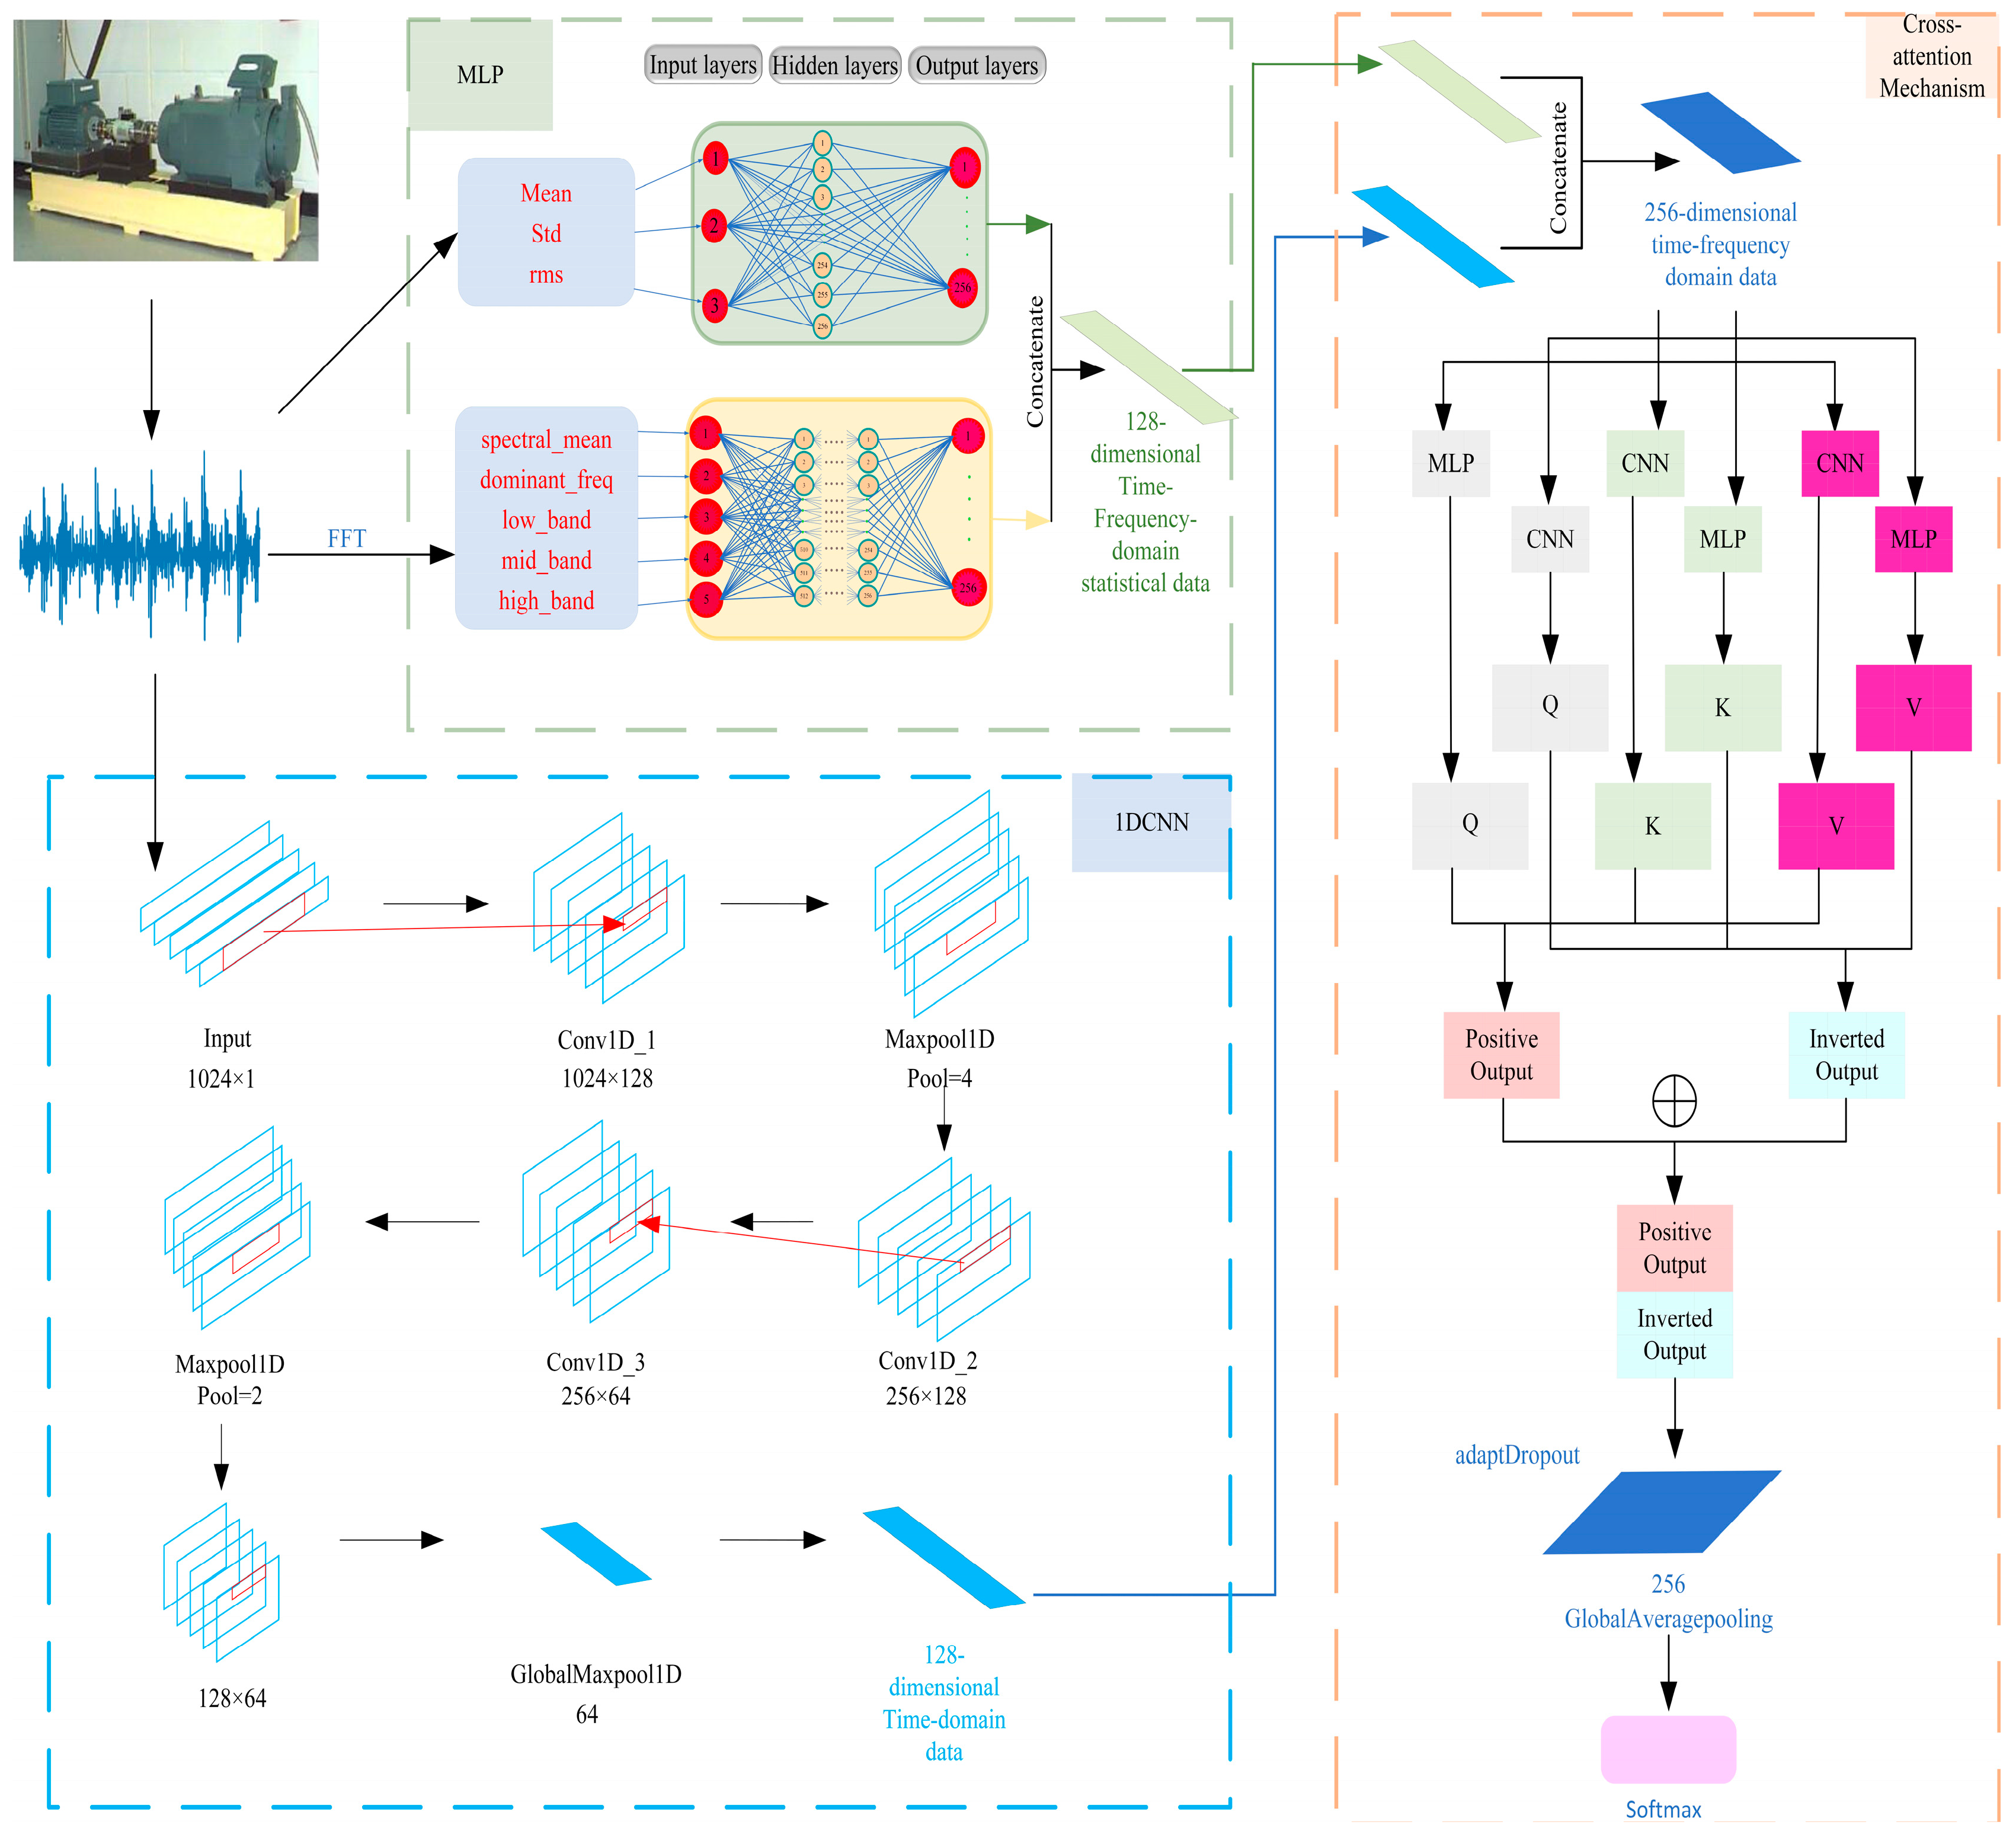
The proposed model architecture for the 1DCNN-MLP parallel dual-stream multi-scale feature fusion mechanism consists of a parallel 1DCNN, dual multi-layer perceptrons (MLPs), and serial cross-attention mechanisms. Initially, the timing data collected by the sensors are subjected to FFT. Thereafter, the timing data and the frequency-domain data after FFT are fed into the dual MLPs. Subsequently, the original timing data are fed into the 1DCNN for feature extraction. Then, the statistical features extracted by the dual MLP are aligned with the time-domain features extracted by 1DCNN and then sent to the cross-attention mechanism for deep feature fusion. Finally, forward and backward cross-attention are combined to enable fault diagnosis. The structure of the 1DCNN-MLP-Cross-Attention mechanism is illustrated in Figure 1 below.

2.1.1. Two-Branch Multi-Scale Feature Fusion MLP

The present paper makes an innovative adoption of the dual MLP structure, whereby the dual-branch MLP structure is able to achieve independent inputs in the time domain and frequency domain. The inputs in the time domain are characterized by three elements: the mean, the standard deviation, and the root-mean-square (RMS) value. The mean represents the DC component of the signal, the average value of the vibration signal of a healthy bearing is usually close to zero, and the asymmetric shock caused by the fault will cause the mean to be offset; the standard deviation quantifies the fluctuation strength of the signal, the periodic shock when the bearing fails will significantly increase the standard deviation; and the root-mean-square value reflects the average energy of the signal. The frequency-domain inputs are the spectral mean, the dominant frequency position, and the superposition of the high–middle- and low-frequency energies extracted after the conversion of the time domain to the frequency domain by the FFT. The spectral mean is the standard of the frequency-domain energy concentration, the spectral energy distribution of healthy bearings is uniform, the energy is aggregated to the characteristic frequency during the fault, the main frequency position directly corresponds to the fault characteristic frequency, the high-frequency energy reflects the high-frequency resonance component of the early fault, the intermediate frequency energy covers the typical resonance band of the bearing fault, and the low-frequency energy captures the rotational fundamental frequency of the bearing and the low-frequency harmonics of the fault. The detailed parameters of the time- and frequency-domain MLPs are given in Table 1 where the mean extraction equation is as follows:
u = 1 N n = 0 N 1 x n
Standard deviation extraction equation:
σ = 1 N n = 0 N 1 x [ n ] u 2
Root-mean-square value extraction equation:
x r m s = 1 N n = 0 N 1 x n 2
The FFT converts the time domain to the frequency-domain equation:
X k = n = 0 N 1 x n × e j 2 π k n N , k = 0 , 1 , , N 1
Spectral amplitude calculation equation:
A m p l i t u d e [ k ] = x [ k ] , k = 0 , 1 , , N / 2 1
Frequency-domain mean calculation equation:
u f r e q = 1 n Σ k = 0 n 1 A m p l i t u d e [ k ] , M = N / 2
Primary frequency position equation:
a r g m a x ( m a g n i t u d e ) × Δ f
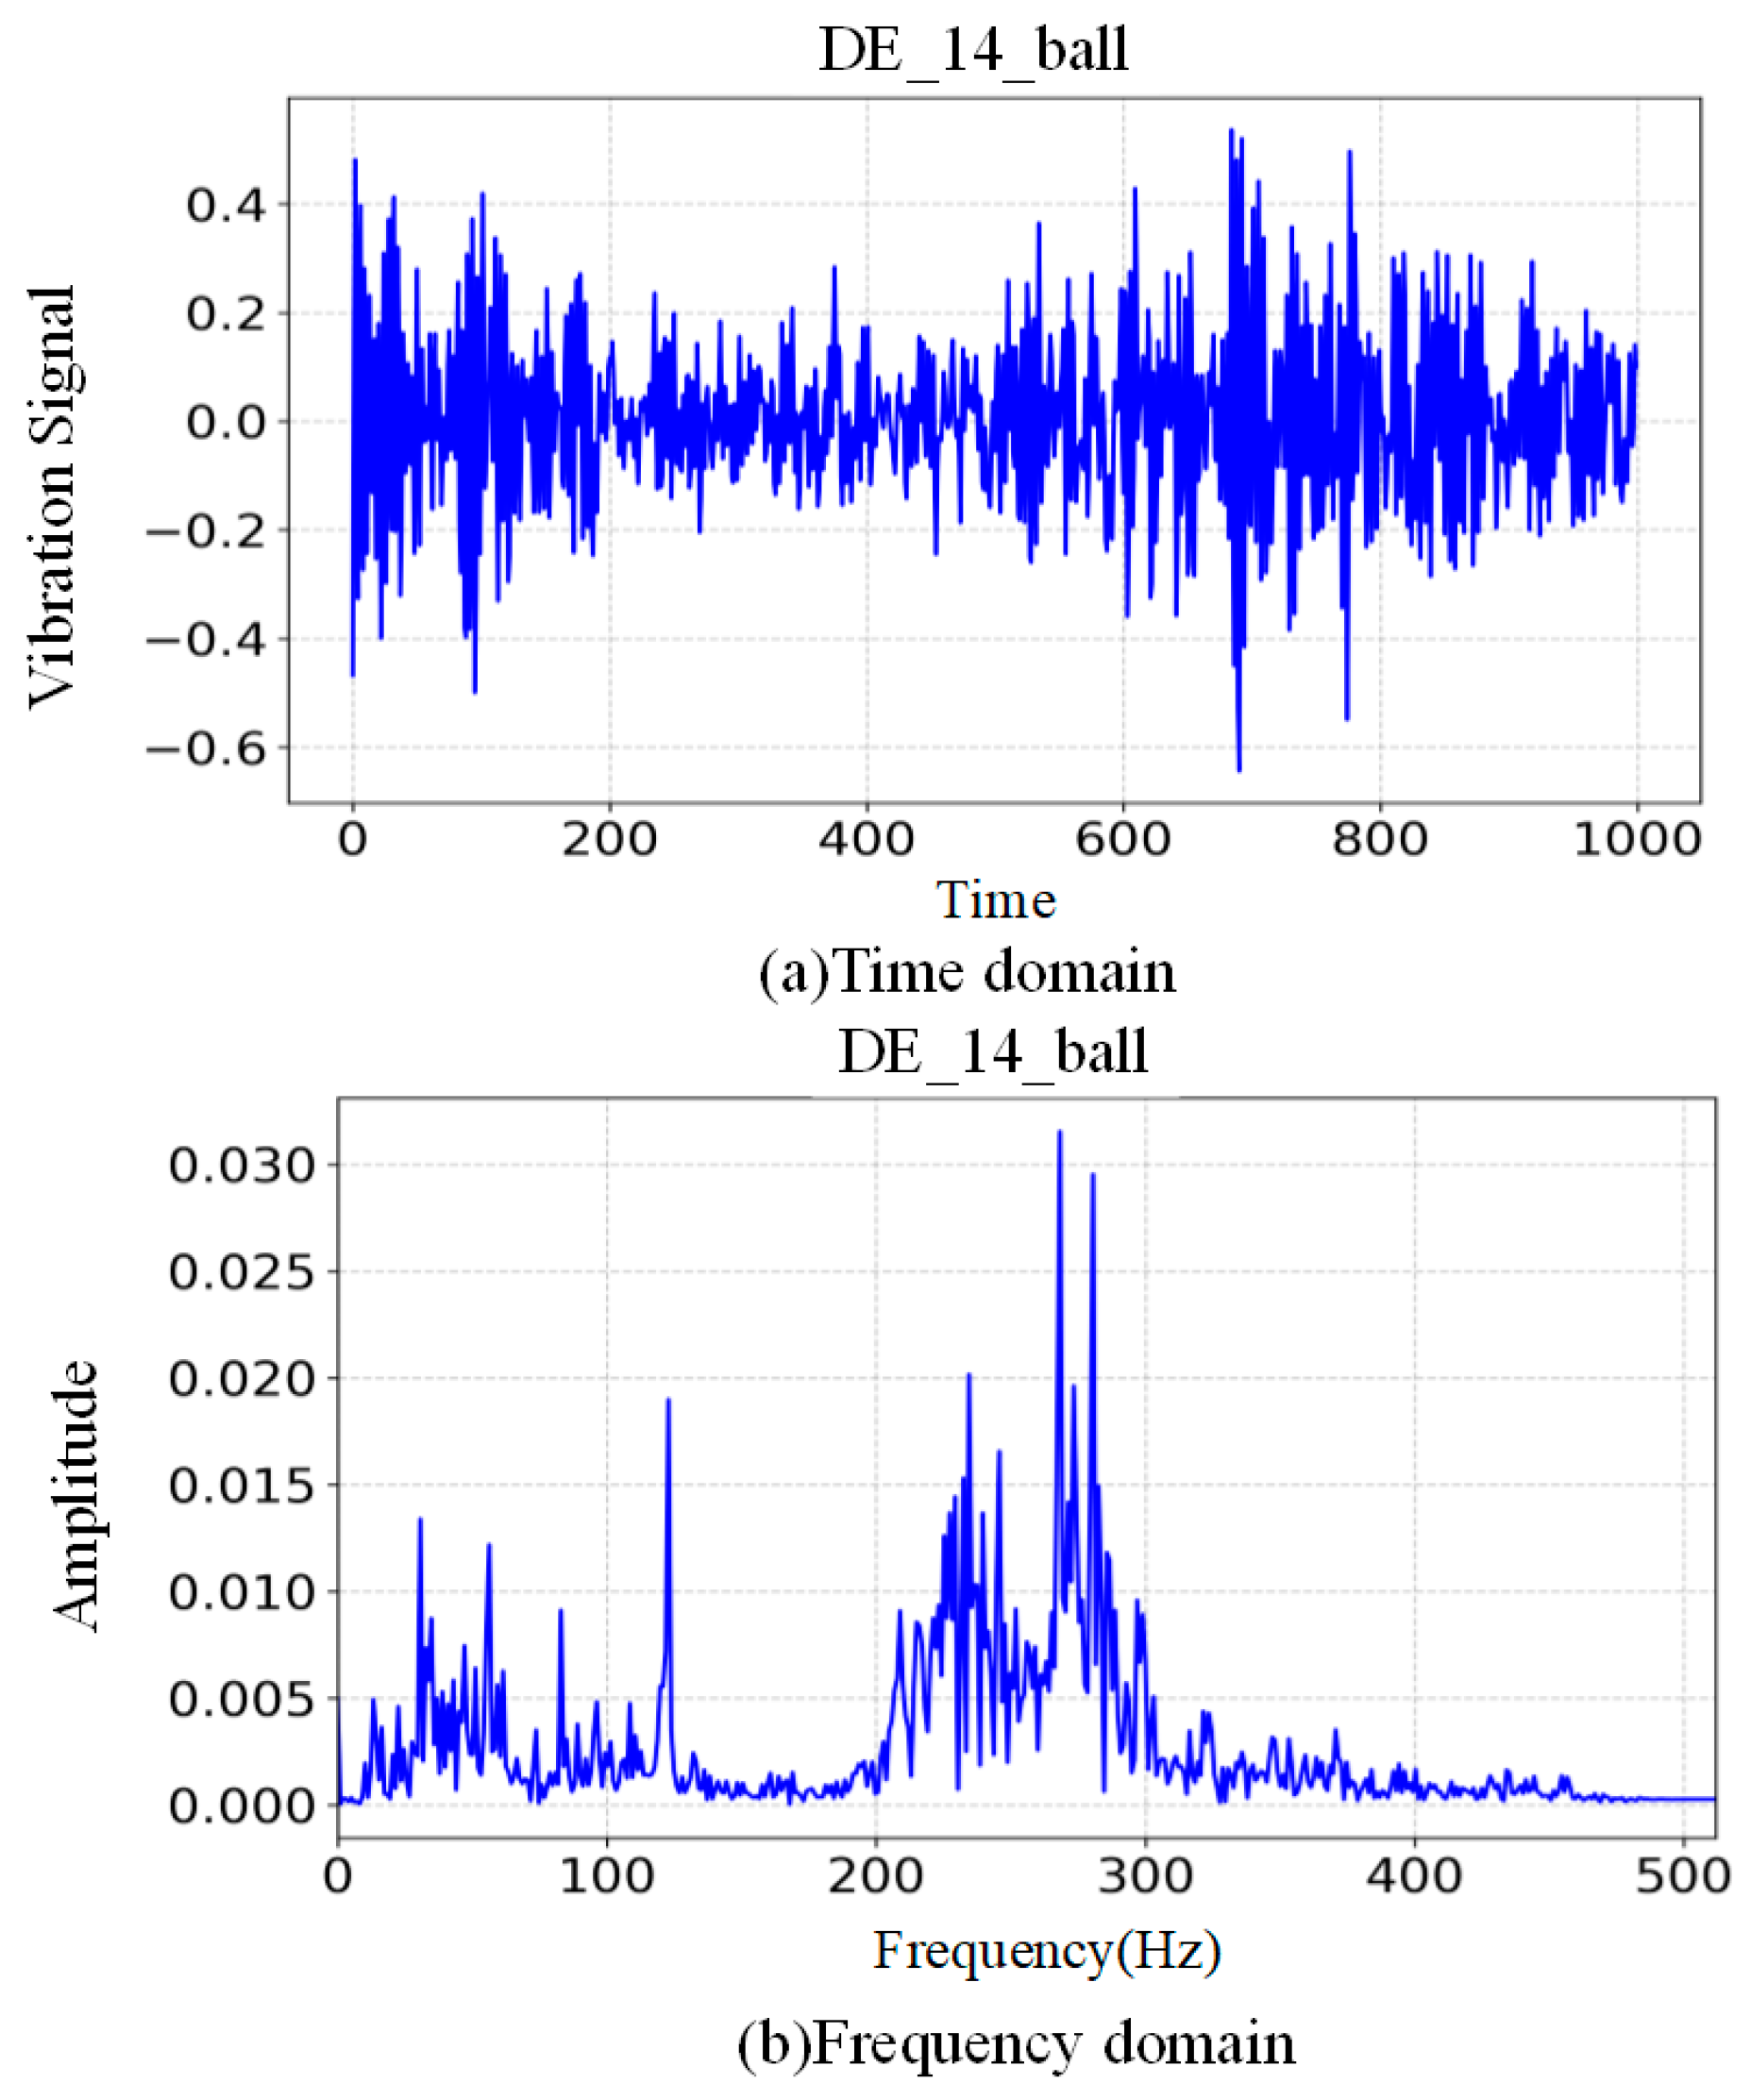
Initially, the three most significant statistics are extracted from the original time-domain data. The mean value reflects the average energy level of the signal, the standard deviation reflects the intensity of the fluctuation of the signal, and the root-mean-square (RMS) value reflects that the effective energy of the signal is directly related to the vibration energy. It is evident that these three statistics have the capacity to reflect the time-domain characteristics of the signal from a global point of view. The three time-domain features are entered into the time-domain multi-layer perceptron (MLP), while the fast Fourier transform (FFT) is used to convert the time-domain signal into a frequency-domain signal. This process enables the extraction of the mean value of the spectral components and the position of the dominant frequency, as well as the superposition of the high–middle- and low-frequency energies. Subsequently, the five frequency-domain features are entered into the frequency-domain MLP, as illustrated in Figure 2. The time-domain plot is represented by Figure 2a, whilst the frequency-domain plot is represented by Figure 2b. Time-domain and frequency-domain diagrams are illustrated using a 12 k 0.014-inch rolling ball fault as an example.
As illustrated in the frequency-domain diagram, under standard operating conditions, the frequency domain of the bearing is predominantly concentrated within the 0–100 Hz range. However, under various types of fault conditions, the energy can be approximately divided into three distinct categories: low frequency (0–10 Hz), middle frequency (10–100 Hz), and high frequency (100–512 Hz). The high-, middle-, and low-frequency energy acquisition is based on this division. The following figure illustrates this. The third energy superposition diagram is representative of the high-, middle-, and low-frequency energy of the MLP. The superposition of the input diagram is illustrated by the example of a 12 k 0.014-inch rolling ball fault.
As demonstrated in Figure 3, the energy exhibited during the fault is predominantly concentrated within the high-frequency range of 100–512 Hz. It has been demonstrated that low-frequency energy (0–10 Hz) and mid-frequency energy (10–100 Hz) are significantly diminished in comparison to high-frequency energy.
The number of neurons in the first fully connected layer of the frequency-domain MLP is 512, and the process follows Equation (8):
h 1 = S w i s h ( X W 1 + b 1 )
The weight matrix W1, the bias vector b1, and the activation function Swish are defined as follows:
S w i s h ( x ) = x σ ( β x ) ( β = 1.0 )
In addition, this layer incorporates L2 regularization, a technique designed to limit the number of weight matrix paradigms (W1) and thereby mitigate the risk of overfitting.
The subsequent layer is the batch normalization layer, which contains 256 neurons. This layer normalizes each feature dimension independently using the following equation:
h 1 = h 1 u σ 2 + ϵ
In this context, “ u ” and “ ϵ ” are used to denote the mean and standard deviation, respectively, of the current batch.
The dropout technique is used to randomly mask a portion of the neurons during training. In this layer, 40% of the neurons are masked with the aim of forcing the network to learn redundant features and improve the generalization of the model
The multi-layer perceptron (MLP) in the time domain contains a fully connected layer consisting of 256 neurons with the dropout rate set to 0.3. The fully connected layer applies L2 regularization designed to prevent overfitting. After this layer, the subsequent output layer also produces 256-dimensional results
Finally, feature splicing combines the outputs of the time and frequency domains. This method offers good feature complementarity and preserves complete feature information. The feature dimensions are projected to 128 dimensions in order to maintain alignment with the 1DCNN.
A two-branch MLP can process features in the time and frequency domains separately, making the model robust in the face of noise.

2.1.2. Enhancement of 1DCNN

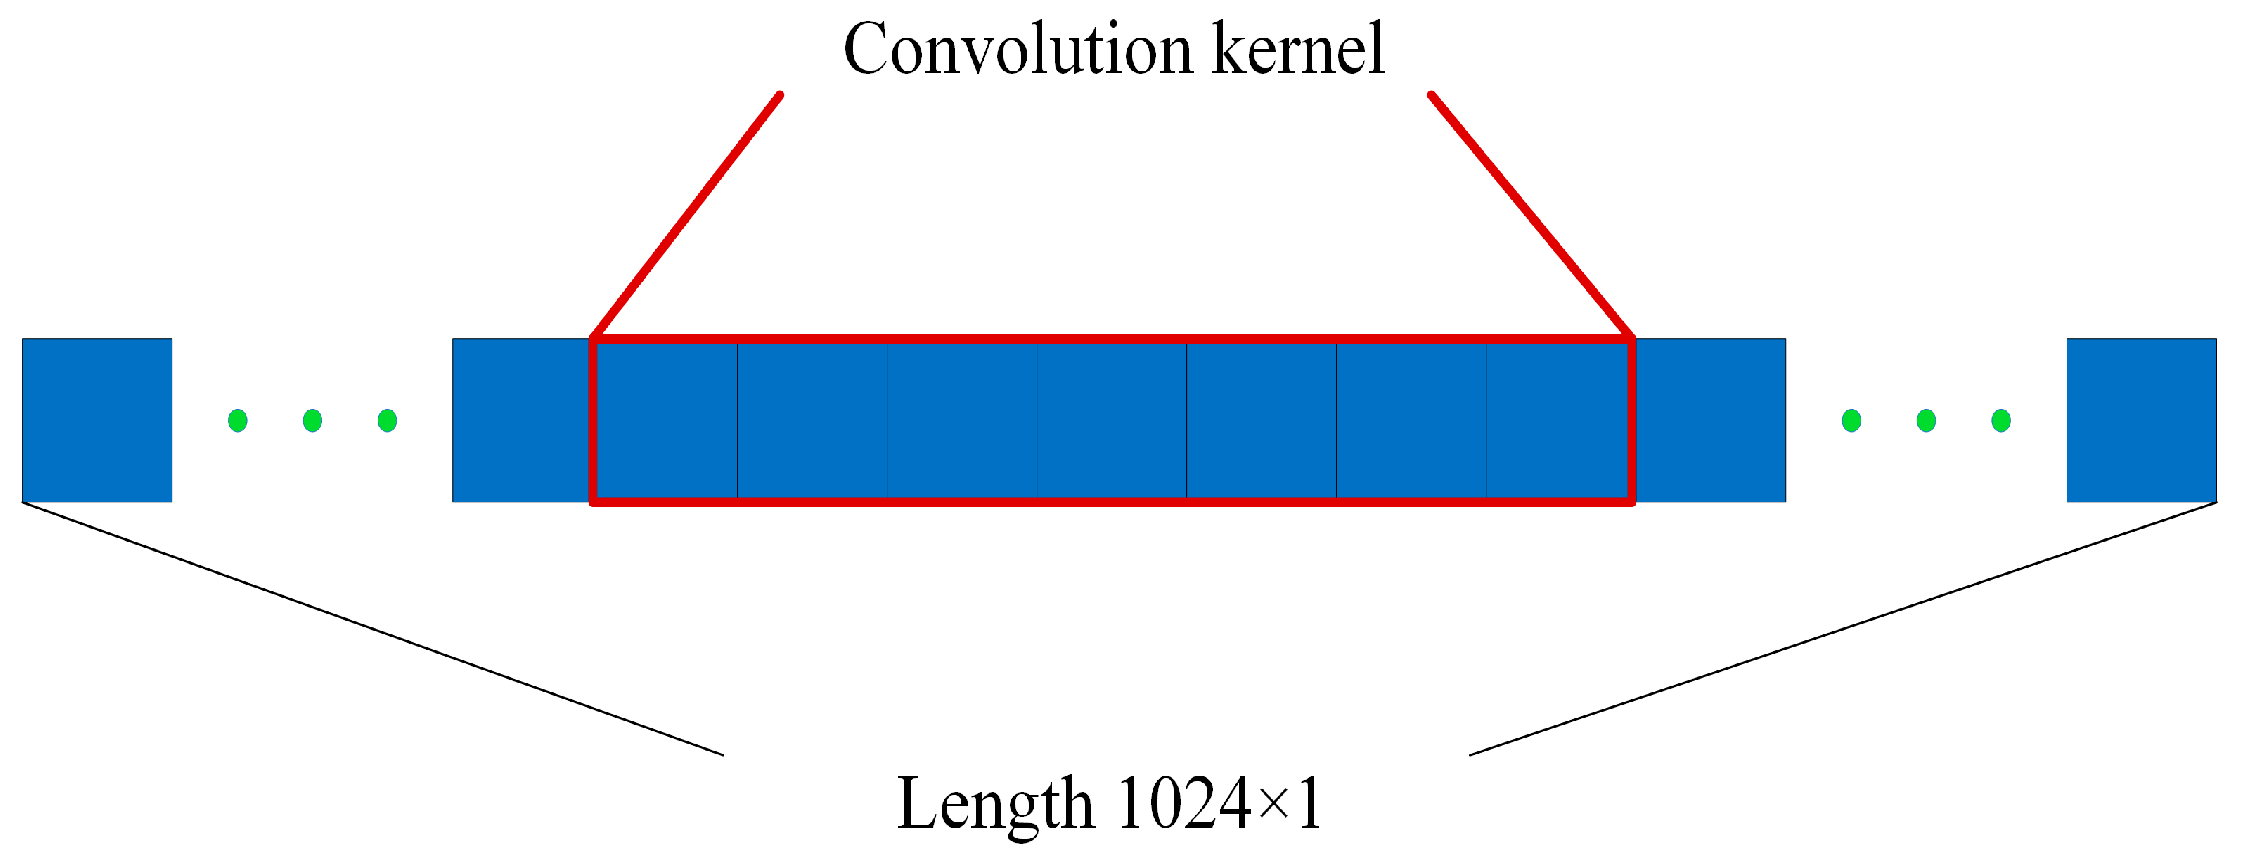
As the original vibration signal obtained from the bearing failure is one-dimensional time-series data, continuous downsampling enables 1DCNN to extract the time-series features from the points. The first layer of 1DCNN is Conv1D_1, with 128 filters and a convolution kernel size of 7. This sliding convolution uses a window of 7 time points, as illustrated in Figure 4 below.
The activation function is Swish, and each filter produces one channel. Therefore, the input shape is (1024, 1), and the output shape after Conv1D is (1024, 128). The first layer uses 128 channels for base feature extraction. The layer between the input and the output follows the following equation:
Z ( 1 ) [ t , c ] = k = 0 6 X [ t + k 3 , : ] W ( 1 ) [ k , c ] + b ( 1 ) [ c ] A ( 1 ) = swish ( Z ( 1 ) )
The input X ∈ (R1024×1), convolution kernel W(1) ∈ (R7×1×128), bias b(1) ∈ (R128), and output A(1) ∈ (R1024×128) are computed independently for each output channel, followed by weighted summation through a sliding window.
The subsequent layer is the first pooling layer, which is characterized by a pooling window of 4 and a step size of 4, as illustrated in Figure 5 below.
After the first pooling layer, a 4-fold downsampling operation was performed to reduce the temporal resolution to 256 points while preserving key features.
The second convolutional layer (Conv1D_2) has 128 channels and a convolution kernel size of 5. Sliding convolution uses a smaller 5-point window, which provides more detail than the 7-point window of the first layer. After this layer, the timing length remains at 256 and the number of channels remains at 128. The output shape is (256, 128). The purpose of the second convolutional layer is to obtain finer, more localized features. This is followed by the third convolutional layer (Conv1D_3), where the channels are compressed further to 64. The purpose of the 5-size convolution kernel is to prevent overfitting by balancing the ability to capture input information with the amount of computation. The output shape is (256, 64), followed by a second pooling layer. The pooling window and step size are changed to 2 to further compress the timing resolution to 128 points and downsample by a factor of two. The output shape of this layer is therefore (128, 64). Finally, the GlobalMaxPool1D global pooling layer takes the maximum over the full timestep for each channel. This reduces (128, 64) to (64), i.e., the maximum for each channel forms a vector of length 64. This layer follows Equation (12):
P = [ t max A ( 2 ) [ t , 1 ] , t max A ( 2 ) [ t , 2 ] , , t max A ( 2 ) [ t , 64 ] ]
The value of p is R64. Finally, there is the fully connected layer dense with output shape (128). The formula for this layer is the following:
Z ( 3 ) = P W ( 3 ) + b ( 3 ) A ( 3 ) = swish ( Z ( 3 ) )
This layer maps 64 dimensions onto 128 dimensions, thereby improving the model’s nonlinear representation. The detailed parameters of the enhanced 1DCNN are given in Table 2.

2.1.3. The Integration of Two-Way Cross-Attention Mechanisms

In order to capture signal features more deeply, simply combining the two models, or using either the traditional or attention mechanisms, is not enough. Consequently, this paper introduces an enhanced two-way cross-attention fusion mechanism, as illustrated in Figure 6 below.
Initially, the attention mechanism was applied to the field of machine translation [27]. In contrast, the traditional attention mechanism only uses, for example, MLP features as the query and 1DCNN as the key and value. The features extracted by the two models are unidirectional, i.e., the multi-layer perceptron (MLP) is employed to calculate the attention weights, thereby integrating the features of the 1D convolutional neural network (CNN). For the deep extraction of features, this paper uses a bidirectional cross-attention mechanism instead of the traditional attention mechanism. In the context of the mechanism, the two-way cross-attention mechanism is subdivided into forward attention and reverse attention. In the forward attention configuration, an MLP is employed as the query, a 1DCNN is utilized as the key and value, and the MLP features are permitted to fuse the CNN features. Conversely, in the reverse attention configuration, a 1DCNN is used as the query, an MLP is employed as the key and value, and the 1DCNN features are permitted to fuse the MLP features. The forward and reverse attention layers each have Q, K, and V dimensions of 128. There are four attention heads, each with dimensions of 64 and a scaling factor of 8. Among them, positive attention is the following:
Attn forward = Softmax M C T d k C
Reverse attention is the following:
Attn backward = Softmax C M T d k M
To illustrate this, we may consider forward attention as a case study. The initial step in this process is a bidirectional projection:
Q = W q × x + b q K = W k × Y + b k V = Wv × Y + bv
The second step is to scale the dot product attention:
Attention ( Q , K , V ) = softmax ( QK T / d k ) V
where the input QKᵀ is the attention score. d k is the scaling factor, which aims to prevent the SoftMax gradient vanishing problem caused by too large dot product.
The third step focuses on designing the multi-head attention mechanism. This consists of four independent attention sub-modules that employ the scaled dot-product attention operation to integrate the four pieces of output information by splicing. This realizes the goal of feature fusion.
MultiHead ( Q , K , V ) = Concat ( head 1 , , head 4 ) W O
The action mode of two-way attention weight includes the weight generation mechanism and the synergistic effect of weights, in which the weight generation mechanism is divided into forward weight and reverse weight, and the forward weight is as follows:
W forward = Softmax ( M C T )
Positive weights reflect the attention of MLP statistics to the local fragments of the waveform.
The reverse weights are the following:
W backward = Softmax ( C M T )
The sensitivity is of the reverse weight response waveform to a particular statistic.
The dominant feature of the positive synergy effect of the weight is the statistical feature, which is to extract the source of statistics from the waveform, and the dominant feature of the reverse synergy effect is the waveform feature, which is to screen the statistics that support the waveform mode. The bidirectional weights form closed-loop feedback, so that the statistical features and waveform features are mutually corrected.
Unlike the ordinary attention mechanism, which can only carry out unidirectional transmission of feature information, the bidirectional cross-attention mechanism breaks the unidirectionality of the ordinary attention mechanism through bidirectional information interaction. Through this mechanism, the MLP and the 1DCNN can pay attention to each other’s features, enhancing the depth of feature extraction in the time–frequency domain.

2.2. GCOS Golden Cosine Learning Rate Scheduler

In order to adapt the model to complex classification tasks, this paper uses a golden cosine learning rate scheduling strategy to dynamically adjust the learning rate. The golden cosine learning rate scheduler quickly explores the parameter space in the early stage of training to shorten the training cycle, gradually decays in the middle stage to avoid jumping out of the local optimum, and makes the parameters more accurate in the later stage. Specifically, the learning rate is calculated by the following formula:
η ( t ) = η min + 1 2 ( η max η min ) 1 + cos π t T ϕ 1 e λ t
Values ηmin and ηmax represent the minimum and maximum learning rates, respectively, i.e., the boundary conditions. “T” denotes the iteration count and “Φ” corresponds to the golden ratio of 1.618, which is used for dynamically adjusting the cycle phase. λ is the exponential decay factor that controls the long-term decay of the learning rate. t indicates the current training step count. GCOS strikes a balance between convergence speed and stability by employing golden ratio phase modulation and dynamic cycle restart. This makes it particularly well suited to large-scale deep learning tasks. Its mathematical design combines the smoothness of cosine annealing with the advantages of periodic restarting associated with SGDR, while optimizing long-term training performance through an exponential decay term.

3. Experimentation and Analysis

3.1. Experimental Data

The experimental data were obtained from the Case Western Reserve University (CWRU) rolling bearing dataset, which is a widely used dataset. The experimental platform, illustrated in Figure 7 below, comprises a 2 hp (1.5 kW) electric motor (positioned on the left), a torque transducer/translator (center), a power meter (right), and electronic controllers (not depicted in the figure). The motor has four operating states: 0 HP, 1 HP, 2 HP, and 3 HP; 1 HP = 0.7457 kW. The function of the test bearing is to provide support for the motor shaft. The test bearings provide support for the motor shaft and are categorized into drive-side bearings and fan-side bearings. It has been determined that these bearings sustain damage at a specific point during the EDM machining process.
There are three types of bearing failure: inner ring (IR) failure, outer ring (OR) failure, and rolling element (ball) failure. There are four damage diameters, classified as follows: 0.007 inch (7 mils, 0.1778 mm), 0.014 inch (14 mils, 0.3556 mm), 0.021 inch (21 mils, 0.5334 mm), and 0.028 inch (28 mils, 1.016 mm) (1 inch = 25.4 mm). The typical characteristic points of damage to the bearing outer ring are located at 3, 6, and 12 o’clock on the dial. To monitor the failure state at the motor fan end and the drive end bearing seat, two acceleration sensors were installed in the relevant positions to collect vibration and acceleration data. A torque sensor/decoder was used to synchronize the measurement of power output and speed parameters, achieving the goal of comprehensive diagnostics. This study involved designing ten sets of experimental data to cover faulty inner rings, rolling elements, and outer rings at the 6 o’clock position (corresponding to working condition parameters of 0.007, 0.014, and 0.021). At the same time, a set of fault-free, normal operation data was introduced as a reference benchmark. The vibration signal was acquired by a 16-channel data logger, and the vibration signal sampling frequency was 12 kHz. A dataset is constructed using sliding window technology with the following parameters: window size: 1024 points; hop size: 1024 points; overlap: 0 points, with each bearing condition type containing 99 samples. Ultimately, the dataset was divided into three parts: a training set, a validation set, and a test set. The ratio of the training set, validation set, and test set is divided into 6:2:2, with the sample sizes for each group being 60, 19, and 20, respectively. The detailed fault classification information is shown in Table 3 below. To validate the model’s performance in noisy environments, Gaussian noise is added to the original experimental data to simulate noise. This can be applied to each point of the original data over a wide range, which more closely resembles the noise generated by the bearing under actual operating conditions. The probability density function of the Gaussian noise is as follows:
f ( x ) = 1 σ 2 π exp ( x μ ) 2 2 σ 2
where “μ” is the mean, which determines the center of the noise, and “ σ ” is the standard deviation, which determines the spread of the noise.

3.2. Experimentation and Validation

3.2.1. Ablation Experiments on the Original Dataset

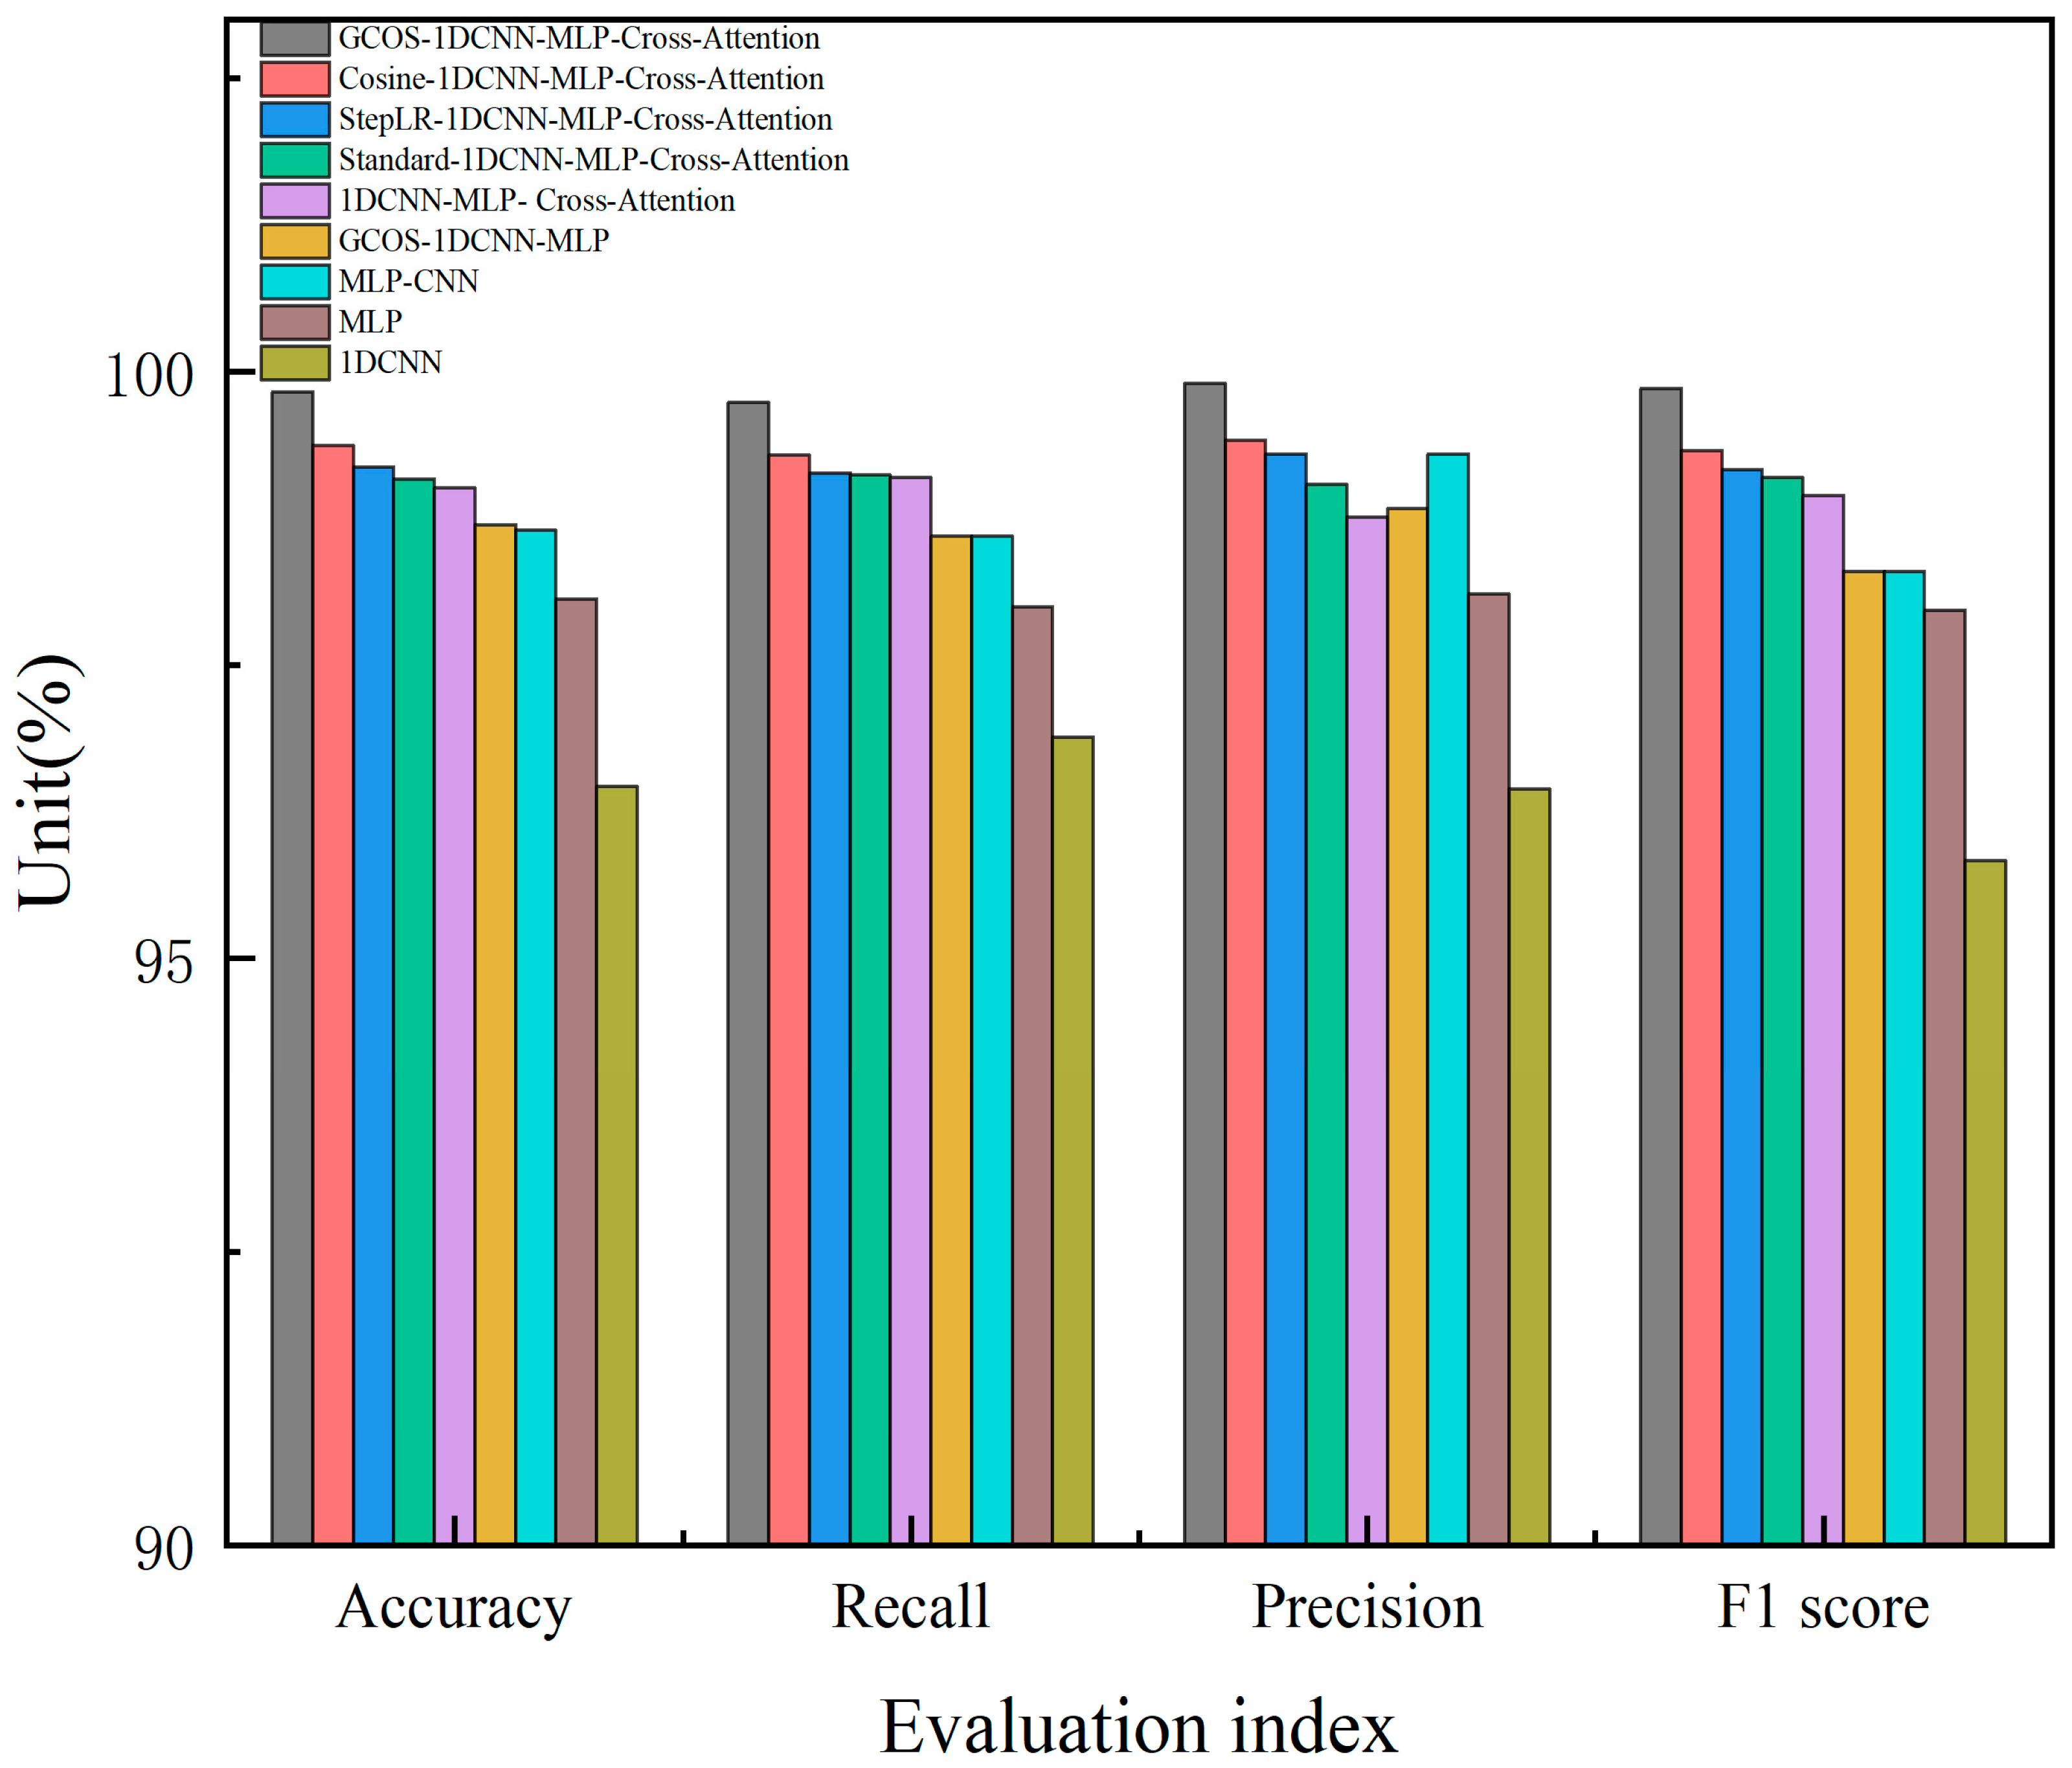
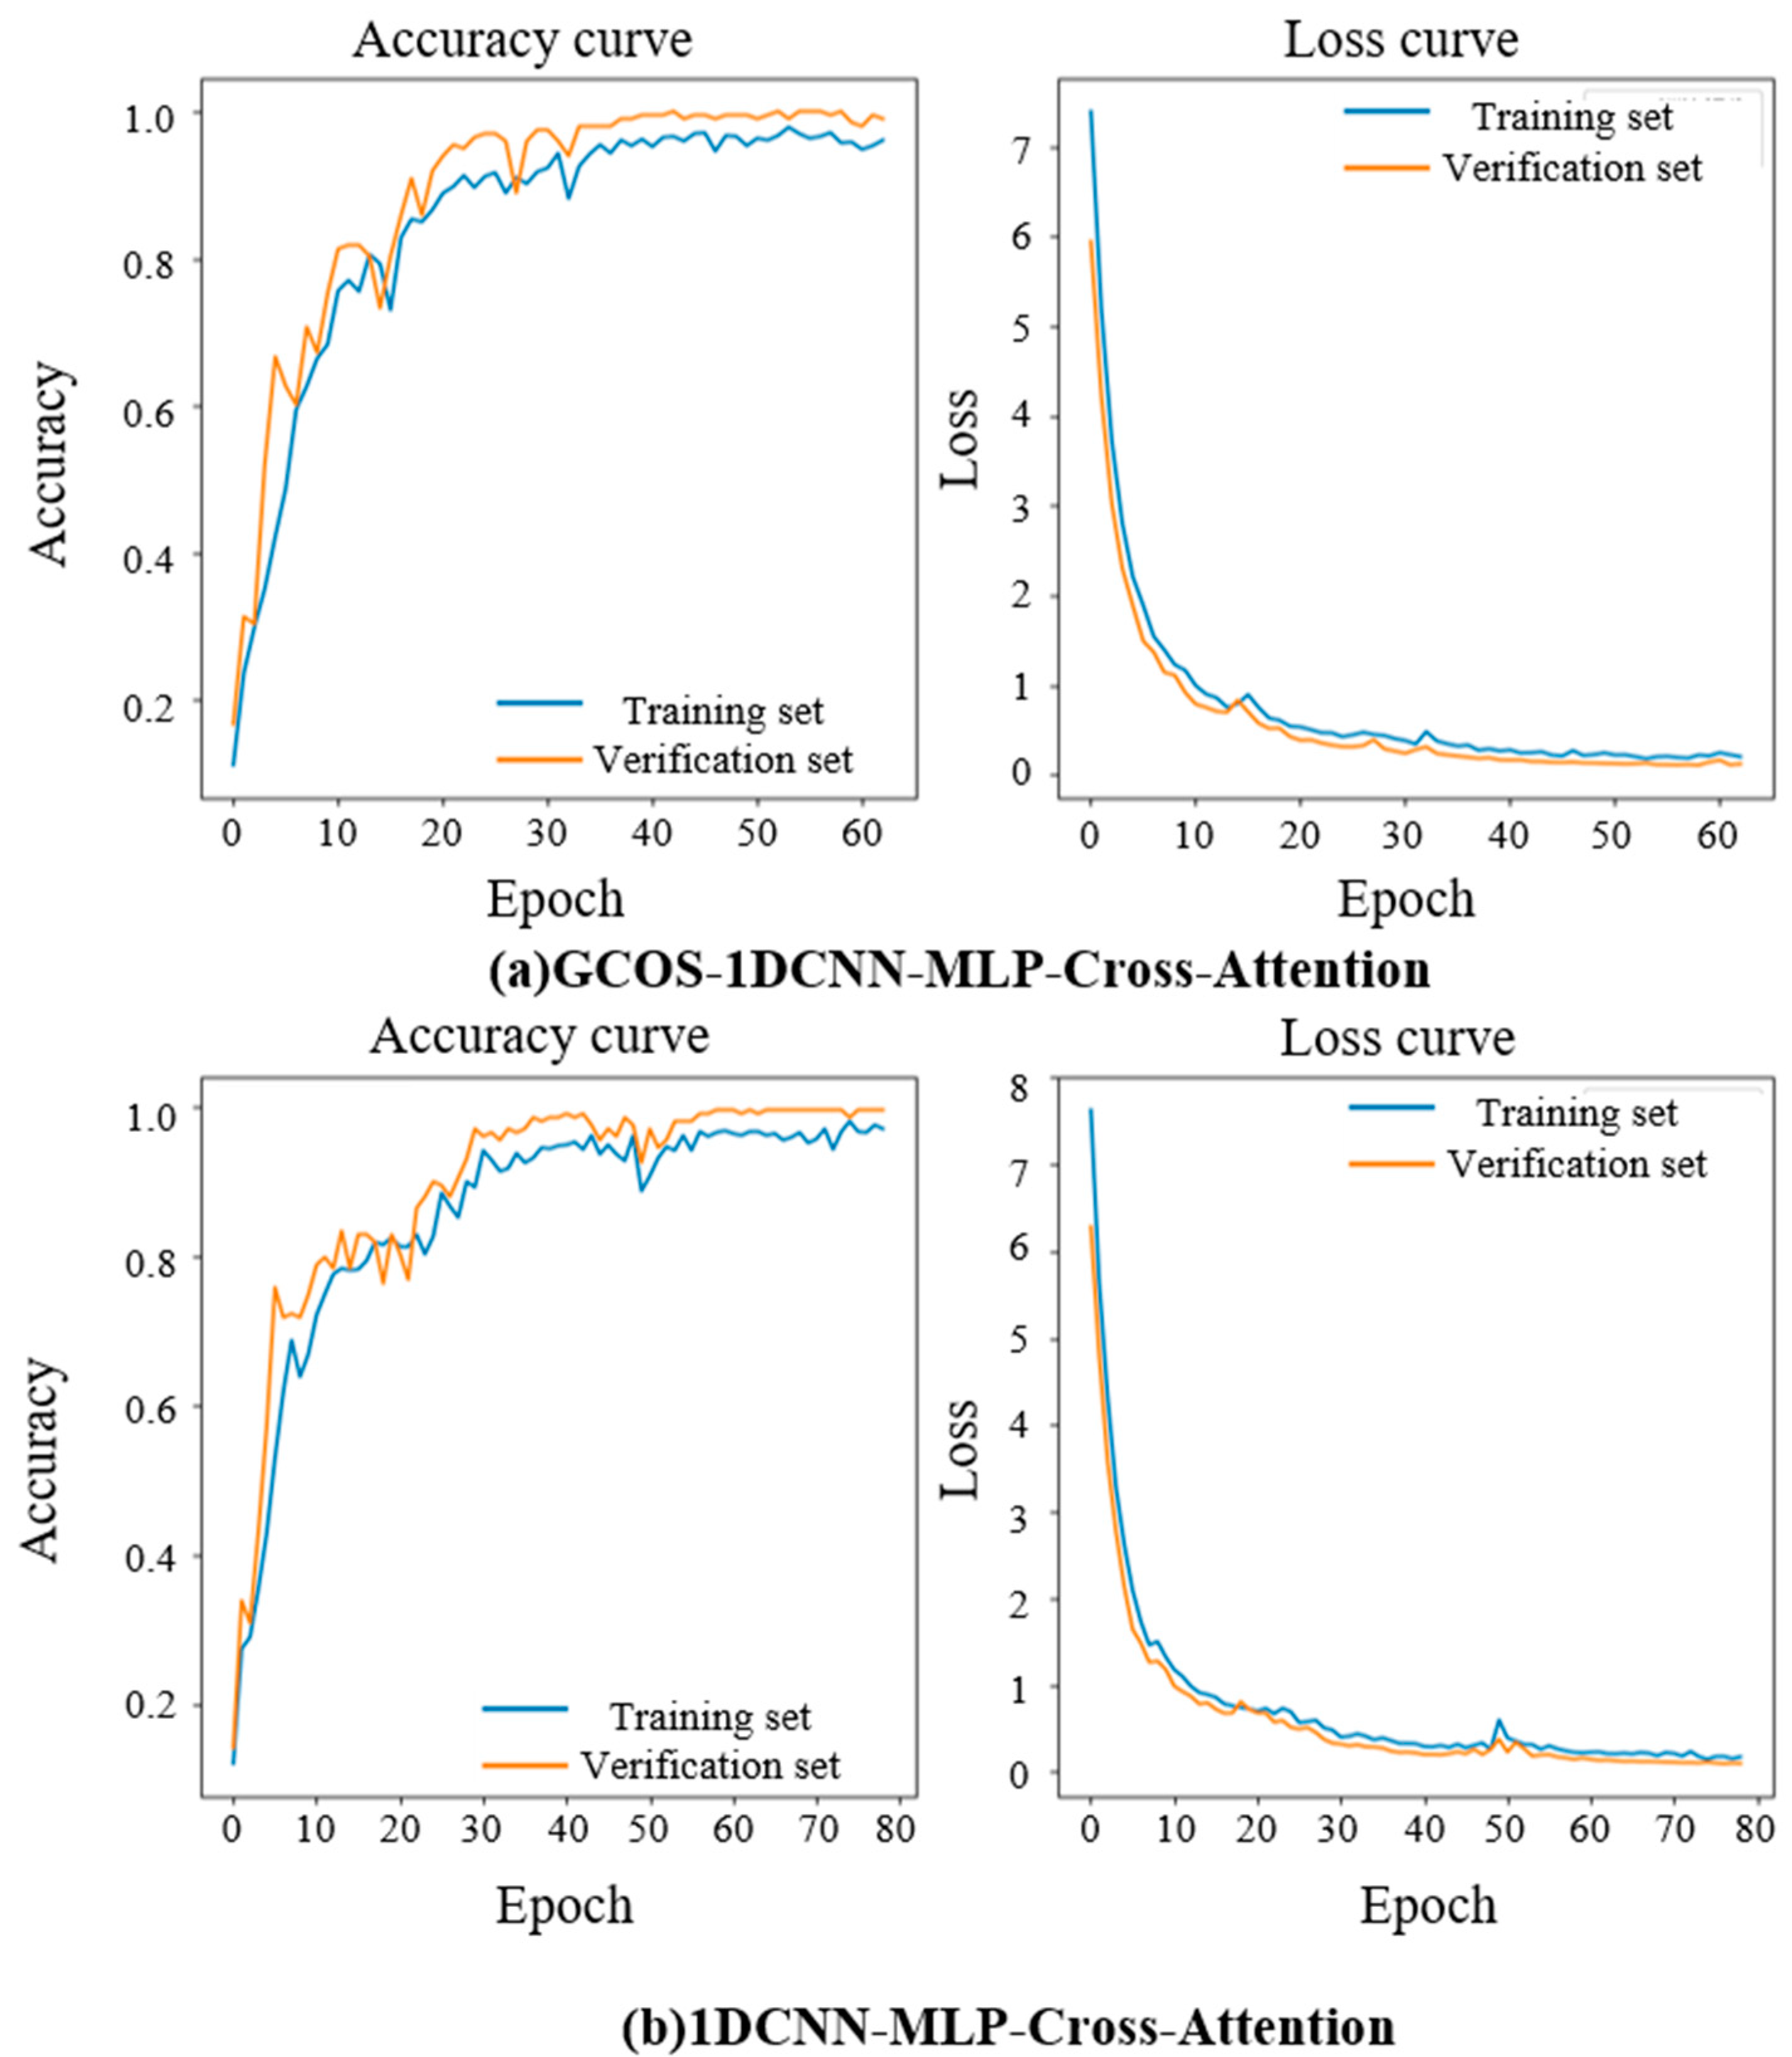
To make a more comprehensive comparison between each model, an ablation experiment is conducted for this model to compare the four evaluation indexes: accuracy, recall, precision, and F1 score. Fifteen independent experiments were conducted for each model, and the average result was calculated. Table 4 below shows the accuracy rates and standard deviations for the first five of fifteen experiments. The results of the ablation experiments for all indexes of the proposed model in this paper are shown in Figure 8. The detailed results are shown in Table 5. According to these results, it can be seen that the four indicators of the GCOS-1DCNN-MLP-Cross-Attention mechanism are optimal and that the accuracy rate has improved by 1.18% relative to the traditional 1DCNN-MLP fusion model, 1.764% relative to the traditional MLP, and 3.36% relative to 1DCNN. Comparing the accuracy rate of the 1DCNN-MLP-Cross-Attention mechanism model with that of the traditional 1DCNN-MLP model, it can be seen that the average accuracy of the model improves by 0.36%, rising from 98.65% to 99.01%. This indicates that the cross-attention mechanism module proposed in this paper improves the classification accuracy of the model. Based on the fair ablation results, replacing GCOS with cosine, StepLR, or the standard scheduler reduced the model accuracy by 0.46%, 0.64%, and 0.742%, respectively. These results demonstrate that the GCOS learning rate scheduler outperforms cosine, StepLR, and the standard scheduler. Observing Table 4 shows that the standard deviation of the model proposed in this paper is only 0.236 over five trials, indicating that the model achieves the highest accuracy while also showing high robustness. It is noteworthy that following the incorporation of the CNN-MLP with the learning rate scheduler proposed in this study, the accuracy rate is enhanced to 98.7%. The findings reveal that the golden learning rate scheduler proposed in this paper plays a significant role in enhancing the model’s accuracy. Further investigation into the impact of the golden cosine learning rate scheduler on the model was conducted. To this end, a comparison is made between the model proposed in this paper and the 1DCNN-MLP-Cross-Attention mechanism model, with and without the golden cosine learning rate scheduler. The accuracy and loss curves of the 1DCNN-MLP-Cross-Attention mechanism model with and without the golden cosine learning rate scheduler are shown in Figure 9 below. It is evident from this figure that the accuracy of the GCOS-1DCNN-MLP-Cross-Attention mechanism fluctuates considerably from the 15th to the 35th round of training and then gradually converges to 1 and finally converges in the 60th round. The loss curves of the model also fluctuate in the 60th round. The loss curve of the model also reaches convergence at approximately round 60. In contrast, the accuracy of the 1DCNN-MLP-Cross-Attention mechanism model without the addition of the golden cosine learning rate scheduler fluctuates considerably between rounds 25 and 50 and finally converges at round 80. As demonstrated in Figure 10, the learning rate undergoes a change following the implementation of the learning rate scheduler. In this paper, the initial learning rate is set to 10−3, and the golden cosine learning rate scheduler establishes a minimum threshold for the learning rate, equivalent to 1% of the initial learning rate (illustrated as the red line in Figure 10). The golden learning rate scheduler causes the learning rate to vary in a cosine function-like manner, and in the process of automatically adjusting the learning rate, the model uses a dynamic learning rate that perfectly balances the disadvantages of overfitting and slow convergence.

3.2.2. Noise Environment Comparison Experiment

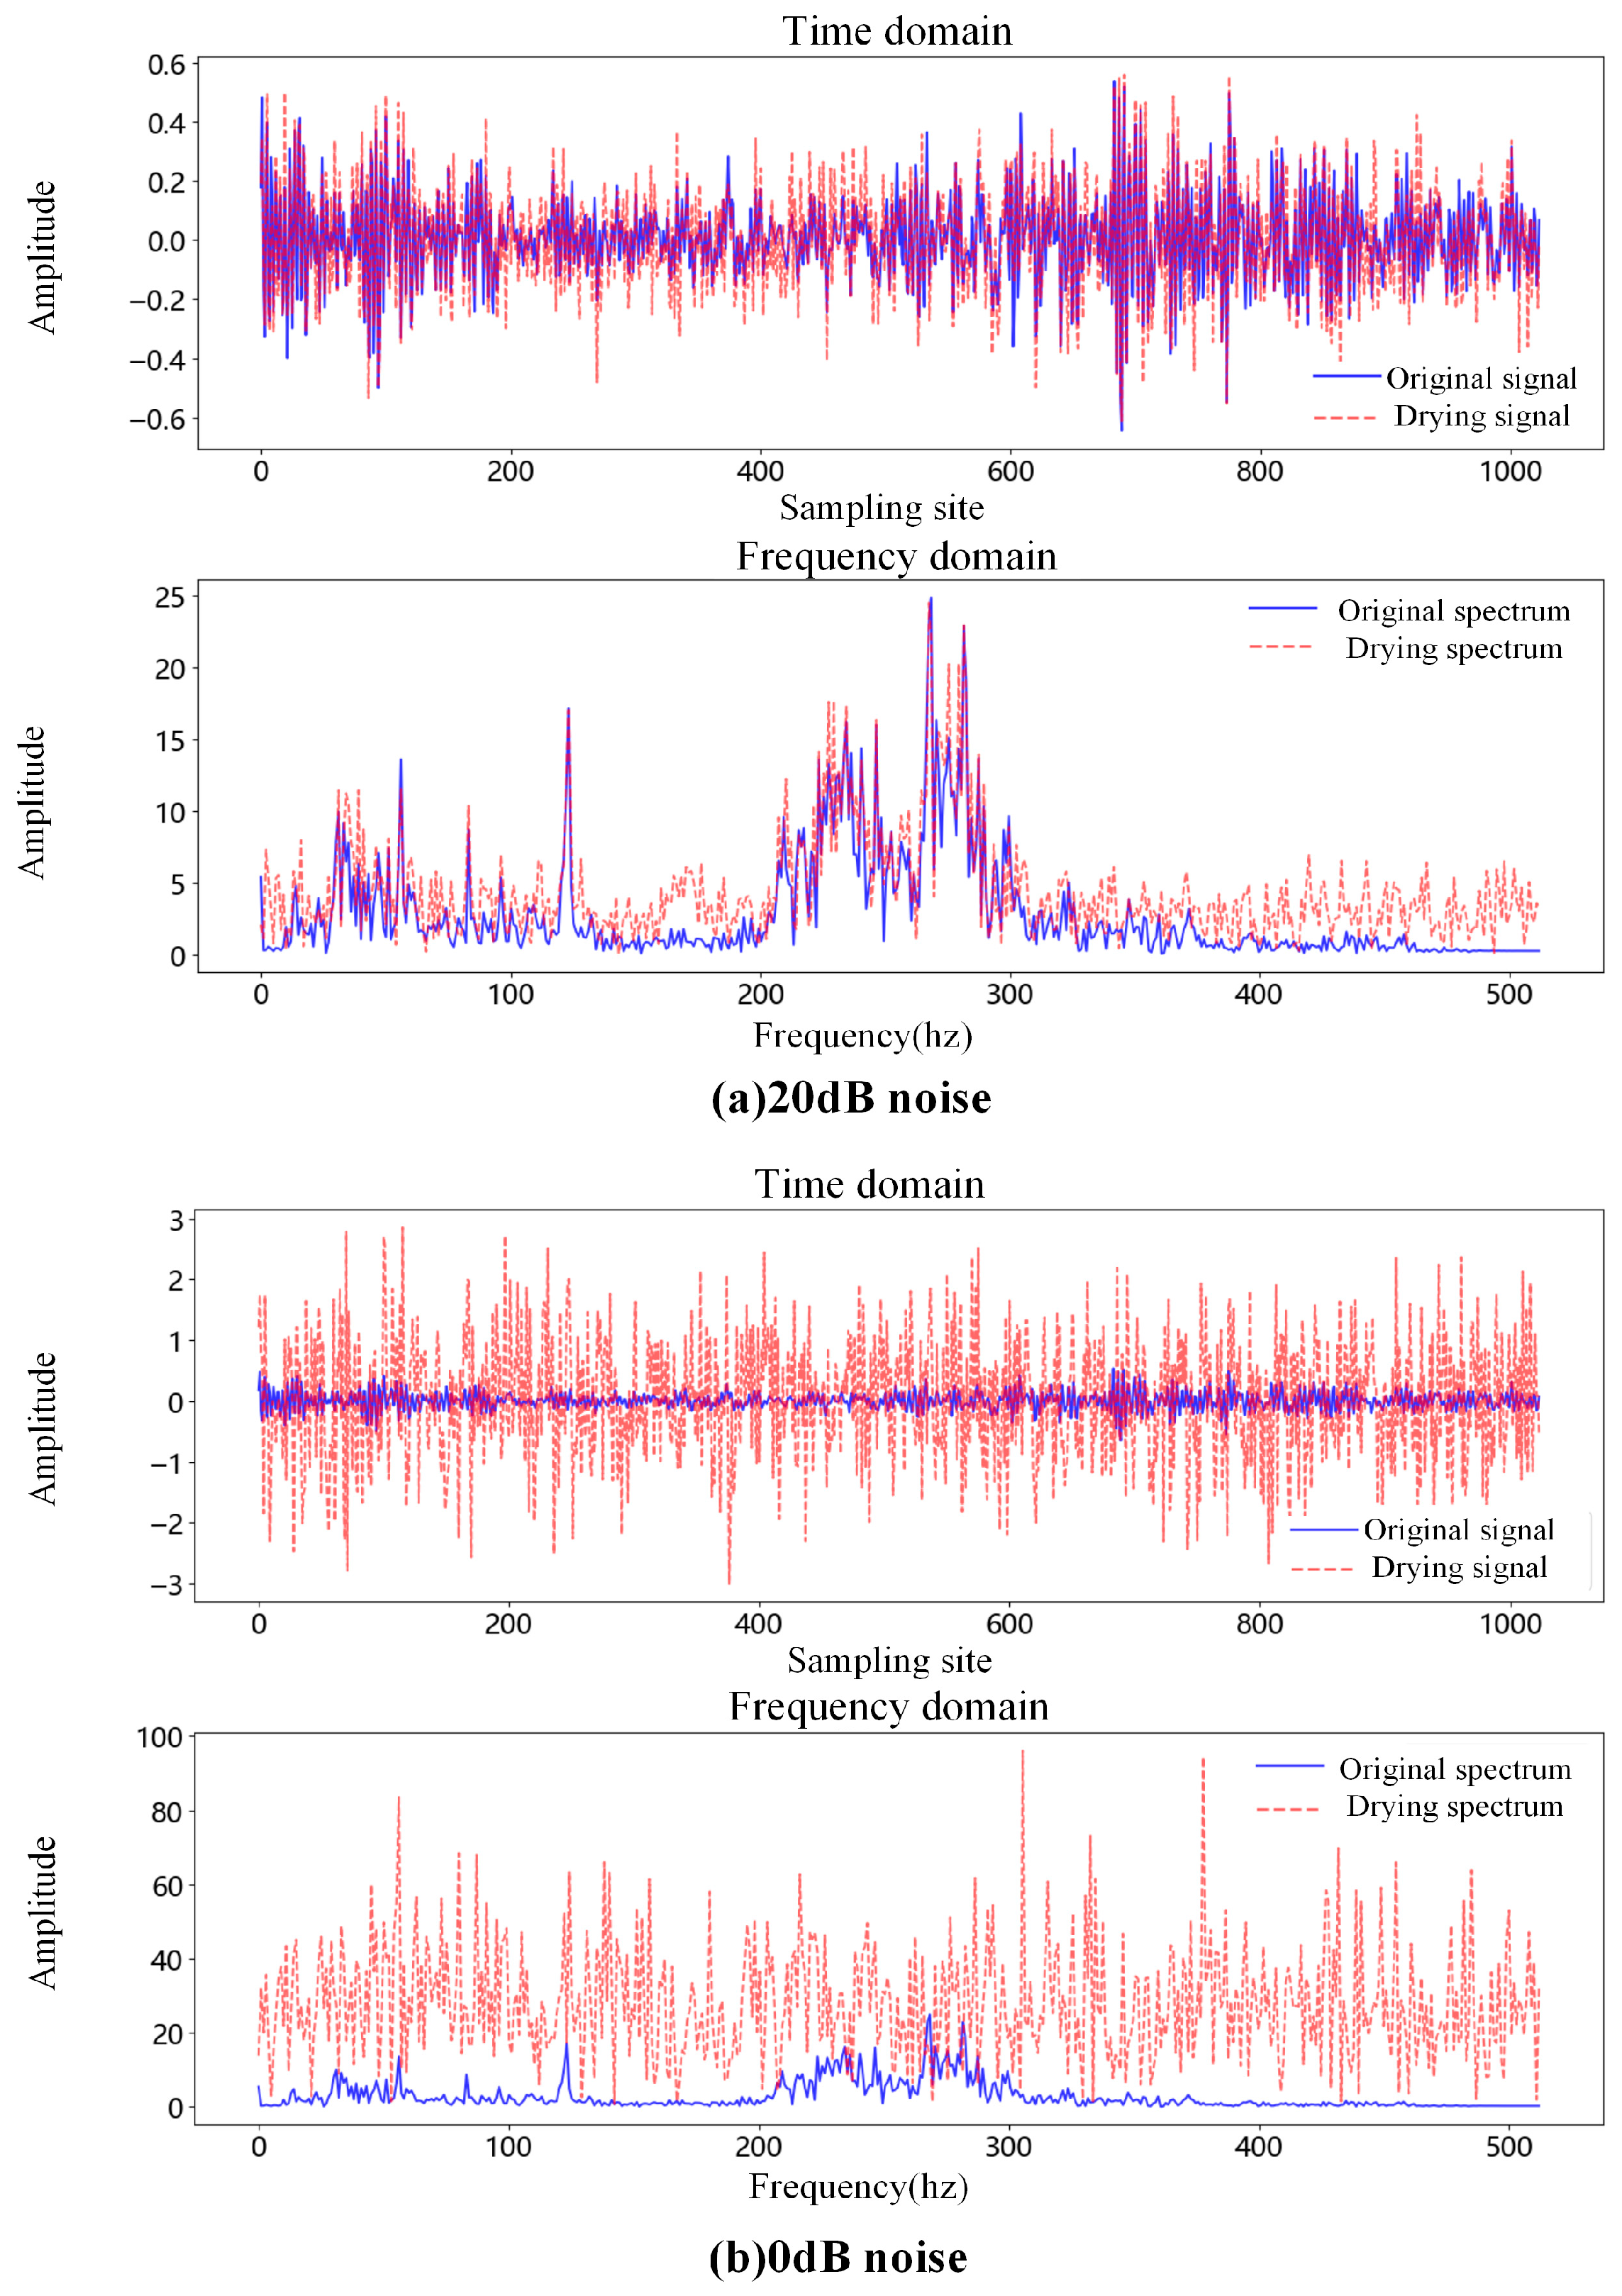
In industrial environments, data collected by sensors are often affected by various noise factors. To simulate these conditions, this study injects Gaussian noise of different intensities into the original vibration signals and evaluates the performance of the constructed model in high-noise environments. Noise is added uniformly to both the training and validation data during the loading phase. A fixed random seed ensures that the same noise sequence is generated each time. The noise intensity is adjusted using a noise factor, which remains constant and is applied to all samples. Signal-to-noise ratio (SNR) is a key metric for evaluating signal quality, defined as the ratio of useful signal power to noise power, typically expressed in decibels (dB). The formula for SNR is as follows:
SNR dB = 10 log 10 P signal P noise
where P signal denotes the effective power of the signal, and P noise denotes the power of the added noise.
As illustrated in Figure 11 below, the fault signal of a 0.014-inch rolling ball fault at the 12 k drive end, with 20 dB and 0 dB Gaussian noise added, is shown. When the signal-to-noise ratio is 20 dB, the noise has little effect on the signal, and it is not difficult to extract the original vibration signal. When the signal-to-noise ratio is 0 dB, it indicates that the energy of the noise signal is the same as that of the original vibration signal, and it can be seen in the figure that the original vibration signal in blue has been completely destroyed when the signal-to-noise ratio is less than 0 dB, which indicates that the intensity of the noise signal has already exceeded the original vibration signal strength. At this time, it becomes extremely difficult to extract the original signal characteristics from the strong noise.
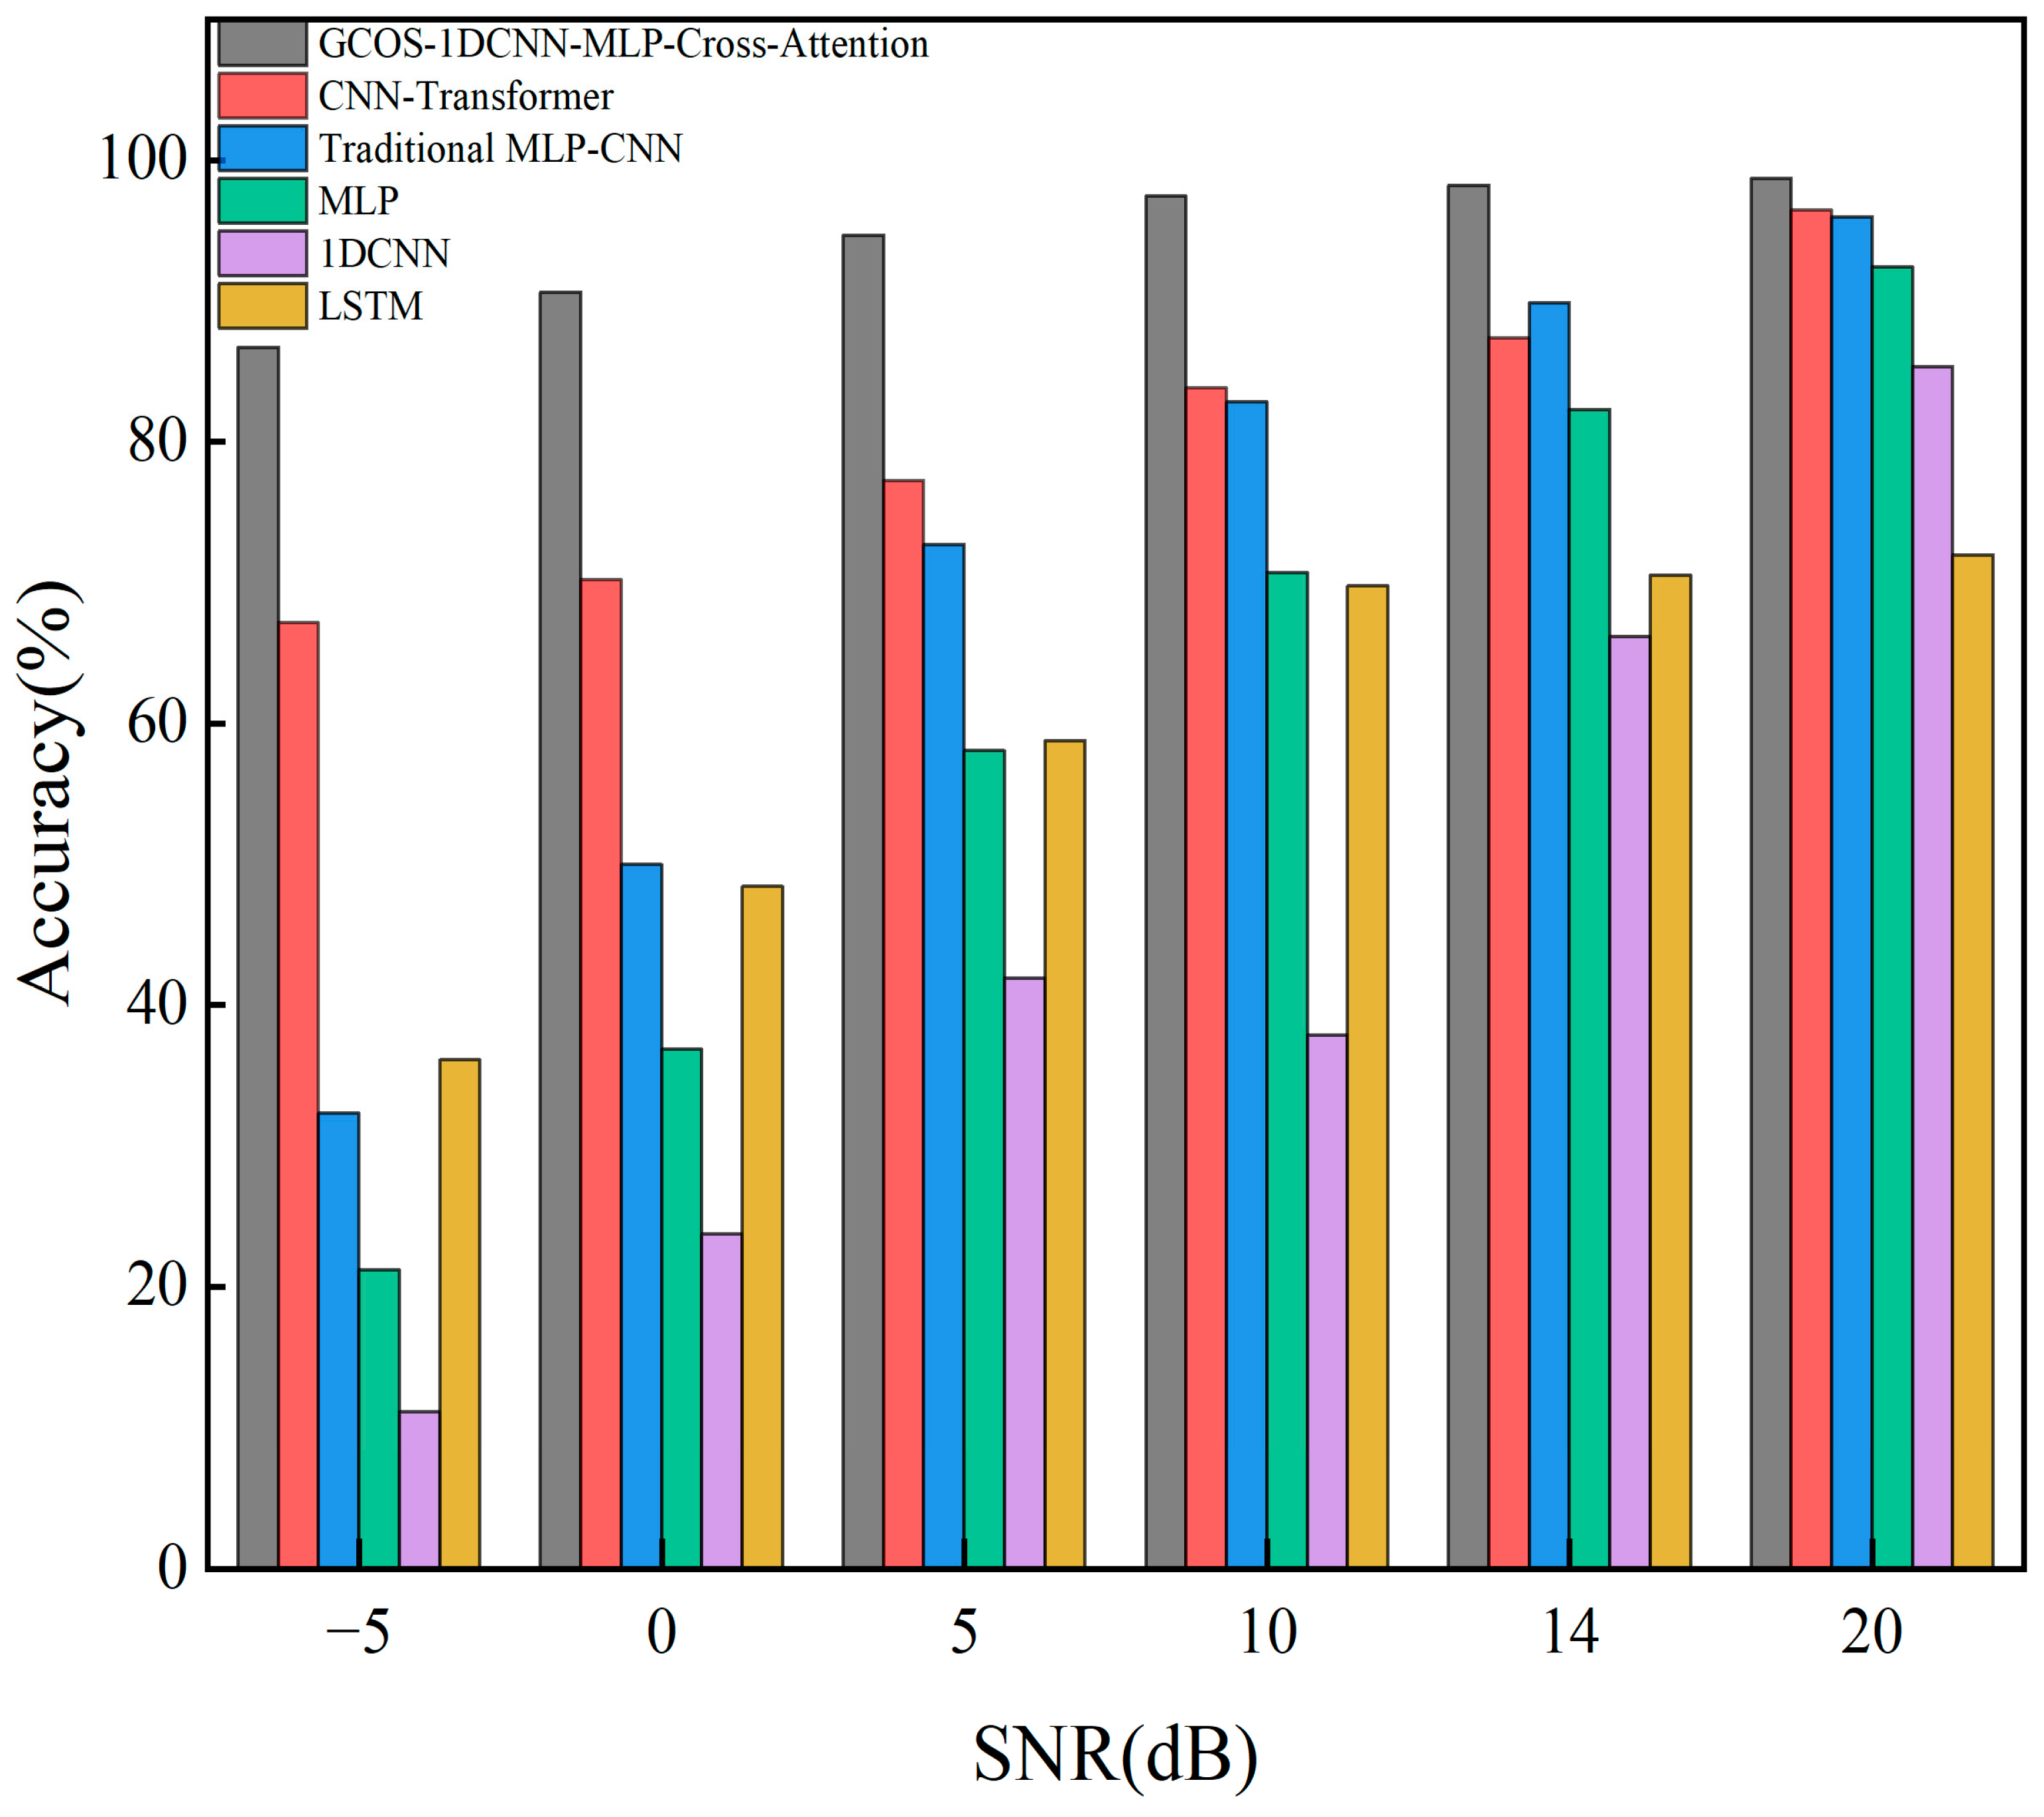
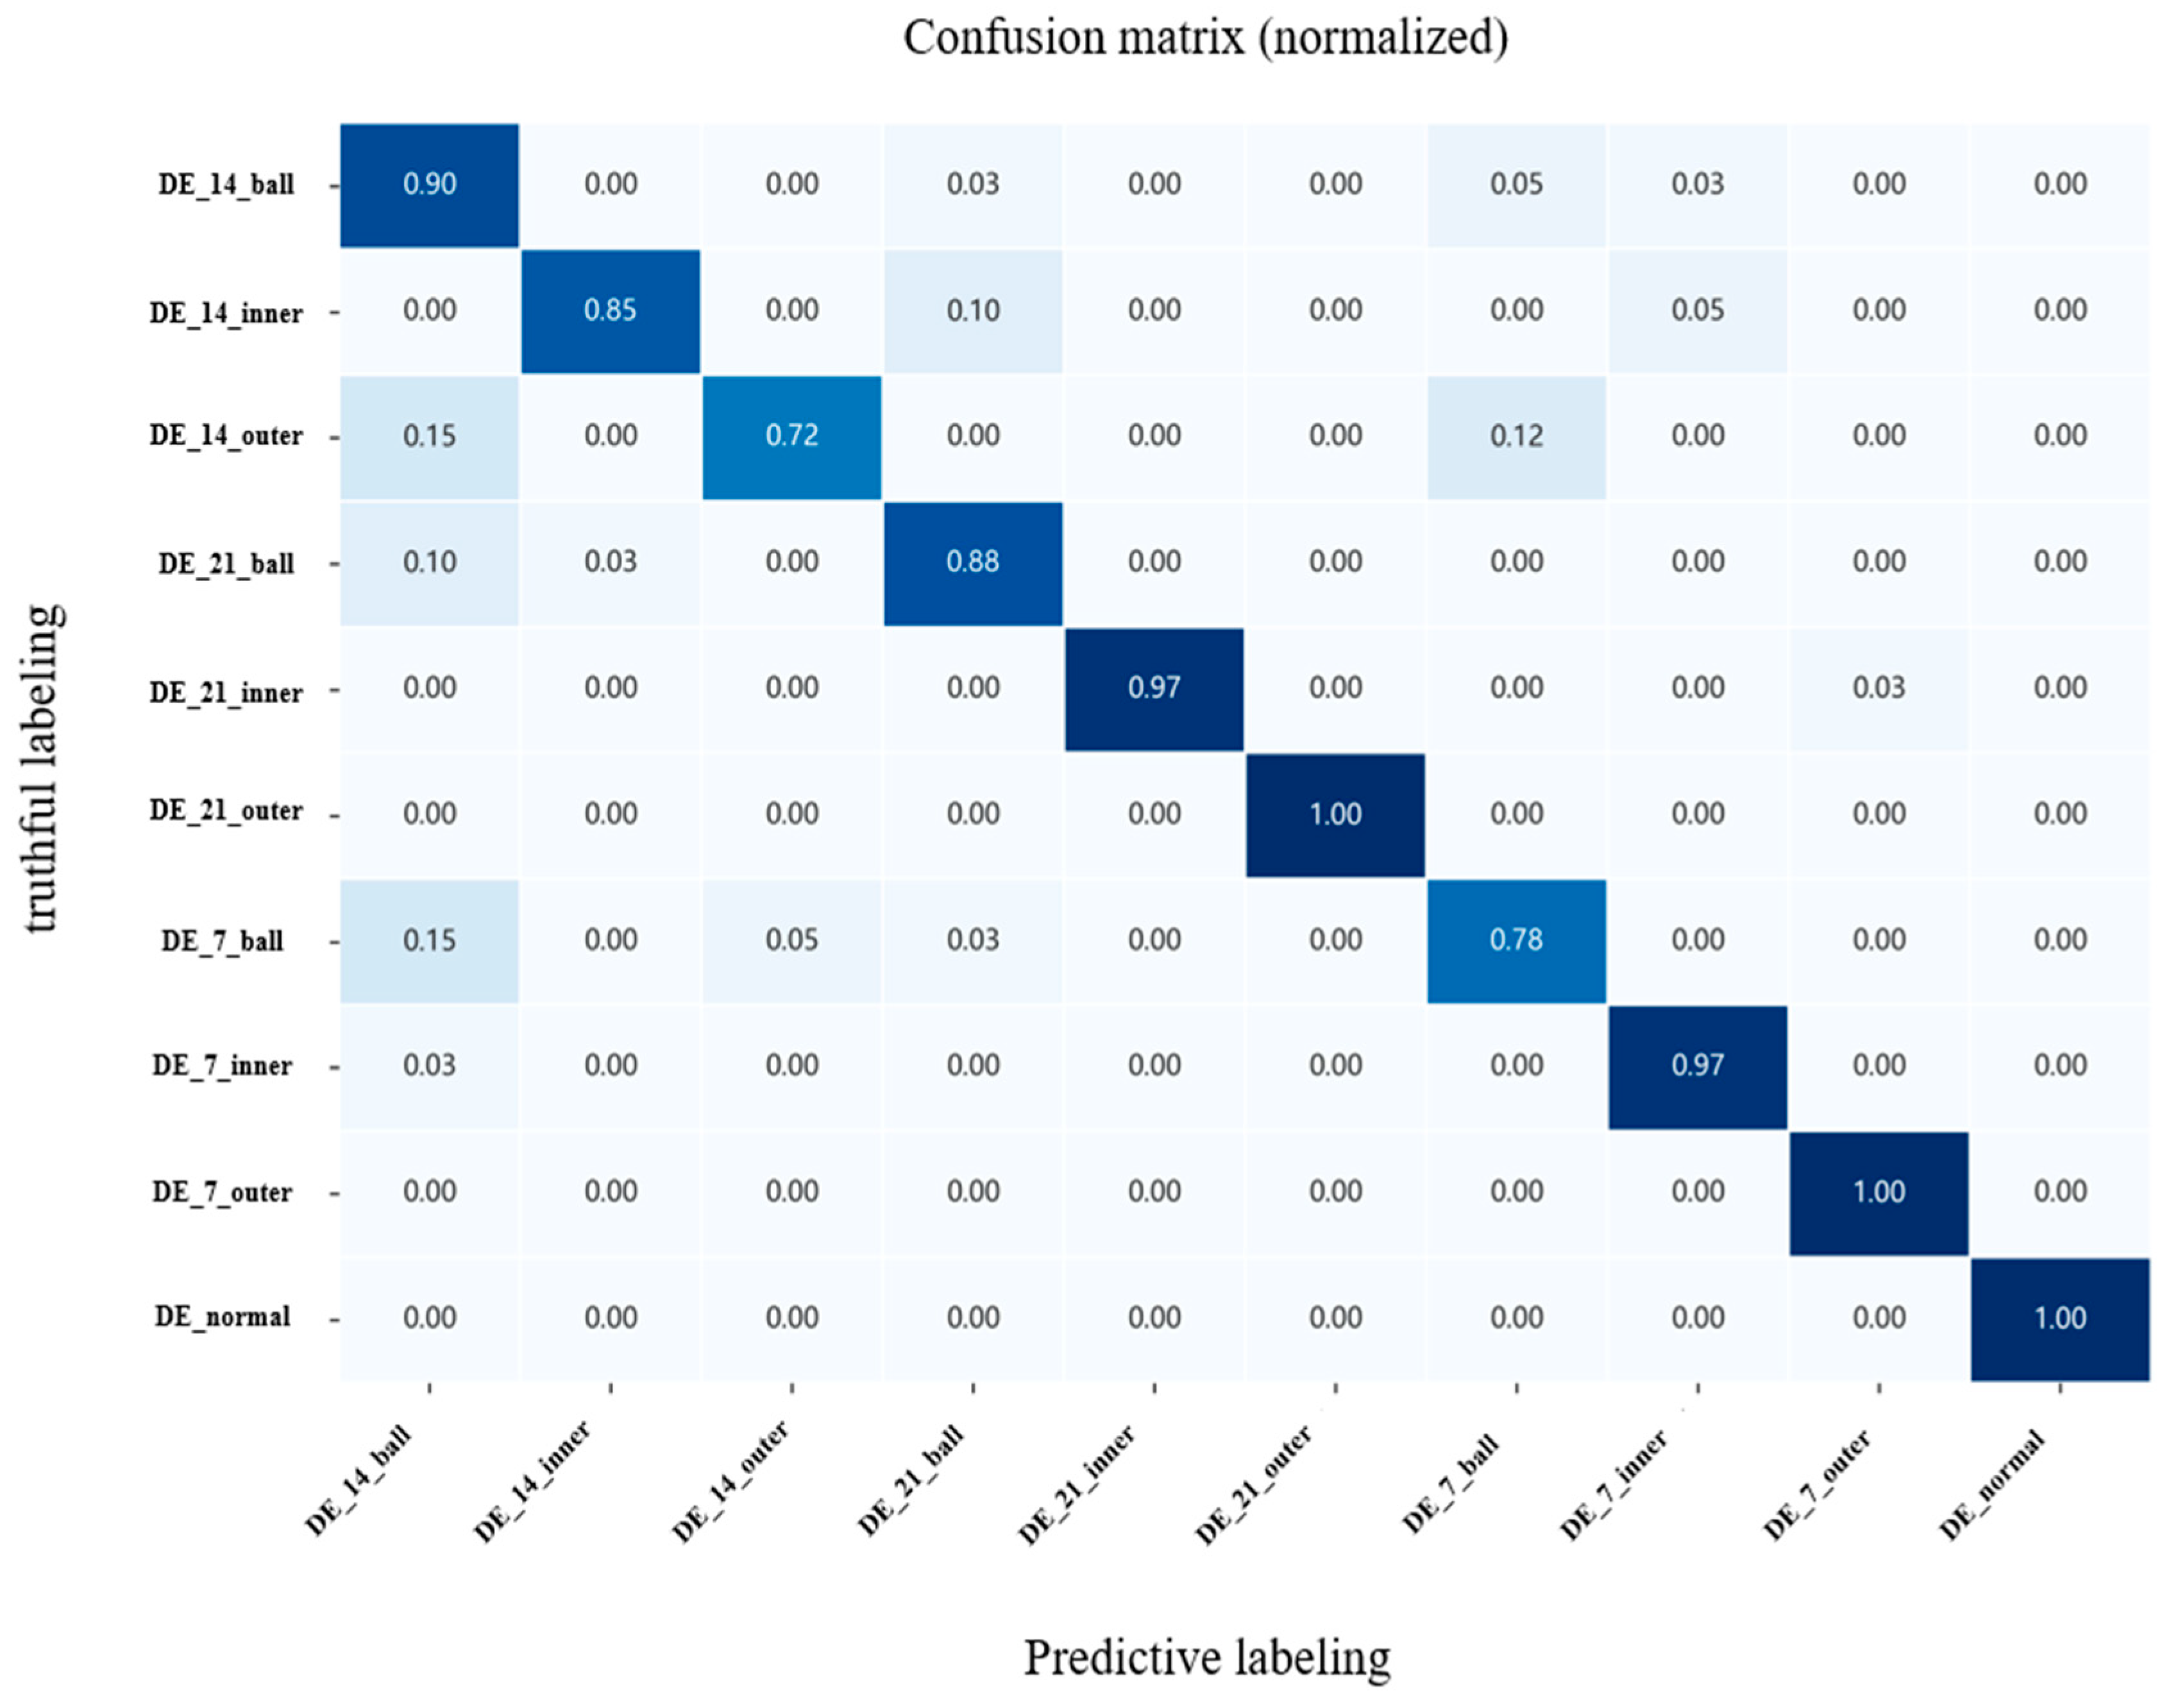
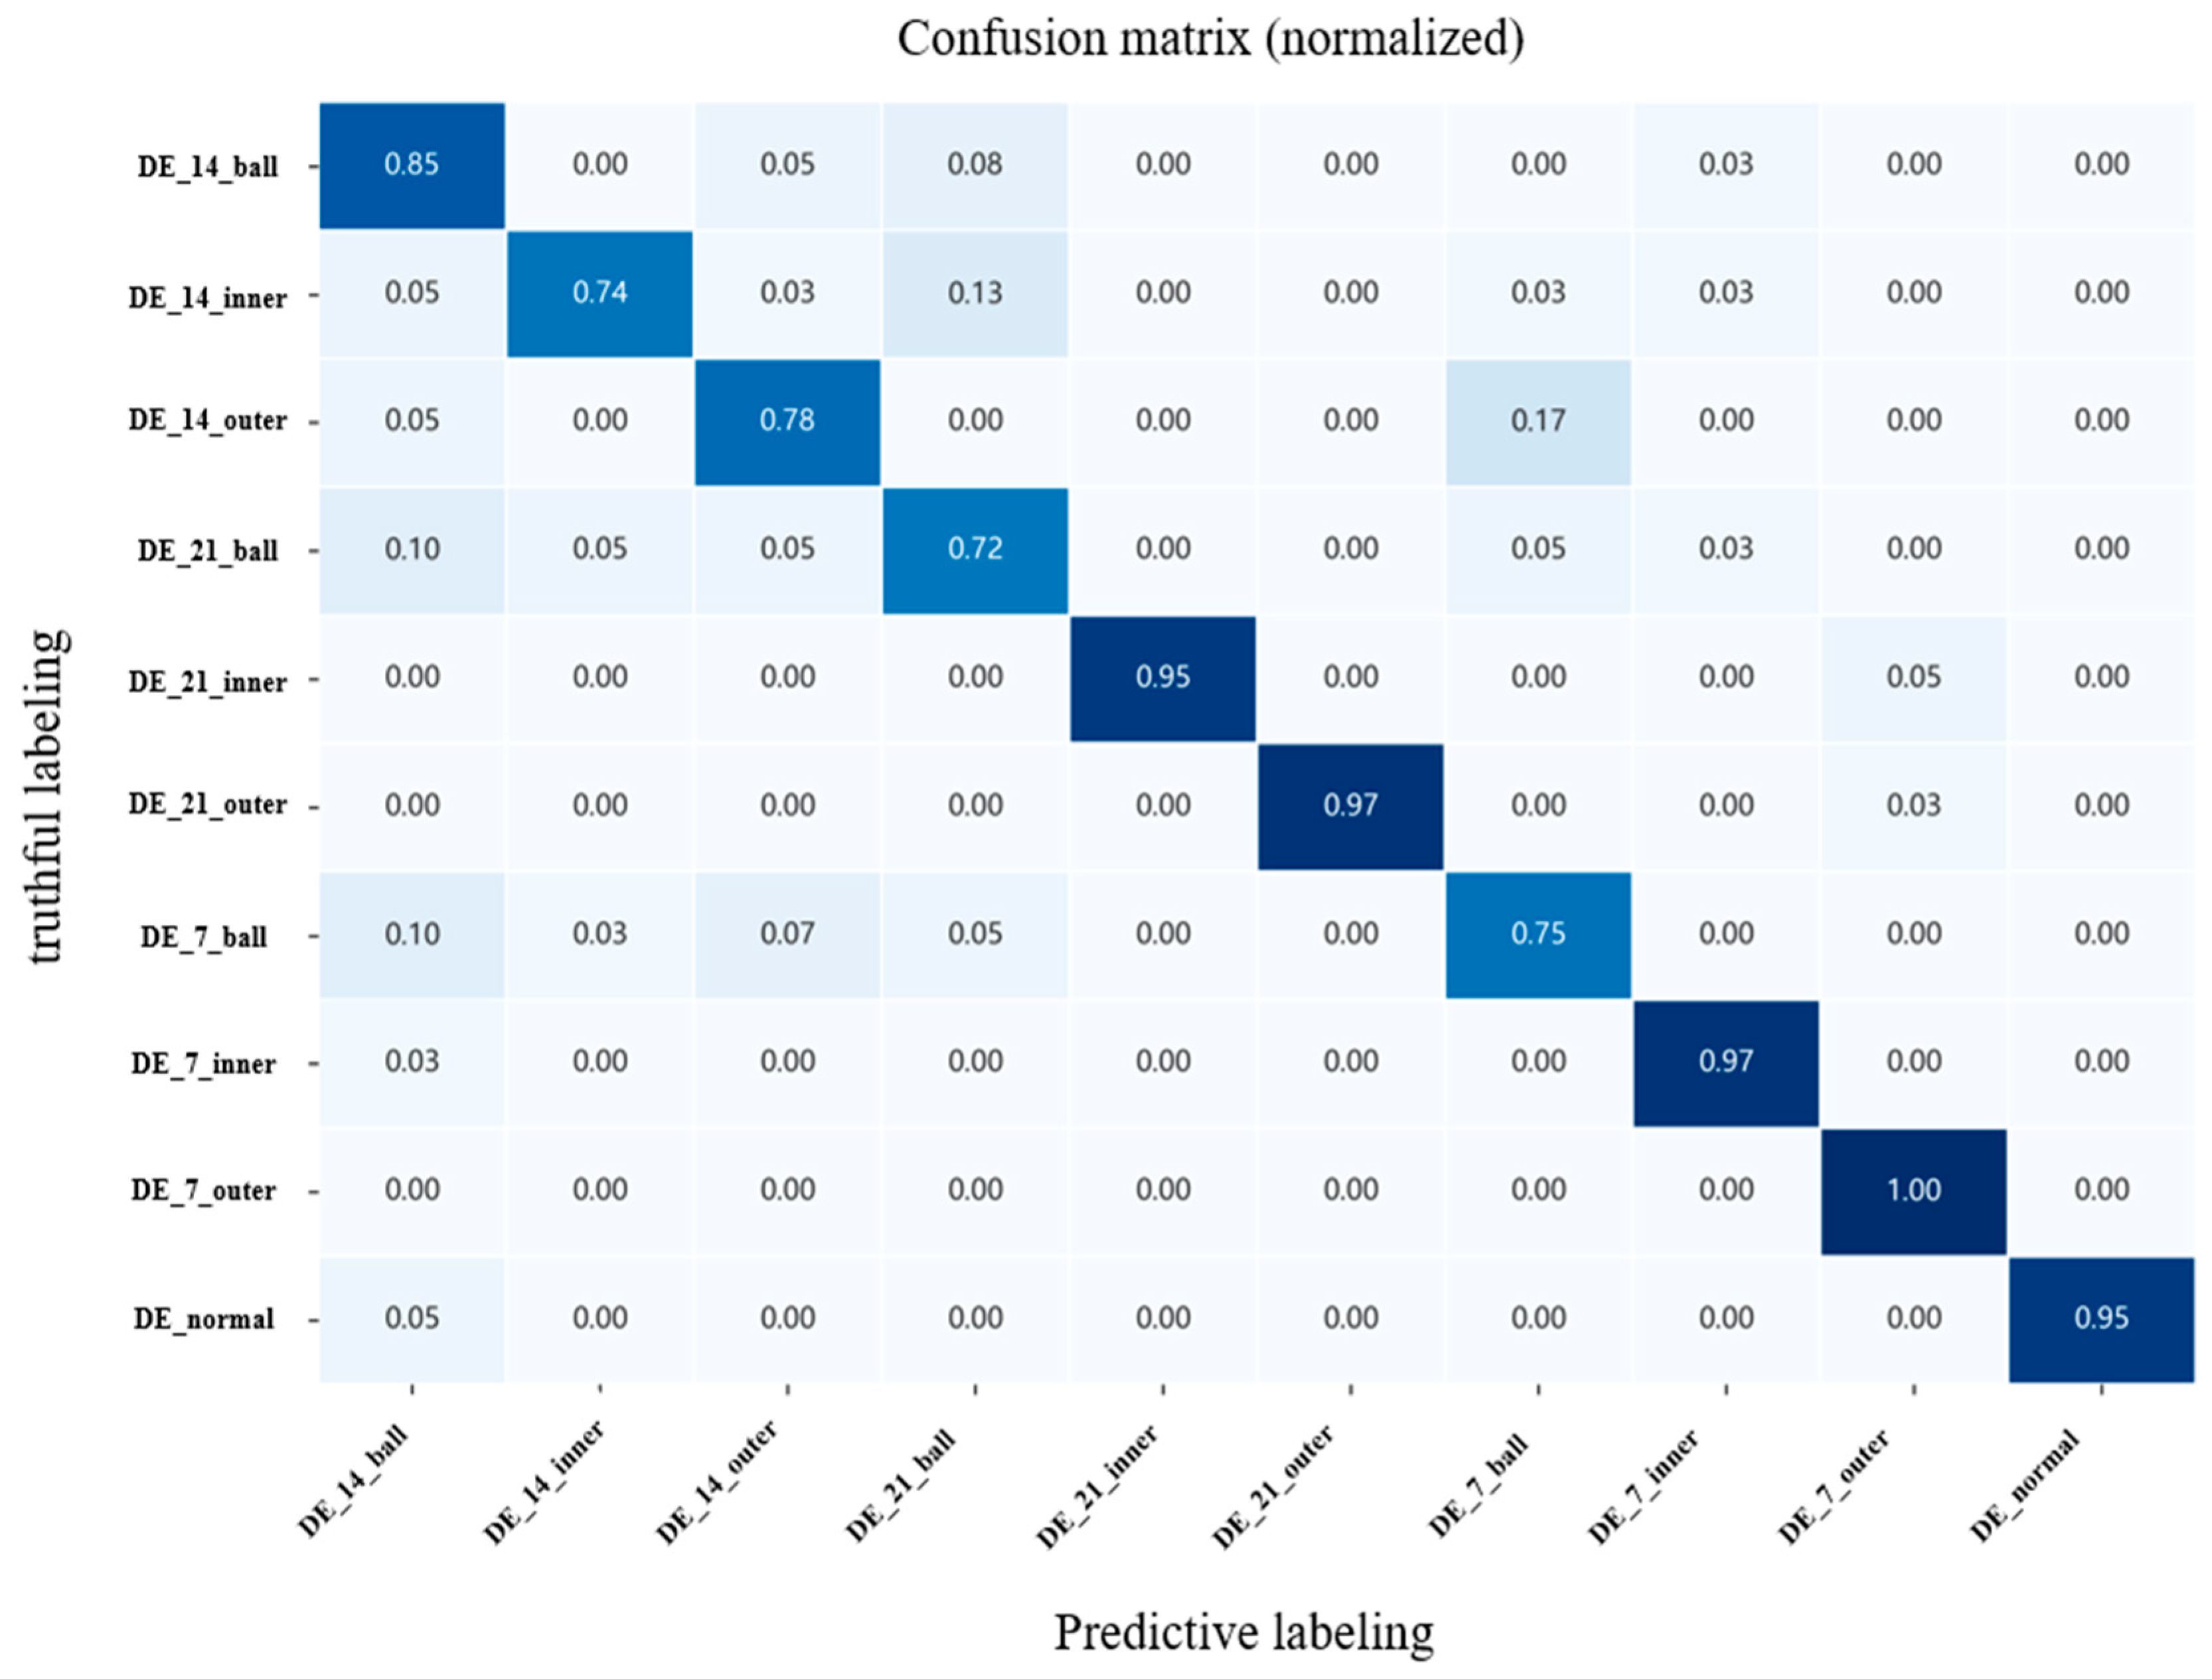
This paper presents an evaluation of signal-to-noise ratios across a range of noise intensities, from 20 dB to −5 dB. Figure 12 below provides a visual representation of the accuracy of various methods under different noise levels. Different methods employ the same regularization and stopping criteria. For a comprehensive analysis, please refer to Table 6, which presents detailed results. The results show that the proposed GCOS-1DCNN-MLP-Cross-Attention mechanism exhibits the highest accuracy at all signal-to-noise ratios, except for the model proposed in this paper, the accuracy of all the other models decays rapidly with the enhancement of the noise signal, and the accuracy of a single model decays to less than 80% at 10 dB; the model proposed in this paper is still at 97.47% accuracy, which is 14.64% higher than the MLP-CNN by 14.64% and CNN-Transformer by 13.63%. At 0 dB, the accuracy of the model proposed in this paper is 90.66%, while all the other models decay to below 80%, which is 40.66% higher than MLP-CNN and 20.46% higher than CNN-Transformer. Under the strong noise of −5 dB, the accuracy of the proposed model can still be maintained at 86.72%, while the accuracy of other models drops to less than 70%. Figure 13 presents the confusion matrix of the GCOS-1DCNN-MLP-Cross-Attention mechanism under 0 dB noise. It can be seen that the model in this paper only drops to 80% for the classification of the DE_14_outer class of faults under 0 dB of strong noise, and even six other classes remain above 90%. The components demonstrate the excellent performance of the GCOS-1DCNN-MLP-Cross-Attention mechanism in the face of strong noise. The experiment was conducted on a system comprising an Intel Core i9-13980HX CPU, an NVIDIA GeForce RTX 4060 GPU, and the Windows 11 operating system. The training parameters for the various methods are presented in Table 7.

3.2.3. Variable Load Noise Environment Comparison Experiment

To demonstrate the robustness of the proposed model and its performance under variable load noise conditions, data from the 12 K drive under 0 HP load conditions were used as the training set. Data from the 12 K drive end operating at a 1 HP load were used for both the test and validation sets (1 HP = 0.7457 kW). The noise addition method remained consistent with that used in the preceding section. Detailed data are presented in Table 8.
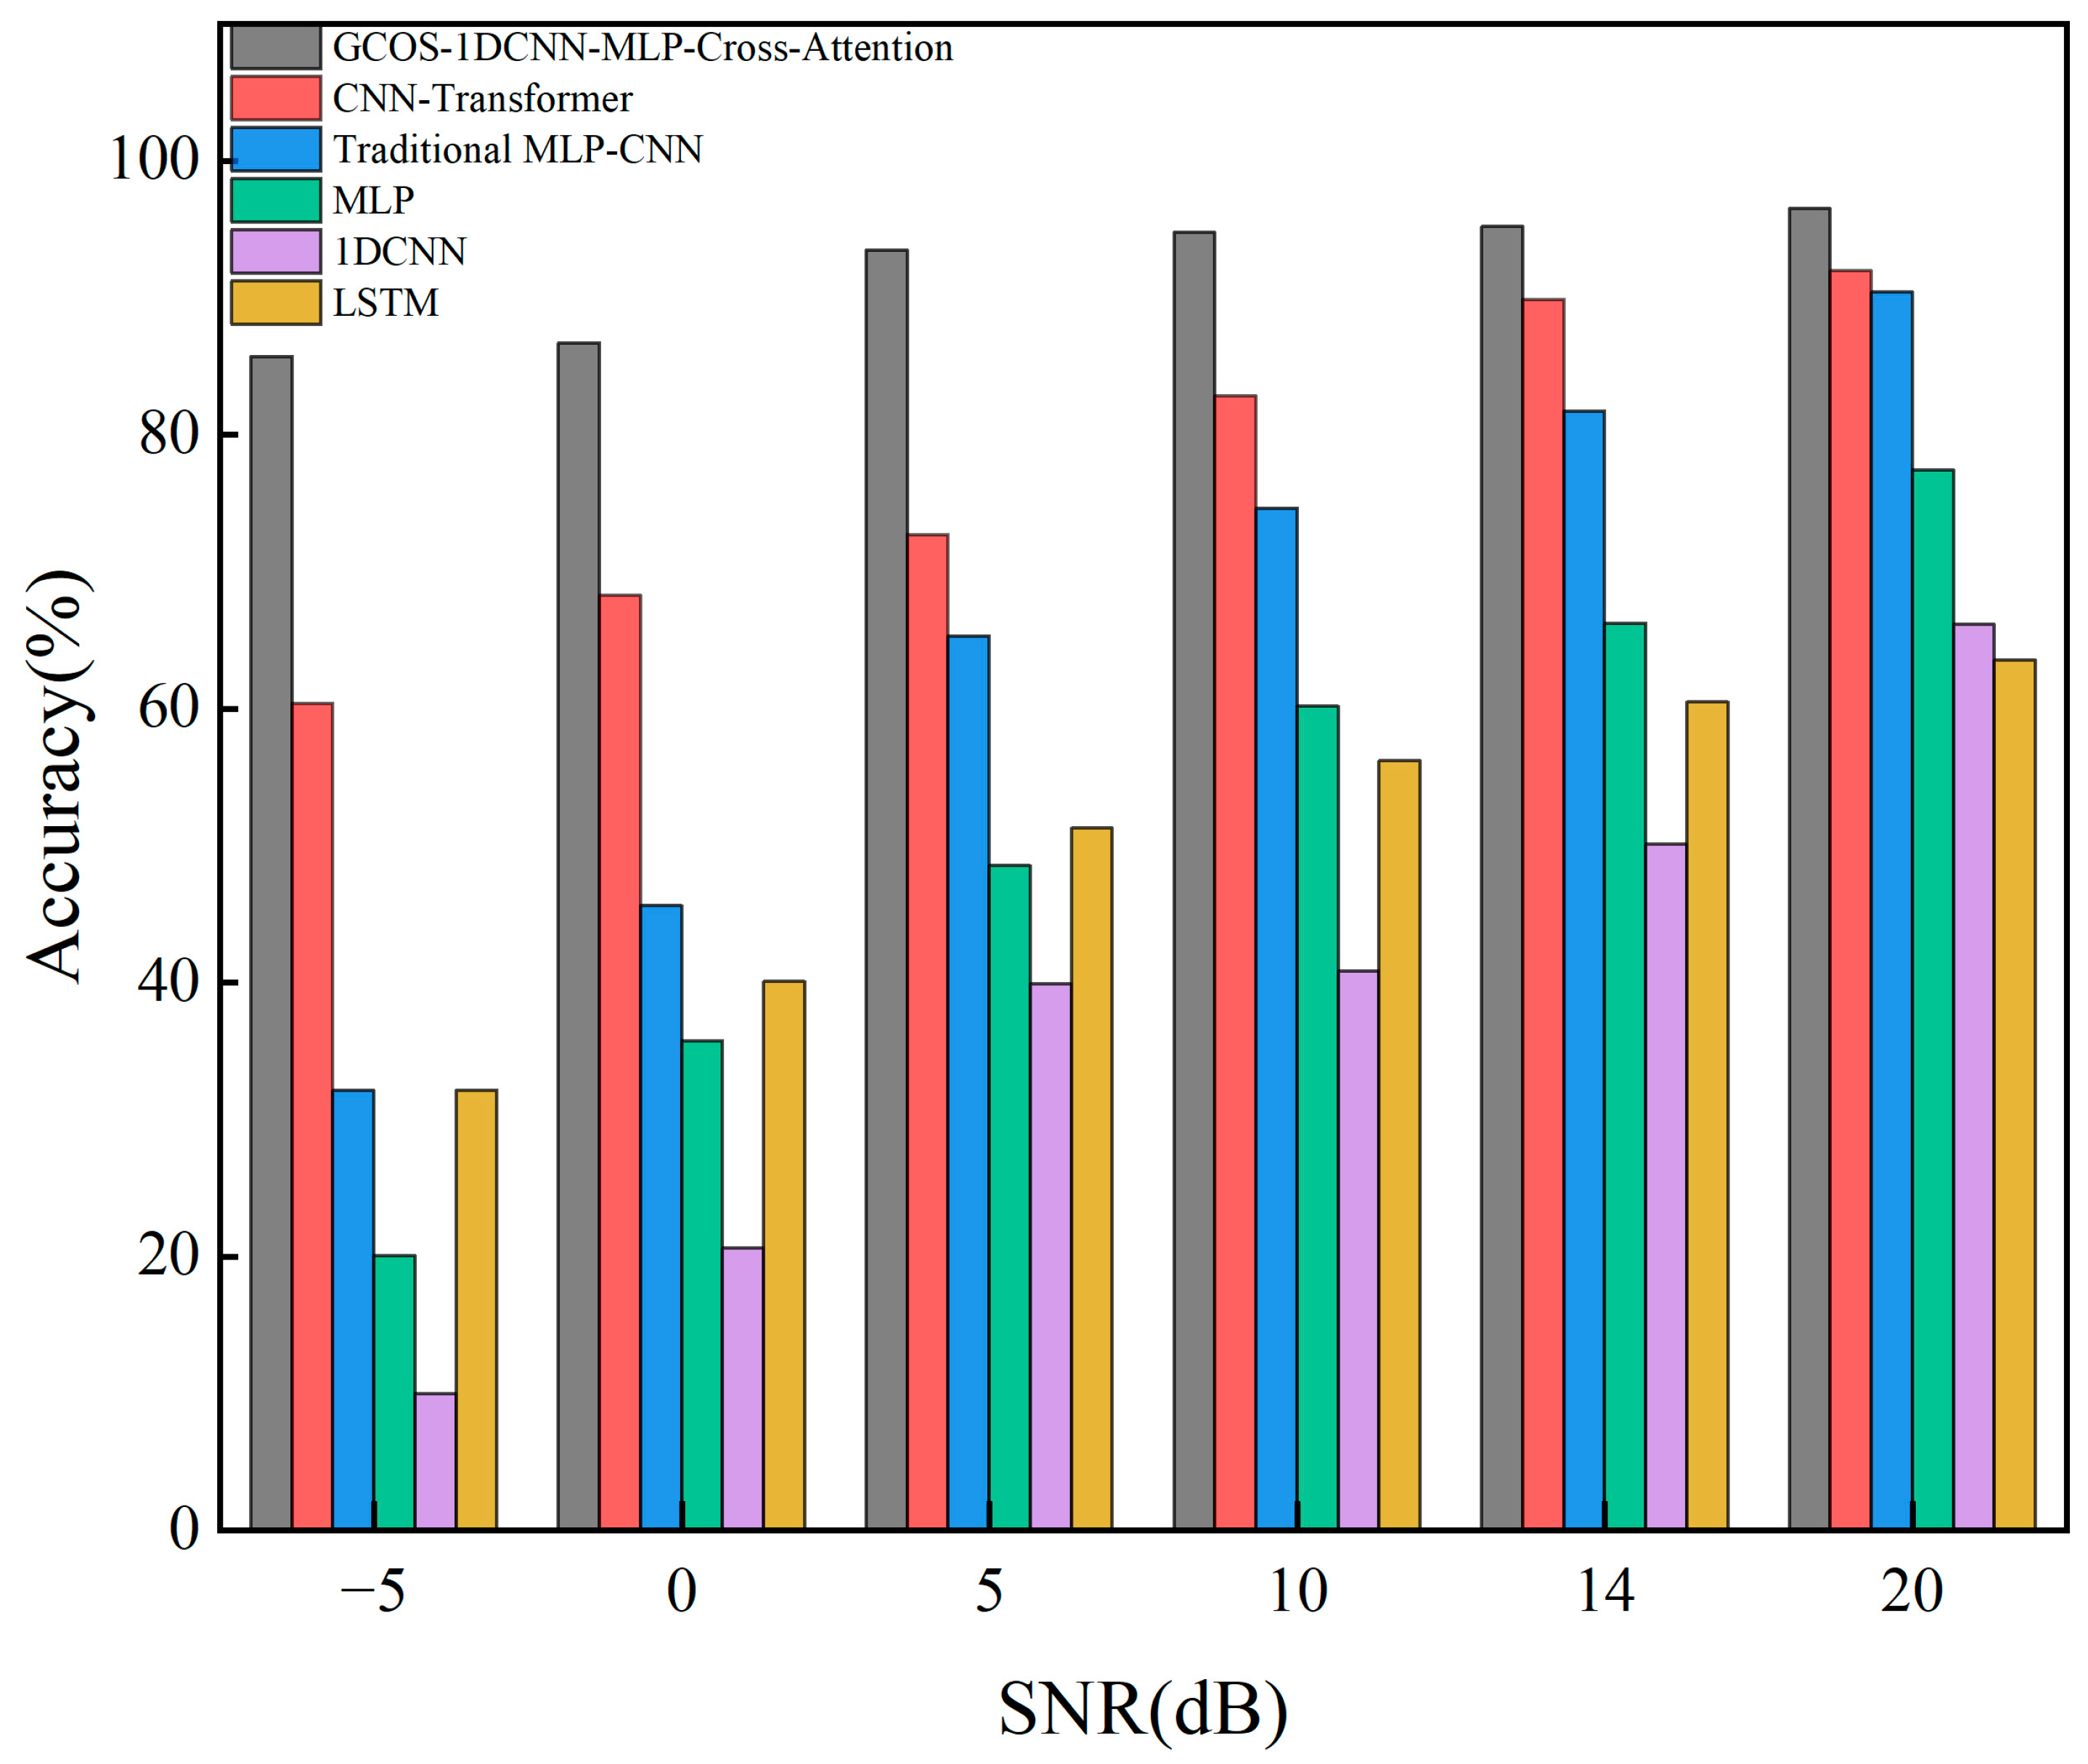
Figure 14 shows the experimental results, with the detailed outcomes presented in Table 9. The results indicate that, under variable load conditions, the performance of all models declined compared to single-load scenarios. However, the GCOS-1DCNN-MLP- Cross-Attention model demonstrated particularly robust performance, ranking first among the six models across various SNRs and maintaining an accuracy of 93.47% even in the presence of 5 dB of noise. At this point, the accuracy of the other models dropped below 80%. Under high noise conditions of −5 dB, the GCOS-1DCNN-MLP-Cross-Attention model achieved 25.3% higher accuracy than the CNN-Transformer model, while the other models nearly lost their classification capability. Figure 15 shows the confusion matrix for the GCOS-1DCNN-MLP-Cross-Attention model under variable loads ranging from 0 HP to 1 HP and 0 dB noise. These results demonstrate that the GCOS-1DCNN-MLP-Cross-Attention model exhibits robust performance under variable loads and noisy conditions.

3.2.4. Feature Correlation Verification

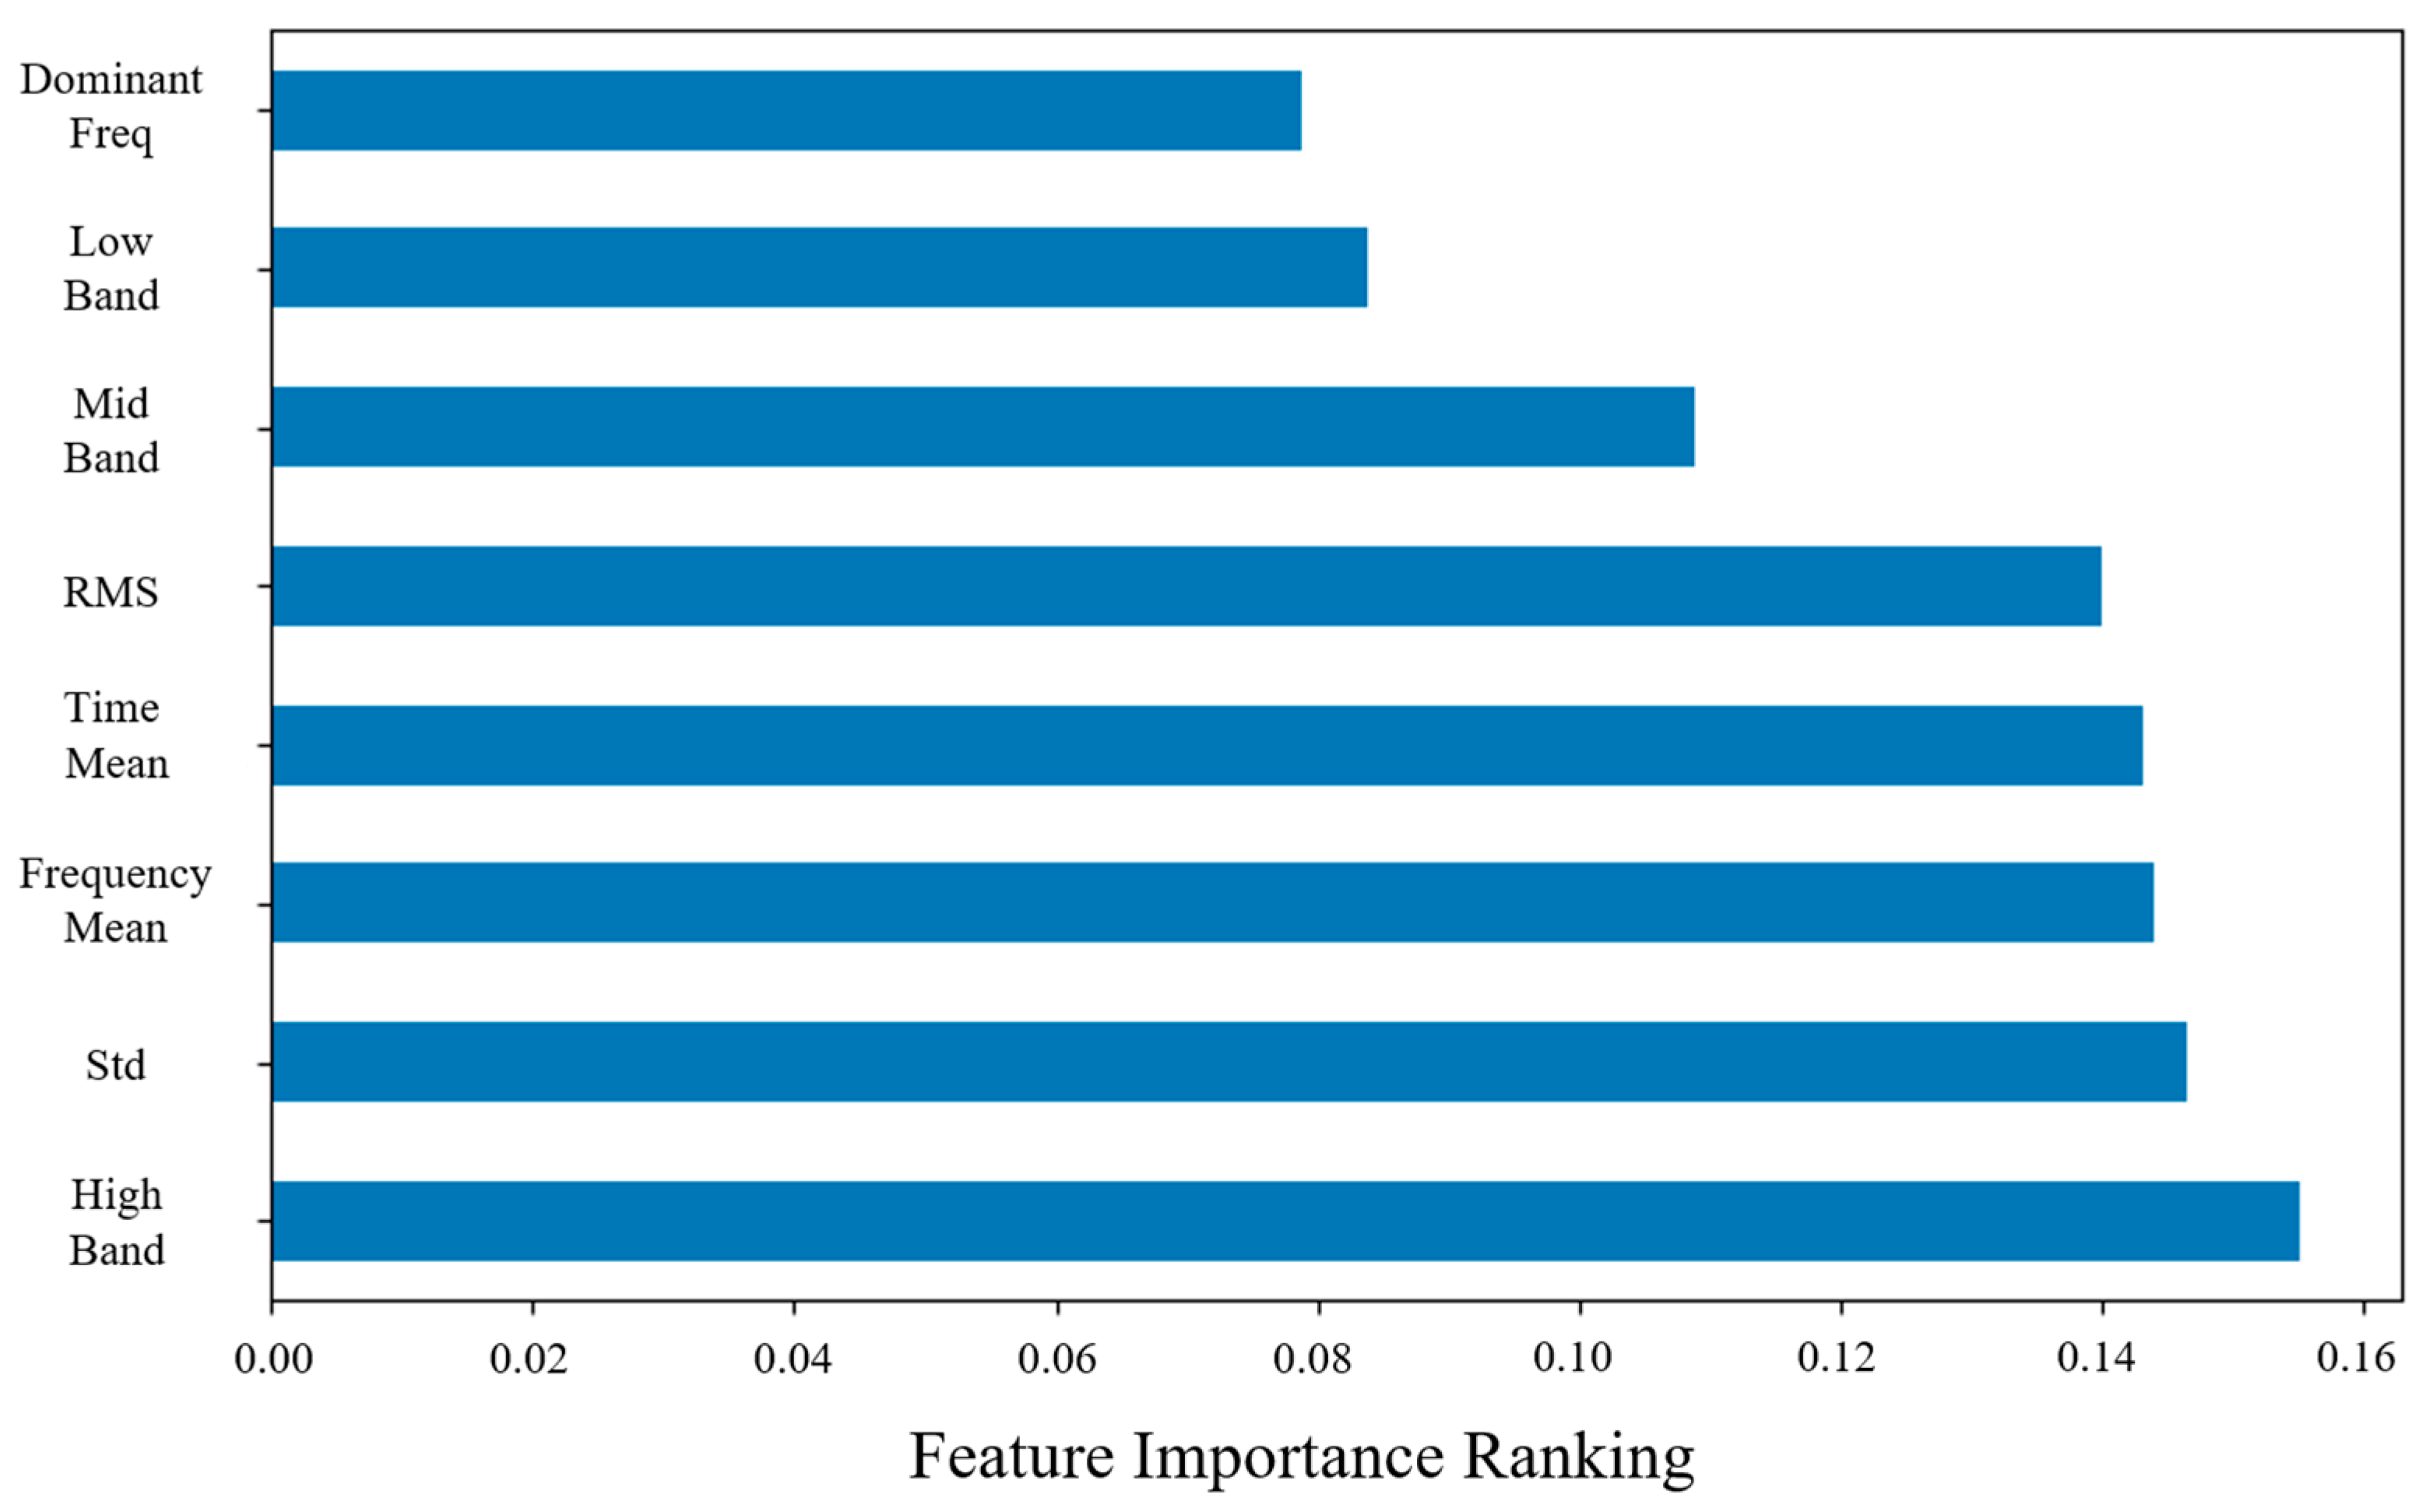
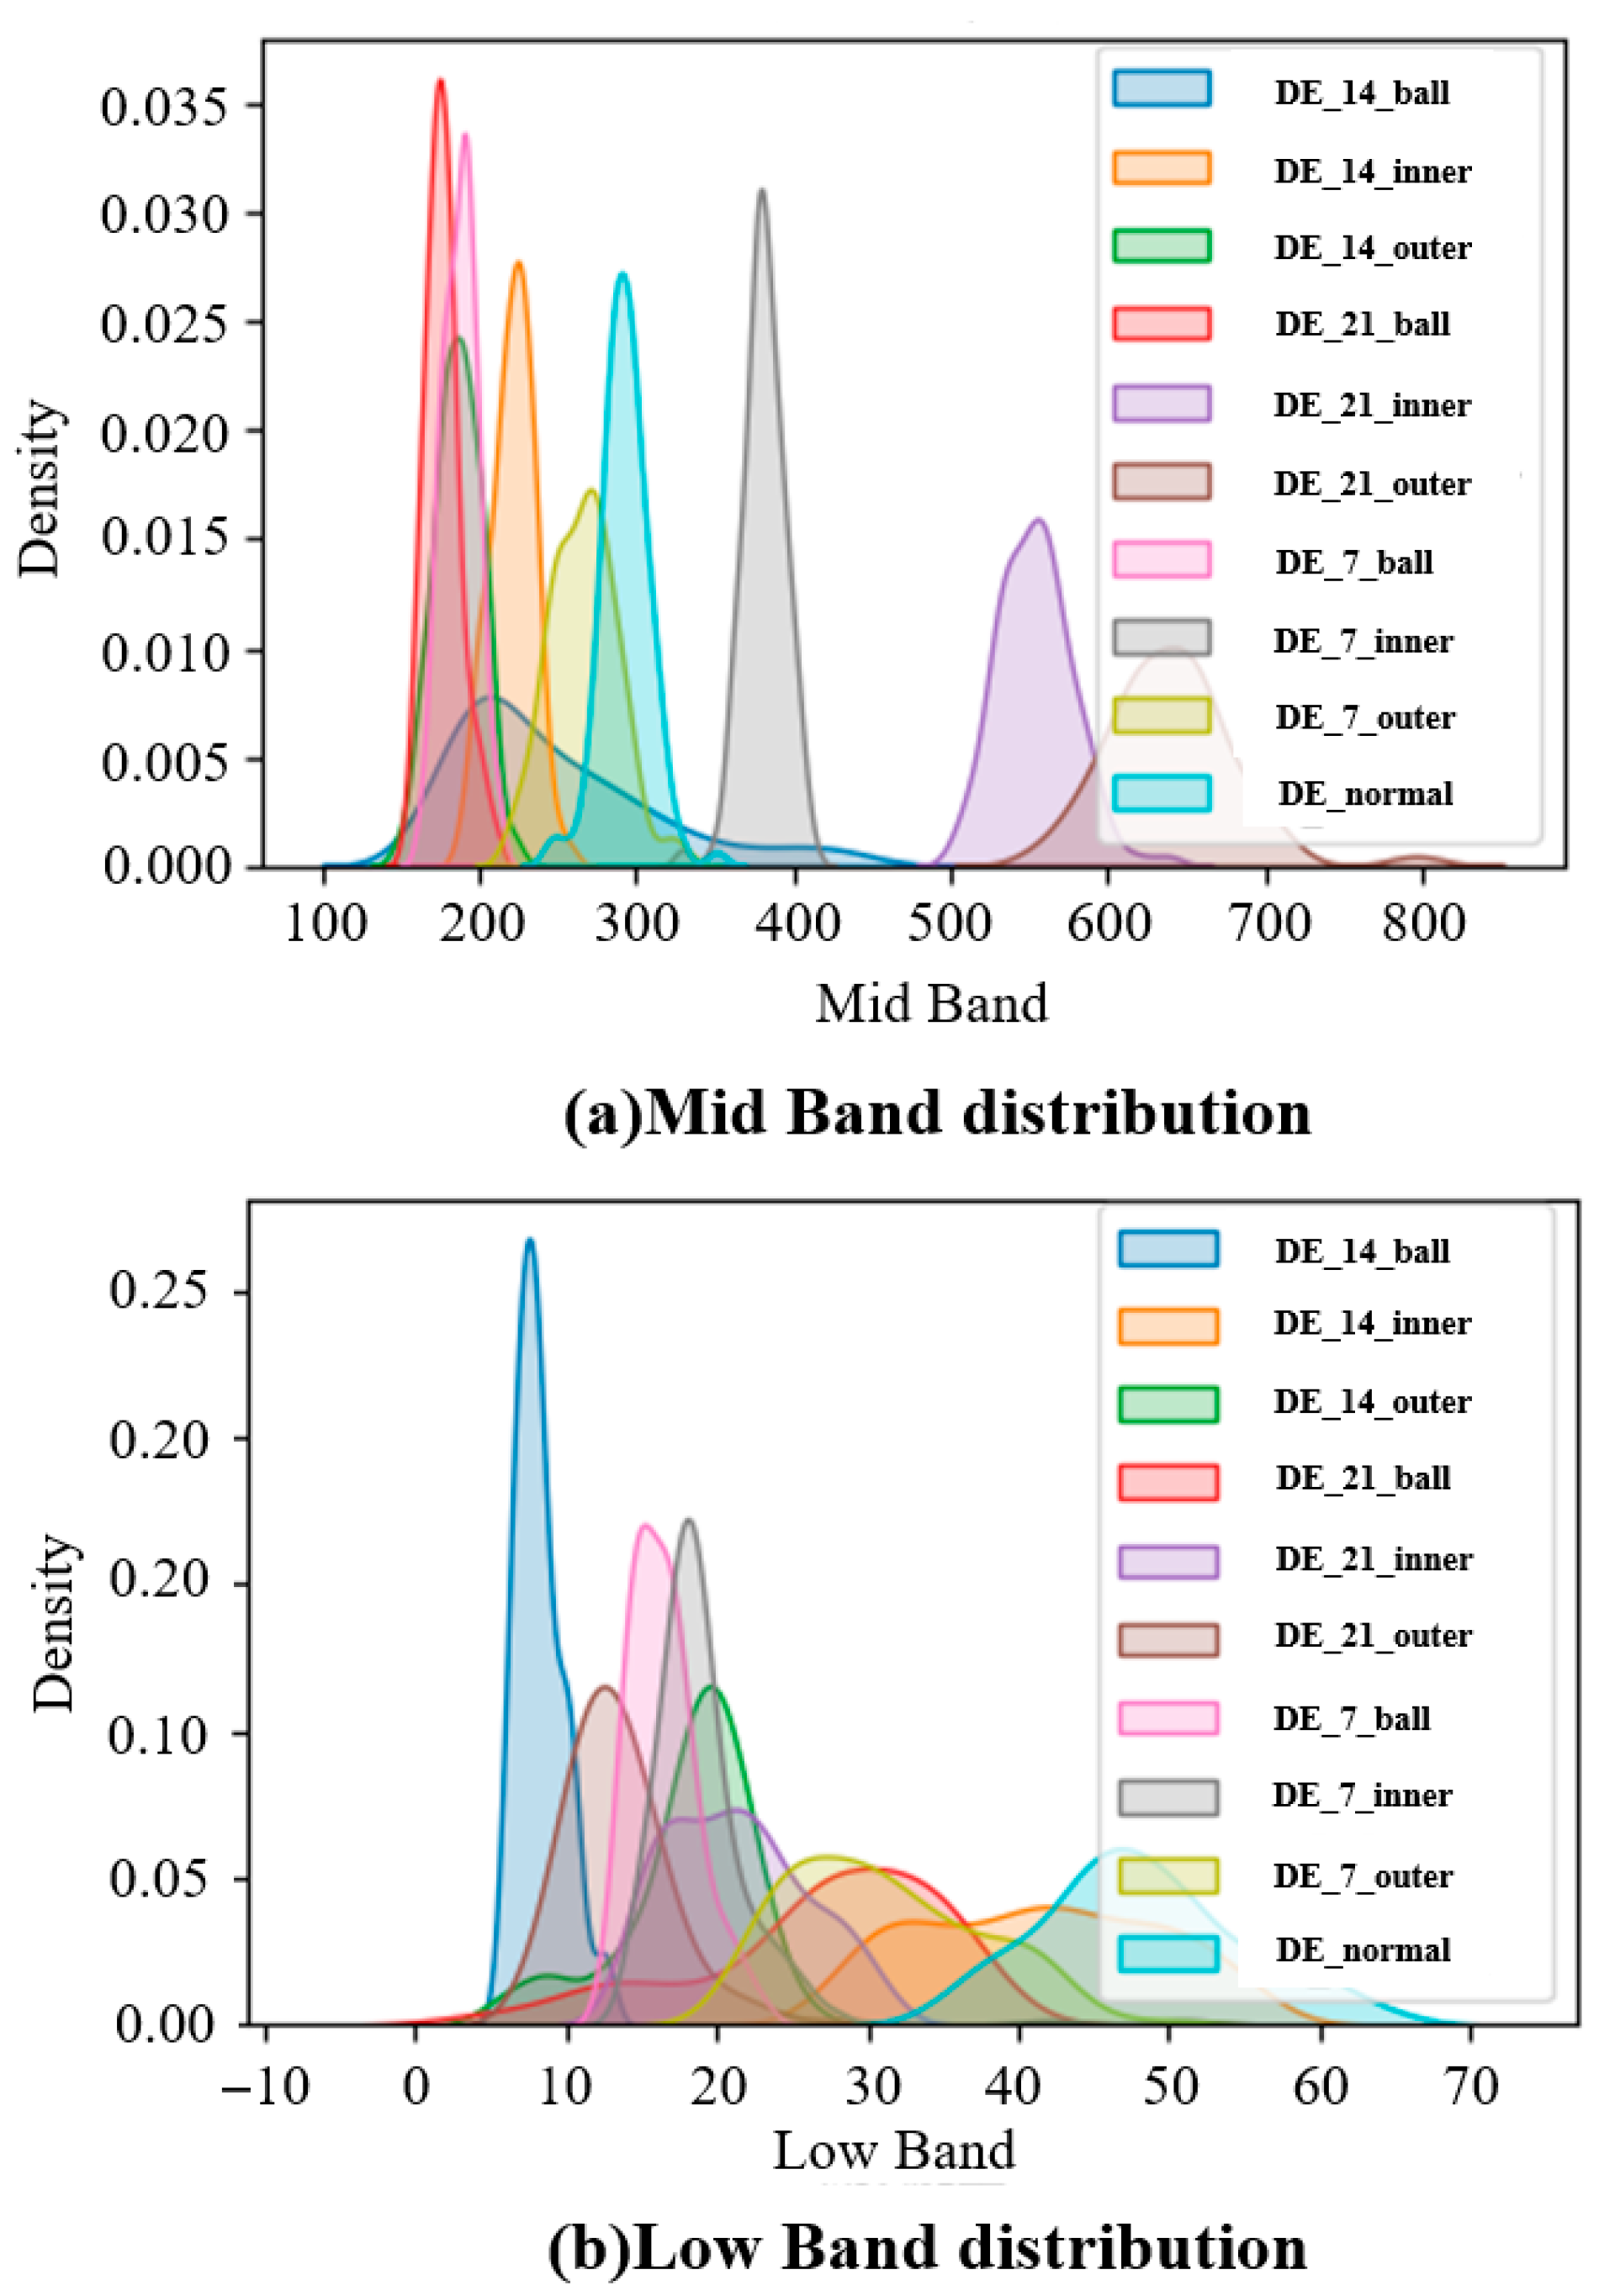
To validate the rationale behind the feature selection in this paper, which includes three time-domain features and five frequency-domain features, a feature correlation analysis was conducted. Figure 16 below shows the importance ranking, while Figure 17 depicts the Pearson correlation coefficient matrix for the eight features. Figure 16 shows that high-frequency energy is the most critical feature, demonstrating that energy distribution in the high-frequency band significantly impacts model performance. Feature importance values exceeding 0.14 were observed for time-domain standard deviation, frequency-domain mean, time-domain mean, and RMS, indicating that statistical characteristics in both time and frequency domains significantly influence model performance. Mid-frequency and low-frequency energy are ranked sixth and seventh in terms of importance, respectively, while the dominant frequency position is ranked as the least important. This suggests that the singular peak frequency location in the data provides weak discriminative power for classification or prediction. Determining feature correlation and redundancy requires an examination of the absolute values of the Pearson correlation coefficients between features. As Figure 17 shows, all the correlation coefficients in the current matrix have absolute values below 0.7, with the highest being 0.68. Therefore, there are no strong correlations among the eight features. Specifically, no correlation exists between the dominant frequency position and the other features. The correlation between low-frequency energy and the time-domain mean is 0.65, while the correlations between mid-frequency energy and the time-domain standard deviation, root mean square (RMS), and the frequency-domain mean are 0.68, 0.67, and 0.72. Feature subset ablation experiments were conducted. These defined the removal of mid-band energy, low-band energy, and the simultaneous removal of mid- and low-band energy as ablation groups 1, 2, and 3, respectively. The results of these experiments are shown in Table 10. Removing mid-band energy alone resulted in a 1.51% decrease in the model’s average accuracy. Removing low-band energy alone resulted in an average accuracy decrease of 1.73%, while simultaneously removing mid- and low-band energy resulted in an average accuracy decrease of 2.6%. This indicates that mid–low-band energy significantly enhances the model’s performance. To investigate the effect of mid–low-frequency energy on model performance in more detail, the feature distributions of mid-band and low-band energy were compared. The feature distribution comparison diagram clearly illustrates the differences in the distribution of mid-band and low-band energy across different categories. Figure 18 shows the feature distribution comparison diagram for mid-band and low-band energy.
Figure 18 shows that the mid-frequency energy distribution exhibits a multi-peak characteristic. The DE_14_ball category has the highest mid-frequency energy peak, forming a distinct single peak between 300 and 400 Hz, which differs from the peaks observed in the other categories. Meanwhile, DE_21_ball and DE_7_ball exhibit a bimodal distribution between 200 and 400, and the low-frequency energy distribution shows distinct zones of energy concentration. DE_14_outer demonstrates an extremely high peak in low-frequency energy, forming a single peak near zero. This indicates that its signal components are predominantly of a low frequency. This suggests that, although mid-frequency and low-frequency signals are somewhat correlated with other features, they significantly contribute to specific faults. Thus, joint analysis confirms that the eight selected features demonstrate excellent performance in terms of both data distribution and model contribution, making their selection both reasonable and necessary.

4. Conclusions and Future Work

In order to cope with the problems of insufficient feature extraction and poor model performance in high-noise environments in current bearing fault diagnosis methods, this paper designs a GCOS-1DCNN-dual MLP-bidirectional cross-attention mechanism model, which gives full play to the advantages of 1DCNN for extracting temporal data and bidirectional cross-attention mechanism for feature fusion. The model constructed in this paper provides a new way and idea of extracting fault diagnosis for bearings, including the ability of dual MLP to deeply extract time-domain and frequency-domain features while using bidirectional cross-attention mechanism to deeply fuse multimodal features, and also designed a learning rate optimizer, which can automatically adjust the learning rate during the model learning process to cope with the shortcomings of slow learning speed and overfitting of the model. In fifteen independent validation experiments using the Case Western Reserve University bearing dataset, the model demonstrated an average accuracy of 99.83%, exhibiting exceptional robustness. Meanwhile, noise is added to the original dataset, noise experiments are conducted, and the results show that the model proposed in this paper still maintains a high accuracy of 90.66% and 86.72% under the strong noise levels of 0 dB and −5 dB. This shows that the model proposed in this paper has the advantages of high recognition accuracy, good robustness, and strong noise resistance.
Future work should evaluate the model’s adaptability to noise scenarios beyond Gaussian noise—such as pink noise and impulse/impact noise—to better address diverse noise conditions encountered in industrial applications. Additionally, research into scheduler sensitivity is warranted.
Author Contributions

Conceptualization, A.S.; methodology, A.S. and L.M.; software, A.S.; validation, A.S.; formal analysis, M.D. and H.Y.; investigation, A.S., M.D. and M.S.; resources, L.M.; data curation, K.H. and F.D.; writing—original draft preparation, A.S.; writing—review and editing, A.S.; visualization, L.M.; supervision, K.H., Z.F., C.L. and M.S.; project administration, L.M.; funding acquisition, L.M. and F.D. All authors have read and agreed to the published version of the manuscript.

Funding

This research was funded by the outstanding youth project of the Education Department of Hunan Province, China (24B0792, 23B0799), and the Changsha Municipal Natural Science Foundation (kq2402042), the Science and Technology Research and Development Command Plan Project of Zhangjiakou, China (2311005A), Hebei Province graduate student innovation ability training funding project (CXZZSS2025127), Graduate Student Innovation Fund Grants, Established Projects of Hebei University of Architecture (XY2025033), Graduate Student Innovation Fund Grants Established Projects of Hebei University of Architecture (XY2024080), and the 2024 Annual Project Topics of the “14th Five-Year Plan” for Educational Science Research in Hebei Province (2403199).

Data Availability Statement

The original contributions presented in this study are included in this article. Further inquiries can be directed to the corresponding author(s).

Conflicts of Interest

The authors declare no conflicts of interest.

References

  1. Song, Q.; Jiang, X.; Du, G.; Liu, J.; Zhu, Z. Smart multichannel mode extraction for enhanced bearing fault diagnosis. Mech. Syst. Signal Process. 2023, 189, 110107. [Google Scholar] [CrossRef]
  2. Zhao, W.; Wang, Z.; Cai, W.; Zhang, Q.; Wang, J.; Du, W.; Yang, N.; He, X. Multiscale inverted residual convolutional neural network for intelligent diagnosis of bearings under variable load condition. Measurement 2022, 188, 110511. [Google Scholar] [CrossRef]
  3. Hoang, D.; Kang, H. Rolling element bearing fault diagnosis using convolutional neural network and vibration image. Cogn. Syst. Res. 2019, 53, 42–50. [Google Scholar] [CrossRef]
  4. Meng, Z.; Zhan, X.; Li, J.; Pan, Z. An enhancement denoising autoencoder for rolling bearing fault diagnosis. Measurement 2018, 130, 448–454. [Google Scholar] [CrossRef]
  5. Jin, Y.; Song, X.; Yang, Y.; Hei, X.; Feng, N.; Yang, X. An improved multi-channel and multi-scale domain adversarial neural network for fault diagnosis of the rolling bearing. Control. Eng. Pr. 2025, 154, 106120. [Google Scholar] [CrossRef]
  6. Rai, V.K.; Mohanty, A.R. Bearing fault diagnosis using FFT of intrinsic mode functions in Hilbert–Huang transform. Mech. Syst. Signal Process. 2007, 21, 2607–2615. [Google Scholar] [CrossRef]
  7. Rajeswari, C.; Sathiyabhama, B.; Devendiran, S.; Manivannan, K. Bearing Fault Diagnosis using Wavelet Packet Transform, Hybrid PSO and Support Vector Machine. Procedia Eng. 2014, 97, 1772–1783. [Google Scholar] [CrossRef]
  8. Saidi, L.; Ben Ali, J.; Fnaiech, F. Bi-spectrum based-EMD applied to the non-stationary vibration signals for bearing faults diagnosis. ISA Trans. 2014, 53, 1650–1660. [Google Scholar] [CrossRef] [PubMed]
  9. Liu, Z.; Peng, D.; Zuo, M.J.; Xia, J.; Qin, Y. Improved Hilbert–Huang transform with soft sifting stopping criterion and its application to fault diagnosis of wheelset bearings. ISA Trans. 2022, 125, 426–444. [Google Scholar] [CrossRef]
  10. Wang, B.; Qiu, W.; Hu, X.; Wang, W. A rolling bearing fault diagnosis technique based on recurrence quantification analysis and Bayesian optimization SVM. Appl. Soft Comput. 2024, 156, 111506. [Google Scholar] [CrossRef]
  11. Mansouri, M.; Fezai, R.; Trabelsi, M.; Mansour, H.; Nounou, H.; Nounou, M. Fault Diagnosis of Wind Energy Conversion Systems Using Gaussian Process Regression-based Multi-Class Random Forest. IFAC-PapersOnLine 2022, 55, 127–132. [Google Scholar] [CrossRef]
  12. Pandya, D.; Upadhyay, S.; Harsha, S. Fault diagnosis of rolling element bearing with intrinsic mode function of acoustic emission data using APF-KNN. Expert Syst. Appl. 2013, 40, 4137–4145. [Google Scholar] [CrossRef]
  13. Gao, S.; Li, T.; Zhang, Y.; Pei, Z. Fault diagnosis method of rolling bearings based on adaptive modified CEEMD and 1DCNN model. ISA Trans. 2023, 140, 309–330. [Google Scholar] [CrossRef]
  14. Guo, Z.; Yang, M.; Huang, X. Bearing fault diagnosis based on speed signal and CNN model. Energy Rep. 2022, 8, 904–913. [Google Scholar] [CrossRef]
  15. Li, Z.-B.; Feng, X.-Y.; Wang, L.; Xie, Y.-C. DC–DC circuit fault diagnosis based on GWO optimization of 1DCNN-GRU network hyperparameters. Energy Rep. 2023, 9, 536–548. [Google Scholar] [CrossRef]
  16. He, D.; Ye, K.; Yuan, J.; Li, S.; Xu, S. Prediction of inlet gas volume fraction of rotary vane pump under variable operational conditions with 1DCNN-TL model utilizing vibration signals. Int. J. Heat Fluid Flow 2024, 110, 109588. [Google Scholar] [CrossRef]
  17. Mystkowski, A.; Wolniakowski, A.; Idzkowski, A.; Ciężkowski, M.; Ostaszewski, M.; Kociszewski, R.; Kotowski, A.; Kulesza, Z.; Dobrzański, S.; Miastkowski, K. Measurement and diagnostic system for detecting and classifying faults in the rotary hay tedder using multilayer perceptron neural networks. Eng. Appl. Artif. Intell. 2024, 133, 108513. [Google Scholar] [CrossRef]
  18. Zou, F.; Zhang, H.; Sang, S.; Li, X.; He, W.; Liu, X.; Chen, Y. An anti-noise one-dimension convolutional neural network learning model applying on bearing fault diagnosis. Measurement 2021, 186, 110236. [Google Scholar] [CrossRef]
  19. Xie, S.; Li, Y.; Tan, H.; Liu, R.; Zhang, F. Multi-scale and multi-layer perceptron hybrid method for bearings fault diagnosis. Int. J. Mech. Sci. 2022, 235, 107708. [Google Scholar] [CrossRef]
  20. Sinitsin, V.; Ibryaeva, O.; Sakovskaya, V.; Eremeeva, V. Intelligent bearing fault diagnosis method combining mixed input and hybrid CNN-MLP model. Mech. Syst. Signal Process. 2022, 180, 109454. [Google Scholar] [CrossRef]
  21. Song, B.; Liu, Y.; Fang, J.; Liu, W.; Zhong, M.; Liu, X. An optimized CNN-BiLSTM network for bearing fault diagnosis under multiple working conditions with limited training samples. Neurocomputing 2024, 574, 127284. [Google Scholar] [CrossRef]
  22. Bharatheedasan, K.; Maity, T.; Kumaraswamidhas, L.; Durairaj, M. Enhanced fault diagnosis and remaining useful life prediction of rolling bearings using a hybrid multilayer perceptron and LSTM network model. Alex. Eng. J. 2025, 115, 355–369. [Google Scholar] [CrossRef]
  23. Wang, H.; Xu, J.; Yan, R.; Sun, C.; Chen, X. Intelligent Bearing Fault Diagnosis Using Multi-Head Attention-Based CNN. Procedia Manuf. 2020, 49, 112–118. [Google Scholar] [CrossRef]
  24. Snyder, Q.; Jiang, Q.; Tripp, E. Integrating self-attention mechanisms in deep learning: A novel dual-head ensemble transformer with its application to bearing fault diagnosis. Signal Process. 2025, 227, 109683. [Google Scholar] [CrossRef]
  25. Cui, L.; Tian, X.; Wei, Q.; Liu, Y. A self-attention based contrastive learning method for bearing fault diagnosis. Expert Syst. Appl. 2024, 238, 121645. [Google Scholar] [CrossRef]
  26. Jiang, P.; Wang, Y.; Yang, C.; Zhang, L.; Duan, B. Fault diagnosis of wind power pitch bearings based on spatiotemporal clustering and a deep attention subdomain adaptive residual network. Measurement 2025, 242, 116187. [Google Scholar] [CrossRef]
  27. Niu, Z.; Zhong, G.; Yu, H. A review on the attention mechanism of deep learning. Neurocomputing 2021, 452, 48–62. [Google Scholar] [CrossRef]
Figure 1. 1DCNN-MLP-cross-attention mechanism.
Machines 13 00819 g001
Figure 2. Time–frequency plot of 0.014-inch rolling ball faults at 12 k drive end.
Machines 13 00819 g002
Figure 3. Energy superposition diagram.
Machines 13 00819 g003
Figure 4. Convolution kernel.
Machines 13 00819 g004
Figure 5. Pooling layer window and step size.
Machines 13 00819 g005
Figure 6. Cross-attention fusion mechanism.
Machines 13 00819 g006
Figure 7. Experimental platform.
Machines 13 00819 g007
Figure 8. Results of ablation experiments.
Machines 13 00819 g008
Figure 9. Effect of GCOS learning rate scheduler on accuracy loss rate.
Machines 13 00819 g009
Figure 10. Learning rate change curve.
Machines 13 00819 g010
Figure 11. Comparison of 0.014-inch rolling seek fault noise at 12 k drive end.
Machines 13 00819 g011
Figure 12. Accuracy of each model under different noise intensities.
Machines 13 00819 g012
Figure 13. Confusion matrix for GCOS-1DCNN-MLP-Cross-Attention mechanism with 0 dB noise.
Machines 13 00819 g013
Figure 14. Accuracy of each model under variable loads and different signal-to-noise ratios.
Machines 13 00819 g014
Figure 15. Confusion Matrix for GCOS-1DCNN-MLP-Cross-Attention mechanism under variable loading and 0 dB noise.
Machines 13 00819 g015
Figure 16. Feature importance ranking.
Machines 13 00819 g016
Figure 17. Feature Pearson correlation coefficient matrix.
Machines 13 00819 g017
Figure 18. Distribution of mid-band and low-band energy characteristics.
Machines 13 00819 g018
Table 1. Detailed parameters of time- and frequency-domain MLPs.
Layer TypeNeuron NumberActivation FunctionRegularizationDropout Rate
Time domainDense256SwishL2 (0.01)0.3
Frequency domainDense1512SwishL2 (0.02)0
Dense2256SwishL2 (0.01)0.4
Table 2. Detailed parameters of enhanced 1DCNN.
Layer TypeKey ParametersExports
Input1024 points1024 × 1
Conv1D_1Convolutional kernel size = 71024 × 128
Maxpool1D_1Pooling window size = 4256 × 128
Conv1D_2Convolutional kernel size = 5256 × 128
Conv1D_3Convolutional kernel size = 5256 × 64
Maxpool1D_2Pooling window size = 2128 × 64
GlobalMaxpool1D 64
Dense 128
Table 3. Experimental data.
Fault CategoryFault DiameterSample Size
Normalcy 99
Inner ring failure799
Outer ring failure799
Rolling body failure799
Inner ring failure1499
Outer ring failure1499
Rolling body failure1499
Inner ring failure2199
Outer ring failure2199
Rolling body failure2199
Table 4. The average of 15 independent experiments and the accuracy rate of the first five trials.
ModelAccuracy Average AccuracyStandard
Deviation
12345
GCOS-1DCNN-MLP-Cross-Attention99.4910099.4910099.8999.830.236
1DCNN-MLP-Cross-Attention99.3298.8998.4598.9899.4999.010.38
GCOS-1DCNN-MLP98.3998.6498.9998.4598.3998.70.251
MLP-CNN98.9997.4798.4898.9998.9998.650.593
MLP97.598.4897.9898.5897.6498.0660.38
1DCNN95.9895.9696.4696.9895.9896.470.896
Table 5. Ablation experiments.
Model1DCNNMLPGCOS
Learning Rate Scheduler
Cross-
Attention
AccuracyRecall RatePrecisionF1 Score
GCOS-1DCNN-MLP-Cross-Attention99.8399.7499.999.86
Cosine-1DCNN-MLP-Cross-Attention 99.3799.2999.4299.33
StepLR-1DCNN-MLP-Cross-Attention 99.1999.1499.399.17
Standard-1DCNN-MLP-Cross-Attention 99.08899.1299.0499.1
1DCNN-MLP-Cross-Attention 99.0199.198.7698.95
GCOS-1DCNN-MLP 98.798.698.8498.3
MLP-CNN 98.6598.6399.3198.34
MLP 98.06698.0198.1697.99
1DCNN 96.4796.8696.4695.88
Table 6. Accuracy of each model with different signal-to-noise ratios.
ModelSNR
−505101420
GCOS-1DCNN-MLP-Cross-Attention86.7290.6694.797.4798.2398.74
CNN-Transformer67.1770.2077.2783.8487.3796.46
Traditional MLP-CNN32.325072.7382.8389.996
MLP21.2136.8758.0870.7182.3292.42
1DCNN11.1123.7441.9237.8866.1685.35
LSTM36.1148.4458.869.7770.5371.99
Table 7. Training parameters for different methods.
ModelParameters/MFLOPs/BInference Latency/msGPU Throughput/Samples/sCPU Throughput/Samples/s1 s Signal Delay at a 1 kHz Sampling Rate/msTraining Time/min
GCOS-1DCNN-MLP-Cross-Attention12.82.10.0814,200210081.92.6
CNN-Transformer45.67.80.448006504008.2
Traditional MLP-CNN8.31.50.676001200614.43.5
MLP0.90.30.328,5003800307.21.2
1DCNN15.22.70.962001000921.64.1
LSTM24.74.22.11600220215015.3
Table 8. Experimental data under variable load noise conditions.
Motor Load (KW)Motor Speed (rpm)Data SegmentationSample Size
0 KW1797Training set99
0.7457 KW1772Validation set 33
0.7457 KW1772Test set33
Table 9. Variable load and accuracy rates of each model at different signal-to-noise ratios.
ModelSNR
−505101420
GCOS-1DCNN-MLP-Cross-Attention85.7286.7393.4794.895.2396.54
CNN-Transformer60.4268.2972.7382.8389.992
Traditional MLP-CNN32.1345.6365.3474.6681.7590.42
MLP20.1135.7748.5760.1966.2777.43
1DCNN10.0320.6439.9240.8750.1166.16
LSTM32.1640.1151.356.2260.5263.55
Table 10. Feature subset ablation experiment.
GroupAccuracyRecall RatePrecisionF1 Score
Primitive99.8399.7499.999.86
Group198.3298.4498.3798.41
Group298.198.0798.1398.11
Group397.2397.1297.3397.4
Disclaimer/Publisher’s Note: The statements, opinions and data contained in all publications are solely those of the individual author(s) and contributor(s) and not of MDPI and/or the editor(s). MDPI and/or the editor(s) disclaim responsibility for any injury to people or property resulting from any ideas, methods, instructions or products referred to in the content.