Article

Enhanced Voltage Stability and Fault Ride-Through Capability in Wind Energy Systems Using FACTS Device Integration

by
Khush N. Patel
1,
Nilaykumar A. Patel
1,
Jignesh Patel
1,
Jigar Sarda
2,* and
Mangal Sain
3,*
1
Department of Electrical Engineering, Chandubhai S. Patel Institute of Technology, Charotar University of Science & Technology, Changa 388421, India
2
Department of Computer Science & Engineering, Chandubhai S. Patel Institute of Technology, Charotar University of Science & Technology, Changa 388421, India
3
Division of Computer & Information Engineering, Dongseo University, Jurye-ro, Sasang-gu, Busan 49236, Republic of Korea
*
Authors to whom correspondence should be addressed.
Machines 2025, 13(9), 805; https://doi.org/10.3390/machines13090805
Submission received: 23 July 2025 / Revised: 29 August 2025 / Accepted: 2 September 2025 / Published: 3 September 2025
(This article belongs to the Special Issue Control and Mechanical System Engineering, 2nd Edition)

Abstract

In modern power systems, FACTS tools are essential for addressing voltage variation along with fault ride-through (FRT) challenges within the electrical power systems, particularly for wind generation integration. Several prominent publications emphasize that the squirrel cage induction generator (SCIG) currently comprises about 15% of operational wind turbines. This research proposes the use of FACTS devices to boost voltage stability and FRT capability. The implementation of these devices leads to improved efficiency in the electrical power system. This study considers many events, including an ideal wind profile, turbulent wind profile, symmetrical faults, and unsymmetrical faults, to support the proposed selection. Furthermore, the proposed approach is evaluated by comparison between a fixed capacitor, static synchronous compensator (STATCOM), and Static VAR Compensator (SVC) to guarantee the achievement of voltage stability, reactive power consumption, and FRT capacity under various wind speed profiles and fault conditions. An overall evaluation is conducted to compare them in all examined circumstances and to highlight their advantages and effects. The simulation findings demonstrate the efficacy and primacy of FACTS in enhancing the functioning of an integrated wind system, which is built upon a grid-connected SCIG, as well as enhancing the power system performance. The MATLAB/Simulink toolbox is used to design the models of SCIG, SVC, and STATCOM.

1. Introduction

Currently, there has been a significant rise in the adoption of sustainable energy generation technologies in electrical networks worldwide. Many countries aim to gradually replace conventional power plants, which rely heavily on fossil fuels, with renewable sources that harness natural resources. However, this transition presents considerable challenges. Reference [1] reviews the global energy sector and its connection to climate change, including energy consumption trends, renewable developments, and related policies. It also provides an overview of India’s energy resources, regulatory framework, power sector capacity, and renewable energy initiatives. Globally, the total renewable energy production capacity is 3372 GW, of which hydropower contributes the largest share at 1393 GW. Wind and solar energy follow with capacities of 899 GW and 1053 GW, respectively. Other contributions include 524 MW from marine energy, 149 GW from biofuels, and 15 GW from geothermal sources [2]. Despite these developments, the heavy reliance on intermittent and unpredictable sources such as wind creates challenges for maintaining the reliability and consistency of power systems—an issue that requires careful investigation.
Reference [3] primarily focuses on specific power quality (PQ) issues in traditional power systems, but lacks a holistic perspective on the unique impacts and monitoring needs of offshore wind integration. This review addresses that gap by systematically analyzing root causes, disturbance locations, and recent advancements in algorithmic solutions for PQ monitoring, with particular emphasis on emerging technologies such as synchronized waveform measurement (SWM). It also critically evaluates existing metrics and proposes a comprehensive system-wide monitoring framework tailored for grids with high offshore wind penetration. The objective is to guide future research and practical implementation for reliable, real-time PQ assessment in renewable energy systems. Extensive studies have already been conducted to assess the impact of large-scale wind power integration into conventional grids. To ensure the quality of power supply, frequency and voltage regulation remain crucial considerations. Reference [4] provides valuable insights into power system operation and renewable integration, particularly the challenges of voltage instability in wind-integrated systems. Maintaining a balance between reactive and real power generation and load demand is essential to safeguard grid reliability. In the early stages of wind power development, fixed-speed wind generators (FSWGs) using squirrel cage induction generators (SCIGs) were widely adopted. Reference [5] highlights the evolution from conventional SCIG control to advanced methods, including direct DC-link current control, to improve supply-demand balance. More recently, advanced wind turbine technologies such as permanent magnet synchronous generators (PMSGs) and doubly fed induction generators (DFIGs) have emerged. Although SCIGs currently account for around 15% of installed capacity, the growing preference for DFIGs in new offshore projects is evident. Nevertheless, due to the large installed base, SCIGs are expected to remain significant, retaining an estimated 8% share of the global wind farm industry by 2030 [6].
However, the widespread deployment of the aforementioned equipment has faced several challenges. The SCIG has a relatively simple design, with its stator windings directly connected to the grid, while the rotor windings are deliberately short-circuited and therefore unavailable for electrical control. This configuration does not incorporate a power converter or any internal mechanism to regulate reactive and real power. Reference [7] addresses this limitation by introducing a grid-forming control structure for self-excited SCIG-based WECSs, employing a STATCOM for reactive power compensation and a prime mover speed controller for active power balancing. Due to its inherent design, the SCIG requires a specific amount of reactive power in the stator windings to establish the magnetic field. Under steady-state conditions, its reactive power demand is typically reduced through the use of capacitors for compensation, which can be switched in or out to match varying power levels. Reference [8] demonstrates the use of a fixed capacitor as a dynamic compensator in conjunction with STATCOM. In this study, SCIG performance during startup and load variations was analyzed using a fixed capacitor and both six- and twelve-pulse STATCOMs as reactive power compensators.
This behavior generally follows a smooth progression but becomes problematic during grid disturbances. When voltage dips occur, the wind turbine’s active power output drops rapidly, while the generator still relies on the grid for connection support. Such faults aggravate voltage instability, often leading to overspeed or undervoltage conditions that cause fixed-speed wind generators (FSWGs) to trip [9]. Reference [10] analyzes the impact of fault-induced voltage dips on frequency stability in high wind penetration systems, emphasizing the risks associated with delayed active power recovery and voltage oscillations in wind turbines across different system scenarios. Although these processes assist in restoring voltage stability, they simultaneously restrict active power delivery, thereby disrupting the overall stability of the grid.
High-income countries are increasingly required to establish new grid codes mandating that wind energy systems possess low-voltage ride-through (LVRT) capability [11,12]. This means that wind systems must remain operational during voltage dips and must also provide reactive power support to help restore system voltage. However, squirrel cage induction generators (SCIGs) are unable to perform this function independently. With respect to reactive power, reference [13] proposes limits on the total reactive power capability of variable-speed SCIG-based wind turbines, taking into account stator voltage/current constraints, generator stability, and inverter ratings. It also develops PQ control strategies and designs DC bus capacitance to support reactive power delivery and reduce current ripples. Additional equipment is therefore required to meet performance criteria, and in this context, Flexible AC Transmission System (FACTS) devices have proven critical. FACTS technologies such as STATCOM and SVC are widely recognized as effective solutions for addressing voltage regulation and reactive power challenges in fixed-speed wind generators (FSWG) [14]. Reference [15] provides a comprehensive review of voltage source converter (VSC)-based FACTS controllers—including STATCOM, SSSC, UPFC, and IPFC—highlighting their control strategies, integration challenges, and contributions to improved voltage regulation, power quality, stability, and efficiency in hybrid microgrid, while also outlining future research directions. Furthermore, when wind farms are connected to the grid via series-compensated transmission lines, they can experience severe rotor oscillations known as sub-synchronous resonance (SSR). The integration of FACTS devices has been shown to successfully mitigate this issue [16]. By connecting with FSWGs, FACTS devices improve the quality of energy delivered to the main grid and enable compliance with LVRT requirements set out in new grid codes. Depending on the installation, STATCOM and SVC can be configured in parallel with SCIG output terminals and can also be employed to stabilize shaft oscillations [17].
Research efforts have largely focused on integrating STATCOM and SVC into wind farms (WFs). Significant attention has been directed toward enhancing the low-voltage ride-through (LVRT) capability of fixed-speed wind generators (FSWGs) through the use of Static Synchronous Compensators, ensuring compliance with modern grid code requirements. Moreover, studies such as [18,19,20,21] have proposed advanced architectures in which energy storage units are incorporated into the STATCOM system to enable efficient management of real power flow and improve frequency regulation in power systems. While both SVC and STATCOM are used for reactive power compensation, they differ in terms of controllability and configuration. A comparative study of reactive power control strategies for wind farms employing these devices is presented in [22], highlighting their respective operational characteristics under similar conditions. However, existing literature still lacks comprehensive sources that directly compare the two methods. Therefore, in this work, particular emphasis is placed on analyzing their behavior in the context of grid-connected FSWGs.
Reference [23] presents a comprehensive multi-objective control framework for hybrid wind farms aimed at enhancing voltage stability, frequency regulation, and mechanical power management across healthy, faulty, grid-tied, and off-grid operating conditions. The proposed strategy incorporates both local and central controllers, along with SVCs and STATCOMs, to ensure robust performance, improved fault ride-through capability, and resilience against disturbances and unbalanced grid conditions. Numerical simulations conducted in MATLAB/Simulink validate the effectiveness of the scheme, demonstrating its ability to coordinate the operation of DFIG and SCIG wind turbines for reliable and resilient renewable energy integration into power grids. Table 1 provides a summary of the reviewed work.
Despite significant advances in variable-speed wind energy conversion systems, FSWGs remain widely deployed across existing wind farms due to their cost-effectiveness and large installed base. However, their inherent limitations, such as poor voltage regulation, weak FRT capability, and vulnerability under turbulent wind conditions, continue to pose operational and reliability challenges. Addressing these limitations requires advanced compensation and control strategies capable of ensuring system stability and improving grid compliance.
In this context, the present study introduces innovative approaches that not only enhance the performance of FSWG-based wind systems but also provide practical application value for modern power grids. The novelty lies in the systematic examination of turbulent wind profiles and multiple grid fault scenarios, coupled with the integration of advanced FACTS-based compensation strategies. Furthermore, the control methodologies proposed for FACTS devices demonstrate superior adaptability and robustness compared to conventional fixed-capacitor solutions.
The primary contributions of this article are as follows:
(i)
A grid-connected wind system comprising six FSWGs is systematically examined under diverse operating conditions, including both ideal and turbulent wind profiles, as well as multiple grid fault scenarios. This provides new insights into the dynamic challenges faced by conventional FSWG-based wind farms, which are often overlooked in favour of modern variable-speed systems.
(ii)
The study investigates the integration and performance of FACTS devices to improve voltage stability, enhance fault ride-through (FRT) capability, and strengthen the overall reliability of modern power systems. The work highlights how FACTS-based compensation offers a more flexible and robust alternative compared to traditional fixed capacitor methods.
(iii)
The article develops and evaluates control strategies specifically tailored for the optimal operation of FACTS devices within wind farm systems. These strategies demonstrate superior performance across various operational scenarios, establishing their practical application value in improving system stability, reducing downtime, and supporting large-scale wind energy integration into power grids.
The organization of this paper is as follows. Section 2 provides a description of the WF. The models of the FACTS are outlined in Section 3. Section 4 provides a comprehensive analysis of simulations. Finally, the study’s findings are outlined in Section 5.

2. Description of the Wind Farm

MATLAB/Simulink 2024 was used to model the wind farm, which was evaluated with several FACTS devices to analyze system behavior. The structure consists of three identical branches connected to a central node, which serves as the output terminal of the wind farm. Each branch contains two fixed-speed wind turbines equipped with SCIG technology, with each SCIG rated at 1.5 MW. This results in a maximum output of 3 MW per branch and a total farm capacity of 9 MW. Each generator set is also connected to a 400 kVAR capacitor for reactive power compensation. Figure 1 illustrates the configuration. A voltage transformer is employed to step up the SCIG output from 575 V to 25 kV, ensuring compatibility with the PCC. Within each branch, three VTs rated at 4 MVA (575 V/25 kV) are installed. A 1 km transmission line, modelled using the π-equivalent, connects the farm divisions.
For cases involving FACTS integration, the central node also serves as the connection point for these devices. An additional branch is connected in parallel with the FACTS devices, and the remainder of the line links the wind farm to the PCC, as shown in Figure 2. A 25 km transmission line, also modelled using the π-equivalent, connects the farm to a step-up transformer, which raises the voltage from 25 kV to 120 kV to meet the PCC requirements of a 47 MVA grid. Finally, the grid is modelled as a three-phase AC power source acting as a slack bus, ensuring a stable voltage magnitude and frequency at the PCC.

2.1. Modelling of Wind Generated Energy System (WGES)

The entire doubly fed wind power system can be roughly divided into three parts: the part that converts wind energy into mechanical energy, the part that converts mechanical energy into electrical energy, and the part that controls the conversion process, which mainly includes wind rotors, drive chains, generators, and controllers. Wind speed exhibits considerable randomness, and various factors, including region, weather, time, season, and terrain, influence its fluctuations. Commonly used models are:
(1)
Wind speed is simulated by combining turbulence and average wind.
(2)
Wind speed is simulated by combining step wind, average wind, random wind, and gust wind.
According to the different research focuses, the corresponding combination selection can be obtained. In this paper, the rotor short circuit fault of the doubly fed generator will be simulated, so the wind speed model is simplified, and the influence of the random characteristics of the wind speed on the fault is not considered as much as possible.
The wind turbine’s function is to convert the kinetic energy into mechanical energy which is shown in Figure 3. The wind wheel is the component that converts the kinetic energy of the wind into mechanical energy. It marks the beginning of energy conversion throughout the entire system. It is mainly used to convert wind energy into mechanical torque Tm and output it to the doubly fed generator. A comprehensive analysis of wind turbine modelling has been extensively covered in [23]. In the given equation, the coefficient of performance, denoted as Cp, is directly linked to the pitch angle of the blade (β) and the ratio of tip to speed (λ). For the SCIG, Cp is determined by:
C p ( λ , β ) = 0.5176 116 λ i 0.4 β 5 exp 21 / λ i + 0.0068 λ
1 λ i = 1 λ + 0.08 β 0.035 β 3 + 1
λ = ω m R V w i n d
The turbine’s mechanical output power is denoted by Equation (4).
P m = 0.5 c p ρ A ( V w i n d ) 3
where A is the turbine swept area, ρ is the air density, and Vwind is the wind speed.
The value of ωm can be derived using Equation (3).
T t u r = P m ω m
T t u r = J e q d ω m d t + B e q · ω m + T e
The wind turbine is a core device that converts the mechanical energy generated by the wind into electrical energy. The corresponding electrical parameters can be calculated by inputting the wind turbine torque. To facilitate system analysis and model building, the following assumptions are usually made for the doubly fed turbine:
(1)
The influence of temperature and frequency on the corresponding parameter values of the motor is not taken into account, and spatial harmonics, magnetic saturation, and core loss are ignored.
(2)
The stator and rotor windings are symmetrically distributed, using Y-type connection and fixed values of self-inductance and mutual inductance.
(3)
The rotor side is converted to the stator side, and the ratio of the number of turns of the converted winding is 1.
Using the above assumptions, the model of the wind turbine will be as shown in Figure 4.
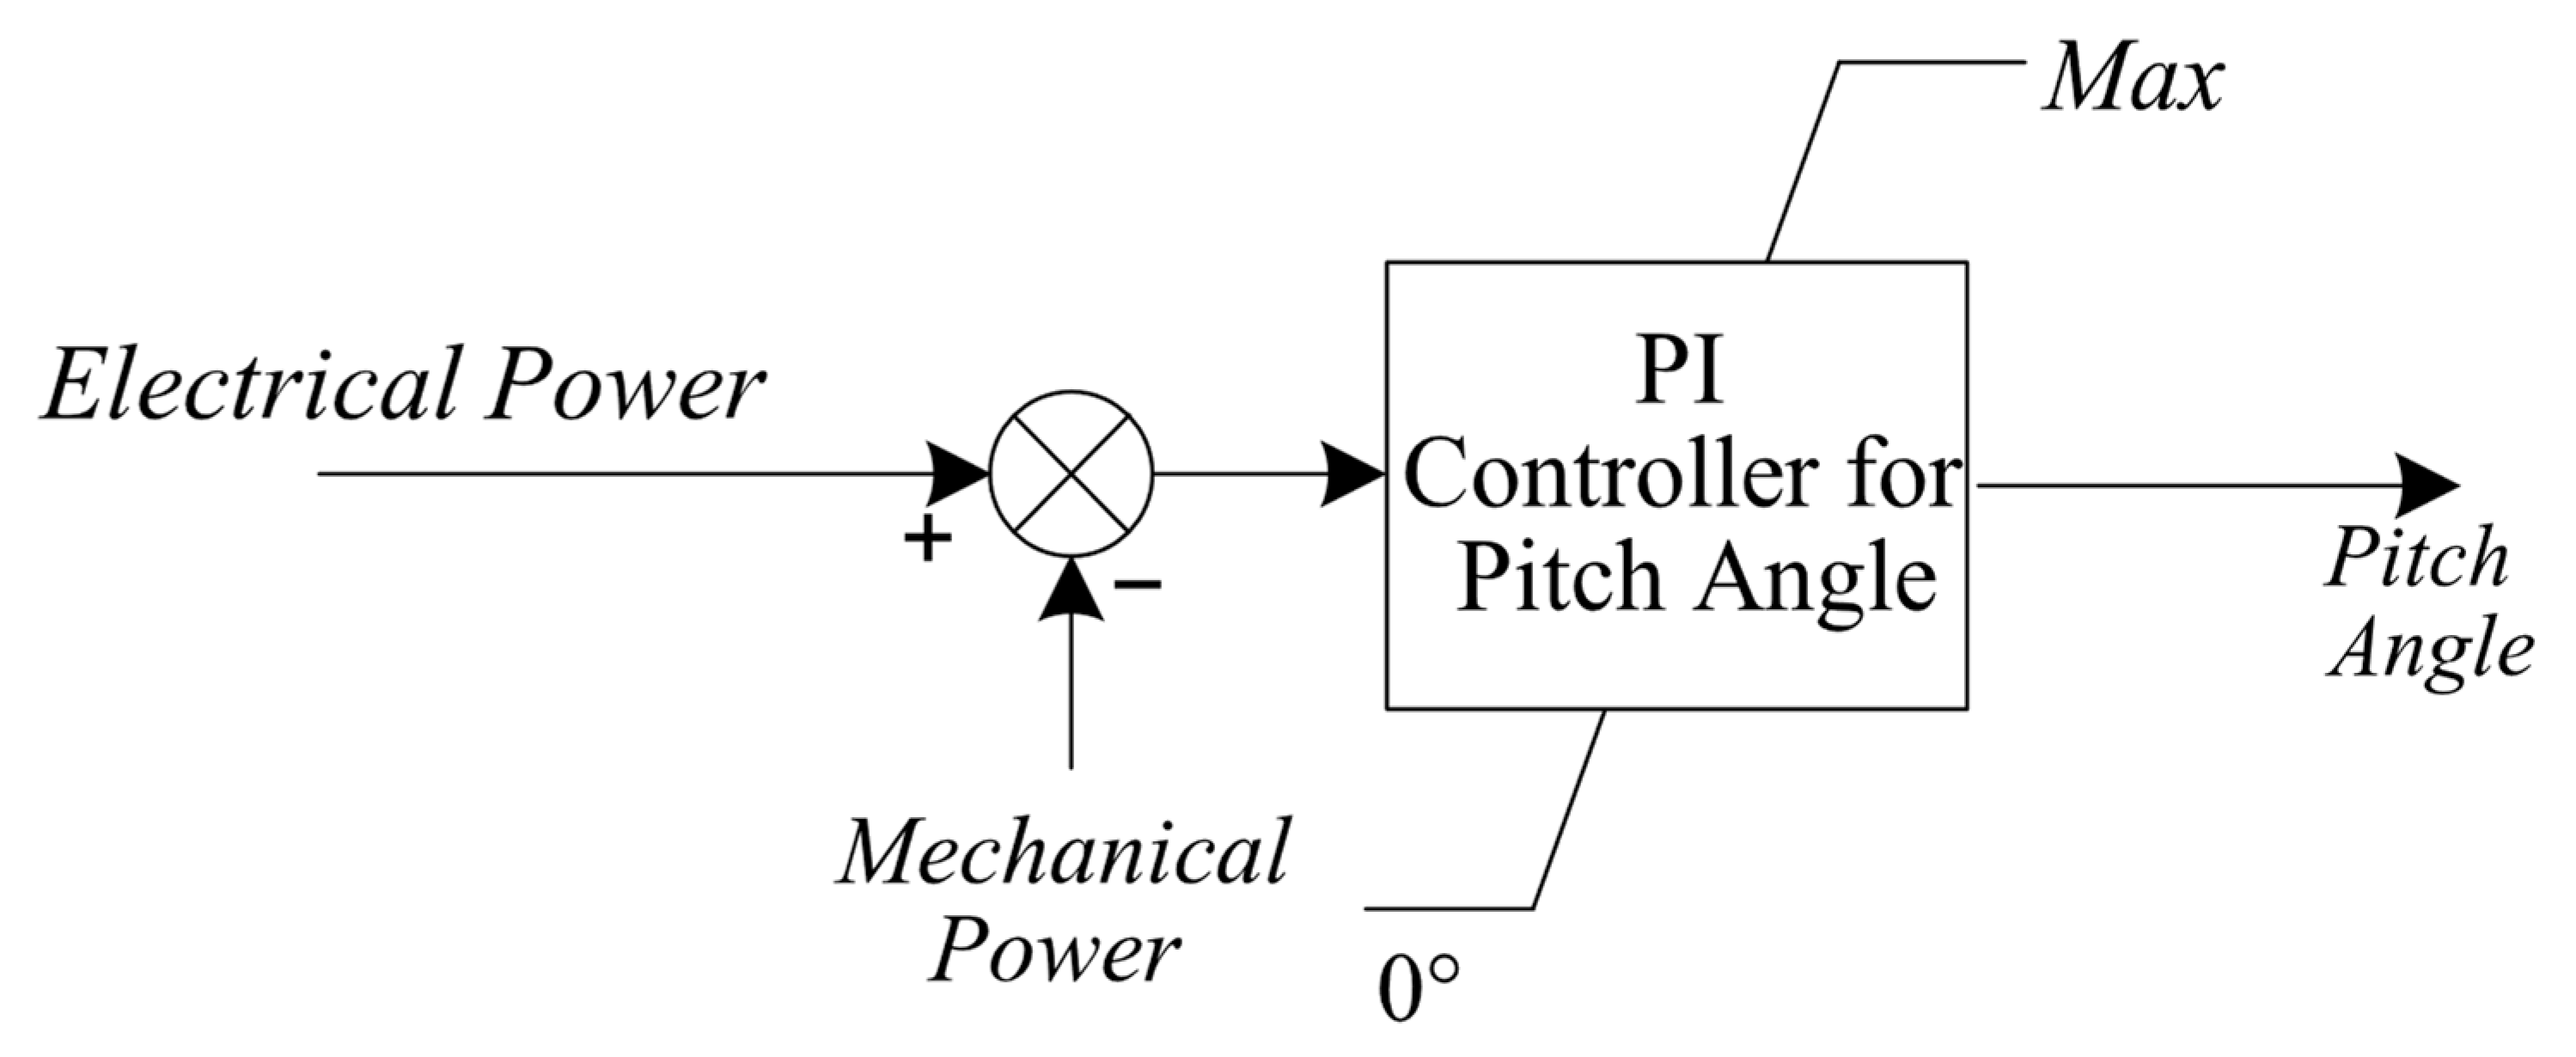
Figure 4 presents the input variation of the pitch angle. To clarify how this pitch angle input is derived, Figure 5 is included, which illustrates how the pitch angle is obtained from the signals of electrical and mechanical power. In addition, Figure 6 displays the turbine power output at various wind speeds when the pitch angle (β) is set to zero, thereby highlighting the baseline operating condition of the system. Together, these figures establish the necessary background to understand the pitch angle behavior used in the subsequent case studies.

2.2. Modelling of Squirrel Cage Induction Generator (SCIG)

The SCIG’s dynamic model can be described by a fourth-order model, as represented by the following equations. Using the Park transformation, the SCIG indicates the voltages of the stator and rotor in a reference frame consisting of a direct and a quadrature component [24].
V q s = R s I q s + P λ q s + ω λ d s V d s = R s I d s + P λ d s ω λ q s
V q r = R r I q r + P λ q r + ( ω ω r ) λ d r = 0 V d r = R r I d r + P λ d r ( ω ω r ) λ q r = 0
The magnetic flux linkage equations are as follows.
i d s i q s i d r i q r = 1 D 1 L r 0 L m 0 0 L r 0 L m L m 0 L s 0 0 L m 0 L s λ d s λ q s λ d r λ q r
λ d s = V d s R s I d s + ω λ d s S λ q s = V q s R s I q s ω λ d s S
λ d r = V d r R r I d r + ( ω ω r ) λ q r S λ q r = V d r R r I q r ( ω ω r ) λ d r S
D 1 = L s L r L m 2
The torque equation is as follows.
T e = 1.5 P ( I q s λ d s I d s λ q s )
The wind driven SCIG has a pitch angle regulator that limits the absorption of mechanical energy to prevent harmful activities during high wind speeds. The parameters for the model are the number of poles (P), voltage (V), resistance (R), current (I), flux linkage (λ), rotor angular speed (ωr), inductance (L), and electromagnetic torque (Te) with ‘s’ and ‘r’ denoting stator and rotor, respectively.

3. Modelling of FACTS

FACTS, or Flexible AC Transmission Systems, is a power electronic system used in AC transmission power networks to enhance controllability, power transfer capacity, and reliability. The FACTS family encompasses a variety of devices that employ distinct operating principles and configurations. In this study, STATCOM and SVC are employed to enhance the grid integration capabilities and power system stability of a wind farm.

3.1. Modelling of STATCOM

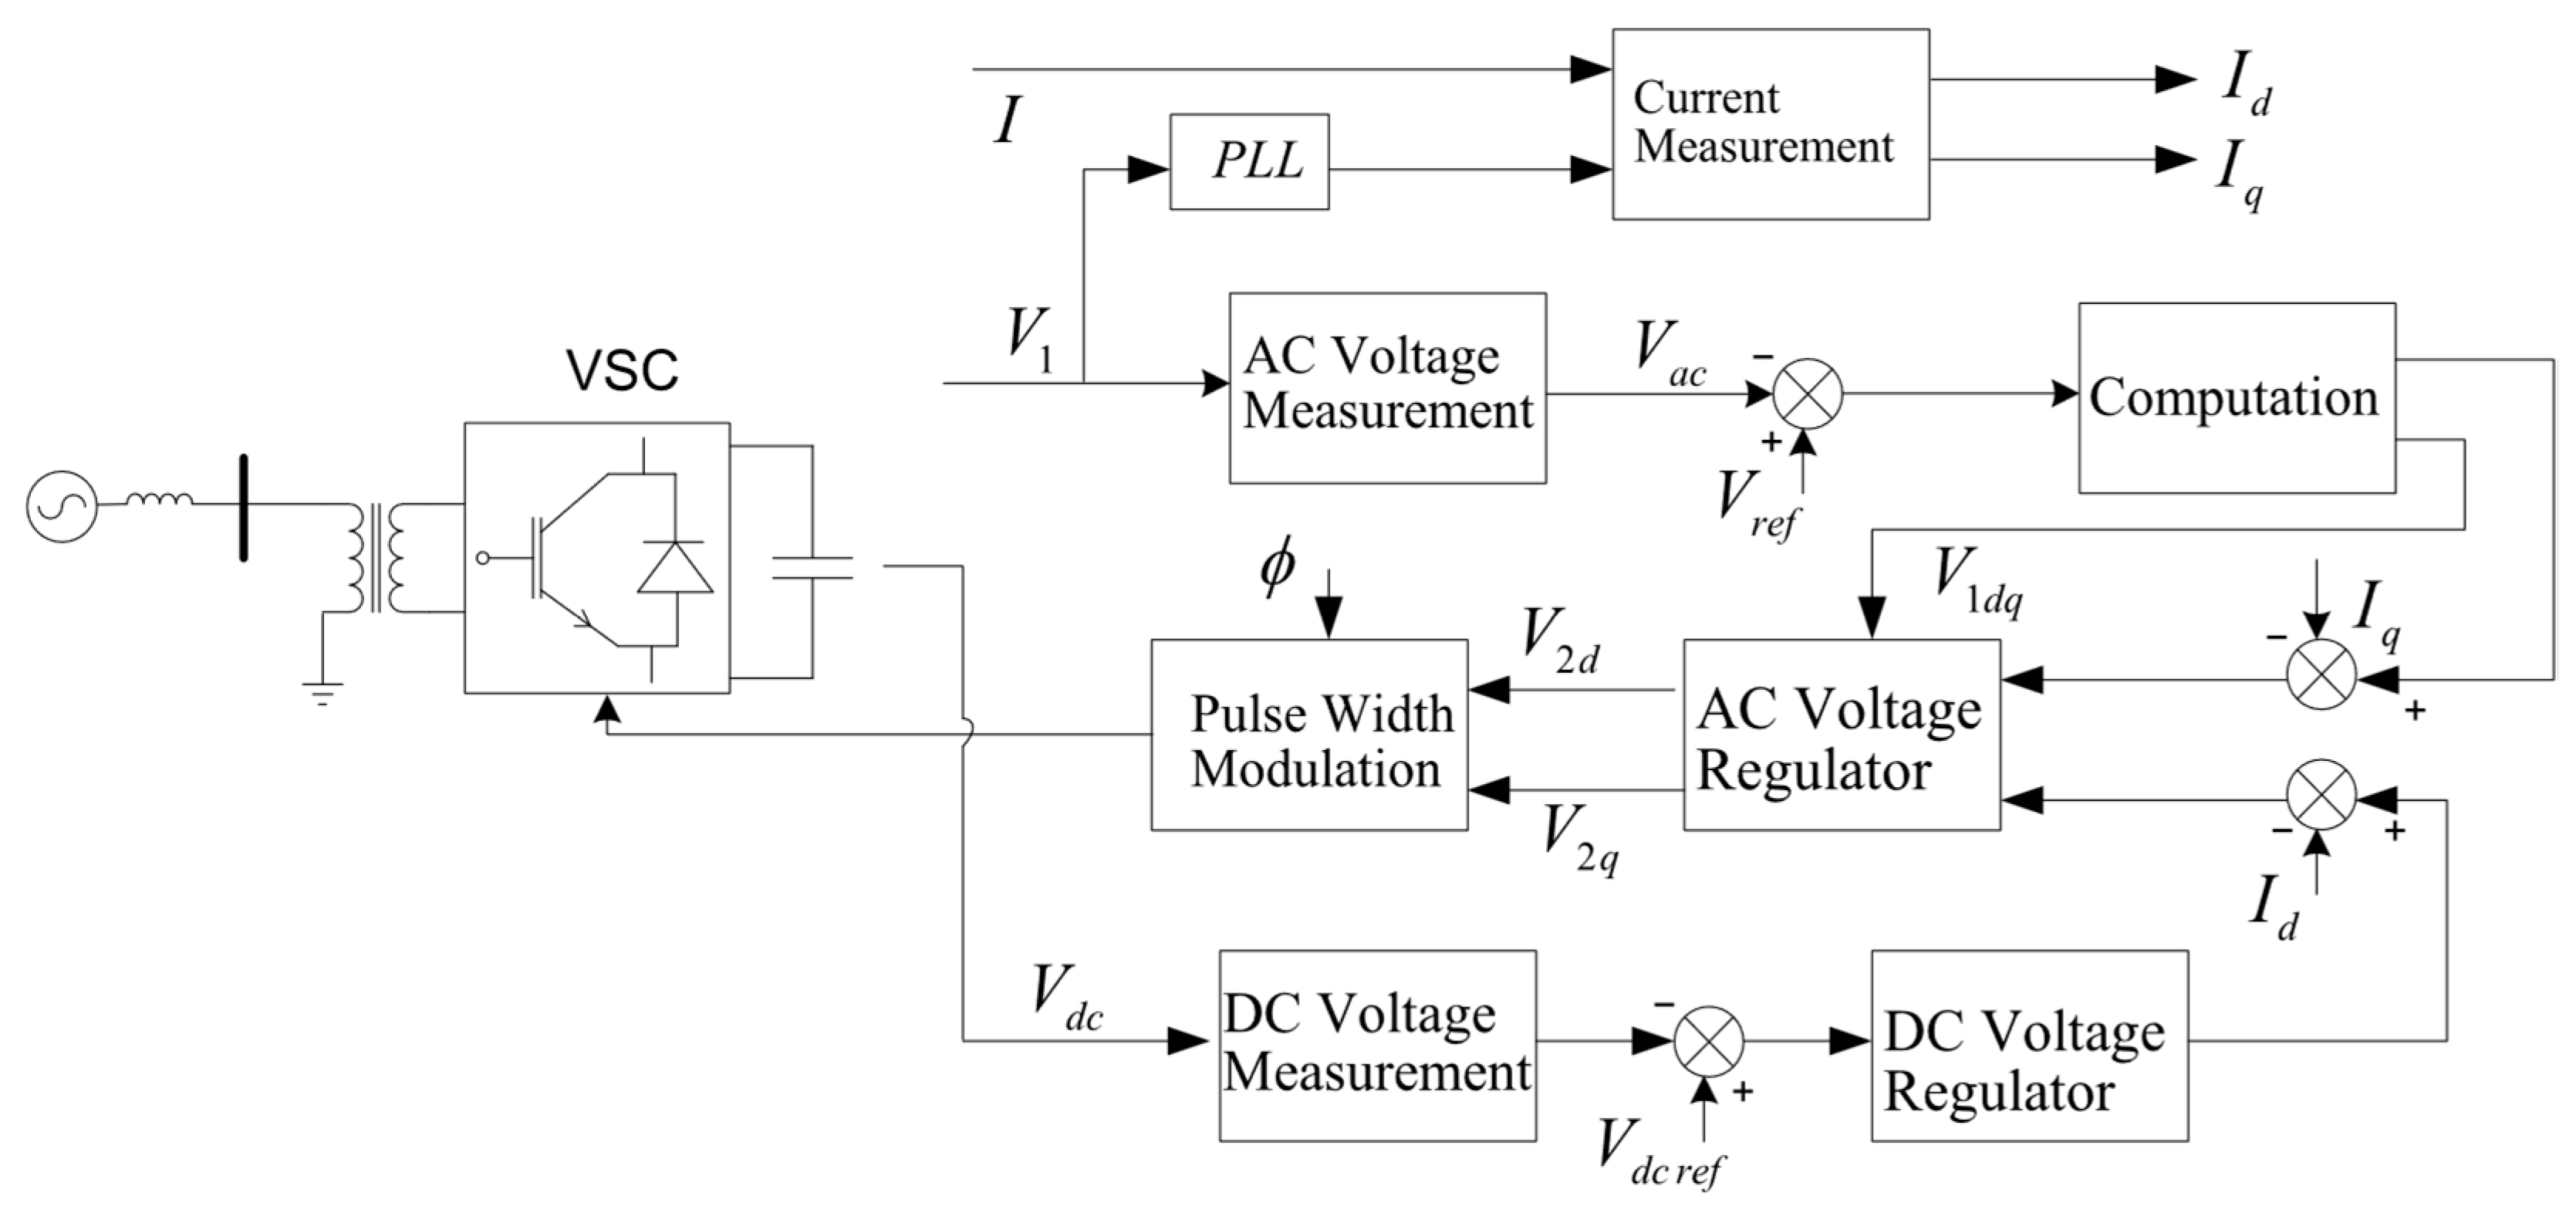
The STATCOM is a device based on converters that is coupled in parallel and used to absorb or inject reactive power with the aim of managing the electrical power flow and voltage [25]. The STATCOM is a sort of static parallel synchronous generator that has ability to adjust the level of reactive power, either as inductive or capacitive, in accordance with the description provided by the IEEE for FACTS devices. The STATCOM offers numerous advantages, including rapid reaction, exceptional precision, compact dimensions, and impeccable dynamic properties under varying operational circumstances. This component comprises a voltage sourced converter that generates a controlled AC voltage. It achieves this by utilizing a coupling transformer, a DC capacitor, and mostly IGBT as semiconductor switches. The system will be represented by a voltage-controlled current source, with its value determined by the transformer’s primary and secondary voltages. The primary voltage in STATCOM is sensed from the connection point, but secondary voltage is determined through indirect calculation. The main function of STATCOM is to generate a sinusoidal waveform at the PCC and regulate flow of reactive current.
In control system depicted in Figure 7, the quadrature component of converter current (in d-q reference form) is responsible for regulating the transformer’s primary voltage to its desired value. This ensures that the exchange of power with the network is properly managed. The regulation is achieved by a PI controller, which takes into account the droop characteristic of the device. Alternatively, by employing a PI controller, the converter’s direct current component is utilized for regulation of DC voltage across the capacitor situated on the converter side, thereby controlling the actual power transmission within the converter. Instead, the d-q components of secondary voltage are regulated by a current regulator, which generates switching signals that convert electricity using pulse width modulation (PWM) for the electronic devices. The regulation of the AC main voltage and the output voltage of the converter is determined by the magnitude of the voltage. The quantity is determined by Equation (14). If the voltage of a system (V2) is lower than the reference voltage (V1), reactive power is being consumed by the STATCOM as it flows from the system to the STATCOM. If the value of V2 is greater than the value of V1, then the STATCOM is injecting reactive power.
Q = V 1 ( V 1 V 2 ) X

3.2. SVC Modelling

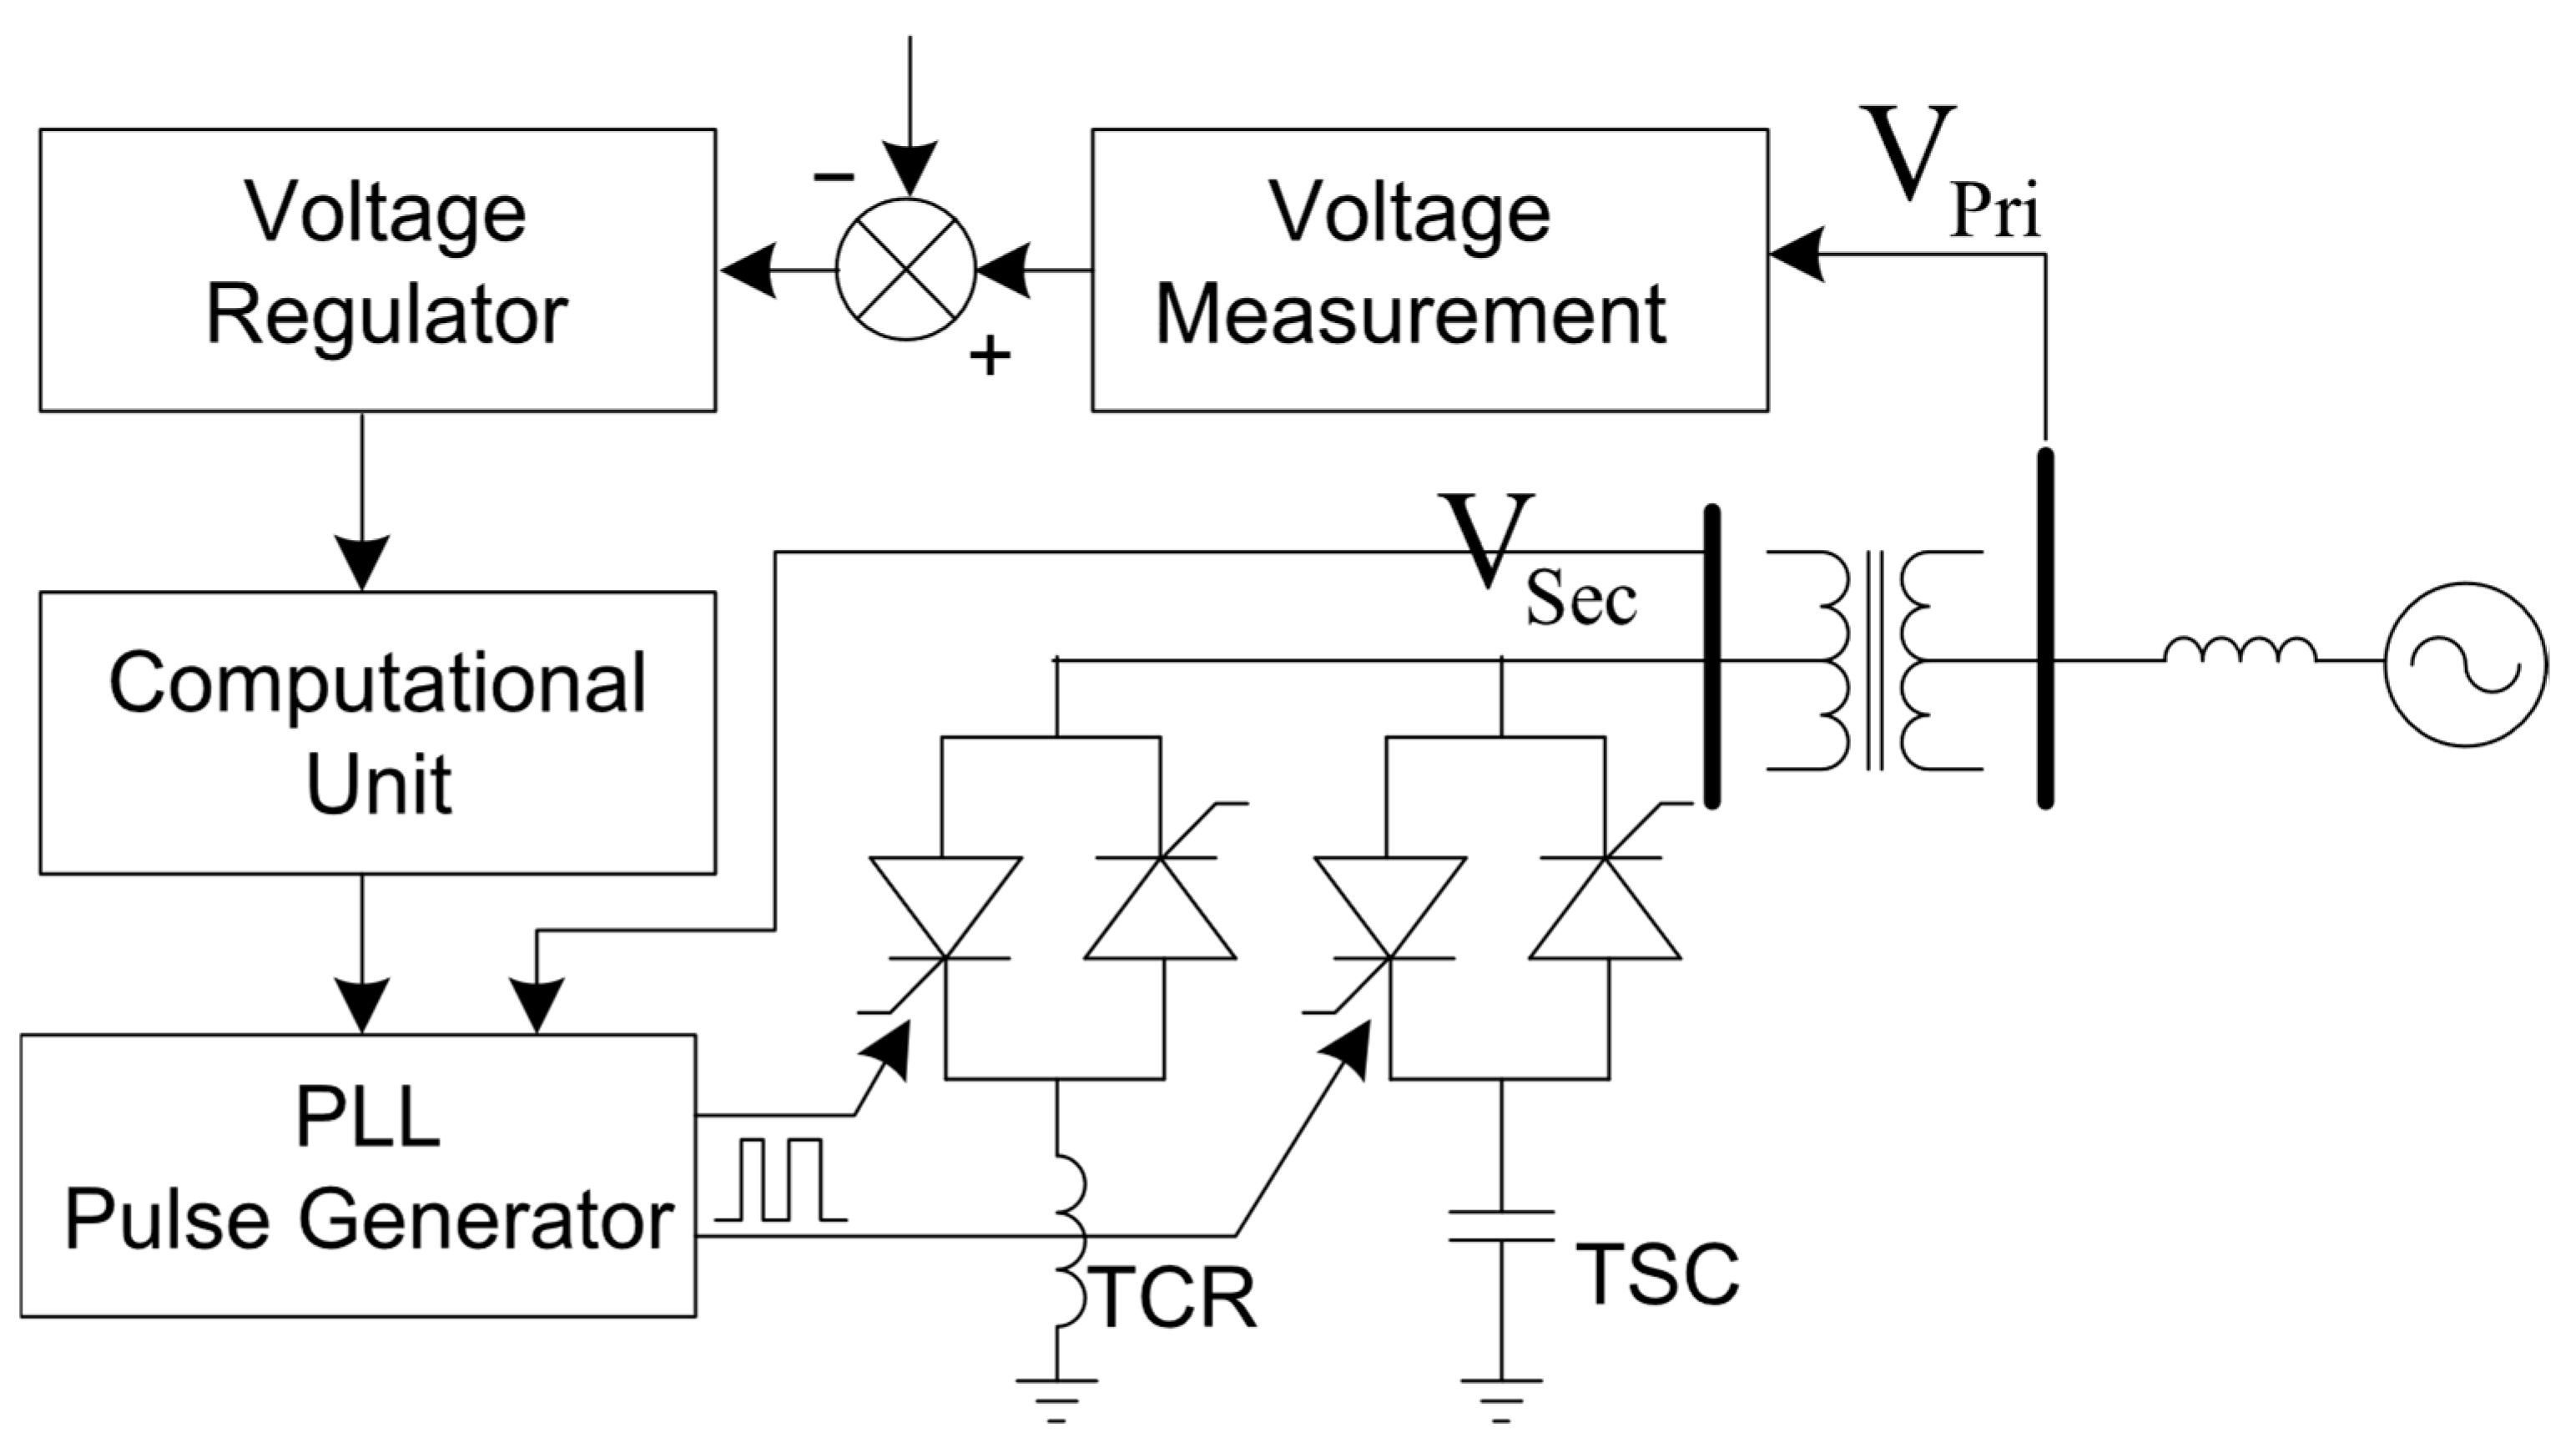
A grid has been added to a shunt-connected Static Var Compensator (SVC) in order to improve stability of voltage and regulate the flow of power in the systems. This gadget enables the Q exchange in the electrical system, in contrast to STATCOM. Moreover, it functions in a distinct manner compared to the STATCOM system. Within the framework of SVC, the process of injecting or absorbing reactive power is accomplished with the assistance of an admittance of variable nature that can shift from inductive into capacitive or vice versa as needed by the controller [25]. Thyristor-controlled reactors and capacitors can accomplish such a performance level. Figure 8 illustrates a control system that utilizes a controller which is PI-based and of single loop. In this system, the discrepancy is amongst the SVC terminal voltage and their desired values are the input, and the varying susceptance is continuously monitored at output side. The determination of susceptance is by the measured voltage and the current which is converted by it. Consequently, variable susceptance is used to measure these currents in order to compensate for voltage fluctuations, and they are then injected into the power supply regulated by the SVC. The overall limits of the inductive and capacitive susceptance are determined by the compensation limits the reactive power of this device.

3.3. Cost-Efficient FACTS Study

While both excel at enhancing power grid stability and dynamic voltage control, a cost-based FACTS study reveals crucial distinctions regarding their economic viability and physical footprint. STATCOMs boast superior performance with their ability to generate or absorb both reactive power and real power. This versatility comes at a premium, however. The cost of STATCOM is 111% compared to SVC [26]. This price reflects the complex power electronics employed within STATCOMs, primarily Insulated-Gate Bipolar Transistors (IGBTs), which facilitate rapid response times.
In contrast, SVCs offer a more cost-effective solution. This lower cost stems from their simpler design, often utilizing Thyristor-Switched Capacitor (TSC) or Thyristor-Controlled Reactor (TCR) banks. However, this design simplification comes at the expense of functionality. SVCs can only exchange reactive power, limiting their ability to directly address real power flow issues.
While cost plays a crucial role, the physical footprint of these FACTS devices also merits consideration. STATCOMs, due to their reliance on IGBTs, tend to have a more compact design compared to SVCs. Owing to the compact nature of STATCOM, the civil engineering cost is reduced to 80% compared to that of SVC [26]. This compactness can be advantageous in situations with limited space availability within substations. However, for applications requiring very large reactive power compensation, the footprint advantage of STATCOMs might become negligible.

4. Results & Discussion

Various simulations were performed to assess the execution of the listed models under varied operating settings, including both normal activity and grid failure scenarios. The primary objective of the case studies is to analyse the potential of FACTS to mitigate voltage sags and wind speed variability, hence enhancing the efficiency of wind farms during disturbances. This allows for the simulation of a temporary defect on the PCC due to interruptions in the grid, enabling the assessment of its influence on the power system and displaying the desired effects of integration of FACTS devices. Thus, as these imperfections are expected to occur in the power system, the PCC is selected as the site to showcase the disruption. The fixed capacitor, STATCOM, and SVC are compared in five cases consisting of an ideal wind and a turbulent wind profile, along with the faults which include a single-phase and a line-to-line fault at PCC, and a three-phase fault in any two wind farm branches. Moreover, these scenarios have been carried out to assess their influence on effectiveness of FRT performance.
  • Case 1: Ideal Wind Speed Profile
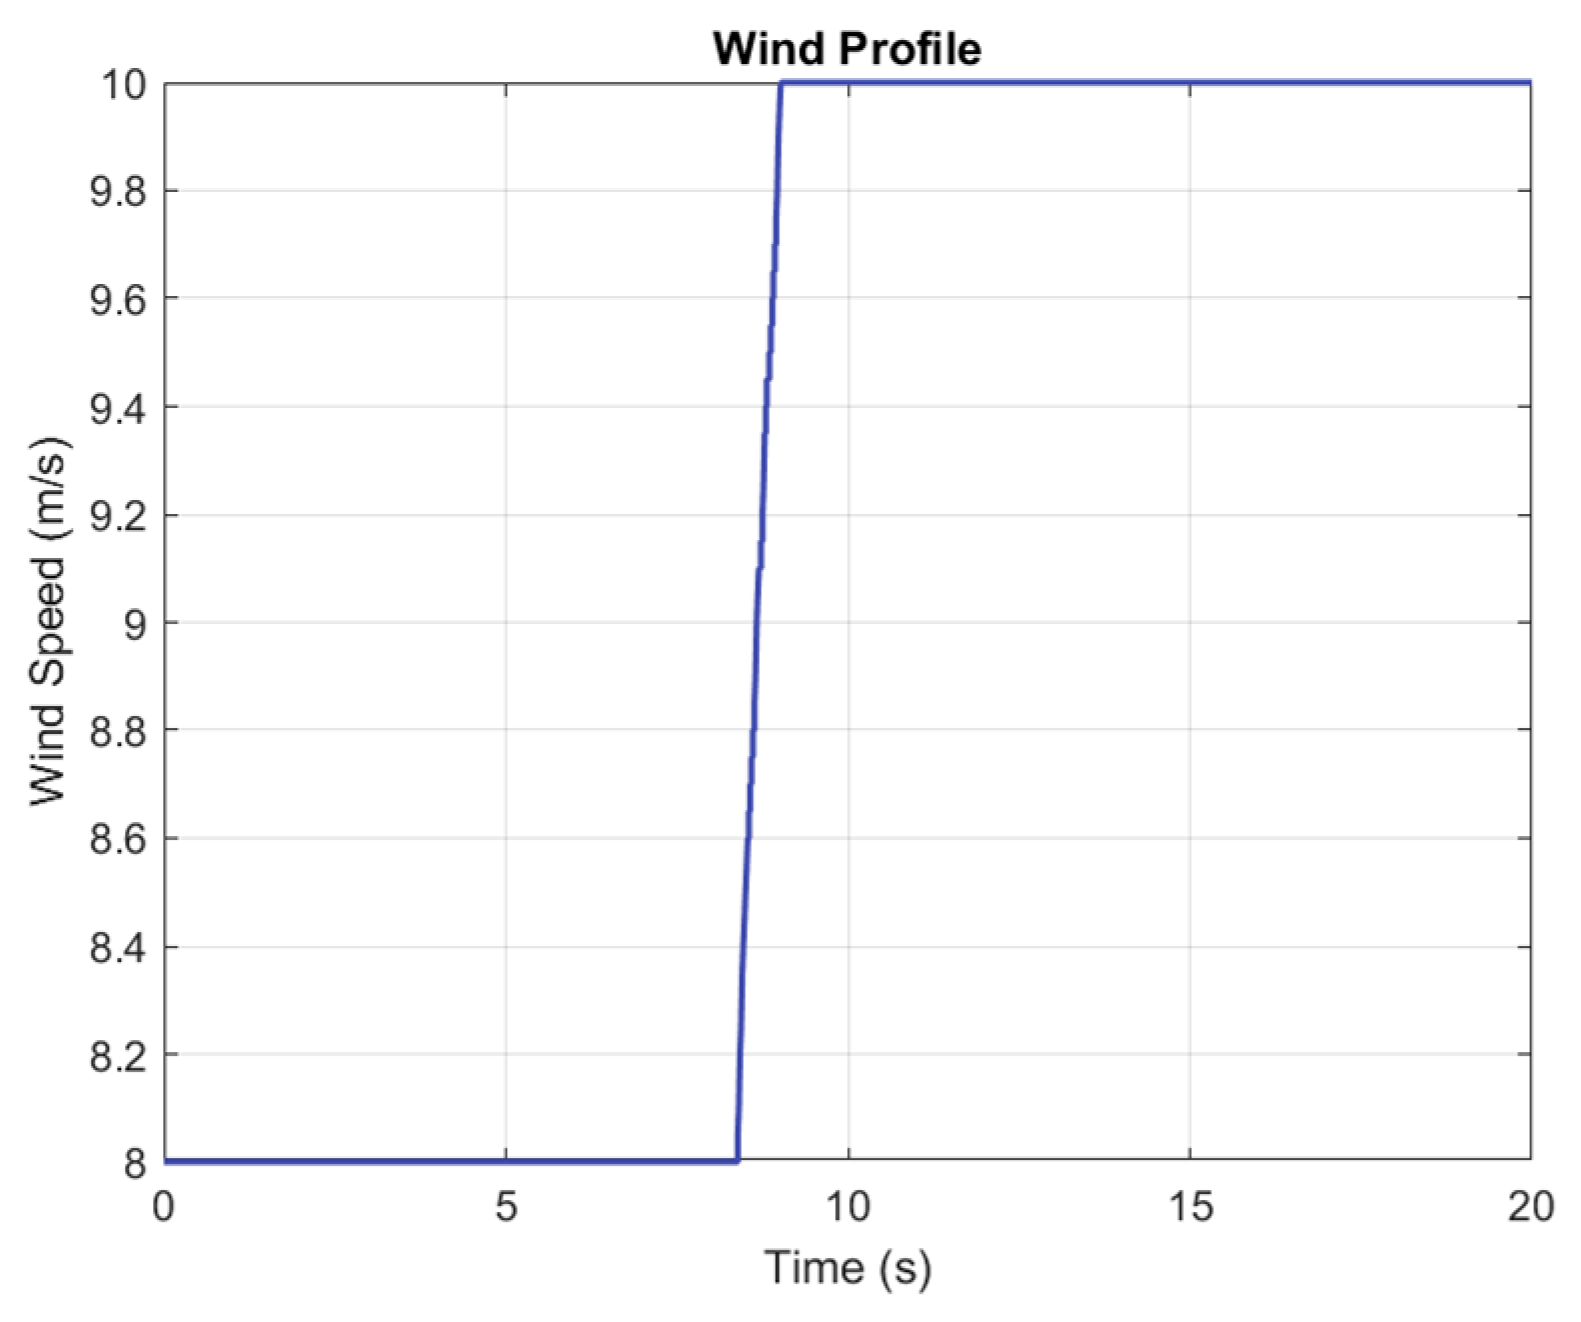
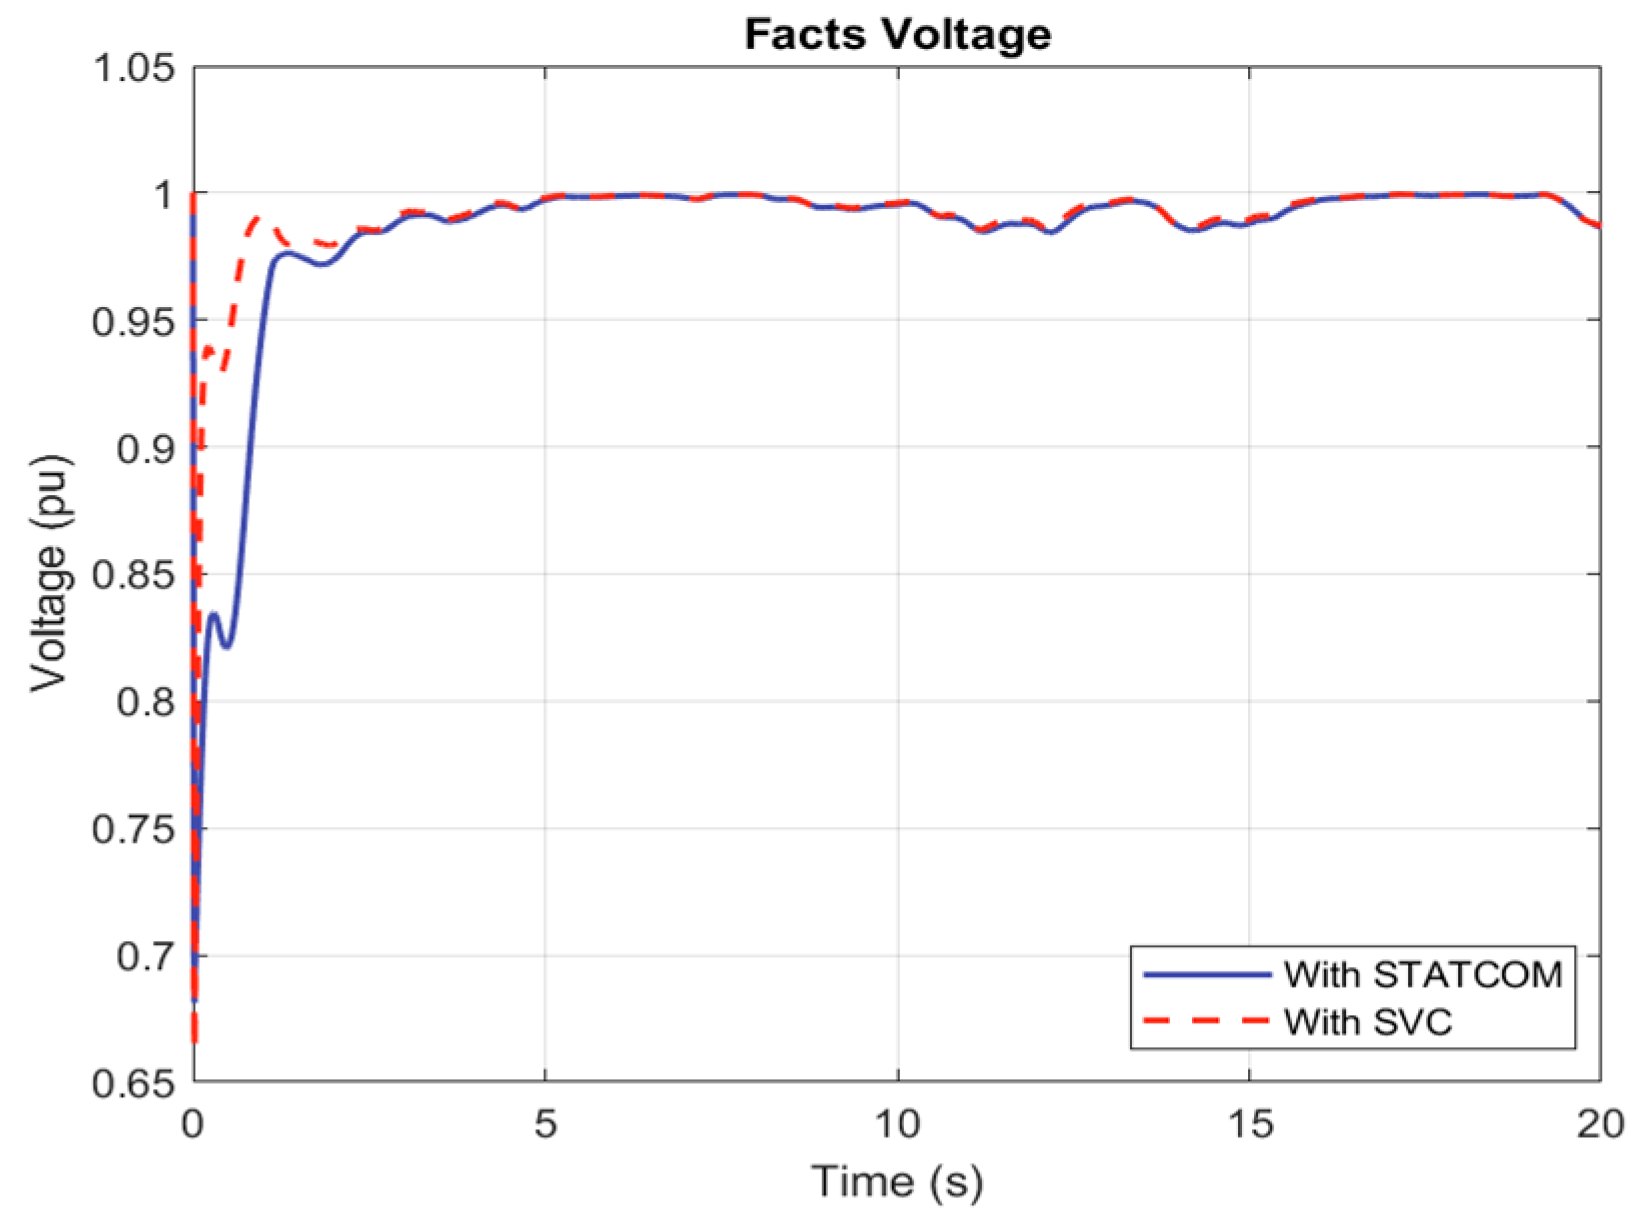
In this scenario, wind farm performance was evaluated under steady, ideal wind conditions to establish a baseline for assessing the effectiveness of FACTS devices. Figure 9 illustrates a constant wind speed maintained before and after step change in speed. The active power delivered to the grid remained stable and consistently high, confirming continuous wind farm operation is shown in Figure 10. Figure 11 demonstrates that the reactive power (Q) drawn from the grid was significantly reduced when SVC and STATCOM were utilized compared to the fixed capacitor scenario, where the reactive power consumption was highest. In terms of voltage performance, Figure 12 shows that the voltage at the PCC achieved stability more rapidly with SVC than with STATCOM, and both devices significantly outperformed the fixed capacitor setup. Figure 13 further confirms steady current flow at PCC when FACTS devices are employed. Figure 14 and Figure 15 highlight that SVC provided more stable reactive power compensation and maintained a more consistent voltage profile throughout the simulation compared to STATCOM.
  • Case 2: Turbulent Wind Speed Profile
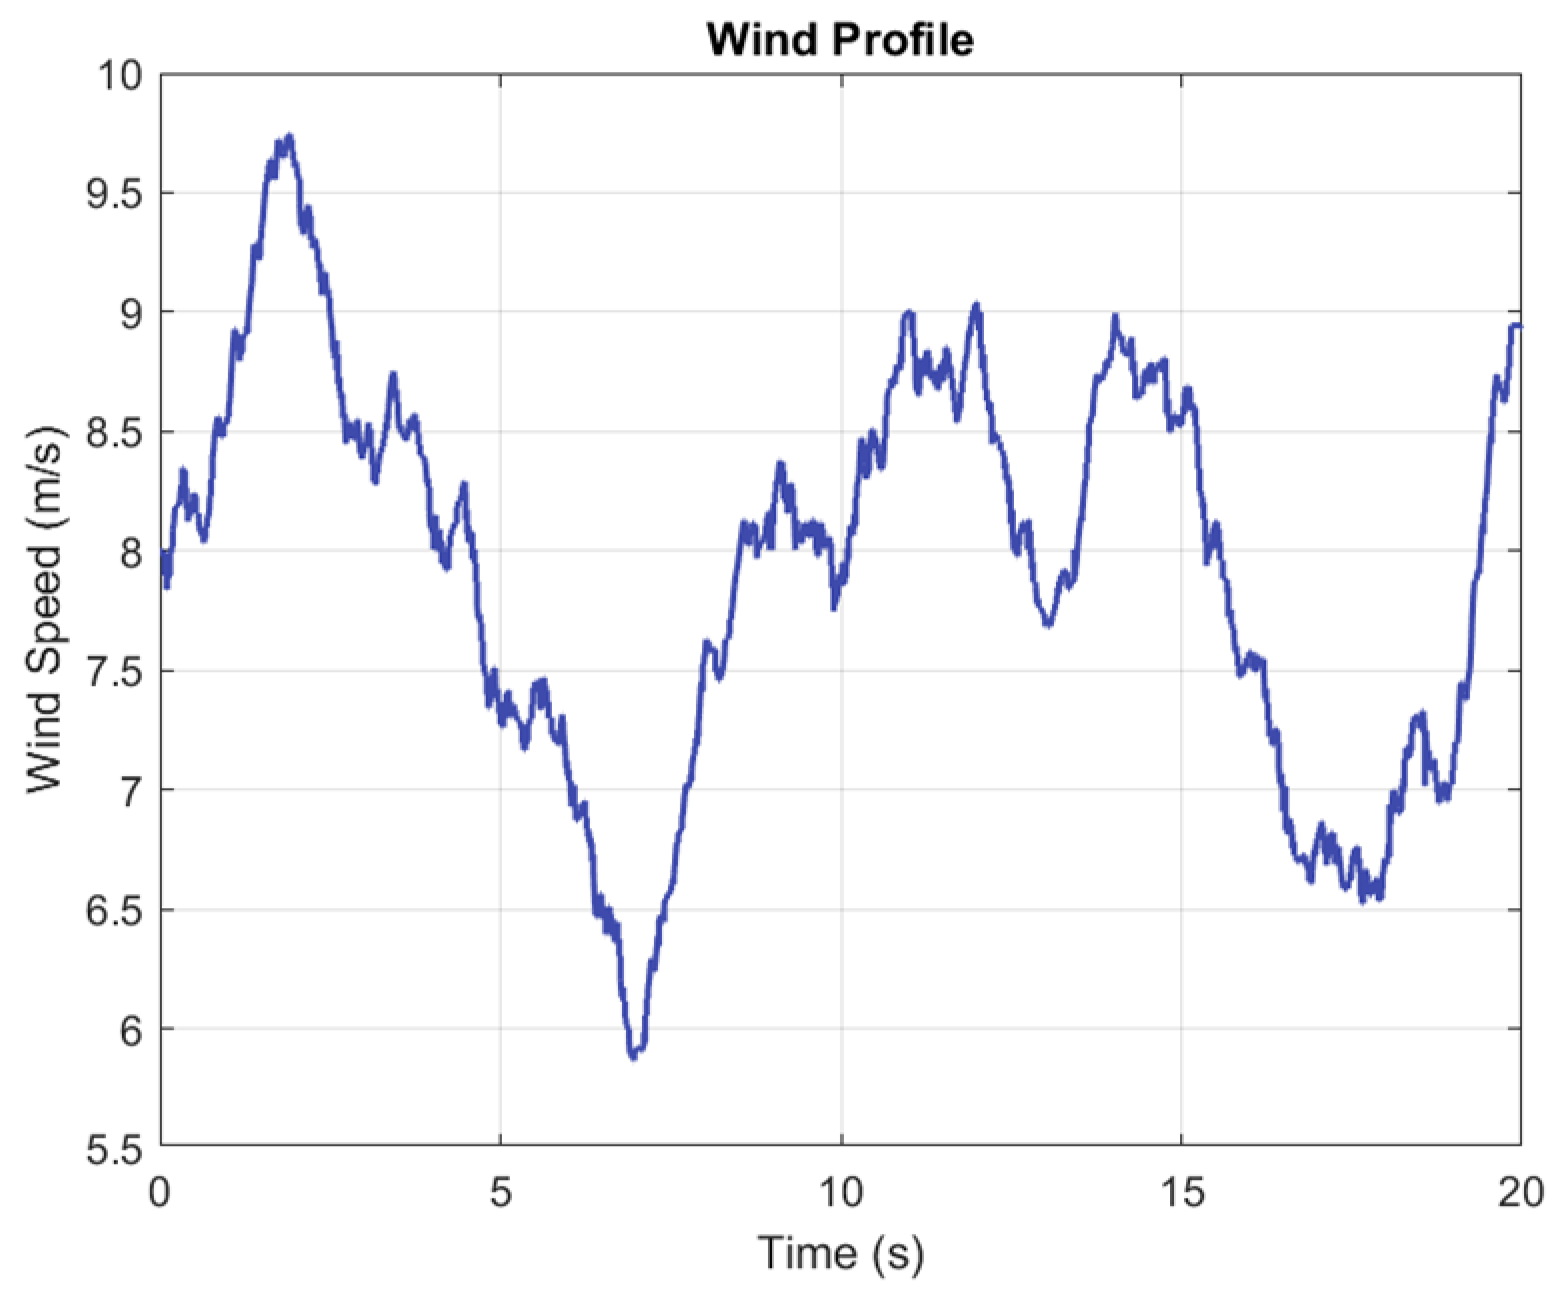
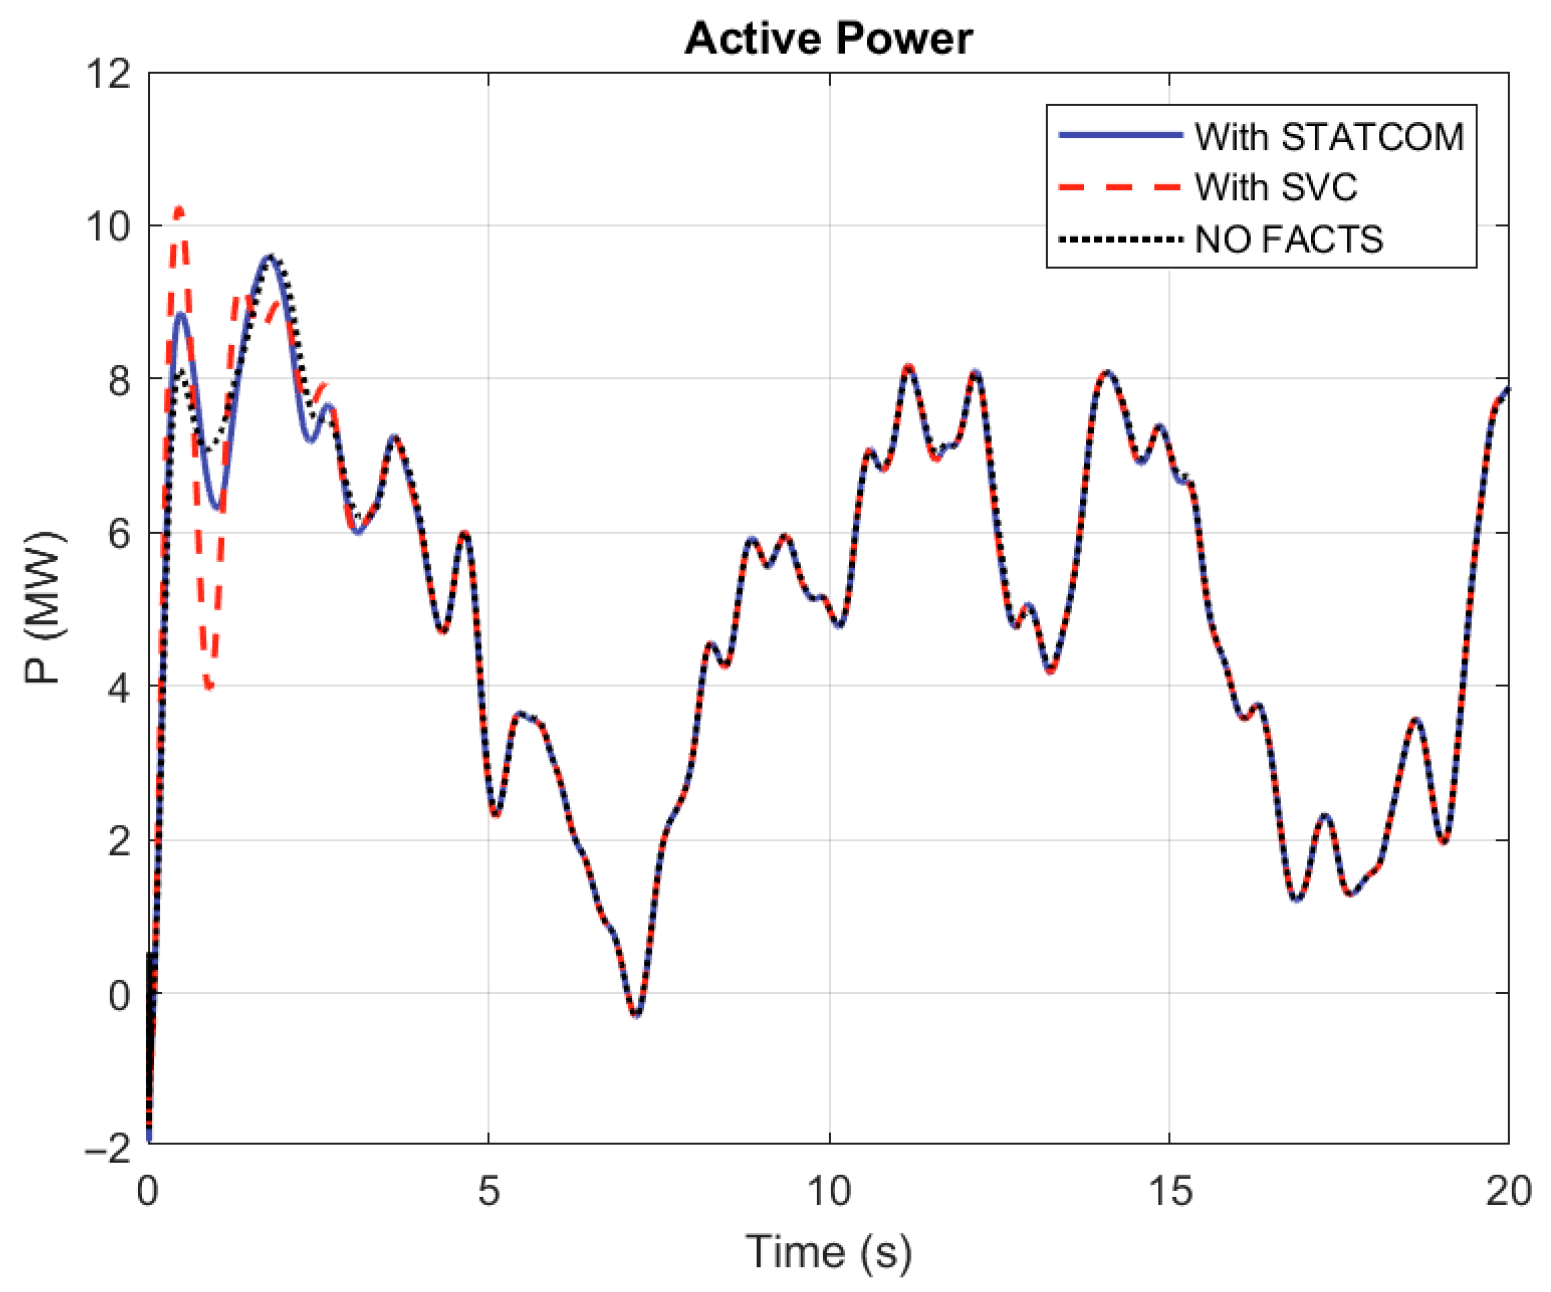
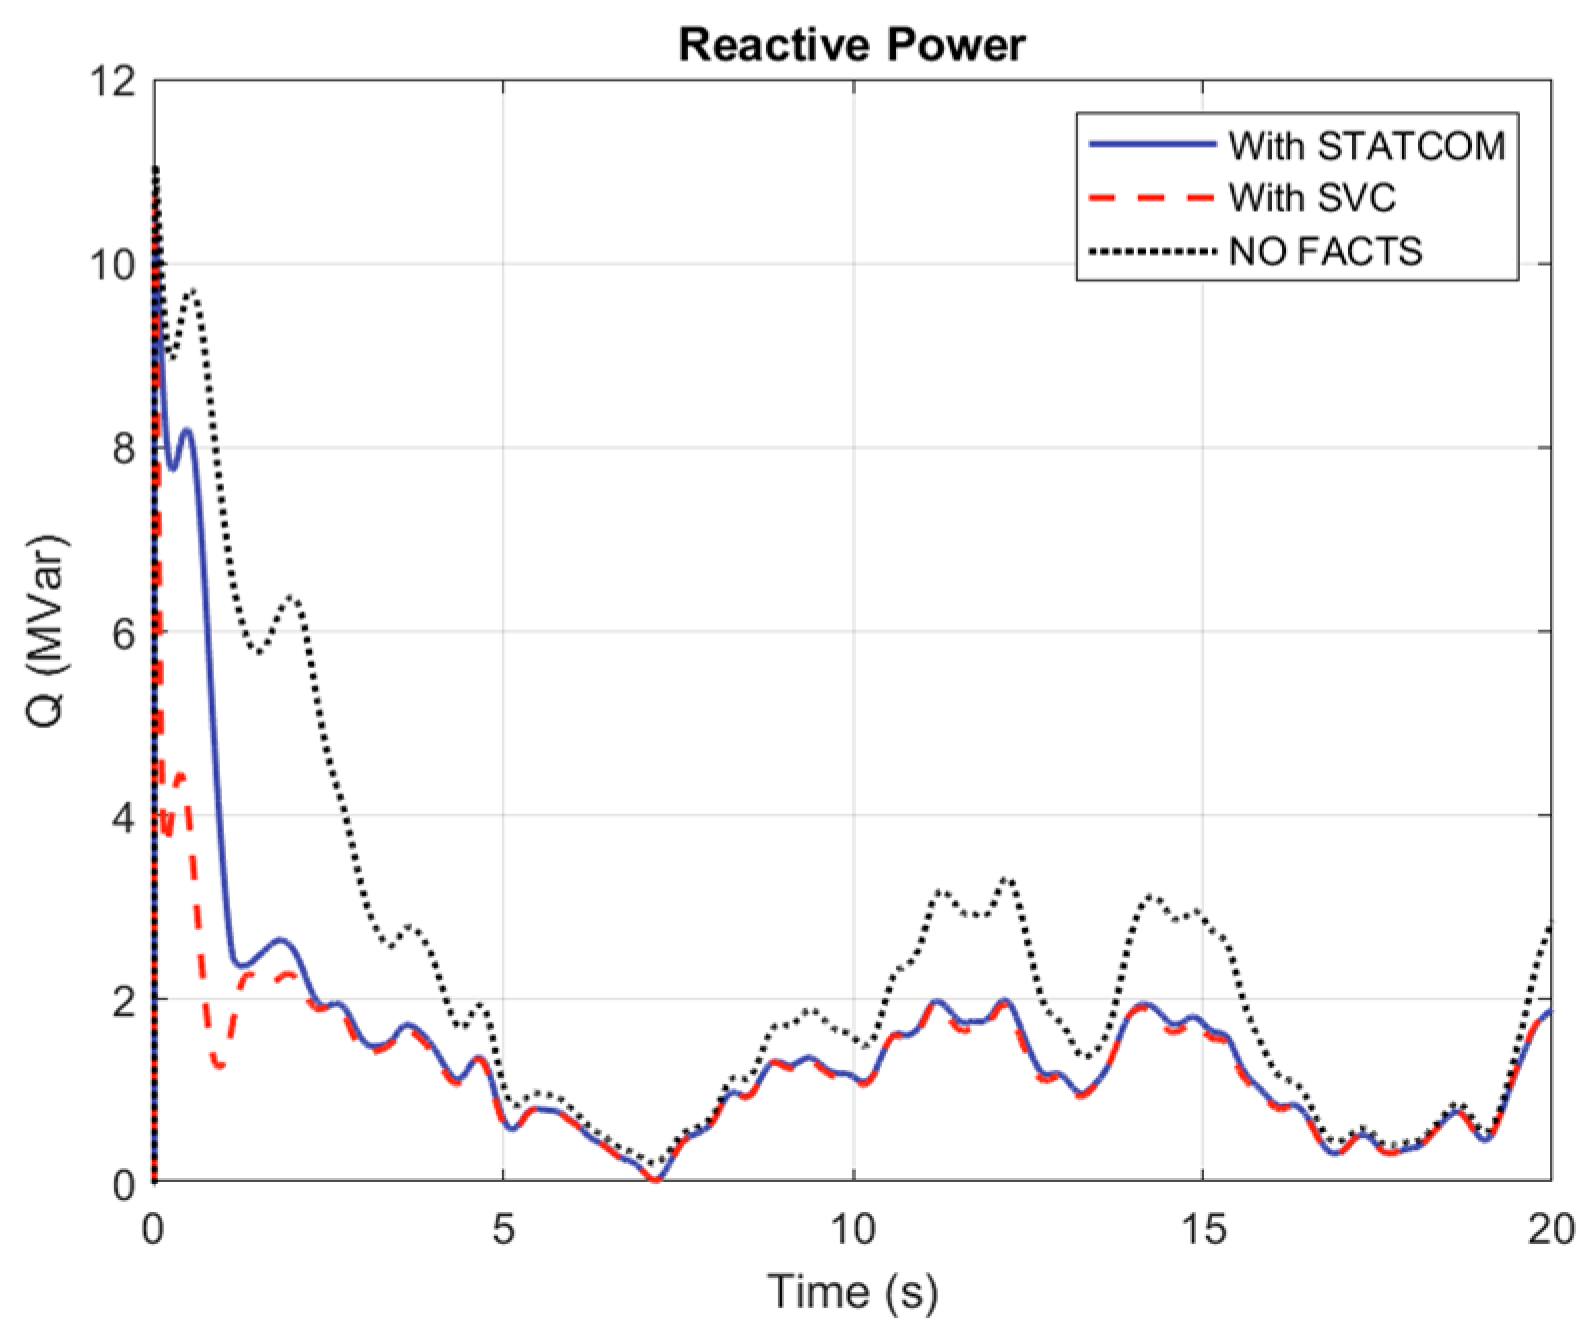
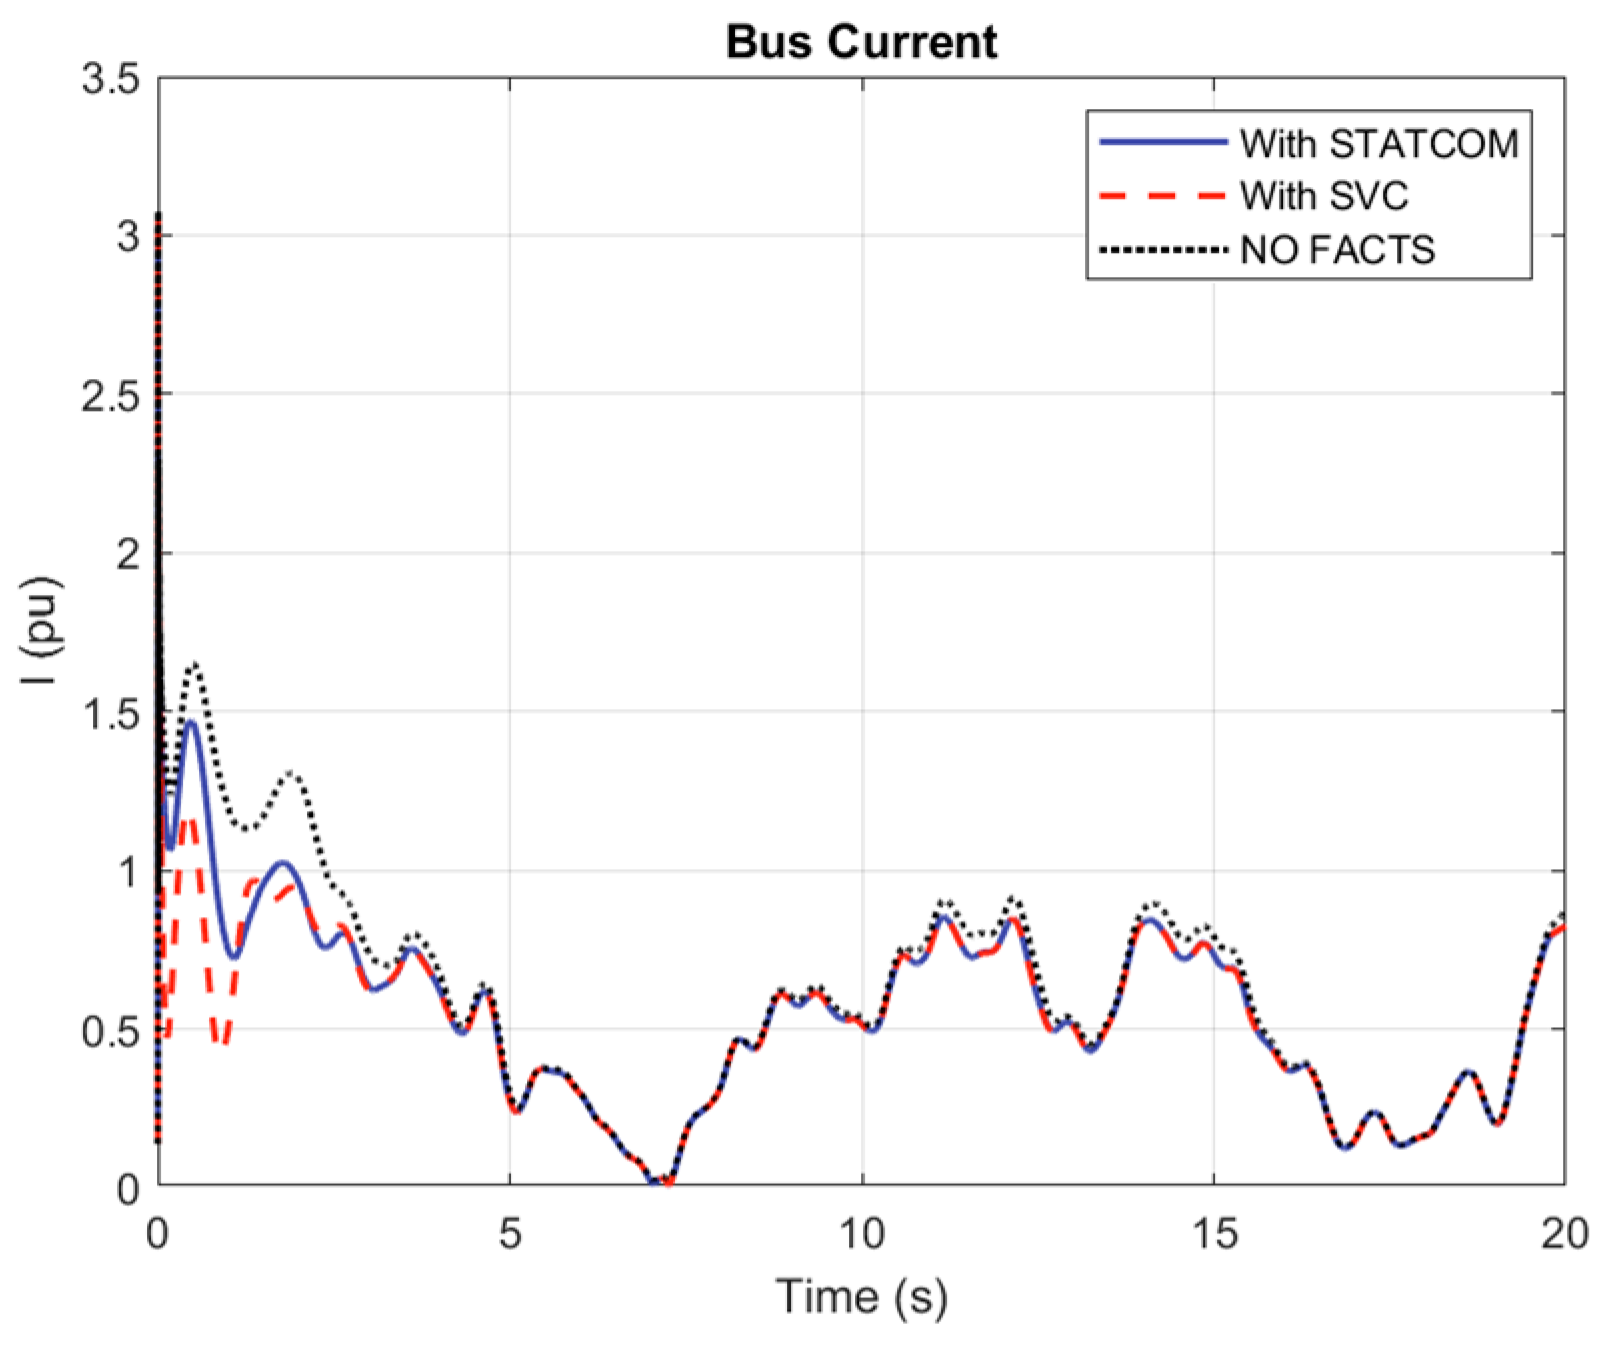
This scenario simulates variable wind speeds to test system robustness. Figure 16 shows the fluctuating wind speed ranging from 8 to 13 m/s, with corresponding active power delivery fluctuating between 7 MW and 9 MW, yet ensuring the wind farm remains operational under all FACTS conditions shown in Figure 17. Figure 18 illustrates that FACTS devices significantly reduced reactive power drawn from the grid, lowering usage from approximately 1.5 MVAR (fixed capacitor) to below 0.5 MVAR. Regarding voltage and current responses under turbulent conditions, Figure 19 demonstrates faster voltage stabilization at the PCC with SVC (within 0.15 s) compared to STATCOM (0.25 s). The current flow at PCC was also steadier with FACTS devices present in Figure 20. Figure 21 and Figure 22 further highlight that SVC provided more stable reactive power output (around 0.4 MVAR) and maintained a superior voltage profile compared to STATCOM, particularly under these variable wind conditions.
  • Case 3: Single-Phase Fault at PCC
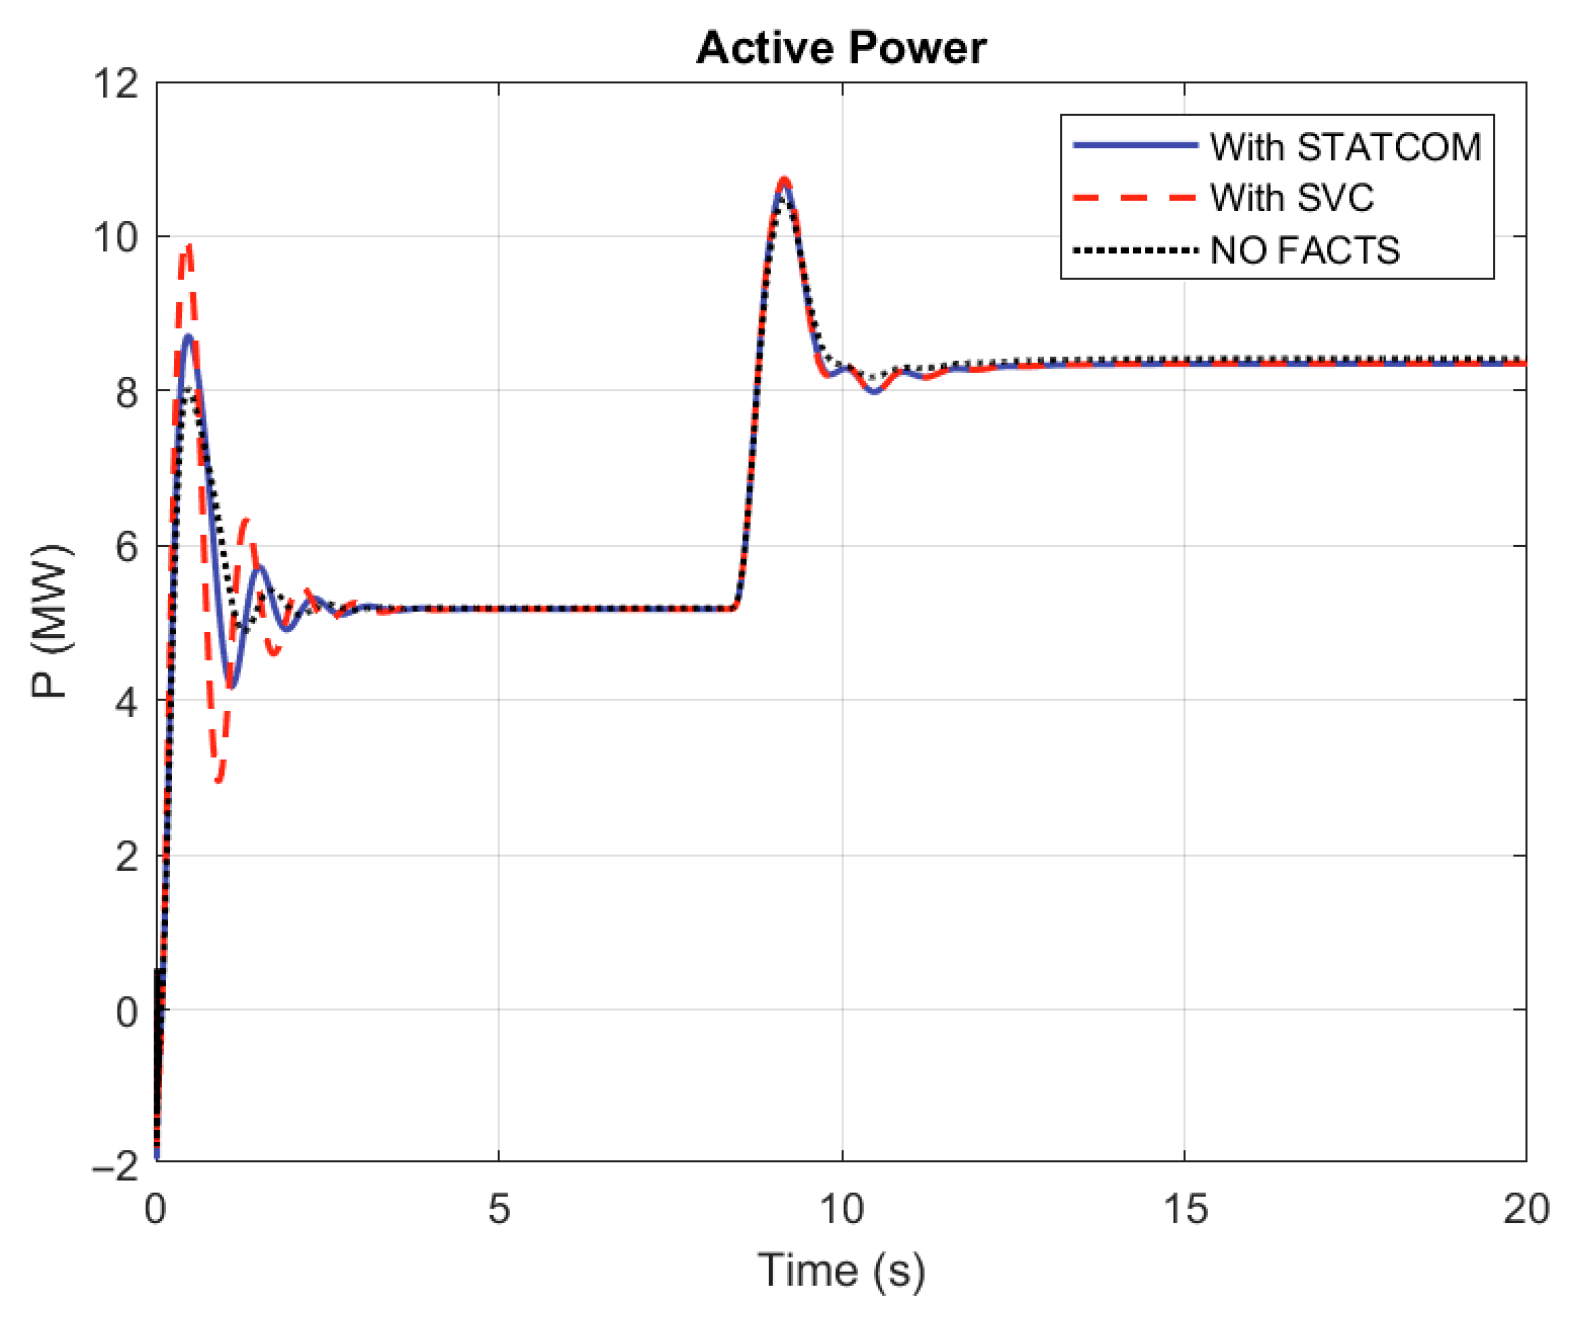
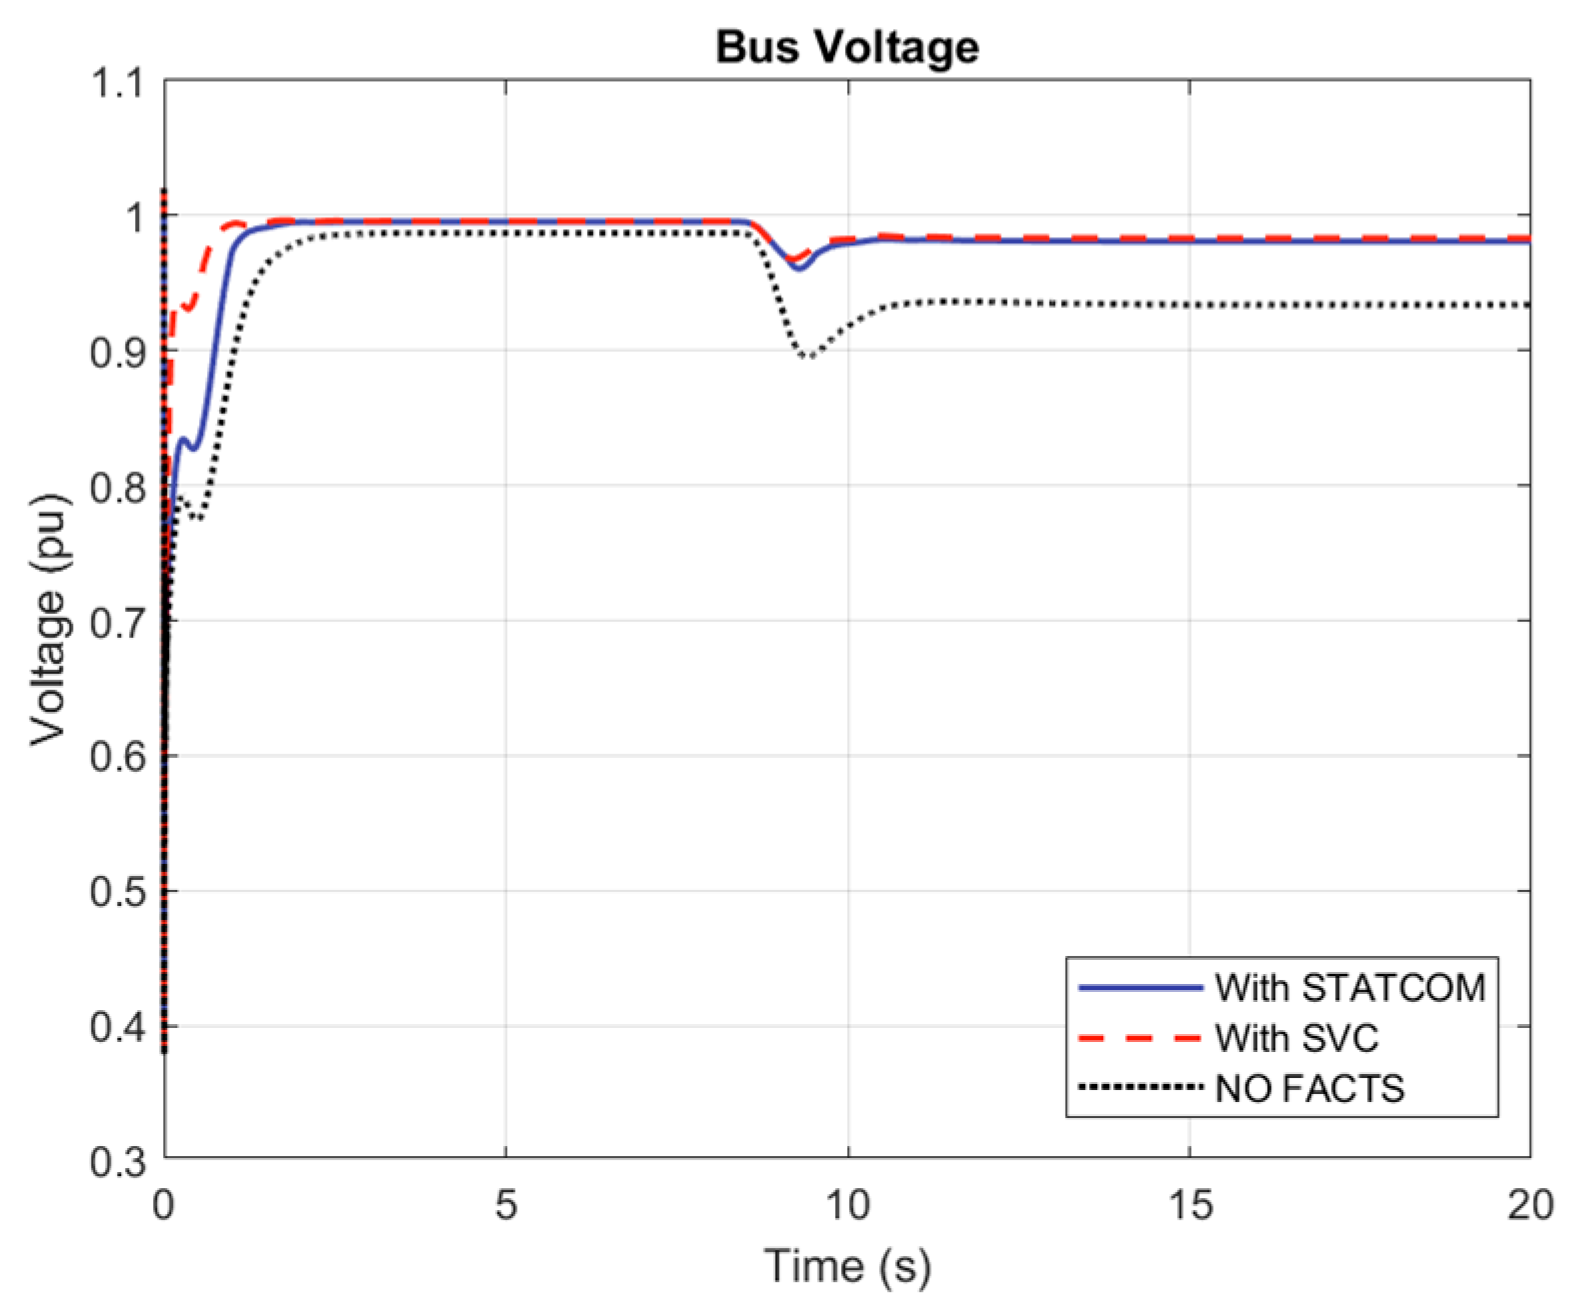
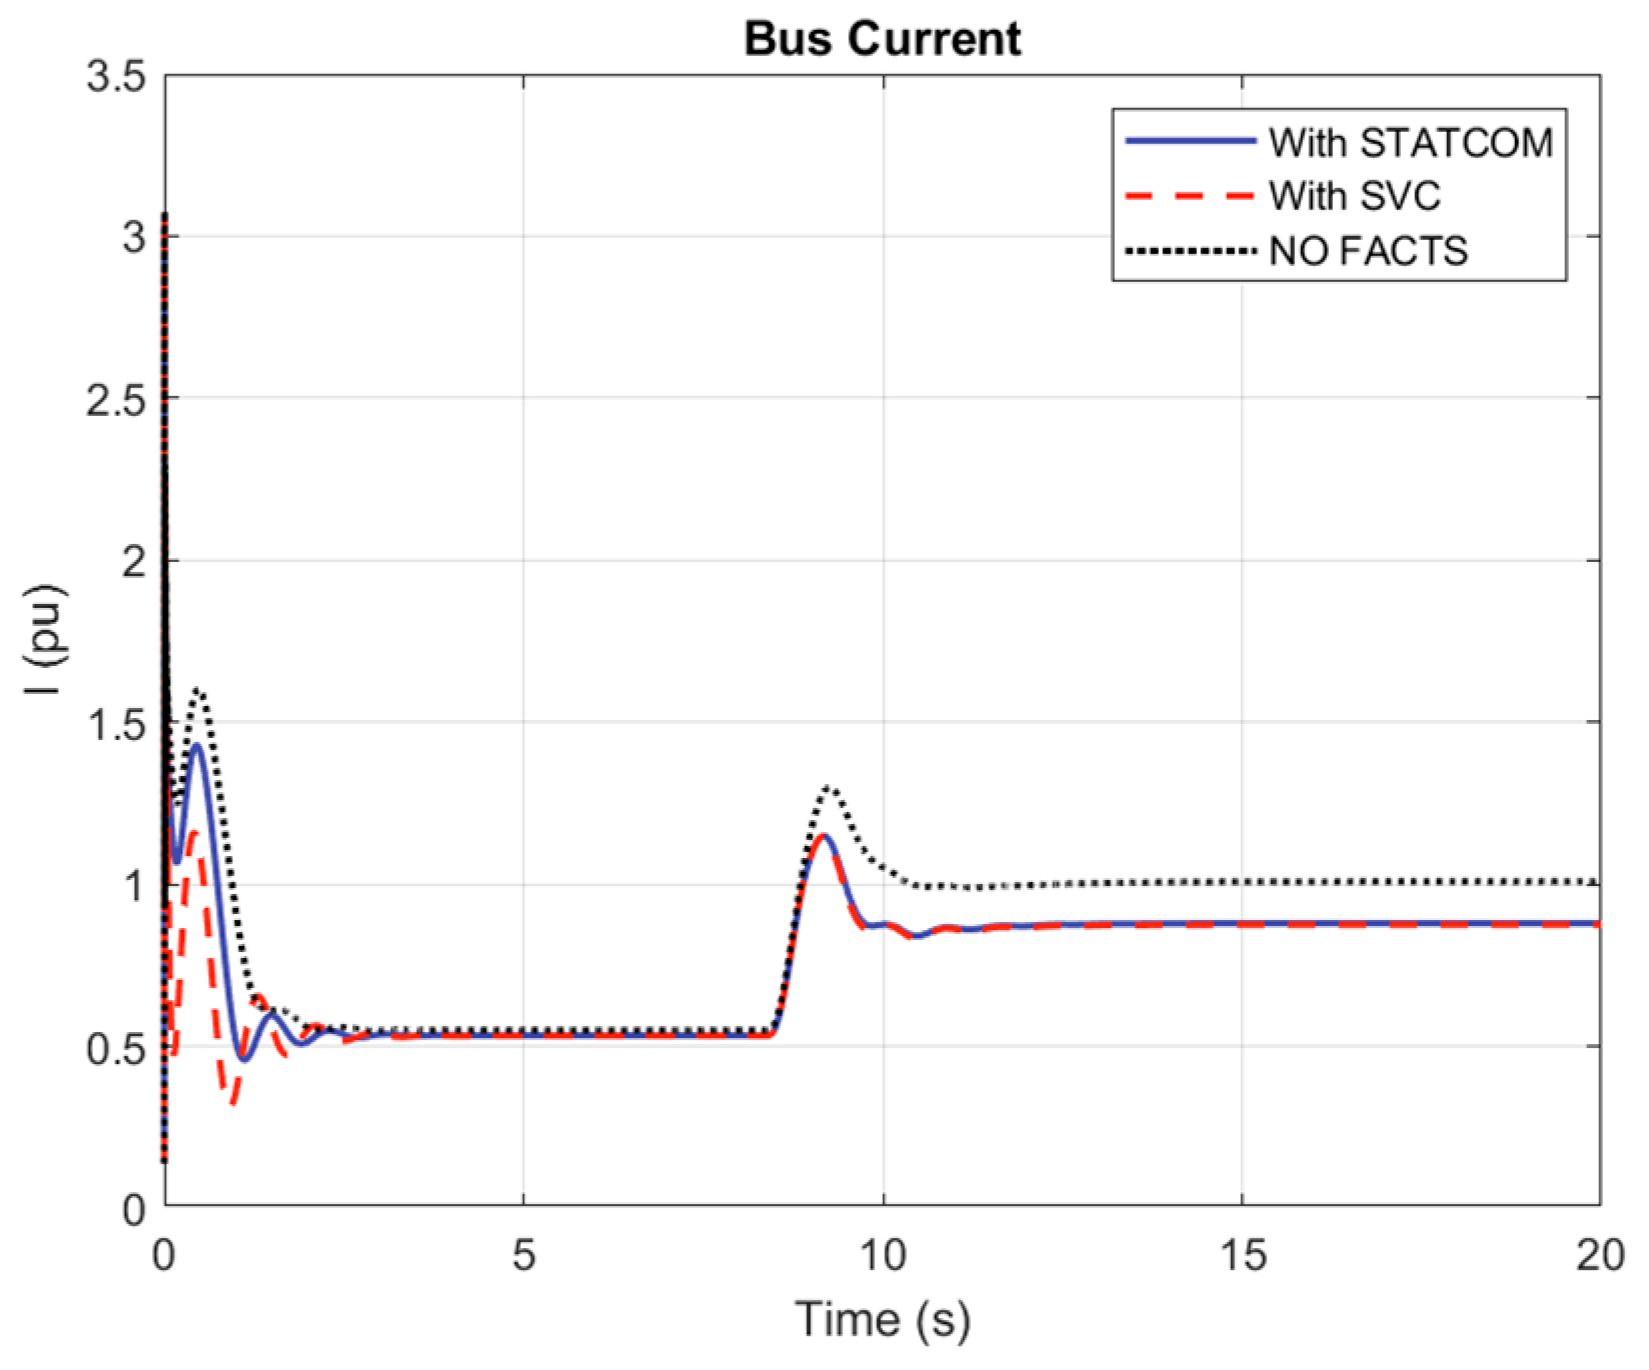
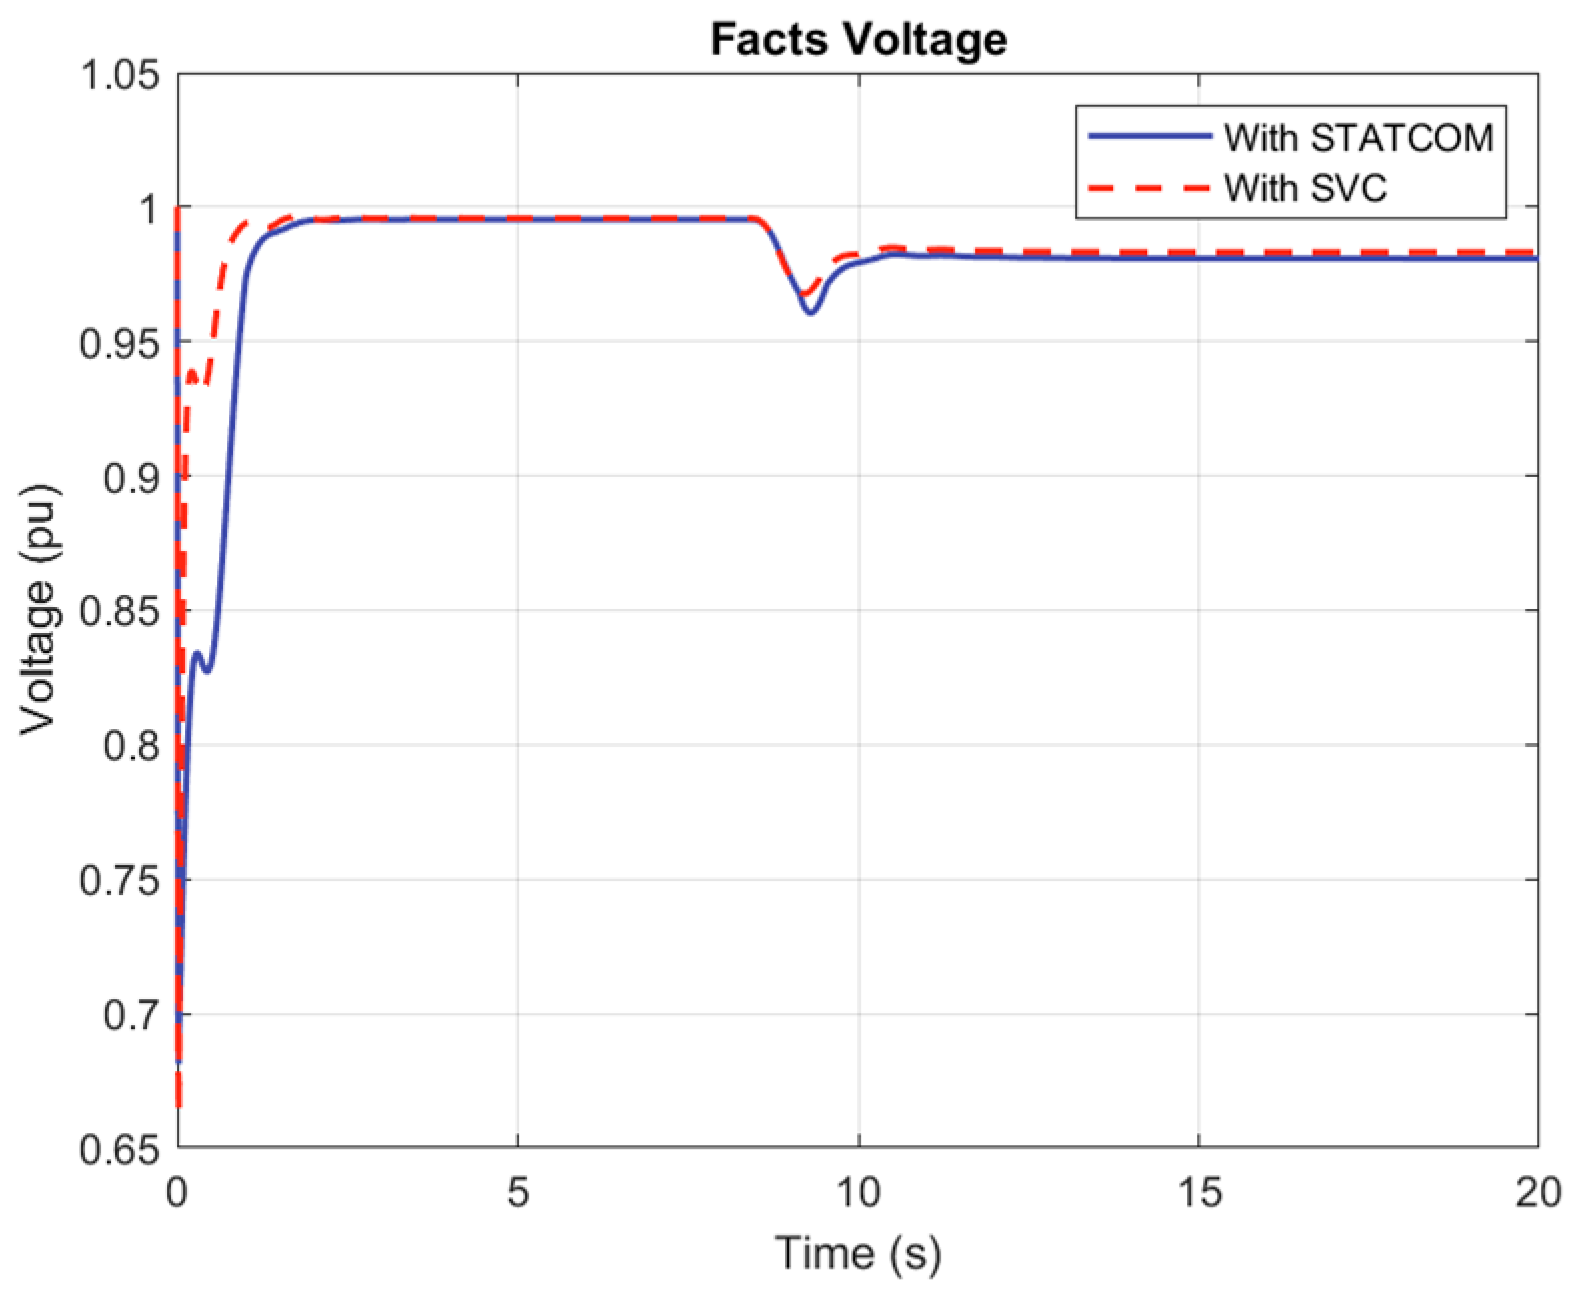
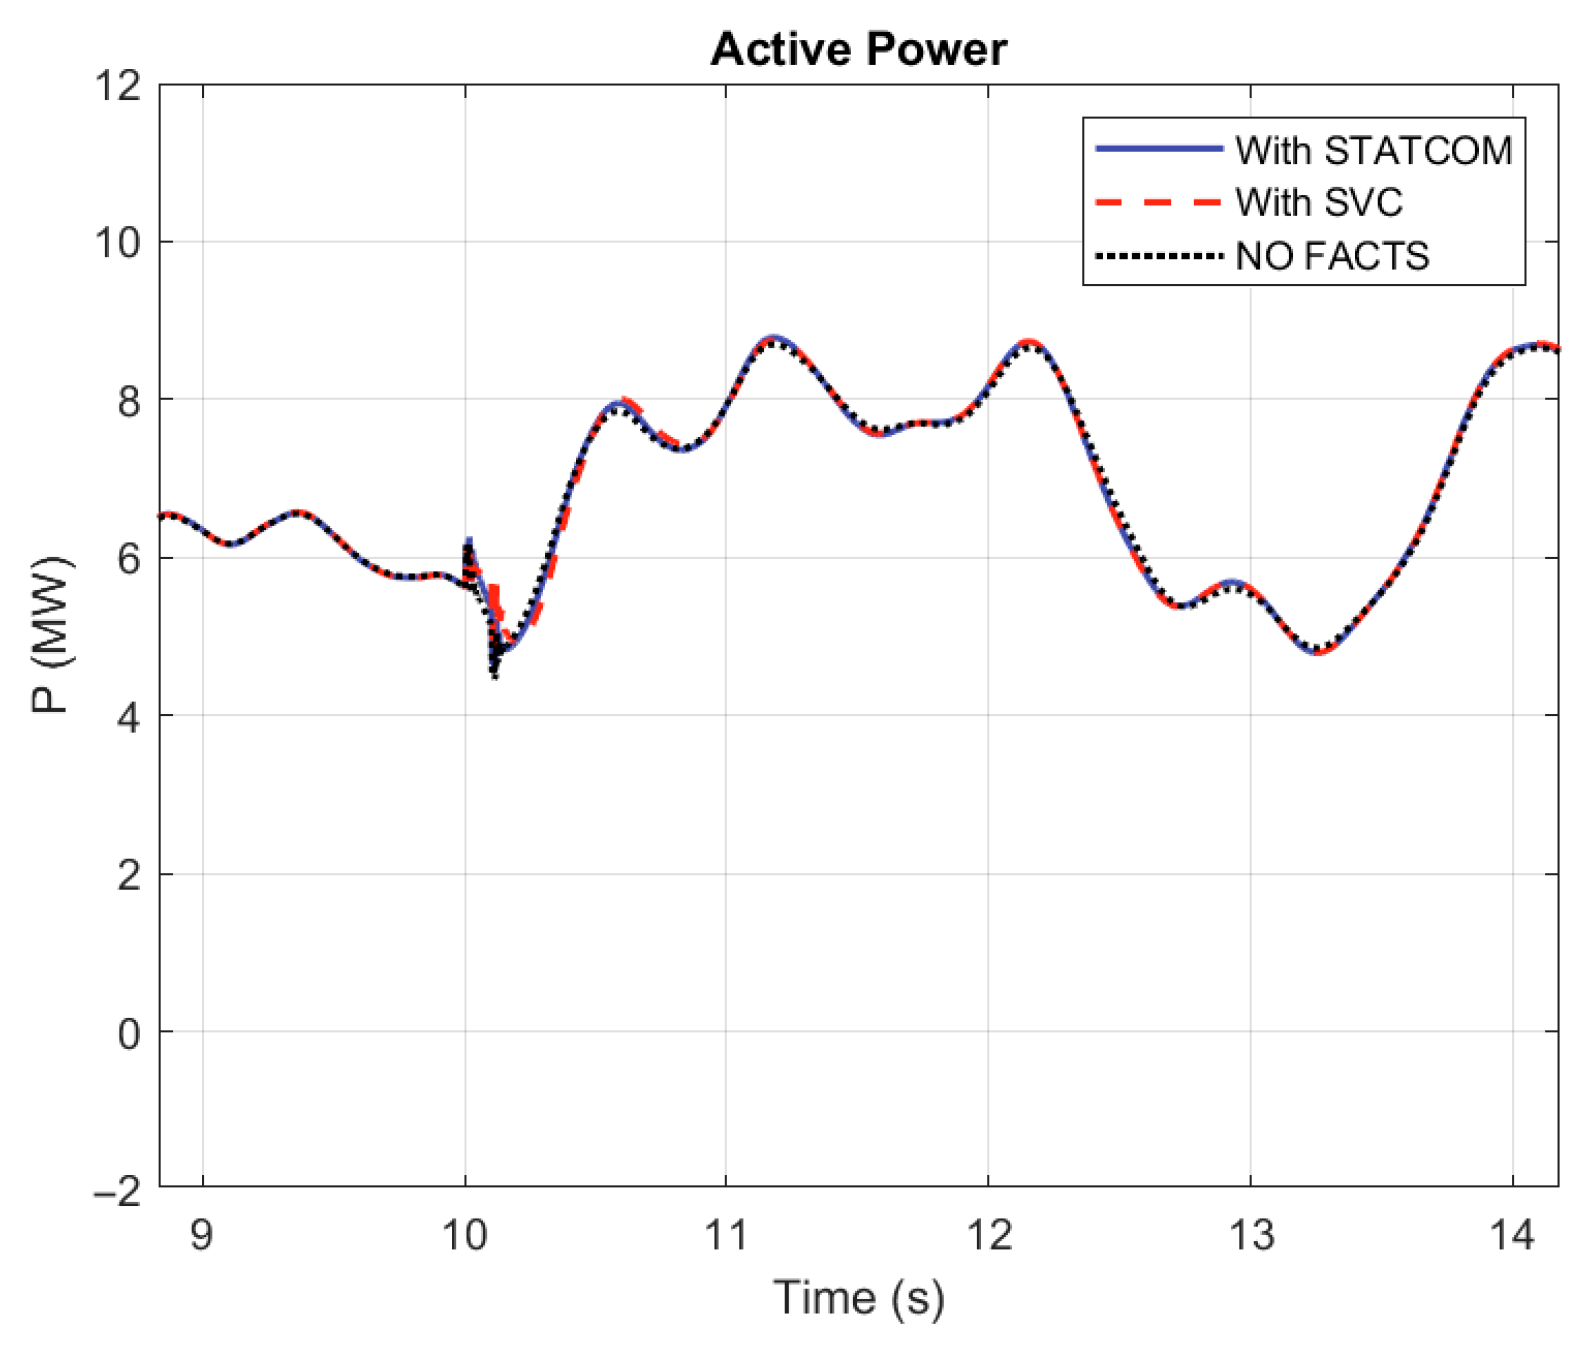
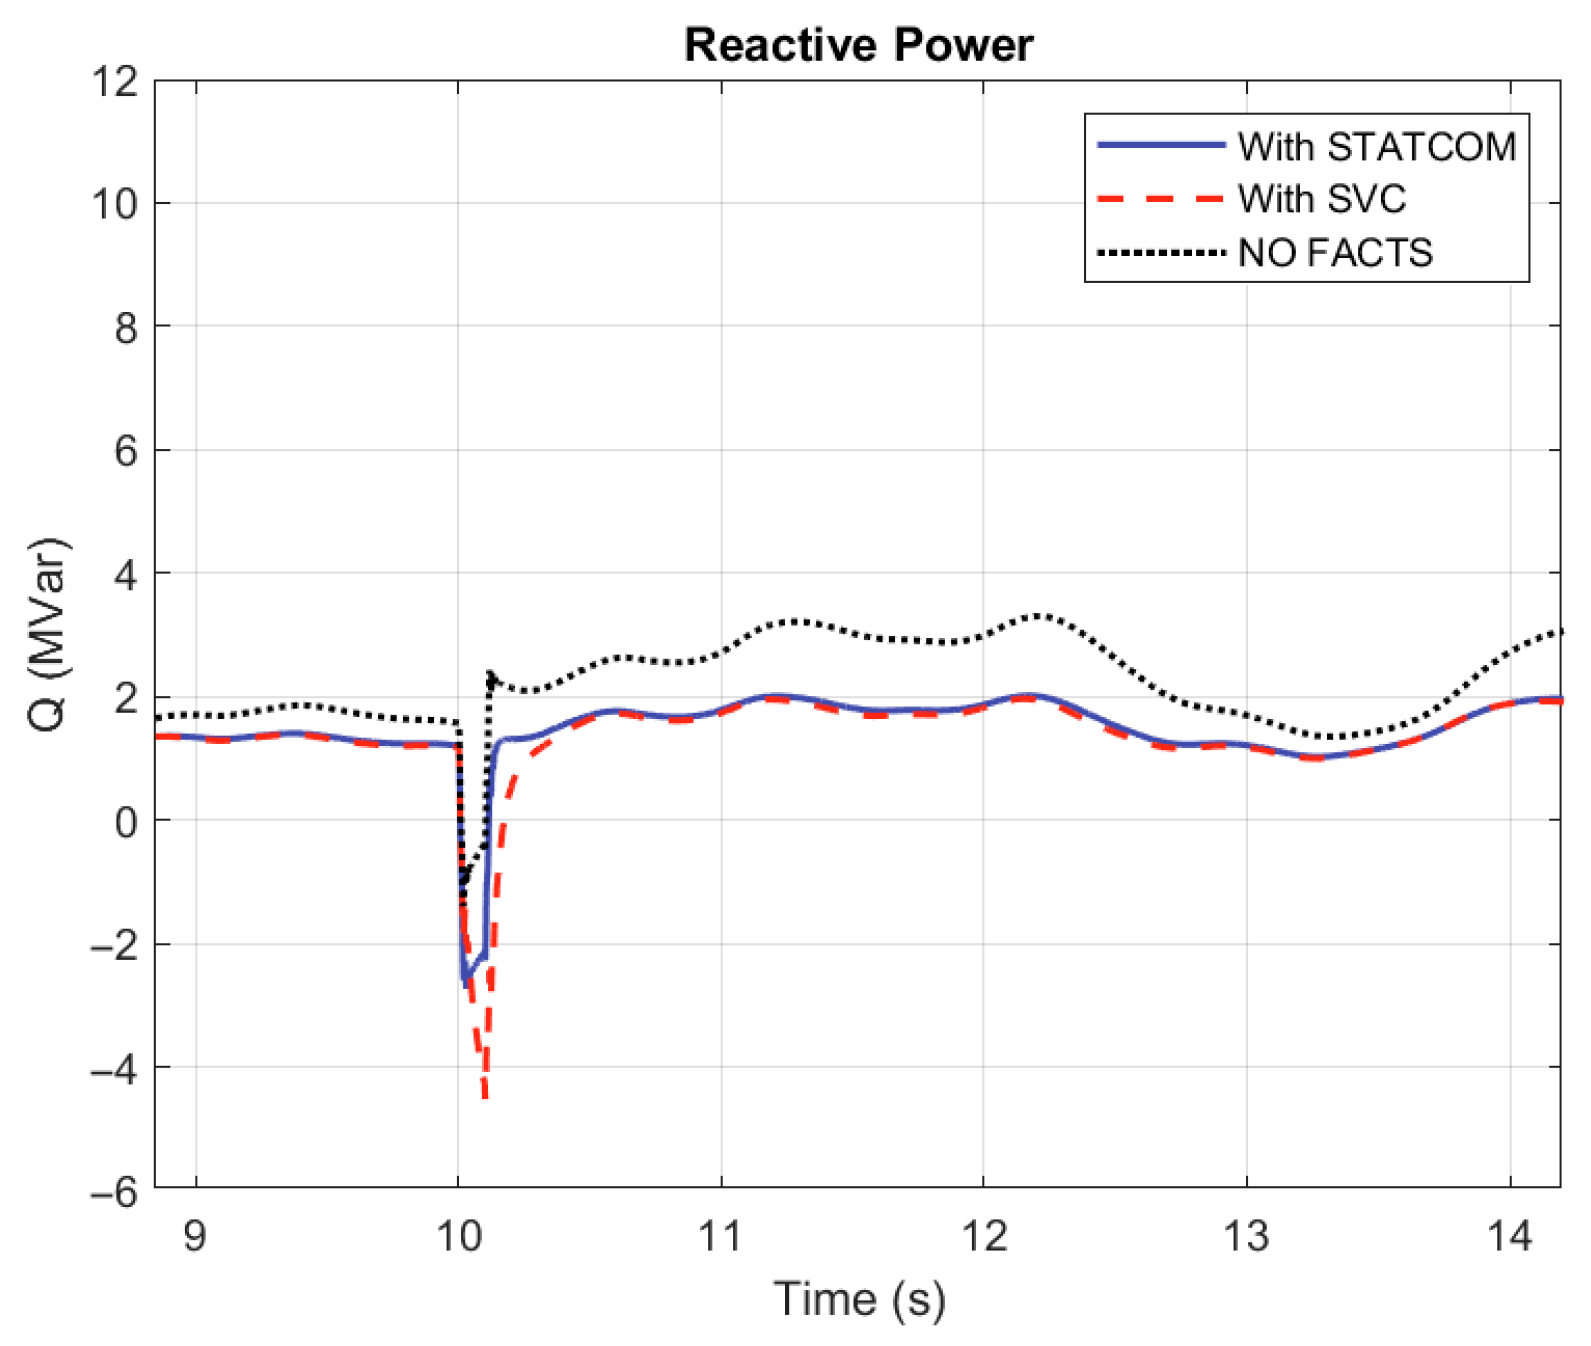
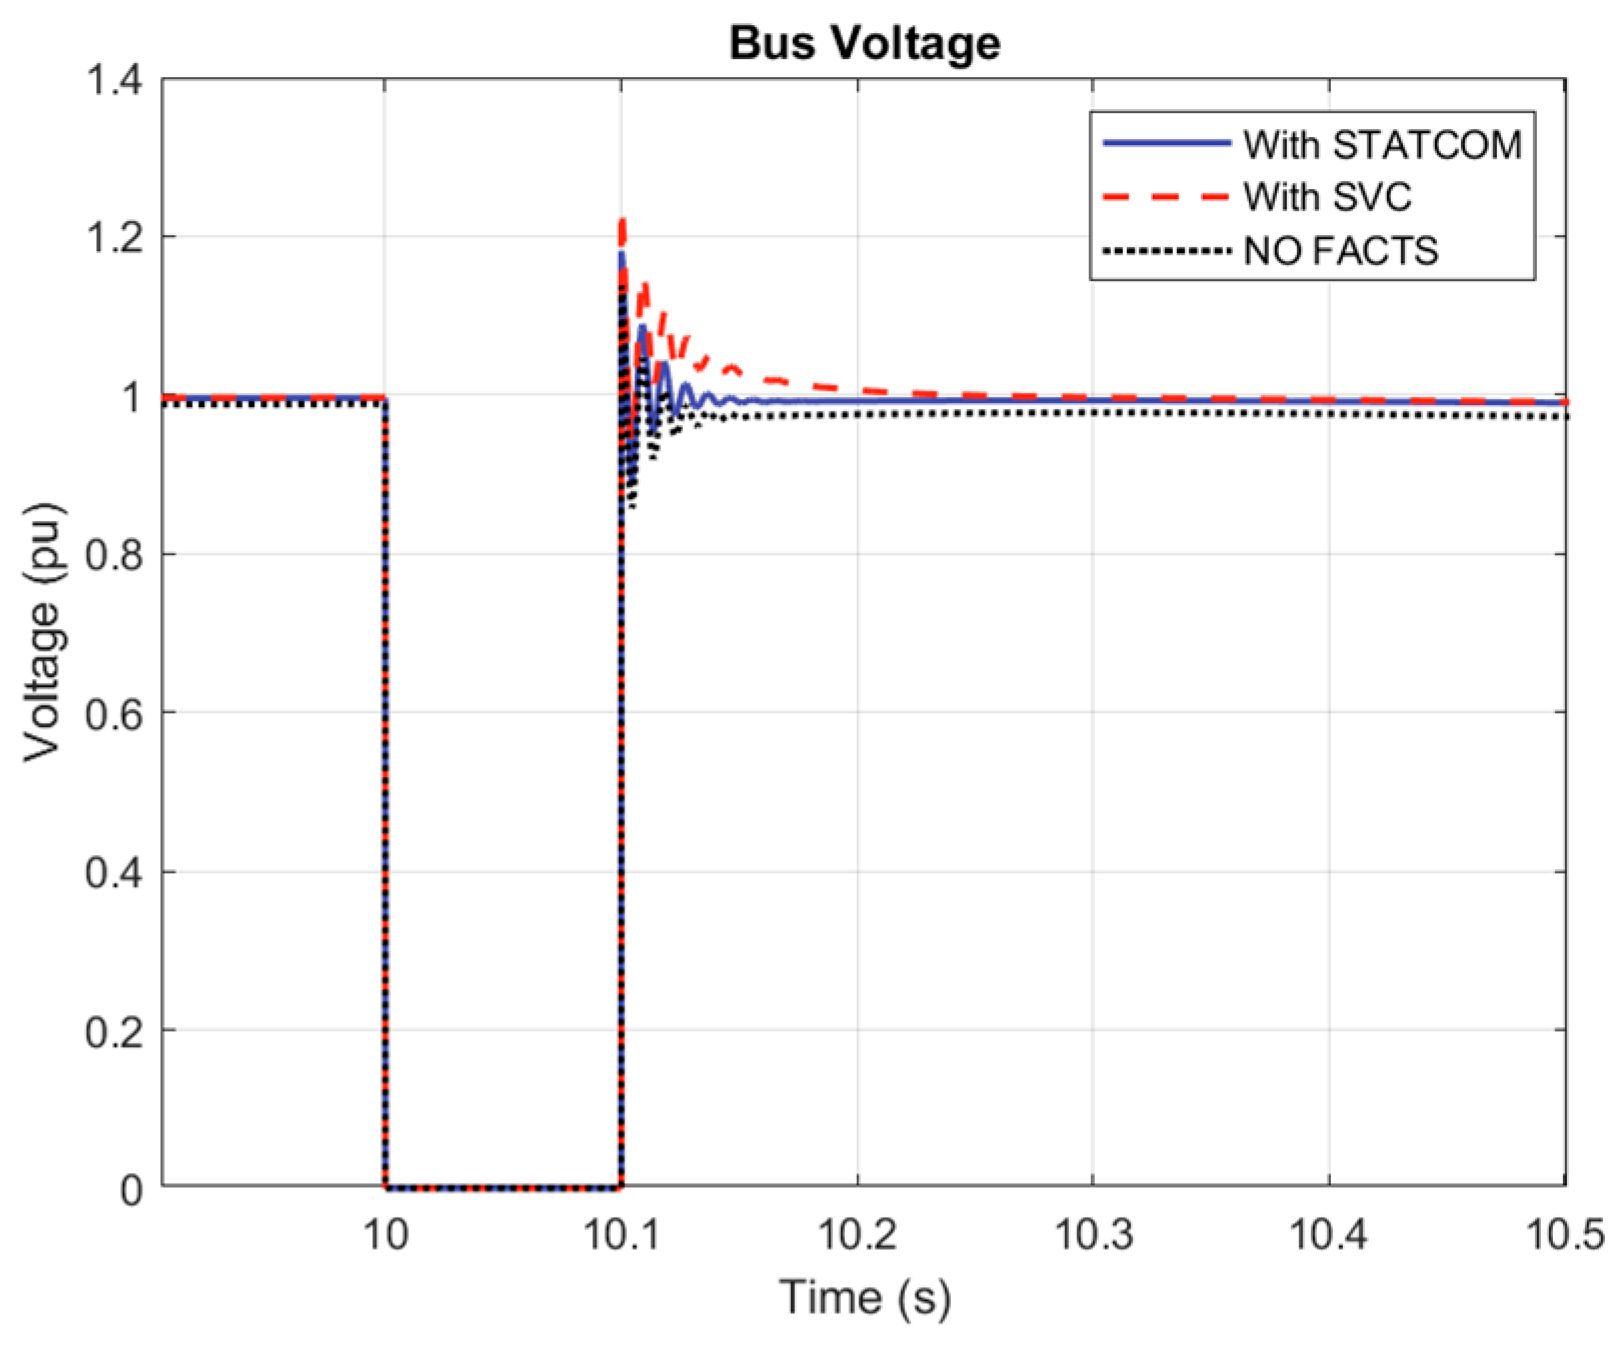
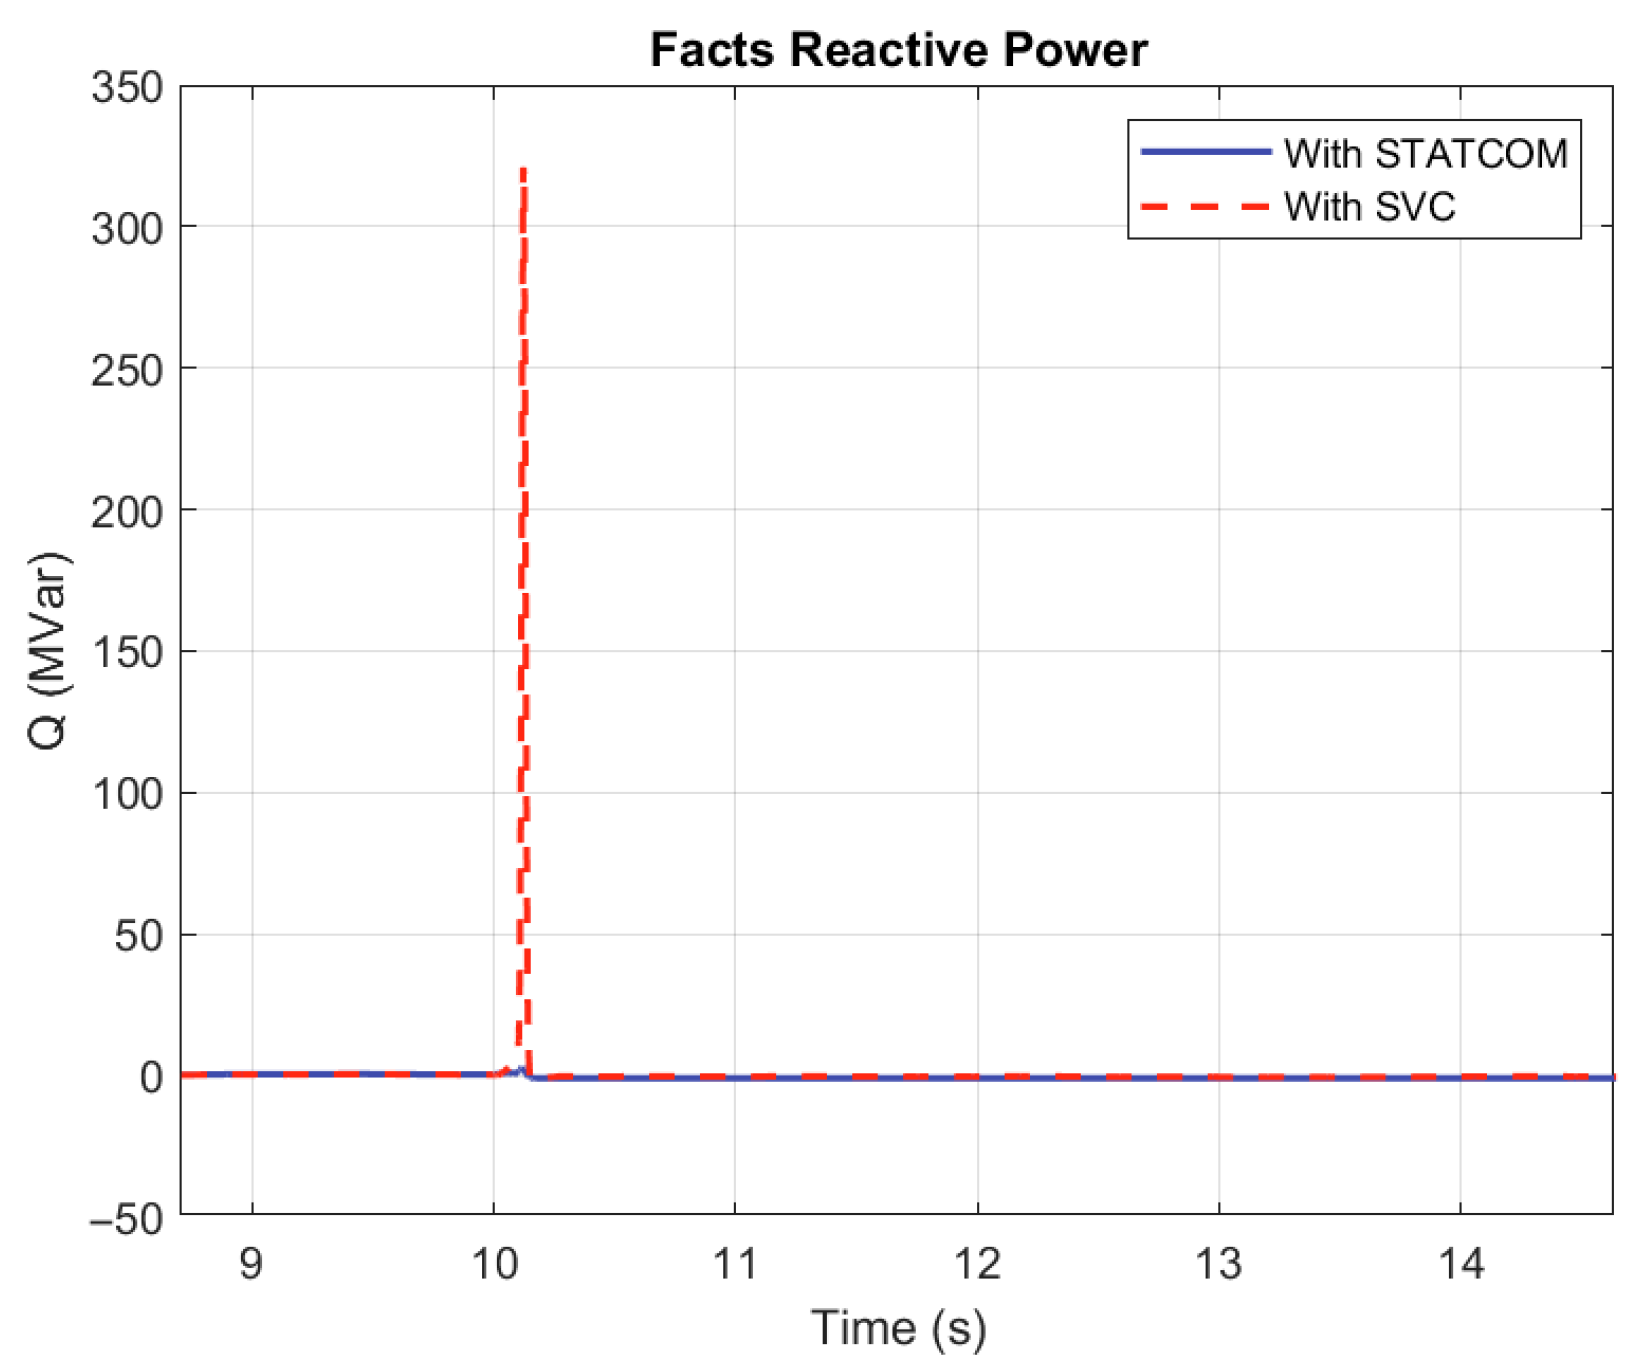
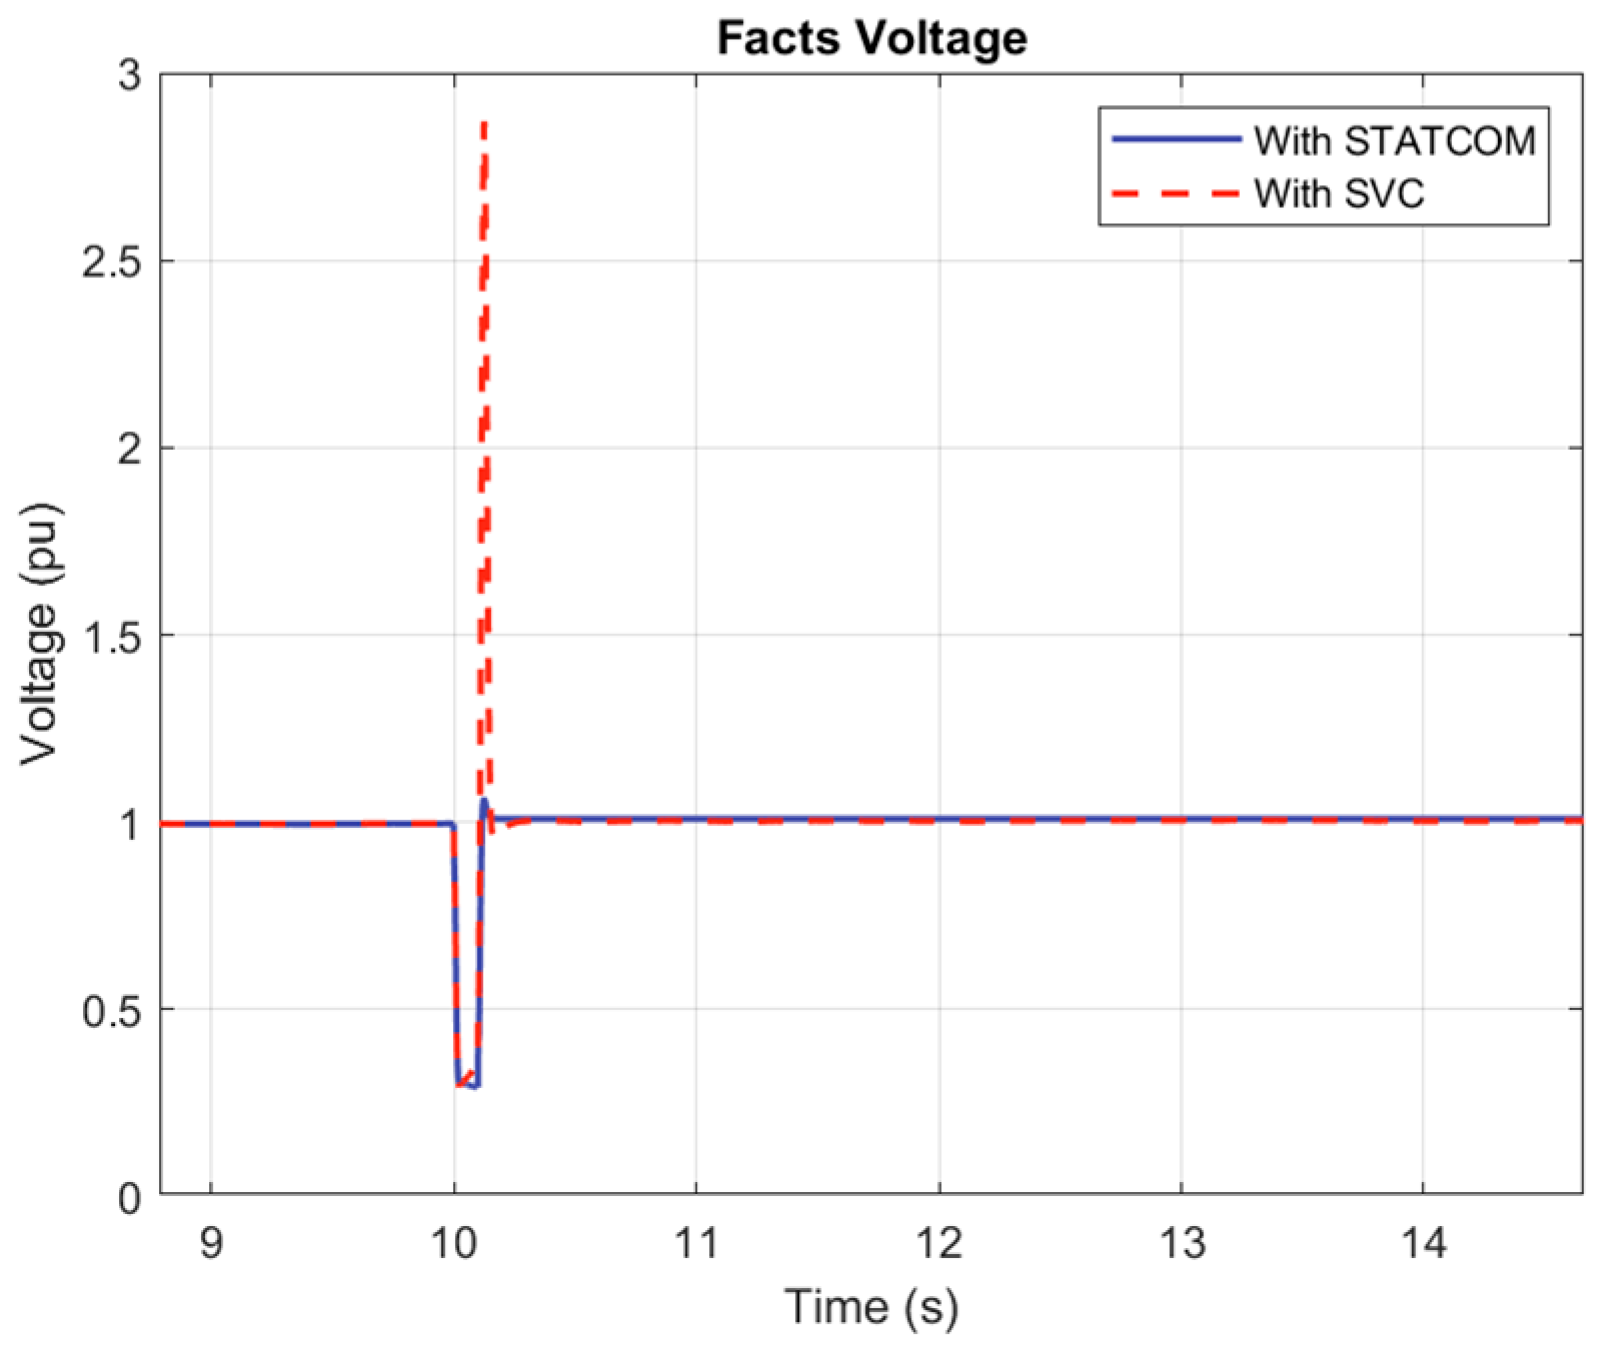
In this scenario, a single-phase fault was simulated at the PCC lasting from 10 s to 10.1 s with the turbulent wind flow pattern discussed in case 2. Figure 23 clearly illustrates a sudden drop in active power from 9 MW to approximately 5 MW during the fault period, with rapid restoration to normal operation post-fault when FACTS devices are employed. Figure 24 demonstrates that the presence of SVC and STATCOM significantly reduced the reactive power drawn from the grid, from around 2.0 MVAR down to approximately 0.5 MVAR, highlighting their effectiveness in rapidly stabilizing the system after faults. Regarding voltage and current responses, Figure 25 shows that STATCOM maintained voltage above 0.9 p.u. during fault recovery, indicating superior FRT performance compared to SVC. Additionally, Figure 26 depicts significantly reduced current spikes at PCC when FACTS devices were utilized, thus minimizing stress on grid infrastructure. Figure 27 and Figure 28 show the reactive power control capabilities of FACTS, with STATCOM providing slightly improved voltage recovery over SVC.
  • Case 4: Two-Phase Fault at PCC
In this scenario, a two-phase fault lasting from 10 s to 10.1 s was simulated at the PCC with the turbulent wind flow pattern discussed in case 2. Figure 29 demonstrates that active power delivery dropped to zero without FACTS devices, but with SVC and STATCOM, power rapidly recovered to approximately 8 MW after fault clearance. Figure 30 shows a significant reduction in reactive power drawn from the grid when FACTS were used, decreasing from around 2.2 MVAR without FACTS to approximately 0.6 MVAR. Additionally, Figure 31 indicates STATCOM’s superior performance, maintaining voltage levels above 0.85 p.u. during the fault due to its faster IGBT-based switching compared to the SCR-based SVC. Figure 32 further highlights that the current drawn from the grid was significantly lower with FACTS devices. Figure 33 and Figure 34 confirm that both devices provided essential reactive power support during faults, with STATCOM offering better voltage stability overall.
  • Case 5: Three-Phase Fault at any two branches of Wind Farm
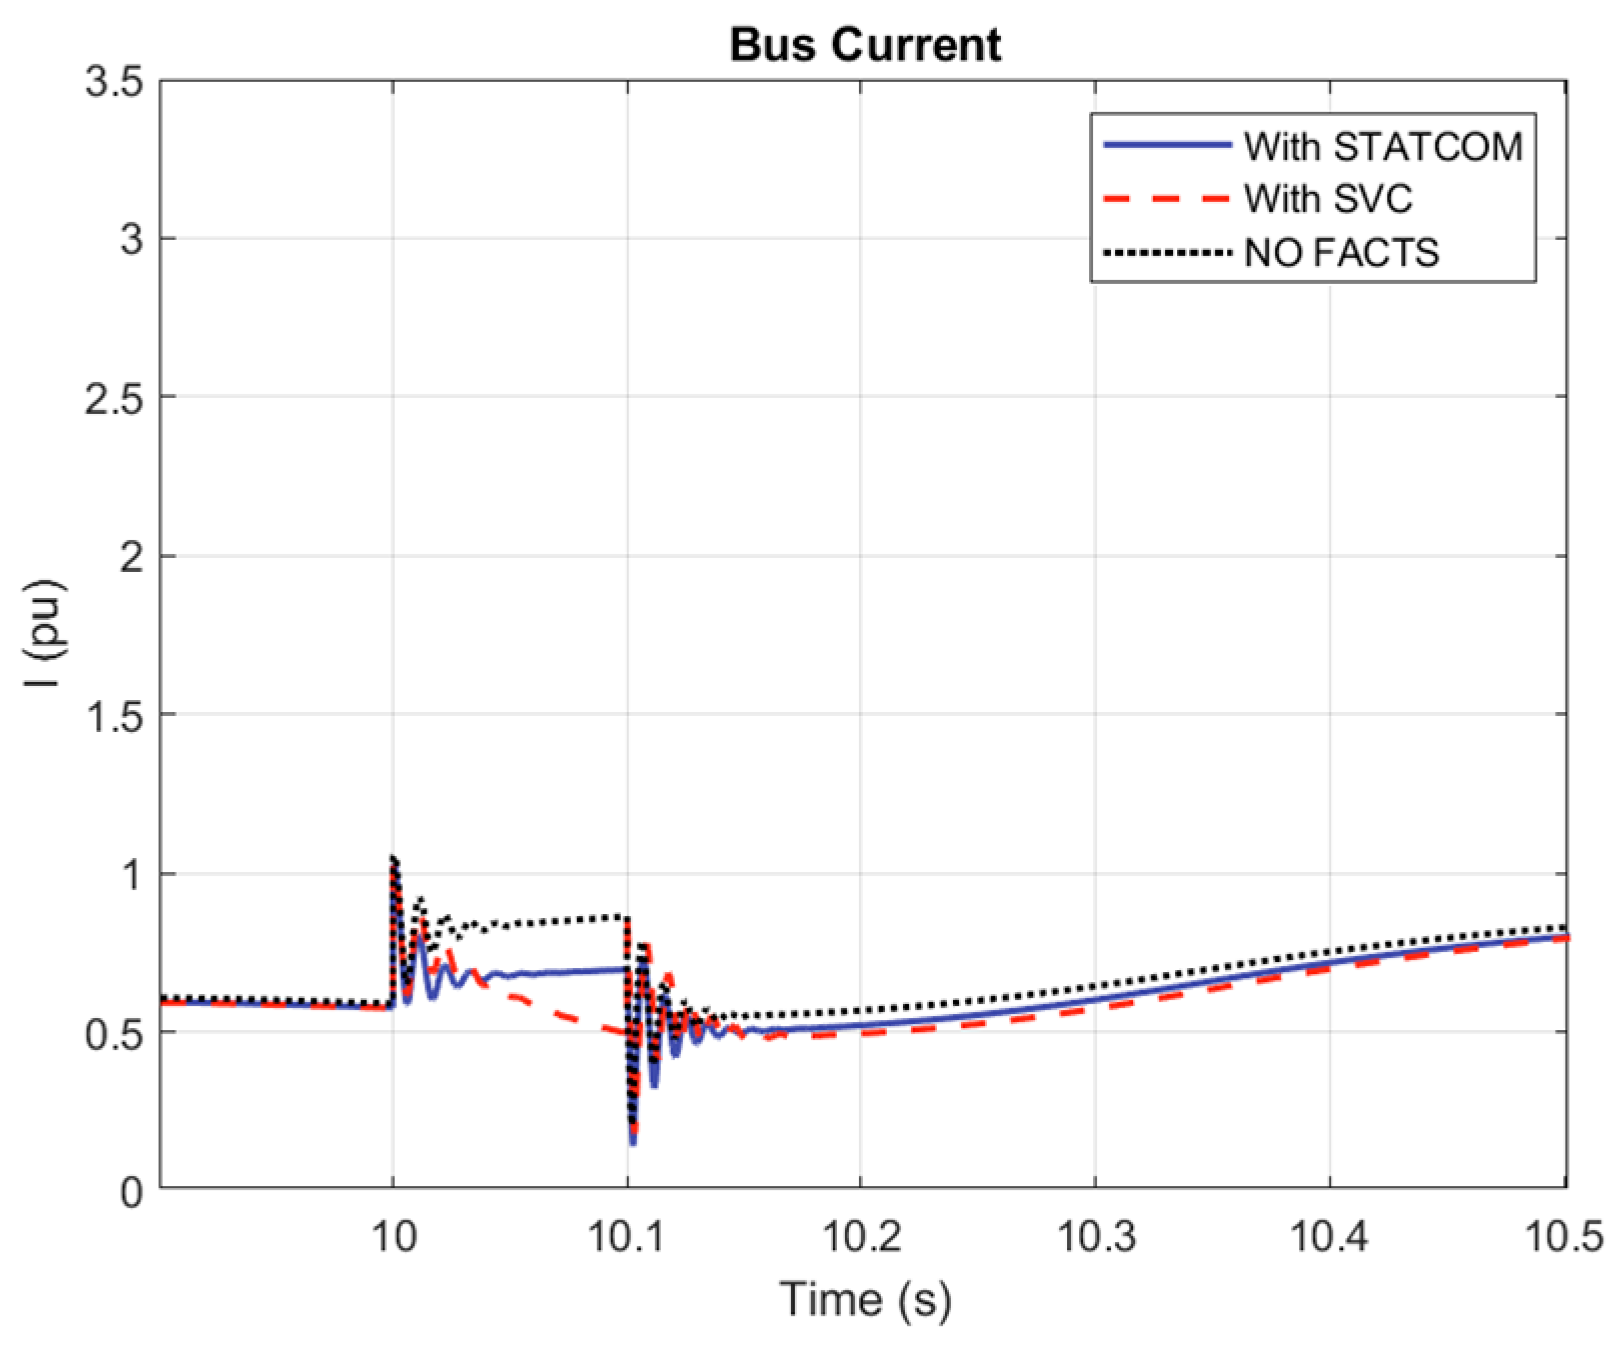
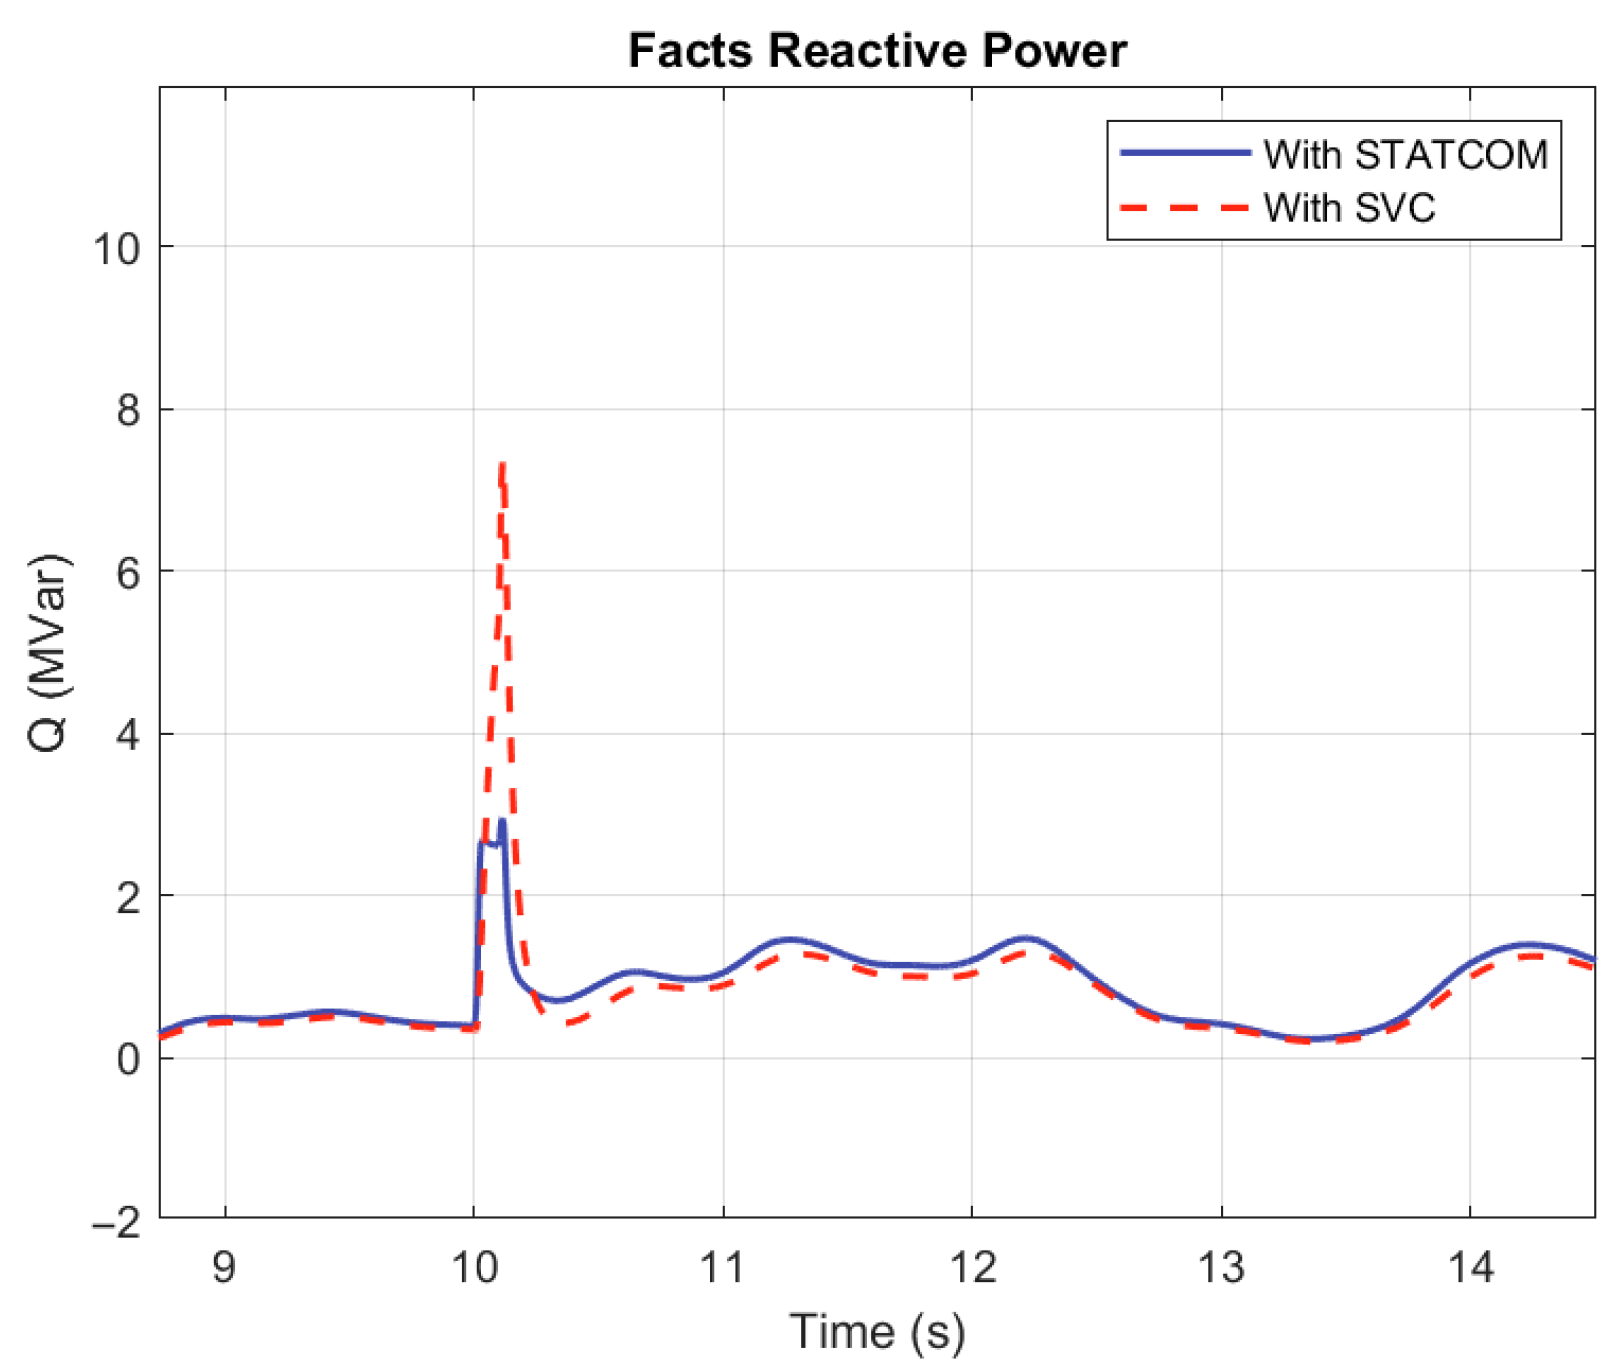
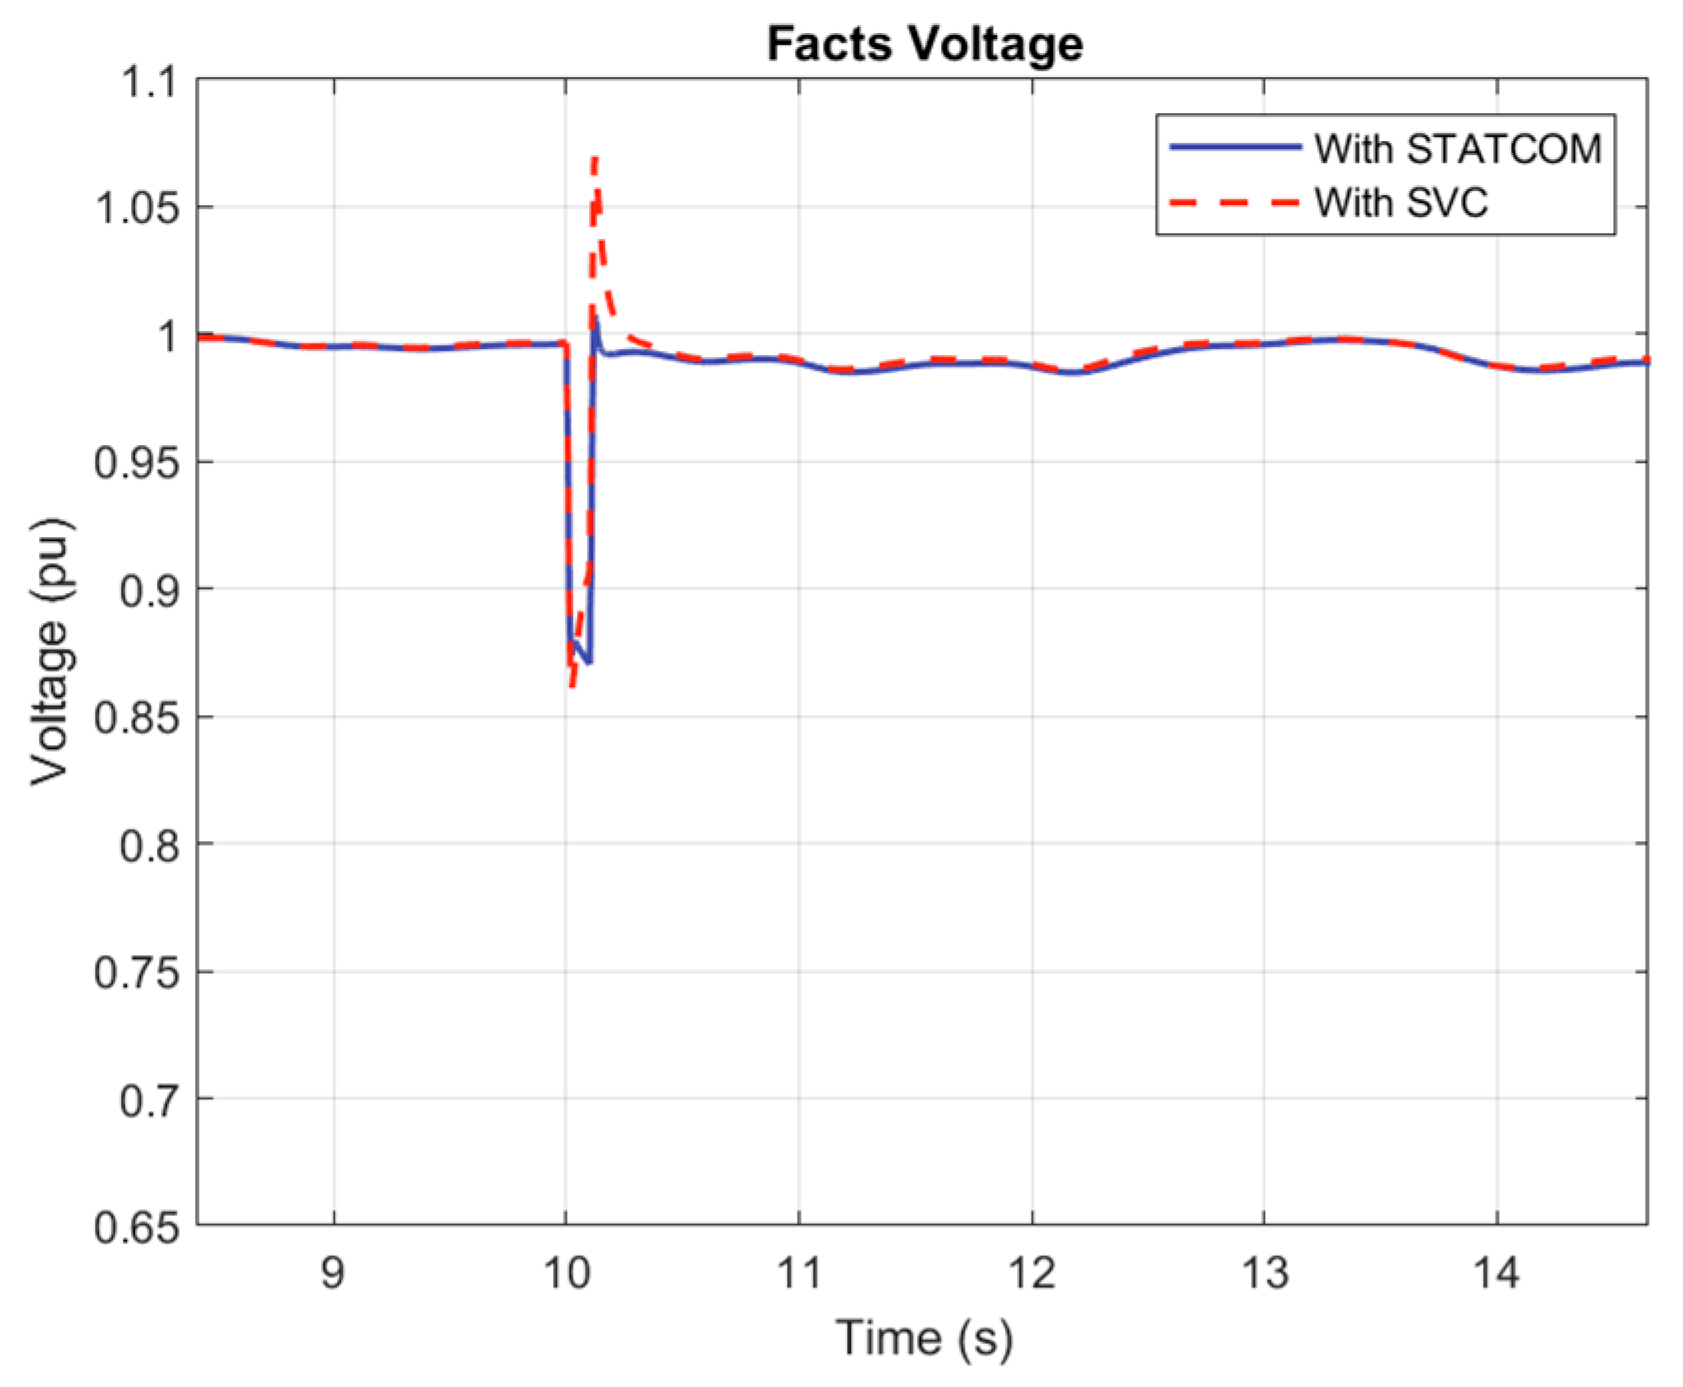
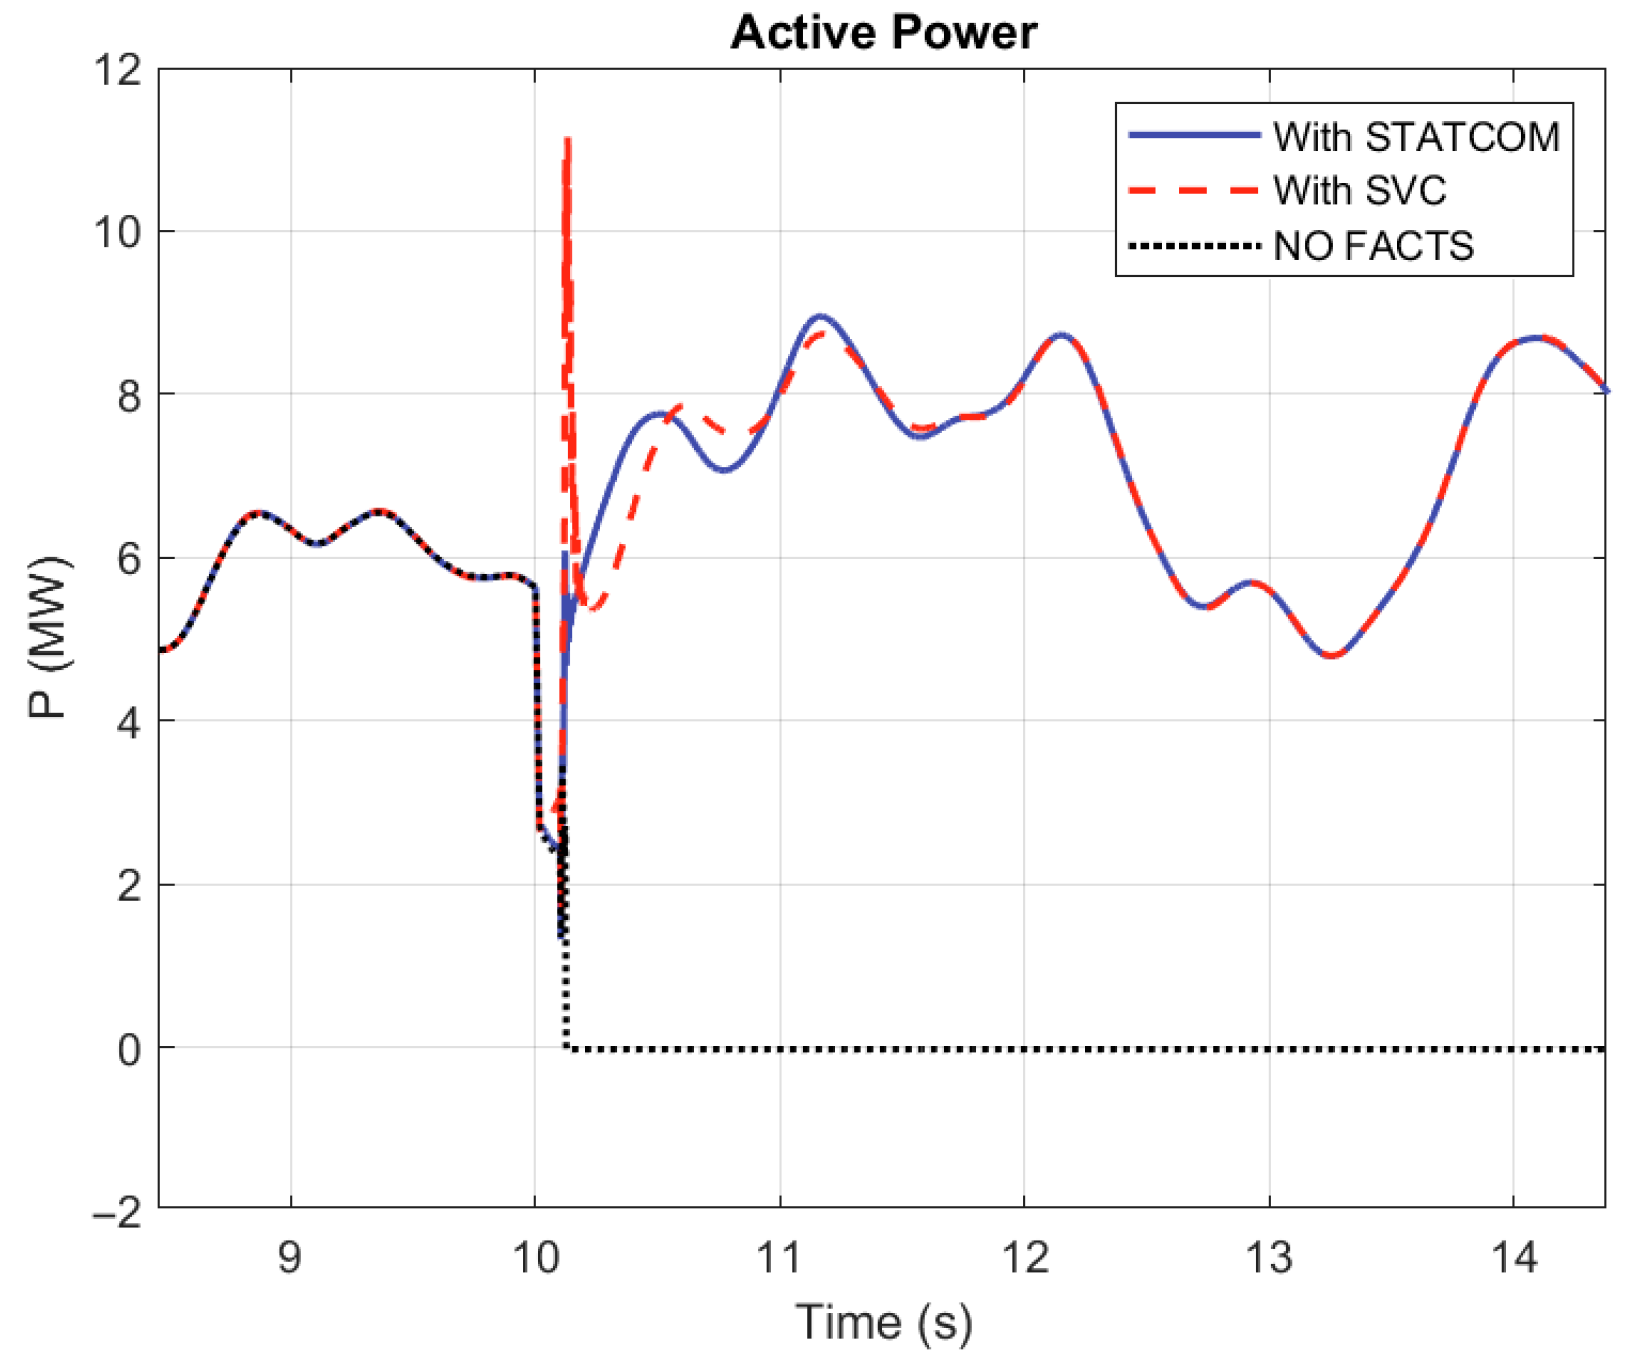
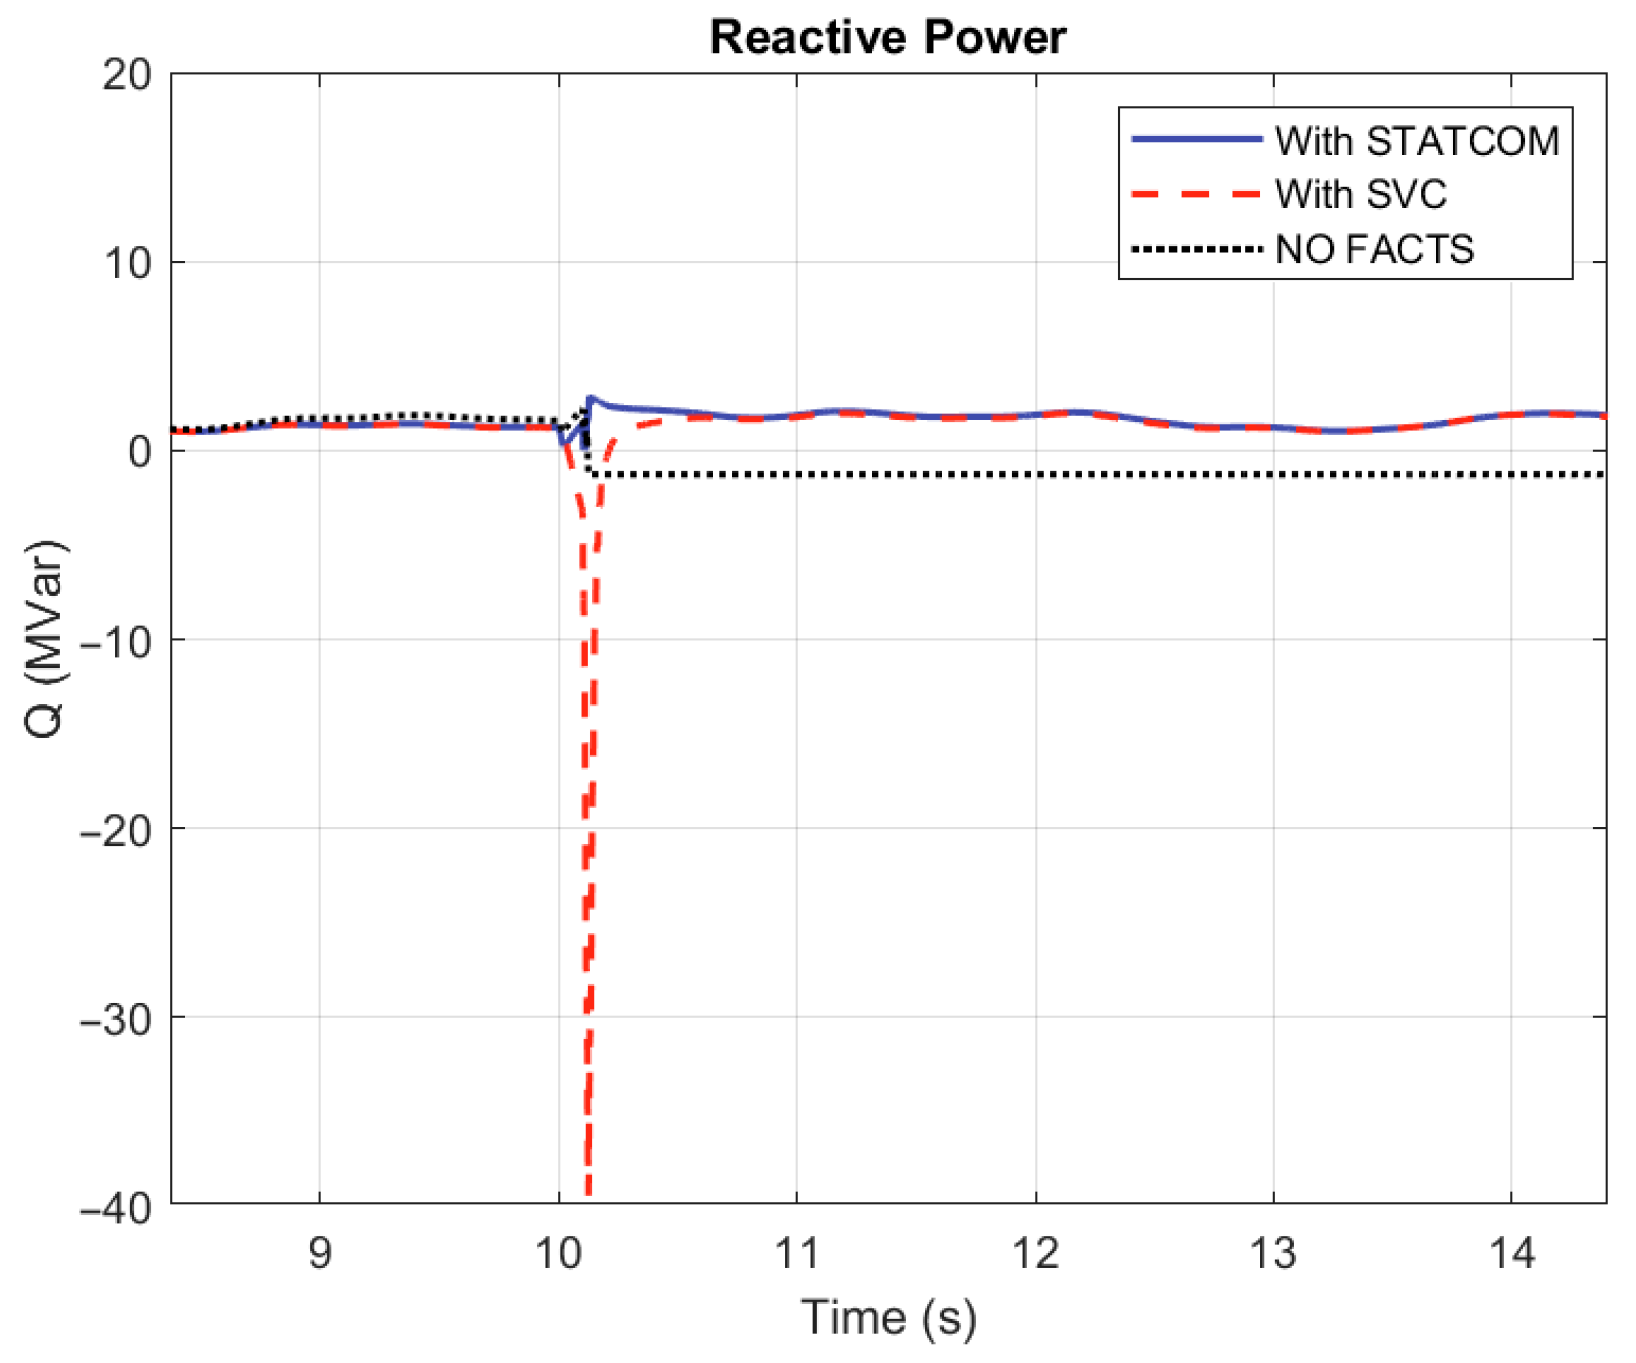
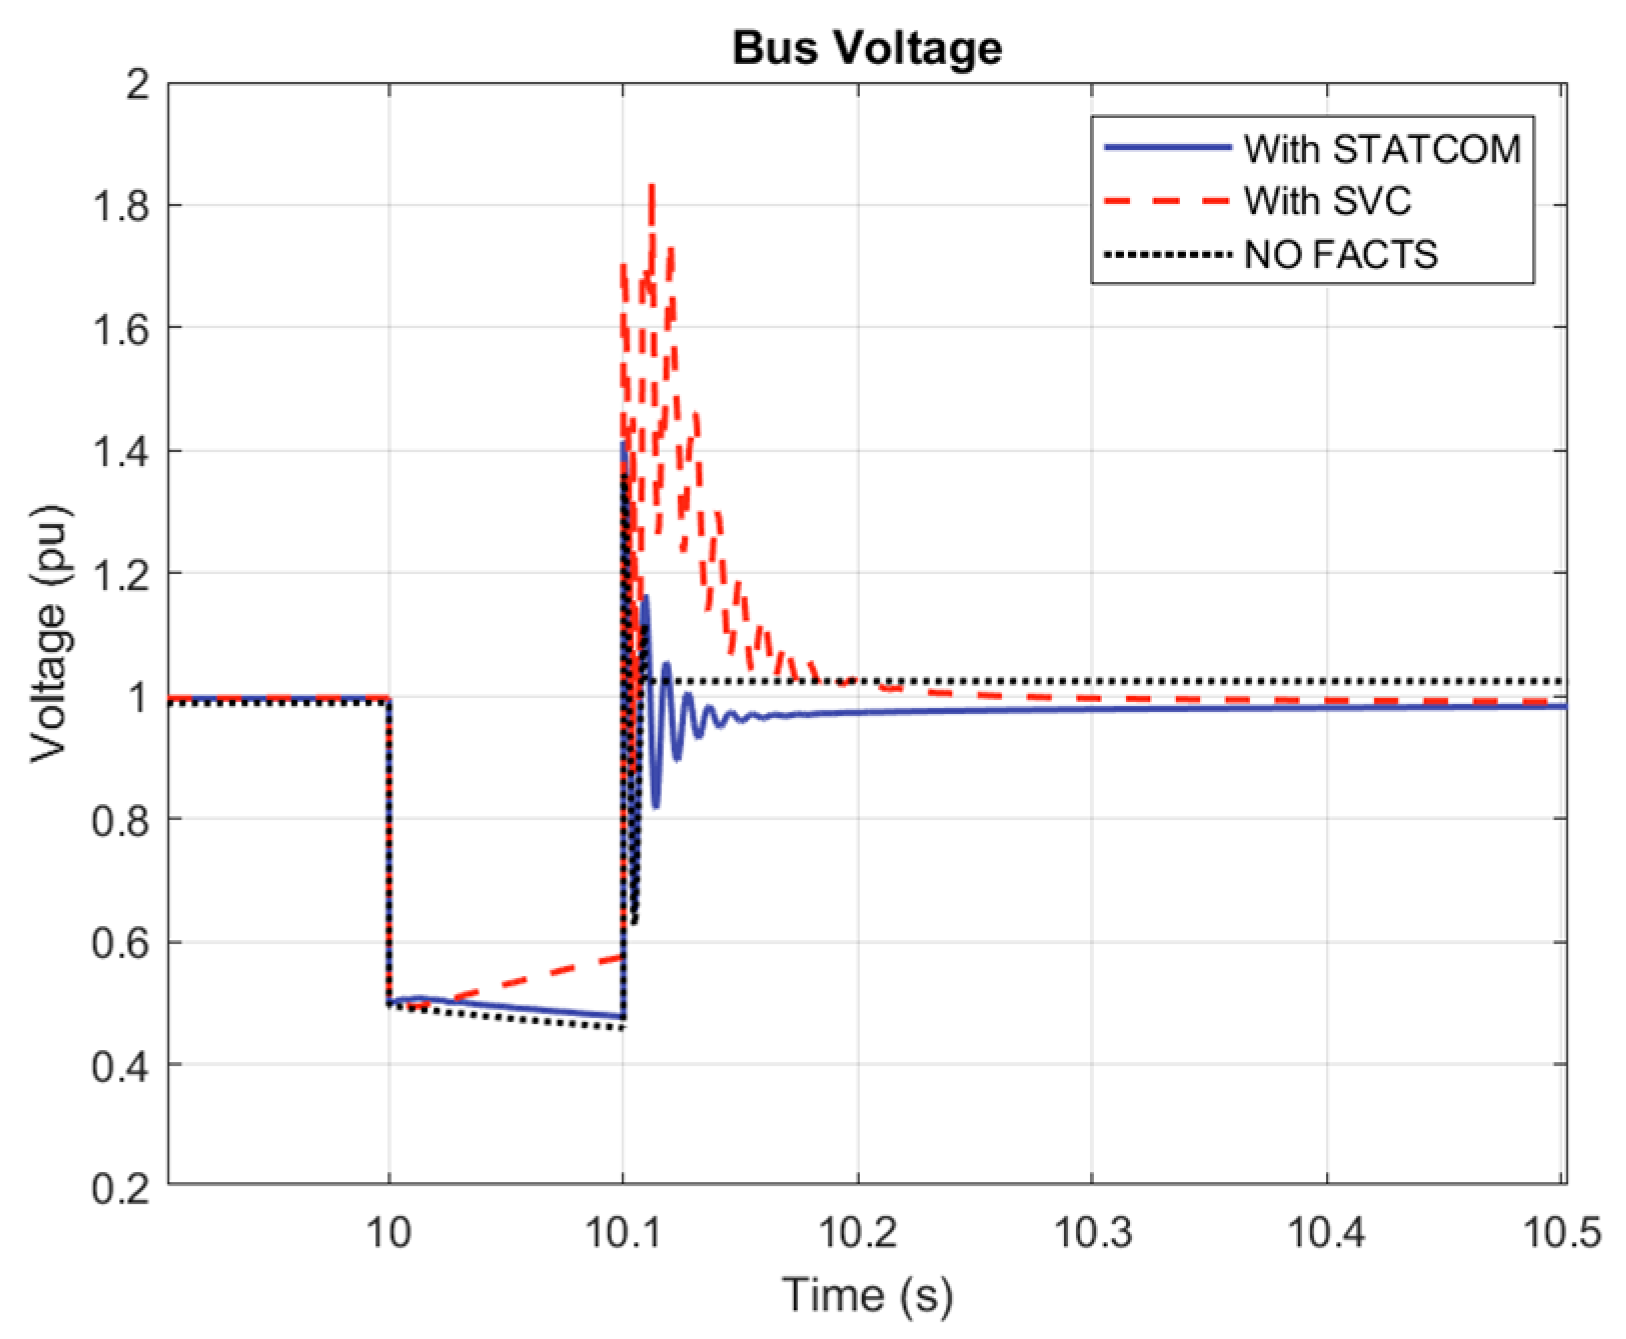
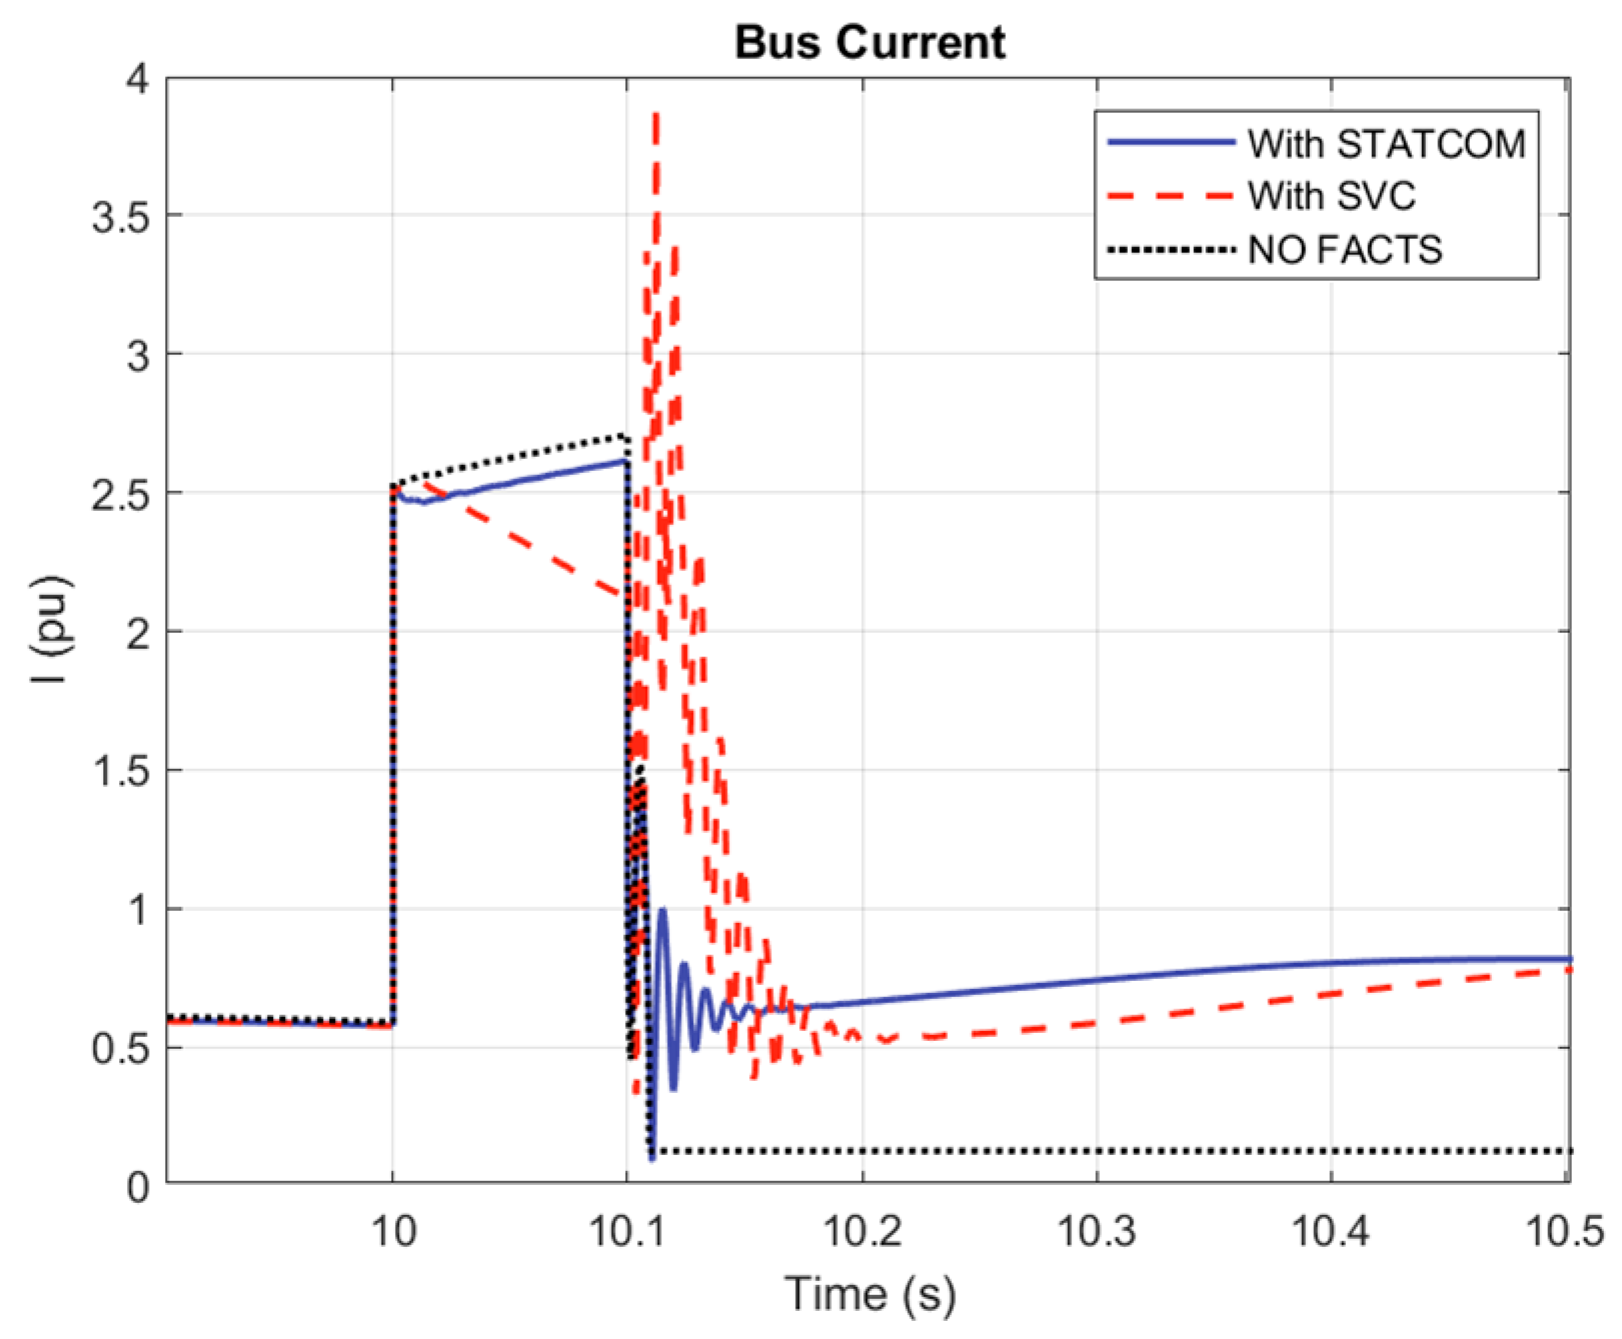
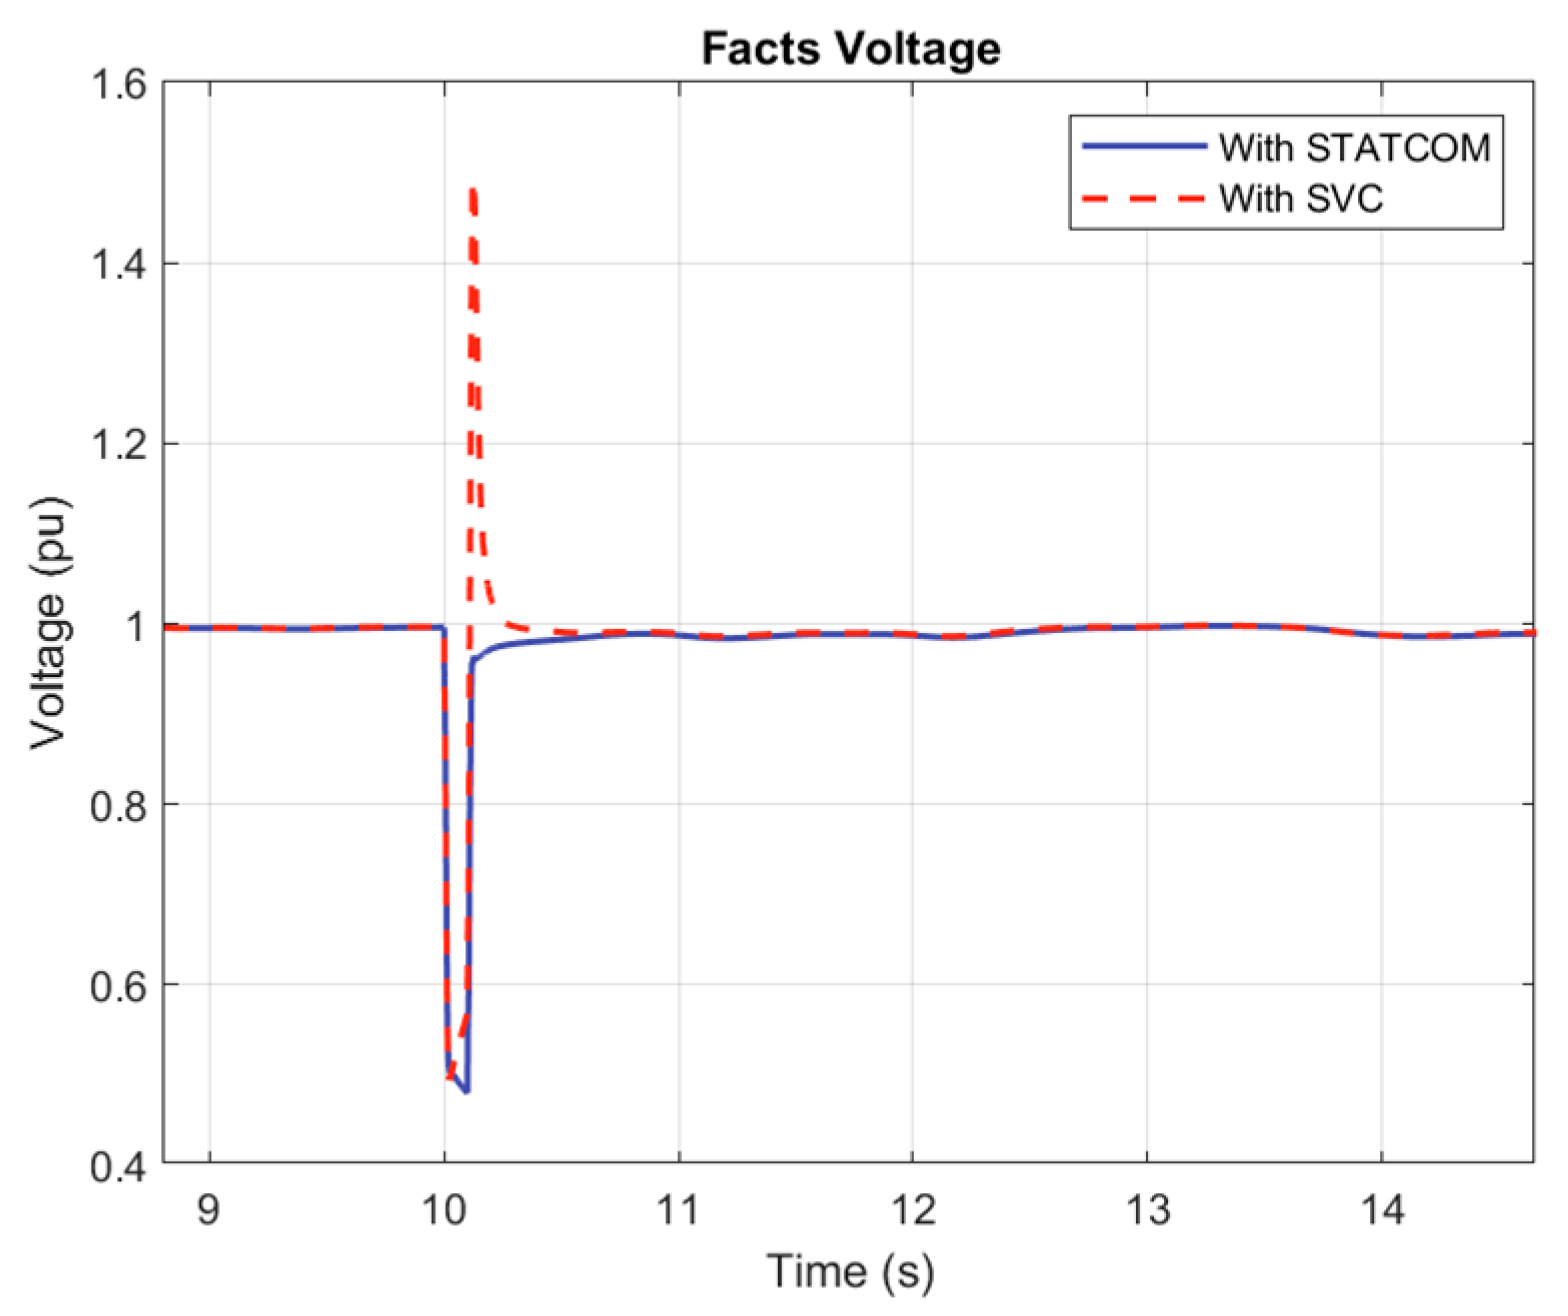
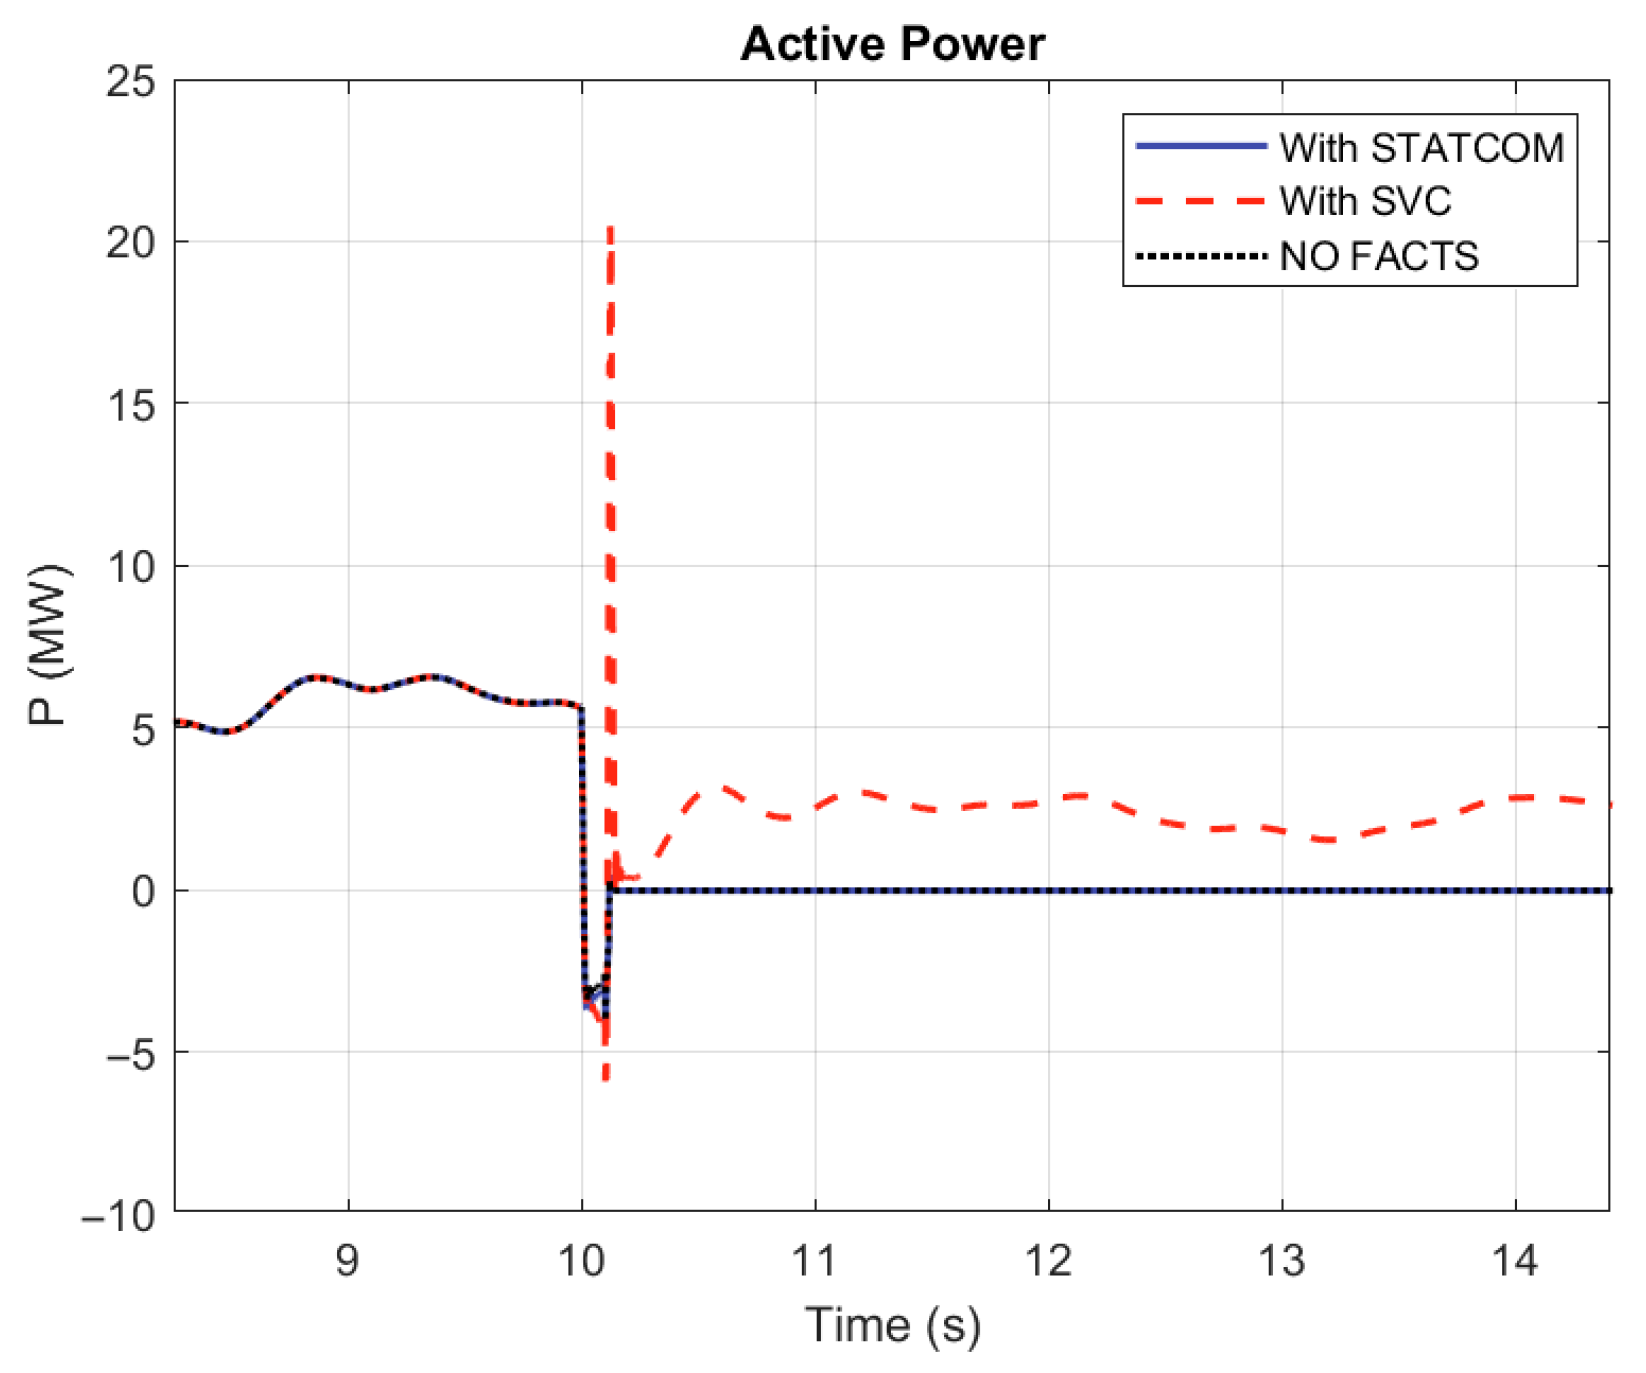
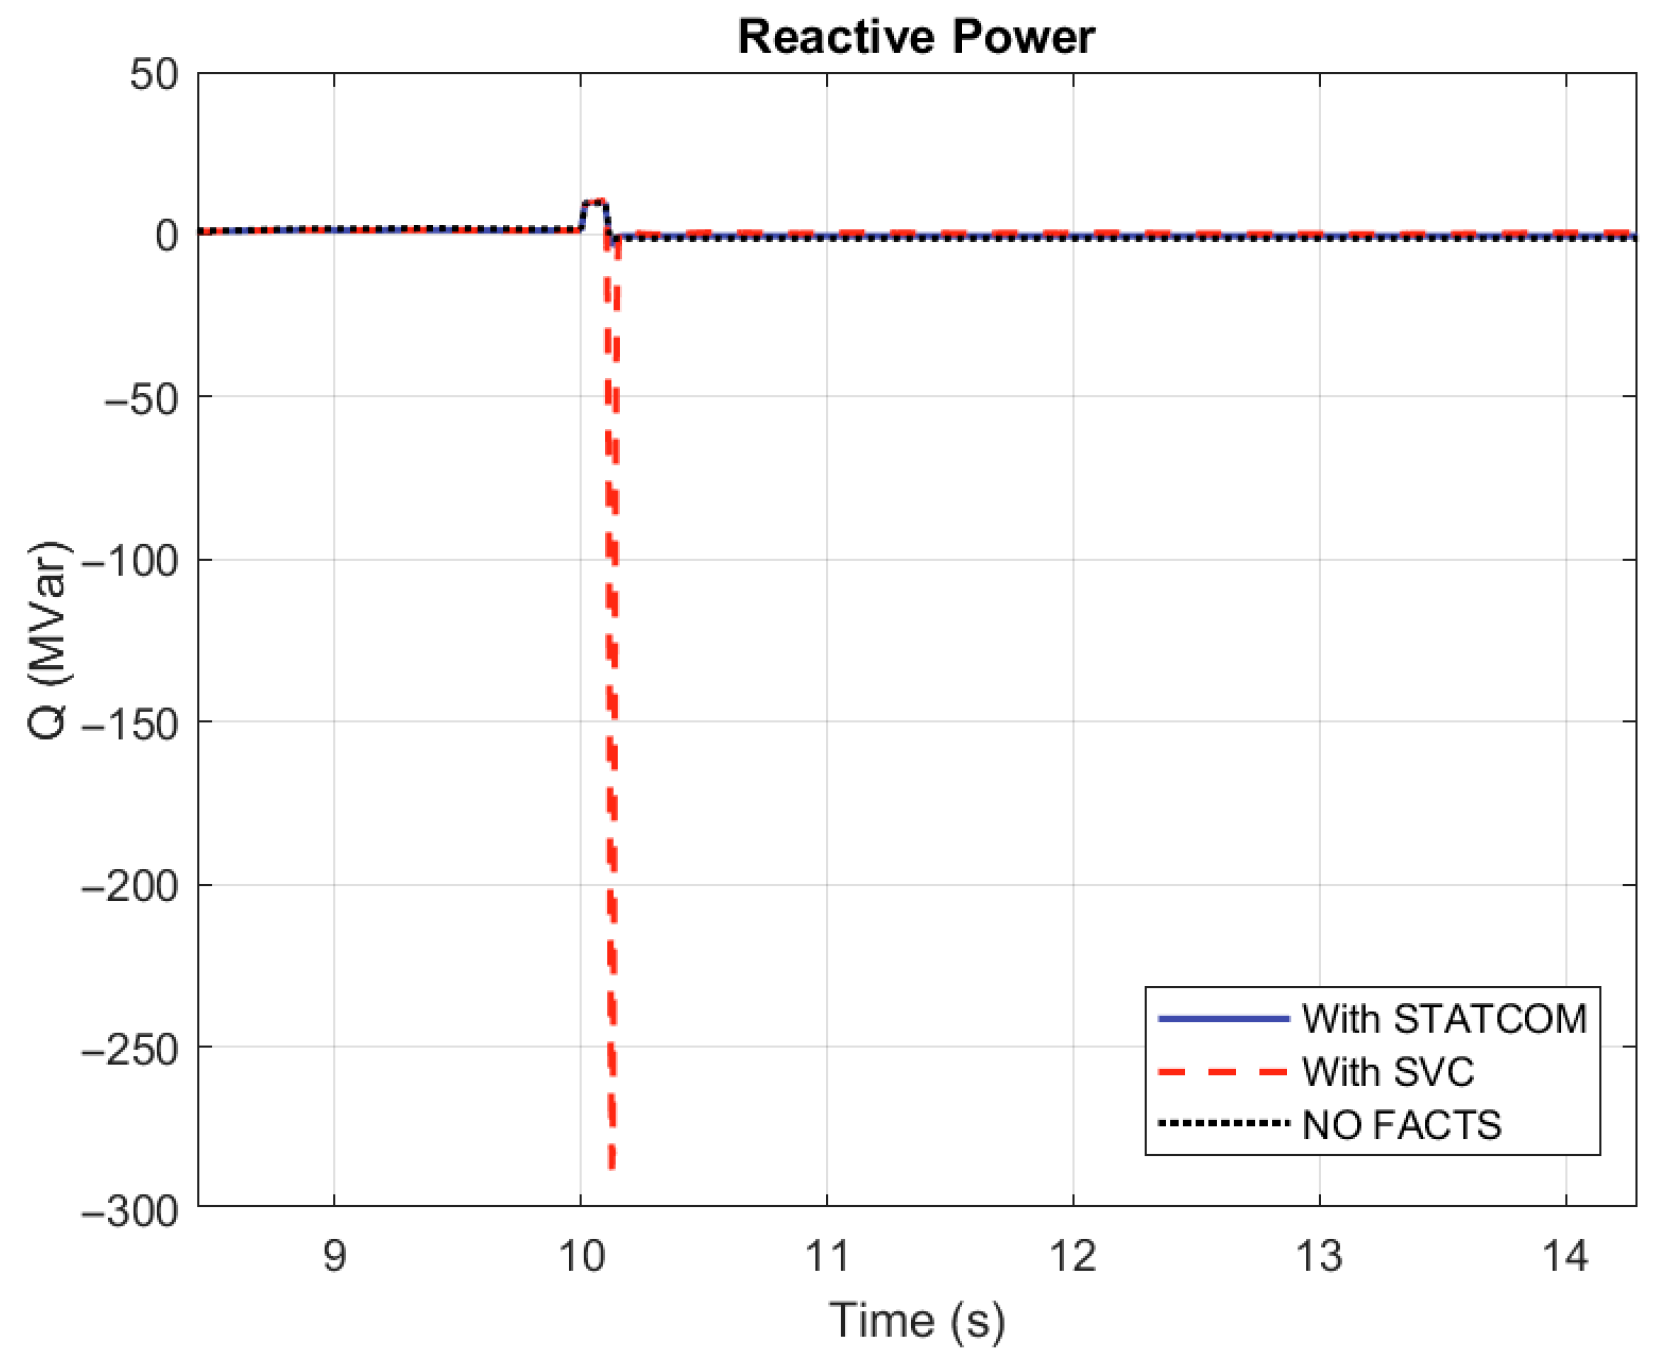
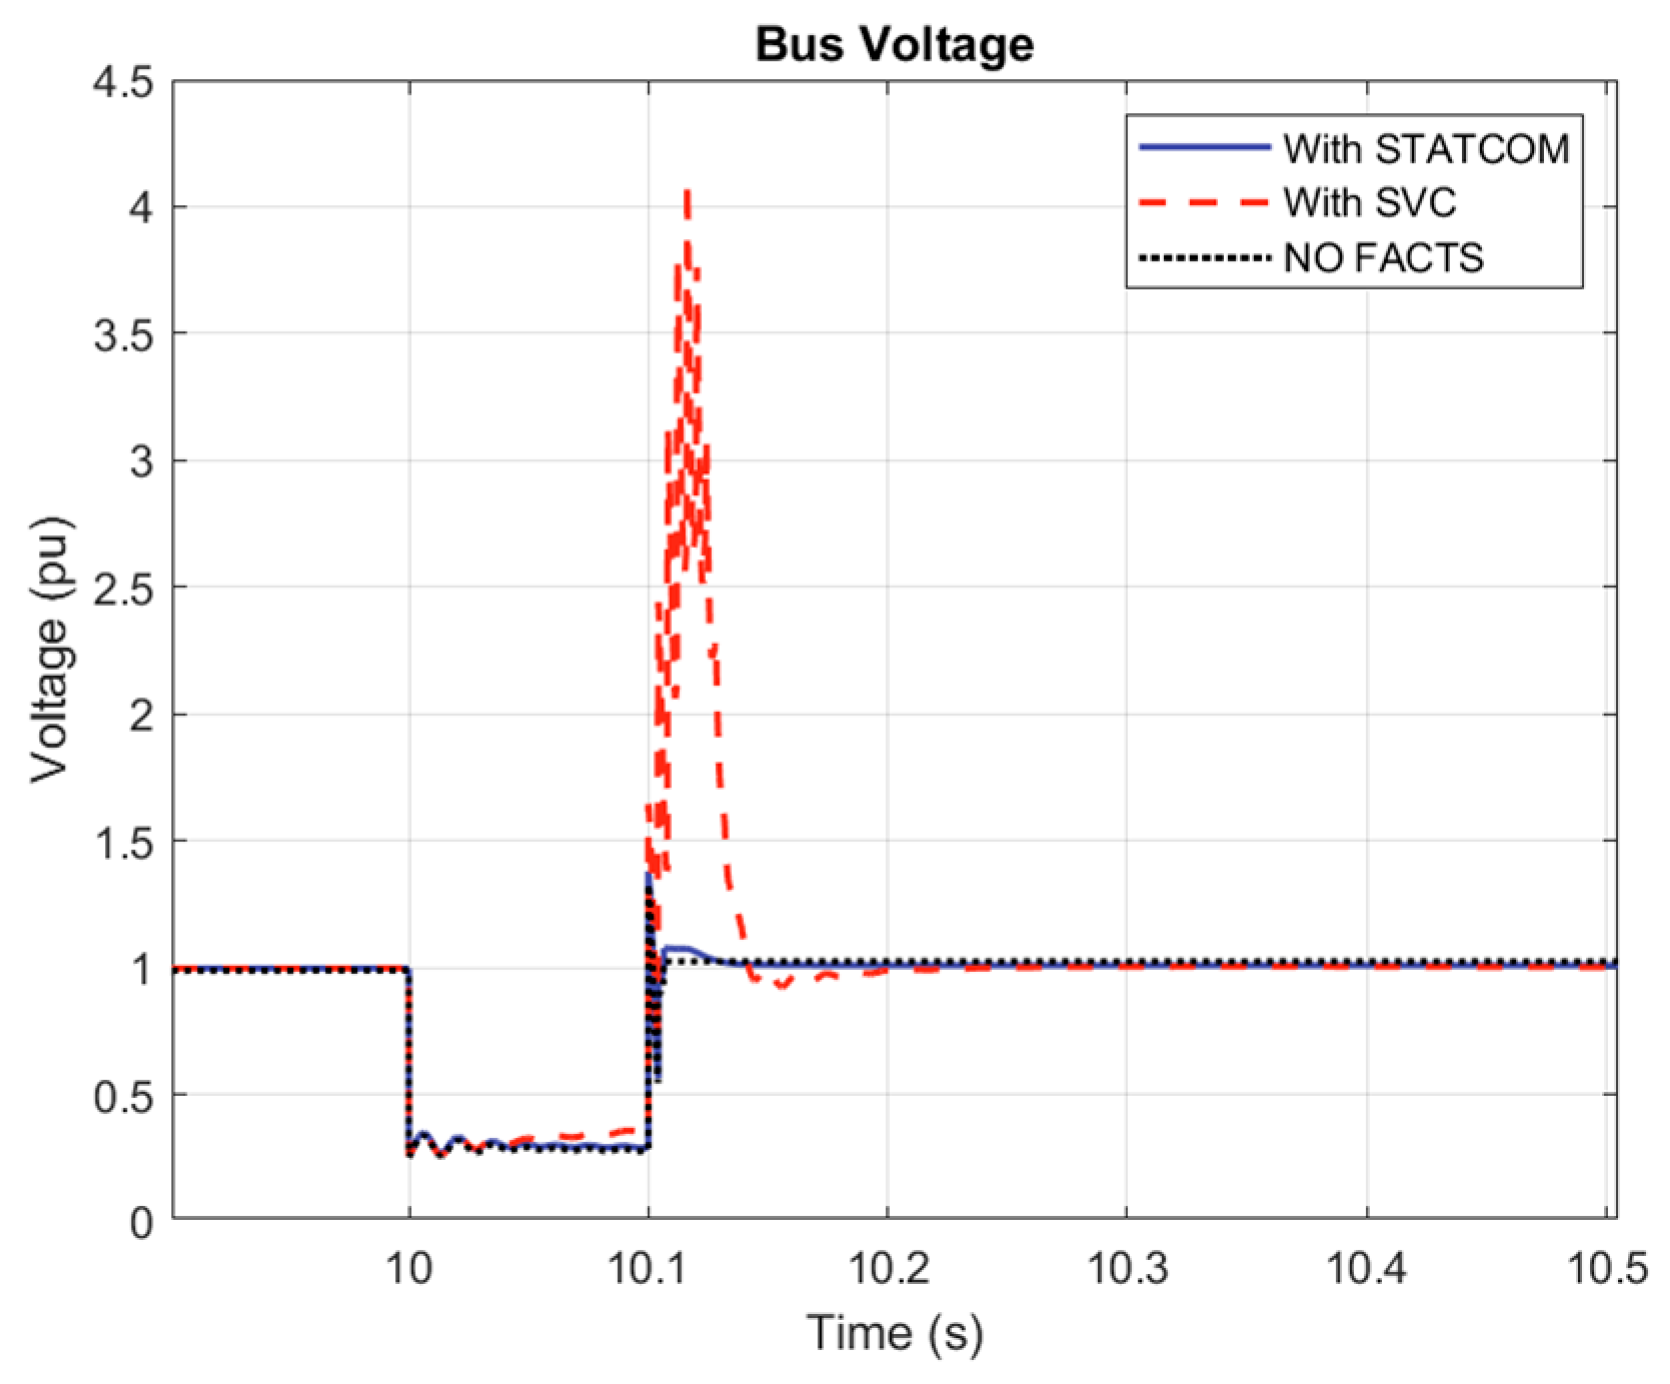
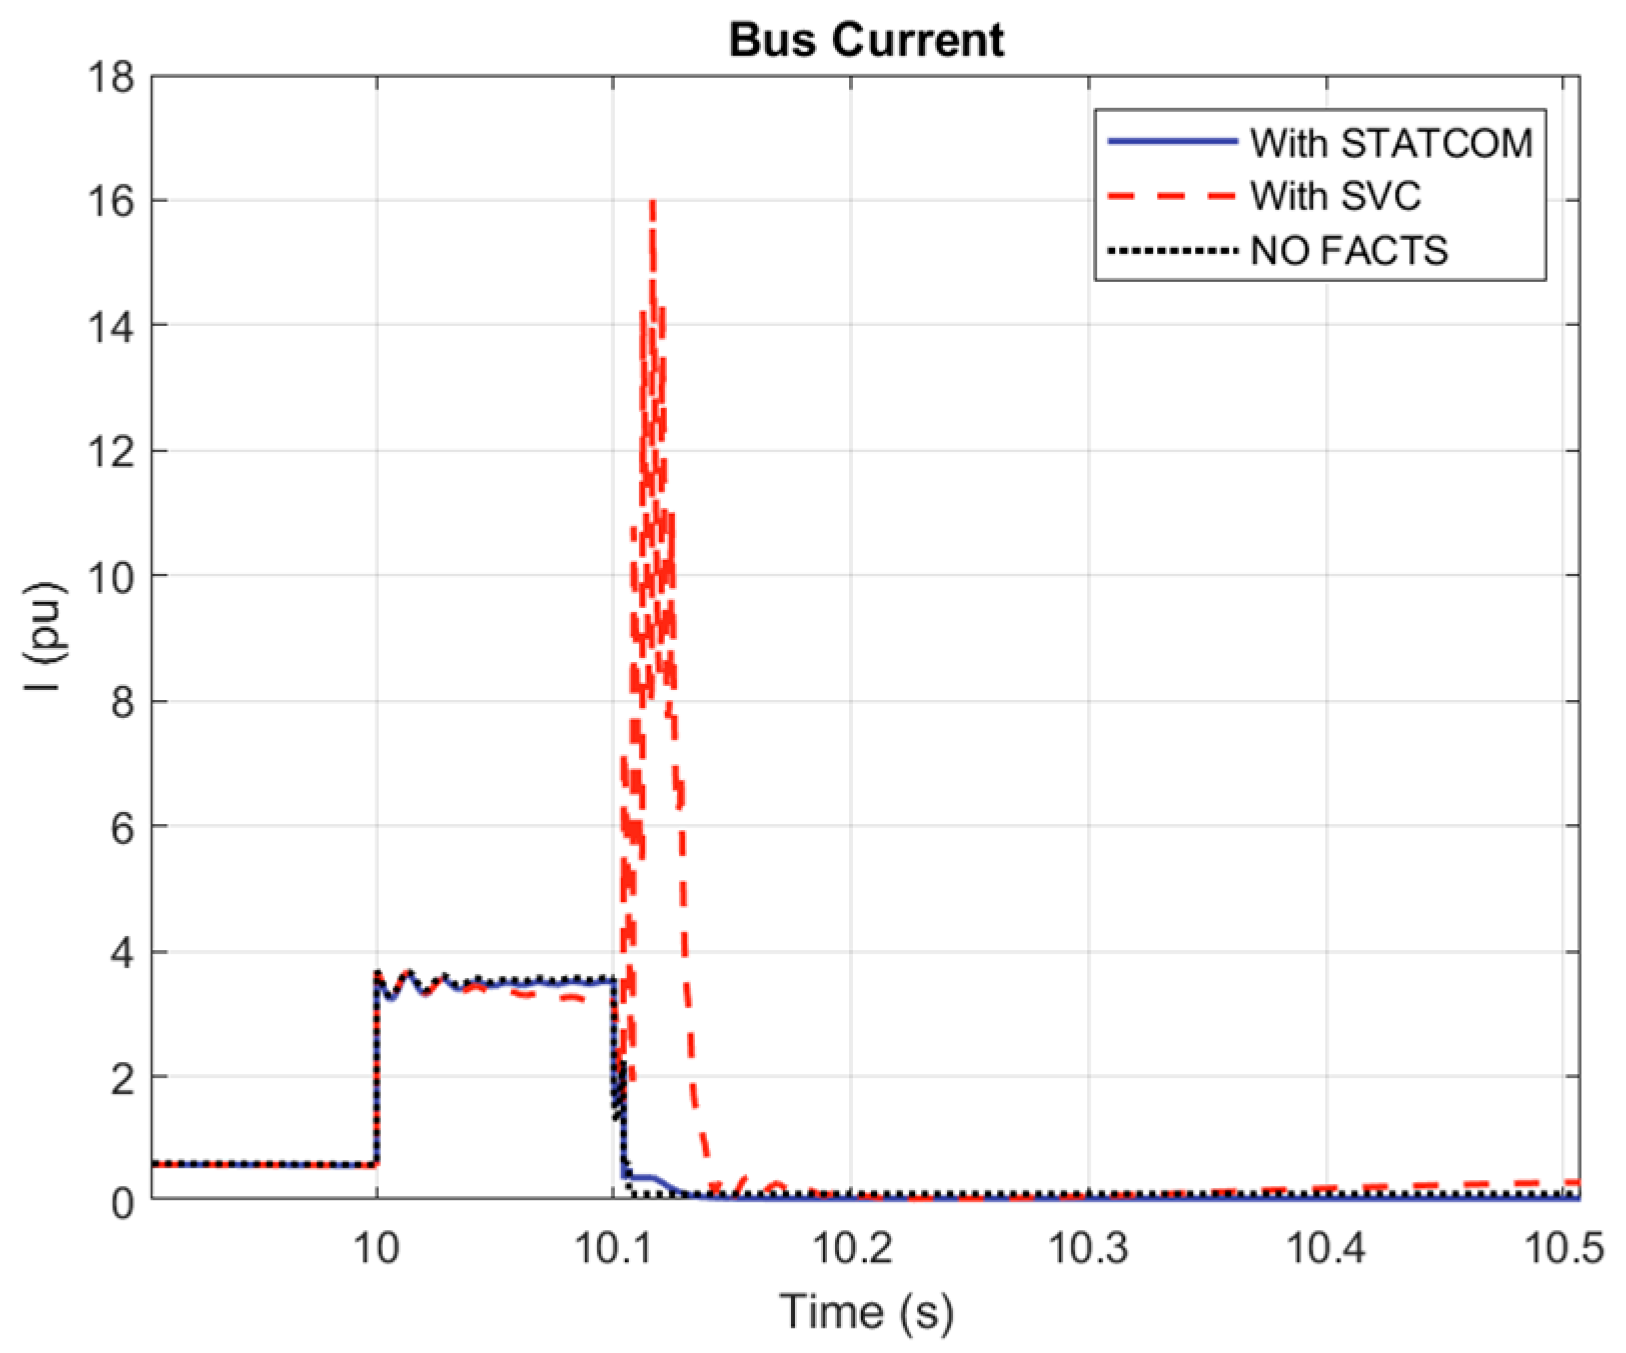
This severe scenario simulates simultaneous three-phase faults from 10 s to 10.1 s with the turbulent wind flow pattern discussed in case 2. Figure 35 demonstrates that without FACTS devices, the active power collapses completely; however, with STATCOM and SVC, the wind farm power quickly recovers to around 7.5 MW immediately after the fault clears. Figure 36 shows a significant reduction in reactive power demand from the grid—from about 2.5 MVAR (without FACTS) down to approximately 0.7 MVAR with FACTS devices. The voltage profiles during the fault (Figure 37) illustrate STATCOM’s superior performance, maintaining voltages near 0.8 p.u., showing better dynamic stability compared to SVC. Additionally, Figure 38 indicates significantly reduced current draw at PCC when FACTS devices are employed. Figure 39 and Figure 40 further confirm that both FACTS devices provide critical reactive power support and enhance voltage stability, with STATCOM consistently demonstrating superior dynamic performance. Table 2 presents an overall comparative analysis of the five situations that were examined.

5. Conclusions

This research evaluated the effectiveness of FACTS devices (STATCOM and SVC) for enhancing the performance of a grid-connected wind farm consisting of fixed-speed wind generators under various operational and fault scenarios. The simulation results demonstrated clear benefits of using these devices, showing improved voltage stability, reduced reactive power demand, and enhanced fault ride-through (FRT) capability compared to conventional fixed capacitors. Under ideal wind conditions, FACTS devices significantly reduced reactive power drawn from the grid from 1.2 MVAR to approximately 0.3 MVAR, maintaining stable grid voltage at around 1.0 p.u. Similarly, under turbulent wind conditions, reactive power demand decreased from about 1.5 MVAR (without FACTS) to below 0.5 MVAR, with rapid voltage stabilization (within 0.15 s for SVC and 0.25 s for STATCOM). During severe faults, such as the three-phase fault scenario, the active power dropped to zero without FACTS devices, while integrating STATCOM and SVC allowed the wind farm to quickly recover power delivery to around 7.5 MW, significantly improving system reliability. STATCOM particularly provided superior voltage support during faults, maintaining voltage levels around 0.8 p.u., compared to SVC, which performed at a lower level.
Overall, STATCOM exhibited superior dynamic response due to its faster IGBT-based technology, outperforming SVC in voltage regulation and fault recovery scenarios. These results highlight that integrating STATCOM significantly enhances grid reliability and compliance with stringent modern grid codes. Future studies should investigate hybrid integration with energy storage to further increase system resilience and operational efficiency.

Author Contributions

Writing—original draft preparation, K.N.P., N.A.P., J.P. and J.S.; Writing—review and editing, K.N.P., N.A.P., J.P., J.S. and M.S.; Supervision N.A.P., J.P., J.S. and M.S. All authors have read and agreed to the published version of the manuscript.

Funding

This work was supported by Dongseo University, “Dongseo Cluster Project (type 1)” Research Fund of 2025 (DSU-20250011, Advanced Aracde Game Rigional Innovation Center).

Institutional Review Board Statement

Not applicable.

Informed Consent Statement

Not applicable.

Data Availability Statement

Data are contained within the article.

Conflicts of Interest

The authors declare no conflicts of interest.

References

  1. Thapar, S. Energy and Climate Change. In Renewable Energy: Policies, Project Management and Economics: Wind and Solar Power (India); Springer Nature Singapore: Singapore, 2024; pp. 1–11. [Google Scholar] [CrossRef]
  2. IRENA. Renewable Capacity Statistics 2023; International Renewable Energy Agency: Abu Dhabi, United Arab Emirates, 2023.
  3. Shao, H.; Henriques, R.; Morais, H.; Tedeschi, E. Power quality monitoring in electric grid integrating offshore wind energy: A review. Renew. Sustain. Energy Rev. 2024, 191, 114094. [Google Scholar] [CrossRef]
  4. Malik, F.H.; Khan, M.W.; Rahman, T.U.; Ehtisham, M.; Faheem, M.; Haider, Z.M.; Lehtonen, M. A Comprehensive Review on Voltage Stability in Wind-Integrated Power Systems. Energies 2024, 17, 644. [Google Scholar] [CrossRef]
  5. Alnasir, Z.; Kazerani, M. A small-scale standalone wind energy conversion system featuring SCIG, CSI, and a novel storage integration scheme. Renew. Energy 2016, 89, 360–370. [Google Scholar] [CrossRef]
  6. Yin, H.; Zhou, F.; Gu, L.; Chen, J. Research on Grid Integration of Wind Power Generation with Power Quality Control Functions. In Proceedings of the 2021 4th International Conference on Energy, Electrical and Power Engineering (CEEPE), Chongqing, China, 23–25 April 2021. [Google Scholar] [CrossRef]
  7. Kazemi, Y.; Rezaei, M.M. A grid forming control strategy for STATCOM-assisted isolated SCIG-based wind energy conversion systems. Energy Syst. 2023, 9, 2016–2026. [Google Scholar] [CrossRef]
  8. Saxena, N.K.; Kumar, A.; Gupta, V. Enhancement of system performance using STATCOM as a dynamic compensator with squirrel cage induction generator (SCIG) based microgrid. Int. J. Emerg. Electr. Power Syst. 2021, 22, 177–189. [Google Scholar] [CrossRef]
  9. Goudarzi, N.; Zhu, W.D. A review on the development of wind turbine generators across the world. Int. J. Dyn. Control 2013, 1, 192–202. [Google Scholar] [CrossRef]
  10. Rather, Z.; Flynn, D. Impact of voltage dip induced delayed active power recovery on wind integrated power systems. Control Eng. Pract. 2017, 61, 124–133. [Google Scholar] [CrossRef]
  11. Qiao, W.; Harley, R.G.; Venayagamoorthy, G.K. Dynamic Modeling of Wind Farms with Fixed-Speed Wind Turbine Generators. In Proceedings of the 2007 IEEE Power Engineering Society General Meeting, Tampa, FL, USA, 24–28 June 2007. [Google Scholar] [CrossRef]
  12. Vegunta, S.C.; Xu, X.; Bishop, M.; Kamalinia, S. The Impact of Grid Code Requirements on Efficient Wind Generation Integration. In Proceedings of the 2020 IEEE/PES Transmission and Distribution Conference and Exposition (T&D), Chicago, IL, USA, 12–15 October 2020. [Google Scholar] [CrossRef]
  13. Elyaalaoui, K.; Ouassaid, M.; Cherkaoui, M. Reactive capability limits for wind turbine based on SCIG for optimal integration into the grid. In Renewable Energy Systems; Academic Press: Cambridge, MA, USA, 2021; pp. 567–587. [Google Scholar] [CrossRef]
  14. Tingyi, H.; Shengnan, L.; Shuijun, W.; Zhen, P.; Ran, O.; Zixuan, Z. Adaptability of Wind Power Integration and Comparison Study on Grid Code Technical Requirements. In Proceedings of the 2018 China International Conference on Electricity Distribution (CICED), Tianjin, China, 17–19 September 2018. [Google Scholar] [CrossRef]
  15. Hussen, M.; Rajaram, T. A Comprehensive Review of Voltage Source Converters-Based FACTS Controllers in Hybrid Microgrids. IEEE Access 2025, 13, 62961–62999. [Google Scholar] [CrossRef]
  16. Patel, N.A.; Patel, K.N. SSR Mitigation in Power System by LQR Control of nearby DFIG. In Proceedings of the 15th International Conference on Advances in Computing, Control, and Telecommunication Technologies, ACT 2024, Hyderabad, India, 21–22 June 2024; GRENZE Scientific Society: Thiruvananthapuram, India, 2024; Volume 1, pp. 70–79. [Google Scholar]
  17. Patel, N.; Patel, K.; Keya, P. Analysis and Mitigation of SSR in a Doubly Fed Induction Generator (DFIG) Based Wind Farm by Employing a STATCOM Controller. J. Electr. Syst. JES 2024, 20, 2379–2384. [Google Scholar] [CrossRef]
  18. Esterhuizen, R.; Giraneza, M.; Abo-Al-Ez, K. An Approach to Voltage Quality Enhancement in Wind Energy Conversion Systems. In Proceedings of the 2022 International Conference on Electrical, Computer and Energy Technologies (ICECET), Prague, Czech Republic, 20–22 July 2022. [Google Scholar] [CrossRef]
  19. Qi, J.; Zhao, W.; Bian, X. Comparative Study of SVC and STATCOM Reactive Power Compensation for Prosumer Microgrids With DFIG-Based Wind Farm Integration. IEEE Access 2020, 8, 209878–209885. [Google Scholar] [CrossRef]
  20. Upadhyai, R.P.; Garg, L. An Integration of the SVC and STATCOM Technologies into Wind-Based Power Systems. In Proceedings of the 2022 International Conference on Futuristic Technologies (INCOFT), Belgaum, India, 24–26 November 2022. [Google Scholar] [CrossRef]
  21. Belhamidi, M.; Lakdja, F.; Boumediene, L.; Guentri, H. Analysis of D-SVC and D-STATCOM in Microgrids with Wind Farm Integration. In Proceedings of the 2022 IEEE International Conference on Electrical Sciences and Technologies in Maghreb (CISTEM), Tunis, Tunisia, 26–28 October 2022. [Google Scholar] [CrossRef]
  22. Cherkaoui, N.; Haidi, T.; Belfqih, A.; El Mariami, F.; Boukherouaa, J. A comparison study of reactive power control strategies in wind farms with SVC and STATCOM. Int. J. Electr. Comput. Eng. 2018, 8, 4836. [Google Scholar] [CrossRef]
  23. Faraji, H.; Beigvand, N.Y.; Hemmati, R. Multi-objective and resilient control on hybrid wind farms under healthy/faulty and off-grid/grid-tied states. Electr. Power Syst. Res. 2023, 215, 109004. [Google Scholar] [CrossRef]
  24. Karaagac, U.; Kocar, I.; Mahseredjian, J.; Cai, L.; Javid, Z. STATCOM integration into a DFIG-based wind park for reactive power compensation and its impact on wind park high voltage ride-through capability. Electr. Power Syst. Res. 2021, 199, 107368. [Google Scholar] [CrossRef]
  25. Heier, S. Grid Integration of Wind Energy Conversion Systems; John Wiley & Sons Ltd.: Chichester, UK, 1998; ISBN 0-471-97143-X. [Google Scholar]
  26. Hingorani, N.G.; Gyugyi, L. Understanding FACTS; Concepts and Technology of Flexible AC Transmission Systems; IEEE® Press: Piscataway, NJ, USA, 2000. [Google Scholar]
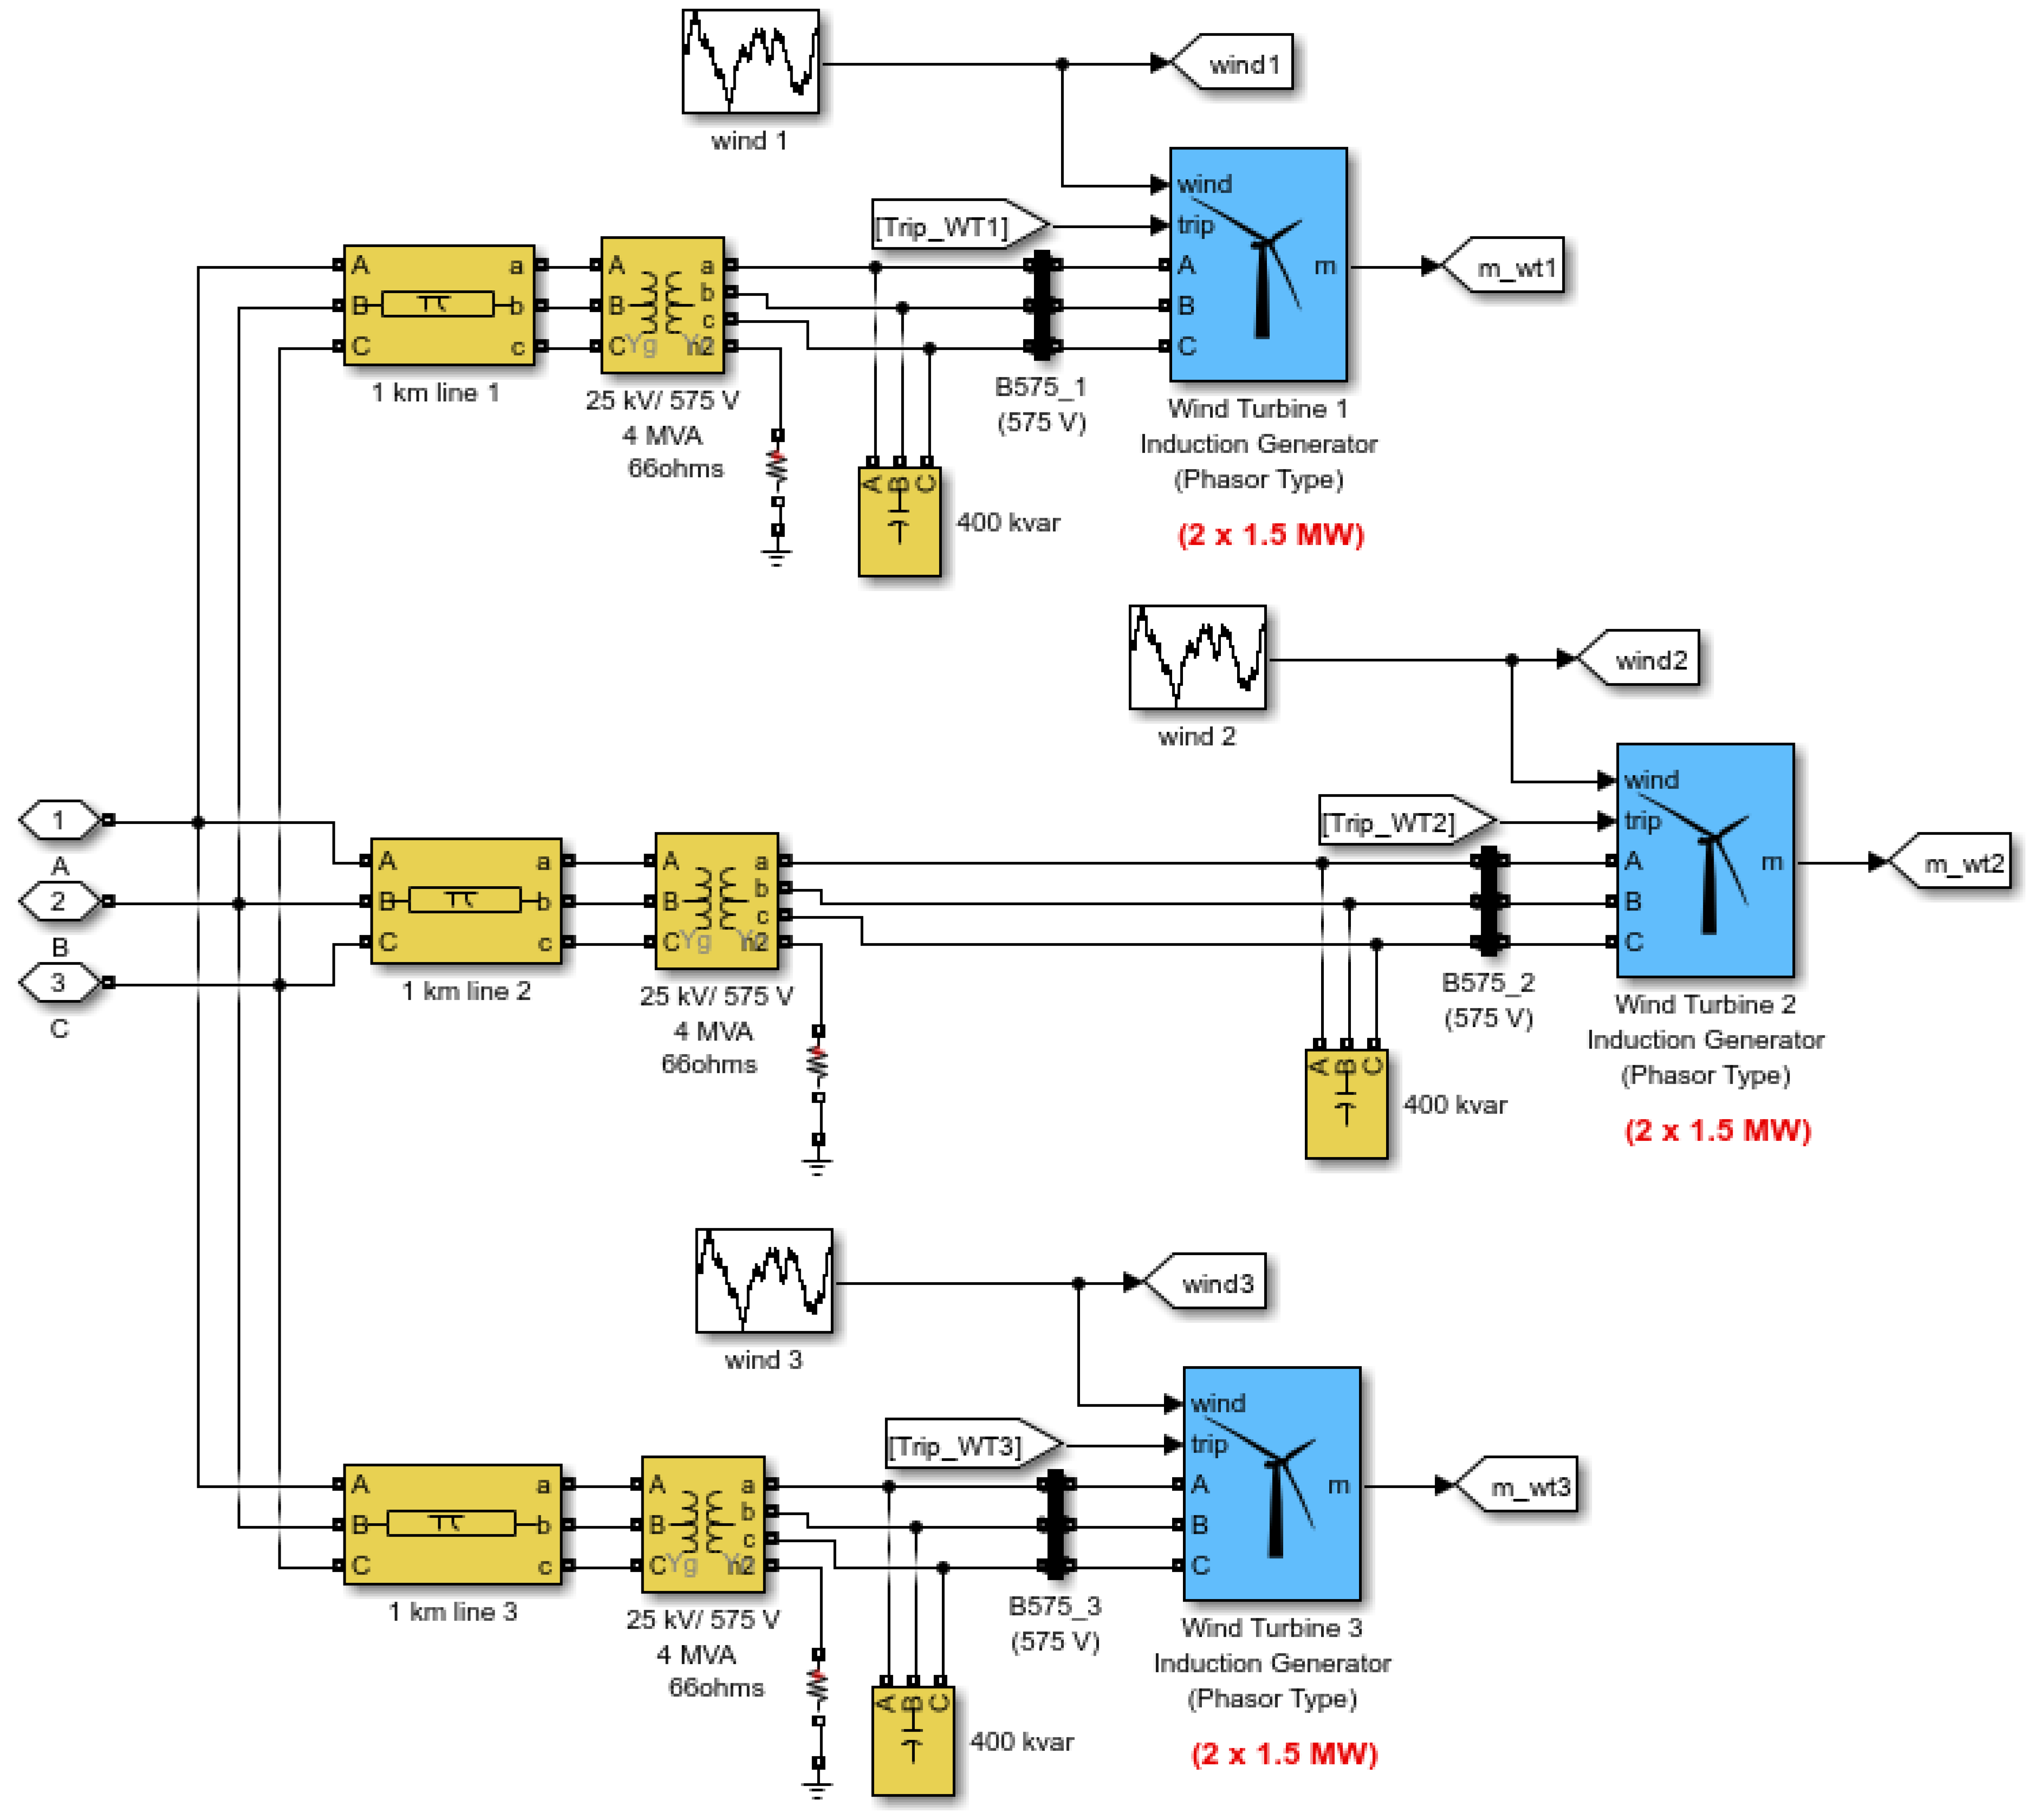
Figure 1. Wind farm Subsystem.
Machines 13 00805 g001
Figure 2. Wind farm connection to the Grid.
Machines 13 00805 g002
Figure 3. Wind turbine model.
Machines 13 00805 g003
Figure 4. Representation of a wind turbine.
Machines 13 00805 g004
Figure 5. Pitch angle controller.
Machines 13 00805 g005
Figure 6. Turbine output at various speeds.
Machines 13 00805 g006
Figure 7. STATCOM Block Diagram.
Machines 13 00805 g007
Figure 8. SVC Block Diagram.
Machines 13 00805 g008
Figure 9. Ideal Wind Speed.
Machines 13 00805 g009
Figure 10. Active Power Flow at PCC.
Machines 13 00805 g010
Figure 11. Reactive Power Flow at PCC.
Machines 13 00805 g011
Figure 12. Voltage profile at PCC.
Machines 13 00805 g012
Figure 13. Current flow at PCC.
Machines 13 00805 g013
Figure 14. Reactive power of FACTS.
Machines 13 00805 g014
Figure 15. Voltage profile of FACTS.
Machines 13 00805 g015
Figure 16. Turbulent Wind Speed.
Machines 13 00805 g016
Figure 17. Active Power flow at PCC.
Machines 13 00805 g017
Figure 18. Reactive power flow at PCC.
Machines 13 00805 g018
Figure 19. Voltage profile at PCC.
Machines 13 00805 g019
Figure 20. Current flow at PCC.
Machines 13 00805 g020
Figure 21. Reactive power of FACTS.
Machines 13 00805 g021
Figure 22. Voltage profile of FACTS.
Machines 13 00805 g022
Figure 23. Active Power flow at PCC.
Machines 13 00805 g023
Figure 24. Reactive power flow at PCC.
Machines 13 00805 g024
Figure 25. Voltage profile at PCC.
Machines 13 00805 g025
Figure 26. Current flow at PCC.
Machines 13 00805 g026
Figure 27. Reactive power of FACTS.
Machines 13 00805 g027
Figure 28. Voltage profile of FACTS.
Machines 13 00805 g028
Figure 29. Active Power flow at PCC.
Machines 13 00805 g029
Figure 30. Reactive power flow at PCC.
Machines 13 00805 g030
Figure 31. Voltage profile at PCC.
Machines 13 00805 g031
Figure 32. Current flow at PCC.
Machines 13 00805 g032
Figure 33. Reactive power of FACTS.
Machines 13 00805 g033
Figure 34. Voltage profile of FACTS.
Machines 13 00805 g034
Figure 35. Active Power flow at PCC.
Machines 13 00805 g035
Figure 36. Reactive Power flow at PCC.
Machines 13 00805 g036
Figure 37. Voltage profile at PCC.
Machines 13 00805 g037
Figure 38. Current flow at PCC.
Machines 13 00805 g038
Figure 39. Reactive power of FACTS.
Machines 13 00805 g039
Figure 40. Voltage profile of FACTS.
Machines 13 00805 g040
Table 1. Summary of Review.
ReferencesSystem UsedMethodologyLimitationsOutcomes of Study
[16]IEEE FBM test system with additional DFIGLinear Quadratic Regulator (LQR) applied to DFIG rotor converter for SSR dampingHigh complexity; scalability for large farms uncertainLQR–DFIG control damped multimodal SSR oscillations effectively
[17]DFIG-based wind farmEmployed STATCOM controller for subsynchronous resonance (SSR) mitigationFocused only on SSR, not overall voltage/reactive power issuesSTATCOM effectively damped SSR oscillations and improved stability
[18]Wind Energy Conversion System (WECS) with SVC & STATCOMMATLAB/Simulink study on IEC 61400-21 grid codes and voltage quality issuesDid not cover economic feasibility; only short-term simulation resultsSTATCOM showed slightly faster transient response and higher reactive power support than SVC
[19]Prosumer microgrid with DFIG wind farmProposed coordinated STATCOM–DFIG control; compared SVC vs. STATCOM at PCC under faultsCoordination tested only in simulation; no real-time controller implementationSTATCOM required lower capacity than SVC for same performance; coordination reduced investment costs
[20]Wind farm with DFIG connected to gridSimulation of 10 MVAr SVC & STATCOM devices in MATLAB/Simulink under static & dynamic loadLimited to DFIG-based systems; economic cost analysis not consideredSTATCOM outperformed SVC in improving transient stability and damping oscillations
[21]Microgrid with wind integrationStudied voltage stability using Distributed FACTS (D-SVC and D-STATCOM) via MATLAB/SimulinkConsidered only distribution-level simulation; not tested under large-scale wind penetrationD-STATCOM showed superior performance in stabilizing microgrid voltage compared to D-SVC
[22]Wind farms with SVC and STATCOMMATLAB/Simulink simulation to compare voltage stability and reactive power compensationLimited to simulation results; real-time hardware implementation not consideredSTATCOM provided faster voltage support and stability enhancement compared to SVC
Proposed workGrid-connected SCIG with Fixed Capacitor, SVC, and STATCOMMATLAB/Simulink study under ideal & turbulent wind profiles; symmetrical & unsymmetrical faults; compared Fixed Capacitor, SVC, STATCOMEarlier works lacked SCIG focus, real-world turbulent wind & multiple fault cases, and broader benchmark devicesDemonstrated STATCOM superiority in FRT and voltage stability; highlighted limits of fixed capacitor; provided holistic benchmark across devices
Table 2. Comparison of the simulated cases.
Studied CasesVoltage Profile at PCCReactive Power Supply from the GridFRT Capability Achieved
Ideal Wind SpeedNo FACTSWorstHigh-
STATCOMClose to BestSimilar to SVC-
SVCBestLow-
Turbulent Wind SpeedNo FACTSWorstHigh-
STATCOMClose to BestSimilar to SVC-
SVCBestLow-
Single Phase Fault at PCCNo FACTSWorstHighYes
STATCOMBestSimilar to SVCYes
SVCVery goodLowYes
Two Phase Fault at PCCNo FACTSShutdownShutdownNo
STATCOMBestSimilar to SVCYes
SVCVery goodLowYes
Three Phase Fault at any two branches of WFNo FACTSShutdownShutdownNo
STATCOMShutdownShutdownNo
SVCVery goodLowYes
Disclaimer/Publisher’s Note: The statements, opinions and data contained in all publications are solely those of the individual author(s) and contributor(s) and not of MDPI and/or the editor(s). MDPI and/or the editor(s) disclaim responsibility for any injury to people or property resulting from any ideas, methods, instructions or products referred to in the content.