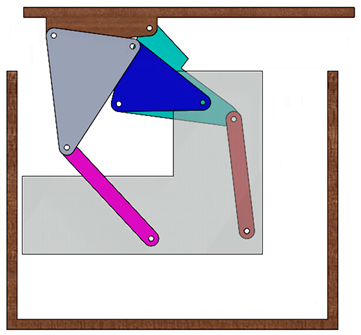
1. Introduction
Linkage mechanisms are often underappreciated, but they are one of the key drivers of motion in the world. Examples are found in everything from engines to cranes, as well as in hinges, exercise equipment, and surgical tools. Their modern ubiquity owes largely to the long history of study of kinematic synthesis, with some of the foundational work dating back to the mid-19th century, though no generalized analytical solution procedure was developed at this time [
1,
2]. In the mid-20th century, researchers like Freudenstein and Sandor resumed the work and identified many of the key principles of modern kinematic synthesis methods [
3,
4,
5,
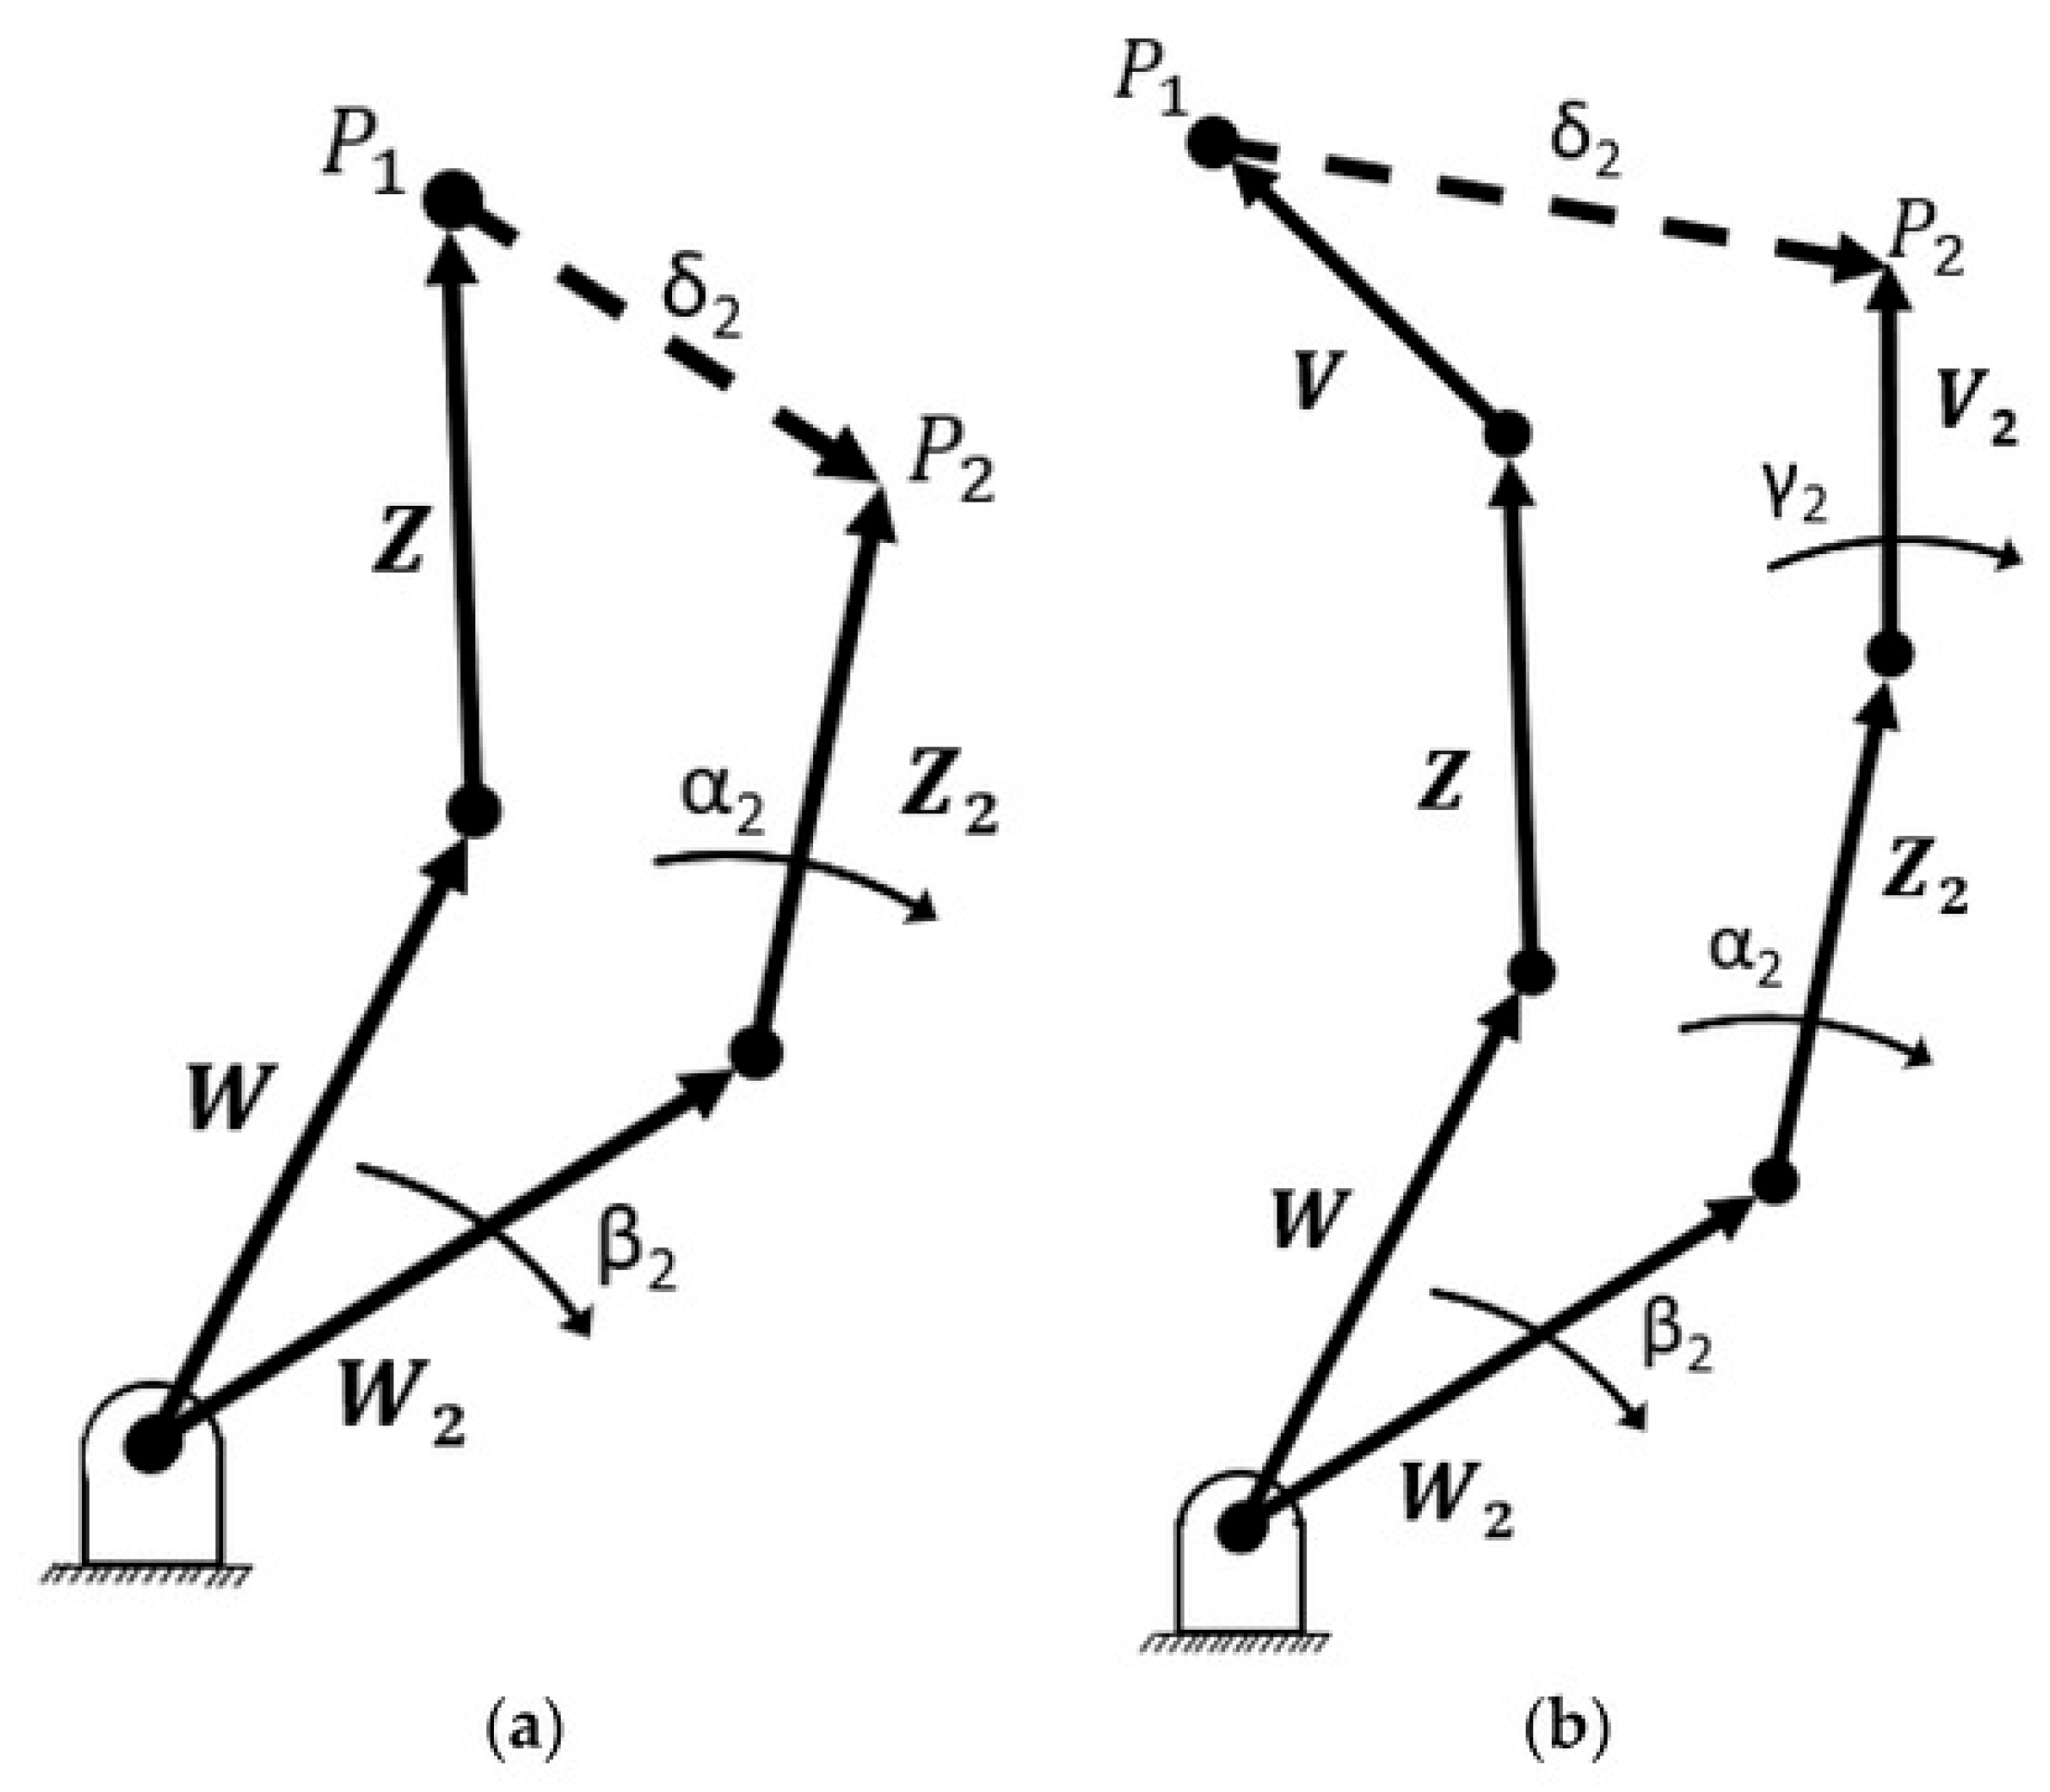
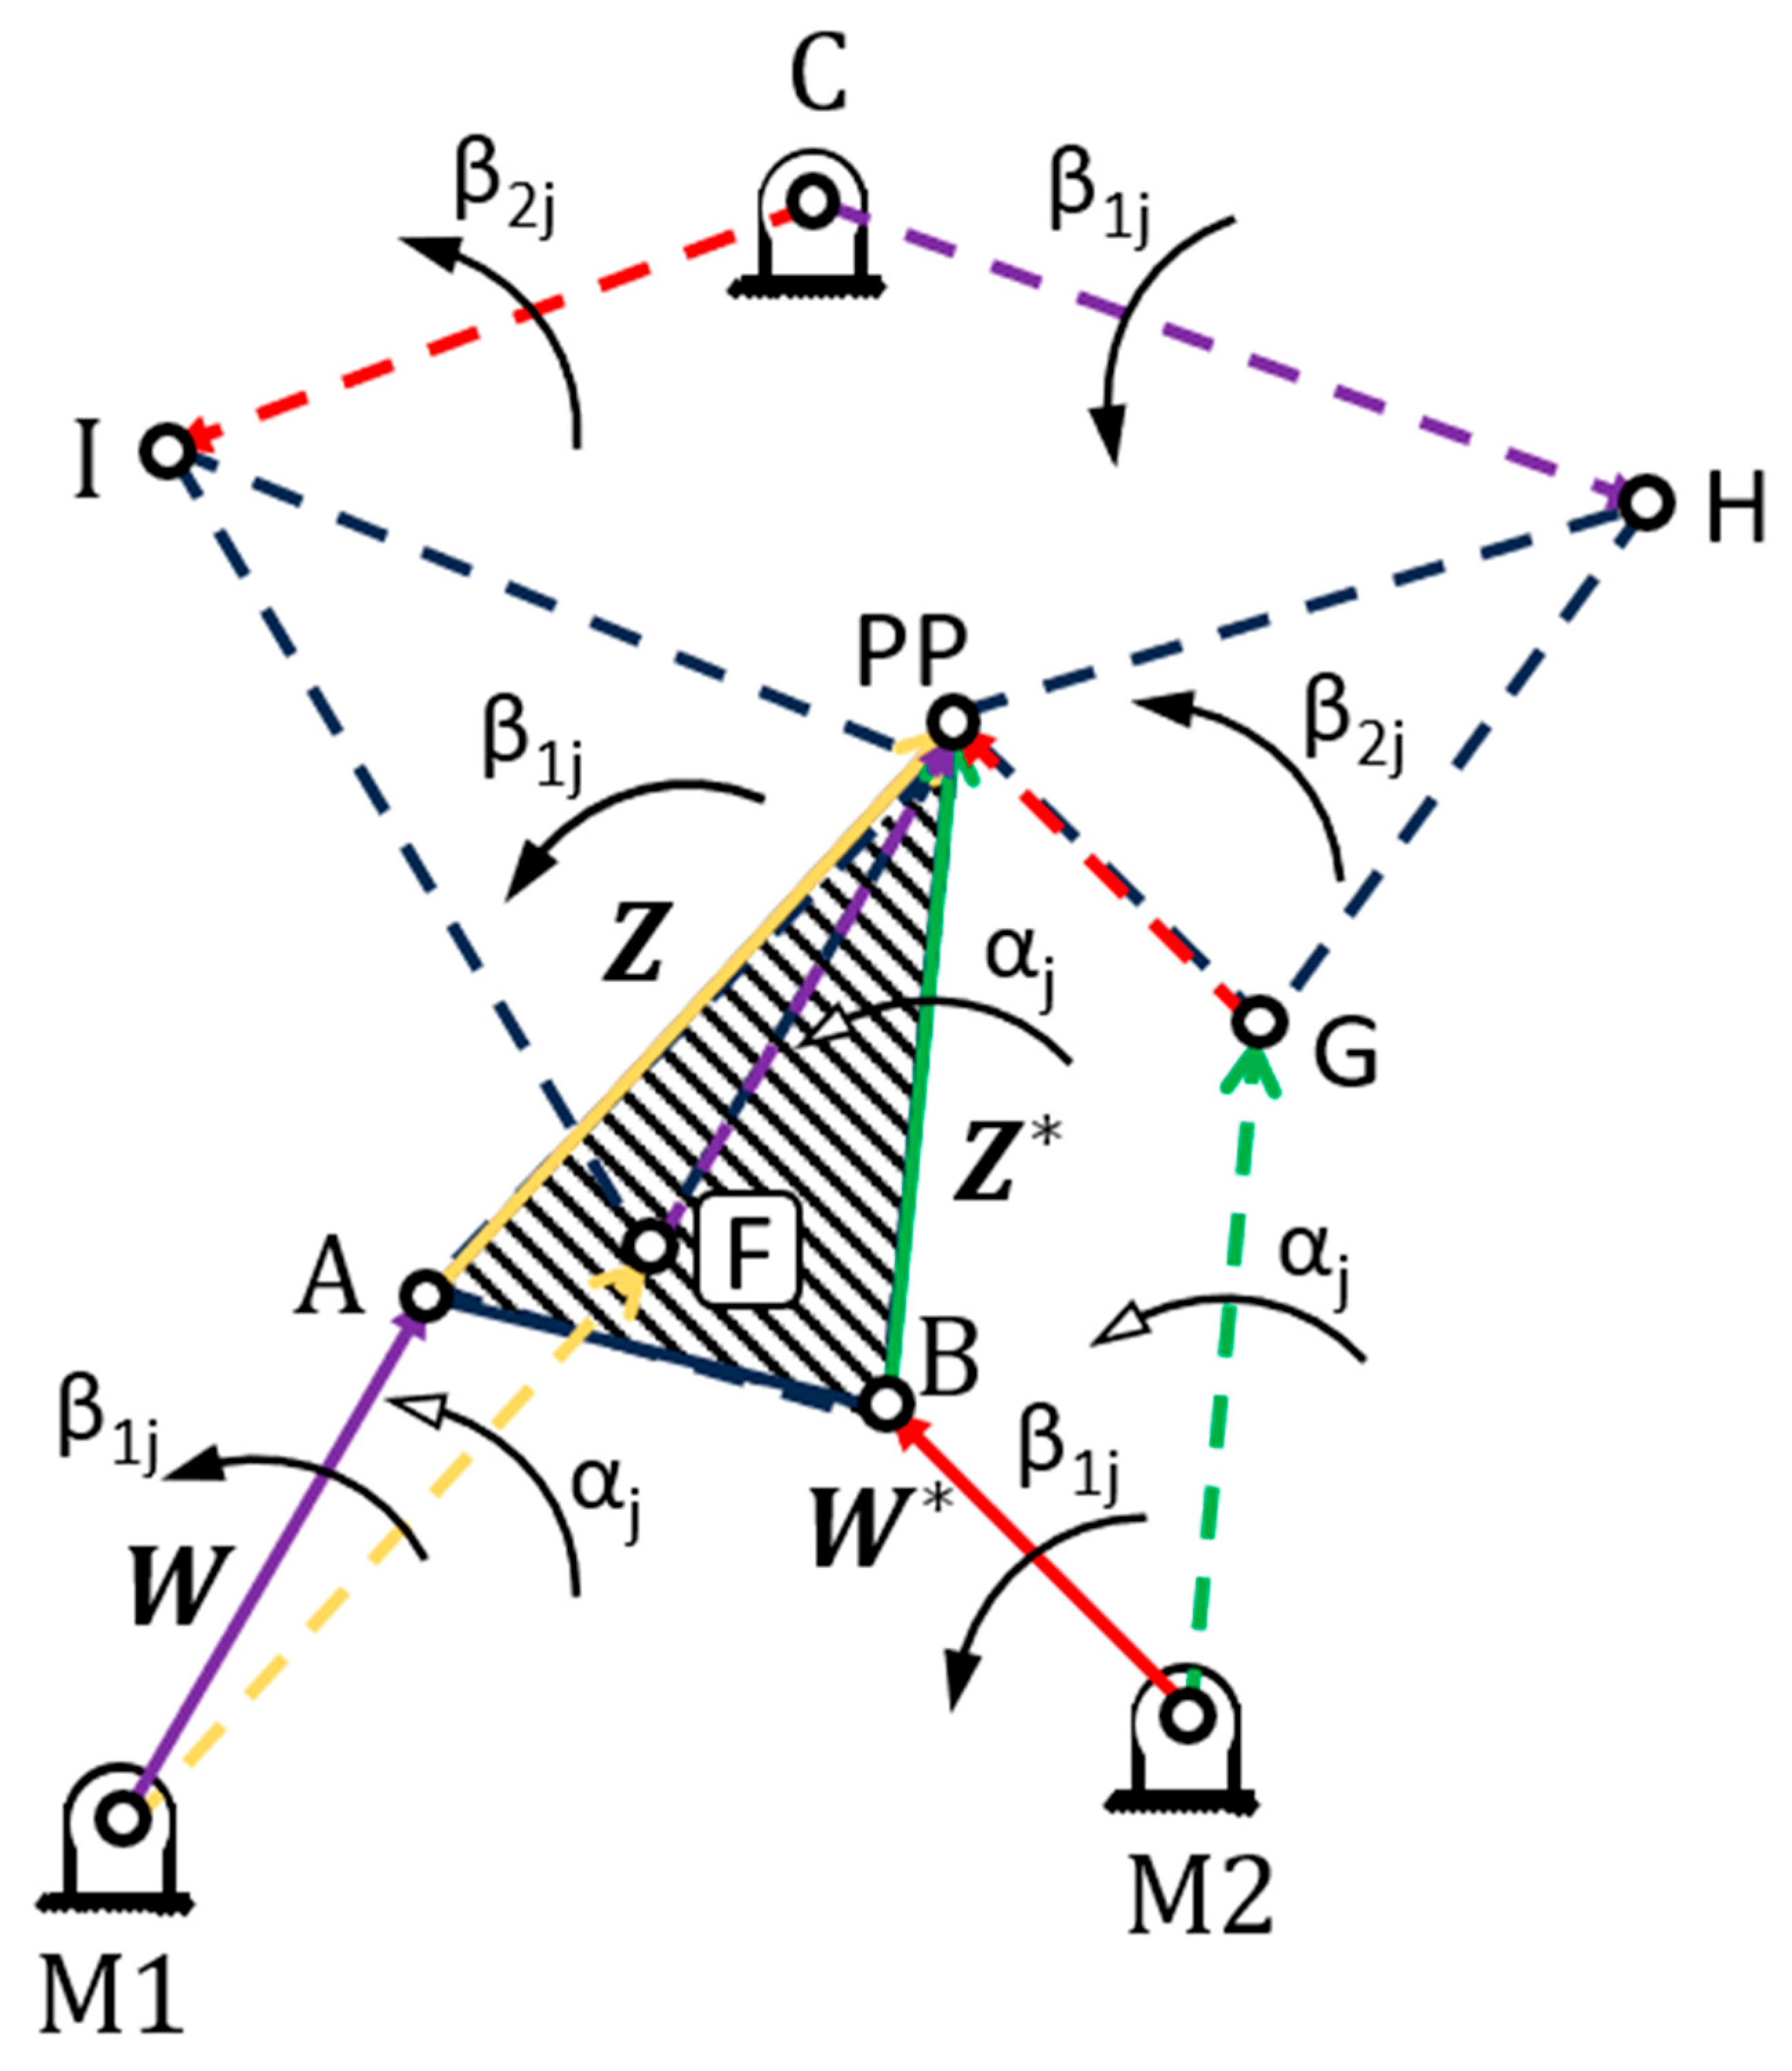
6]. During these early years, a technique emerged that is still in use today, involving the division of a mechanism’s topology into dependent kinematic chains. These chains are commonly known as dyads, triads, etc., according to their number of links. An example is shown in
Figure A1.
Many authors have furthered this method of dividing a topology into vector loops. It is the principal method demonstrated in Sandor and Erdman’s Advanced Mechanism Design texts [
7,
8]. Commonly, these kinematic chains are set to accomplish a path, motion, or function generation task. Of these, the motion generation task is the most restrictive, requiring that a point on the mechanism pass through a series of positions and that a link on the mechanism rotate through a corresponding set of angles. Each pair of a positional and angular displacement (
δ, α) is referred to as a prescribed position. Researchers like Chase, Riley, and Erdman, or Lin, showed the method could be applied to triad chains [
9,
10]. Others found how many positions could be prescribed while preserving an exact solution to the problem [
11,
12]. For dyads, a designer can specify anywhere between two and five of these prescribed positions and still identify an exact solution. Diab used dyads to synthesize four-bar motion generators that also included prescribed velocities or accelerations [
13]. Similar vector-based methods that do not use complex numbers have also found success, like those demonstrated by Midha and Zhao [
14].
Traditionally, the designer specifies their set of prescribed positions, then manipulates free-choice variables to find an exact solution to the problem. While generally effective, the requirement that the solution exactly reach each prescribed position is often unnecessarily restrictive, limiting the solution space. Consider, for example, a pick-and-place operation. The linkage will drop down to an exact position to pick up a part, then translate over to a final exact drop-off position to release the part. The first and last positions need to be precise, but oftentimes, what the mechanism does in between these positions matters very little. Perhaps the mechanism needs to remain relatively close to a vertical orientation to avoid spilling any contents, and it may need to approach the final position from above to avoid striking an obstacle on the ground. Even with these interstitial requirements, though, the exact intermediate position often remains unnecessary; a designer may benefit the most from the ability to specify an approximate region as a prescribed position, allowing some extra space to mitigate the consequences of their uncertainty on the solution space. This realization gave rise to the optimal approximate and mixed exact-approximate prescribed position synthesis approaches [
15,
16,
17,
18,
19,
20]. Other authors have also expanded this idea to include optimization techniques [
21,
22]. In this framework, the designer specifies some (or sometimes, zero) exact positions, then adds a finite number of approximate positions. Replacing exact prescribed positions with approximate ones expands the solution space and increases the probability of finding a solution with favorable properties like high mechanical advantage or transmission angles, but also makes the problem more complex. Liu et. al. combined exact positions with approximate ones, and used a numerical atlas technique to obtain an initial estimate for link dimensions, in theory simplifying the overall calculation [
23].
Other researchers have gone beyond mixing exact and approximate synthesis to pursue optimal approximate numerical methods, a trend that has increased correspondingly as computer capabilities have improved. Genetic algorithms, which find optimal solutions by emulating the ideas of natural selection, are one of the most common approaches within numerical methods [
24,
25,
26,
27,
28,
29]. Other approaches have included least squares or homotopy [
30,
31,
32,
33], neural networks [
34,
35], state-space models [
36], and multiobjective synthesis [
37,
38]. Kim et. al., for example, applied machine learning to the synthesis of four-bar function generators in exact or approximate prescribed positions. Their approach uses a mixture of experts’ frameworks to identify optimal solutions across many four-bar variants (crank-rocker, rocker-rocker, etc.) [
39]. Zhang et. al. used genetic algorithms to generate 1-DOF six-bar mechanisms capable of replicating multiple target curves through an adjustable input parameter [
40].
One computational approach that still finds exact solutions is commonly known as a ‘grid search,’ or sometimes a global search. While no computer can search through the infinite number of possible combinations of the free-choice variables, a script could feasibly search through a few million or even billions of possible combinations given enough time. This type of wide-ranging search increases the chances of finding a good solution, but is also computationally expensive and time-consuming, as an uninformed search must sift through huge quantities of bad options on the way to the final solution. The proposed technique in this manuscript will be compared against this blind grid-search approach as a benchmark for its effectiveness.
Much of the work in the exact synthesis analytical area has been building on the framework of loop-based kinematic synthesis, developing new methods that make more complex problems possible to solve or new tools for designers to visualize problems. For example, Lin and others’ work on the compatibility linkage, a method for solving nonlinear systems of equations arising in kinematics [
10,
41,
42,
43]. Others have applied Freudenstein’s method for analytical synthesis to geared linkages [
44,
45]. A visualization tool based on loop-based synthesis was uncovered by Loerch, called the MK Circles [
46,
47]. Loerch discovered that if one of the free-choice variables is held constant while the other is iterated from 0° to 360° (commonly β
2 and β
3), the solutions for both the ground and moving pivots settle into circles as shown in
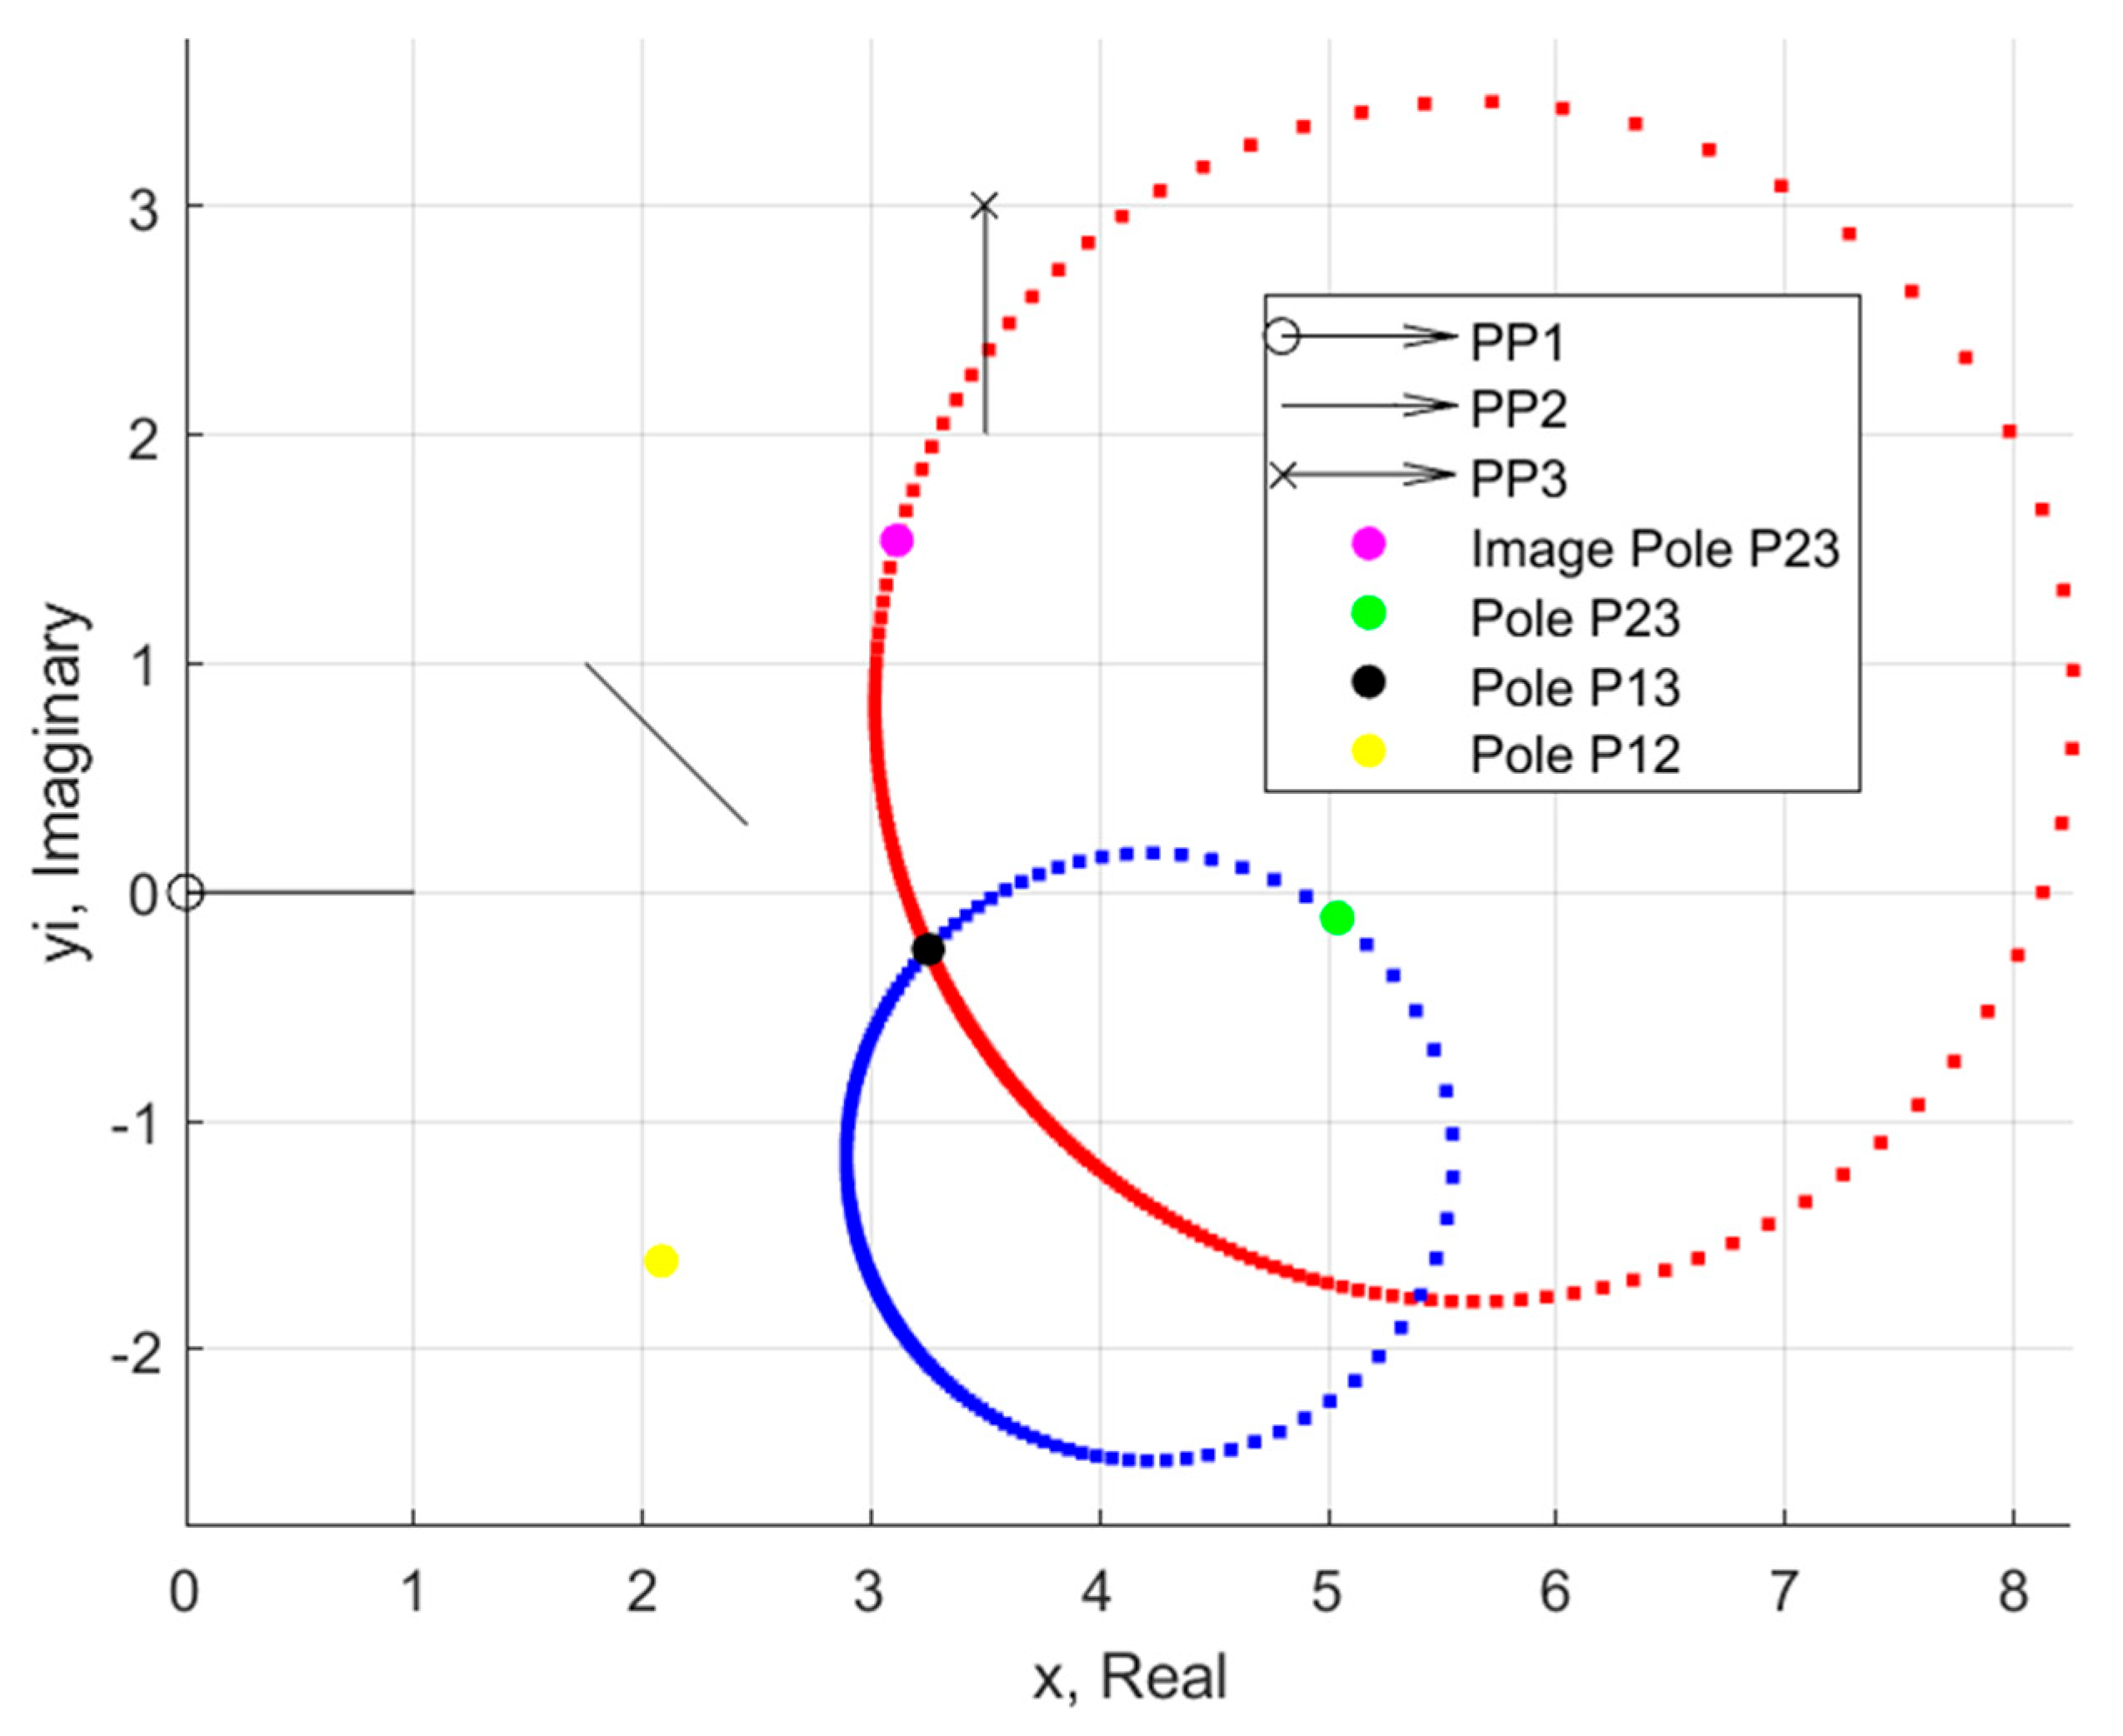
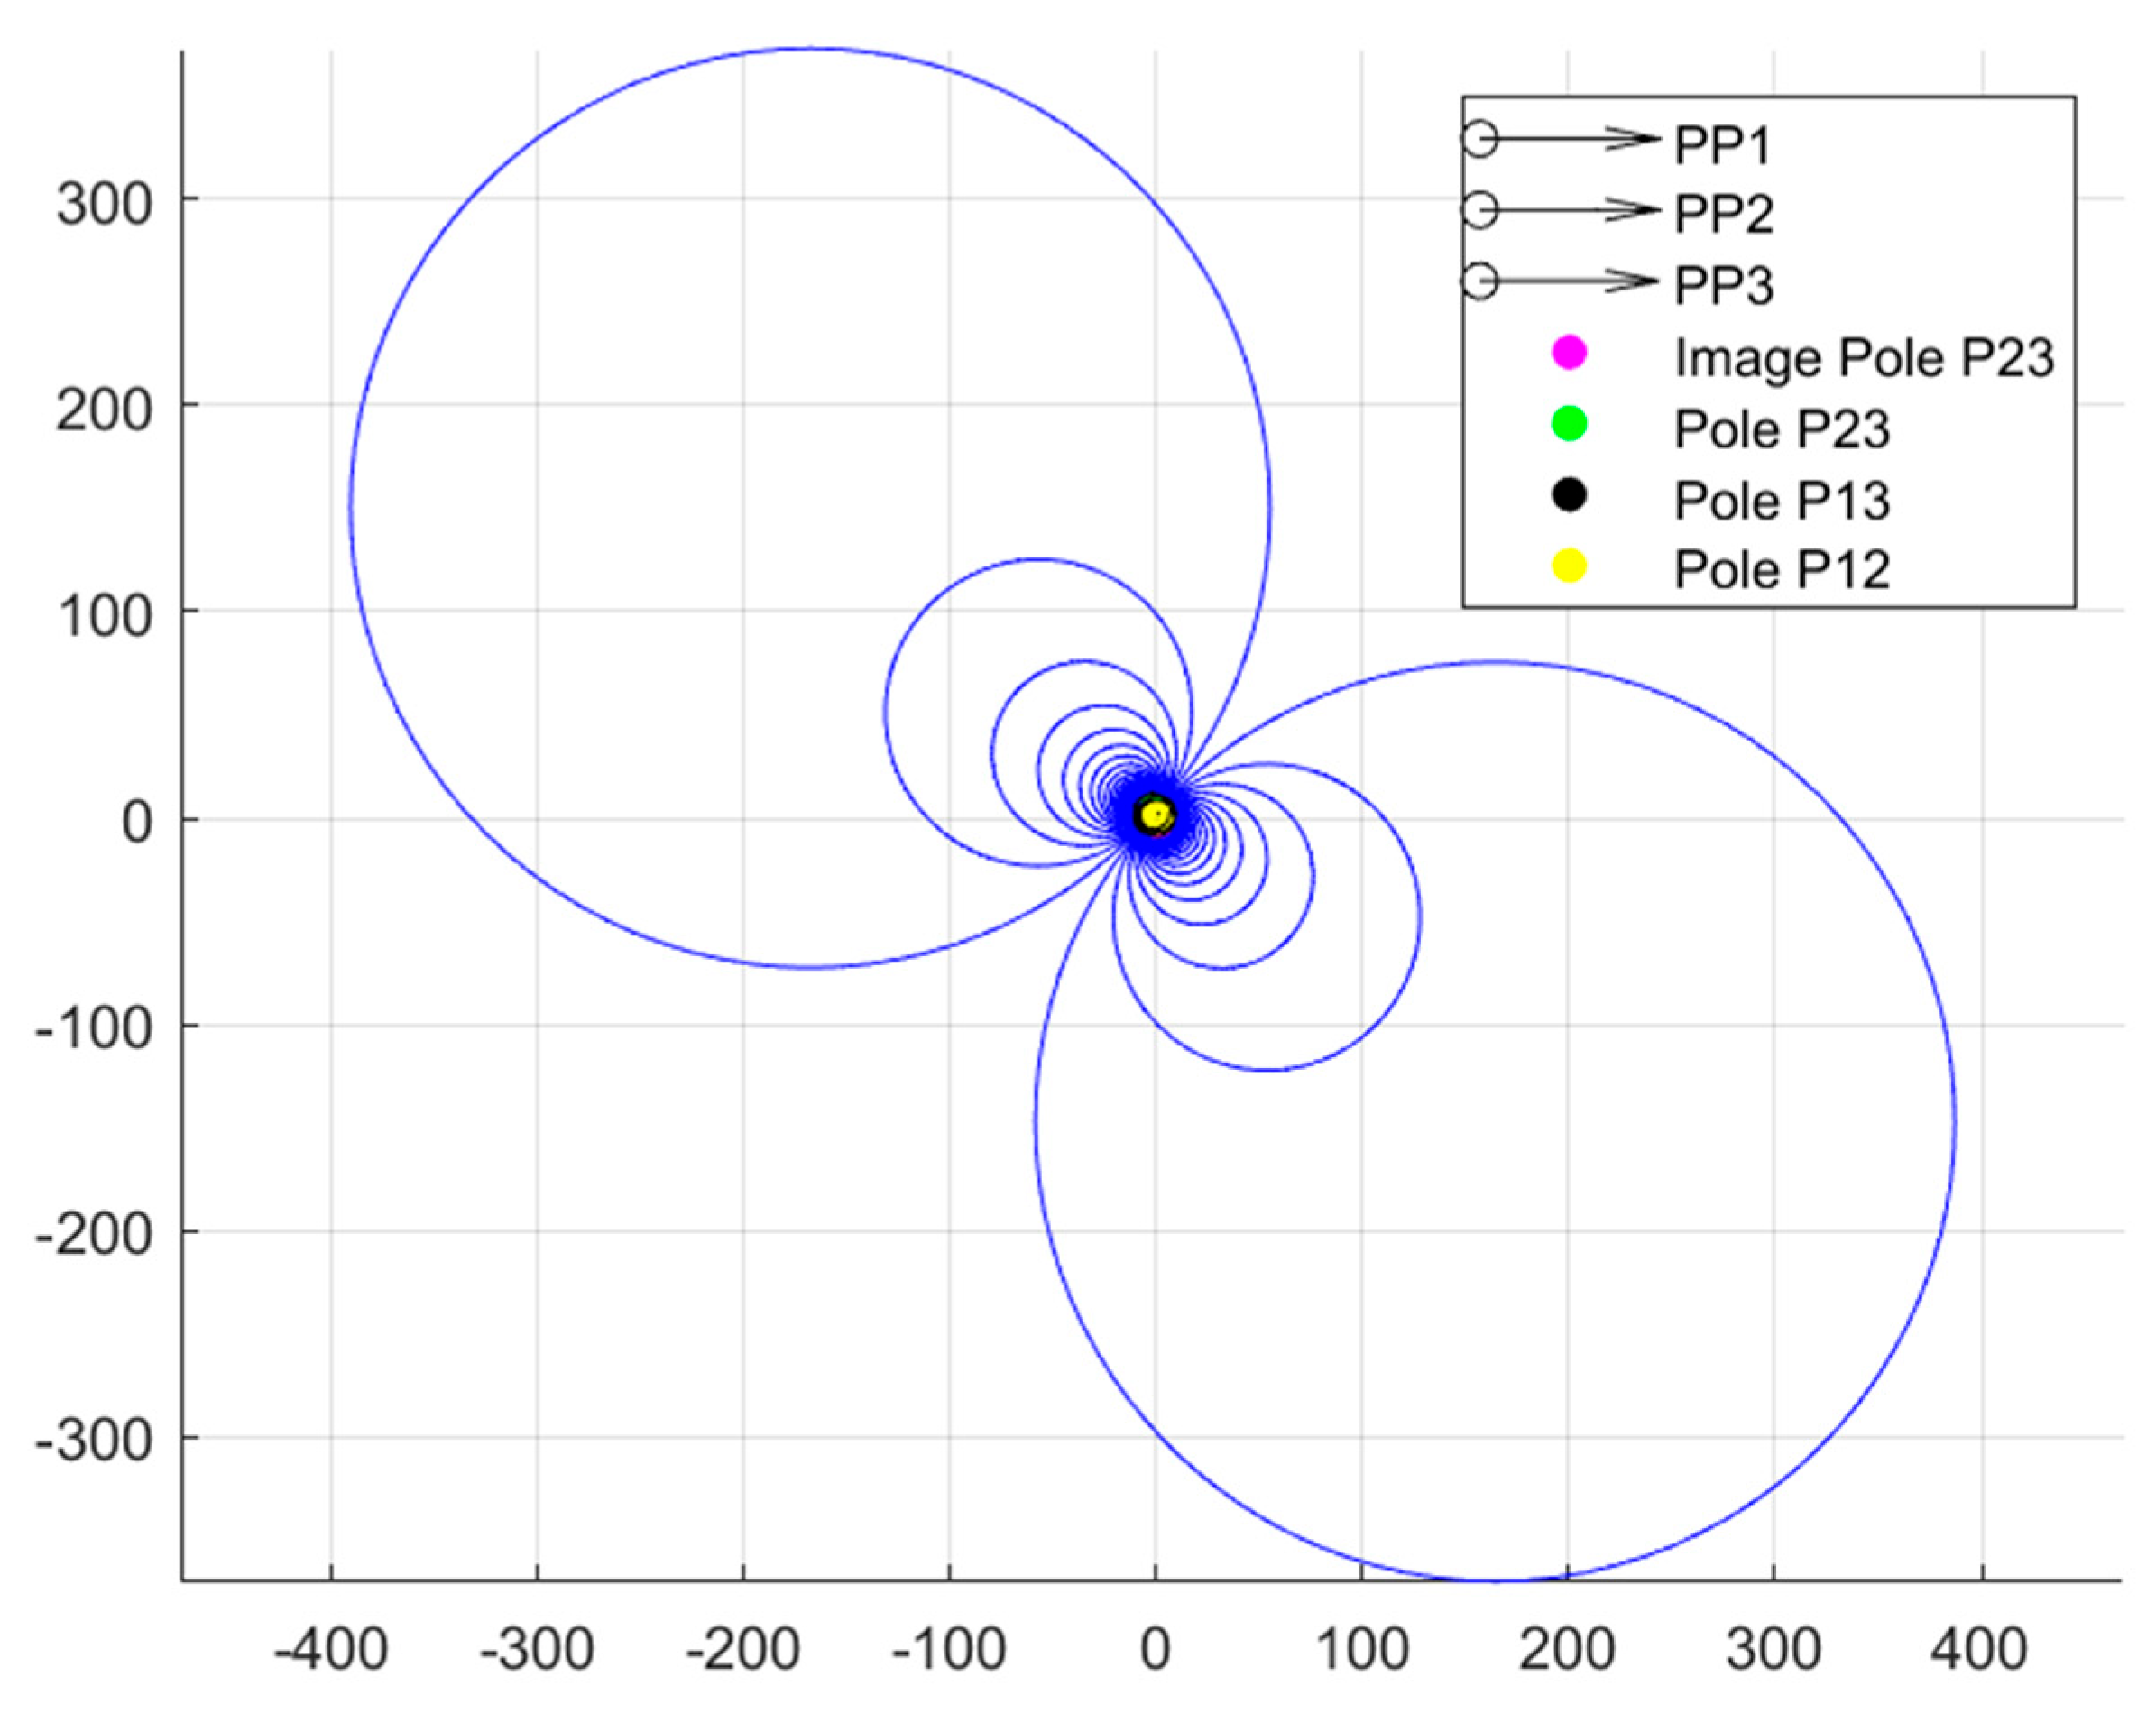
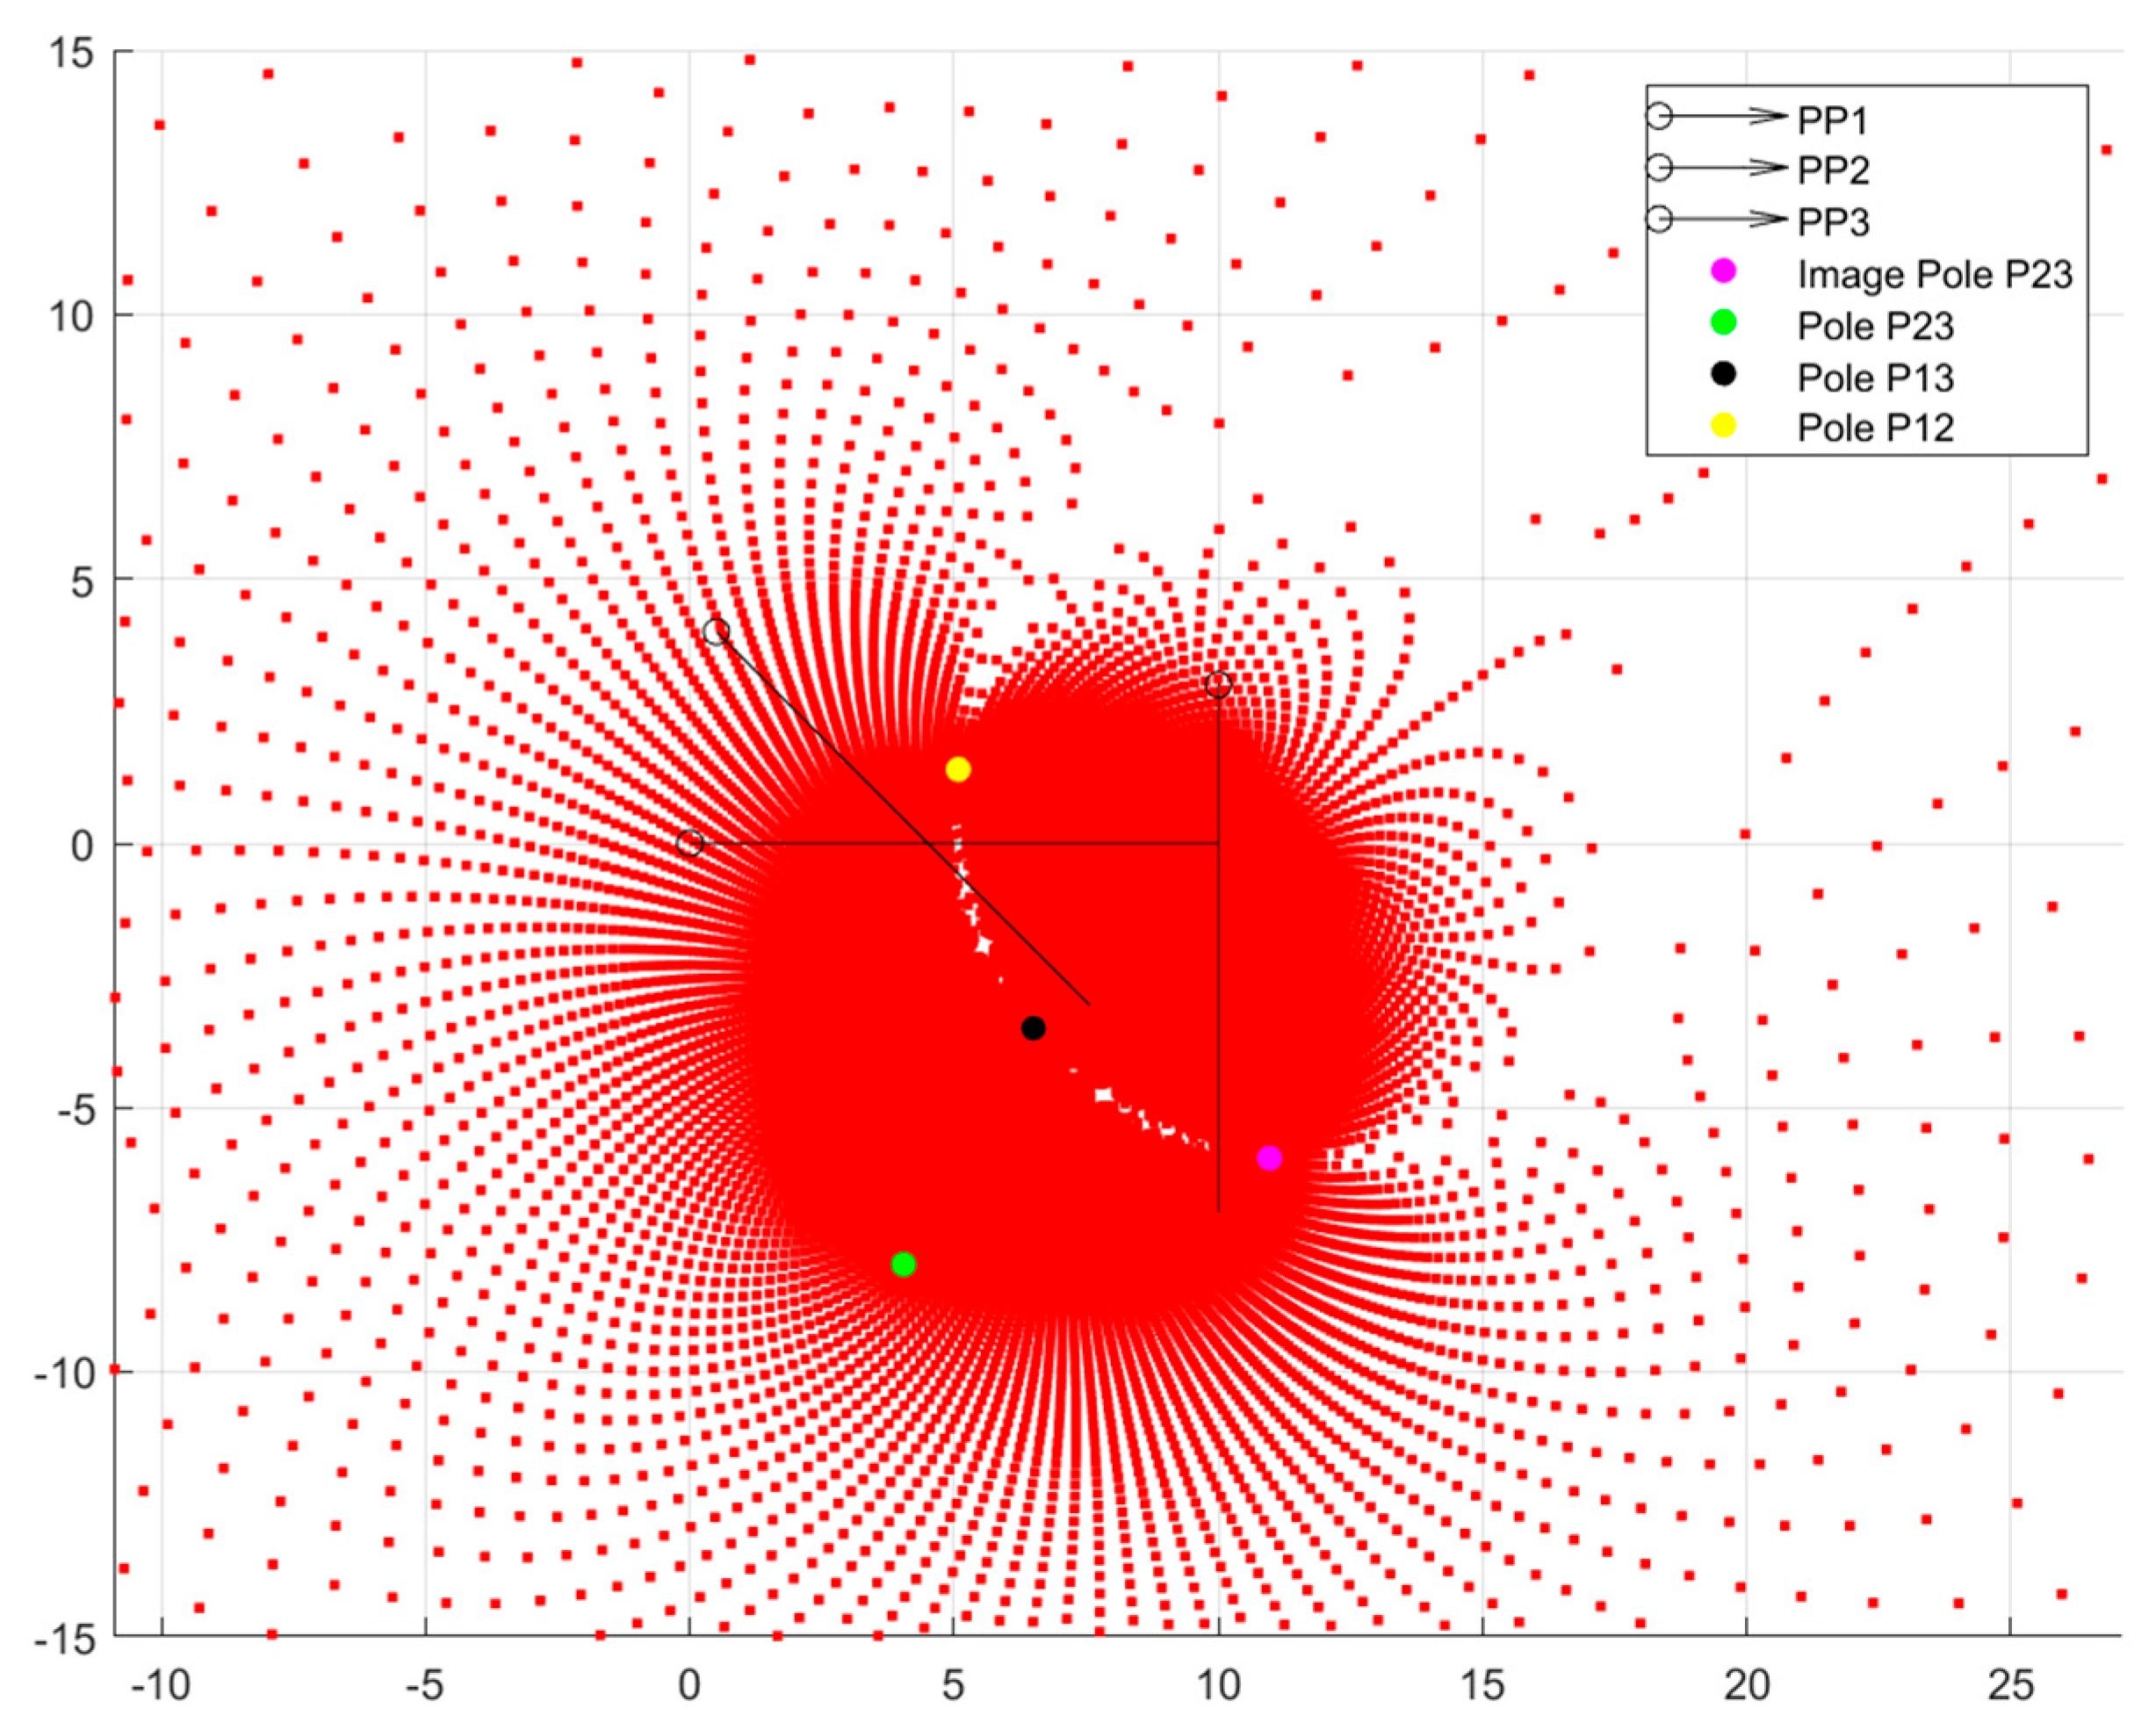
Figure 1. By itself, this finding is already a valuable synthesis and visualization tool for analyzing the mechanism solution space. One other item to note from
Figure 1 is the dispersion of the potential pivot points. The figure was generated using a constant value of β
2 and varying β
3 by a uniform increment of 1° (the opposite case with constant β
3 is shown in the
Appendix in
Figure A3). The resulting solutions, though, are not evenly dispersed in the plane. Instead, there is a high concentration of both moving pivot and ground pivot solutions centered about the pole P
13. This is the concept referred to in this paper as “solution density.” The density, in terms of pivot points per unit of planar area, decreases further away from the poles.
The MK Circles have a clear relationship with the poles, as each circle will pass through at least two poles. The poles have significance outside of the circles, though. Each pole represents a geometric special case of the kinematic synthesis problem. For example, if the free choice β
2 is equal to α
2, that means that the first and second links of the dyad chain are rotating by the same amount between positions one and two. The practical effect is that the link behaves like a rigid line between the ground pivot and the prescribed position. There is only a single position in the plane about which a straight line can rotate to replicate the pose and angle of two unique prescribed positions [
8]. The other pole locations have similar geometric explanations, which are summarized in
Table 1, along with equations for finding their locations. The general forms are given in Reference [
48]. Adding a fourth position adds three more poles—P
14, P24, and P
34—but also changes the behavior of solutions in the plane. When all four positions are considered, as the free-choice variable is iterated, the solutions settle into a cubic curve called the Burmester Curve that passes through a set of six of the poles and image poles. Mirth and Mlinar investigated how these curves change as a design parameter is varied, creating what Mlinar calls “the Burmester Field” [
48,
49,
50].
The effect of the poles is significant for finding ideal solutions, especially when ground or moving pivots must be in a prescribed region, but it also has implications for manufacturing tolerances and linkage performance. Similar properties were observed by Faik, who investigated mechanism design sensitivity. He defines sensitivity as “the ratio of the change of a given output variable to the change in a design parameter [
51].” As a mechanism’s sensitivity value increases, so too does the impact of manufacturing inaccuracies on the output of the mechanism. In essence, manufacturing tolerances must be tighter when sensitivity is high to ensure the mechanism performs as designed. Several other authors also investigated the effect of tolerances on mechanism performance, or applied a similar sensitivity lens in mechanism synthesis [
37,
52,
53,
54].
2. Principles of Solution Density
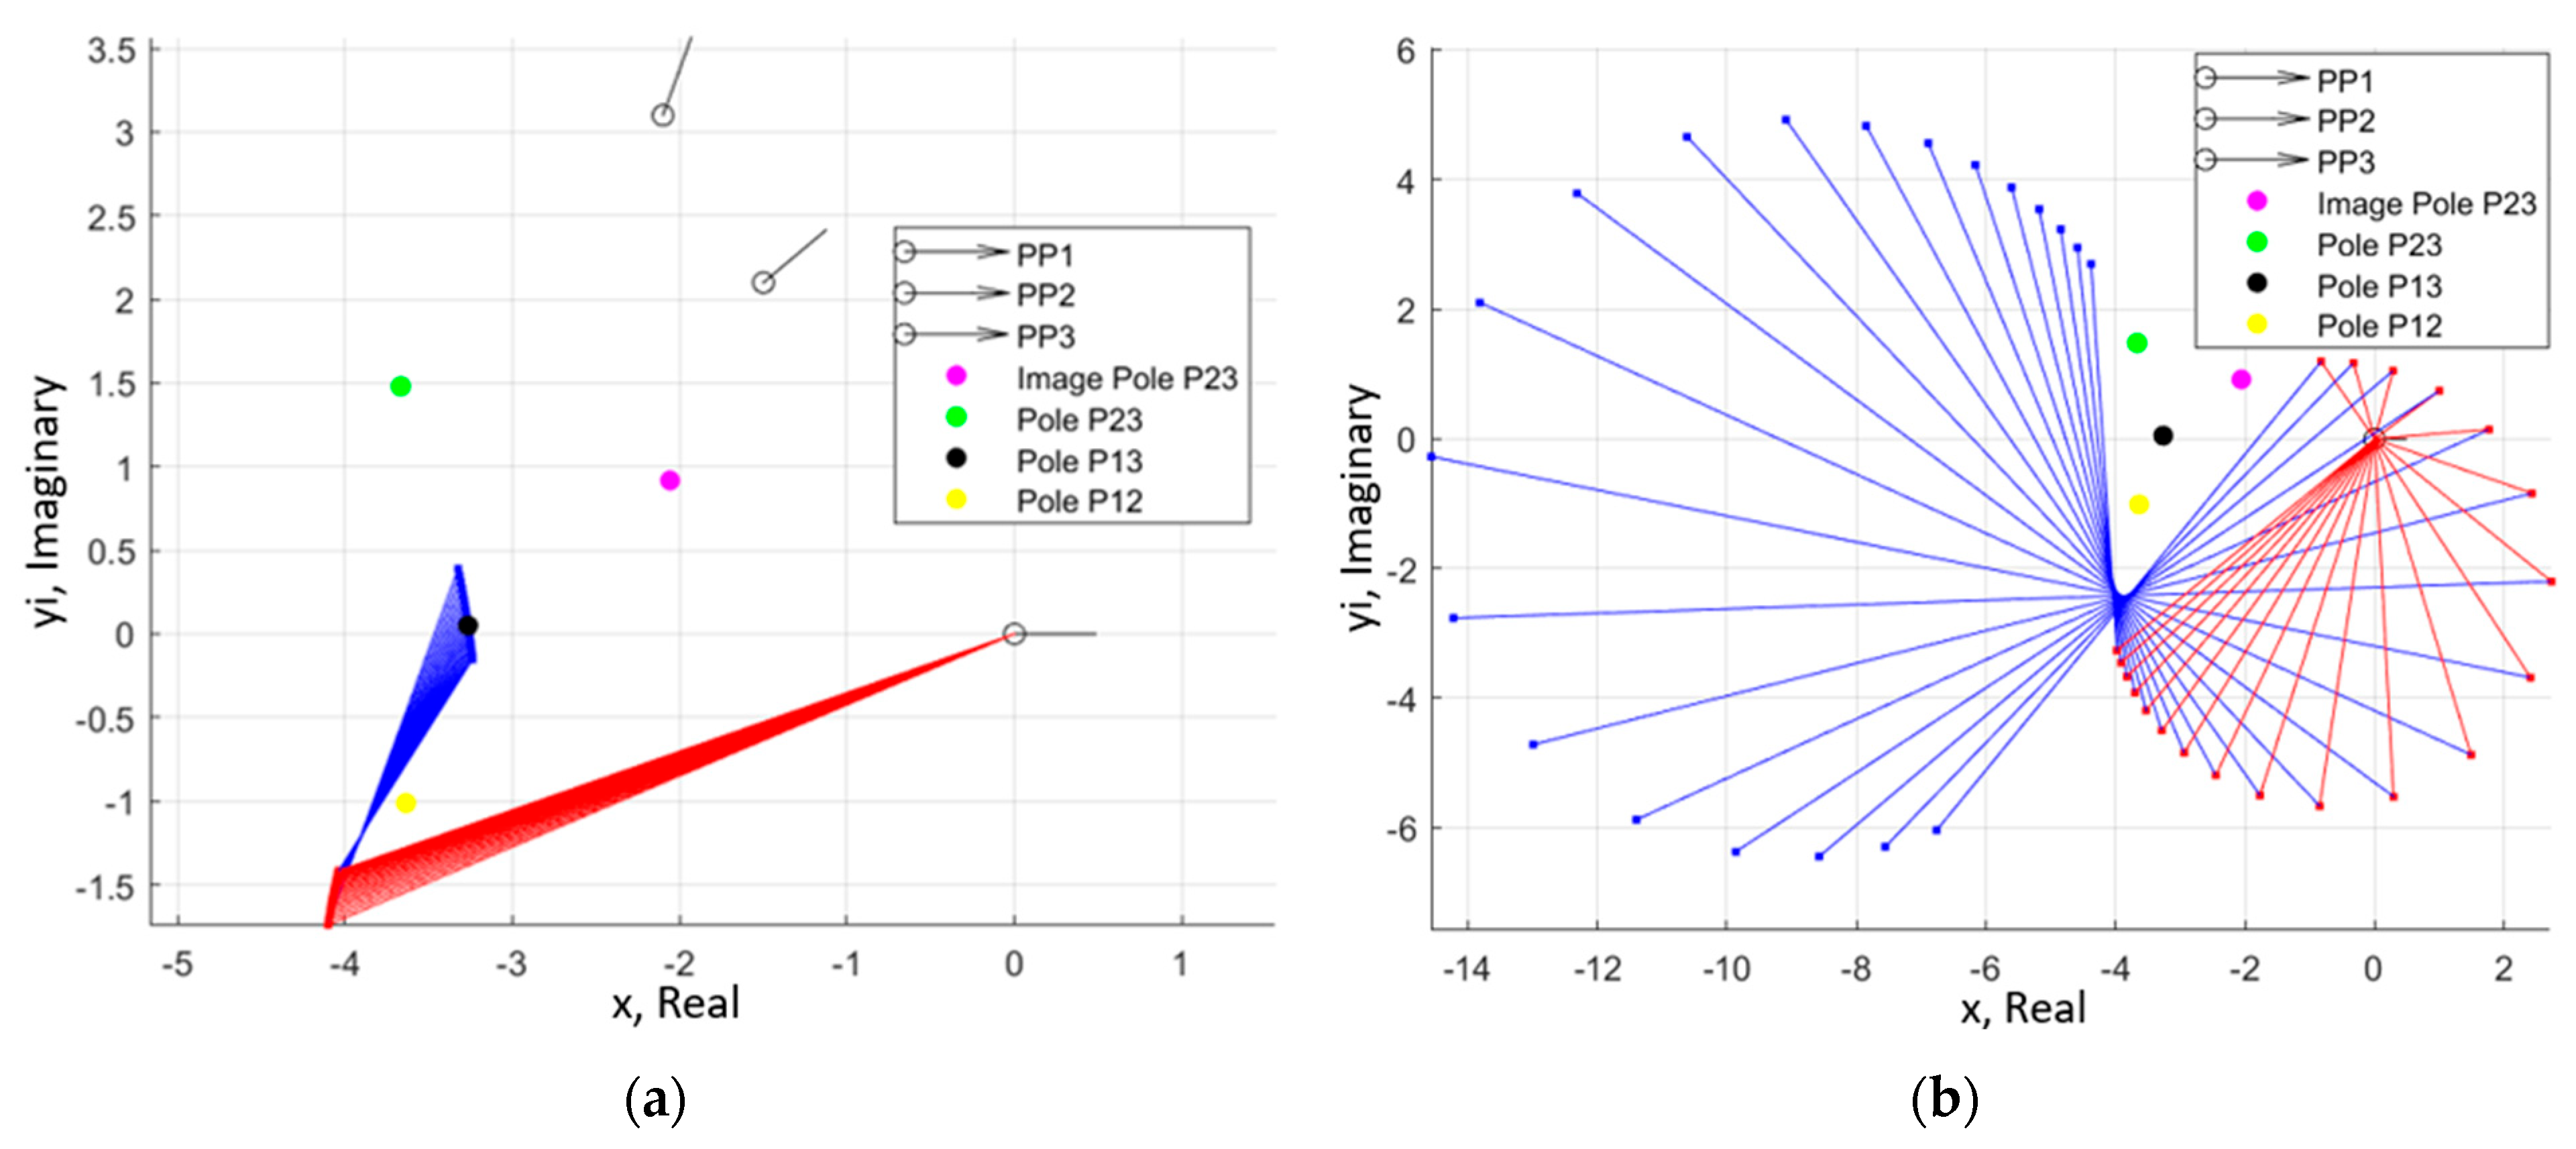
To demonstrate the principles of solution density, a generic numeric example is provided. In
Figure 2a, 20 points are plotted, ranging from 10 degrees below to 10 degrees above the value of β
3 that yields the pole location P
13. The linear distance between the first and last ground pivot locations is 0.5487, and the linear distance between the first and last moving pivot locations is 0.3309. In
Figure 2b, an identical 20° range of values of β
3 is shown, but this time the range is from a lower bound of 20° to an upper bound of 40°. These items and the prescribed positions are summarized in
Table 2.
Despite plotting an identical angle input range, the second case results in answers spanning nearly the entire circumference of both the M and K circles. In that case, the distance between the furthest points is just the diameter of each circle, or 11.381 and 6.863 units for the M and K circles, respectively. At the widest point, the distance between two consecutive points is 2.4934. That is greater than the entire 20° interval plotted near the pole location in (a). The pair of figures reveals how dramatic the effect of solution density is on the solution space.
Given these findings, a key question that emerges is, ‘How might a designer take advantage of the concept of solution density?’ We propose using a mixed exact-approximate problem definition to invert the synthesis process. Rather than applying a method like ground pivot specification [
8] to a set of prescribed positions, in this approach, the designer finds a solution in the desired ground pivot region by adjusting the prescribed information to manipulate the pole locations.
For example, in the case presented in
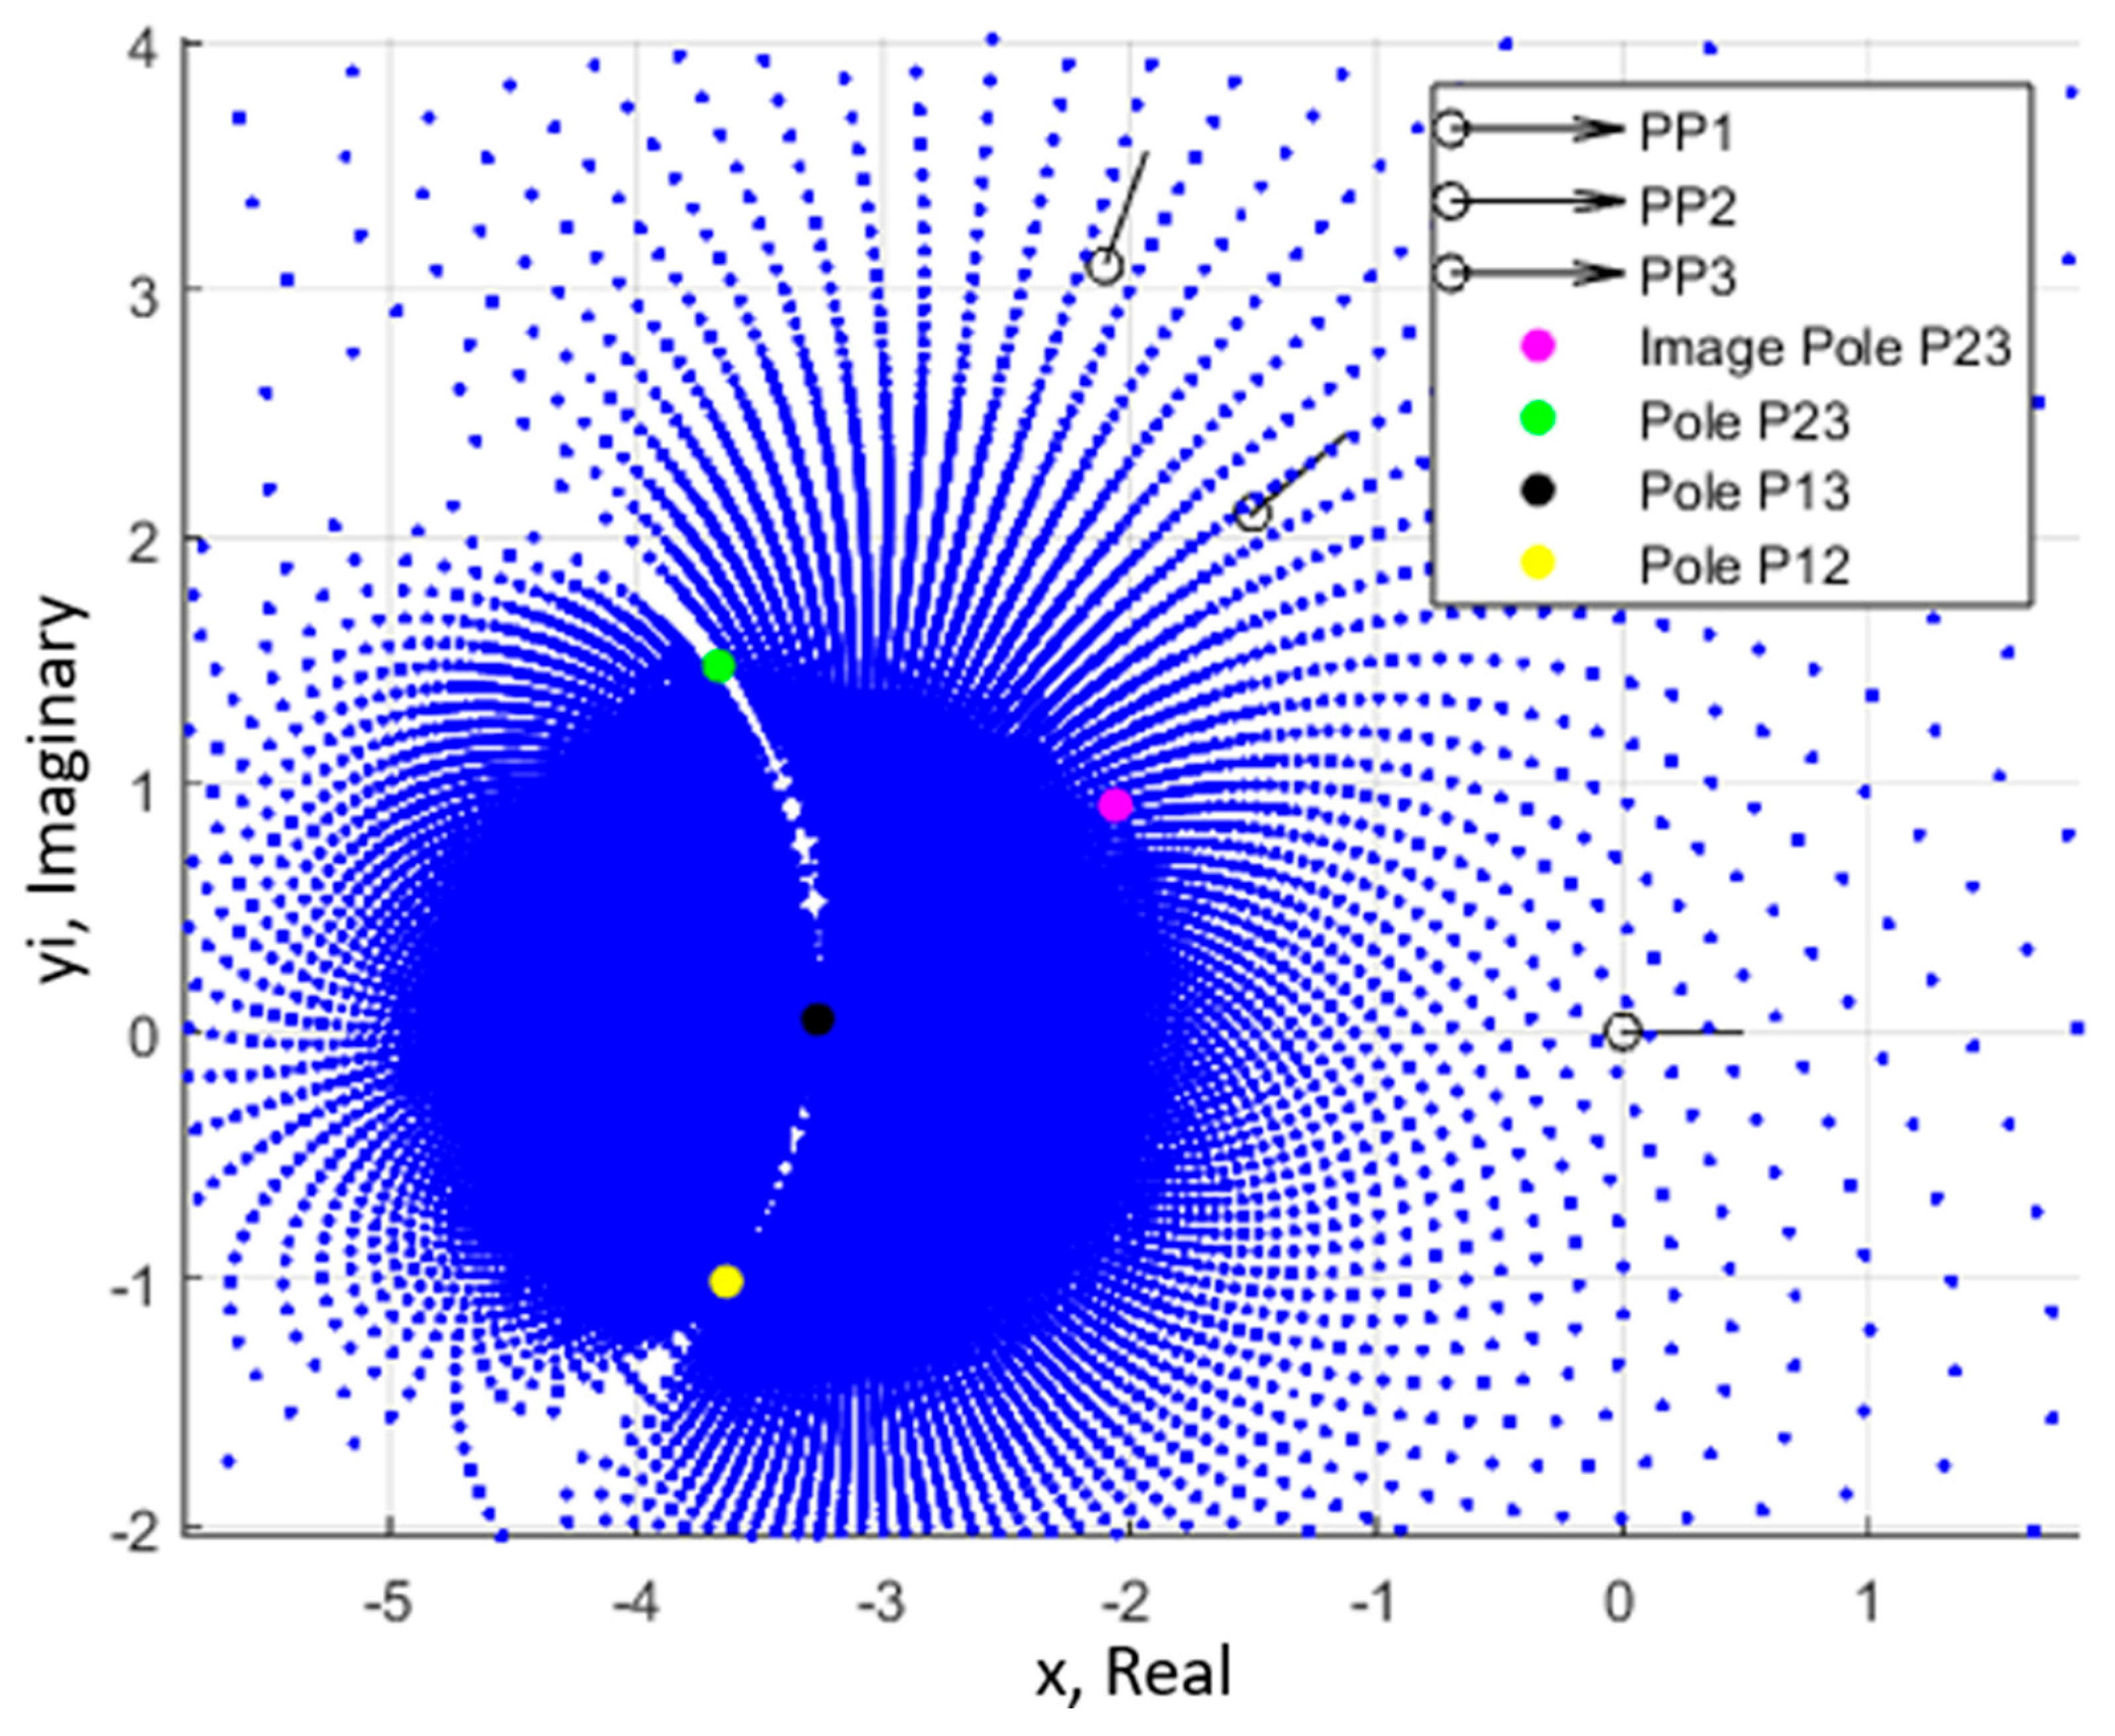
Table 2, the region of greatest solution density is concentrated around −3 + 0i. Plotting the entire range of β
2 and β
3 reveals the plot shown in
Figure 3. Both β
2 and β
3 are iterated in two-degree increments from 0 to 360 degrees. Recall from
Figure 1 and
Figure A3 that all ground pivot circles pass through the pole P
23, regardless of which free-choice variable is held constant. If the angle β
2 is held constant and the value of β
3 is iterated from 0 to 360°, the ground pivot circle will also include the point pole P
13. Similarly, if the angle β
3 is held constant and the value of β
2 is iterated from 0 to 360°, the ground pivot circle will always include the point pole P
12. This is due to the special-case conditions shown in
Table 1 that produce pole locations. The pole P
12 is a ground pivot solution when β
2 = α
2, a condition that will always be activated if all 360 degrees of the possible range of β
2 are considered. The same is true for pole P
13 when β
3 = α
3. Finally, P
23 is a ground pivot solution that is found when β
2 = β
3, a condition that is reached regardless of which variable is iterated. The resulting pole triangle (P
12–P
23–P
13) is the confluence in the plane with the highest solution density.
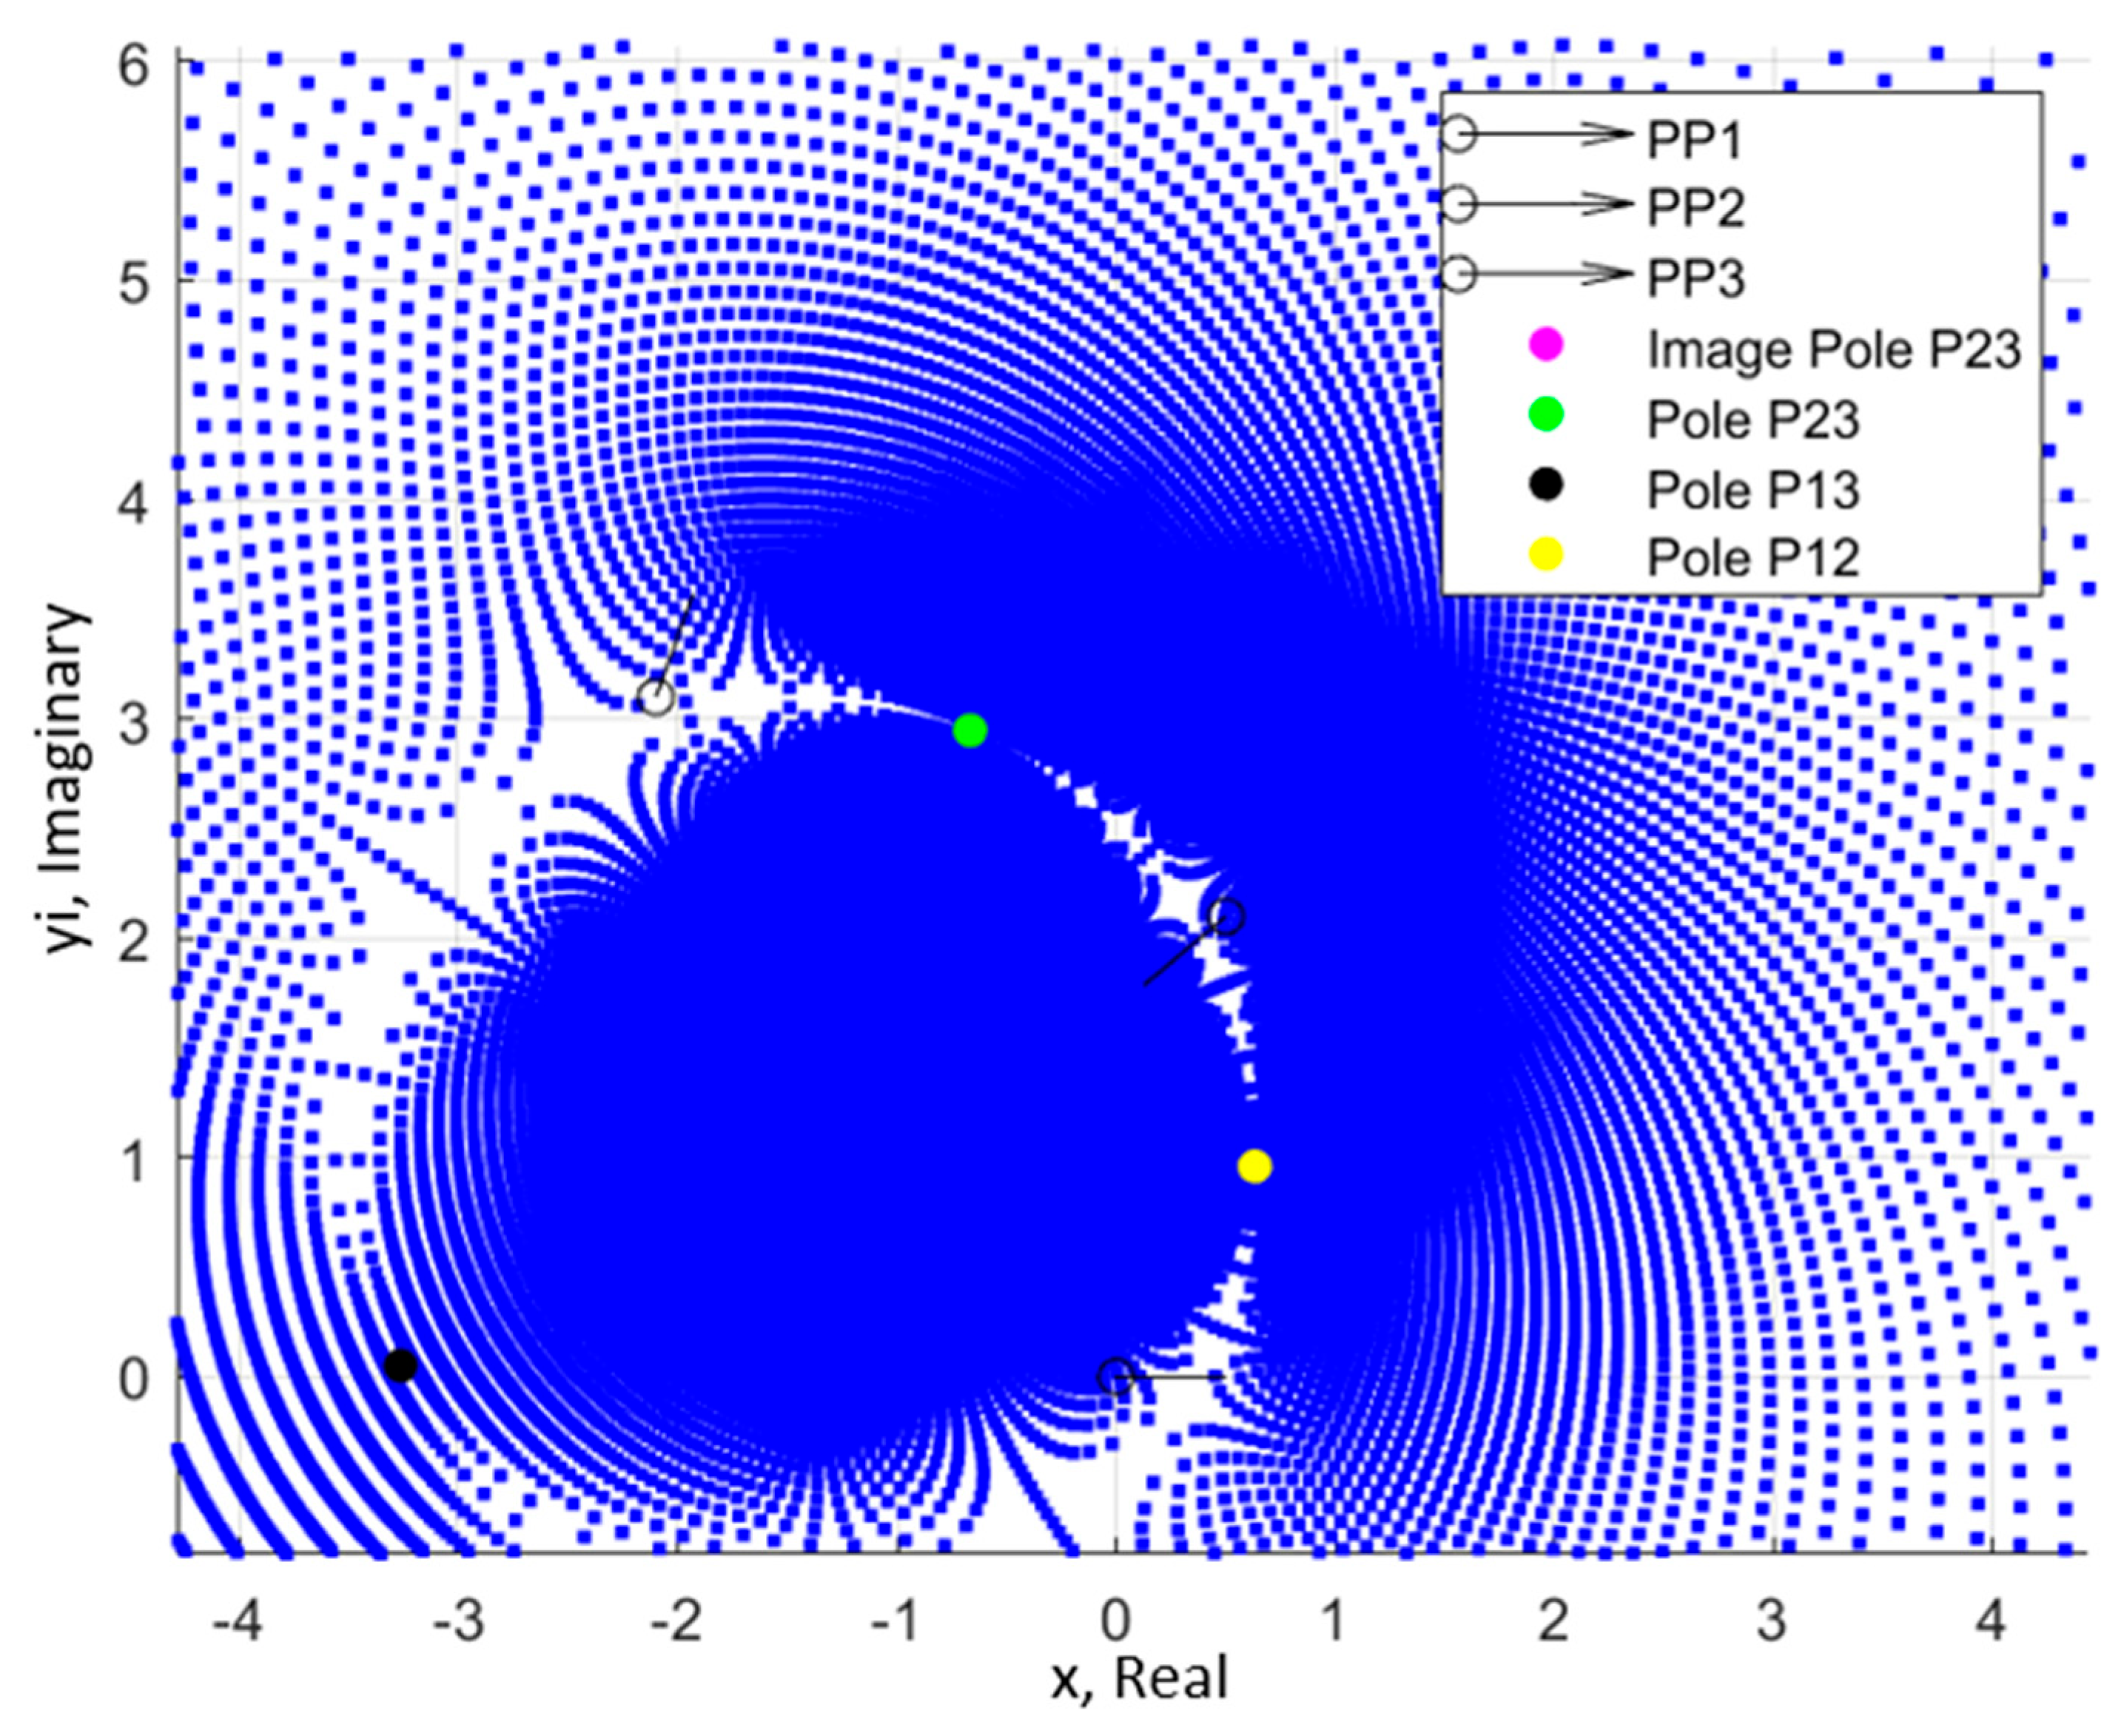
Suppose the mechanism designer hopes to perform a pick-and-place operation with an exact first and third position. In that case, they can still manipulate the location of the pole triangle by adjusting the position and orientation of the second prescribed position. A ground pivot location above and to the right of the prescribed positions (i.e., at 0 + 3i) may be desirable to avoid an obstacle in the workspace. The initial problem configuration centers the pole triangle (and consequently the region of greatest solution density) around (−3 + 0i). If position 2 is held in place, but the angle is increased by 180° to 220°, the poles P
23 and P
12 shift to a position above the prescribed points, as shown in
Figure 4. Combining rotation with moving the second precision position can have an even greater effect, as shown in
Figure 5.
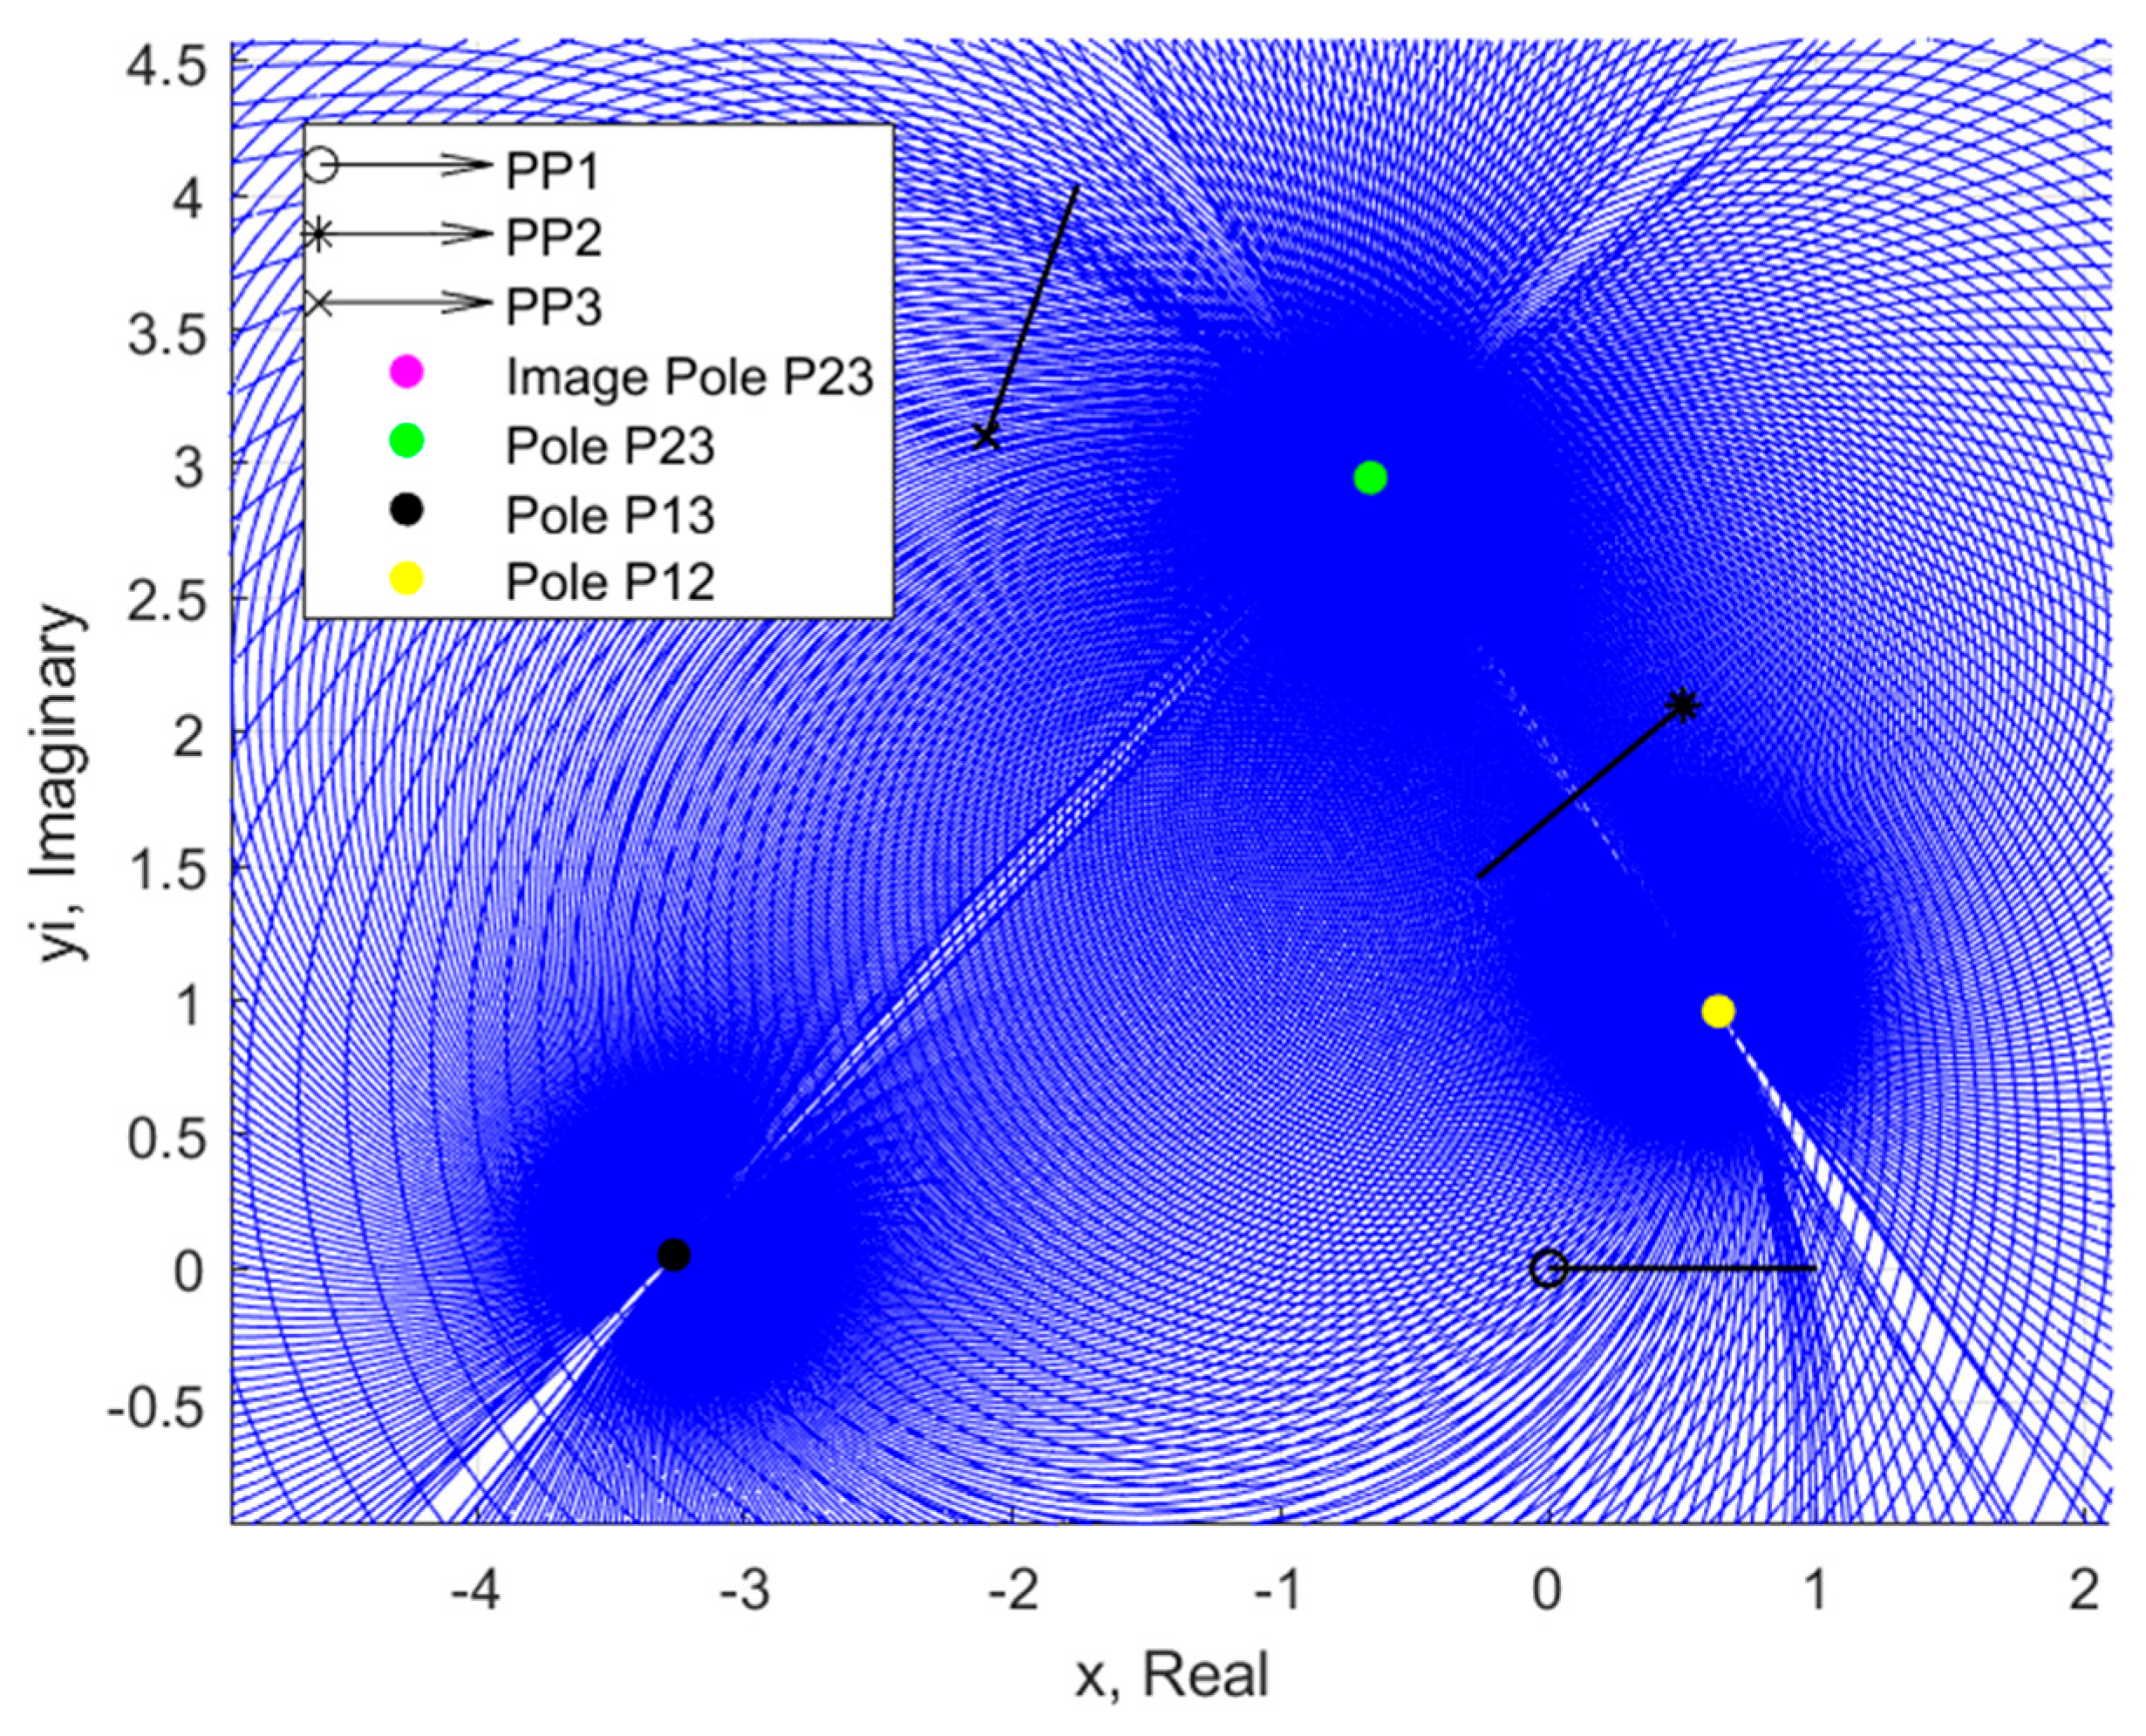
Figure 2 shows the effect of positional density around a circle, indicating that the input free-choice values most frequently yield solutions near the pole locations. This effect is so dramatic that a 20° increment covers over 2/3rds (~70%) of the corresponding circle. But, this is only one portion of density’s effect—there is a second dimension to the concept of solution density. That second dimension is the space between two adjacent circles. Along a single circle, as the angle increment of β
2 approaches 0, the circle of discrete points approaches a straight line. In the same way, as the increment between two circles approaches 0, the space between becomes a continuous surface of varying density. Once again, though, plotting multiple circles reveals that this dimension of solution density is greatest near the poles. This phenomenon may be observed in
Figure 6, which is a recreation of
Figure 5, but this time, the plot is created using a set of circles drawn as a single continuous line rather than a collection of individual points.
It is known from geometry (see
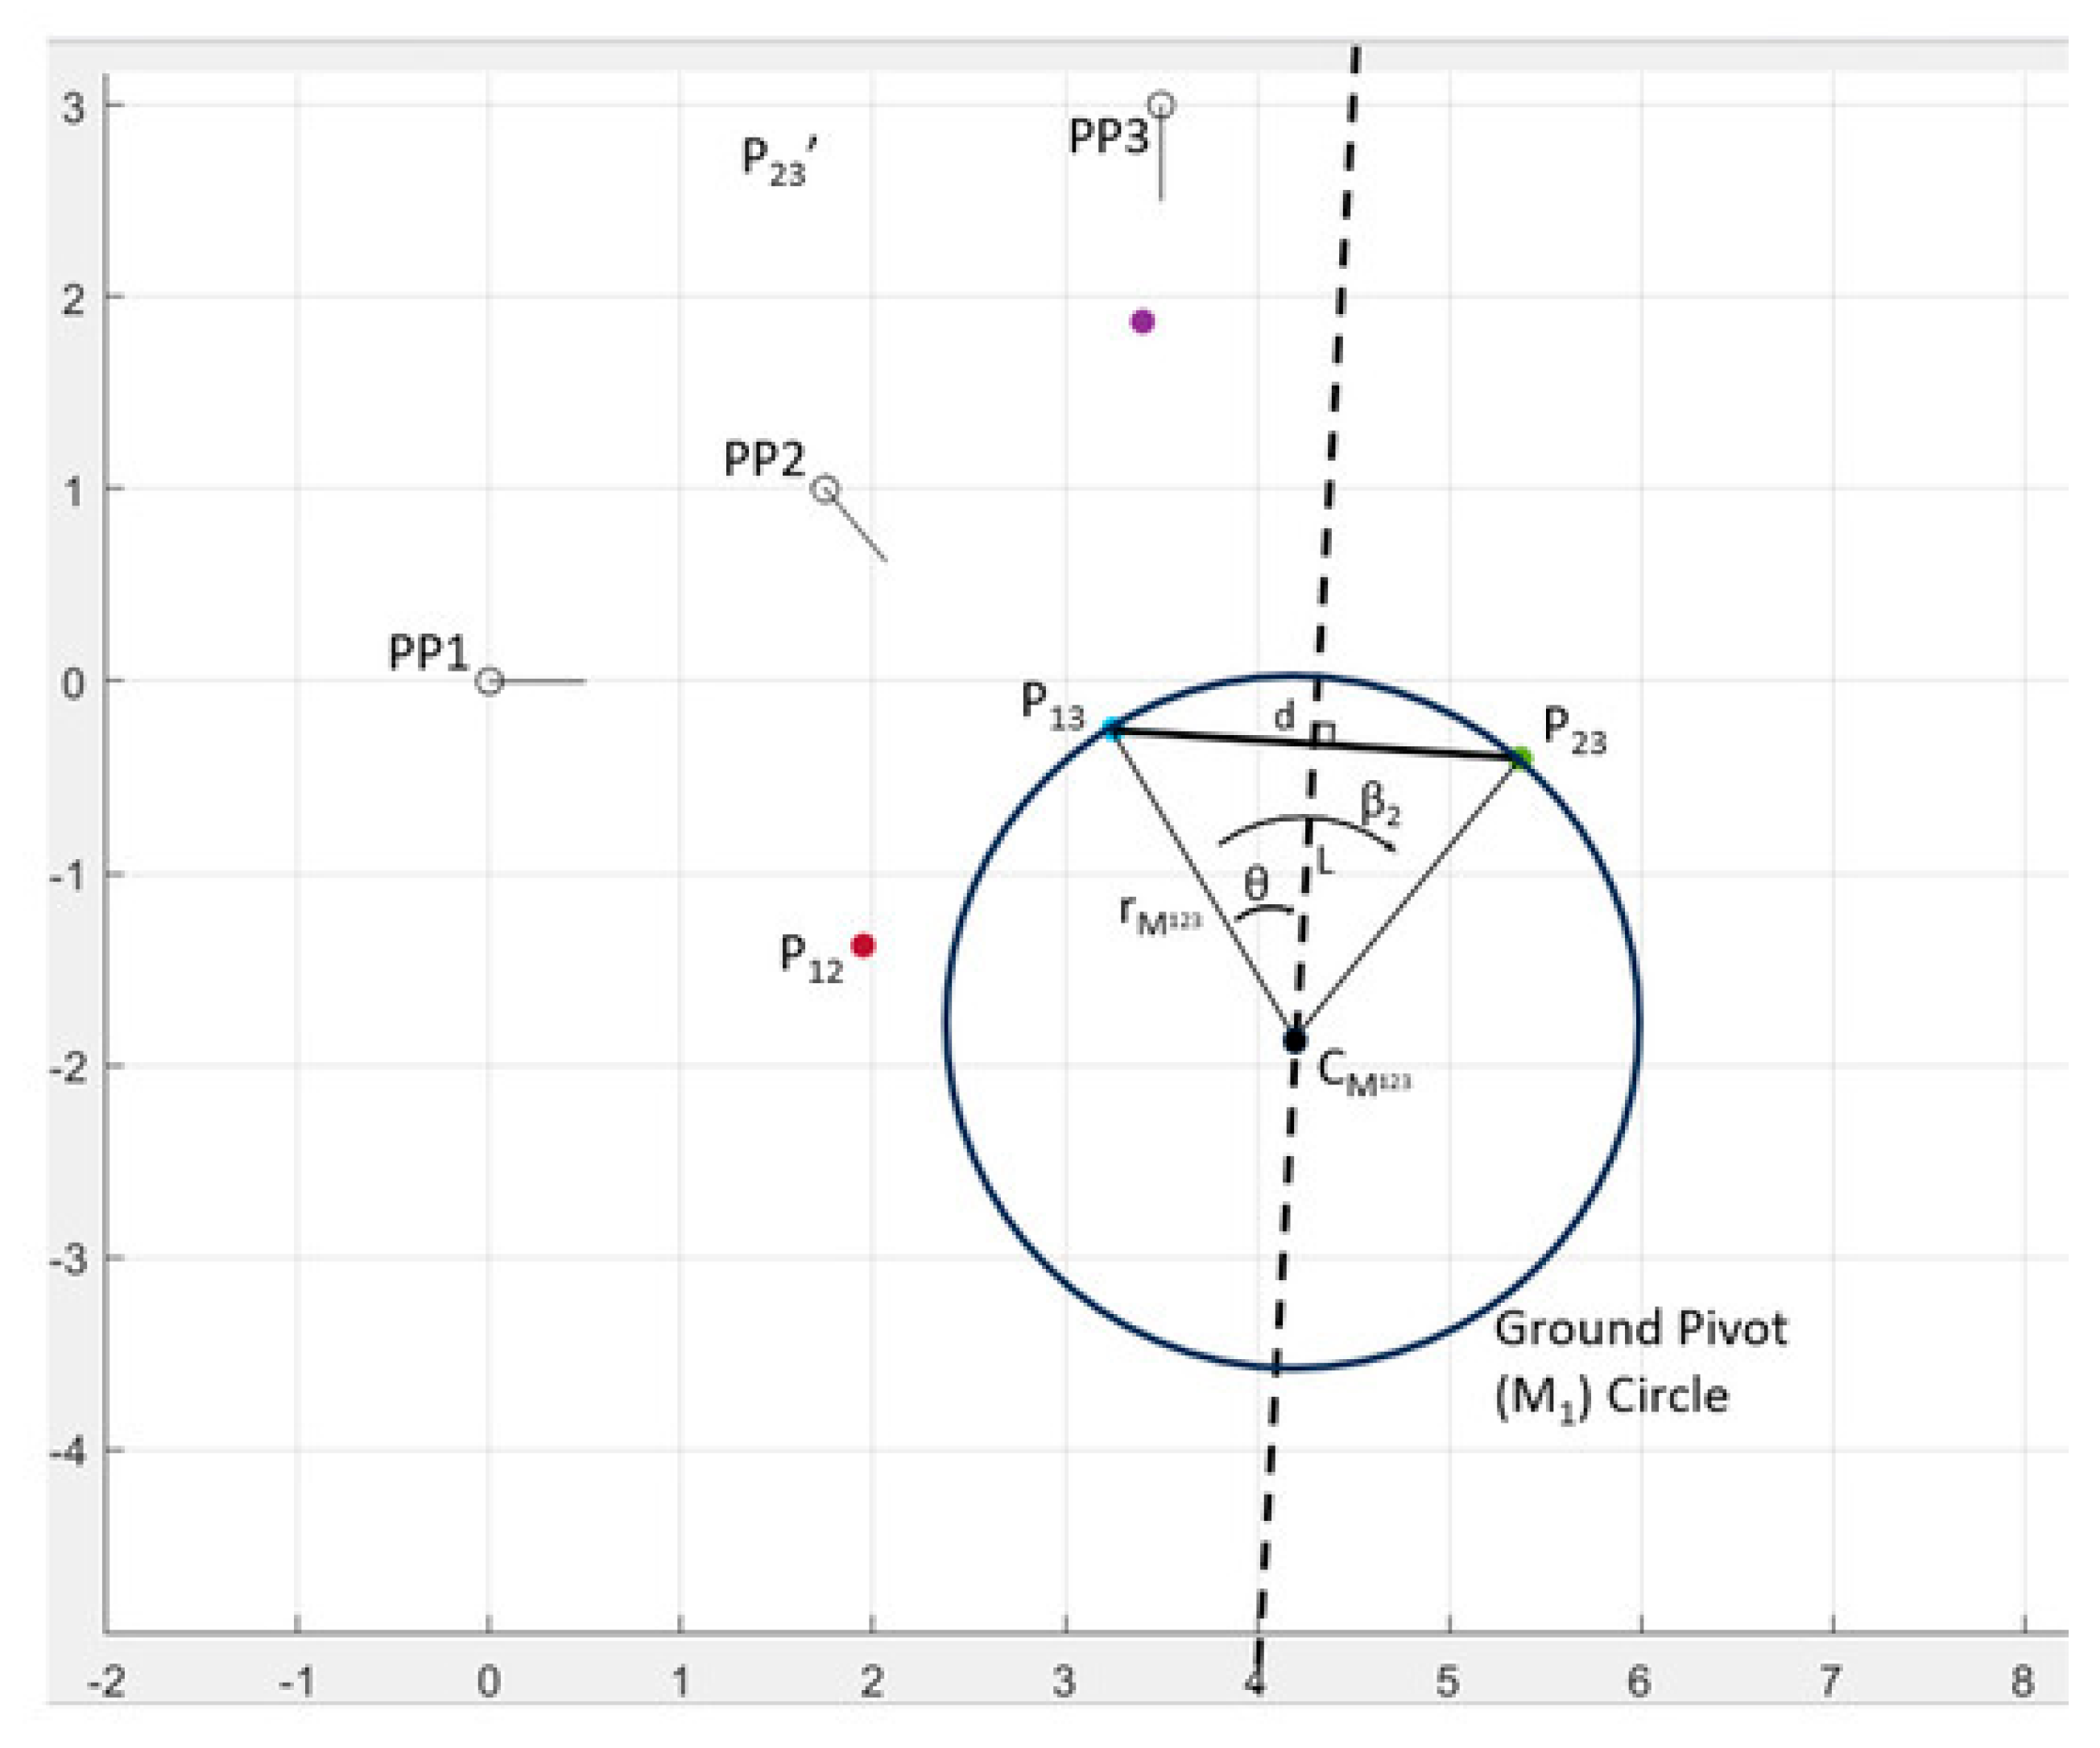
Figure A2) that each circle passes through two of the poles exactly. The circle radius is set by the internal angle between the poles and center point, which is a factor of the free choices. The circle radius sets the second dimension of solution density, a property that is even more obvious in
Figure 7, which shows a single set of circles. The focus of the present work is on dyad chains, but some preliminary work of a similar nature has been conducted on triad chains as well. This foundational effort for future work to build off for triad chains is shown in
Appendix C.
3. Applications to Mechanism Synthesis
A common tactic for finding solutions in mechanism synthesis is to apply a grid search over a set variable range. In a three-prescribed-position motion generation problem, a designer will often vary the values of the angles β
2 and β
3, with the solution yielding a single complete dyad. To make a complete four-bar, the first dyad is combined with a second dyad formed from another unique combination of β
2 and β
3. Testing 360 values for both β
2 and β
3 yields 129,600 unique dyads, and every resulting four-bar solution combines two of these kinematic chains into one mechanism. That means between just these two dyads, using one-degree increments, a designer will end up sifting through more than
possible solutions (1).
Even with modern computing power, running that volume of solutions through a grid search (synthesizing solutions) and an affiliated optimization routine (finding ground pivots, mechanical advantage, velocity/acceleration analysis, transmission angles, etc.) will be a time-consuming and computationally expensive process. And that is only for a four-bar mechanism on a 1° increment! The complexity and volume of free choices further increase for mechanisms with more links. Even so, despite the astronomical number of solutions considered, the concept of solution density reveals that one-degree increments may not be a tight enough resolution.
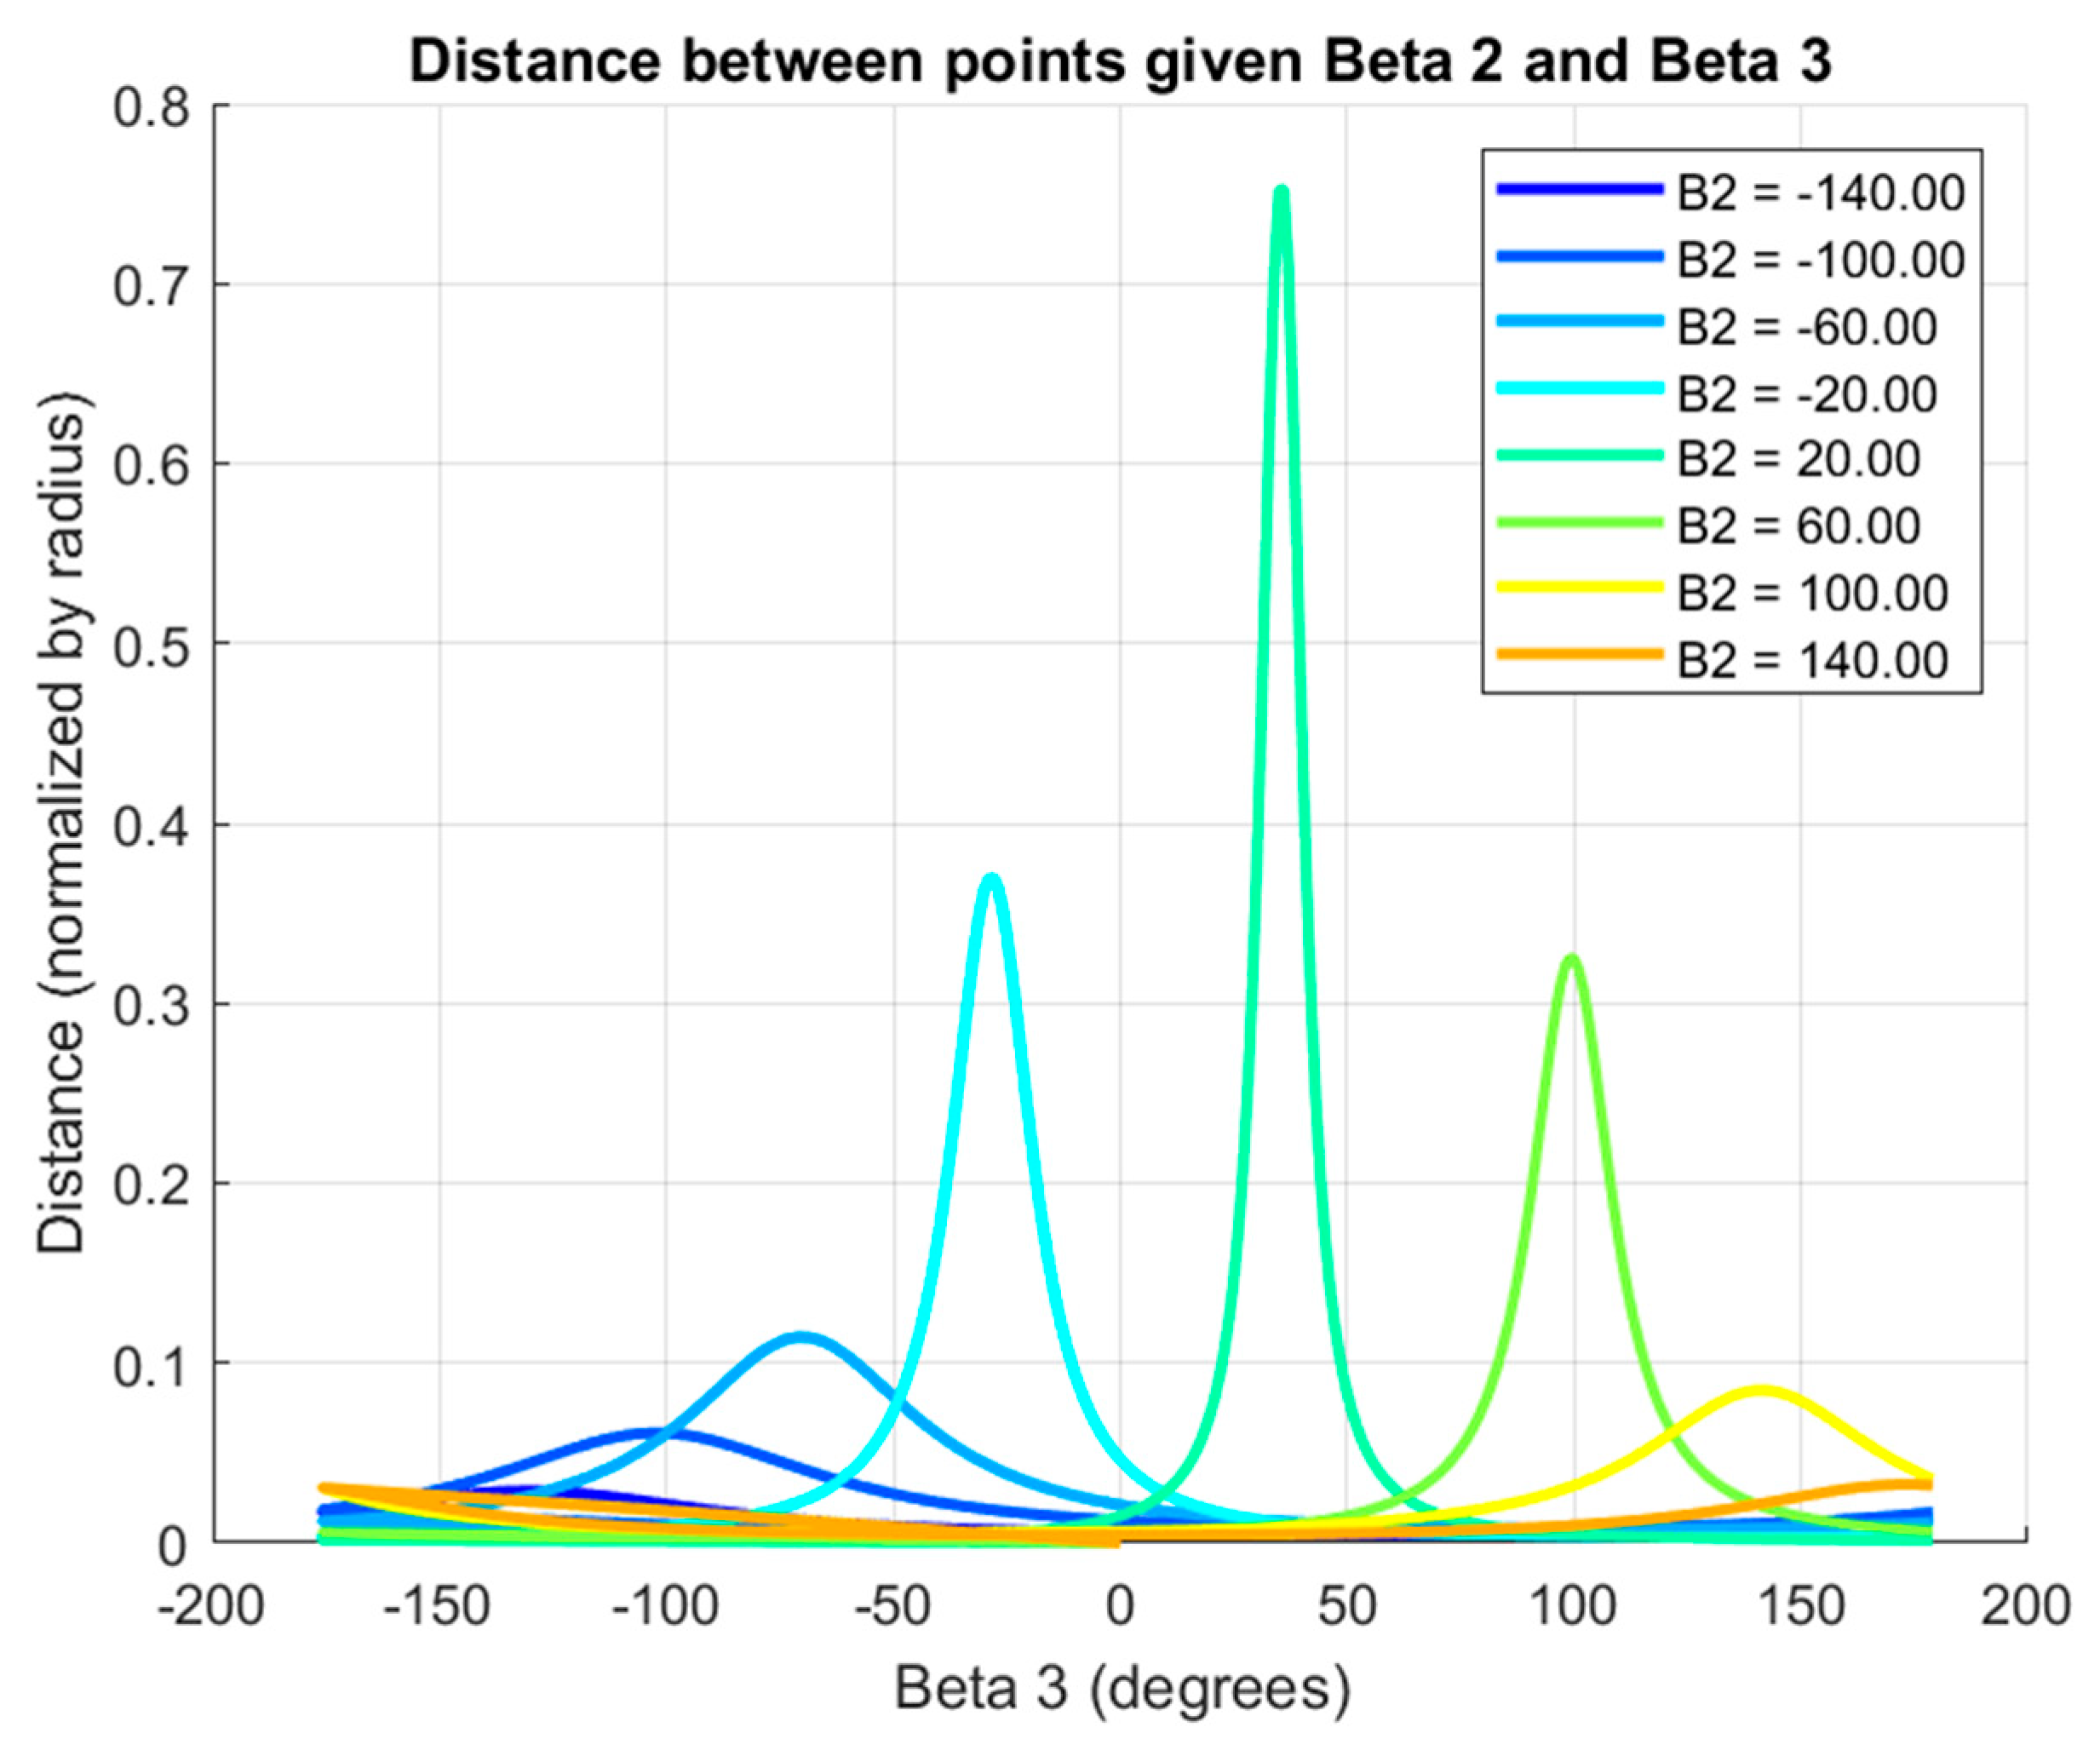
Figure 7 shows that even a small increment of β
2 can produce solutions hundreds of units apart. If a designer first creates a plot of the solution space or even just identifies the locations of the critical poles, they may use a larger increment of the free choices as the spacing between points is much tighter. The result is that designers sift through significantly fewer candidates on the way to their answer.
Manipulating the problem definition to improve solution density is valuable for finding solutions, but the impact of this concept extends beyond the theoretical to the practical construction of the mechanism.
Figure 2a shows that the regions of high solution density contain essentially a single ‘family’ of solutions. All the dyads in this region have the same general form, but slightly different dimensions. The opposite is true for the low-density solutions shown in
Figure 2b, which have notably different geometries and dimensions. The result is that mechanisms designed with prescribed timing on the driving link will have more significant output inaccuracies at each set position of the input as solution density decreases. An equal change in angle β
2 or β
3 will produce a greater change in corresponding pivot locations in low-density regions than in high-density regions. Quantifying this output inaccuracy or identifying the amount tolerances must be tightened to accommodate solutions selected from low-density positions is not the emphasis of the present work. As shown in
Figure 8 and
Figure 9, the change in density along each dimension changes non-linearly with respect to changes in the free-choice angles. Much of this effort, including comparing Faik’s sensitivity study to the current study to identify correlations, is left for future work [
51,
55].
The geometric construction procedure for each set of solutions found using the MK circles also reveals interesting information about how solutions fall in the plane. If β
2 and α
2 have opposite signs, the ground and moving pivot solutions will typically fall on the same side of pole P
12, while matching signs will lead to solution positions on opposite sides of pole P
12 [
8]. This is not necessarily significant for link lengths, but it is important for how links move, affecting instant centers, transmission angles, and other force transmission properties.
Figure 8 shows the density relationship between two adjacent points on any given circle. This relationship is governed by Equation (2), which finds the distance between two adjacent ground pivot solutions. The circles are continuous, so the distance will be dependent on the amount by which β
3 is incremented.
where M
1 is ground pivot solution one, given by PP1 −
Z1 −
W1, and M
2 is ground pivot solution two, given by PP1 −
Z2 −
W2. For cases like the 3-position problem considered in
Figure 8,
W and
Z may be calculated using Cramer’s rule (Equation (3)), a method for solving a system of equations. In the example, to find
Z2 and
W2, the value of β
3 is incremented by 1°.
Figure 9 shows the effect of solution density between two circles. In that case, the density is a result of the radius of the circles, a property which is again a function of the free-choice angles. The radius may be calculated according to the geometry of the solution space, especially the pole locations. See
Figure A2 for an example of the formulation. The result is shown in Equation (4), which simply applies trigonometric identities to the geometry to find the radius. Note that the equations for calculating the pole locations are provided in
Table 1.
Equations (2) and (4) specifically relate to the ground pivot circles, but similar relationships exist for the moving pivot circles as well. The distance equation may be updated by replacing M with K, the moving pivot position, which is only a function of PP1 and Z rather than Z and W.
4. Solution Density Technique Applied to Chest-Style Coffee-Table Mechanism
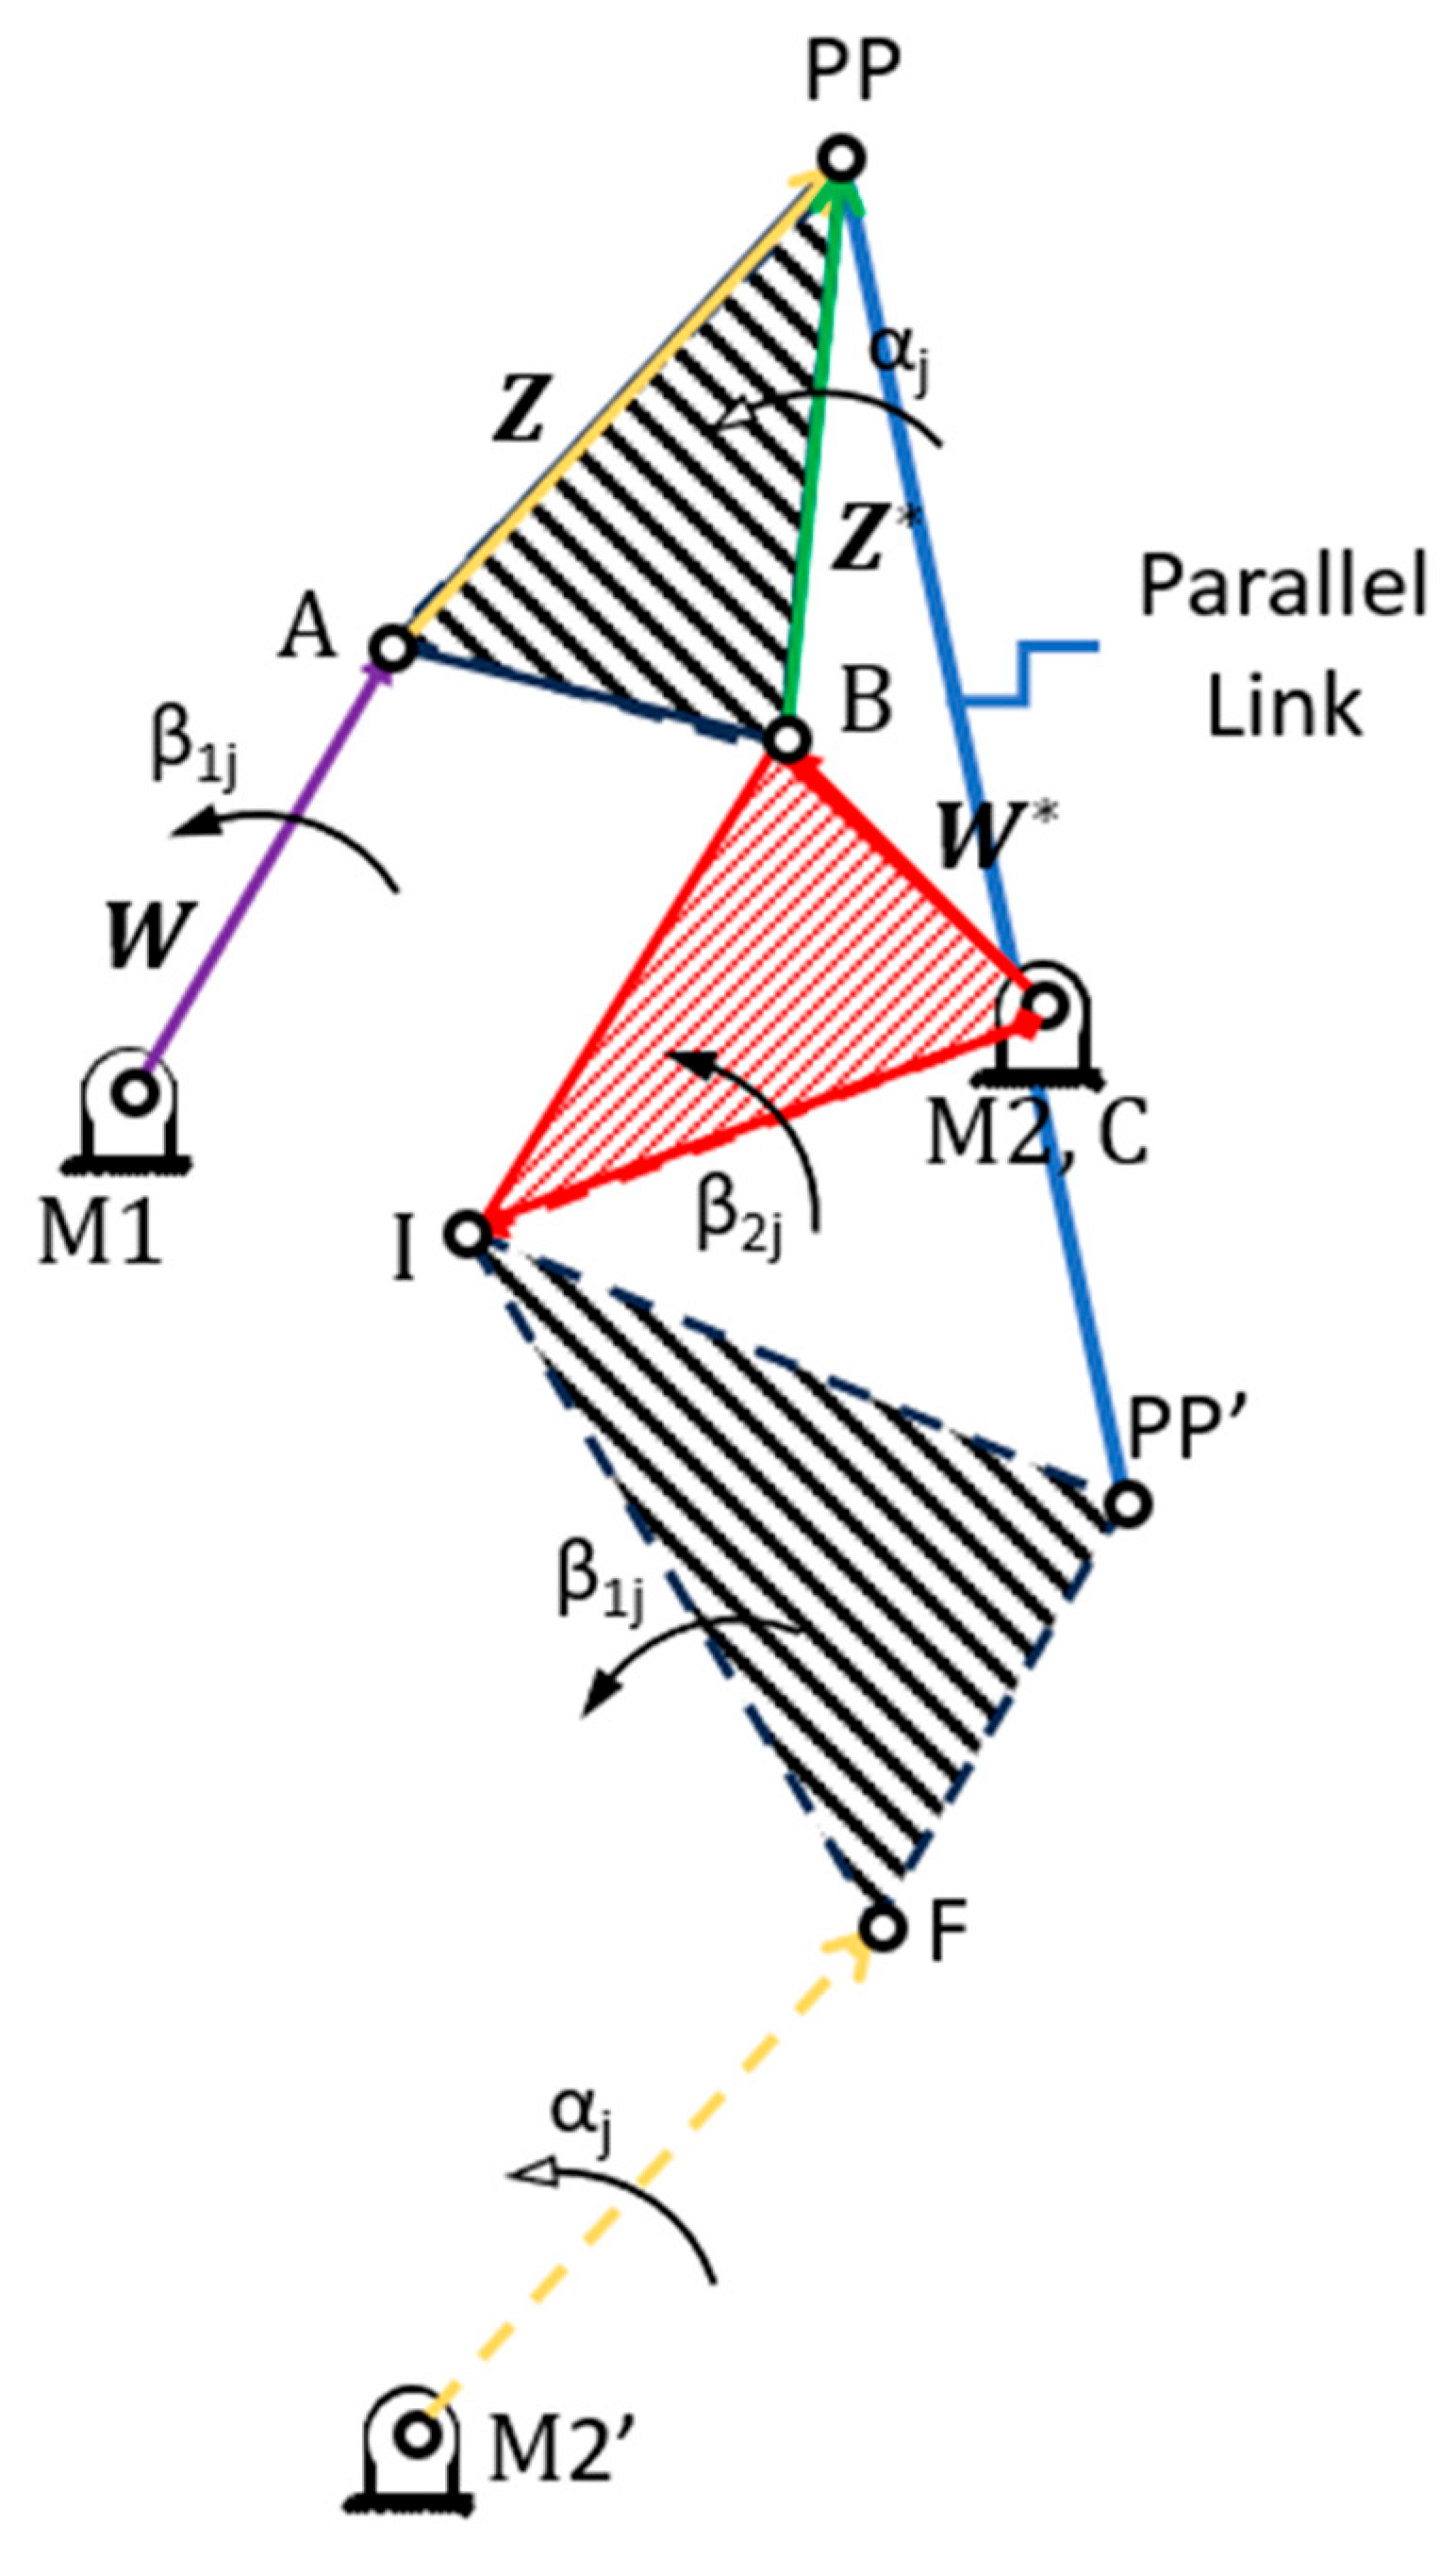
A common challenge in mechanism synthesis is designing parallel (not rotating) or straight-line motion. Consider a common chest-style coffee table that opens from the top with a single hinge. If the user has anything on top of the table, it will need to be picked up and placed off to the side to access the contents of the chest, or else the items would slide off the top when the lid is opened. If the lid were instead mounted with a parallel-motion linkage that keeps the top surface flat as the lid moves up and out of the way, the items could be left in place even while the user accesses the chest. The simplest method for creating parallel motion is to use a parallelogram four-bar linkage, but this design is known to suffer from poor mechanical advantage and takes up a large space relative to the travel distance of the parallel link. An alternative method is to generate a cognate 7-bar linkage using the Roberts-Chebyshev theorem [
8,
56]. In this method, two four-bar cognate linkages that generate an identical path to the base four-bar are created using geometric properties of linkages. If one of the cognates and the original linkage is then joined together, their shared paths create parallel motion. By Gruebler’s equation, the final 7-bar linkage technically has 0-DOF (F = 3 (7−1)−2 ∗ 9 = 0), but the presence of parallel motion allows the system to move nonetheless—taking away the constant angle bar between the two four-bar segments does not change the motion of the mechanism. See
Appendix B for a more complete description of the Chebyshev theorem, and instructions for applying it.
Conveniently, these properties make the theorem conducive to solution density optimization, as the base linkages produce parallel motion regardless of the values of α
j. In the following example, solution density optimization and the Chebyshev theorem are used in tandem to synthesize a parallel-motion generator for use inside a coffee table that has an internal height of 12 inches and an in-plane width of 15 inches. The goal is to create a parallel-motion linkage that allows a user to open a coffee table and access its contents without needing to remove anything sitting on top of it. The problem definition is initially set using the parameters in
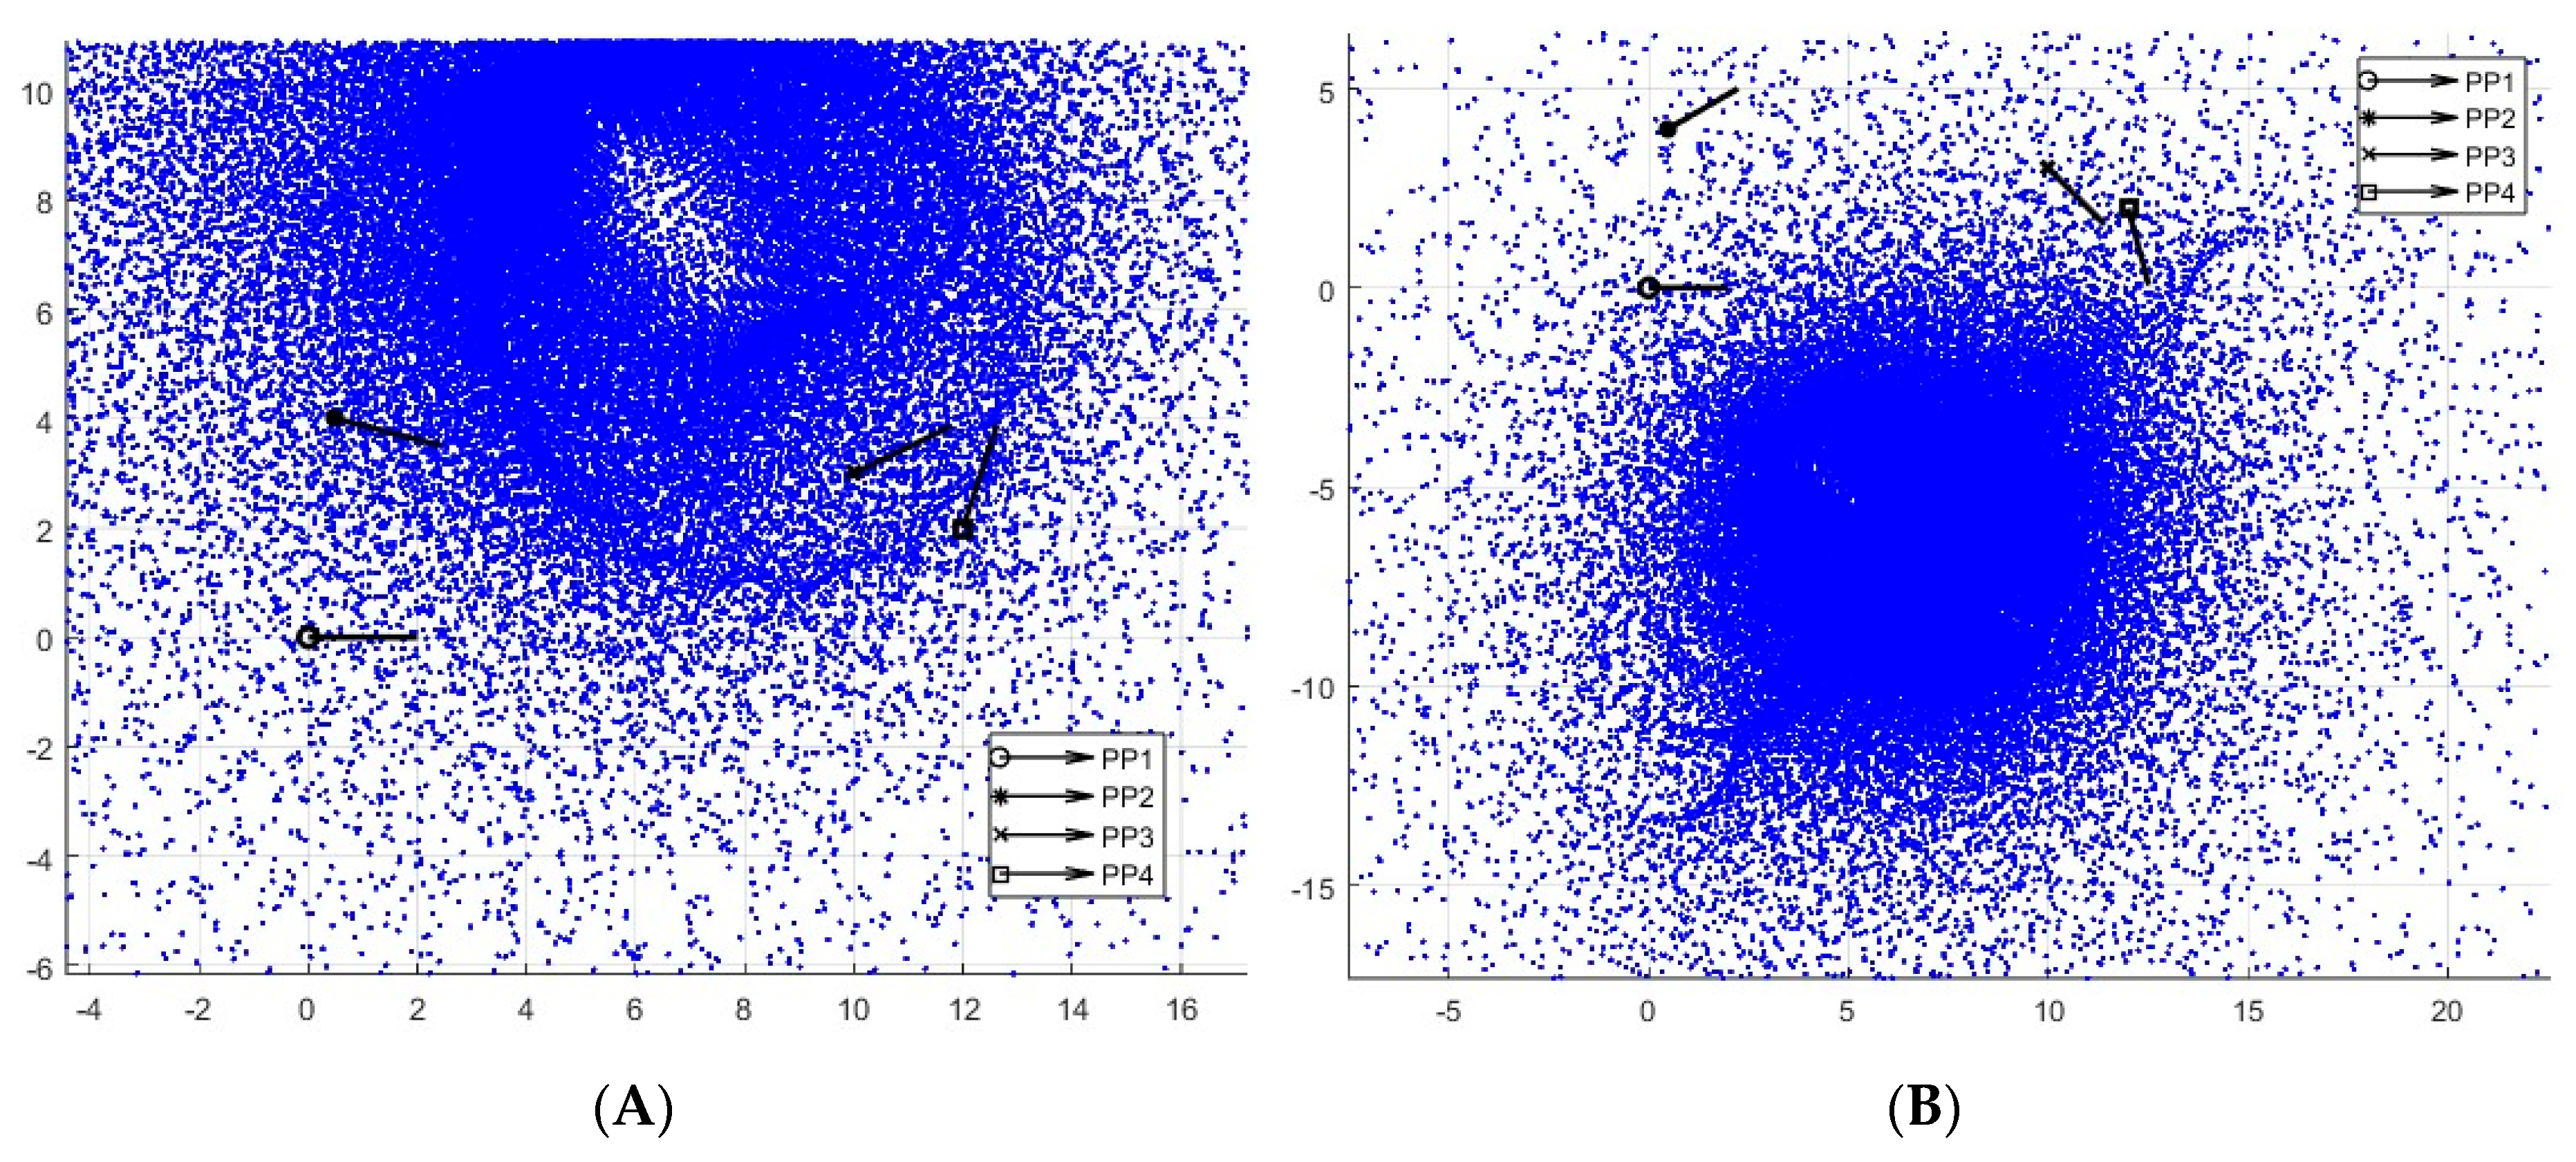
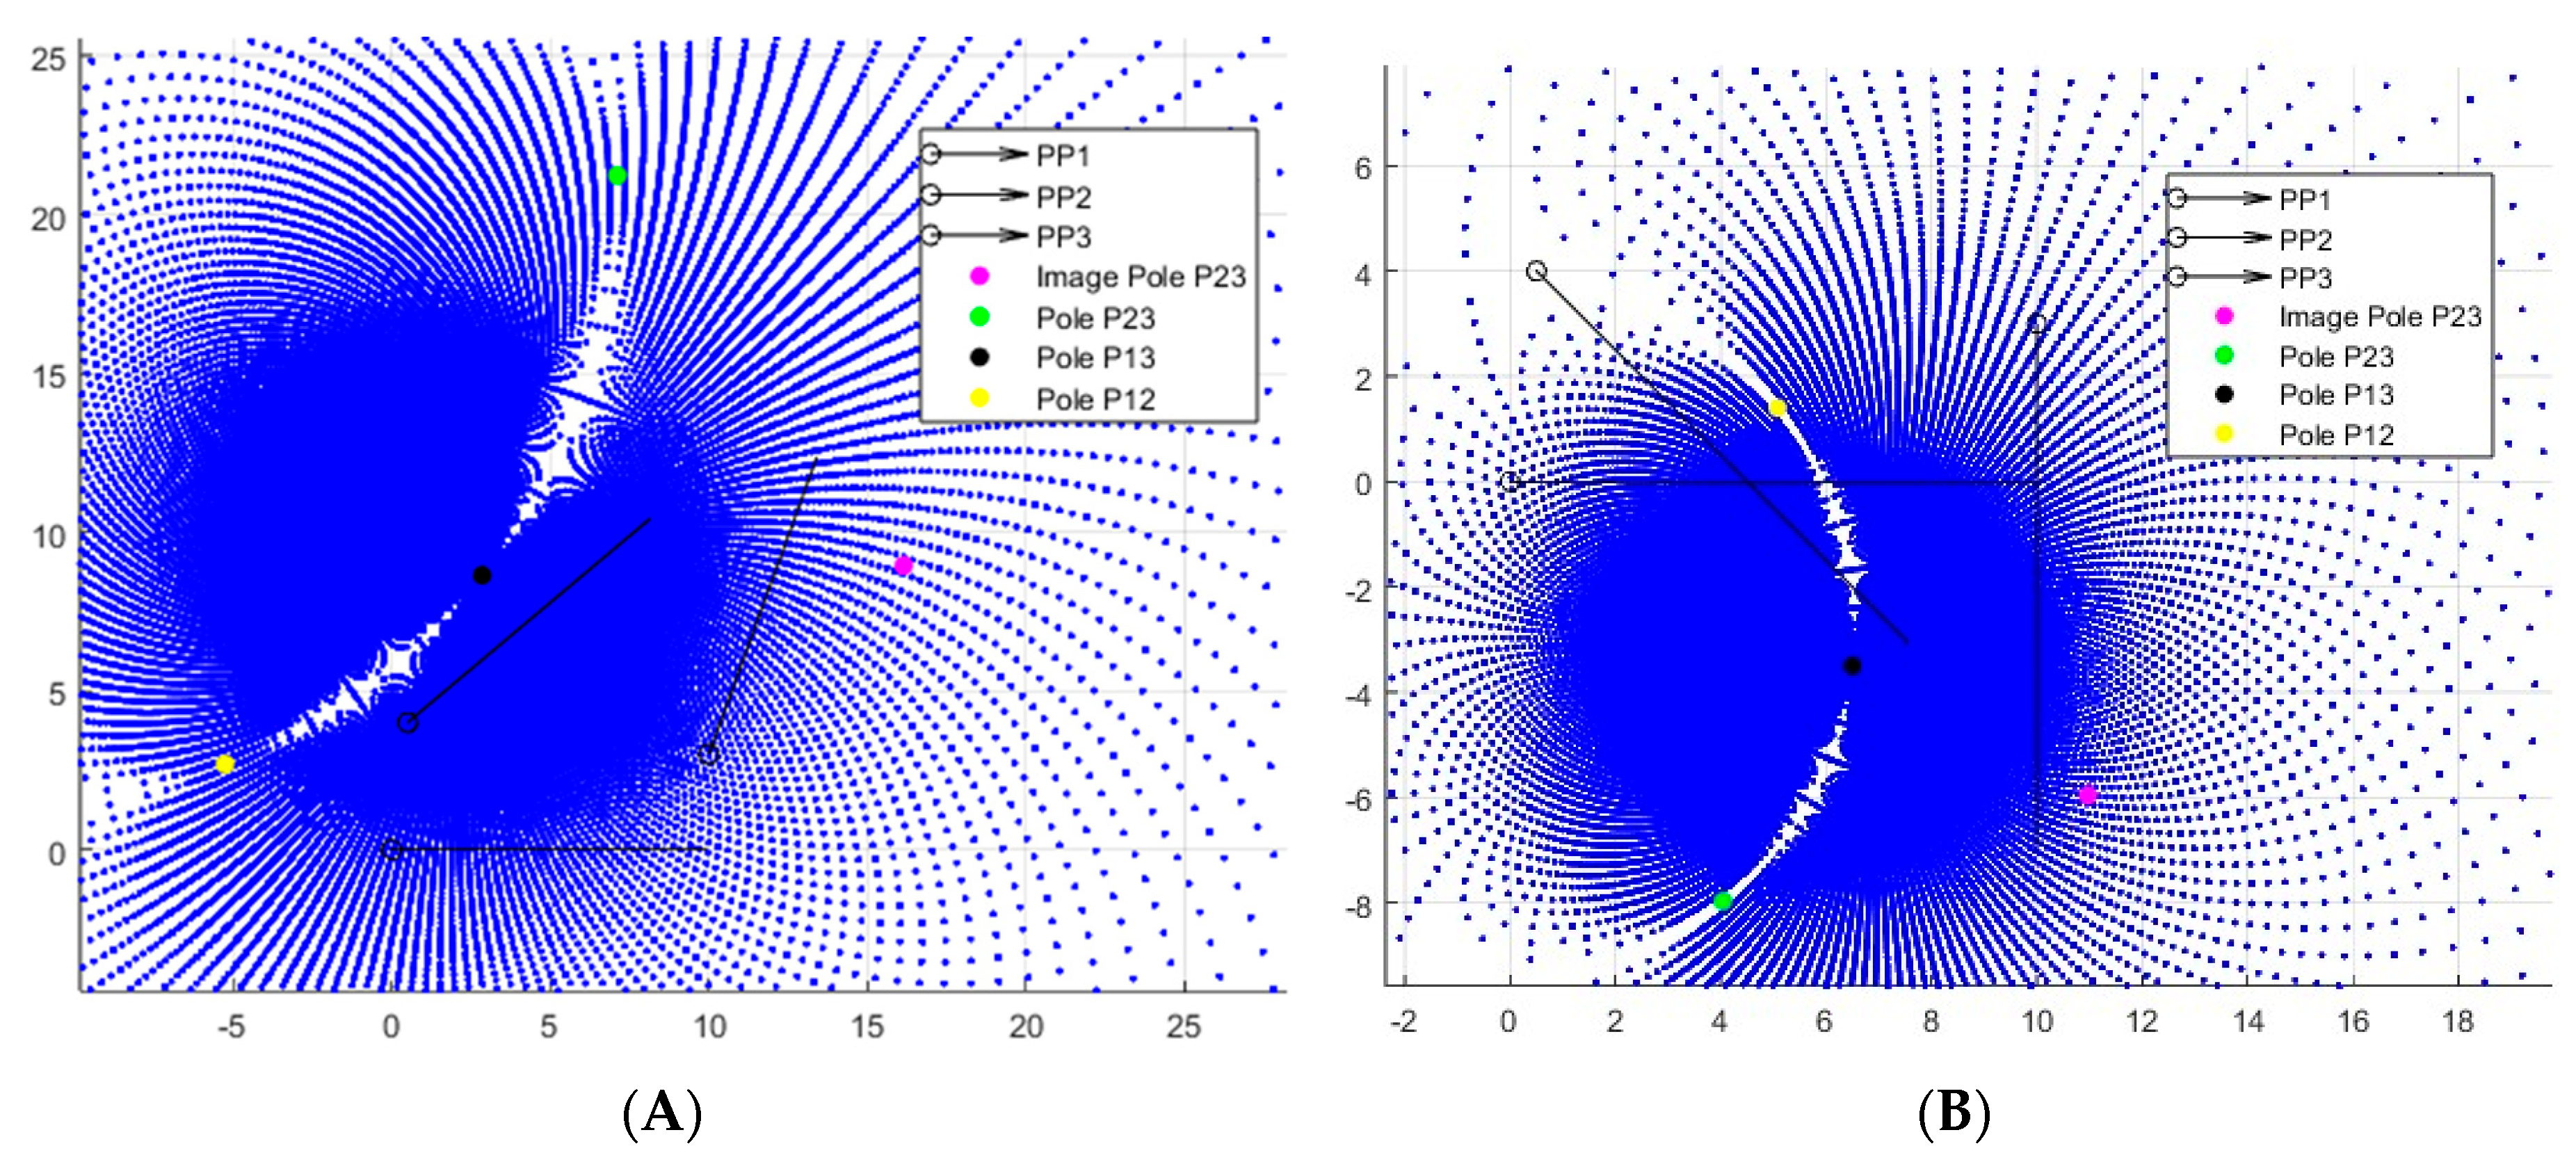
Table 3. The ground pivots must be positioned underneath the prescribed positions (and ideally a bit to the left), so the alpha values are adjusted to those shown in column α
b from α
a after observing the solution density plots shown in
Figure 10A,B. To adjust the problem, the designer may either use the equations shown in
Table 1 to directly find favorable values of
δj and α
j, or simply guess at ideal values and replot the poles until they are satisfied.
In this example, the criteria for a solution to be considered ‘passing’ are the following:
The ground pivots for dyads A and B of the base four-bar linkage must be inside the compartment of the coffee table. This range is selected as −3 < Oax < 12 in the X-direction, and −12 < Oay < 0 in the Y-direction. Both ranges are set relative to the first prescribed position in which the coffee table is fully closed.
The maximum length of a link does not exceed 6 inches. After analyzing a few preliminary solutions, it became clear that in a seven-bar mechanism, the links would almost certainly strike the side walls of the container if they were too long. As a result, this limit is initially set low at 6, with the opportunity to relax it to 8–10 inches if no solutions are found. *
In the first (closed) position, the moving pivots also must be contained within the bounds of the coffee table. These limits are the same as the first set.
The final requirement is to reapply criteria 1–3 to the synthesized cognates generated from the base four-bar linkages. For the sake of efficiency, the left and right cognates are not generated unless the base four-bar passes the first three criteria.
* Note that the link length filter applied in step 2 is a specific criterion tied to the application’s requirement that a large mechanism operate in a tightly confined space. This filter could easily be replaced or combined with any other filter examining a linkage property, like mechanical advantage at a position or average transmission angle. It would also be trivial to add a “sorting” filter after this step that does not reject any possible designs but organizes the list of solutions in order of a quantifiable performance metric like maximum link length or mechanical advantage.
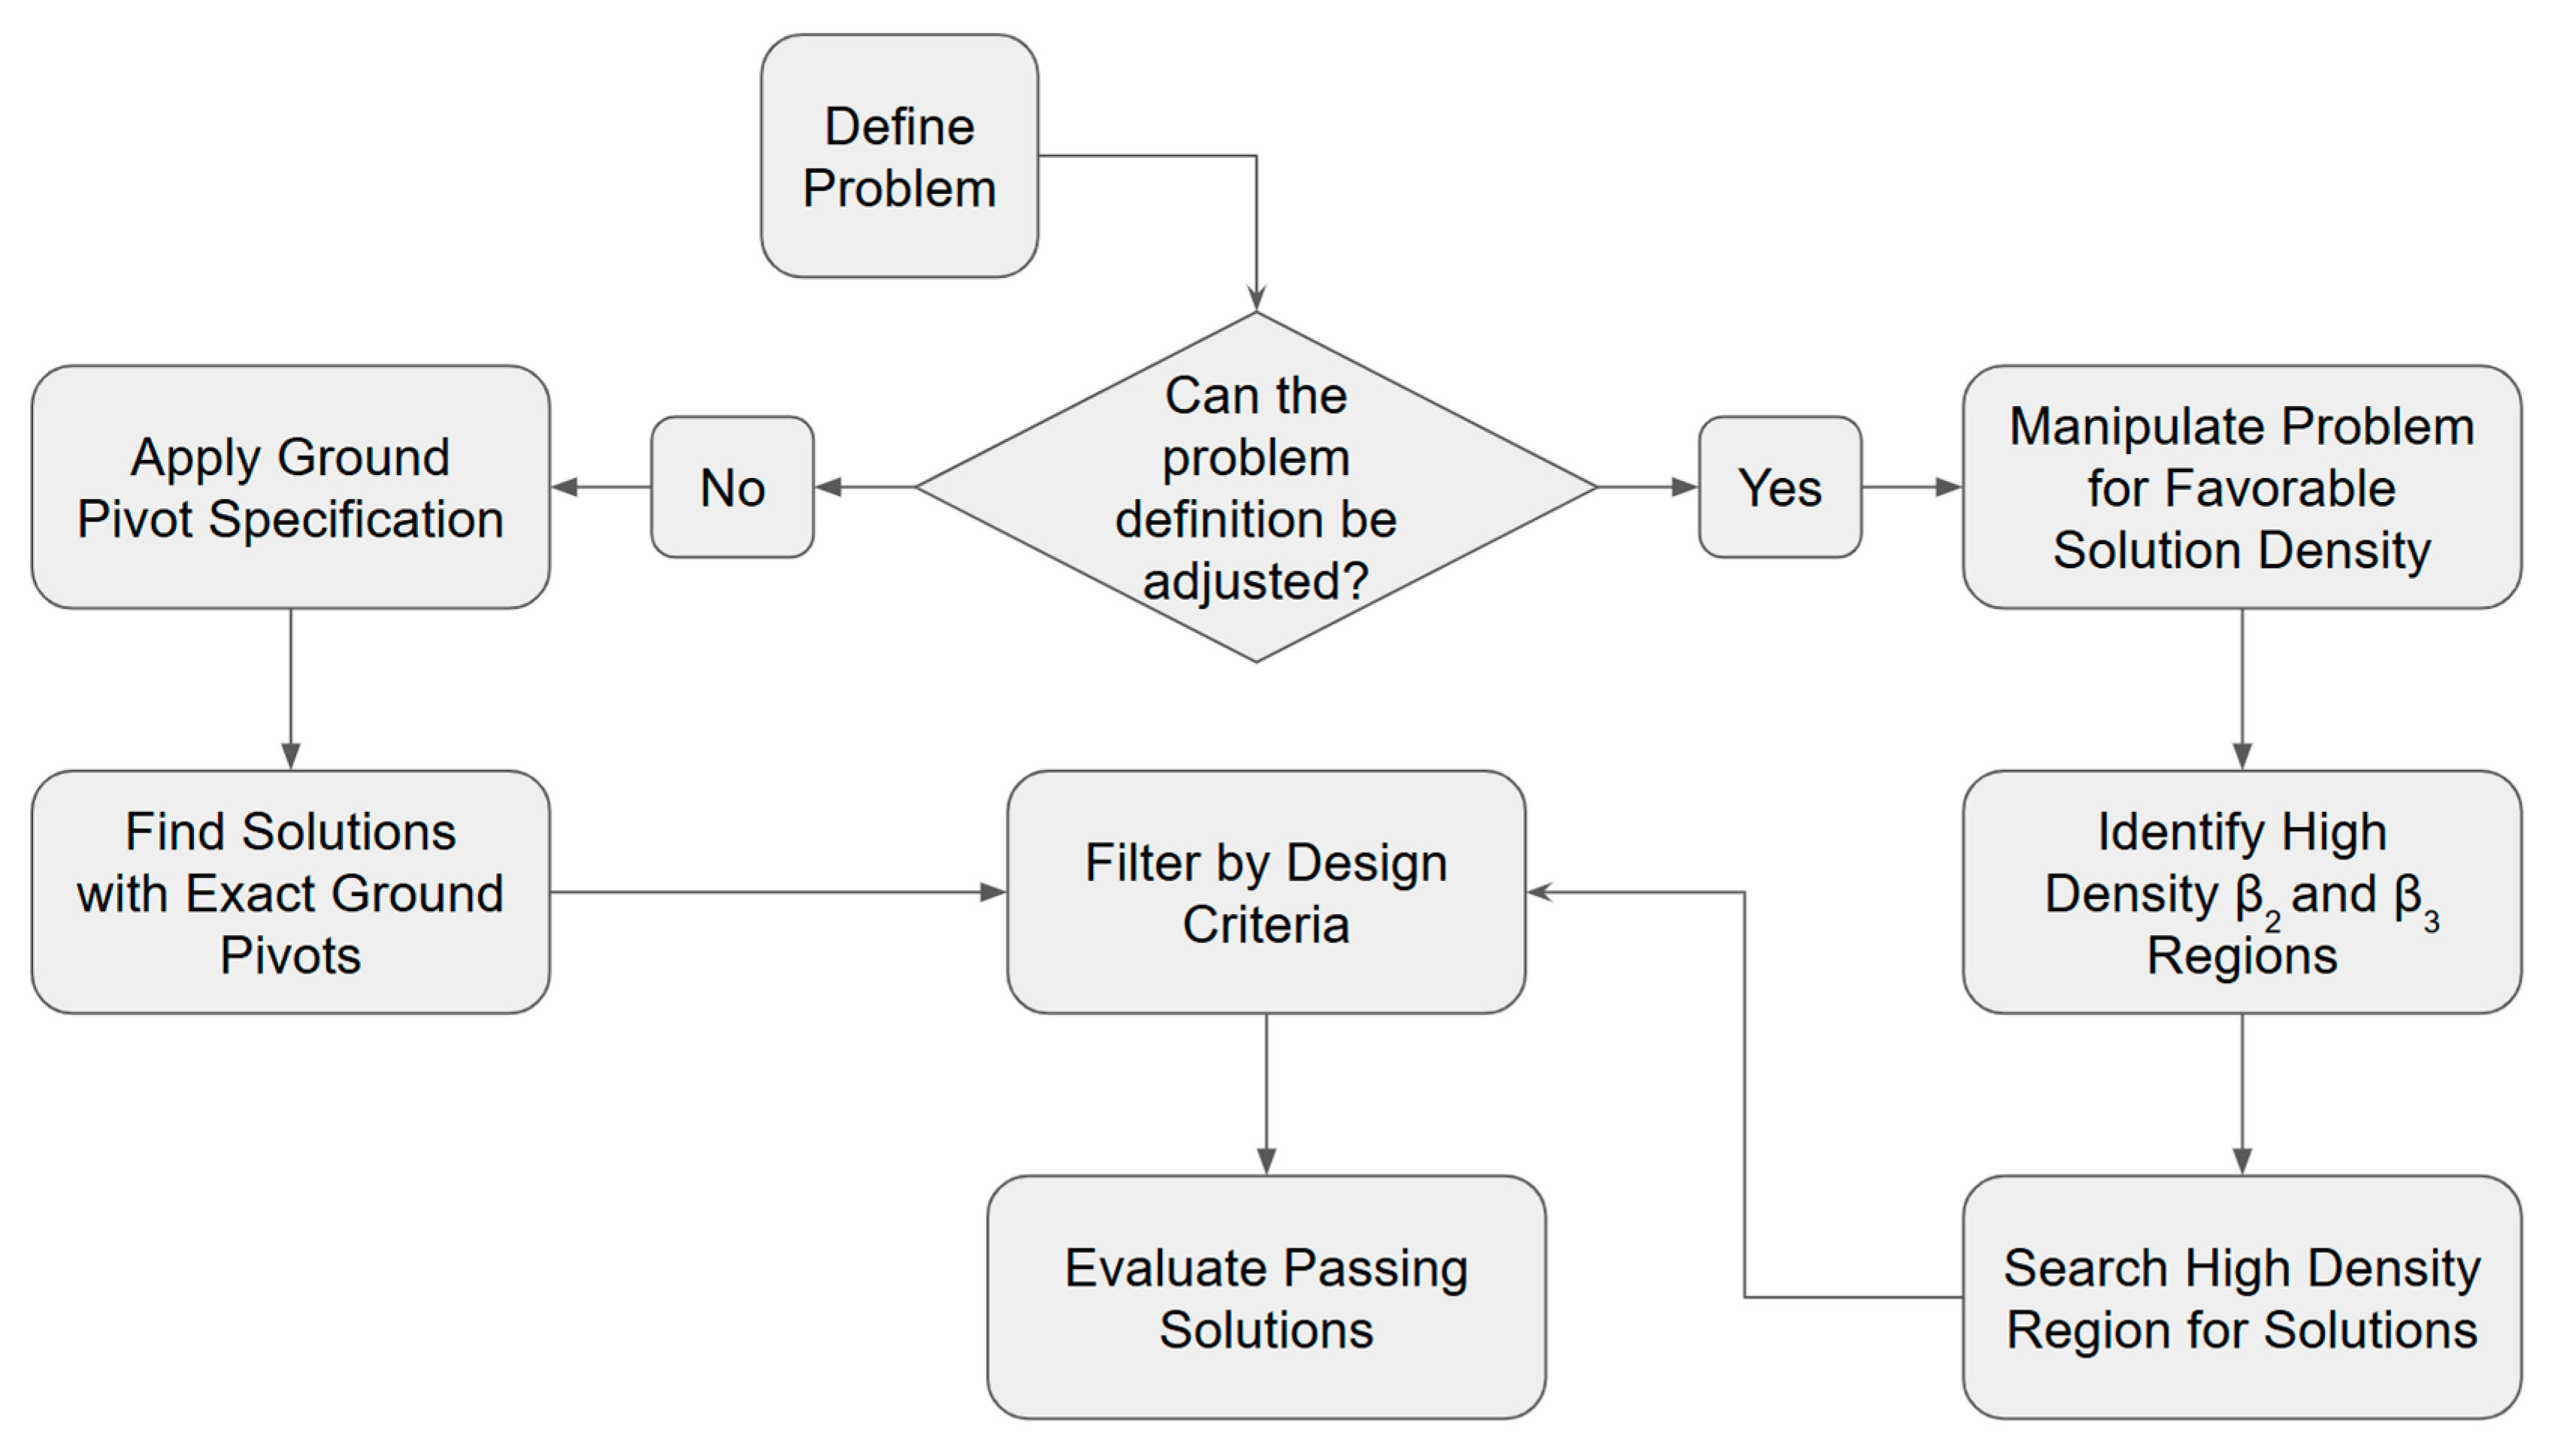
The flow chart shown in
Figure 11 summarizes the synthesis procedure.
Specifying the location of a ground pivot is a common problem in linkage synthesis, but setting the location of moving pivots is a similarly important, but less well-studied, task in kinematics. For the case of an internal hinge, like the one designed here that must reside entirely inside the coffee table in the first position, it is significant to verify that the moving pivots are in an appropriate location. To this end,
Figure 12 is generated, which shows the solution density map of the moving pivot locations in the first position. The figure confirms that there is a high density of moving pivot solutions inside the region defined as the inside of the table, increasing the odds of finding solutions.
Using the listed criteria to filter solutions, a reduced-scale grid search is applied. β
2a and β
2b are varied from −90° to 90° in 5° increments, while β
3a and β
3b are varied from −180° to 180° in 10° increments. This script takes less than 30s to run in MATLAB using version R2020b. In the α
b configuration of
Table 3—533 solutions pass the selection criteria on the search over the four beta values, totaling 1.67 million options tested (0.032% success). To put this in perspective, the same search algorithm operating over the α
a problem definition resulted in 0 passing solutions. If the maximum link length is expanded to 8 inches, 135 solutions pass the criteria (applying the same relaxation to the B configuration results in 52669 passing solutions, which is 0.008% passing on A and 3.154% on B). Not every one of these solutions found using the A configuration was specifically examined, but the majority ultimately fails because they are too wide, or the links pass through the top lid of the container at some point during the motion. For additional comparison, if the same script is set with the A configuration and runs with a 1° increment on each variable, it is estimated to take 150+ hours to complete. It is unknown how many solutions this version of the script produces because it was not feasible to complete the analysis. One of the identified solutions from the B configuration is analyzed in greater depth. The synthesized values that make up this linkage are shown in
Table 4.
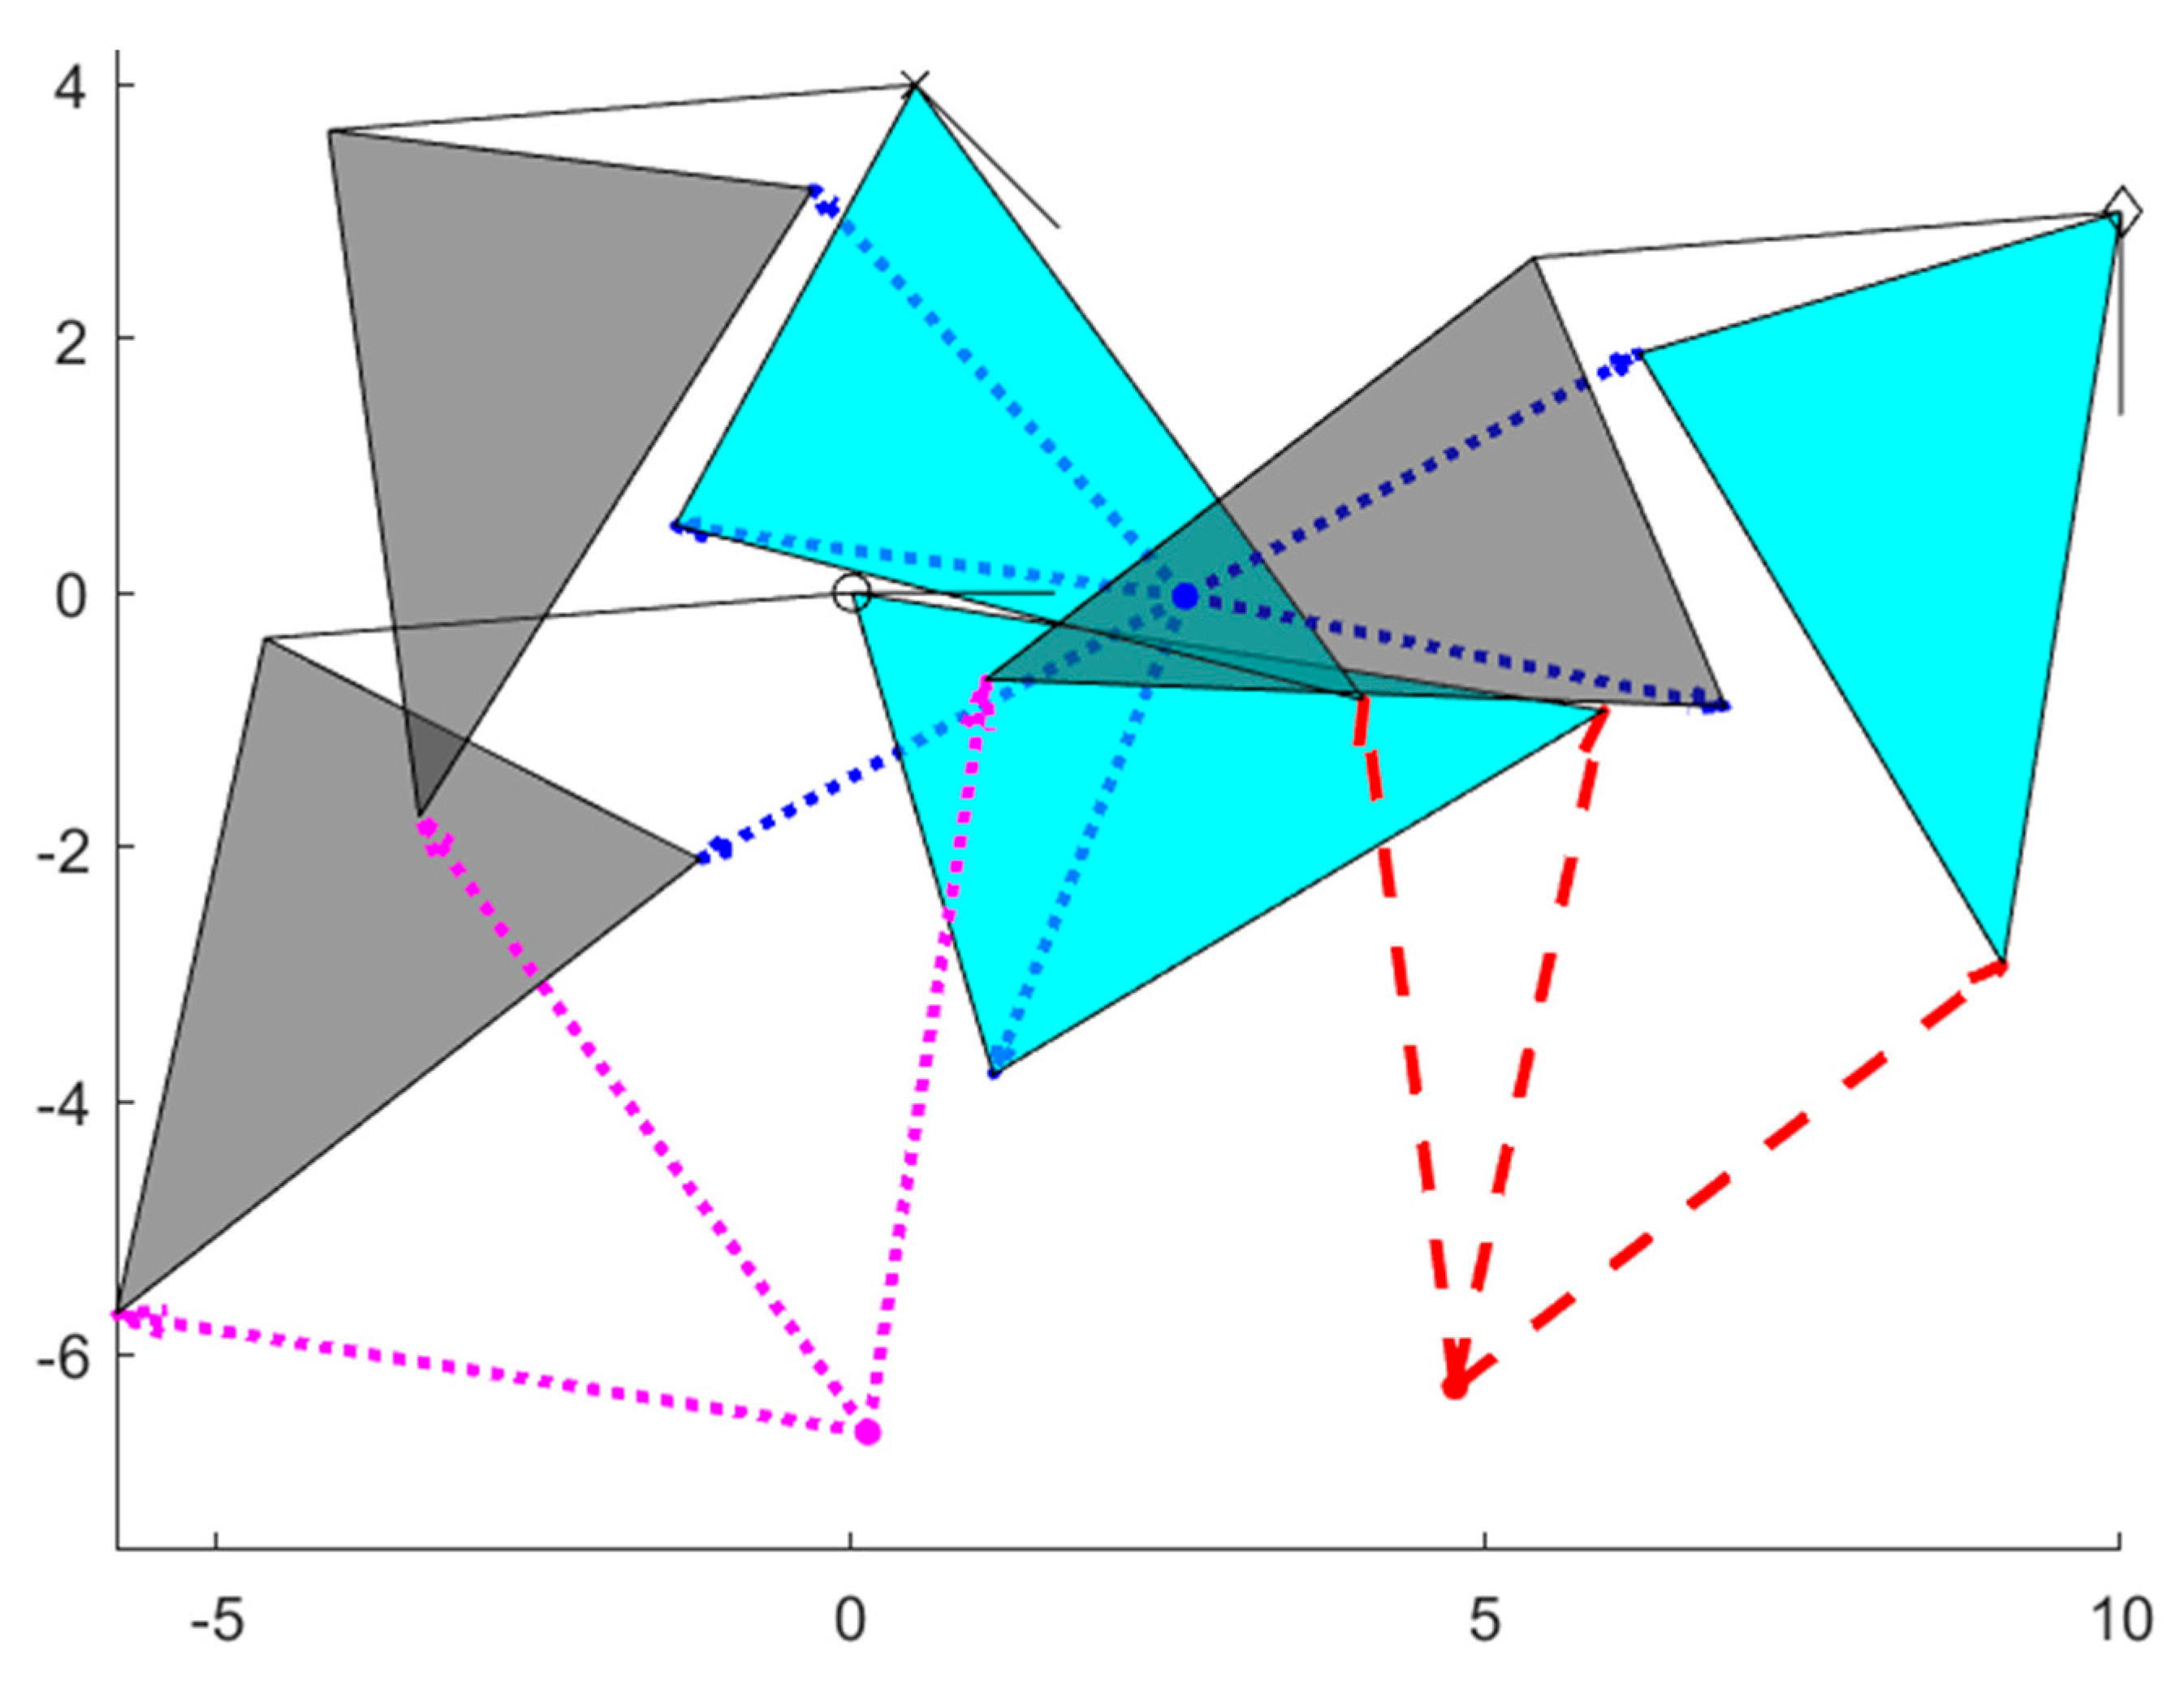
The MATLAB figure portraying the synthesized solution of
Table 4 is visualized moving through the three prescribed positions in
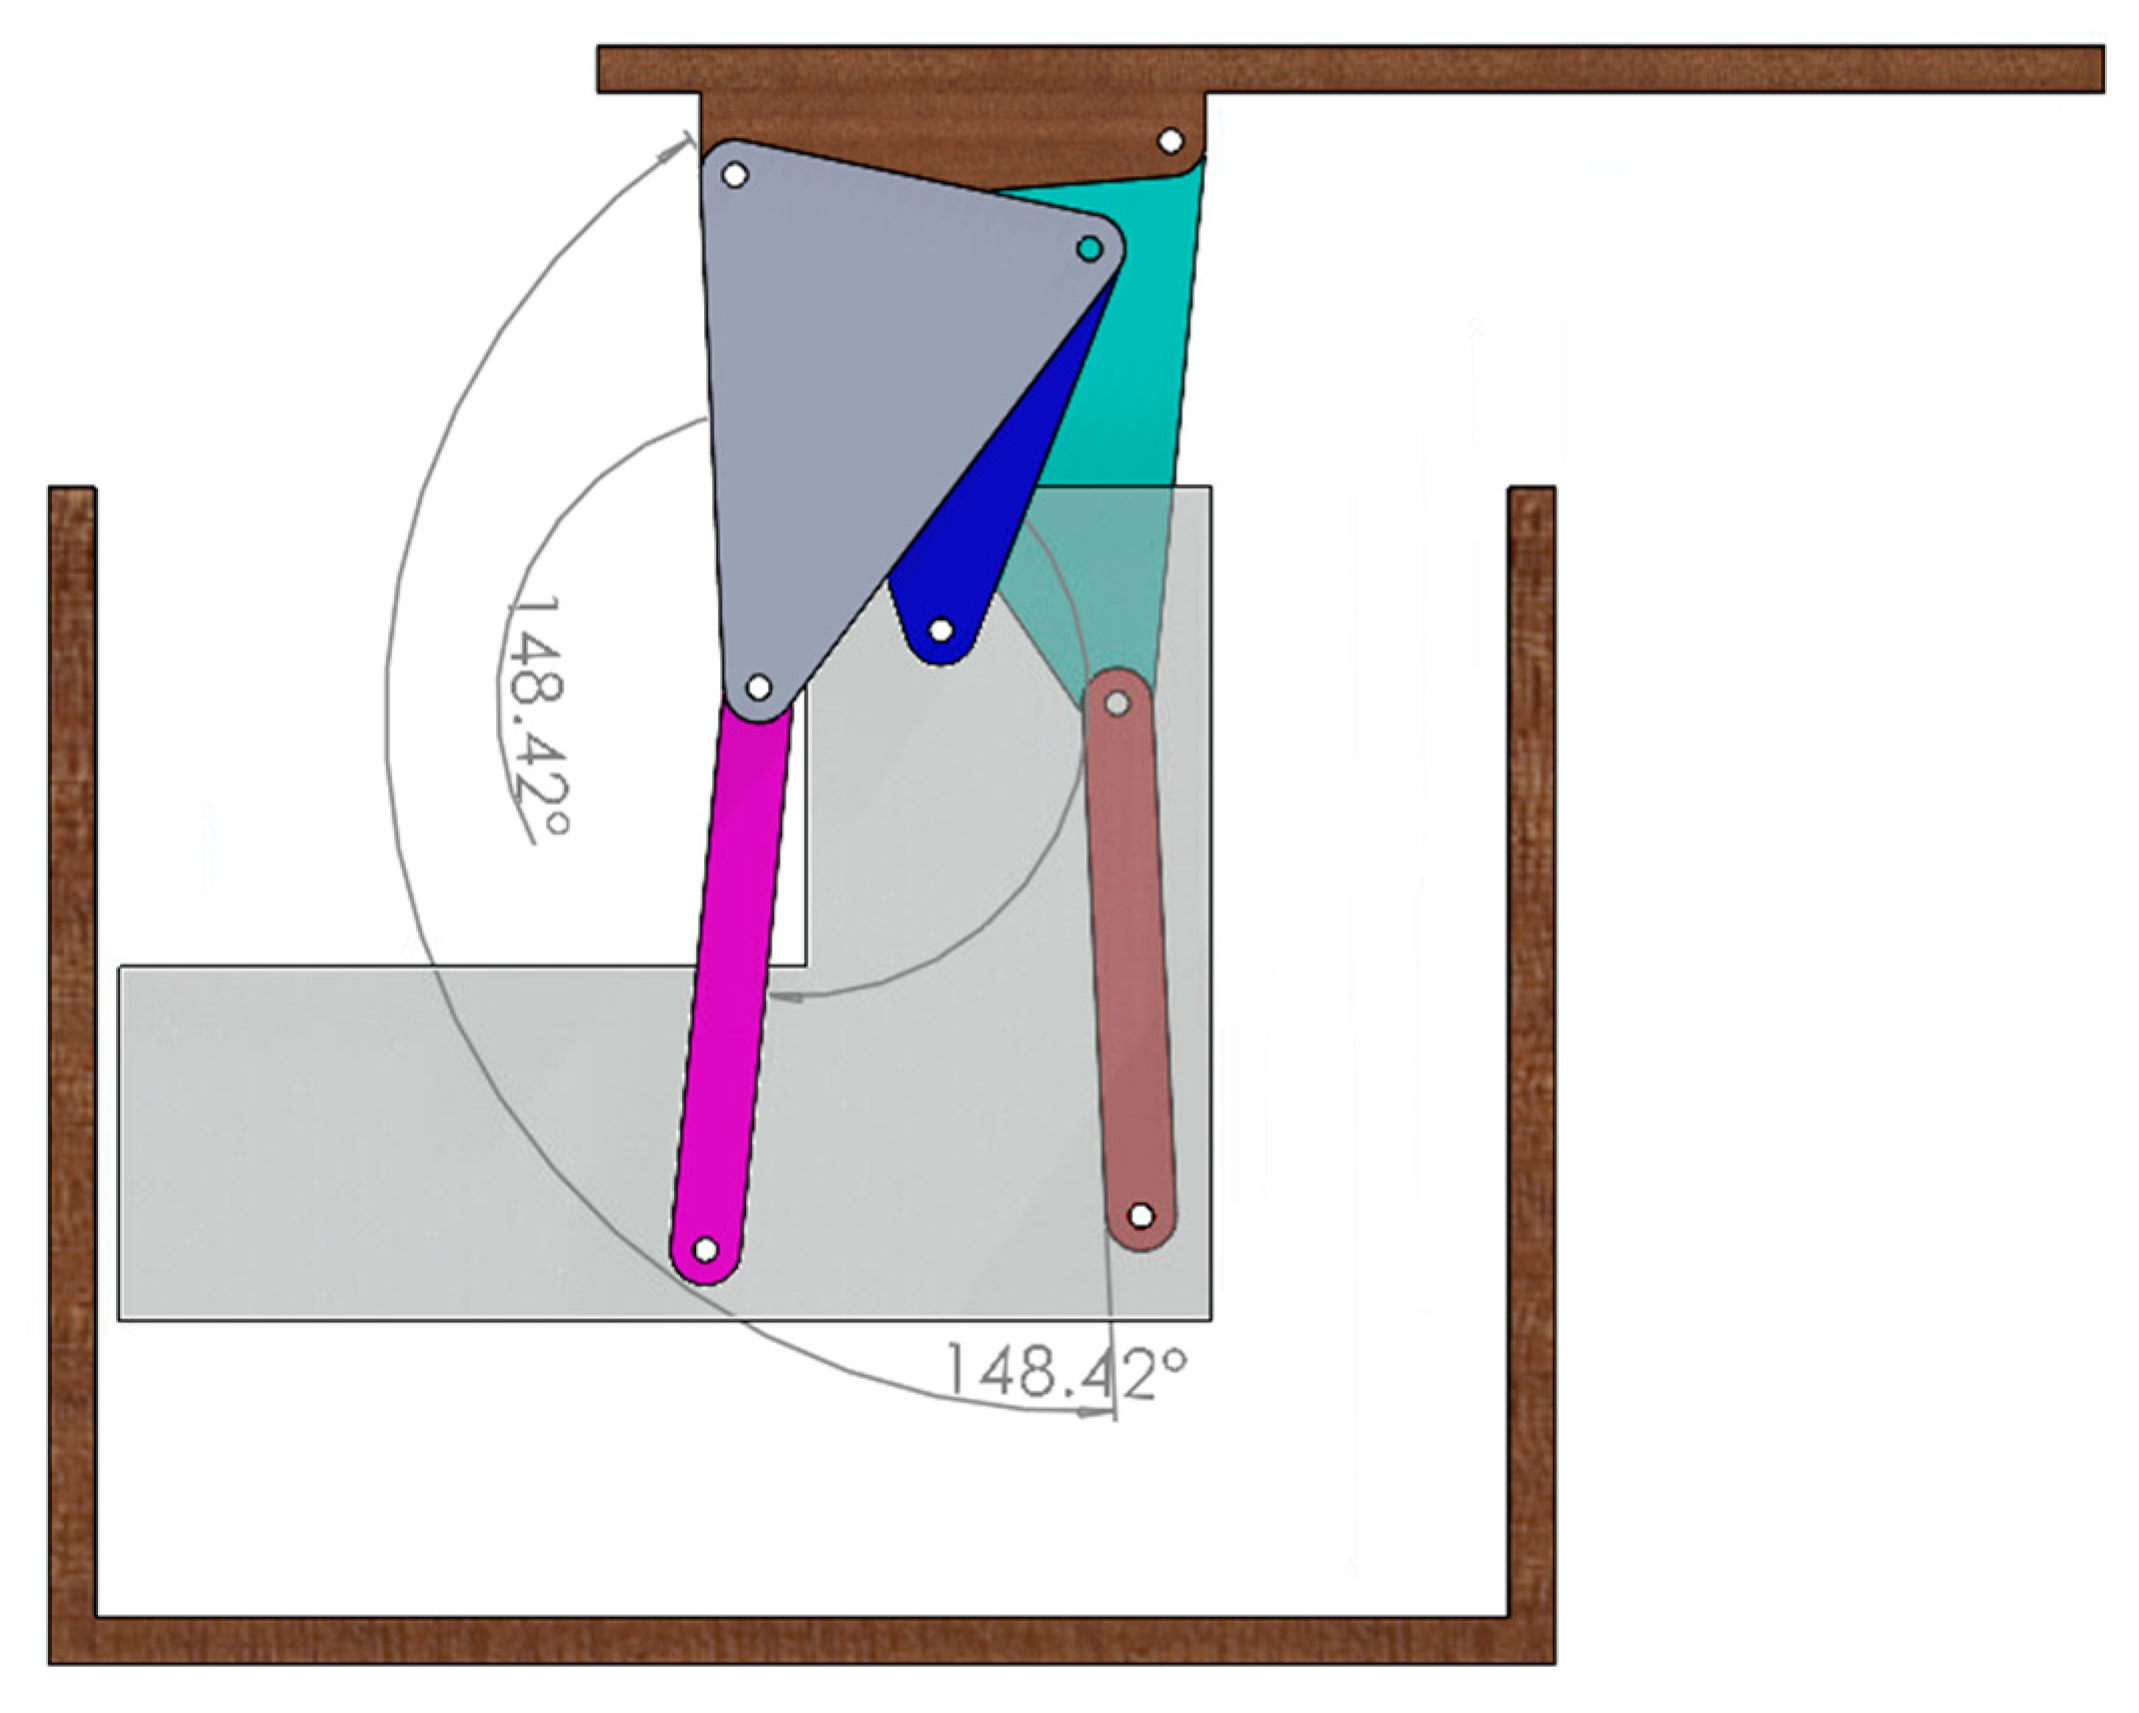
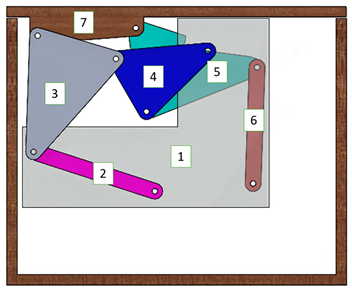
Figure 13. A CAD rendering of what a physical version of the mechanism might look like is shown in
Table 5. The primary goal in providing this example is to quantitatively demonstrate the impact of optimizing solution density as an intentional, isolated step in the kinematic synthesis procedure with a relative comparison to the performance of a blind grid search. Even so, a preliminary analysis and discussion of the kinematic properties of the selected solution are provided below.
Two modes of driving the mechanism are considered. First, a user could grab directly onto the tabletop, presumably at the front edge (consider
Table 5). Alternatively, an internal motor, either a rotary motor or a linear actuator, could apply an internal force to move the mechanism. For this second option, three primary links are considered as possible driving links. Links 2, 4, and 5 rotate in a single direction, making them well-suited to driving the mechanism. Links that rotate in a single direction throughout the full range of motion reduce ambiguity, as at the inflection point when the motor starts turning back in the other direction, it is uncertain whether the mechanism will continue forward or turn back. Of the three links, 2 and 4 are both connected to ground, making it easier to mount a motor to drive them directly without some form of geared setup.
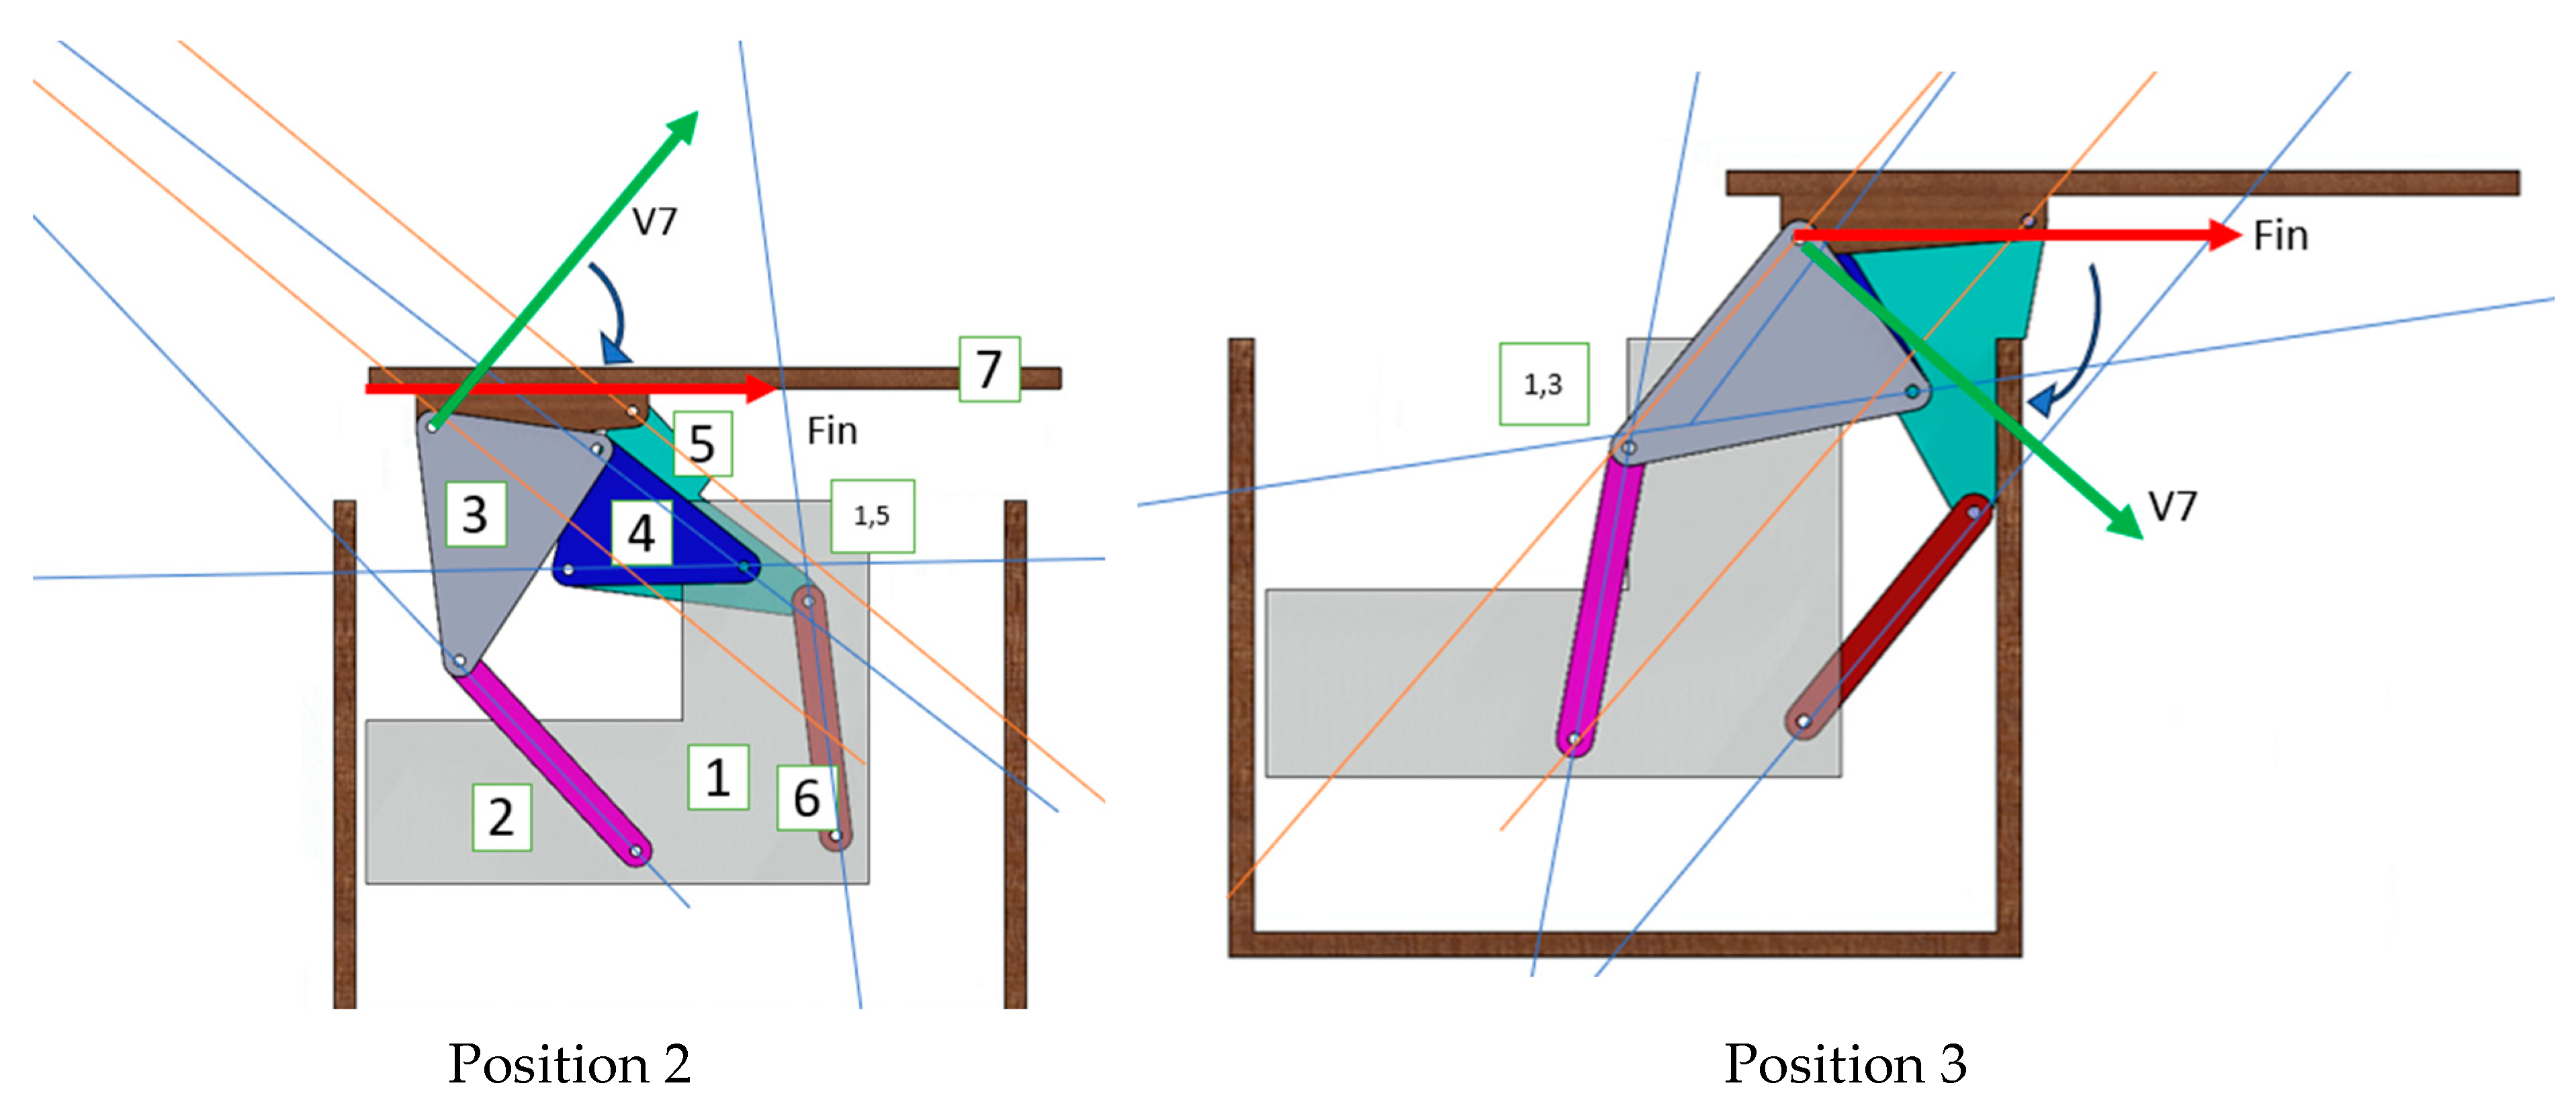
If the tabletop is driven directly, the user will be exerting a torque and lateral force, but the link is not rotating, so the torque will be largely distributed along the link into the ground pivots. One good indicator of how efficiently force is transmitted through the mechanism is the transmission angle. This angle is most ideal at 90°, but performance typically remains quite good at ranges above 65°. Notably, 30° is commonly chosen as the minimum value below which the mechanism cannot function reliably. The velocity direction of link 7 is determined using the instant center approach in position 1. In
Figure 14, note that the instant center (1,7) is an infinite line (like a slider) because the link is not rotating. Here, the transmission angle between a vertical force
Fin and the tabletop link velocity
V7 is 74°. Repeating this same method at positions 2 and 3, the transmission angles are 50° and 49°, respectively. The instant center calculations for positions 2 and 3 are shown in
Figure A4. Note that just after position 2, it is assumed the operator switches from applying a vertical upward force to a horizontal force—this force application should feel natural, matching the up and back motion of the tabletop.
If the linkage is driven by a motor instead of directly grabbing the tabletop, it is important to verify that the motor can transmit power throughout the linkage in the entire range of motion. Examining the case where link 2 is driving the mechanism, unfortunately, this results in a position where the transmission angle between links 2 and 4 reaches 0° between positions 2 and 3, as shown in
Figure 15. If a different link is driven for the remainder of the motion, link 2 remains motionless after reaching this position. That makes relying on link 2 as the sole driver of the system impossible.
If instead the user drives link 4, an interesting property of the cognate parallel-motion linkage is observed—the transmission angles on either side of the central link are always the same. Throughout the motion, the angles are generally quite good, with the single exception shown in
Figure 16, where the transmission angles dip down to 32°. Although this is technically above the 30° threshold, these low angles are still a warning sign for the mechanism’s motion. Fortunately, they occur when the tabletop is near its peak height, hopefully mitigating the losses from lifting against gravity with poor force transmission.
A middle-ground option may be to drive the linkage by driving the tabletop directly, but to add an internal torsion or linear spring to assist the user in actuating the linkage. This would make the tabletop feel lighter during the lift between positions 1 and 2 and would help keep the tabletop in the open position until the user intentionally pulls it closed. This option will also be cheaper/easier to manufacture than a motorized version.
5. Advantages and Limitations of the Proposed Technique
The method of optimizing solution density is demonstrably effective in generating more solutions to a given problem when testing an equal number of candidate values (a higher percentage of synthesized links pass design requirements). For completeness, it is important to emphasize that the proposed technique is not based on new dimensional synthesis equations. The underlying math is identical to the MK circle method, an approach based on solving the synthesis equations with linear algebra. Rather, optimizing solution density is an optional added step in the normal workflow for any exact or mixed exact-approximate synthesis problem. Once learned, this technique only takes a few minutes to implement in a new problem and guarantees a high volume of solutions with ground and/or moving pivots in favorable regions. The core advantages of the technique are that it increases the probability of finding a good solution (in the case of the coffee-table example, applying the technique increased the number of solutions from 0 to 533 on a search of 1.67 million options) and increases a designer’s understanding of the solution space. There is no guarantee that this approach will yield better linkage solutions—rather, the intent is to encourage designers to integrate this novel, intuitive step into their existing planar linkage synthesis workflow, saving time overall and improving the quality and consistency of the synthesis process.
With these benefits in mind, it is worth noting some of the limitations of the approach and identifying areas for future work. First, the method of optimizing solution density does not guarantee that the synthesized linkages will have favorable properties (transmission angle, mechanical advantage, etc.). Rather, the focus is on ensuring there are solutions to the prescribed problem while minimizing the computational load required to find them. With that said, optimizing solution density does tend to increase the probability of finding favorable solutions. As shown in the practical example, an optimized problem yields more solutions over the same search depth, and solutions tend to have shorter link lengths. There are exceptions, especially in cases where α2, α3, or α23 are nearly 0 (slider point), or the case where α = β (concurrency point). In these cases, the poles are infinitely far away, increasing the length of the links unless they are fully replaced with sliders. Shorter links are favorable for designers hoping to manufacture the synthesized mechanism or fit it in a confined space, and short output links are often associated with high mechanical advantage.
Another limitation is that applying this method is dependent on having some degree of flexibility in the problem definition, either in the positions (δ), the angles (α), or ideally, both. If a problem definition is truly inflexible and each position must be reached exactly, a different synthesis approach must be applied. Similarly, this method is most effective when applied to problems with ideal ground pivot regions, rather than singular ideal ground pivot points. In the case where an exact ground pivot position is required, the designer may use the method of exact ground pivot specification.
6. Conclusions and Future Work
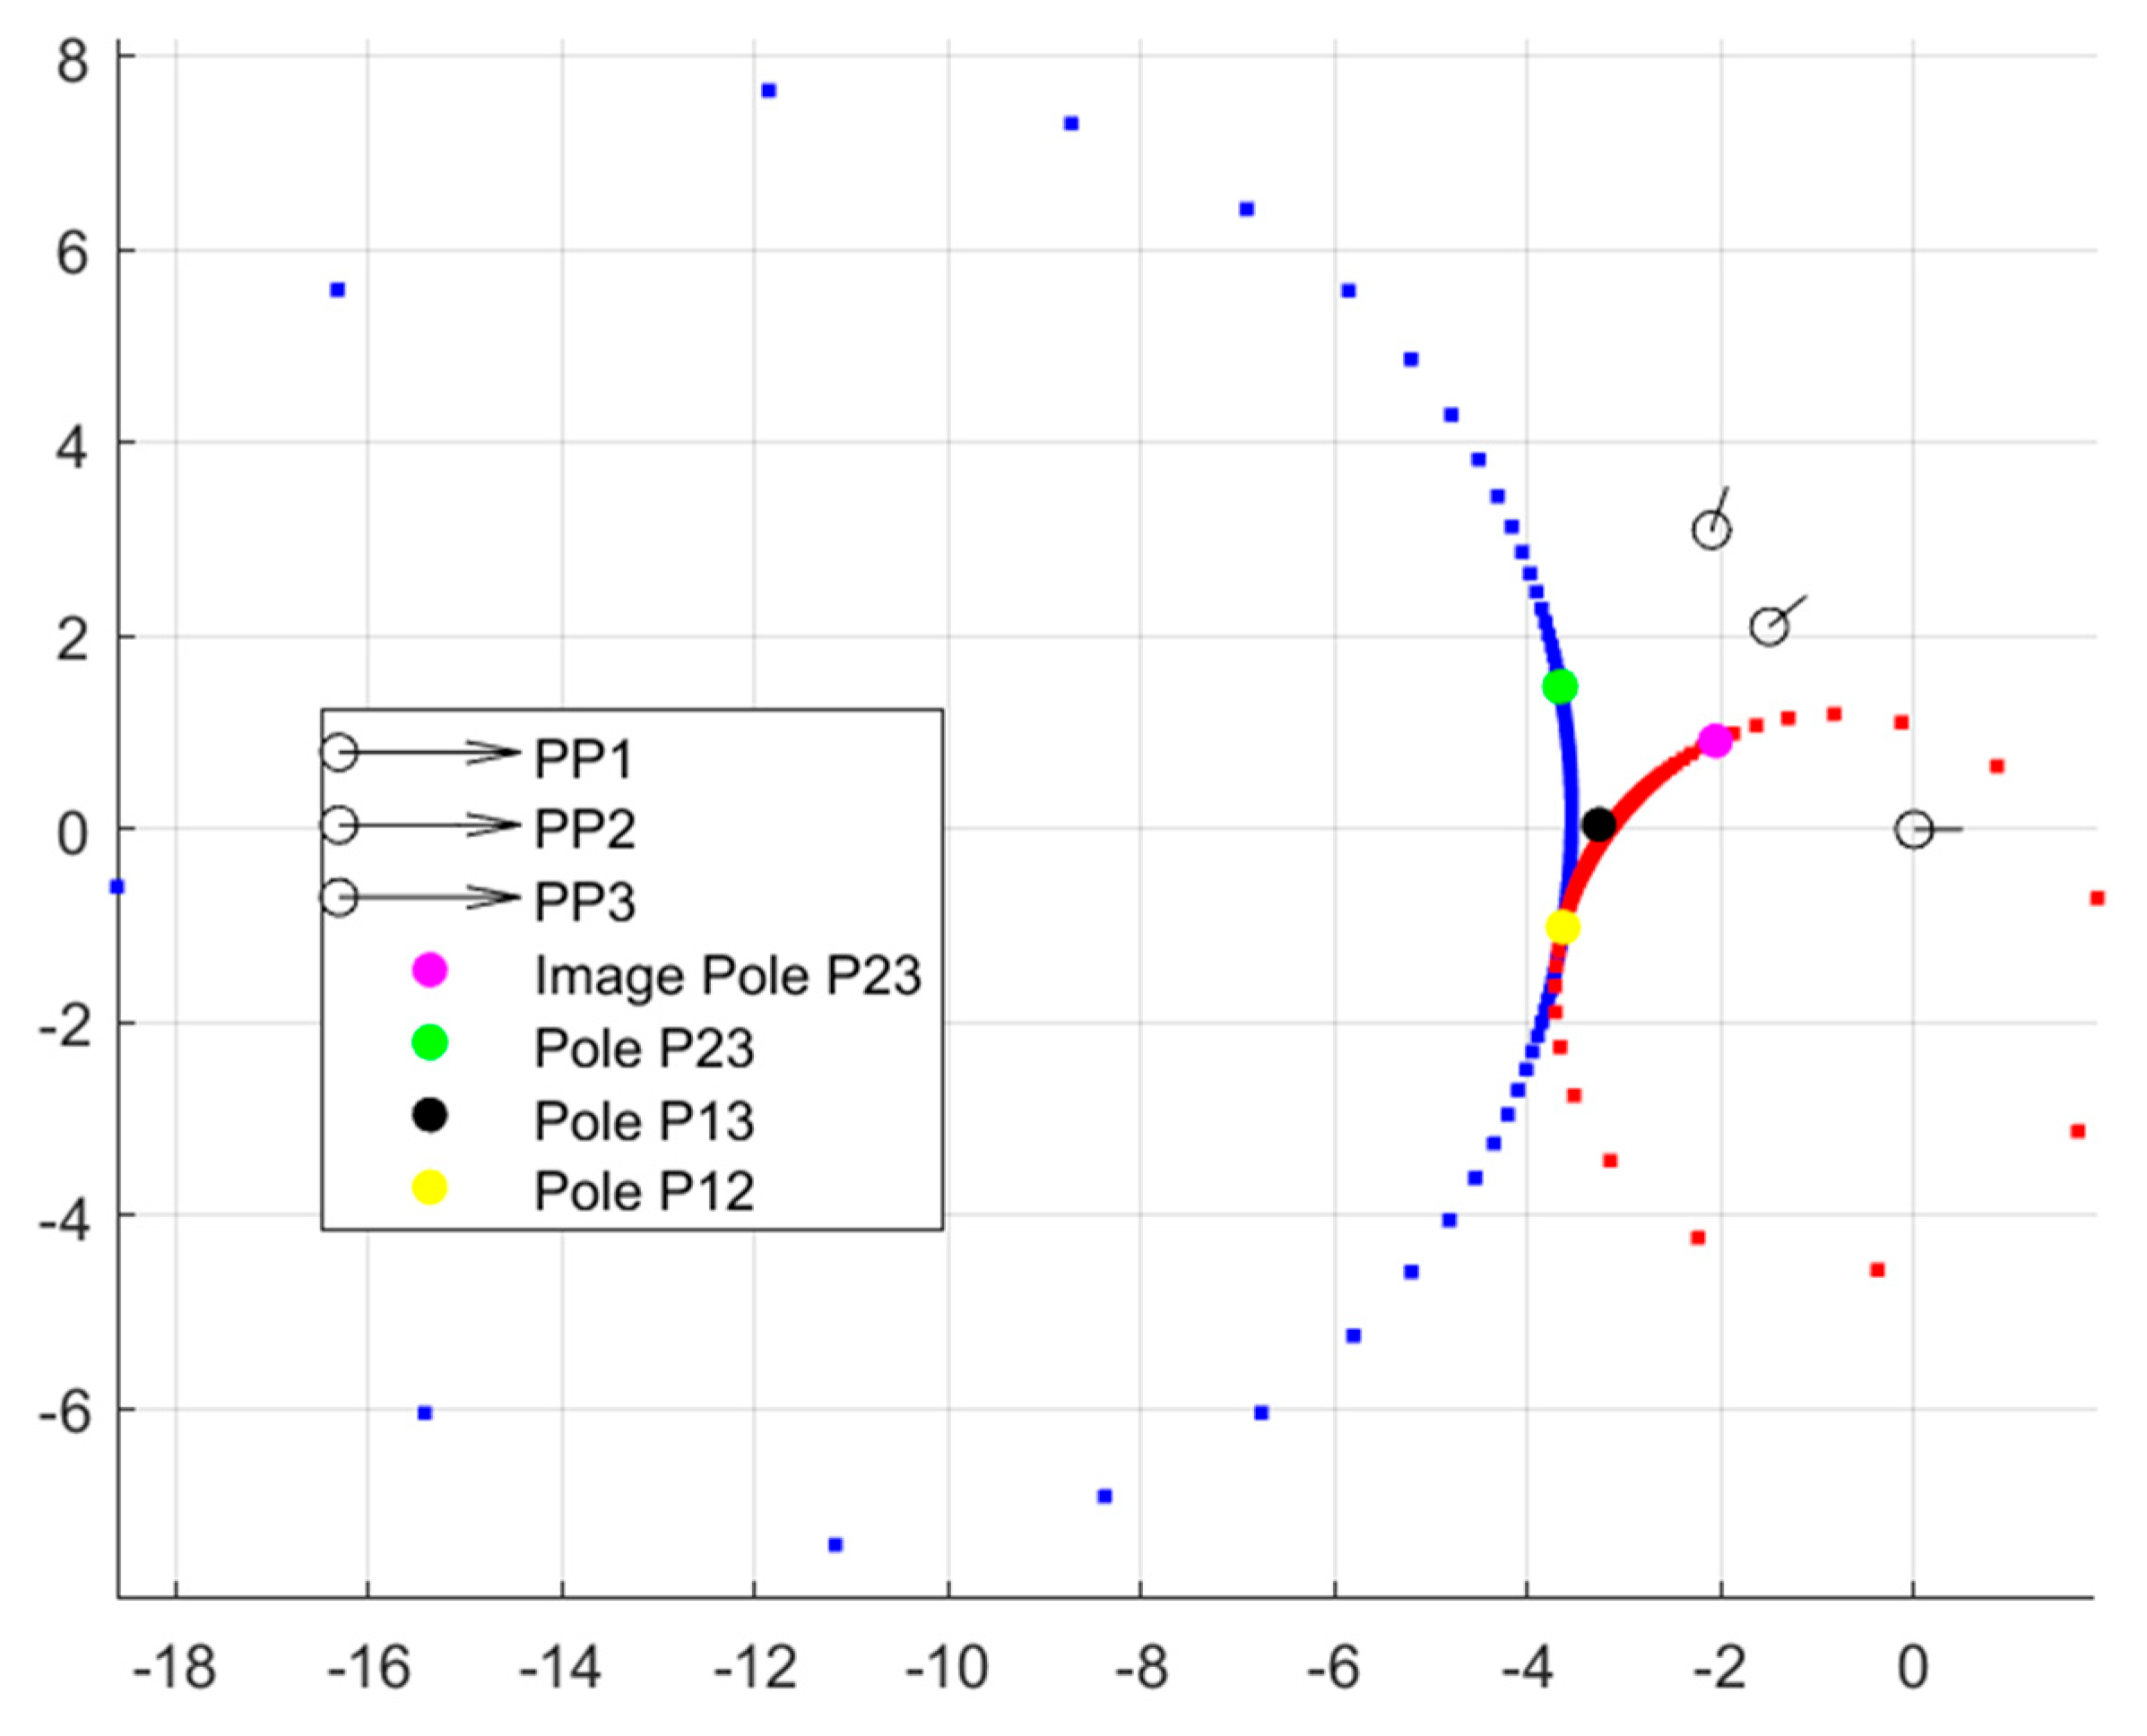
This paper has presented the foundations of linkage synthesis aided by optimized solution density. The method allows a user to manipulate their problem parameters, creating a configuration that ensures a high volume of solutions with pivot locations in the prescribed region. The method is demonstrably effective in identifying a greater number of solutions at equal search depth, and in many cases, like the one provided here, those solutions also exhibit better properties than the alternatives. With this foundation in place, there remain several opportunities for future work. The first is to expand the approach to also apply to triad chains, not just dyads. For most synthesis methods, adapting to triads only requires expanding the standard form equations to accommodate an additional vector. In this case, the process is a bit more involved. The same basic solution density plot can be generated (example shown in
Figure A7), but interpreting the figure is not as simple as the dyad plot. Some preliminary work on this topic has been completed and is shown in
Appendix C, but the majority of the effort is left for future work.
Another opportunity for future work is identifying explicit equations for how the density varies relative to position in the plane rather than just the free-choice variables. An equation of this form would be valuable for numerically representing the density. Examining the plots makes it clear to see how solution density varies in the plane. Still, it would be beneficial to know the solution density properties of the plane more exactly without needing to plot the solutions. A general equation for either (or both) primary directions would also just be valuable in deepening our understanding of the dyad solution space.
A few more areas for future work are in representing and plotting the density information. Plotting individual pivot points is reasonably effective in demonstrating where density is highest, as shown in this paper. However, in the highest density regions, the points get so close together that they look like a continuous mass rather than discrete points. That makes it difficult to differentiate the true highest density position from a general high-density region. What might be more effective is to use a heat map plotting style that uses color to represent the third dimension, density, in a 2D plot. The challenge with setting up this type of plot is that the density quantity varies non-linearly in multiple dimensions, and without explicit equations for the density in each of these dimensions related to their position in the plane, the overall density is difficult to calculate. This task is left to future research. A similar objective is to create a density map that represents multiple moving pivot locations. In the example provided here, the position of the moving pivots is most essential in the first position, as all links need to be contained inside the box. In other cases, though, like a mechanism moving through a confined space, it may be necessary to ensure that the moving pivots are within an acceptable region in all positions. Representing where the moving pivots will be in each position would also be valuable information to the designer.
