Article

Stator Fault Diagnostics in Asymmetrical Six-Phase Induction Motor Drives with Model Predictive Control Applicable During Transient Speeds †

by
Hugo R. P. Antunes
*,
Davide. S. B. Fonseca
,
João Serra
and
Antonio J. Marques Cardoso
CISE—Electromechatronic Systems Research Centre, University of Beira Interior, Calçada Fonte do Lameiro, P-6201-001 Covilhã, Portugal
*
Author to whom correspondence should be addressed.
This article is a revised and expanded version of a paper entitled “Stator Fault Diagnostics in Asymmetrical Six-phase Induction Motor Drives with Model Predictive Control under Transient Regimes”, which was presented at 2024 International Symposium on Power Electronics, Electrical Drives, Automation and Motion (SPEEDAM), Napoli, Italy, 19–21 June 2024.
Machines 2025, 13(8), 740; https://doi.org/10.3390/machines13080740
Submission received: 10 July 2025 / Revised: 11 August 2025 / Accepted: 13 August 2025 / Published: 19 August 2025
(This article belongs to the Section Electrical Machines and Drives)

Abstract

Abrupt speed variations and motor start-ups have been pointed out as critical challenges in the framework of fault diagnostics in induction motor drives, namely inter-turn short circuit faults. Generally, abrupt accelerations influence the typical symptoms of the fault, and consequently, the fault detection becomes ambiguous, impacting prompt and effective decision-making. To overcome this issue, this study proposes an inter-turn short-circuit fault diagnostic technique for asymmetrical six-phase induction motor drives operating under both smooth and abrupt motor accelerations. A time–frequency domain spectrogram of the AC component extracted from the q-axis reference current signal serves as a reliable fault indicator. This technique stands out for the compromise between robustness and computational effort using only one control variable accessible in the model predictive control algorithm, thus discarding both voltage and current signals. Experimental tests involving various load torques and fault severities, in transient regimes, were performed to validate the proposed methodology’s effectiveness thoroughly.

1. Introduction

Multiphase induction motor drives embody higher reliability and superior fault-tolerance when compared to the three-phase ones, mainly due to the merit of phase redundancy [1,2]. This key feature allows the motor to start or maintain operation even in the event of one or more open-phase faults, yet with derated performance. Additional technical benefits such as torque ripple mitigation, improved power distribution among stator phases, a reduction in the rated phase current compared to three-phase machines, and lower current harmonics in the DC-link capacitor, mutually contribute to reduced mechanical and thermal fatigue on motor components, thereby extending the machine’s operational lifetime [3]. Such aspects make multiphase induction motors highly recommended for critical applications, meeting the rigorous requirements of industries where uninterrupted operation is paramount to prevent financial losses or power outages. Consequently, the use of three-phase redundant systems in such applications becomes avoidable. Therefore, the use of multiphase motor drives, exemplified by asymmetrical six-phase induction motor drives (A6PIMs), provides a strong and dependable solution, capable of sustaining efficiency in unforeseen scenarios [4].
To take full advantage of the multiphase induction motor drive features, the implementation of an optimal control strategy, which controls the system variables is necessary. In this context, different control strategies, such as direct torque control (DTC), field-oriented control (FOC), and model predictive control (MPC), have been reported in the literature as optimal solutions. MPC has notably been in the limelight for electrical drives over the past decade. The reports claim an improved inherent fast dynamic response, simple structure, and easy inclusion of system constraints, when compared to the classical ones [5,6].
Inter-turn short circuit faults (ITSCFs) are more prone to appear during start-up or speed variations due to the sudden increase in current amplitude. This susceptibility can be further worsened, particularly in inverter-fed electric motors, by the semiconductors’ high switching frequency. The occurrence of an ITSCF produces additional thermal stress in the contact point between the turns of a coil, owing to the formation of current loops. If not identified in a timely manner, such thermal stress gradually deteriorates the insulation around the adjacent turn, promoting the spread of the fault [7,8,9]. The ITSCF develops a negative sequence current that, by joining to the positive sequence one, forms an asymmetric phase system. This way, fault symptoms arise in the motor currents. The majority of the existing ITSCF diagnostic techniques are to be applied in steady-state operation. As a result, during the motor start-up or speed variation conditions, ITSCFs cannot be properly detected, compromising the diagnostic. Therefore, ITSCF detection in motor start-up or during abrupt accelerations is of major importance. No less important is the detection of motor faults under these circumstances, as well as the cumulative influence of the closed-loop control strategies adopted. The current compensation imposed by closed-loop control strategies is known for masking the fault symptoms, making fault detection ambiguous [10,11].
The literature highlights a large number of ITSCF diagnostic methods for motor drives, with most reports on closed-loop-control focusing on three-phase permanent magnet synchronous motors (PMSMs) and three-phase induction motors (3PIMs). Signal-based methods such as q-axis reference voltage signature analysis using wavelet transform (WT) [12], d-q plane current spectrum analysis using fast Fourier transform (FFT) [13], and high-frequency signal injection [14] were applied to three-phase PMSMs driven by FOC. Additionally, methods based on the analysis of the zero-sequence voltage component using low-pass filters [15] and WT [16], as well as the use of WT for analyzing features extracted from the cost function [17] were also explored in the same motor type but using MPC. These methods present effective results in steady-state conditions. However, the performance of the fault indicators under transient speed or abrupt accelerations are not addressed, which significantly limits their practical applicability in scenarios involving dynamic operation.
Model-based techniques also offer an alternative direction for fault diagnosis in three-phase PMSM drives. One approach involves analyzing the d-q subspace current residuals, calculated by subtracting the measured motor currents from those given by an analytical model, to detect ITSCFs in a three-phase PMSM drive using FOC [18]. The fact that its effectiveness is only tested under steady-state conditions, combined with the requirement for accurate motor parameter extraction in model-based techniques, limits its applicability. For six-phase PMSMs, driven by FOC, studies [19] and [20] detect and locate ITSCFs, respectively, adopting a similar approach that follows the same principle as [18], yet the analysis is concentrated on the x-y subspace current residuals. Although [19] fundamentally validates the effectiveness of the approach under steady state conditions, the authors also demonstrate its effectiveness under an abrupt acceleration scenario. However, such methods are complex, rely on filters, which require the careful tuning of the parameters, and the method’s extension to other motor types require mathematical motor model adaptations.
As for 3PIM drives adopting FOC, signal-based techniques, such as the analysis of the voltage references and control path decoupling signals [21] or changes in the negative sequence impedance component [22], were put forward. Other signal-based methods, including the analysis of the instantaneous active and reactive power signatures through FFT [23], and sequence components impedance matrix [24] were tested in 3PIM drives using DTC. In the same motor drive type, a technique based on the multiple reference frames theory is also introduced for diagnosing ITSCFs in [25]. However, the application of these approaches under transient speed and abrupt accelerations conditions remains to be validated, as only steady-state conditions were considered. In [26,27], studies on 3PIMs driven by MPC address both steady-state conditions (which was most extensively studied) and transient speed conditions involving low motor acceleration rates. These works employed model-based techniques focused on the evaluation of the amplitude ratio of α-β plane current residuals, obtained through a computational model of the motor, and the angle of the residual stator flux, defined as the difference between the reference and the predicted stator flux angles, respectively. Nonetheless, these methodologies are complex, requiring accurate motor parameter knowledge, and relatively high rates of motor accelerations were not assessed. Another attempt to analysis transient speed conditions (beyond the extensive focus on steady-state conditions) in a 3PIM drive using MPC is found in [28], where inverter switching statistics are employed. Nevertheless, the proposed fault indicator requires a certain time to become sensitive to the occurrence of the fault, and due to the method’s nature, the fault quantification in such conditions become challenging.
Concerning six-phase induction motors, a straightforward signal-based technique for diagnosing ITSCFs in A6PIMs using the zero-voltage factor was reported in [29]. While this study demonstrates effective results under steady-state conditions, transient speed or abrupt acceleration conditions were not addressed. Moreover, the method requires additional external voltage sensors, which increases the overall cost of the drive system.
Past reports on ITSCFs detection in motors operating exclusively under transient regimes have been predominantly explored in three-phase motors. For PMSM drives using FOC, ITSCF detection under transient speed and abrupt acceleration rates was investigated in [30], resorting to the use of the zero-sequence voltage component analyzed by means of Hilbert–Huang transform. However, the zero-sequence component measurement requires access to the stator star’s midpoint electrical potential, which is usually not available in industrial applications. Still within the same motor drive type, [31] proposed the ITSCF detection by applying short-time Fourier transform (STFT), Wigner–Ville distribution, and WT to the stator currents. Additionally, in [32], fault detection was carried out by analyzing the stator currents harmonics through the combination of the empirical mode decomposition with pseudo-WVD and Zhao–Atlas–Marks transform. Nevertheless, these methods were validated only under low acceleration rates, and their computational complexity may limit practical implementation. Regarding 3PIMs connected to the grid, the authors in [33] and [34] proposed ITSCF detection during motor start-up by monitoring harmonic components in the stator currents using the WT and by analyzing stray flux harmonics components through the application of the STFT, respectively. However, these methods present disadvantages when applied to six-phase induction motors driven by MPC, such as the potential masking of stator current harmonics due to the control nature of MPC, the additional cost of stray flux measurement systems, and the impact of sensor placement on detection accuracy. Additionally, in 3PIMs operating under transient speed conditions, other faults such as air-gap eccentricity were detected through the analysis of the stator currents using the WT [35] and the adaptive slope transform [36]. Using the same signals, the Dragon transform [37] and STFT [38] were also proposed for the broken rotor bars detection.
The ITSCF detection in six-phase induction motor drives under transient speed variations has been partially covered in [39]; however, it remains computationally demanding, lacks robustness to abrupt acceleration rates, and presents challenges with respect to the spectrogram interpretation, particularly at lower motor speeds. It is therefore essential to address the ITSCF detection under abrupt or quick accelerations, following the requirements of the critical applications of six-phase induction motor drives with MPC.
This paper presents a method to detecting ITSCFs in A6PIM drives using MPC applicable during transient speed conditions. The proposed technique is particularly developed to diagnose ITSCF under constant and abrupt motor accelerations, offering a compromise between robustness and computational effort. In contrast to the existing diagnostic techniques, it does not depend on externally measured voltage or current signals. Instead, the ITSCF diagnostic technique exploits the time–frequency analysis of the AC component of the q-axis reference current—an internal variable of the control structure—thereby ensuring a simple implementation. This component is analyzed through the Gabor transform (GT) in scaled time, enabling time–frequency mapping. Under ITSCFs, the AC component draws a characteristic pattern in the time–frequency spectrogram, providing a reliable fault indicator.
Unlike in [39], where the spectrogram is processed along a conventional frequency axis, the proposed approach analyzes the spectrogram along the harmonic order component axis, thereby significantly reducing computational effort. This advancement not only enables better computational efficiency but also enhances the interpretability of the fault diagnostic outcomes, which is particularly important for fast and reliable decision-making. Furthermore, this work extends the analysis to include fault scenarios with higher fault severities, including values closer to those found in genuine ITSCFs, while ensuring that motor currents remain within rated limits. The effectiveness of the proposed methodology is validated by experimental tests conducted under transient regimes, including different load torques, fault severities, and both smooth and abrupt motor acceleration profiles.

2. A6PIM Drive with MPC

The arrangement of the windings in an A6PIM drive comprises two three-phase sets (A1, B1, C1 and A2, B2, C2), displaced by 30 degrees between each other, with a common neutral point (Figure 1a). As the name indicates, the MPC is based on the steady-state analytical model of the six-phase induction motor, following the structure of two orthogonal subspaces. Thus, the equations are expressed as d-q (flux/torque production), x-y (stator losses), and 0+,0 (zero-sequence) subspaces [6]:
v α s = R s + L s d d t i α s + L m d d t i α r v β s = R s + L s d d t i β s + L m d d t i β r v x s = R s i x s + L l s d d t i x s v y s = R s i y s + L l s d d t i y s v 0 + = R s i 0 + + L l s d d t i 0 + v 0 = R s i 0 + L l s d d t i 0 0 = R r + L r d d t i α r + ω m L r i β r + L m d d t i α s + ω m L m i β s 0 = R r + L r d d t i β r ω m L r i α r + L m d d t i β s ω m L m i α s
where [ v α s , v β s , v x s , v y s , v 0 + , v 0 ] and [ i α s , i β s , i x s , i y s , i 0 + , i 0 ] are the stator voltages and currents of the corresponding Vector Space Decomposition (VSD) variable, respectively, i α r and i β r are the rotor currents of α-β axis, R s and R r are the stator resistance, L l s is stator phase leakage inductance, L m is the magnetizing inductance, L s is the stator self-inductance ( L m   + L l s ), L r is the rotor self-inductance ( L m   + L l r ), L l r is the rotor phase leakage inductance, and ω m is the mechanical angular speed.
To achieve flux and torque regulations, it is necessary to establish a rotating reference frame using d-q axis currents. Therefore, the Park’s transformation is applied to Equation (1) to obtain a rotating reference frame:
i d s , i q s T = cos θ sin θ sin θ cos θ · i α s , i β s T
where i d s and i q s are the d and q-axis stator currents, respectively, and θ is the angular position of the d-axis of the rotating reference frame, with respect to the α axis, which is determined as follows:
θ = ω s   d t ω s =   ω m + ω s l ω s l = i q r e f i d r e f · τ r
In Equation (3), ω s l is the motor slip, τ r = L l r / R r   is the rotor time-constant, ω s is the reference frame angular speed (i.e., synchronous speed), and i d r e f and i q r e f are the d and q-axis reference currents, respectively.
The reference currents i d r e f and i q r e f are necessary for speed control. i d r e f , linked to the peak flux density, is set constant. Simultaneously, i q r e f , proportional to the generated torque, adjusts its amplitude based on the desired speed. Thus, the estimation of the i q r e f is expressed as follows:
i q r e f =   L m + L l r p L m Ψ d r · T e r e f
where L l r is the rotor leakage inductance, p is the number of pole pairs, Ψ d r is estimated rotor linkage flux, and T e r e f is the electromagnetic reference torque:
T e r e f = ω m r e f ω m · k p + k i T s z + 1 2 z 1  
In Equation (5), ω m r e f is the reference (desired) mechanical angular speed, and k p and k i are the PI controller parameters.
By maintaining a constant d-axis rotor flux component, the torque will rely solely on i q r e f . In the MPC controller, the outer speed loop, with a PI controller, can supply directly the i q r e f , if a proper k p adjustment is respected. Therefore, one obtains:
i q r e f = T e r e f  
The i q r e f is signal constant throughout the time and only changes its DC value whenever the speed error deviates from zero.
The immeasurable quantities, such as the rotor currents, are estimated at each sampling instant, relying on prior measured values. In digital implementation, long computation times may negatively impact the controller’s performance owing to computation delays. A viable solution is to employ a two-step prediction strategy, thus compensating for the computational delay. The predicted currents at the current moment are derived from the previous voltage equations, using the standard Euler approximation [6]. The optimization commences with the integration of the predicted currents into a cost function defined as:
g = i d s r e f i d s k + 2 2 + i q s r e f i q s k + 2 2 + λ 1 i x r e f i x k + 2 2 + i y r e f i y k + 2 2 + λ 2 i 0 + r e f i 0 + k + 2 2 + i 0 r e f i 0 k + 2 2  
where i r e f defines the stator reference currents, i k + 2 stands for the predicted currents at the instant k + 2 , and λ 1 and λ 2 are the weighting factors. It is also important to emphasize that during the operation the reference currents i x r e f ,   i y r e f , i 0 + r e f , and i 0 r e f are set to zero in order to minimize the stator losses.
The optimization of the cost function ensures the identification of optimal voltage vectors linked to the minimum error, which are then applied at the following switching instant. A diagram of the overall MPC is presented in Figure 1b.

3. Fault Diagnostic Technique

The diagnostic of an ITSCF occurring in an A6PIM drive, with closed-loop control, has the particularity of the fault symptoms being attenuated or hidden in the measured motor currents or voltages by the control itself. The challenge further increases whenever the motor operates under abrupt accelerations or speed variations because the fault symptoms are dependent on the supply frequency.
An ITSCF disrupts the magnetic field distribution, introducing an imbalance that affects both the electrical and mechanical motor quantities. The current loop of the drive control acknowledges these deviations through feedback and immediately attempts to correct them, thereby inherently attenuating the fault symptoms in the measured currents. However, the unbalanced magnetic field persists in the motor due to the short-circuit in the faulty phase winding and continues to affect motor’s torque and speed.
According to Equation (6), the disturbances presented in the motor speed further impact on the torque reference component of the current, represented by the q-axis reference current. Such speed fluctuations caused by the ITSCF lead to the appearance of harmonic components in i q r e f , making it a sensitive and useful signal for fault detection. Therefore, a diagnostic technique that performs the time–frequency analysis of i q r e f is put forward to detect ITSCFs in A6PIMs, under abrupt accelerations or speed variations.
GT is selected for the analysis of the i q r e f signal due to its effective capability to map both time and frequency content with a balanced and optimal resolution, along with computational efficiency. The transform relies on the convolution between the analyzed signal and a Gaussian-modulated complex exponential, where the Gaussian window is defined as g [ n , t c ] = C σ · e ( t [ n ] t c ) 2 2 σ 2 . This Gaussian window ensures that the signal is analyzed in specific segments, where σ governs the width of the Gaussian window, i.e., smaller σ values provide greater time resolution and lower frequency resolution, while higher σ values offer better frequency resolution and lower time resolution.
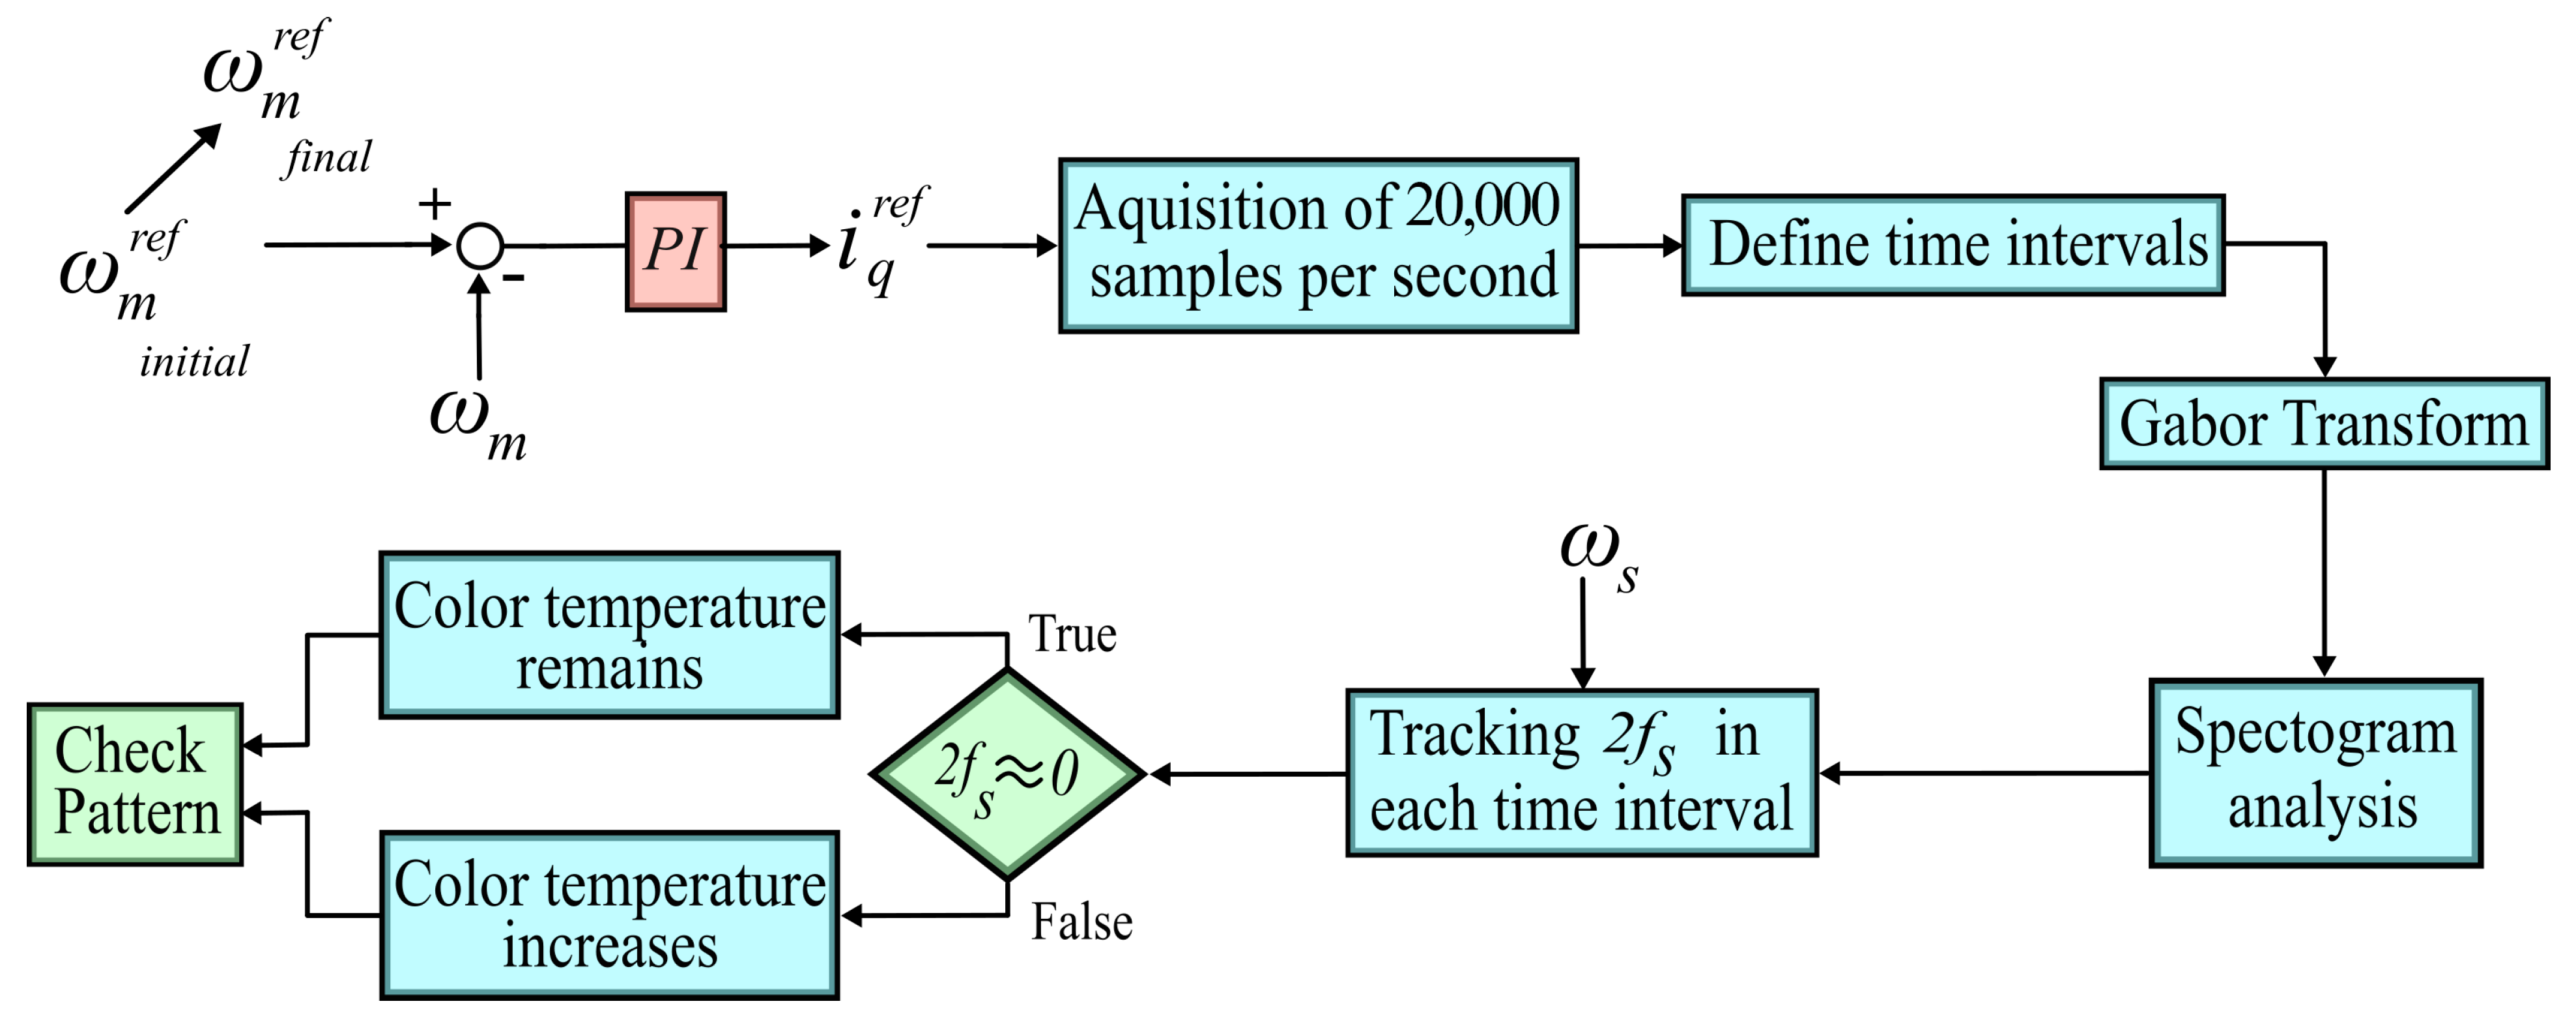
As depicted in Figure 2, the methodology begins with the acquisition of the i q r e f signal at a sampling frequency of 20,000 samples per second. Secondly, the number of time intervals is defined, respecting a compromise between achieving sufficiently high resolution in both frequency and time. The applied Gaussian window, characterized by a standard deviation σ , slides over the signal and centers at each defined time instant, allowing the signal to be examined in time segments.
Posteriorly, the GT is computed for each time interval, resulting in a time–frequency analysis of the i q r e f , expressed by the following equation:
i q r e f ¯ t c , f c = n = 0 L 1 i q r e f n · C σ · e ( t [ n ] t c ) 2 2 σ 2 · e j 2 π k n / L
where σ is the Gaussian envelope deviation parameter that characterizes the time dispersion of the window, t c is the sample corresponding to the time instant where the frequencies of each time interval are centered in the spectrogram, C σ = 1 π 4 · σ is the normalization constant to preserve the energy content, t n is the time array containing all samples, n is the sample’s number, k is the modulated frequency index, and L is the total number of samples.
Additionally, in this work, an adequate trade-off between time–frequency resolution and computational efficiency was achieved by configuring the fault diagnostic technique to analyze the i q r e f signal using a sliding window of 0.25 s, which corresponds to 5000 samples at a sampling rate of 20,000 samples per second and a fixed-width Gaussian window with σ = 6 . Both these parameters were determined empirically.
In the case of a healthy motor drive, the generated torque is perfectly balanced, resulting in a motor’s mechanical angular speed free of oscillations:
d ω m d t = 1 J ( T e m T l o a d )
where
T e m = 3 2 p L m i q s i d r i d s i q r
and i d r and i q r are the d and q-axis rotor currents, respectively.
Since i q r e f = T e r e f , under ideal motor operation, the i q r e f signal only shows a DC component at each time interval:
i q r e f ¯ t c i q r e f D C
Conversely, when an ITSCF occurs, a fault current ( i k ) arises as a result of the parallel electric circuit between the shorted turns. This fault current disrupts the rotating magnetic field, causing it to become asymmetric. Consequently, the electromagnetic torque comprises two terms, namely the healthy and the faulty terms:
T e m = T e m h + T e m f = 3 2 p L m i q s i d r i d s i q r + p L m μ i k i d r s i n ( ω s t ) i q r c o s ( ω s t )
where μ is the ratio between the shorted turns and the total number of turns, and i k is the sinusoidal short-circuit stator fault current.
The periodic oscillations presented in the generated torque are deduced by the product of two sinusoidal waveforms at the same frequency, i k = I k sin ( ω s t ) , and the currents i d r and i q r :
T e m f = L m μ I k · i d r · sin ω s t sin ω s t L m μ I k · i q r · sin ω s t cos ω s t = L m μ 2 I k i d r 1 cos 2 ω s t I k i q r sin 2 ω s t
Accordingly, one concludes that T e m f introduces a periodic oscillation at twice the supply frequency, which in turn it will be reflected in the motor’s mechanical angular speed [40]:
d ω m d t = 1 J T e m h + T e m f T l o a d
Considering that i q r e f = T e r e f , such a periodic speed oscillation induces an extra component in the i q r e f spectrogram. Therefore, an AC component arises in the spectrogram at twice the fundamental frequency, whose amplitude becomes higher as the fault severity increases:
i q r e f ¯ t c i q r e f D C + ρ = 1 i q r e f ρ sin ρ 4 π f s t + φ q ρ
where ρ = 1, 2, 3, …, f s denotes the fundamental frequency obtained based on the reference value of the speed (estimated through Equations (2) and (3)) and the number of poles of the motor, and φ q is the phase angle.
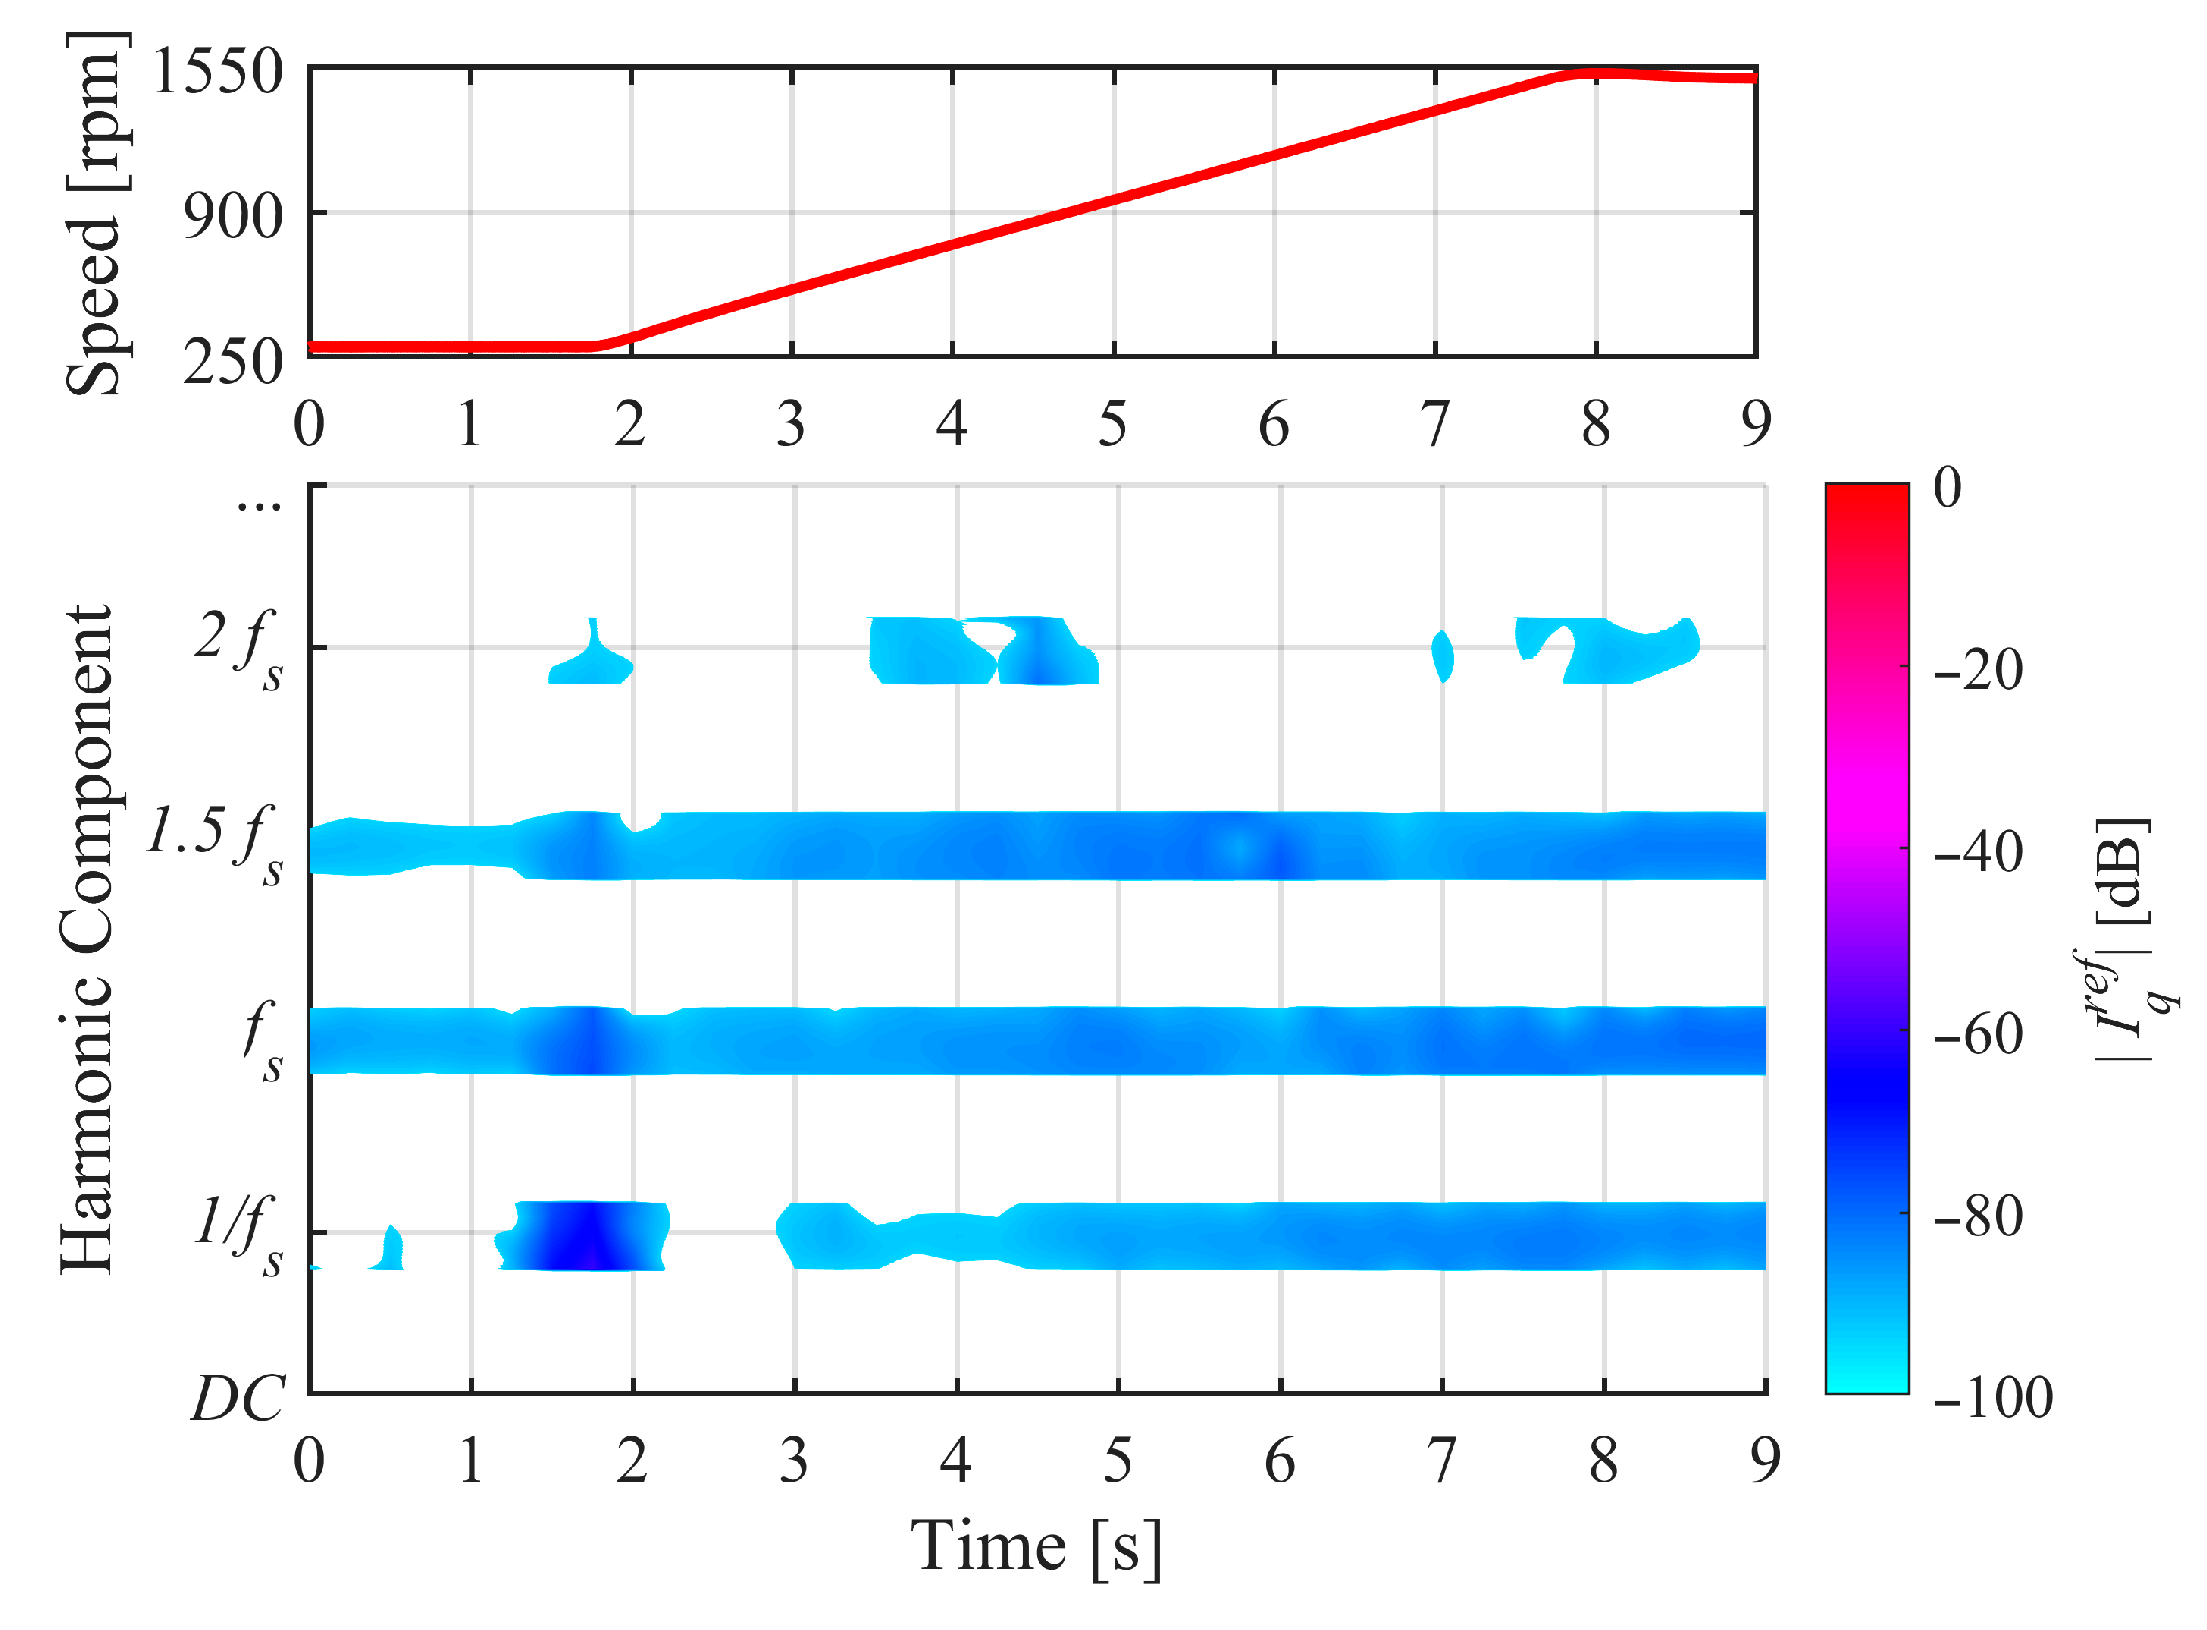
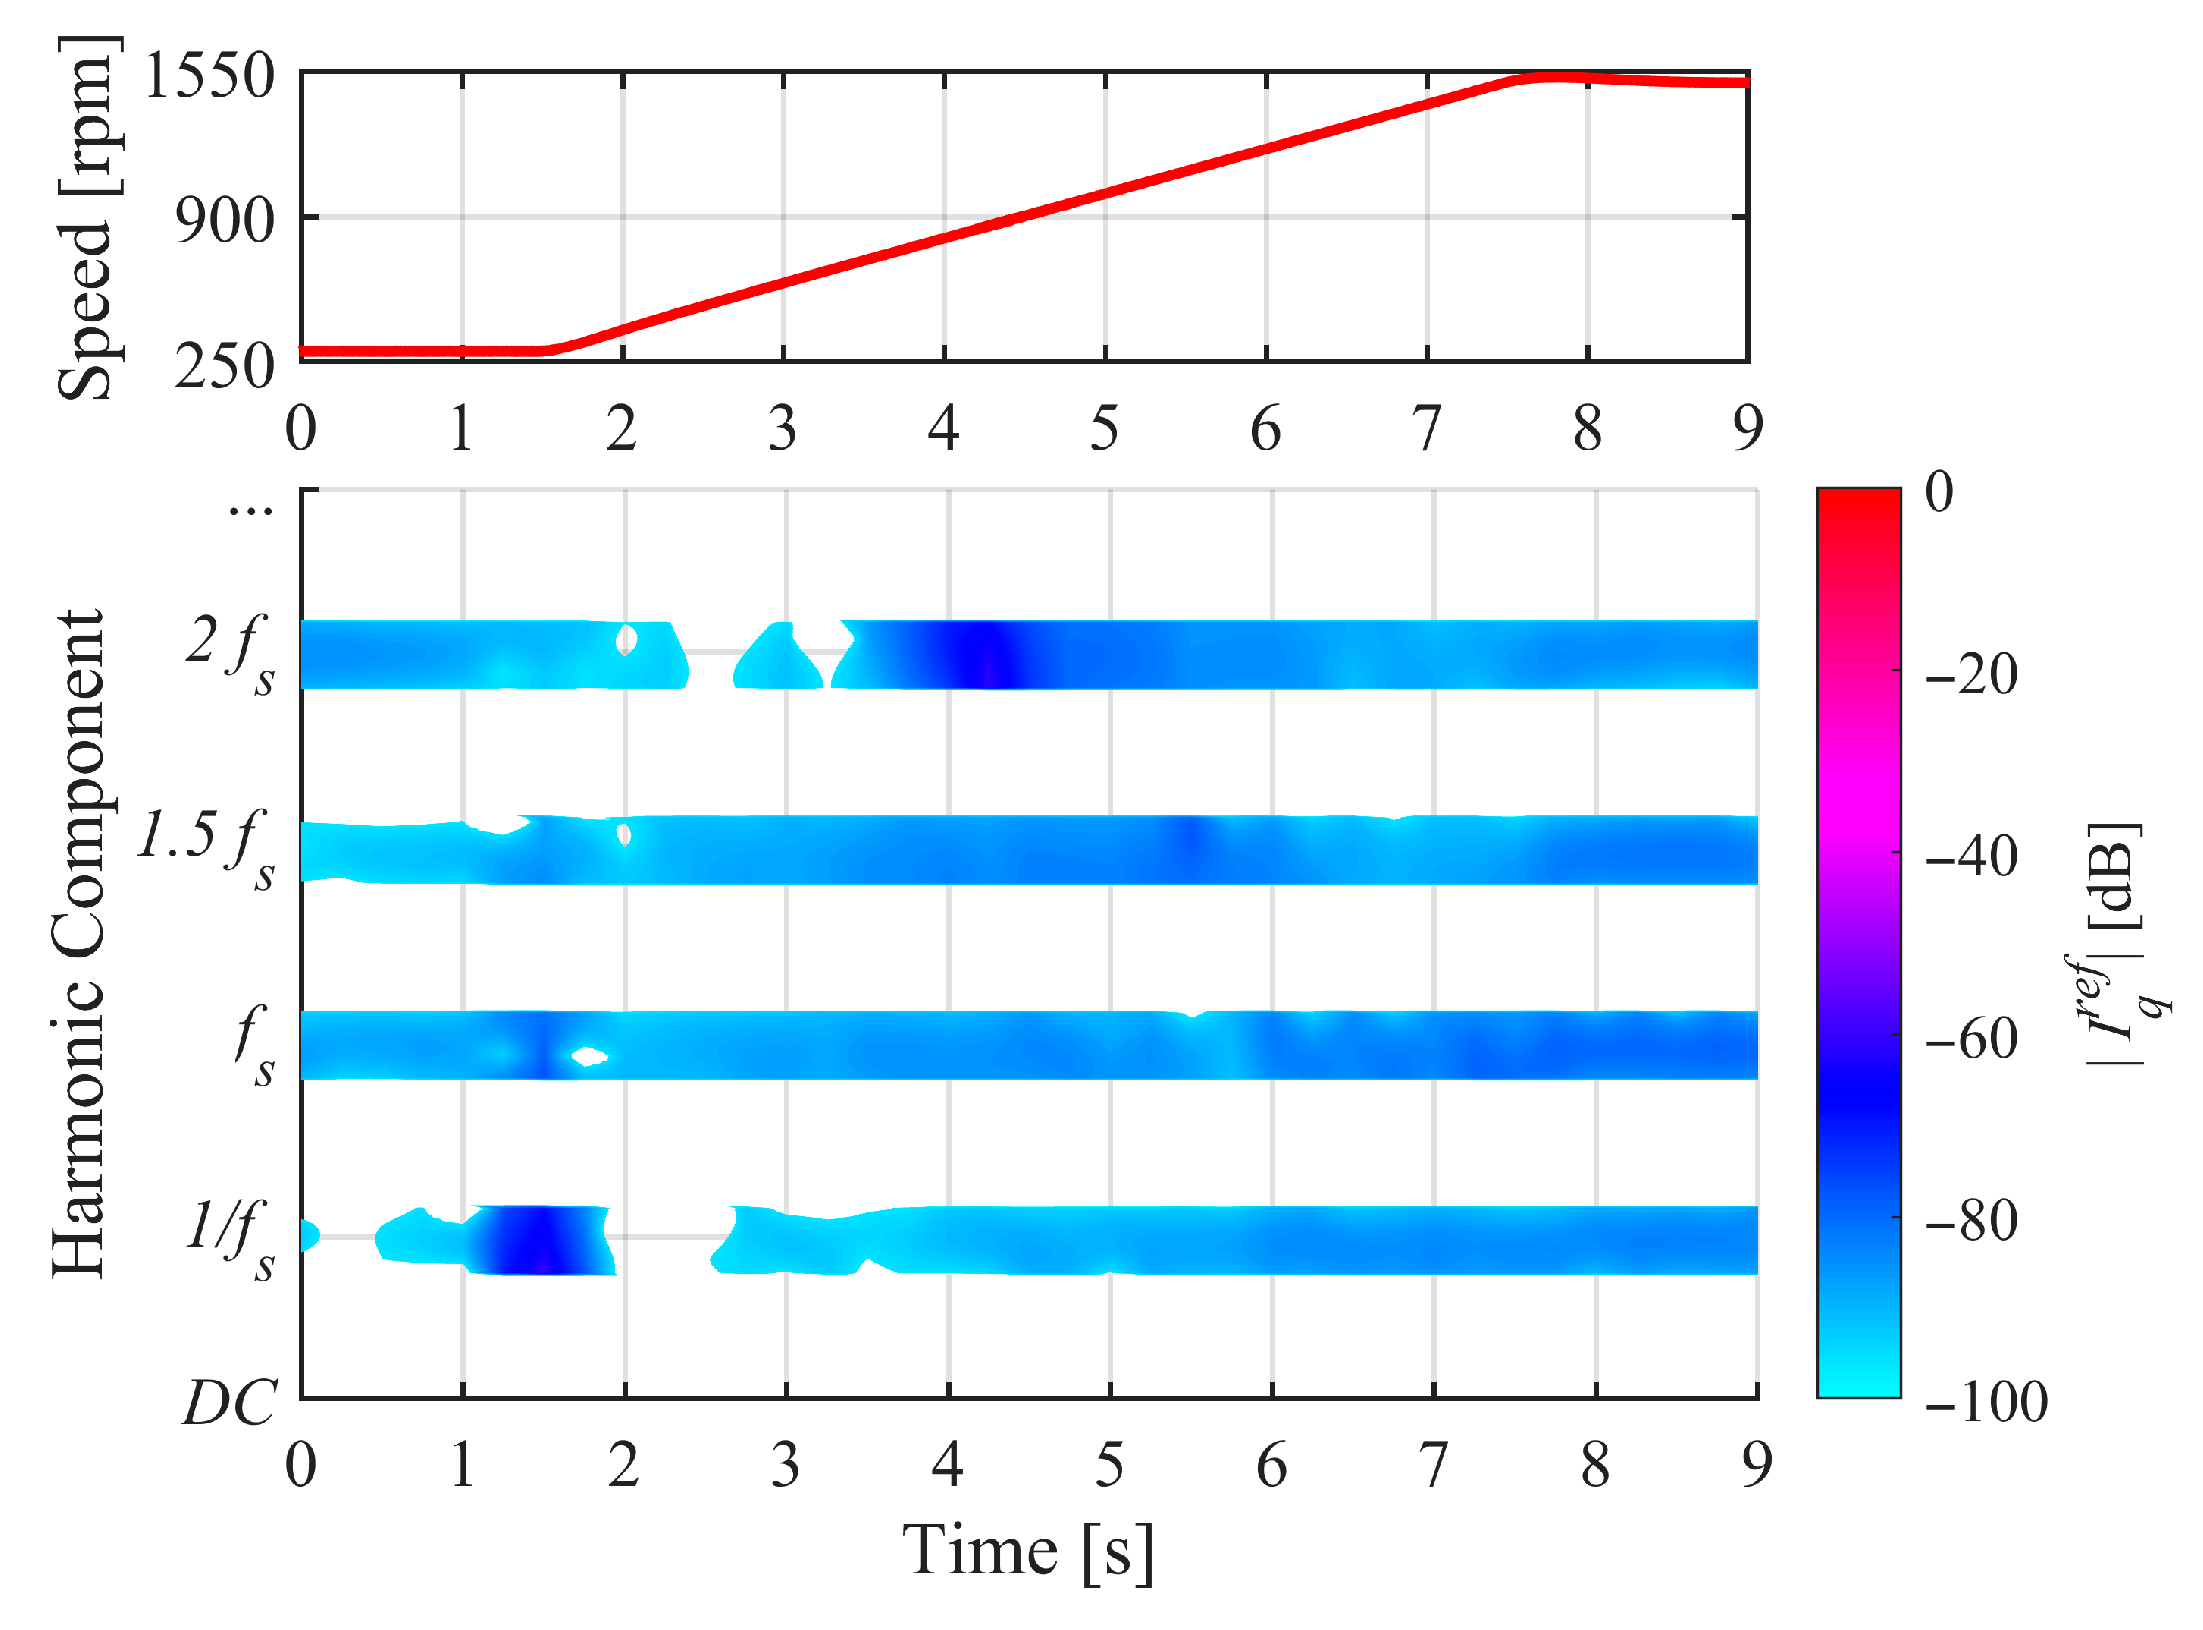
The magnitude of the AC component ( 2 f s ), in the dB scale, is tracked according to the reference frame angular speed ( ω s ) at each time interval. This step is crucial as, for a given rotor speed, the fundamental frequency varies with the motor load due to the motor slip. Hence, the presence of the AC component ( 2 f s ) in the spectrogram of the i q r e f is proposed as a fault indicator of the presence of an ITSCF. The higher the AC level, the higher the color temperature (intensity) drawn in the spectrogram. This way, the presence of such a component, along with the defined time intervals ( t c ) , will define a pattern that declares the existence of the fault. The fault severity is evaluated through the intensity of color temperature along with the pattern.
Since the AC component and other neighbor harmonic components depend on the supply frequency, which varies with motor speed, their patterns in the spectrogram resemble the motor speed profile. Hence, the careful interpretation of the AC component pattern is required by the observer, increasing the decision-making time. In addition, the computation of a spectrogram involves considerable computational load. To substantially simplify the interpretation of the pattern, while also reducing computational load, the magnitude of the time–frequency representation at 2 f s is converted into a harmonic component scale. This highlights the behavior of the specific harmonic over time (in the form of a horizontal band), as shown in the example of Figure 3. The representation is computed by extracting the spectral content (absolute frequency) around 2 f s , using the frequency variable information within MPC with a ±10 frequency–bin window to enhance both time and frequency resolution. Considering these aspects, the proposed algorithm achieved a processing time of approximately 1.098 s, compared to 1.5706 s for the algorithm presented in [39], representing a significant reduction in the processing time. This evaluation was performed by considering the algorithm’s three main tasks (data reading, execution, and spectrogram computation) over a 9 s data window.
To ensure an objective detection of the occurrence of an ITSCF in the motor, two conditions must be satisfied. First, the AC component in the i q r e f signal must exceed a spectral threshold of −96 dB. Secondly, the corresponding pattern must be considerably developed within the defined ±10 frequency–bin window and consistently observable throughout the time extension. These criteria were established upon the careful analysis and interpretation of empirical data patterns of the motor under diverse operation conditions.

4. Experimental Validation

4.1. Experimental Setup

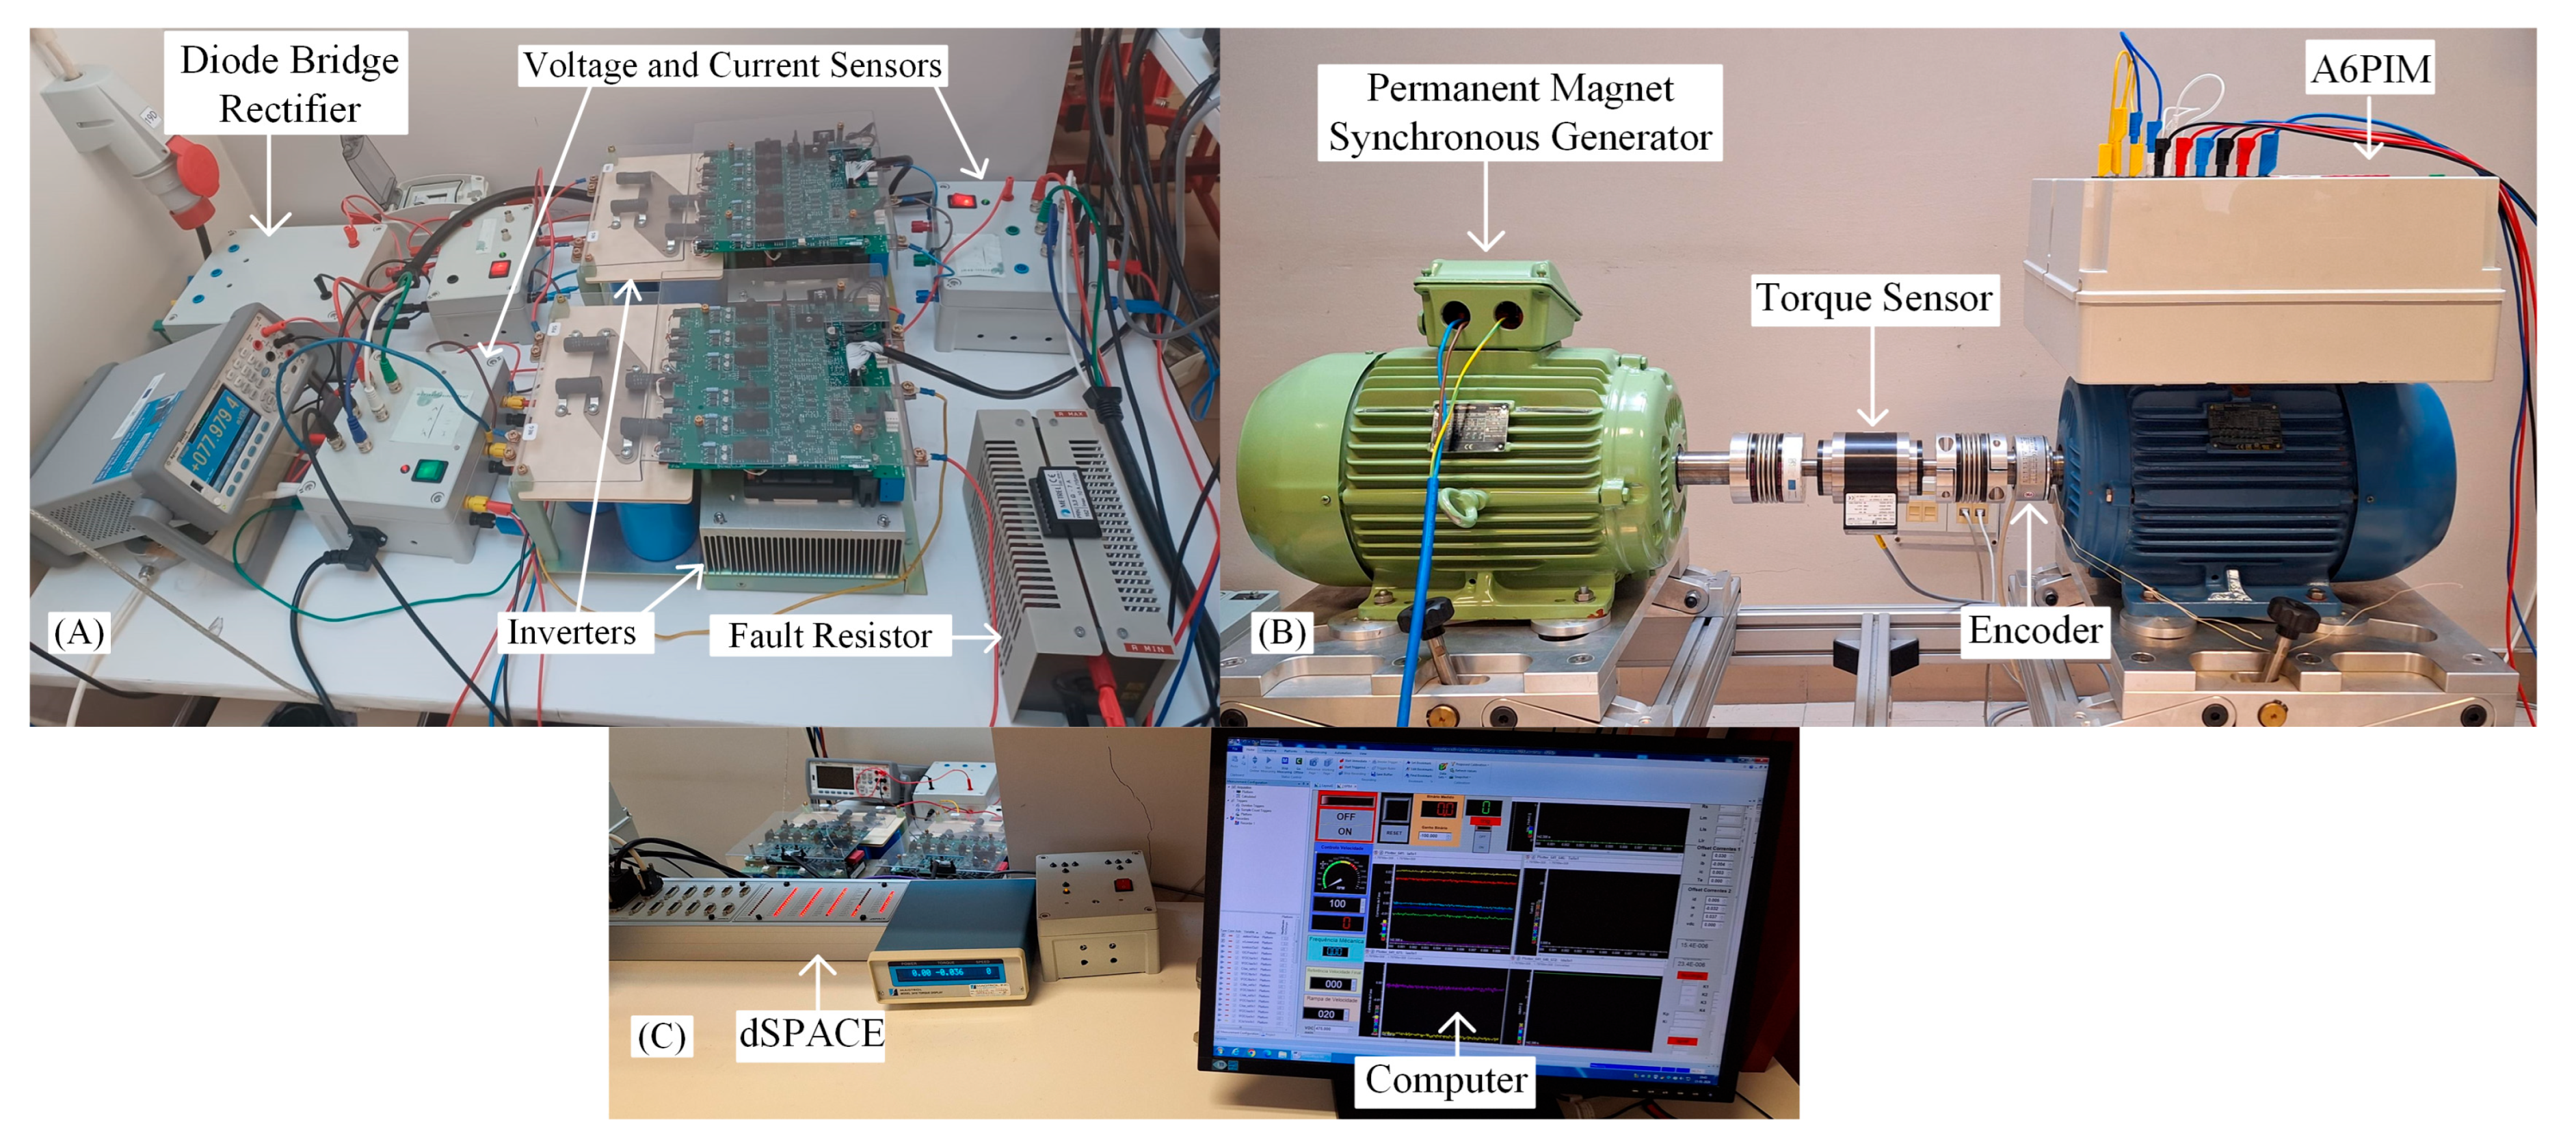
The validation of the proposed fault diagnostic technique was carried out using the test platform illustrated in Figure 4. The A6PIM, whose parameters are displayed in Table 1, operates star-connected. A permanent magnet synchronous generator (PMSG) is mechanically coupled to the A6PIM, providing a mechanical load to the motor. The torque and speed measurements are performed by means of a torque sensor MAGTROL TMB-310/41, and an encoder Hengstler RI76TD. The converter, supplied by a three-phase autotransformer, is composed of a diode bridge rectifier and two Powerex POW-R-PAK three-phase voltage source inverters, which are controlled by a dSPACE DS1103. The MPC algorithm was built in Matlab/Simulink and implemented into the dSPACE controller. As the control algorithm and the data acquisition were implemented in the same computational environment (dSPACE controller), both clock frequency and sampling frequency were set to 20 kHz. The phase current signals were acquired through closed-current transducers (LEM, model LA 55-P), respectively.
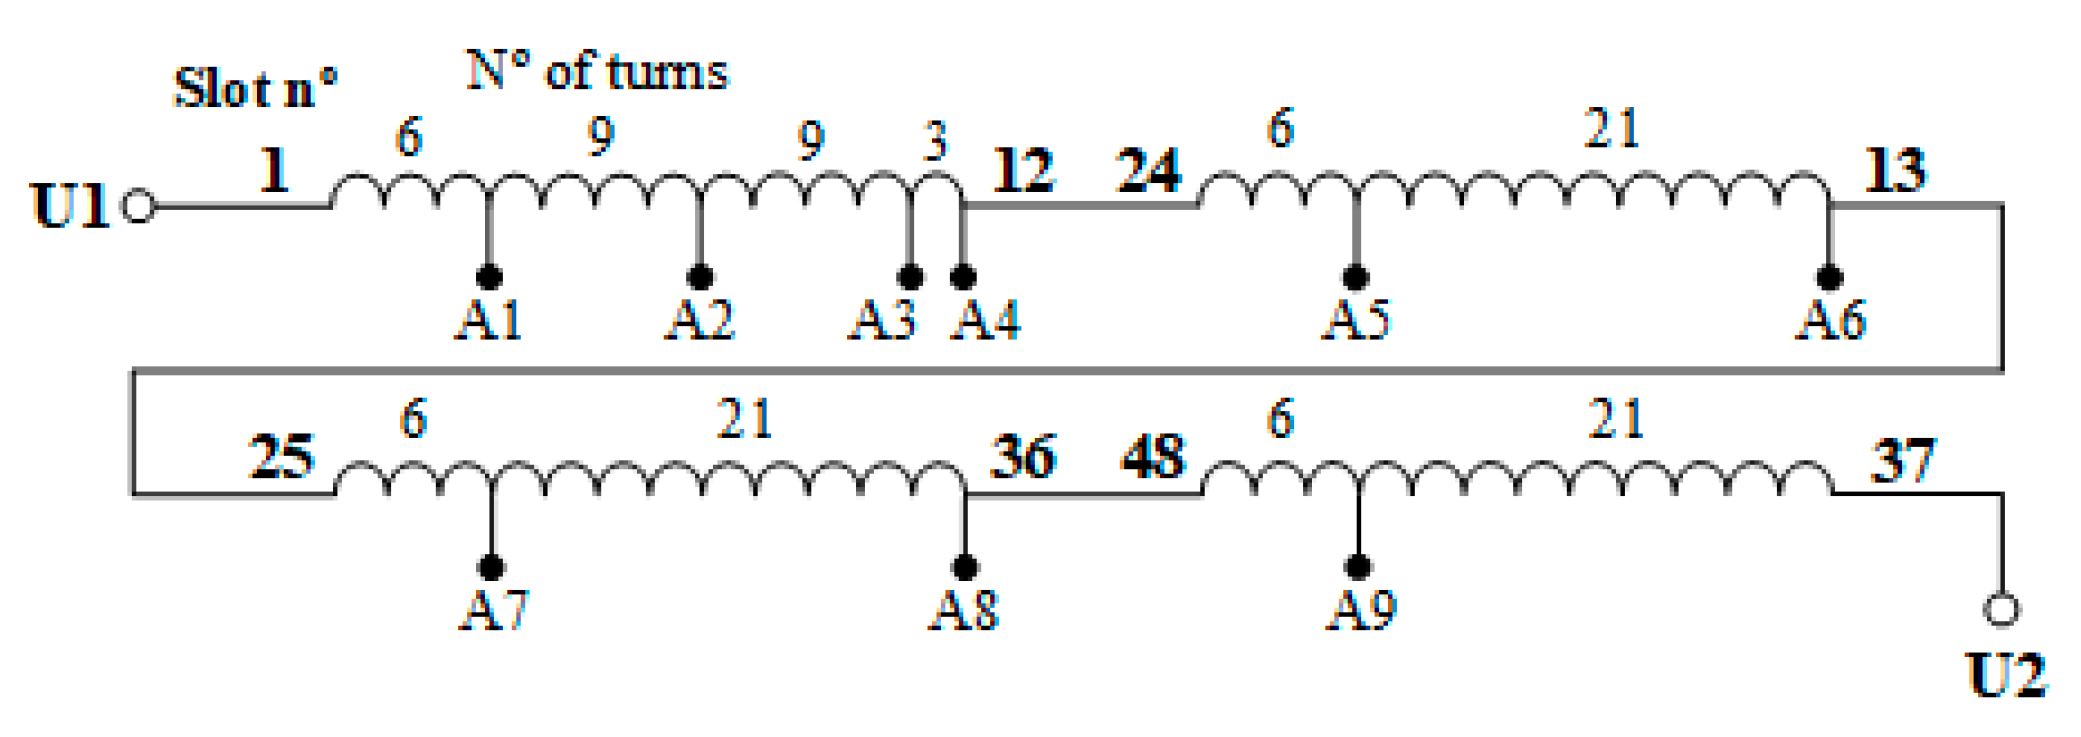
ITSCFs were introduced by means of a set of tappings that were added to the A6PIM stator winding, whose the total number of turns is 108. Figure 5 illustrates the specific locations of these tappings for the A2 winding phase. An external shorting resistor, parallelly connected between two tappings (faulty turns), was used, whose value was chosen to generate an effect strong enough to be easily visualized, but simultaneously big enough to limit the current in the faulty phase winding, thus protecting the motor from a catastrophic failure. The fault severity level is quantified using the ratio between the number of shorted turns and the total number of turns in the winding. In addition, as the fault resistance value decreases, the impact of the fault increases, effectively raising the severity level.
It is worth mentioning that the severity of ITSCFs is directly proportional to the number of shorted turns and inversely proportional to the value of the fault resistance. In a real scenario of ITSCFs, the fault contact resistance is significantly low (approximately zero). Therefore, this means that fault severities involving a smaller number of shorted turns would result in more pronounced seriousness than that in the cases analyzed in this study.

4.2. Results

A series of experiments were performed on the A6PIM drive to validate the ITSCF diagnostic technique. These experiments were performed under different speed variation conditions under a low level of load torque (approximately 1.4 Nm) and at a maximum of 20 Nm load torque (in this case, the load was set to present a load torque of 20 Nm at 1500 rpm) in both healthy and faulty conditions. The load resistance of the PMSG is kept constant during the transient, and consequently, the load torque is speed-dependent, a typical characteristic of various types of loads.
To perform the faulty condition tests, two values of shorted turns of phase A2 winding were selected (12 (11.1%) and 21 (19.4%), out of a total of 108 turns), with a fault contact resistance of 2 Ω (lower severity impact) and 1 Ω (higher severity impact). It is important to note that both considered contact resistances are significantly higher than the typical full-contact resistance found in industry, which is approximately 0.1 Ω. Consequently, fault diagnosis under these conditions becomes more challenging than under full-contact scenarios.
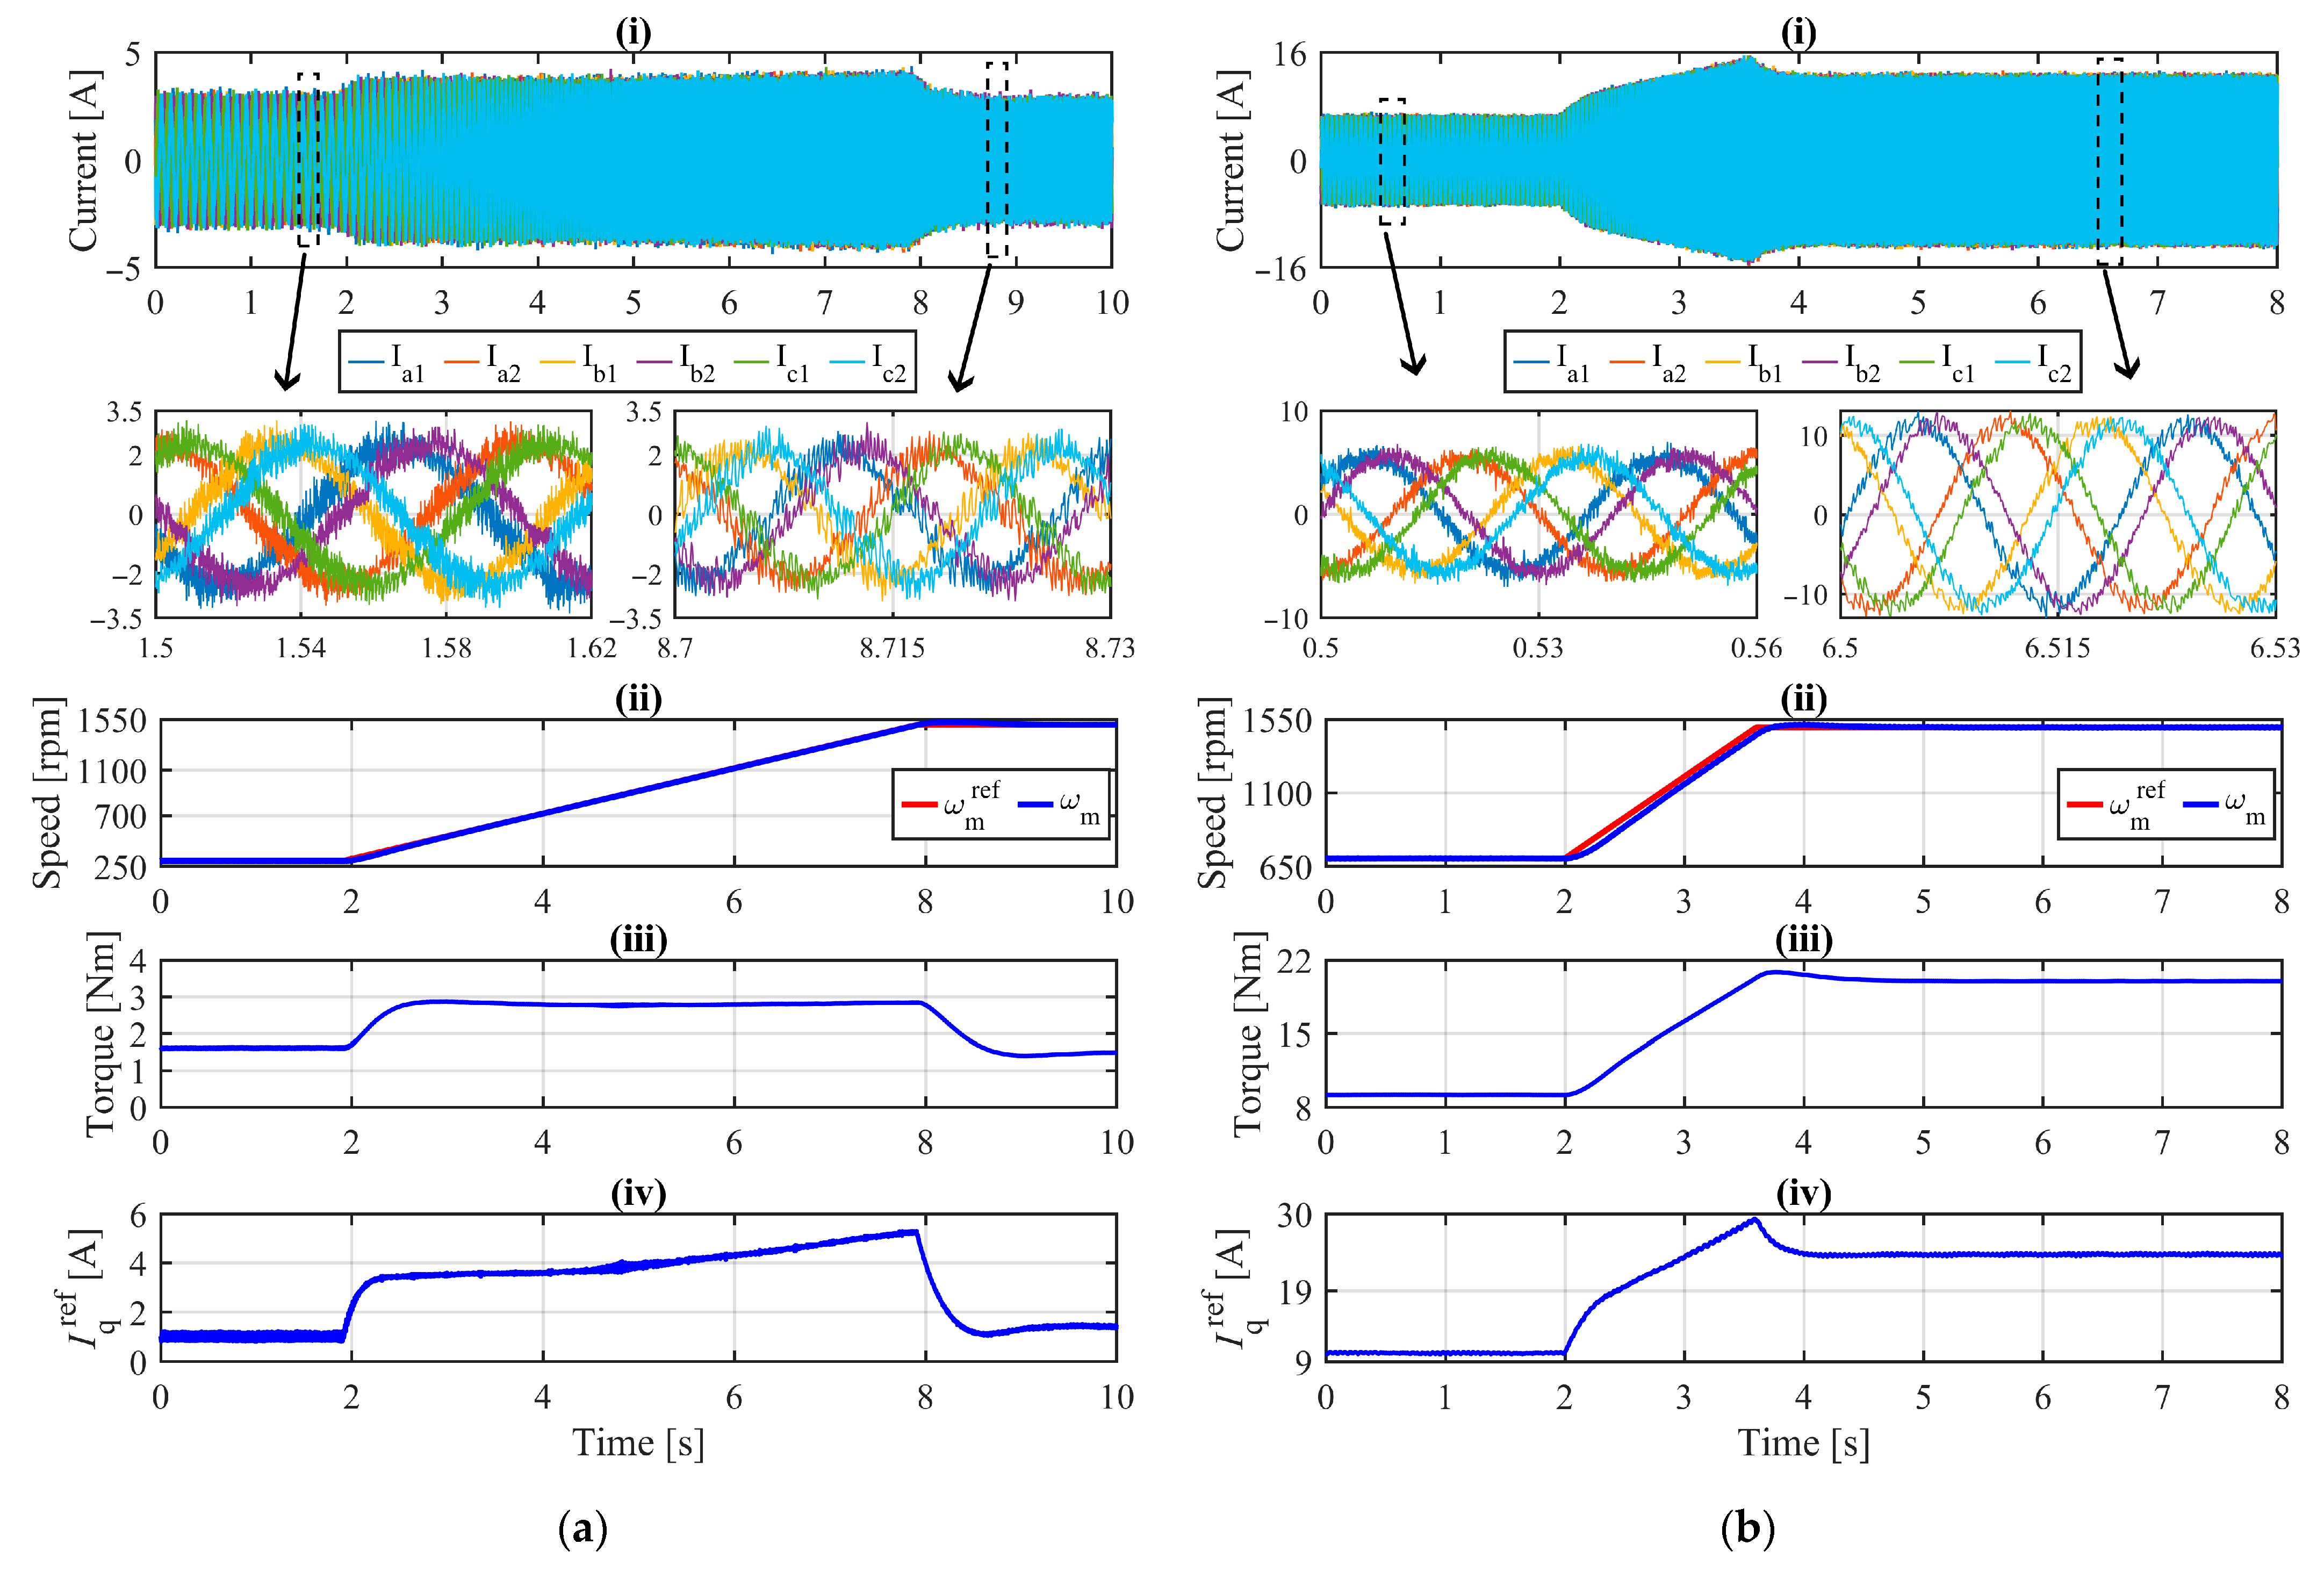
The transient behavior of the recorded experimental motor quantities, such as six-phase currents, speed, and q-axis reference current, is illustrated in Figure 6a,b.
Figure 6 shows the faulty operation of the motor with 12 shorted turns and a fault resistance of 2 Ω in phase A2 winding. The motor undergoes a speed variation from 300 rpm to 1500 rpm, with an acceleration of 200 rpm/s at a low level of load torque. The speed ramp profile, visible in Figure 6a(ii), introduces changes in both motor currents and q-axis reference current, leading to challenges in diagnosing the fault under such conditions due to the dependency of fault indicators on the supply frequency. These challenges become even more critical when higher or abrupt motor accelerations occur, such as in the case illustrated in Figure 6b, where the speed varies from 700 rpm to 1500 rpm, with an abrupt acceleration of 500 rpm/s. Here, the motor operates at a load torque of 20 Nm (at 1500 rpm) with 12 shorted turns and a fault resistance of 1 Ω in phase A2 winding.
Figure 7 and Figure 8 present the modified spectrogram of the i q r e f (over an extension of 9 s) at low load torque, with a motor speed variation increasing from 300 rpm (10 Hz) to 1500 rpm (50 Hz) at an acceleration rate of 200 rpm/s, for both the healthy condition (Figure 7) and the case of 21 shorted turns and a fault resistance of 2 Ω (Figure 8). In the healthy condition (Figure 8), the i q r e f spectrogram reveals the absence of 2 f s component, as indicated by the nearly nonexistent color intensity throughout the entire time span. The occasional, dispersed segments observed within the 2 f s pattern are attributed to the motor inherent imbalance, which are not significant enough to interfere with fault diagnosis.
Conversely, Figure 8 clearly displays a noticeable and continuous pattern in the 2 f s component over time, highlighted by its pronounced color intensity. This distinct pattern results from the expressive rise in the 2 f s component amplitude, confirming the presence of the ITSCF and demonstrating the effectiveness of the 2 f s component as a reliable fault indicator. It is also worth noting that neighboring harmonic components do not adversely impact the fault diagnosis.
Figure 9, Figure 10 and Figure 11 depict the i q r e f modified spectrogram at low load torque, with motor speeds varying from 1000 rpm (33.3 Hz) to 1500 rpm (50 Hz) at an acceleration rate of 100 rpm/s. These figures correspond to the healthy condition, and cases with 12 and 21 shorted turns, respectively, each with a fault resistance of 2 Ω. Expectedly, the fault indicator exhibits a behavior consistent with previously observed cases. Under healthy operating conditions (Figure 9), the 2 f s component pattern is nearly nonexistent. However, the presence of an ITSCF, with 12 (Figure 10) and 21 (Figure 11) shorted turns, results in the development of a pattern spanning the entire time interval, corresponding to an expressive rise in the 2 f s component. In addition, a noticeable difference in color intensity at 2 f s band is observed between the two fault severities, with the contrast becoming more pronounced as the fault severity increases.
The case of the motor operating with load torque increasing from 13 Nm (at 1000 rpm) to 20 Nm (at 1500 rpm), within a speed variation range rising of 1000 rpm (35.6 Hz) to 1500 rpm (53.5 Hz) at acceleration rate of 100 rpm/s, is shown in Figure 12 and Figure 13, for the case of healthy operation and faulty operation (21 shorted turns and fault resistance of 2 Ω), respectively. Comparing these results with those under low load torque, it can be concluded that an increase in load torque level does not adversely impact the fault diagnostic. The absence of a pattern under healthy conditions and the presence of a distinct pattern under faulty conditions demonstrate the effectiveness of the fault diagnostic technique under load torque conditions.
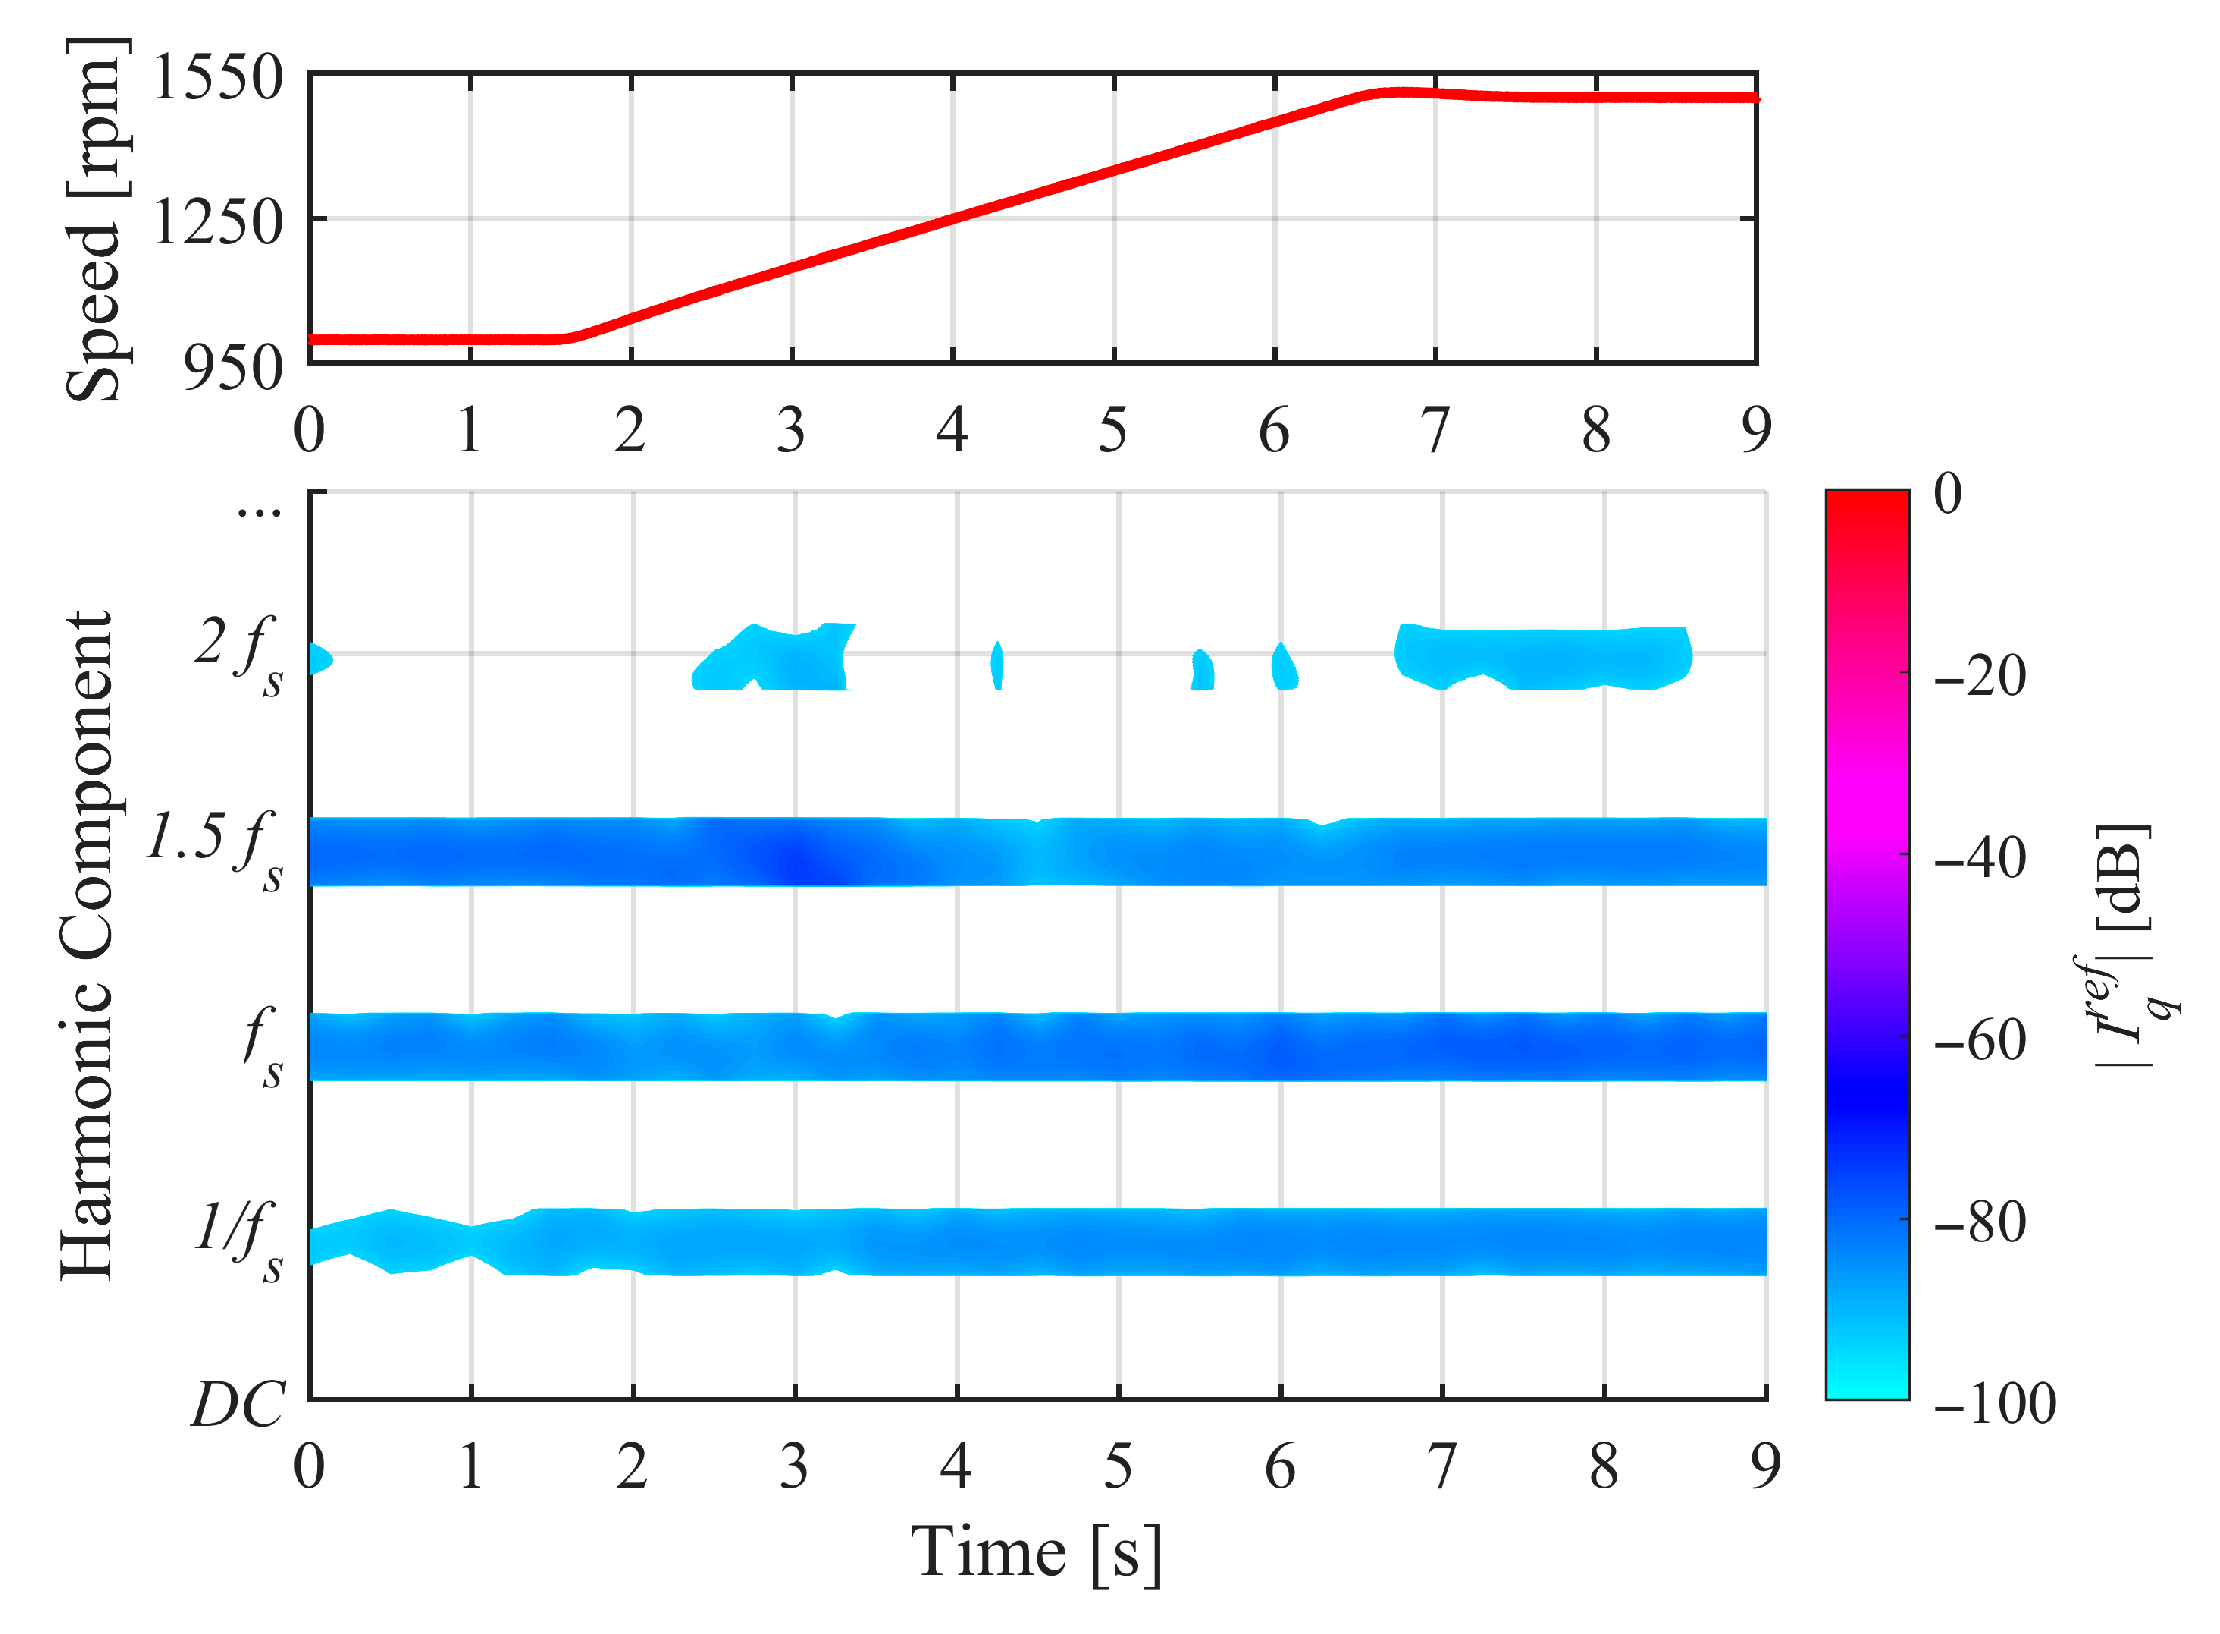
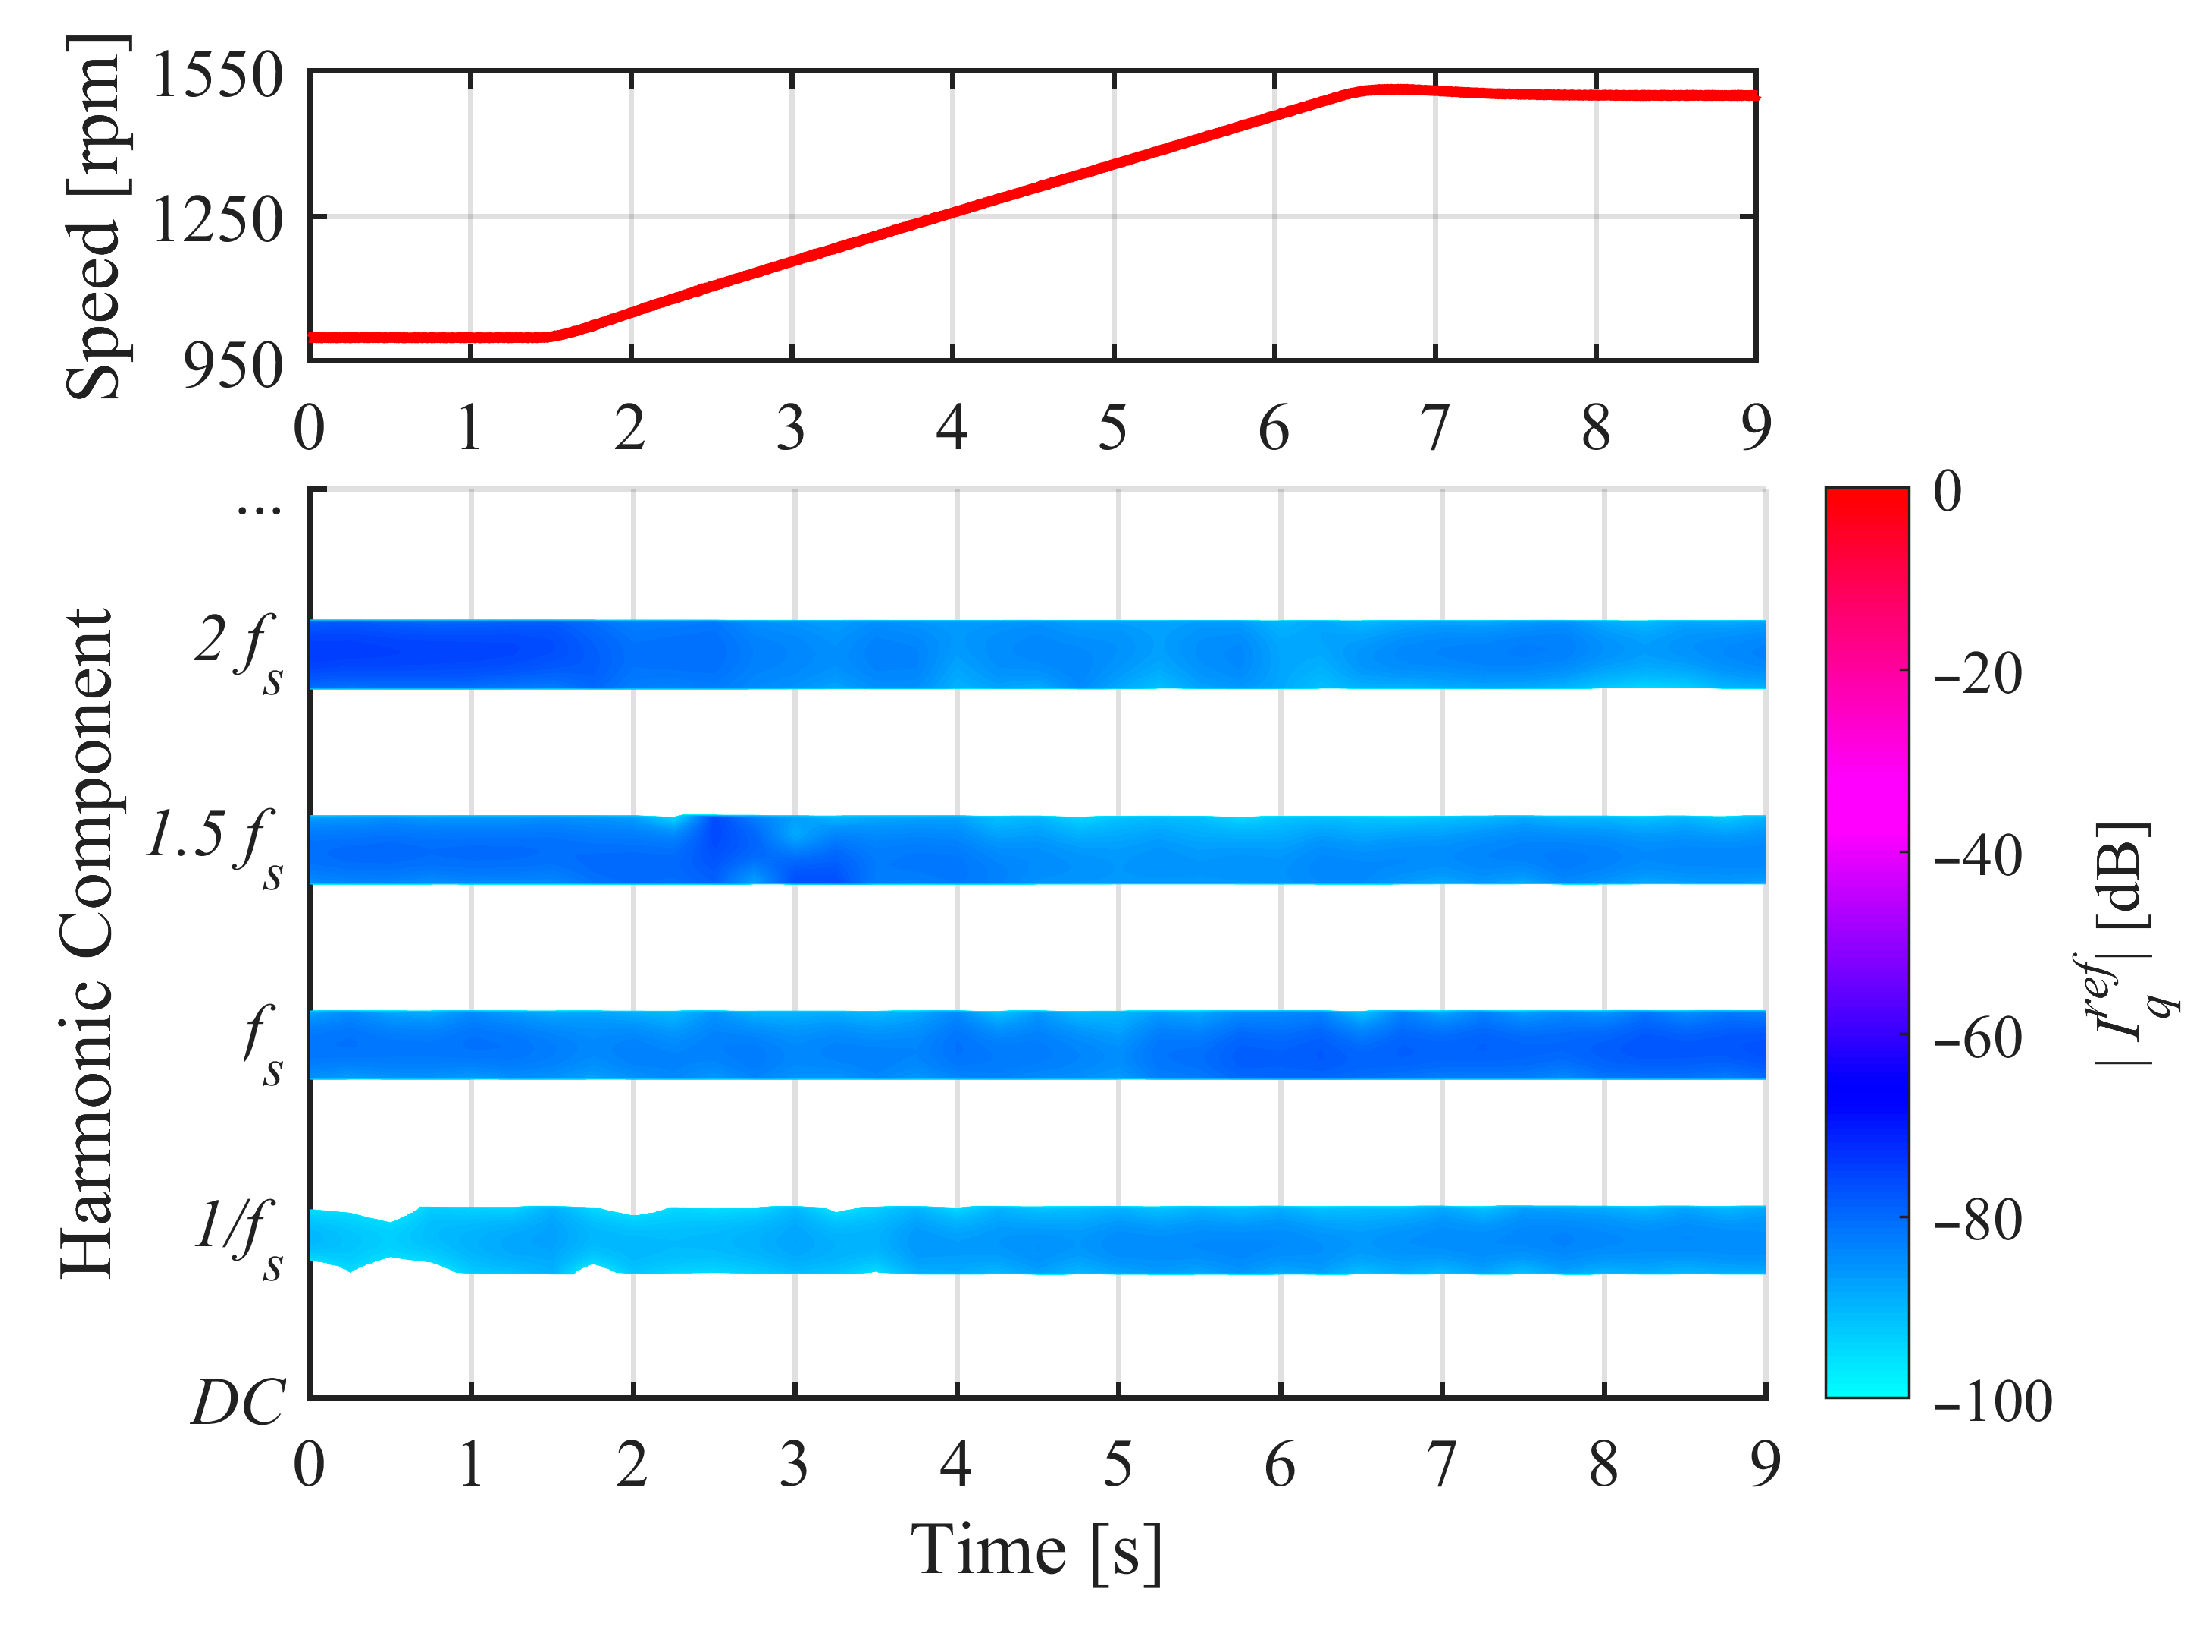
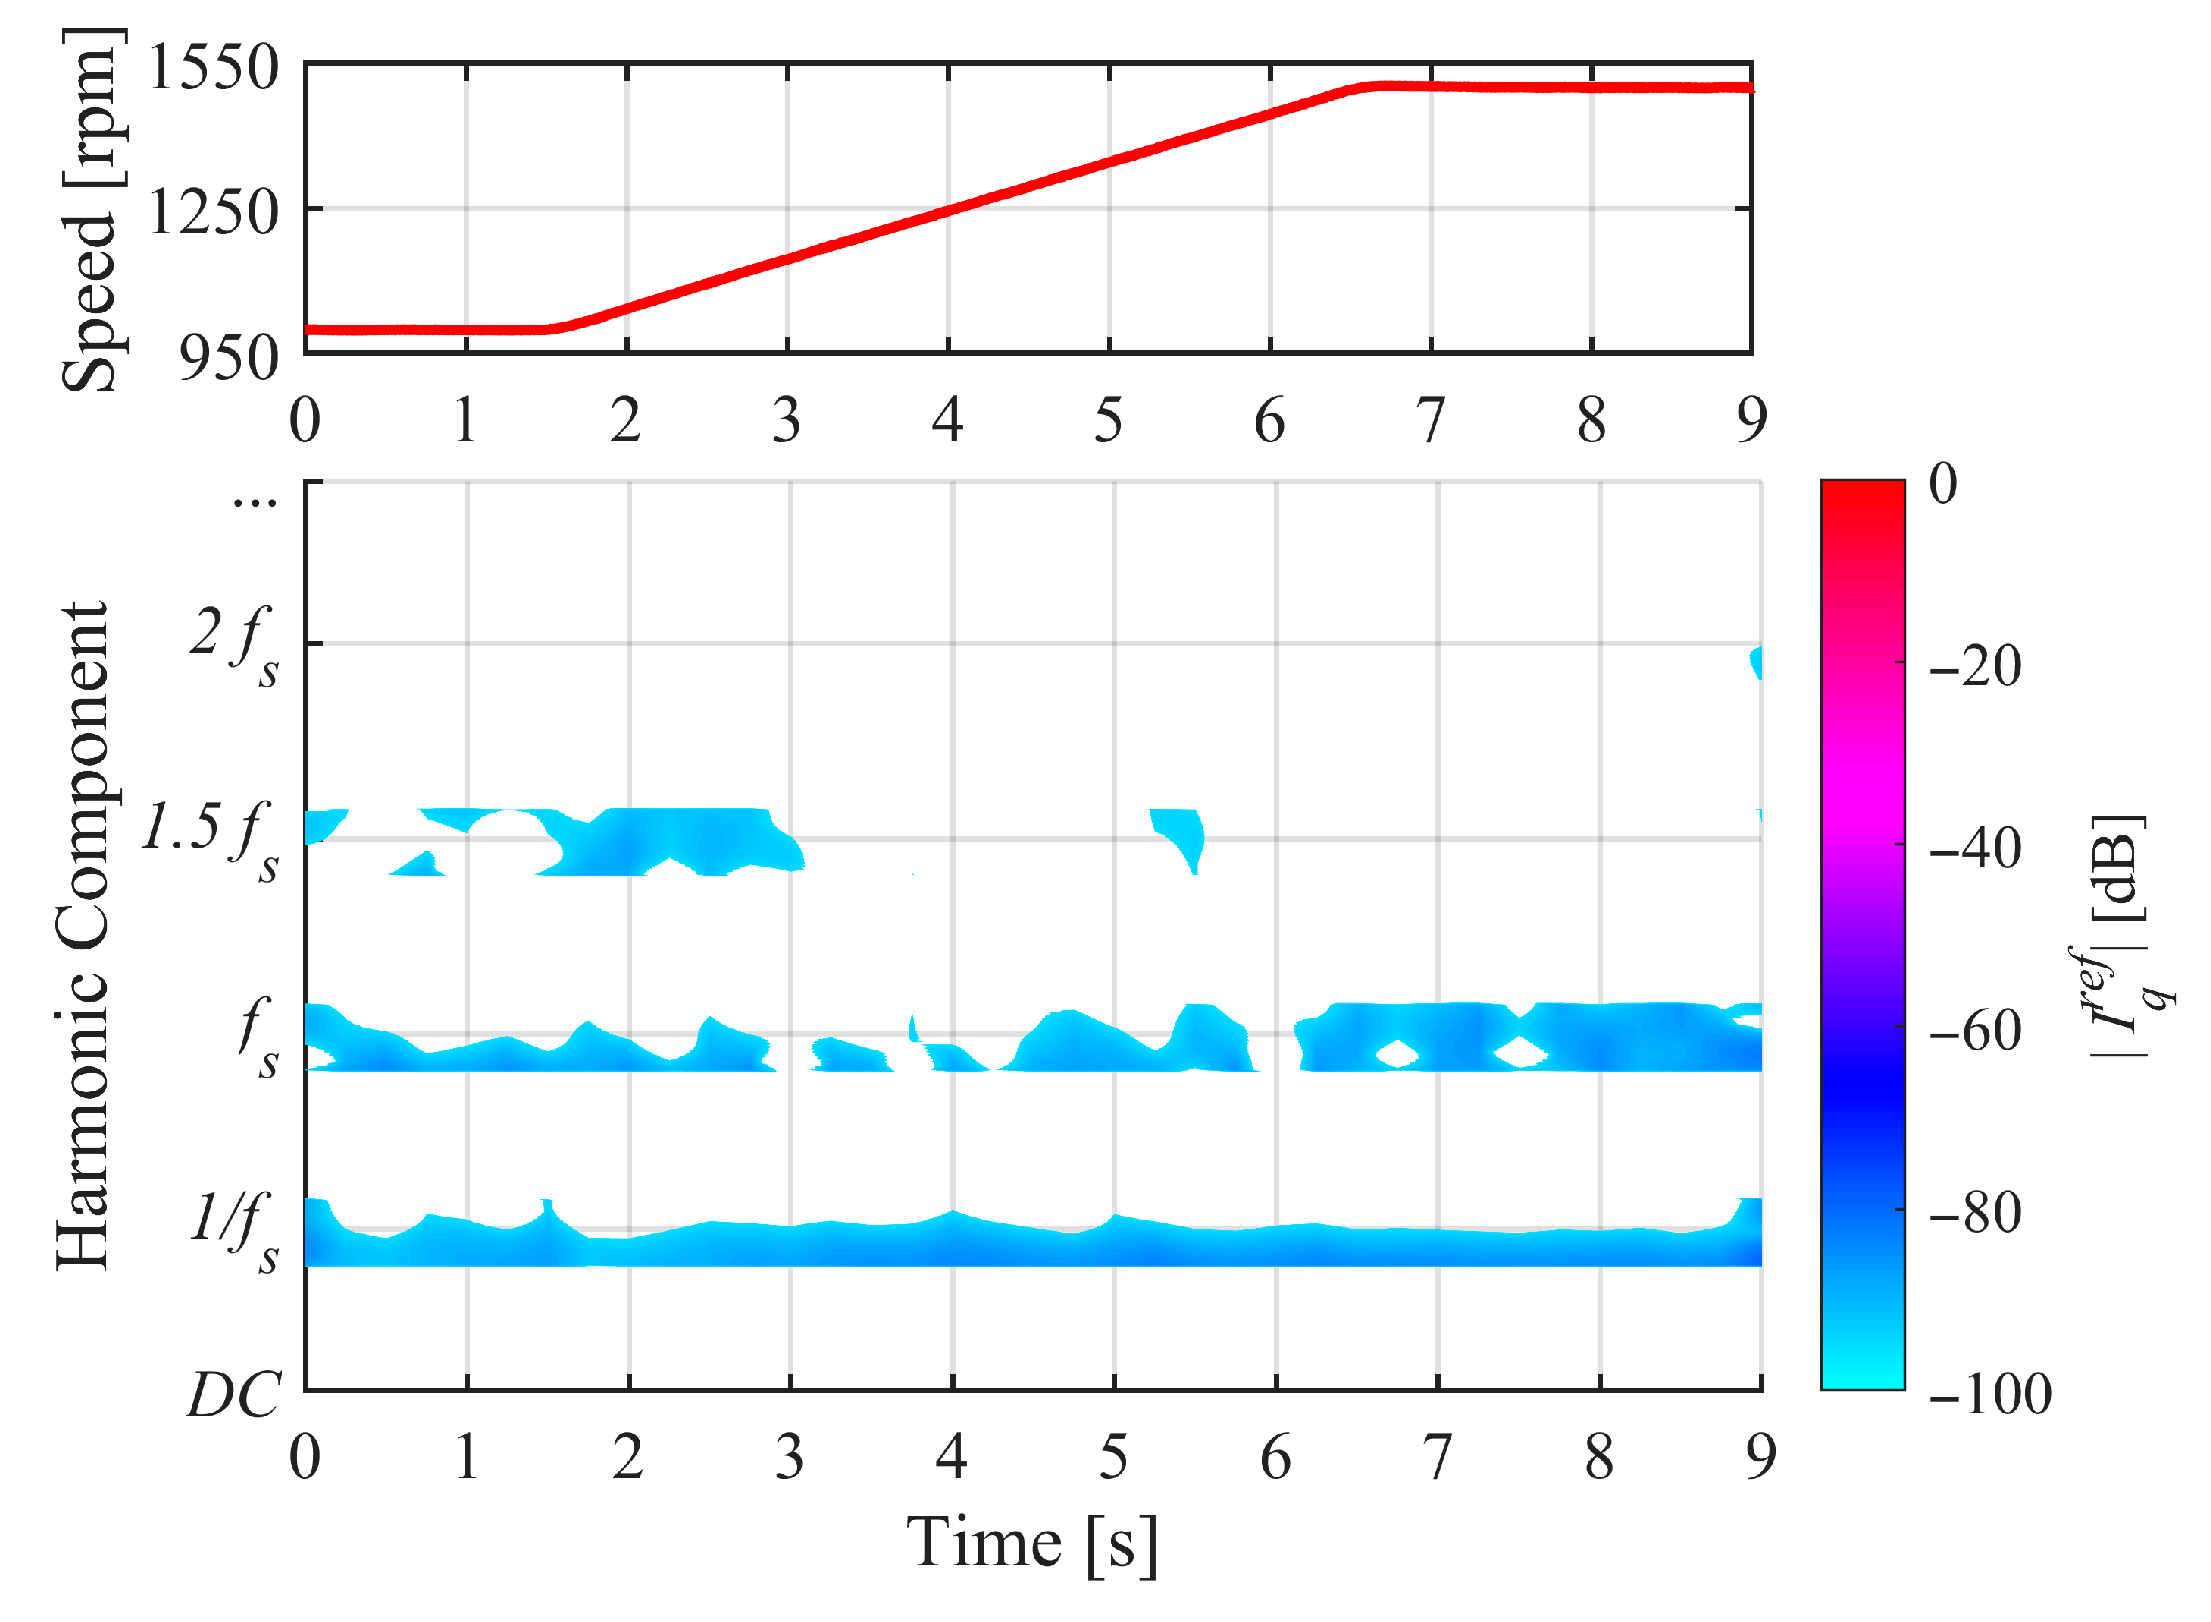
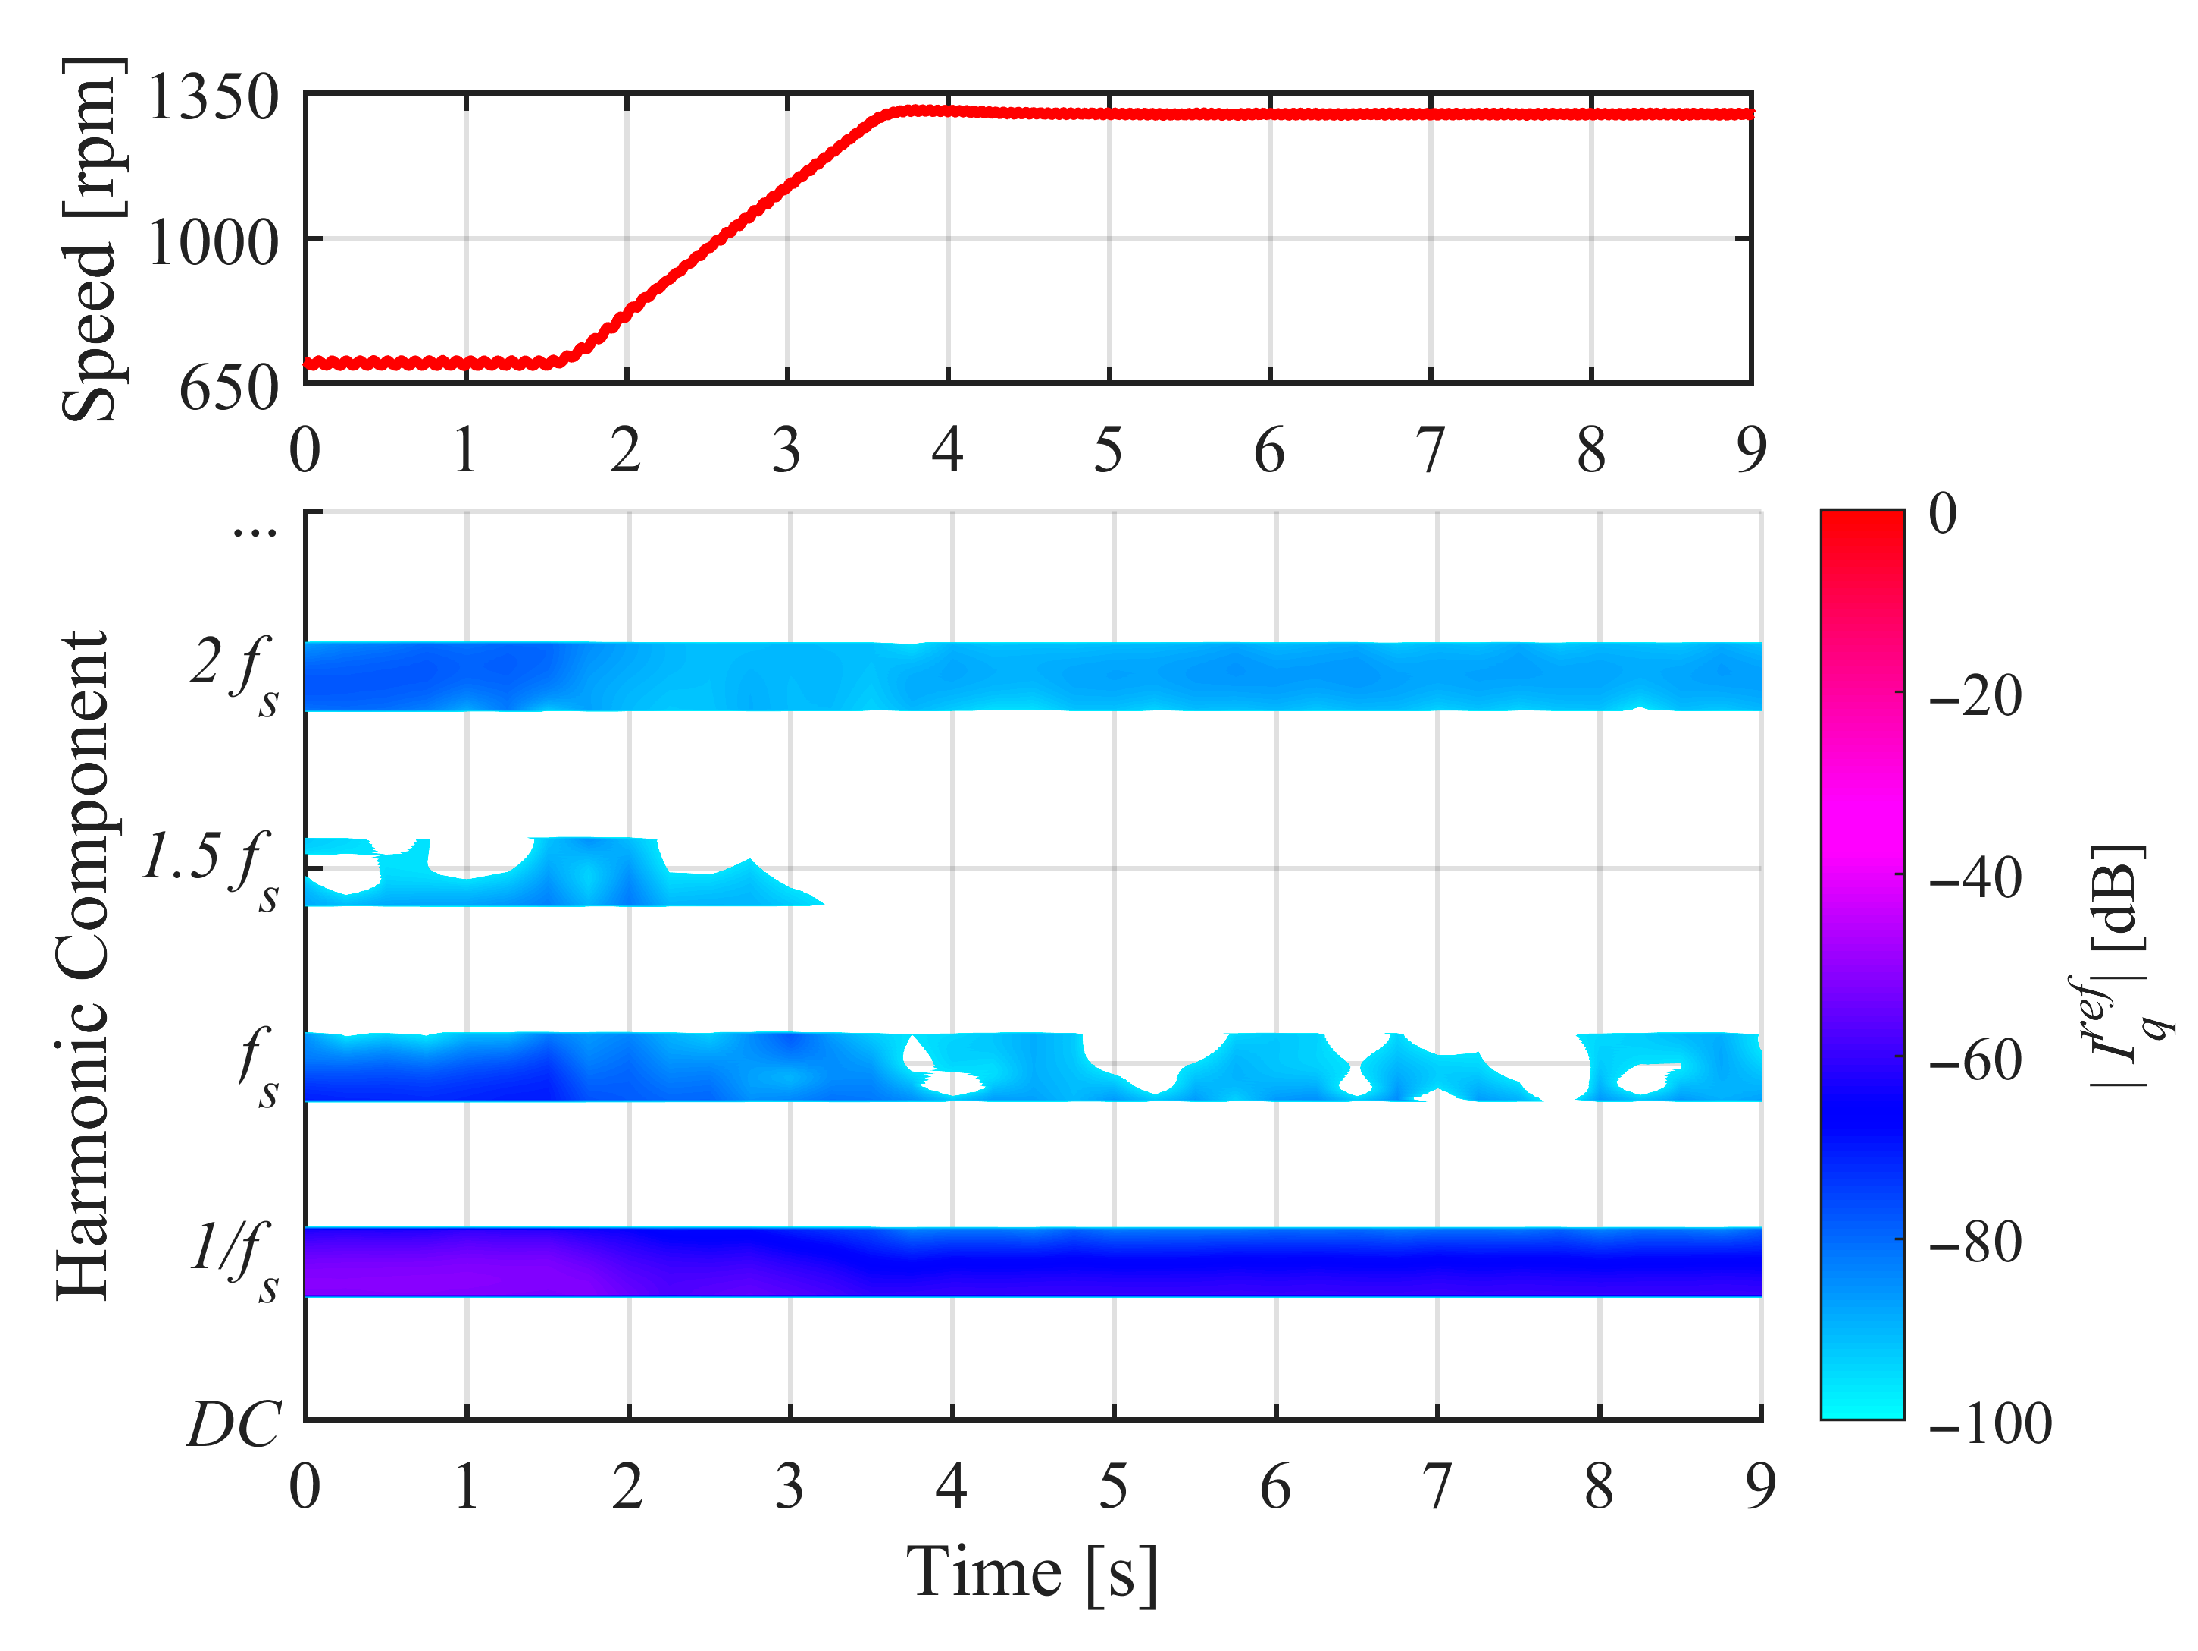
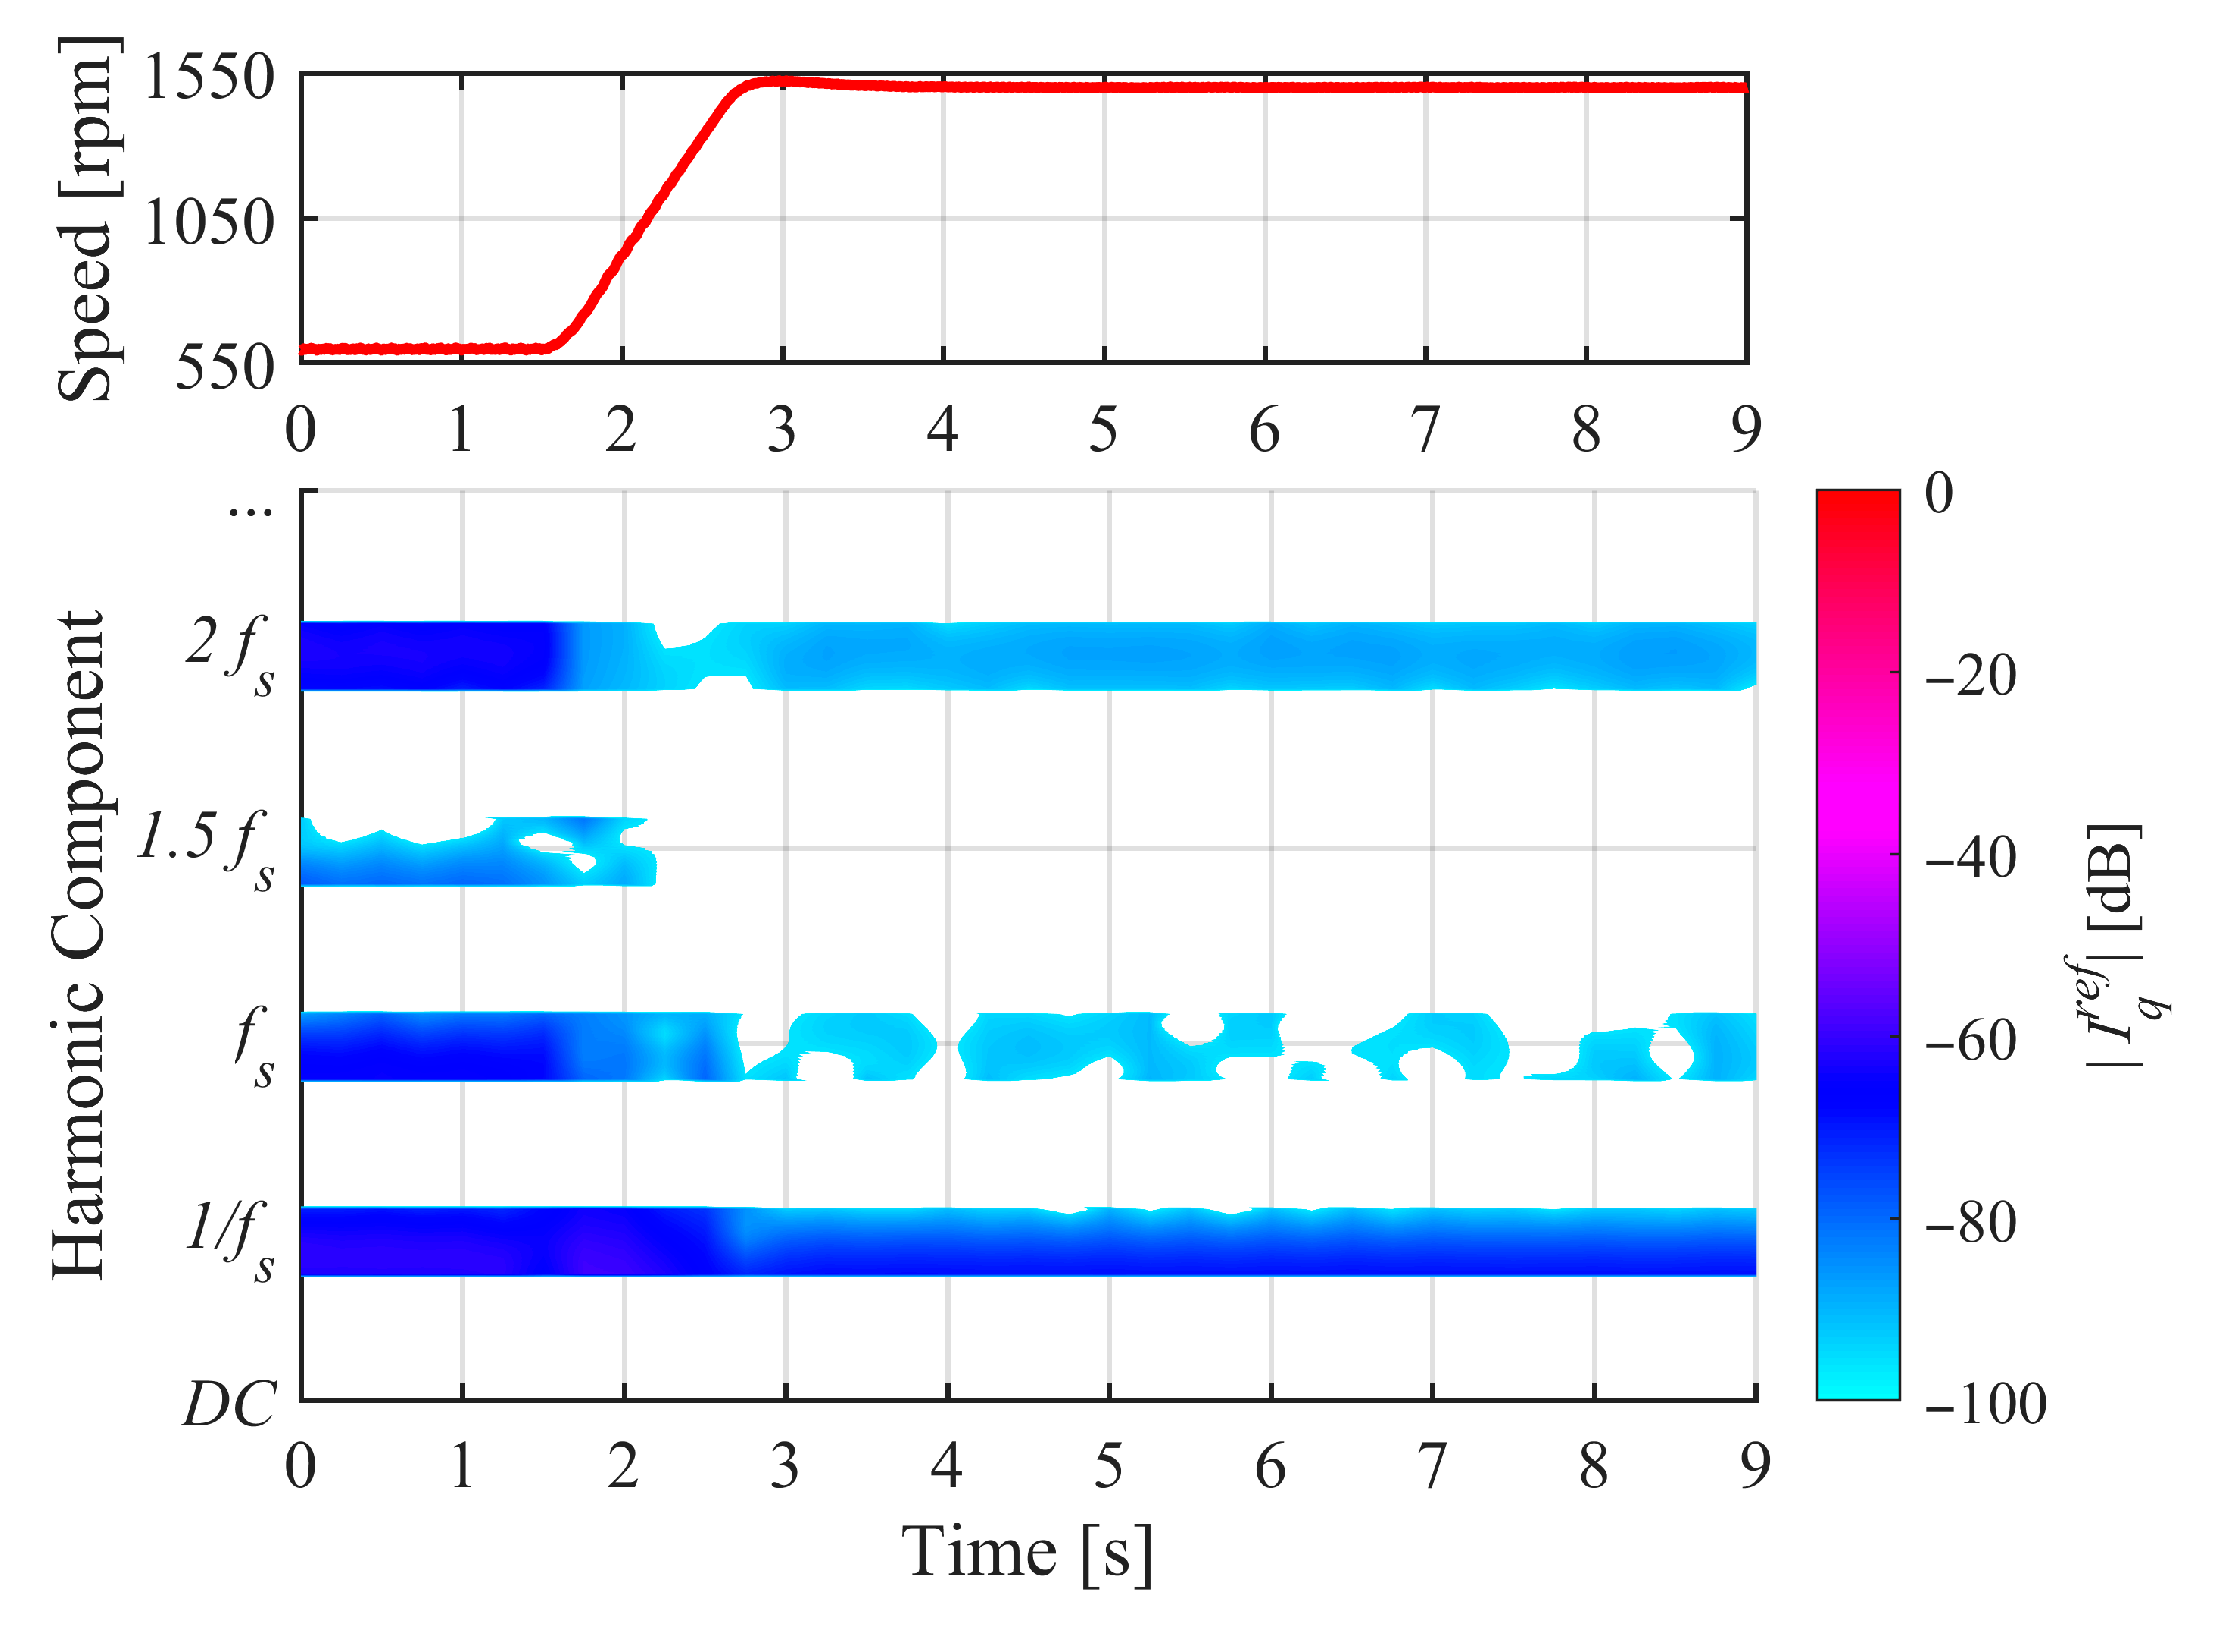
Higher or abrupt acceleration rates may be considered challenging for ITSCF diagnosis. Nonetheless, the findings depicted in Figure 14, Figure 15, Figure 16 and Figure 17 clarifies that the fault diagnostic technique shows considerable robustness in such conditions. In the subsequent analysis, the fault severity was relatively increased by reducing the fault resistance to 1 Ω to clearly visualize the effects of the ITSCF during abrupt acceleration rates. Considering a speed variation range of 700 rpm (9 Nm) to1300 rpm (17 Nm) and a motor acceleration rate of 300 rpm/s, Figure 14 illustrates the faulty condition case with 12 shorted turns and a fault resistance of 1 Ω. The occurrence of an ITSCF leads to the rise in the 2 f s component, drawing a continuous and clear pattern in the spectrogram along with the entire time interval. Figure 15 shows the case of the motor operating at rated load (rated load torque at rated speed), with a speed variation range increasing from 700 rpm (9 Nm) to 1500 rpm (20 Nm) at an acceleration rate of 500 rpm/s, with 12 shorted turns and a fault resistance of 1 Ω. Similarly, the fault diagnostic technique successfully detects the ITSCFs, as evidenced by the distinct pattern observed in the 2 f s signature.
Figure 16 and Figure 17 illustrate the motor operation under rated load conditions with speed increasing from 600 rpm (8 Nm) to 1200 rpm (15.7 Nm) at an acceleration rate of 600 rpm/s, and from 600 rpm (8 Nm) to 1500 rpm (20 Nm) at 800 rpm/s, respectively. Despite these significantly higher acceleration rates, the occurrence of an ITSCF involving 12 shorted turns with a fault resistance of 1 Ω clearly produces a consistent and well-defined pattern in the 2 f s signature, declaring once again the presence of the fault. Notably, Figure 14, Figure 15, Figure 16 and Figure 17 validate the robustness and effectiveness of the fault diagnostic technique under higher or abrupt motor accelerations.
These findings confirm that the fault diagnostic technique presents a consistent performance across different varying speed ranges, abrupt accelerations, and different load torque conditions, making it well-suited for A6PIM drive systems with MPC. Additionally, the use of a harmonic scale axis spectrogram significantly enhances the clarity and interpretability of the pattern for the observer.

5. Conclusions

This paper presents an ITSCF diagnostic technique applied to an A6PIM, driven by MPC and operating under varying speed variations and abrupt accelerations, covering a gap often overlooked in the literature. The proposed technique relies on the time–frequency analysis (through the application of the GT) of the AC component ( 2 f s ) within the q-axis reference current spectrogram. This approach eliminates the need for measured voltage or current signals for fault diagnostic purpose, making the methodology more straightforward and immune to the masking effects of fault symptoms in motor currents caused by closed-loop control systems. Additionally, analyzing the spectrogram along a harmonic component axis, rather than the conventional frequency axis, offers two key advantages: it reduces computational complexity and significantly simplifies the interpretation of fault patterns.
The results presented in Figure 7, Figure 8, Figure 9, Figure 10, Figure 11, Figure 12, Figure 13, Figure 14, Figure 15 and Figure 16 confirm the effectiveness of the diagnostic technique, as the emergence of a distinct pattern in the modified spectrogram of q-axis reference current directly declares the occurrence of an ITSCF in the phase windings. These patterns provided a clear and consistent fault indicator, thereby validating the methodology. Hence, the proposed technique successfully offers the detection of ITSCFs across different operating conditions, including constant speed variations and abrupt acceleration rates. Its ability to detect faults reliably under such challenging conditions makes it particularly valuable for critical applications where operational reliability and early fault detection are essential.
For future research, the discrimination between ITSCFs and high-resistance connections, as well as between other faults such as eccentricity or broken rotor bar faults, is considered particularly important, because these faults can yield similar fault symptoms, making the fault diagnostic challenging.

Author Contributions

Conceptualization, H.R.P.A., D.S.B.F., J.S. and A.J.M.C.; methodology, H.R.P.A., D.S.B.F., J.S. and A.J.M.C.; software, H.R.P.A. and J.S.; validation, H.R.P.A. and D.S.B.F.; formal analysis, H.R.P.A.; investigation, H.R.P.A. and D.S.B.F.; resources, A.J.M.C.; data curation, H.R.P.A.; writing—original draft preparation, H.R.P.A.; writing—review and editing, D.S.B.F. and A.J.M.C.; visualization, H.R.P.A.; supervision, A.J.M.C.; project administration, A.J.M.C.; funding acquisition, A.J.M.C. All authors have read and agreed to the published version of the manuscript.

Funding

This work was supported by the Portuguese Foundation for Science and Technology (FCT) under projects UIDB/04131/2020, UIDP/04131/2020, UI/BD/153572/2022, and 2022.14121.BD.

Data Availability Statement

The original contributions presented in this study are included in the article.

Conflicts of Interest

The authors declare no conflicts of interest.

Abbreviations

The following abbreviations are used in this manuscript:
DTCDirect torque control
FOCField-oriented control
MPCModel predictive control
ITSCFInter-turn short circuit fault
PMSMPermanent magnet synchronous motor
3PIMThree-phase induction motor
FFTFast Fourier transform
A6PIMAsymmetrical six-phase induction motor
WTWavelet transform
STFTShort-time Fourier transform
GTGabor transform
VSDVector space decomposition
PMSGPermanent magnet synchronous generator

References

  1. Levi, E. Multiphase Electric Machines for Variable-Speed Applications. IEEE Trans. Ind. Electron. 2008, 55, 1893–1909. [Google Scholar] [CrossRef]
  2. Levi, E. Advances in Converter Control and Innovative Exploitation of Additional Degrees of Freedom for Multiphase Machines. IEEE Trans. Ind. Electron. 2006, 63, 433–448. [Google Scholar] [CrossRef]
  3. Bojoi, R.; Farina, F.; Profumo, F.; Tenconi, A. Dual-Three Phase Induction Machine Drives Control—A Survey. IEEJ Trans. Ind. Appl. 2006, 126, 420–429. [Google Scholar] [CrossRef]
  4. Barrero, F.; Duran, M.J. Recent Advances in the Design, Modeling, and Control of Multiphase Machines—Part I. IEEE Trans. Ind. Electron. 2016, 63, 449–458. [Google Scholar] [CrossRef]
  5. Rodriguez, J.; Garcia, C.; Mora, A.; Davari, S.A.; Rodas, J.; Valencia, D.F.; Elmorshedy, M.; Wang, F.; Zuo, K.; Tarisciotti, L.; et al. Latest Advances of Model Predictive Control in Electrical Drives—Part II: Applications and Benchmarking With Classical Control Methods. IEEE Trans. Power Electron. 2022, 37, 5047–5061. [Google Scholar] [CrossRef]
  6. Serra, J.; Jlassi, I.; Cardoso, A.J.M. A Computationally Efficient Model Predictive Control of Six-Phase Induction Machines Based on Deadbeat Control. Machines 2021, 9, 306. [Google Scholar] [CrossRef]
  7. Zhang, P.; Du, Y.; Habetler, T.G.; Lu, B. A Survey of Condition Monitoring and Protection Methods for Medium-Voltage Induction Motors. IEEE Trans. Ind. Appl. 2011, 47, 34–46. [Google Scholar] [CrossRef]
  8. Gyftakis, K.N.; Sumislawska, M.; Kavanagh, D.F.; Howey, D.A.; McCulloch, M.D. Dielectric Characteristics of Electric Vehicle Traction Motor Winding Insulation Under Thermal Aging. IEEE Trans. Ind. Appl. 2016, 52, 1398–1404. [Google Scholar]
  9. Cardoso, A.J.M. Diagnosis and Fault Tolerance of Electrical Machines, Power Electronics and Drives; The Institution of Engineering and Technology: London, UK, 2018; ISBN 978-1-78561-531-3. [Google Scholar]
  10. Wolbank, T.M.; Loparo, K.A.; Wohrnschimmel, R. Inverter statistics for online detection of stator asymmetries in inverter-fed induction motors. IEEE Trans. Ind. Appl. 2003, 39, 1102–1108. [Google Scholar] [CrossRef]
  11. Bellini, A.; Filippetti, F.; Franceschini, G.; Tassoni, C. Closed-loop control impact on the diagnosis of induction motors faults. IEEE Trans. Ind. Appl. 2000, 36, 1318–1329. [Google Scholar] [CrossRef]
  12. Obeid, N.H.; Boileau, T.; Nahid-Mobarakeh, B. Modeling and Diagnostic of Incipient Interturn Faults for a Three-Phase Permanent Magnet Synchronous Motor. IEEE Trans. Ind. Appl. 2016, 52, 4426–4434. [Google Scholar] [CrossRef]
  13. Kim, K.-h.; Gu, B.-G.; Jung, I.-S. Online fault-detecting scheme of an inverter-fed permanent magnet synchronous motor under stator winding shorted turn and inverter switch open. IET Electr. Power Appl. 2011, 5, 529–539. [Google Scholar] [CrossRef]
  14. Xu, Z.; Zhang, J.; Xiong, J.; Wu, Y.; Cheng, M. An Improved High-Frequency Voltage Injection Method for Interturn Short-Circuit Fault Detection in PMSMs. IEEE Trans. Transp. Electrif. 2023, 9, 3228–3239. [Google Scholar] [CrossRef]
  15. Li, W.; Hang, J.; Ding, S.; Wang, Q. Common Predictive Model for PMSM Drives With Interturn Fault Considering Torque Ripple Suppression. IEEE Trans. Transp. Electrif. 2023, 9, 4071–4079. [Google Scholar] [CrossRef]
  16. Fang, J.; Sun, Y.; Wang, Y.; Wei, B.; Hang, J. Improved ZSVC-based fault detection technique for incipient stage inter-turn fault in PMSM. IET Electr. Power Appl. 2019, 13, 2015–2026. [Google Scholar] [CrossRef]
  17. Hang, J.; Zhang, J.; Xia, M.; Ding, S.; Hua, W. Interturn Fault Diagnosis for Model-Predictive-Controlled-PMSM Based on Cost Function and Wavelet Transform. IEEE Trans. Power Electron. 2020, 35, 6405–6418. [Google Scholar] [CrossRef]
  18. Hu, R.; Wang, J.; Mills, A.R.; Chong, E.; Sun, Z. Current-Residual-Based Stator Interturn Fault Detection in Permanent Magnet Machines. IEEE Trans. Ind. Electron. 2021, 68, 59–69. [Google Scholar] [CrossRef]
  19. Hu, J.; Wang, H.; Li, Y. Model-Based Severity Monitoring for Interturn Short Circuit Faults in Symmetrical Six-Phase PMSMs Using Subspace Current Residuals. IEEE Trans. Power Electron. 2023, 38, 16142–16152. [Google Scholar] [CrossRef]
  20. Wang, H.; Hu, J.; Li, Y. Fault Phase Location for Interturn Short-Circuit Faults in Symmetrical Six-Phase PMSMs Based on Subspace Current Residual. IEEE Trans. Transp. Electrif. 2024, 10, 8336–8345. [Google Scholar] [CrossRef]
  21. Wolkiewicz, M.; Tarchała, G.; Orłowska-Kowalska, T.; Kowalski, C.T. Online Stator Interturn Short Circuits Monitoring in the DFOC Induction-Motor Drive. IEEE Trans. Ind. Electron. 2016, 63, 2517–2528. [Google Scholar] [CrossRef]
  22. Cheng, S.; Zhang, P.; Habetler, T.G. An Impedance Identification Approach to Sensitive Detection and Location of Stator Turn-to-Turn Faults in a Closed-Loop Multiple-Motor Drive. IEEE Trans. Ind. Electron. 2011, 58, 1545–1554. [Google Scholar] [CrossRef]
  23. Drif, M.; Cardoso, A.J.M. Stator Fault Diagnostics in Squirrel Cage Three-Phase Induction Motor Drives Using the Instantaneous Active and Reactive Power Signature Analyses. IEEE Trans. Ind. Inform. 2014, 10, 1348–1360. [Google Scholar] [CrossRef]
  24. Berzoy, A.; Eldeeb, H.H.; Mohammed, O.A. On-Line Detection of Stator Faults in DTC-Driven IM Using SC Impedance Matrix Off-Diagonal Term. IEEE Trans. Ind. Appl. 2019, 55, 5906–5915. [Google Scholar] [CrossRef]
  25. Cruz, S.M.A.; Cardoso, A.J.M. Diagnosis of stator inter-turn short circuits in DTC induction motor drives. IEEE Trans. Ind. Appl. 2004, 40, 1349–1360. [Google Scholar] [CrossRef]
  26. Jia, Z.; Song, W.; Ma, C.; Zhang, B.; Sun, N. An MPC-Based Online Interturn Fault Diagnosis Method for Induction Motors With Fault Localization. IEEE Trans. Transp. Electrif. 2025, 11, 75–85. [Google Scholar] [CrossRef]
  27. Ma, C.; Song, W.; Jia, Z.; Zhang, B.; Huang, W. A Residual Stator Flux Angle-Based Interturn Short-Circuit Fault Diagnosis Method Alongside MPTC for Induction Motor Drives. IEEE J. Emerg. Sel. Top. Power Electron. 2025, 13, 2296–2306. [Google Scholar] [CrossRef]
  28. Şahin, İ.; Keysan, O. Model Predictive Controller Utilized as an Observer for Inter-Turn Short Circuit Detection in Induction Motors. IEEE Trans. Energy Convers. 2021, 36, 1449–1458. [Google Scholar] [CrossRef]
  29. Laadjal, K.; Bento, F.; Serra, J.; Cardoso, A.J.M. An Integrated Strategy for the Real-Time Detection and Discrimination of Stator Inter-Turn Short-Circuits and Converter Faults in Asymmetrical Six-Phase Induction Motors. IEEE Trans. Ind. Appl. 2024, 60, 377–387. [Google Scholar]
  30. Urresty, J.-C.; Riba, J.-R.; Saavedra, H.; Romeral, L. Detection of inter-turns short circuits in permanent magnet synchronous motors operating under transient conditions by means of the zero sequence voltage. In Proceedings of the 2011 14th European Conference on Power Electronics and Applications, Birmingham, UK, 30 August–1 September 2011; pp. 1–9. [Google Scholar]
  31. Rosero, J.; Cusido, J.; Garcia, A.; Romeral, L.; Ortega, J.A. Detection of Stator Short Circuits in PMSM by mean of joint Time-Frequency Analysis. In Proceedings of the 2007 IEEE International Symposium on Diagnostics for Electric Machines, Power Electronics and Drives, Cracow, Poland, 6–8 September 2007; pp. 420–425. [Google Scholar]
  32. Rosero, J.A.; Romeral, L.; Ortega, J.A.; Rosero, E. Short-Circuit Detection by Means of Empirical Mode Decomposition and Wigner–Ville Distribution for PMSM Running Under Dynamic Condition. IEEE Trans. Ind. Electron. 2009, 56, 4534–4547. [Google Scholar] [CrossRef]
  33. Dlamini, M.; Barendse, P.S.; Khan, A.M. Detecting faults in inverter-fed induction motors during startup transient conditions. In Proceedings of the 2014 IEEE Energy Conversion Congress and Exposition (ECCE), Pittsburgh, PA, USA, 14–18 September 2014; pp. 3131–3138. [Google Scholar]
  34. Bonet-Jara, J.; Pons-Llinares, J.; Morinigo-Sotelo, D.; Gyftakis, K.N. A Novel Approach for Early Detection of Inter-turn Faults in Induction Motors during Start-up. In Proceedings of the 2023 IEEE 14th International Symposium on Diagnostics for Electrical Machines, Power Electronics and Drives (SDEMPED), Chania, Greece, 28–31 August 2023; pp. 56–62. [Google Scholar]
  35. Riera-Guasp, M.; Antonino-Daviu, J.A.; Pineda-Sanchez, M.; Puche-Panadero, R.; Perez-Cruz, J. A General Approach for the Transient Detection of Slip-Dependent Fault Components Based on the Discrete Wavelet Transform. IEEE Trans. Ind. Electron. 2008, 55, 4167–4180. [Google Scholar] [CrossRef]
  36. Pons-Llinares, J.; Antonino-Daviu, J.; Roger-Folch, J.; Moríñigo-Sotelo, D.; Duque-Pérez, O. Mixed eccentricity diagnosis in Inverter-Fed Induction Motors via the Adaptive Slope Transform of transient stator currents. Mech. Syst. Signal Process. 2014, 48, 423–435. [Google Scholar] [CrossRef]
  37. Fernandez-Cavero, V.; Pons-Llinares, J.; Duque-Perez, O.; Morinigo-Sotelo, D. Detection and quantification of bar breakage harmonics evolutions in inverter-fed motors through the dragon transform. ISA Trans. 2021, 109, 352–367. [Google Scholar] [CrossRef] [PubMed]
  38. Antonino-Daviu, J.A.; Zamudio-Ramirez, I.; Osornio-Rios, R.A.; Dunai, L.; Quijano-Lopez, A. Application of Transient Analysis to Detect Rotor and Stator Asymmetries in Wound Rotor Induction Motors: A Field Case. In Proceedings of the 2021 IEEE Workshop on Electrical Machines Design, Control and Diagnosis (WEMDCD), Modena, Italy, 8–9 April 2021; pp. 237–242. [Google Scholar]
  39. Antunes, H.R.P.; Fonseca, D.S.B.; Serra, J.; Cardoso, A.J.M. Stator Fault Diagnostics in Asymmetrical Six-phase Induction Motor Drives With Model Predictive Control under Transient Regimes. In Proceedings of the 2024 International Symposium on Power Electronics, Electrical Drives, Automation and Motion (SPEEDAM), Napoli, Italy, 19–21 June 2024; pp. 1204–1209. [Google Scholar]
  40. Cruz, S.M.A.; Cardoso, A.J.M. Multiple reference frames theory: A new method for the diagnosis of stator faults in three-phase induction motors. IEEE Trans. Energy Convers. 2005, 20, 611–619. [Google Scholar] [CrossRef]
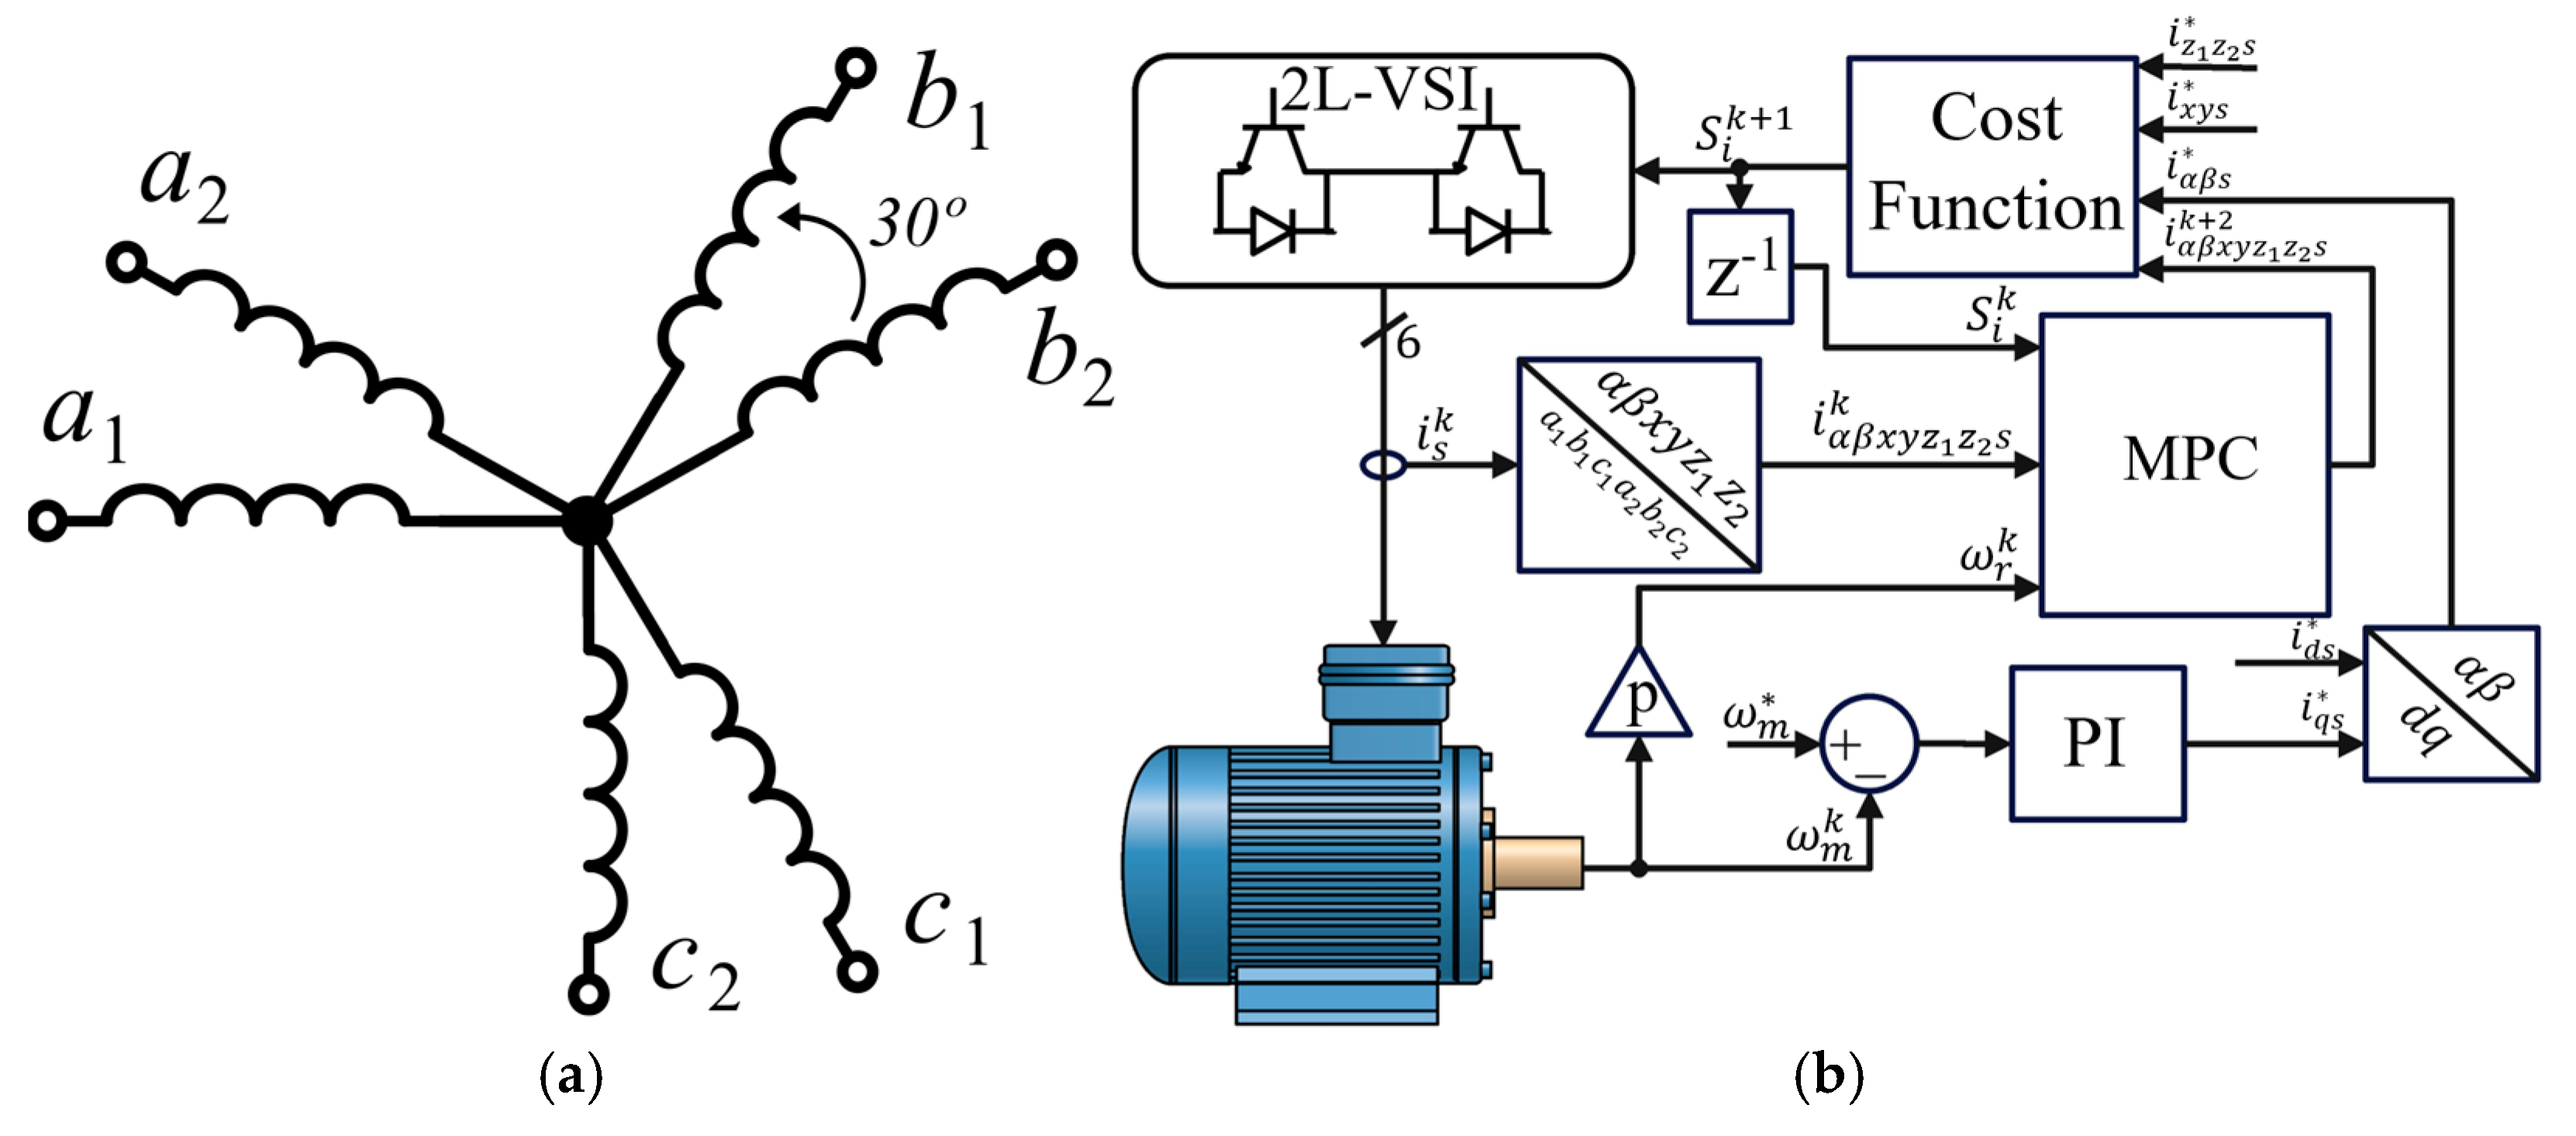
Figure 1. A6PIM drive schematics: (a) winding arrangement; (b) MPC implementation.
Machines 13 00740 g001
Figure 2. Pseudo-flowchart of the proposed ITSCF diagnostics technique.
Machines 13 00740 g002
Figure 3. MPC implementation scheme for the A6PIM.
Machines 13 00740 g003
Figure 4. Experimental test bench: (A) power electronic devices; (B) A6PIM and PMSG; (C) controller devices.
Machines 13 00740 g004
Figure 5. A6PIM stator phase A2 winding tappings location.
Machines 13 00740 g005
Figure 6. A6PIM motor quantities corresponding to (a) the motor operating at 1.4 Nm load torque (speeds varying from 300 rpm to 1500 rpm, at an acceleration rate of 200 rpm/s), under the faulty condition, with 21 shorted turns and a fault resistance of 2 Ω, and (b) to the motor operating at 20 Nm load torque (speeds varying from 700 rpm to 1500 rpm, at an acceleration rate of 500 rpm/s), under the faulty condition, with 12 shorted turns and a fault resistance of 1 Ω. (i) Six-phase motor currents; (ii) motor speed; (iii) load torque; (iv) q-axis reference current.
Machines 13 00740 g006
Figure 7. Motor speed profile and spectrogram of the q-axis reference current during motor operation at 1.4 Nm load torque with speeds varying from 300 rpm to 1500 rpm, at an acceleration rate of 200 rpm/s, under the healthy condition.
Machines 13 00740 g007
Figure 8. Motor speed profile and spectrogram of the q-axis reference current during motor operation at 1.4 Nm load torque with speeds varying from 300 rpm to 1500 rpm, at an acceleration rate of 200 rpm/s, under the faulty condition with 21 shorted turns and a fault resistance of 2 Ω.
Machines 13 00740 g008
Figure 9. Motor speed profile and spectrogram of the q-axis reference current during motor operation at 1.4 Nm load torque with speeds varying from 1000 rpm to 1500 rpm, at an acceleration rate of 100 rpm/s, under healthy conditions.
Machines 13 00740 g009
Figure 10. Motor speed profile and spectrogram of the q-axis reference current during motor operation at 1.4 Nm load torque with speeds varying from 1000 rpm to 1500 rpm, at an acceleration rate of 100 rpm/s, under faulty conditions with 12 shorted turns and a fault resistance of 2 Ω.
Machines 13 00740 g010
Figure 11. Motor speed profile and spectrogram of the q-axis reference current during motor operation at 1.4 Nm load torque with speeds varying from 1000 rpm to 1500 rpm, at an acceleration rate of 100 rpm/s, under faulty conditions with 21 shorted turns and a fault resistance of 2 Ω.
Machines 13 00740 g011
Figure 12. Motor speed profile and spectrogram of the q-axis reference current during motor operation at 20 Nm load torque (at 1500 rpm) with speeds varying from 1000 rpm to 1500 rpm, at an acceleration rate of 100 rpm/s, under healthy conditions.
Machines 13 00740 g012
Figure 13. Motor speed profile and spectrogram of the q-axis reference current during motor operation at 20 Nm load torque (at 1500 rpm) with speeds varying from 1000 rpm to 1500 rpm, at an acceleration rate of 100 rpm/s, under faulty conditions with 21 shorted turns and a fault resistance of 2 Ω.
Machines 13 00740 g013
Figure 14. Motor speed profile and spectrogram of the q-axis reference current during motor operation at 17 Nm load torque (at 1300 rpm) with speeds varying from 700 rpm to 1300 rpm, at an acceleration rate of 300 rpm/s, under faulty conditions with 12 shorted turns and a fault resistance of 1 Ω.
Machines 13 00740 g014
Figure 15. Motor speed profile and spectrogram of the q-axis reference current during motor operation at 20 Nm load torque (at 1500 rpm) with speeds varying from 700 rpm to 1500 rpm at an acceleration rate of 500 rpm/s, under faulty conditions with 12 shorted turns and a fault resistance of 1 Ω.
Machines 13 00740 g015
Figure 16. Motor speed profile and modified spectrogram of the q-axis reference current during motor operation at 20 Nm load torque (at 1500 rpm) with speeds varying from 600 rpm to 1200 rpm at an acceleration rate of 600 rpm/s, under faulty conditions with 12 shorted turns and a fault resistance of 1 Ω.
Machines 13 00740 g016
Figure 17. Motor speed profile and spectrogram of the q-axis reference current during motor operation at 20 Nm load torque (at 1500 rpm) with speeds varying from 600 rpm to 1500 rpm at an acceleration rate of 800 rpm/s, under faulty conditions with 12 shorted turns and a fault resistance of 1 Ω.
Machines 13 00740 g017
Table 1. A6PIM drive parameters.
ParameterValue
Stator phase resistance (RS)1.03 Ω
Rotor phase resistance (Rr)0.89 Ω
Stator phase leakage inductance (Lσs)9.7 mH
Rotor leakage inductance (Lσr)9.7 mH
Magnetizing inductance (Lm)220.3 mH
Moment of inertia (J)0.0563 kg·m2
Number of pole pairs (p)2
Proportional gain ( k p )0.08
Integral gain ( k i )0.2
Disclaimer/Publisher’s Note: The statements, opinions and data contained in all publications are solely those of the individual author(s) and contributor(s) and not of MDPI and/or the editor(s). MDPI and/or the editor(s) disclaim responsibility for any injury to people or property resulting from any ideas, methods, instructions or products referred to in the content.