Article

Experimental Analysis of a Coaxial Magnetic Gear Prototype

1
Department of Industrial Engineering, Università degli Studi di Padova, Via Venezia 1, 35131 Padova, Italy
2
Department of Energy, Politecnico di Torino, Corso Duca degli Abruzzi 24, 10129 Torino, Italy
*
Author to whom correspondence should be addressed.
Machines 2025, 13(8), 716; https://doi.org/10.3390/machines13080716
Submission received: 9 July 2025 / Revised: 4 August 2025 / Accepted: 9 August 2025 / Published: 12 August 2025
(This article belongs to the Special Issue Dynamics and Lubrication of Gears)

Abstract

Magnetic gears are becoming promising devices that can replace conventional mechanical gears in several applications, where reduced maintenance, absence of lubrication and intrinsic overload protection are especially relevant. This paper focuses on the experimental analysis of a coaxial magnetic gear prototype recently developed at the Department of Industrial Engineering of the University of Padova. It is found that its efficiency is high and aligned with prototypes in the literature, its stationary response confirms the velocity ratio of the corresponding mechanical planetary gear, the overload protection is aligned with numerical prediction, while the dynamic response highlights that the intrinsic compliance of the magnetic coupling prevents the use of such device in high-frequency transients. It is concluded that the proposed architecture can be effectively employed for speed reducers applications where low-frequency modulation is sufficient, which includes many industrial applications. Nevertheless, high rotational speeds are allowed. The performance characteristics, although specific for the prototype considered, experimentally highlights the key features of coaxial magnetic gear devices. The experimental performance are also compared with estimations from the literature, when available.

1. Introduction

The first patents related to magnetic gears (MG) with permanent magnets (PM) date back to the 1940s [1], with coaxial solutions proposed in the late 1960s [2]. Although several topologies of MG with PM have been proposed in the following years, the practical applications of the technology remained quite limited, mainly because of its low torque density (when compared against the mechanical counterparts). In [3], a new topological solution for the planetary magnetic gear has been proposed, which significantly improved the torque density, thus making the technology appealing also for practical applications. Nowadays, the most common mechanical topologies (external/internal spur gears, worm gears, rack and pinion, etc.) have their magnetic counterparts [4,5]. The magnetic planetary gear is one of the most promising topologies, and basically consists of an inner sun, a carrier and an outer ring rotors, where the number of mechanical teeth is replaced by the number of magnetic poles. There are several advantages in using MG, including reduced maintenance, lack of lubrication, and automatic overload protection. Applications have been reported for pumps used in the chemical/pharmaceutical and food industries [6,7], robotics and aerospace [8], wind turbines [9,10], marine propulsion [11], aircraft propulsion [12], and automotive applications [13,14].
While MG have been widely studied using numerical methods and analytical models, experimental investigations remain comparatively scarce. An experimental prototype derived from the concepts introduced in [3] is analysed in [15]. The torque density is 73 kNm/m3 and the efficiency at large transmitted torques exceeds 97%. A concentric, coaxial, field-modulated arrangement is employed which has become the benchmark for the basic topology of high-performance MG. Another early experimental implementation of a coaxial MG is reported in [16]. The three main tests carried out are related to velocity ratio (to verify that there is no pole slippage), static torque (to assess the transmission torque), and no-load run test (to assess the cogging torque). In [17], a coaxial MG prototype is designed and tested. The focus of the modelling is on end-effects that reduce the torque density experimentally observed when compared against the numerical predictions. The experiments are limited to the measurement of stall torque, rotational losses in no-load conditions and efficiency at a constant load. A recent surveys of MG technologies used in mechanical power transmission, with particular attention to their industrial applicability, can be found in [18,19]. The reviews include discussions of various prototypes, some of which had been physically built and tested.
In this work, the performance of the coaxial MG speed-reducer prototype recently developed at the Department of Industrial Engineering of the University of Padova is experimentally assessed and compared both with predictions from physical models and figures from the literature, when available. The fundamentals are discussed and similarities with the mechanical counterparts highlighted. The prototype performance is assessed both in stationary and dynamic conditions. In particular, in addition to the standard analyses related to velocity ratio, power losses and efficiency, the frequency responses are investigated under different operating conditions, including variable MG angular velocity and transmitted torque. The overload protection is also analysed with different approaches to confirm the robustness of the estimations.
This manuscript is organized as follows. In Section 2, the fundamentals of the MG are given. In Section 3, the experimental set-up is described. In Section 4, the steady-state and dynamic experimental analyses carried out are reported, with comparison against numerical predictions.

2. Fundamentals

The layout of the planetary MG prototype is depicted in Figure 1a and consists of three coaxial rotors. The sun rotor (inner) and ring rotor (outer) have magnets, which are denoted in blue/red. The carrier rotor (middle) consists of a set of ferromagnetic iron poles interspersed with polymer, shown in gray and green, respectively. The physical components of the MG prototype used in this work are shown in Figure 1b.
The sun has N s pole pairs, the ring has N r pole pairs, and the carrier has Q iron poles. For the highest torque transmission capability, the following relationship between N s , N r , Q must hold [5]
Q = N s + N r .
A planetary MG can operate in different input/output configurations, similarly to its mechanical counterparts. In the adopted configuration, the ring rotor is kept fixed, the input is the sun rotor, and the output is the carrier rotor. Hence, the MG prototype works as a planetary gear and the speed is reduced from the input to the output.
Under the assumption that losses and cogging torque are negligible, the torque T m transmitted by the MG (measured at the carrier rotor) is [13]
T m = T M sin θ e ,
where T M is the limit torque of the MG at the carrier and θ e is the load angle defined as
θ e = N s θ s + N r θ r Q θ c ,
with θ s , θ r , θ c the (absolute) angular positions of the sun, ring, and carrier rotors, respectively.
In normal operating conditions, the transmitted torque T m remains smaller than the limit torque T M , and | θ e |   <   π 2 . If the transmitted torque exceeds the limit torque, the magnets lose alignment, resulting in slip between the sun and carrier rotors. Consequently, the carrier rotor starts rotating freely, depending on the load characteristics. In such scenarios, overload protection occurs and the load becomes disconnected from the input, resulting in a loss of control. The MG can resume its normal operating condition as long as the transmitted torque returns lower than the limit torque [18,19]. Pole-slip detection strategies that attempt to recover and re-engage the load were suggested in the literature, e.g., in [20].
Differentiating twice (3) with respect to the time gives
θ ˙ e = N s θ ˙ s + N r θ ˙ r Q θ ˙ c ,
θ ¨ e = N s θ ¨ s + N r θ ¨ r Q θ ¨ c ,
where the over dot denotes the time derivative. In the adopted configuration it is θ r = 0 , hence θ r vanishes in (3)–(5).
The performance of MG is characterized in both stationary and dynamic conditions. The former is fundamental for the analysis of the torque transmission capability under stationary operation, while the latter—including assessment of the frequency response of the MG—reveals the system’s response to time-varying excitations. These analyses are essential for understanding the suitable operating scenarios of such devices, which may include stationary or transient loads depending on the application.

2.1. Stationary Conditions

In stationary conditions the load angle θ e is constant, hence (4) gives
θ ˙ c = N s Q θ ˙ s .
The velocity ratio τ is constant and given by
τ = θ ˙ c θ ˙ s , = ( 6 ) N s Q , = ( 1 ) N s N s + N r .
Using (7), the load angle θ e from (3) can be rewritten
θ e = N s Q θ s θ c Q = τ θ s θ c Q ,
where τ θ s θ c is the angular shift measured at the output, i.e., measured at the carrier rotor. The output meshing stiffness is given by
k m = d T m d ( τ θ s θ c ) = Q T M cos θ e = Q T M 1 sin 2 θ e = ( 2 ) Q T M 1 T m T M 2 ,
while the input meshing stiffness (i.e., measured at the sun) is τ 2 k m . The maximum output meshing stiffness is attained at θ e = T m = 0 and is expressed as
k M = Q T M .
As suggested by (10), the maximum meshing stiffness k M can be increased by acting on either the limit torque T M or the number of iron poles Q. According to [21], the limit transmitted torque T M is
T M D L B s B r h s h r ,
where D , L are the diametral and axial dimensions of the MG, B s , B r are the sun and ring magnet remanences, and h s , h r are the corresponding thicknesses, respectively. Accordingly, the maximum meshing stiffness k M becomes
k M Q D L B s B r h s h r ,
and can thus be increased by enlarging the MG dimensions (i.e., D , L ), employing magnets with higher remanences (i.e., B s , B r ) or thicknesses (i.e., h s , h r ), or increasing the number of iron poles (i.e., Q). In the latter case, the sun N s and ring N r pole pairs need to be adjusted accordingly to match the desired velocity ratio τ defined in (7), while satisfying the constraint given by (1) to ensure the maximum torque transmission capability.
As a final remark, (7) is identical to the one used for mechanical planetary gears, as the number of pole pairs of the sun N s and ring N r is replaced by the number of teeth of the sun and ring.

2.2. Dynamic Model

The dynamical equations of the planetary MG are [22]
J s θ ¨ s = T s T M N s Q sin θ e ,
J c θ ¨ c = T c + T M sin θ e ,
J r θ ¨ r = T r T M N r Q sin θ e ,
where T s , J s are the external torque and moment of inertia of the sun rotor (input side), T c , J c are the external torque and moment of inertia of the carrier rotor (output side), and T r , J r are the external torque and moment of inertia of the ring rotor. The torques T s , T c , T r are positive clockwise, i.e., same direction of the angular velocities θ ˙ s , θ ˙ c , θ ˙ r ; see Figure 1a.
In the adopted configuration, it is θ r = 0 , hence θ ¨ r vanishes and (15) gives the reaction torque T r = T M N r Q sin θ e applied on the ring rotor. Solving (13), (14) for θ ¨ s , θ ¨ c and introducing the solutions into (5) gives
θ ¨ e + ω 0 2 sin θ e = γ e ,
where
ω 0 2 = T M ( J s Q 2 + J c N s 2 ) Q J s J c
= ( 10 ) k M ( J s Q 2 + J c N s 2 ) Q 2 J s J c ,
γ e = N s J s T s Q J c T c ,
It is worth noting that (16) is a second-order ordinary differential equation in θ e , and corresponds to the dynamics of a non-linear pendulum with angular frequency ω 0 in the linear regime.
In stationary conditions (i.e., θ ¨ s = θ ¨ c = θ ¨ e = 0 ) it is
θ e 0 = arcsin T m T M ,
γ e 0 = N s 2 J s Q + Q J c T m ,
T c 0 = T m ,
T s 0 = N s Q T m ,
where the subscript 0 denotes variables at the equilibrium and T m is the stationary transmitted torque, measured at the carrier rotor.

2.3. Frequency Response Function

Under the assumption of small oscillation around the equilibrium, one can linearize (16) to give
δ θ ¨ e + ( ω 0 2 cos θ e 0 ) δ θ e = δ γ e ,
where δ denotes variations with respect to the equilibrium, while
cos θ e 0 = 1 sin 2 θ e 0 = ( 19 ) 1 T m T M 2 .
The natural frequency associated with (23) is
f n = ω 0 2 π cos θ e 0 = ( 24 ) ω 0 2 π 1 T m T M 2 4 ,
and its maximum value is attained at θ e 0 = T m = 0 and is given by
f 0 = ω 0 2 π .
Using (17) and considering the velocity ratio τ as defined in (7), along with the constraint between Q , N s , N r in (1), the (squared) maximum natural frequency f 0 2 can be expressed as
f 0 2 k M J ( 12 ) Q B s B r h s h r D 3 ,
where J D 4 L denotes the MG inertia. Therefore, the natural frequency of the MG can be increased by employing magnets with higher remanences (i.e., B s , B r ) or thicknesses (i.e., h s , h r ), or increasing the number of iron poles (i.e., Q). Conversely, it reduces when enlarging the diametral dimension (i.e., D) to increase the limit torque T M , due to the increased machine inertia.
The frequency response function (FRF) is obtained from the forced response to a harmonic excitation with angular frequency ω . The complex excitation δ γ e and corresponding response δ θ e are
δ γ e = Γ e i ω t , δ θ e = Θ e i ω t ,
where i = 1 is the imaginary unit and Γ , Θ are the (complex) amplitudes of the excitation and response, respectively. Introducing (28) into (23) gives the FRF from the input δ γ e to the angular rate δ θ ˙ e
H ( ω ) = i ω Θ Γ = 1 ω 0 · i ω ω 0 cos θ e 0 ( ω ω 0 ) 2 .
In the case that damping is included in the system, the FRF from δ γ e to δ θ ˙ e becomes
H ( ω ) = 1 ω 0 · i ω ω 0 cos θ e 0 ( ω ω 0 ) 2 + 2 ζ i cos θ e 0 ω ω 0 ,
where ζ is the damping ratio. It is worth noting that (30) is the typical FRF of a second-order system when expressed using the natural angular frequency ω n = 2 π f n = ω 0 c o s θ e 0 .
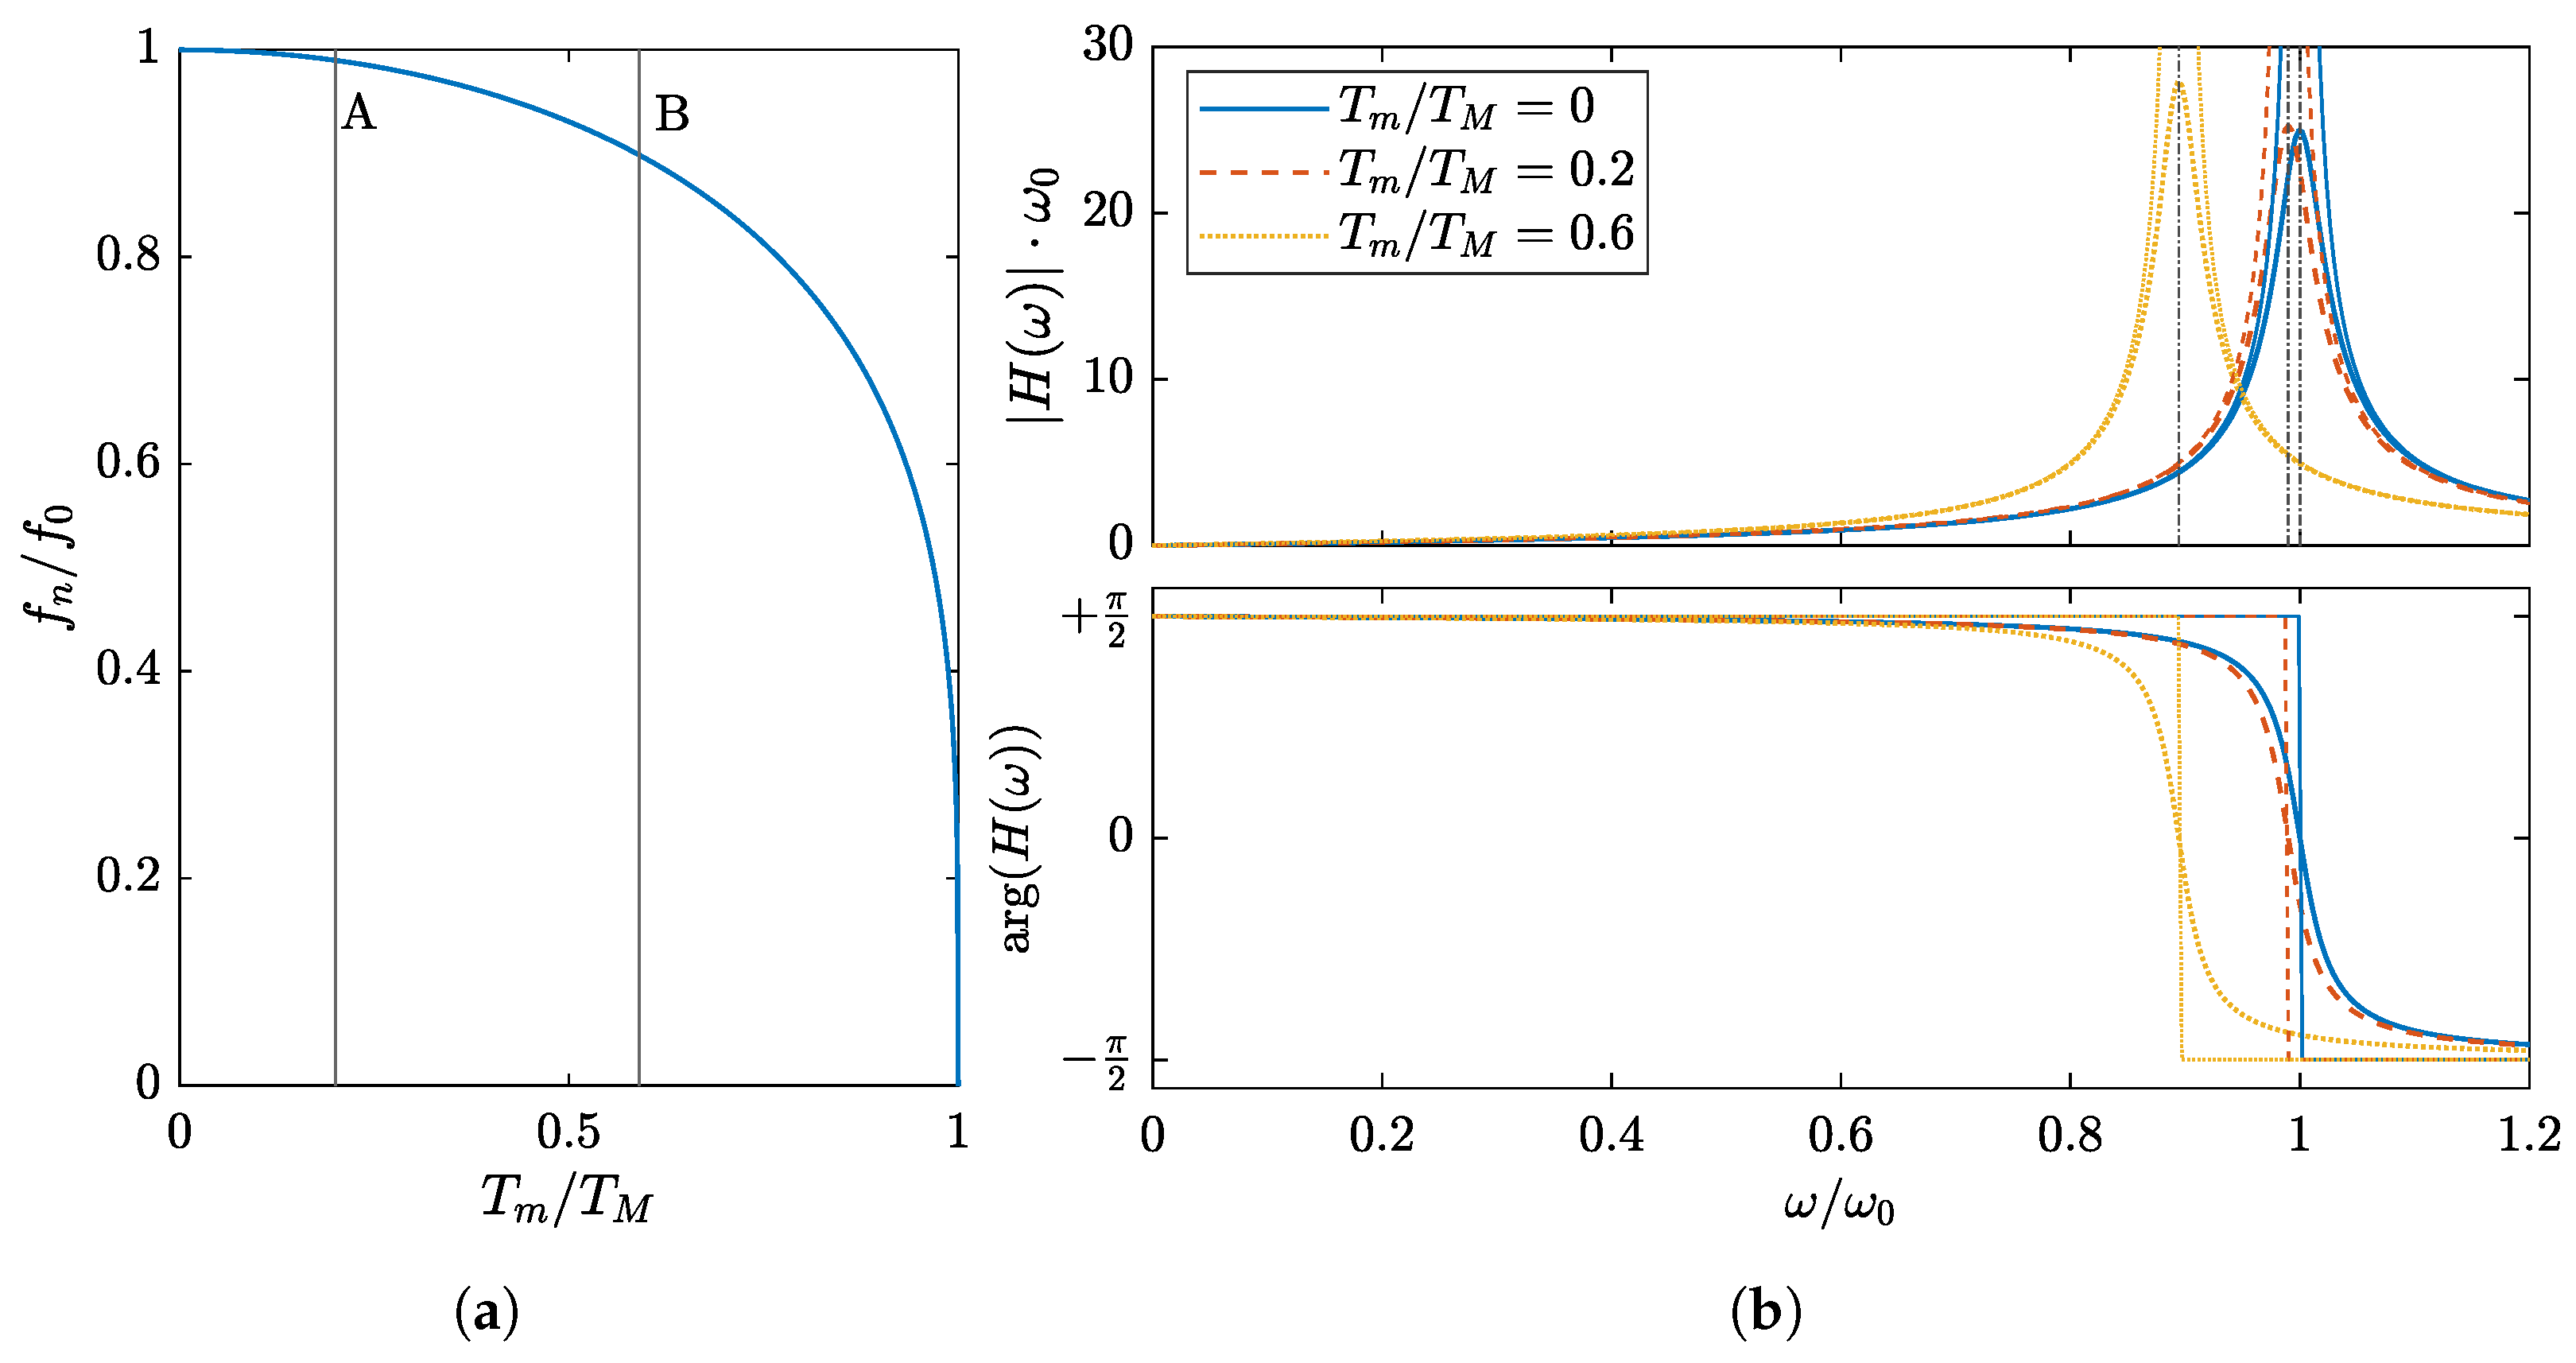
Figure 2a shows the natural frequency given by (25) as a function of the ratio T m / T M . The maximum value is attained at T m / T M = 0 and is given by (26). The natural frequency remains almost constant (difference <   1 % ) up to T m / T M = 0.2 —see the vertical line with label A in Figure 2a. As the ratio T m / T M increases, the natural frequency reduces. As an example, such reduction is 10 % at T m / T M 0.6 —see the vertical line with label B in Figure 2a.
Figure 2b shows the magnitude (top) and phase (bottom) of the FRFs obtained from (30) with ζ = 0.02 (thick lines) and with no damping (i.e., ζ = 0 , thin lines). Three values of T m / T M are considered, namely T m / T M = 0 (solid blue), T m / T M = 0.2 (dashed red), and T m / T M = 0.6 (dotted yellow). In all scenarios, at ω / ω 0 = 0 the magnitude is zero and the phase is + π 2 rad. This corresponds to stationary conditions. As the frequency increases, the magnitude increases as well while the phase reduces. At the resonance (i.e., ω / ω 0 = cos θ e 0 ) the magnitude is near the peak and the phase is zero—see the vertical dash-dot lines. In the case of no damping, the magnitude tends to infinity at the resonance. Finally, for ω / ω 0 > > 1 the magnitude tends to zero and the phase to π 2 rad. The case with T m / T M = 0 (solid blue) has the highest resonance frequency. When T m / T M = 0.2 (dashed red) the FRF remains quite similar to the one obtained for T m / T M = 0 , namely the resonance frequency decreases by 1% and the peak magnitude increases by 1%. As T m / T M increases, the resonance shifts to lower frequencies and the peak magnitude increases.

3. Experimental Set-Up

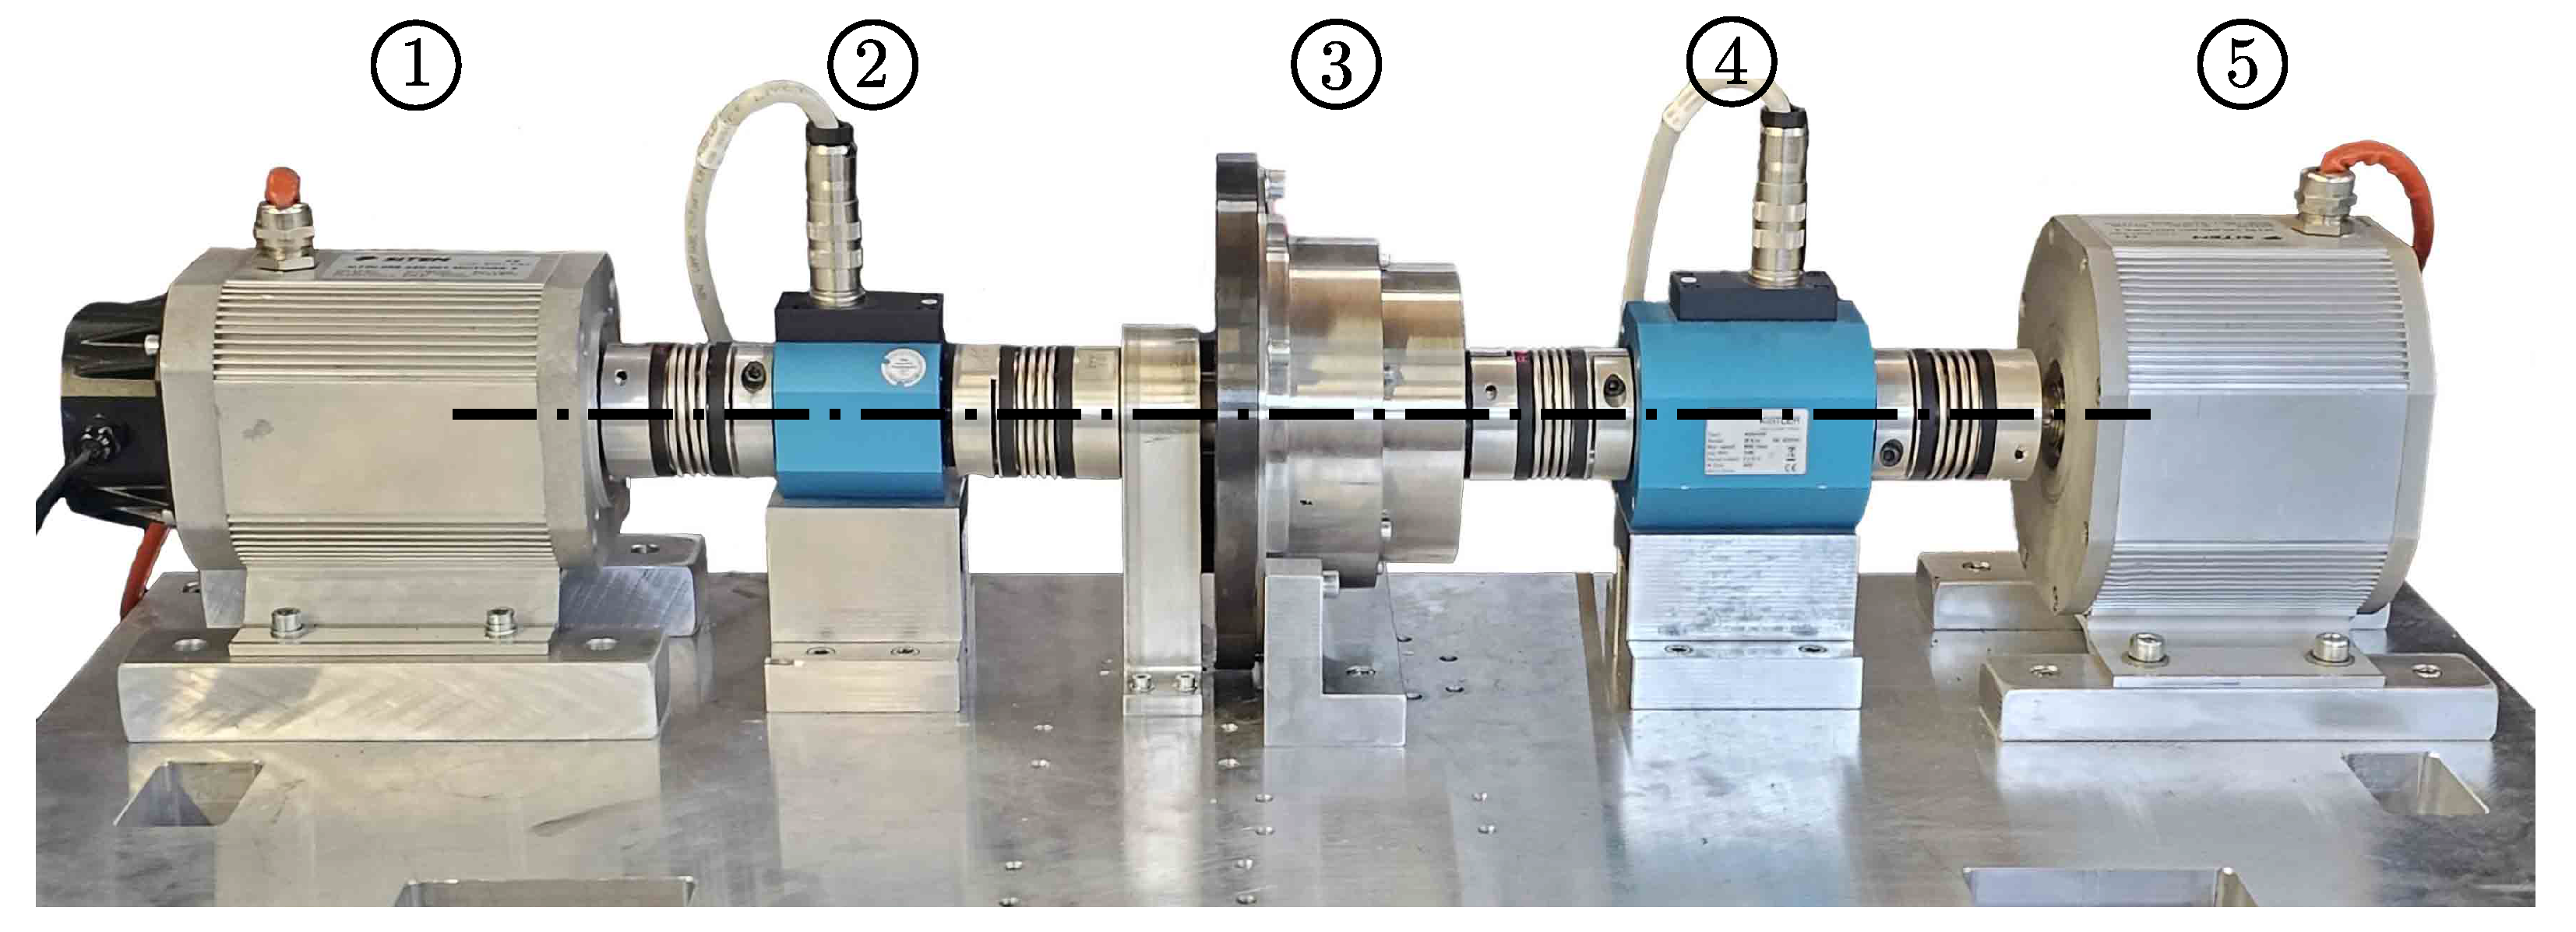
The experimental set-up is shown in Figure 3. The traction electric motor (label 1 in Figure 3) applies an angular velocity and injects energy into the mechanical system (i.e., traction torque). On the opposite side, the load electric motor (label 5 in Figure 3) applies a output braking torque and draws energy from the system. The coaxial MG prototype (label 3 in Figure 3) is located between the two motors. The input torque (left side) is measured by a Kistler 4520A010 torque sensor (label 2 in Figure 3). The output torque (right side) is measured by a Kistler 4520A020 torque sensor (label 4 in Figure 3). The measured torques include the bearing friction, i.e., three bearings on the input side (one in the Kistler 4520A010 torque sensor and two that support the MG input shaft), and three bearings on the output side (one in the Kistler 4520A020 torque sensor and two that support the MG output shaft). The elements of the transmission are interconnected using four BK2/15 elastic joints. The main characteristics of the experimental set-up are reported in Table 1.
A NI cRIO-9065 running at 1 kHz is employed for data acquisition and system control. The controller is equipped with a NI-9205 analog-to-digital converter that acquires four analog signals, specifically the input and output torques from the torque sensors, and the input and output angular velocities from the traction and load motors. A NI-9263 digital-to-analog converter is employed to generate the reference signals for the traction motor (reference input angular velocity) and load motor (reference output torque).
The main parameters of the employed MG prototype are in Table 2 [13]. The device has 5 sun pole pairs, 13 ring pole pairs, and 18 iron poles, for a nominal velocity ratio of 1 3.6 0.278 , which is given by (7). The nominal limit torque at the carrier is 13.1 Nm, which is calculated with a 3D FEM analysis of the machine [13].
The device was designed using the automatic optimization procedure proposed in [21]. Specifically, the MG geometry was selected as a trade-off between torque density and efficiency, while meeting the specified velocity ratio and satisfying the constraint given by (1). Multiphysics constraints including thermal aspects, mechanical strength, and PM demagnetization were also taken into account in the optimization process, with the latter being the most critical.
It is worth noting that the torsional stiffness of the input and output transmissions (torque sensor plus two elastic joints) is much larger than the maximum meshing stiffness of the MG prototype (>10 times), which is 236 Nm/rad at the carrier. Consequently, the angular velocities of the traction and load motors are considered identical to the input and output angular velocities of the MG prototype, respectively.
The MG prototype employs NdFeB magnets of grade 40SH, with a density of 7.5 g/cm3. The permanent magnets have radial thicknesses of 6.75 mm and 5 mm for the sun and ring rotors, respectively. The thickness of the iron poles is 8.25 mm. The air gap between the rotors is 2 mm in both the sun-to-carrier and carrier-to-ring interfaces. Each magnet segment spans an angle of 12 deg and 6.92 deg for the sun and ring, for a total of three and two radial segments for each magnetic pole, respectively.
The axial length of the rotors is 20 mm, comprising two axial segments. The outer diameter of the sun is 73.5 mm. The inner diameter of the ring is 98 mm. The yoke thicknesses of the rotors are 8 mm for both the sun and ring. The overall diametrical dimension is 124 mm (inner ring diameter plus thickness of magnets plus yoke thickness), with a total mass of roughly 1.3 kg and a volume of π 4 12 . 4 2 · 2 = 242 cm3 (including magnets, iron, and rotor yokes). The nominal torque density of the MG prototype is 54 kNm/m3 and 10 Nm/kg.
With the employed parameters, the maximum natural frequency f 0 given by (26) is approximately 68 Hz. The natural frequency remains almost the same (i.e., difference <   1 % ) up to T m 2.5 Nm, while it reduces by 10% at T m 7.5 Nm.

4. Experimental Test and Discussion

4.1. Velocity Ratio

The velocity ratio τ of the MG prototype is experimentally determined under different stationary operating conditions. Each test consists of the MG running at constant input angular velocity and transmitted torque. After applying the specified speed–torque combination, a period of 2 s is waited before acquisition, to ensure steady-state conditions are reached. The operating condition is maintained for ten revolutions of the input (i.e., sun) rotor. For each test, the velocity ratio is computed as
τ = θ ˙ ¯ c θ ˙ ¯ s ,
where the over bar denotes the time average value and θ ˙ s , θ ˙ c are the measured input and output angular velocities, respectively.
The input angular velocity is varied from 200 to 1000 rpm by steps of 100 rpm; both rotating directions (i.e., clockwise and counter-clockwise) are considered. The transmitted torque is varied from 0 to 10.5 Nm by steps of 3.5 Nm, measured at the output side. Three repetitions are performed for each speed–torque combination, for a total of 9 · 2 · 4 · 3 = 216 tests.
The velocity ratio, computed as the average of all tests, is τ = 0.277 ± 0.001 at a confidence level of 95%. The value is consistent with the one computed from (7) and reported in Table 2.

4.2. Power Losses

The experimental procedure used to assess the MG power losses P l and efficiency η is the same as that employed for the velocity ratio, i.e., MG prototype running under different (stationary) operating conditions. Also, the speed–torque combinations are the same. For each test, the power losses P l and efficiency η are computed as
P l = P ¯ s P ¯ c ,
η = P ¯ c P ¯ s ,
where P s , P c are the input (i.e., sun) and output (i.e., carrier) powers. These are given by
P s = | T s · θ ˙ s | ,
P c = | T c · θ ˙ c | ,
where T s , T c are the measured input and output torques, respectively.
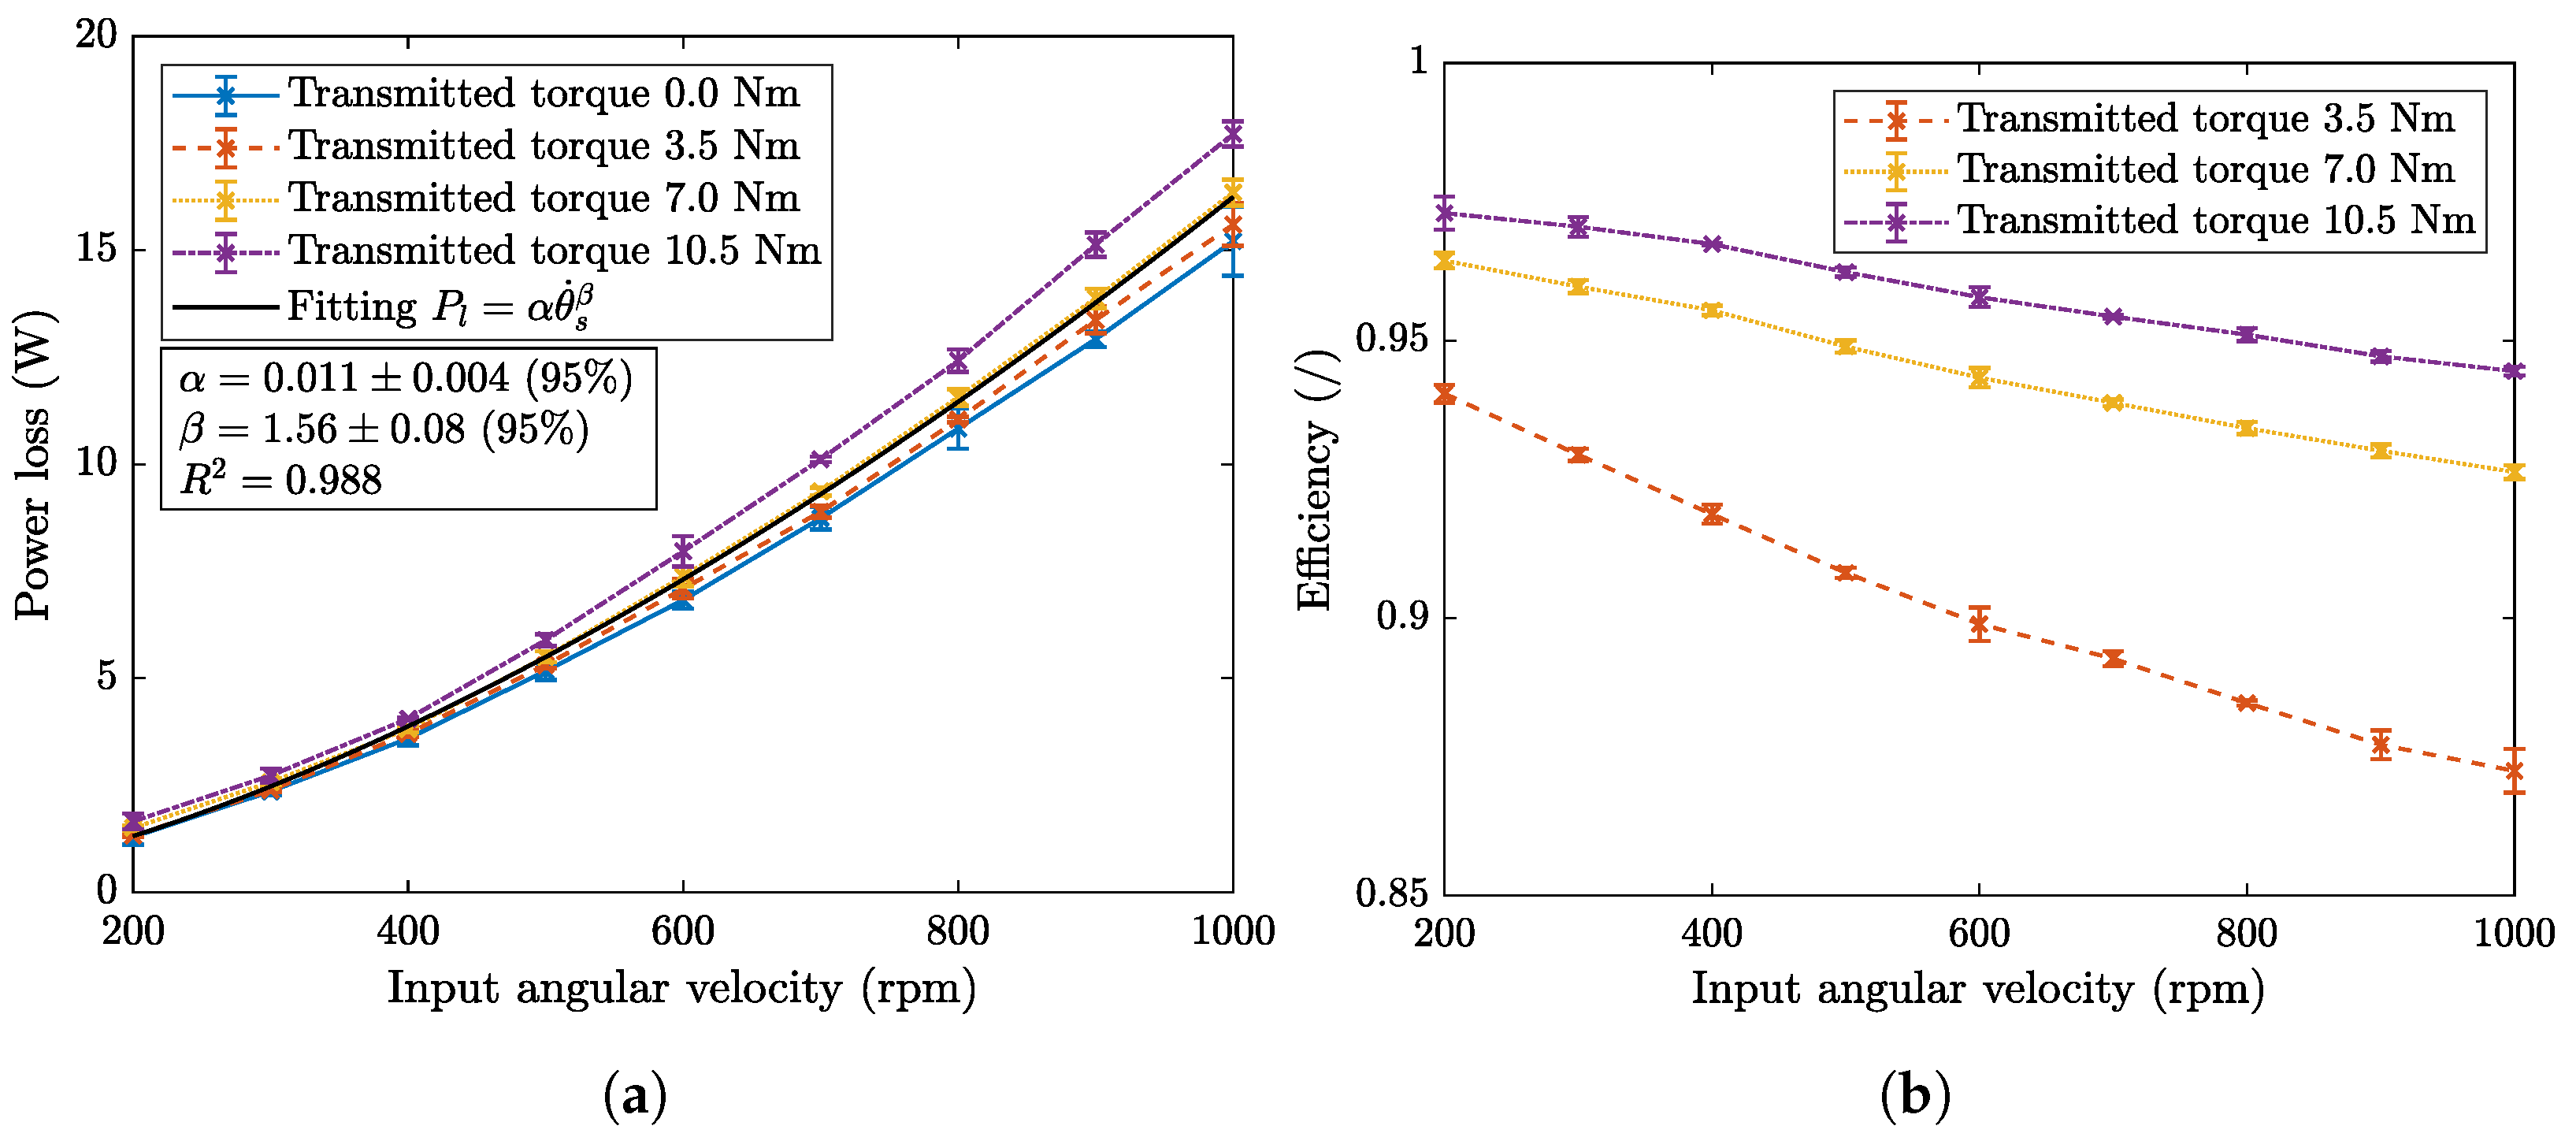
Figure 4a shows the MG power losses as a function of the input angular velocity at different levels of transmitted torque. Each point is obtained as the average of six tests (three with clockwise and three with counter-clockwise directions). It is observed that the losses significantly depend on the angular velocity, with the highest values at high speeds. On the contrary, the dependency on the transmitted torque, and thus on the load angle, is weaker. The trend is similar to the one reported in [13], which highlighted a superlinear dependency with the speed in accordance with standard electrical machines.
The MG efficiency is reported in Figure 4b, again as a function of the input angular velocity at different levels of transmitted torque. Tests at 0 Nm output torque are excluded, as no power is transferred to the output. Again, each point is obtained as the average of six tests. In the considered operating conditions, the efficiency ranges within 0.87 and 0.97, with larger values at low speeds and high transmitted torques. The range is comparable to that reported in [15]. Also, the trend aligns with the one observed for the prototype in [17], although higher. The result suggests that MGs are effective in applications involving medium-to-high levels of transmitted torque combined with moderate rotational speeds, while a significant reduction in the efficiency is observed at higher speeds. In contrast, mechanical planetary gears typically exhibit efficiencies up to 0.97 , which are maintained even at high speeds [23,24].
As a final remark, the power losses in Figure 4a can be fitted assuming a superlinear model in the speed, such as
P l = α θ ˙ s β ,
where θ ˙ s is the input angular velocity expressed in rad/s, P l are the power losses expressed in W, and α , β are the fitting coefficients to be determined. The least-squares method is employed. The fitted curve is depicted as a solid black line in Figure 4a, along with the corresponding parameter estimates and the coefficient of determination R 2 . At a confidence level of 95%, the fitting gives α = 0.011 ± 0.004 and β = 1.56 ± 0.08 , confirming the superlinear trend of power losses on speed. The corresponding coefficient of determination is R 2 = 0.988 .

4.3. Overload Protection

The torque transmission capability of the MG prototype is determined based on the principle that when the transmitted torque exceeds the limit torque T M , the magnets lose alignment, resulting in slip between the input and output shafts. After stepping-out, the load may be re-engaged through slip-detection strategies, as demonstrated experimentally in [20].
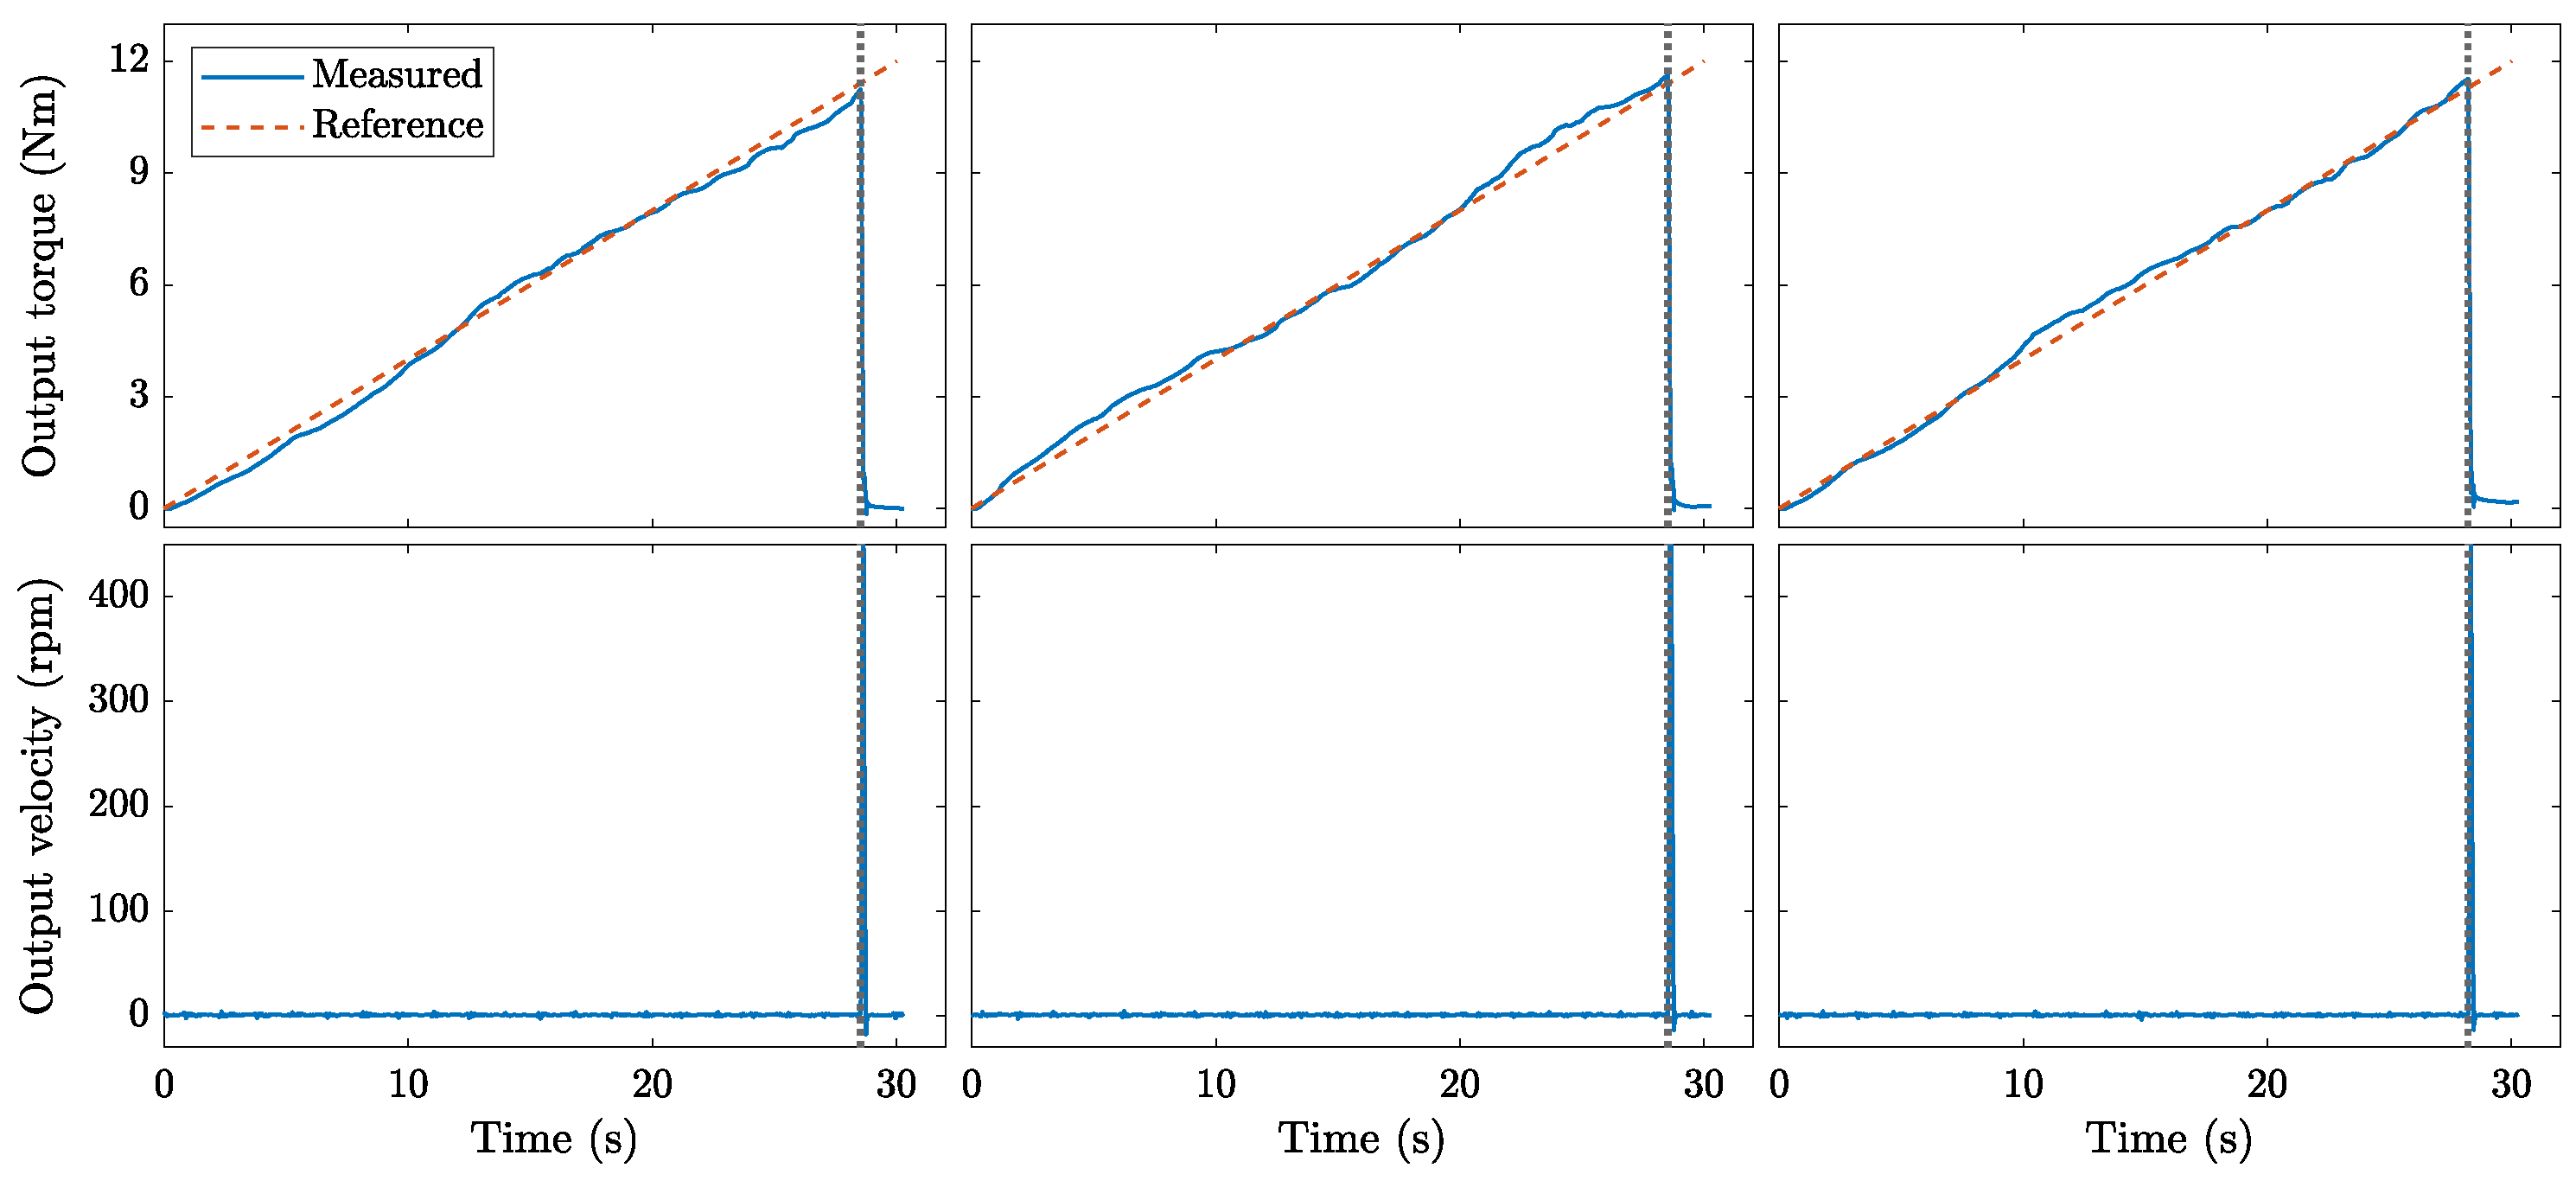
The experimental test consists in applying a ramp output torque while maintaining a constant input angular velocity. Specifically, the input is kept fixed, i.e., zero input angular velocity is enforced, and the output torque is increased linearly from 0 to 12 Nm in 30 s. Hence, the test is carried out under static operating conditions. Time-domain data are filtered using a moving average over a 0.1 s window. During such window, the variation of the output torque is <0.1 Nm. The test is repeated ten times.
Figure 5 shows the output torque (top) and output angular velocity (bottom) acquired during three repetitions (among the ten performed). At the beginning, the measured torque (blue solid line in top plots) follows the reference signal (dashed red line in top plots). In this region, the output angular velocity is almost zero (solid blue line in bottom plots), as the input reference velocity is zero, i.e., the system does not move. When the applied output torque exceeds the limit torque, the output shaft starts rotating freely. In such a condition, the load motor enters into emergency mode and stops. This instant is denoted with the vertical dotted line in Figure 5.
The limit torque is the maximum measured output torque. It is found that the limit torque (measured at the carrier) is T M = 11.3 ± 0.4 Nm, at a confidence level of 95%. The value differs by 14 % from the estimation reported in Table 2, which is obtained in [13] from a 3D FE model of the MG prototype. This discrepancy is similar to the estimation reported in [13].

4.4. Frequency Response

The frequency response of the MG prototype is experimentally investigated by imposing a variable-frequency output torque while applying a constant input angular velocity. Specifically, a 60 s sweep signal starting at 0 Hz and ending at 80 Hz is adopted. This signal bandwidth covers frequencies larger than the estimated system resonance, which is at approximately 65 Hz with the obtained (experimental) limit torque. The average value of the sweep is non-zero and corresponds to the stationary transmitted torque, again measured at the output side. The sweep amplitude is 1 Nm, which is enough to inject sufficient power into the system, while maintaining small angular oscillations.
The procedure consists in measuring the MG response (i.e., input and output torques and angular velocities) with different combinations of stationary transmitted torque and input angular velocity, hence obtaining the experimental FRF in a number of operating conditions. The input angular velocity ranges from 200 to 1000 rpm by steps of 200 rpm. Different levels of stationary transmitted torque are used, namely 1.5, 3.5, and 7.0 Nm. The former corresponds to the case of almost zero transmitted torque, as T m T M = 1.5 11.3 0.13 < 0.2 and thus f n f 0 —tests at exactly 0 Nm cannot be performed due to mechanical backlash. The related stationary load angles, calculated using (19), are approximately 8, 18, and 38 deg, which correspond to an angular shift measured at the output of 0.4, 1.0, and 2.3 deg, respectively. Six repetitions are performed for each speed–torque combination, for a total of 5 · 3 · 6 = 90 tests.
For a given speed–torque combination, the data processing is the following. First, time-domain data are filtered using a zero-phase digital low-pass filter with passband frequency 100 Hz, stopband frequency 200 Hz, and passband ripple <   0.1 dB. Secondly, the angular rate θ ˙ e is computed from (4) with θ ˙ r = 0 , while γ e is calculated from (18) with J s , J c estimated from the MG parameters. Specifically, J s includes the input torsiometer, one elastic joint, and the MG sun rotor, and is 11.93 kg cm2; J c includes the output torsiometer, one elastic joint, and the MG carrier rotor, and is 14.00 kg cm2. The stationary transmitted torque T m is calculated as the average of the measured output torque, while γ e 0 is given by (20). Finally, the experimental FRF from δ γ e = γ e γ e 0 to δ θ ˙ e = θ ˙ e is calculated using a H2 estimator, as the noise is predominantly observed in the input signal (i.e., δ γ e ). The Welch’s averaged periodogram method [25] is employed to compute the FRF, with each acquisition split into 15 hamming windows with 50% overlap, to give a frequency sampling of roughly 0.1 Hz.
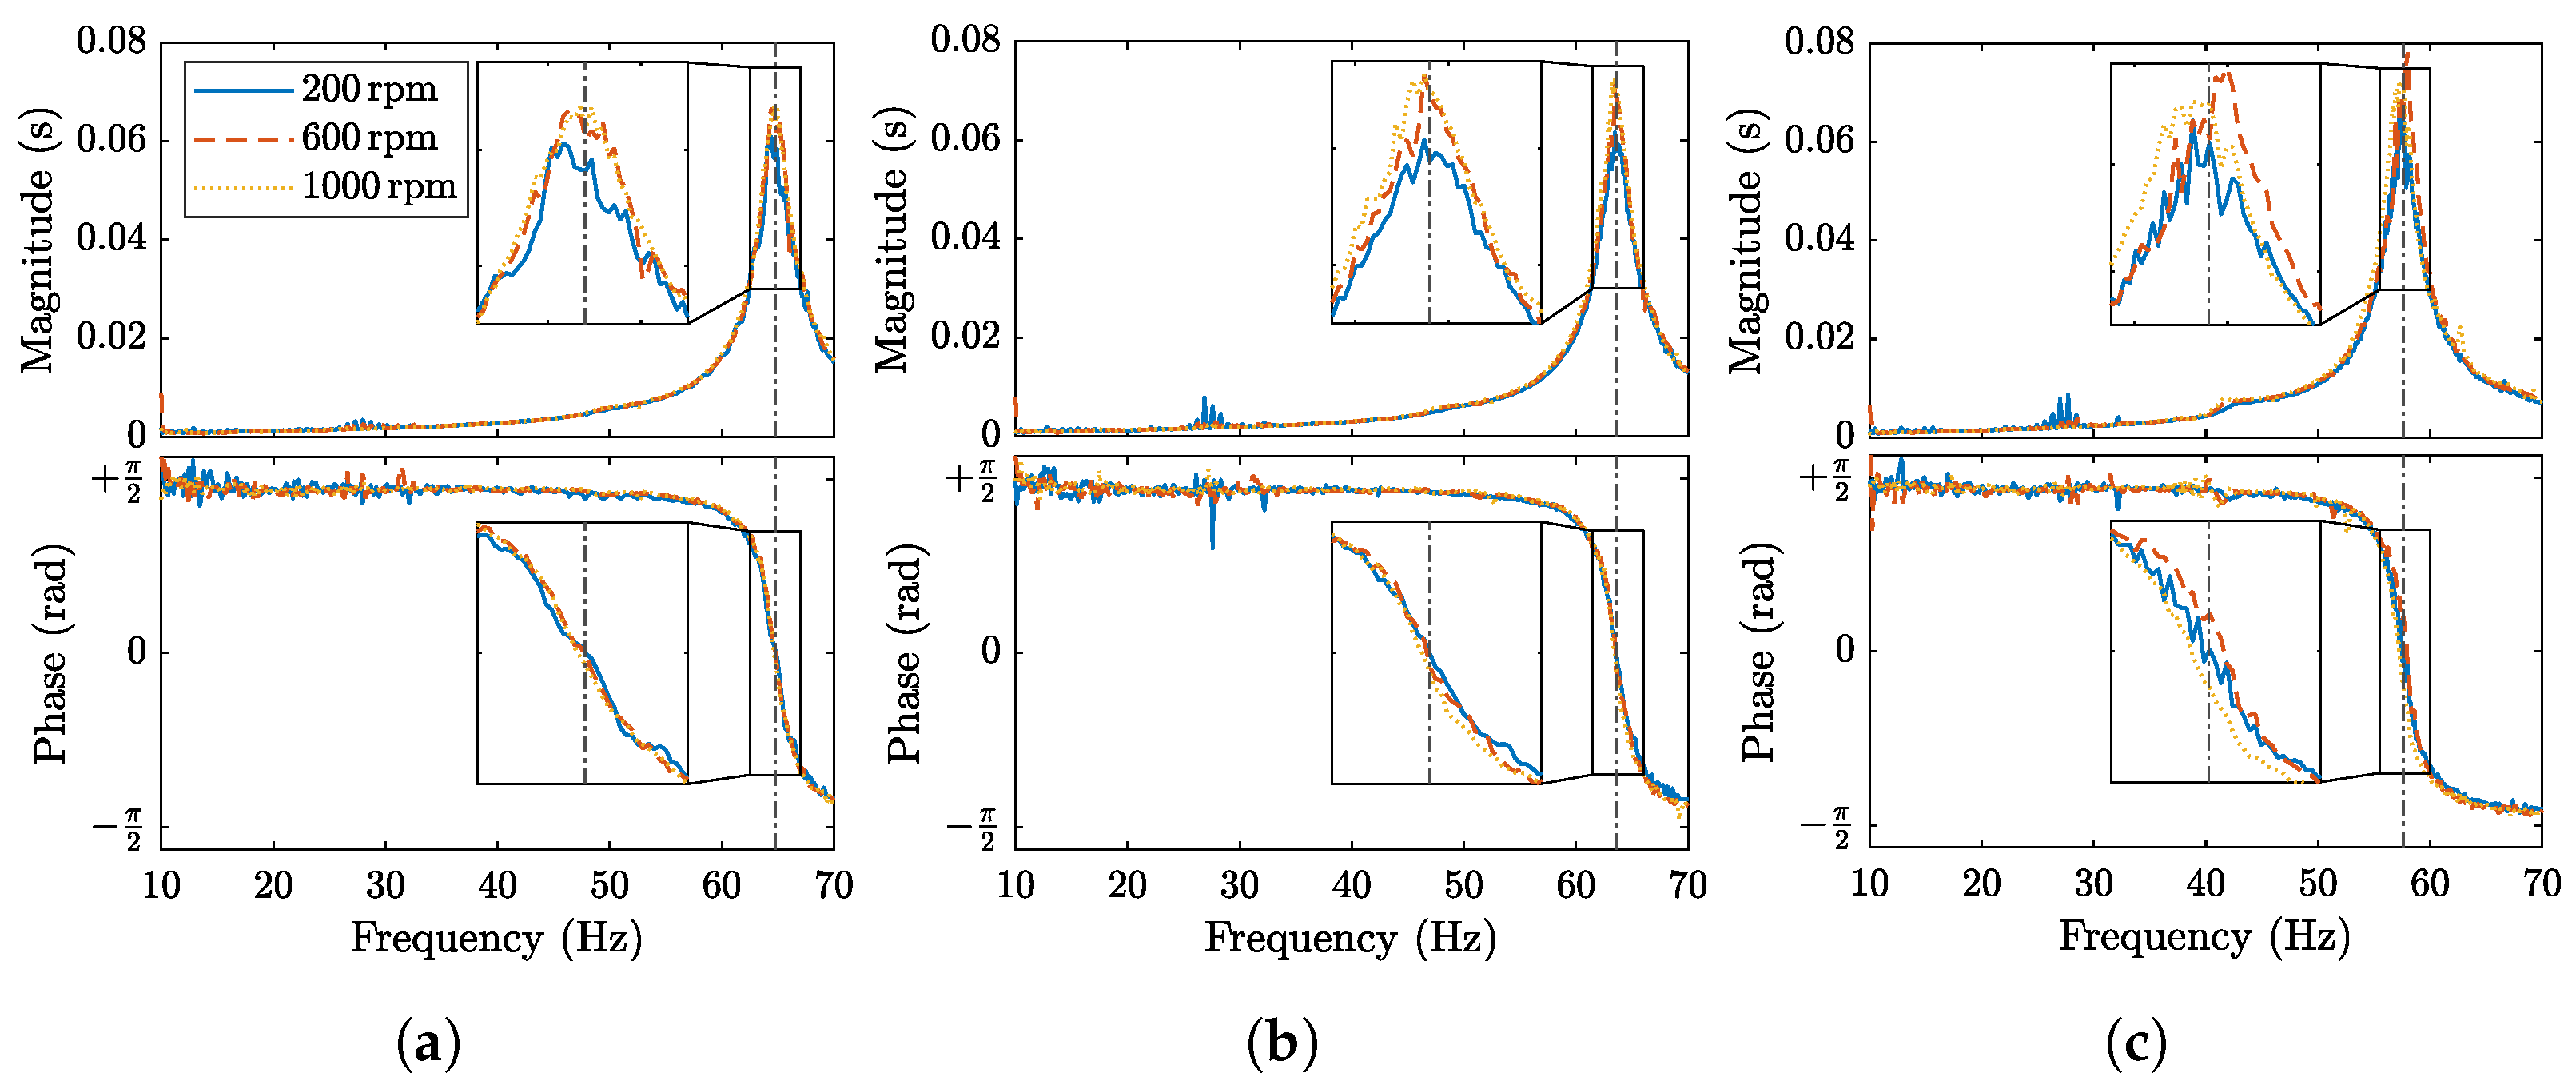
Figure 6 shows the magnitude (top) and the phase (bottom) of the experimental FRF at different speed–torque combinations, obtained as the average of the six repetitions. For the sake of clarity, only three angular velocities are shown (among the 5 tested), namely 200 rpm (solid blue), 600 rpm (dashed red), and 1000 rpm (dotted yellow), while the stationary transmitted torque is 1.5 Nm (Figure 6a), 3.5 Nm (Figure 6b), and 7.0 Nm (Figure 6c). The investigated frequency band is 10 ÷ 70 Hz. For frequencies lower than 10 Hz, the response δ θ ˙ e becomes small and the noise-to-signal ratio increases. For frequencies higher than 70 Hz, the injected power proved insufficient to excite the system significantly.
The system resonance is clearly evident in all scenarios, with a peak in the magnitude and a 180 deg phase variation—see the vertical dash-dot lines denoting the frequencies at which the phase is almost zero. It is observed that the experimental FRFs depend on the stationary transmitted torque, but are in practice independent from the angular velocity of the MG—indeed, the system dynamics remain the same. As the stationary transmitted torque increases, the resonance shifts to lower frequency and the peak magnitude increases. The same pattern is predicted by (30).
To characterize the frequency response of the system in terms of the natural frequency f n and damping ratio ζ , the FRFs are fitted using such quantities as the fitting parameters. The procedure is the following. First, each experimental FRF is fitted using (30) with f n from (25). A total of 90 fittings are performed, and as many pairs of f n , ζ are obtained. A least-squares method is employed, i.e., the following optimization problem is solved
min f n , ζ j | H j H ( ω j , f n , ζ ) | 2 ,
with H ( · ) given by (30) while ω j , H j are the angular frequency and the value of the j-th point of the experimental FRF, respectively. Secondly, for each torque, f n , ζ are computed as the average of 6 · 5 = 30 values, i.e., between tests with the same stationary transmitted torque (yet different angular velocities). Finally, the fitting is assessed by inspecting the coefficient of determination R 2 , which for each torque is calculated as
R 2 = 1 j | H j H ( ω j , f n , ζ ) | 2 j | H j H ¯ | 2
where H j is the FRF obtained as the average of the experimental FRFs at the same torque, while H ¯ is its mean value.
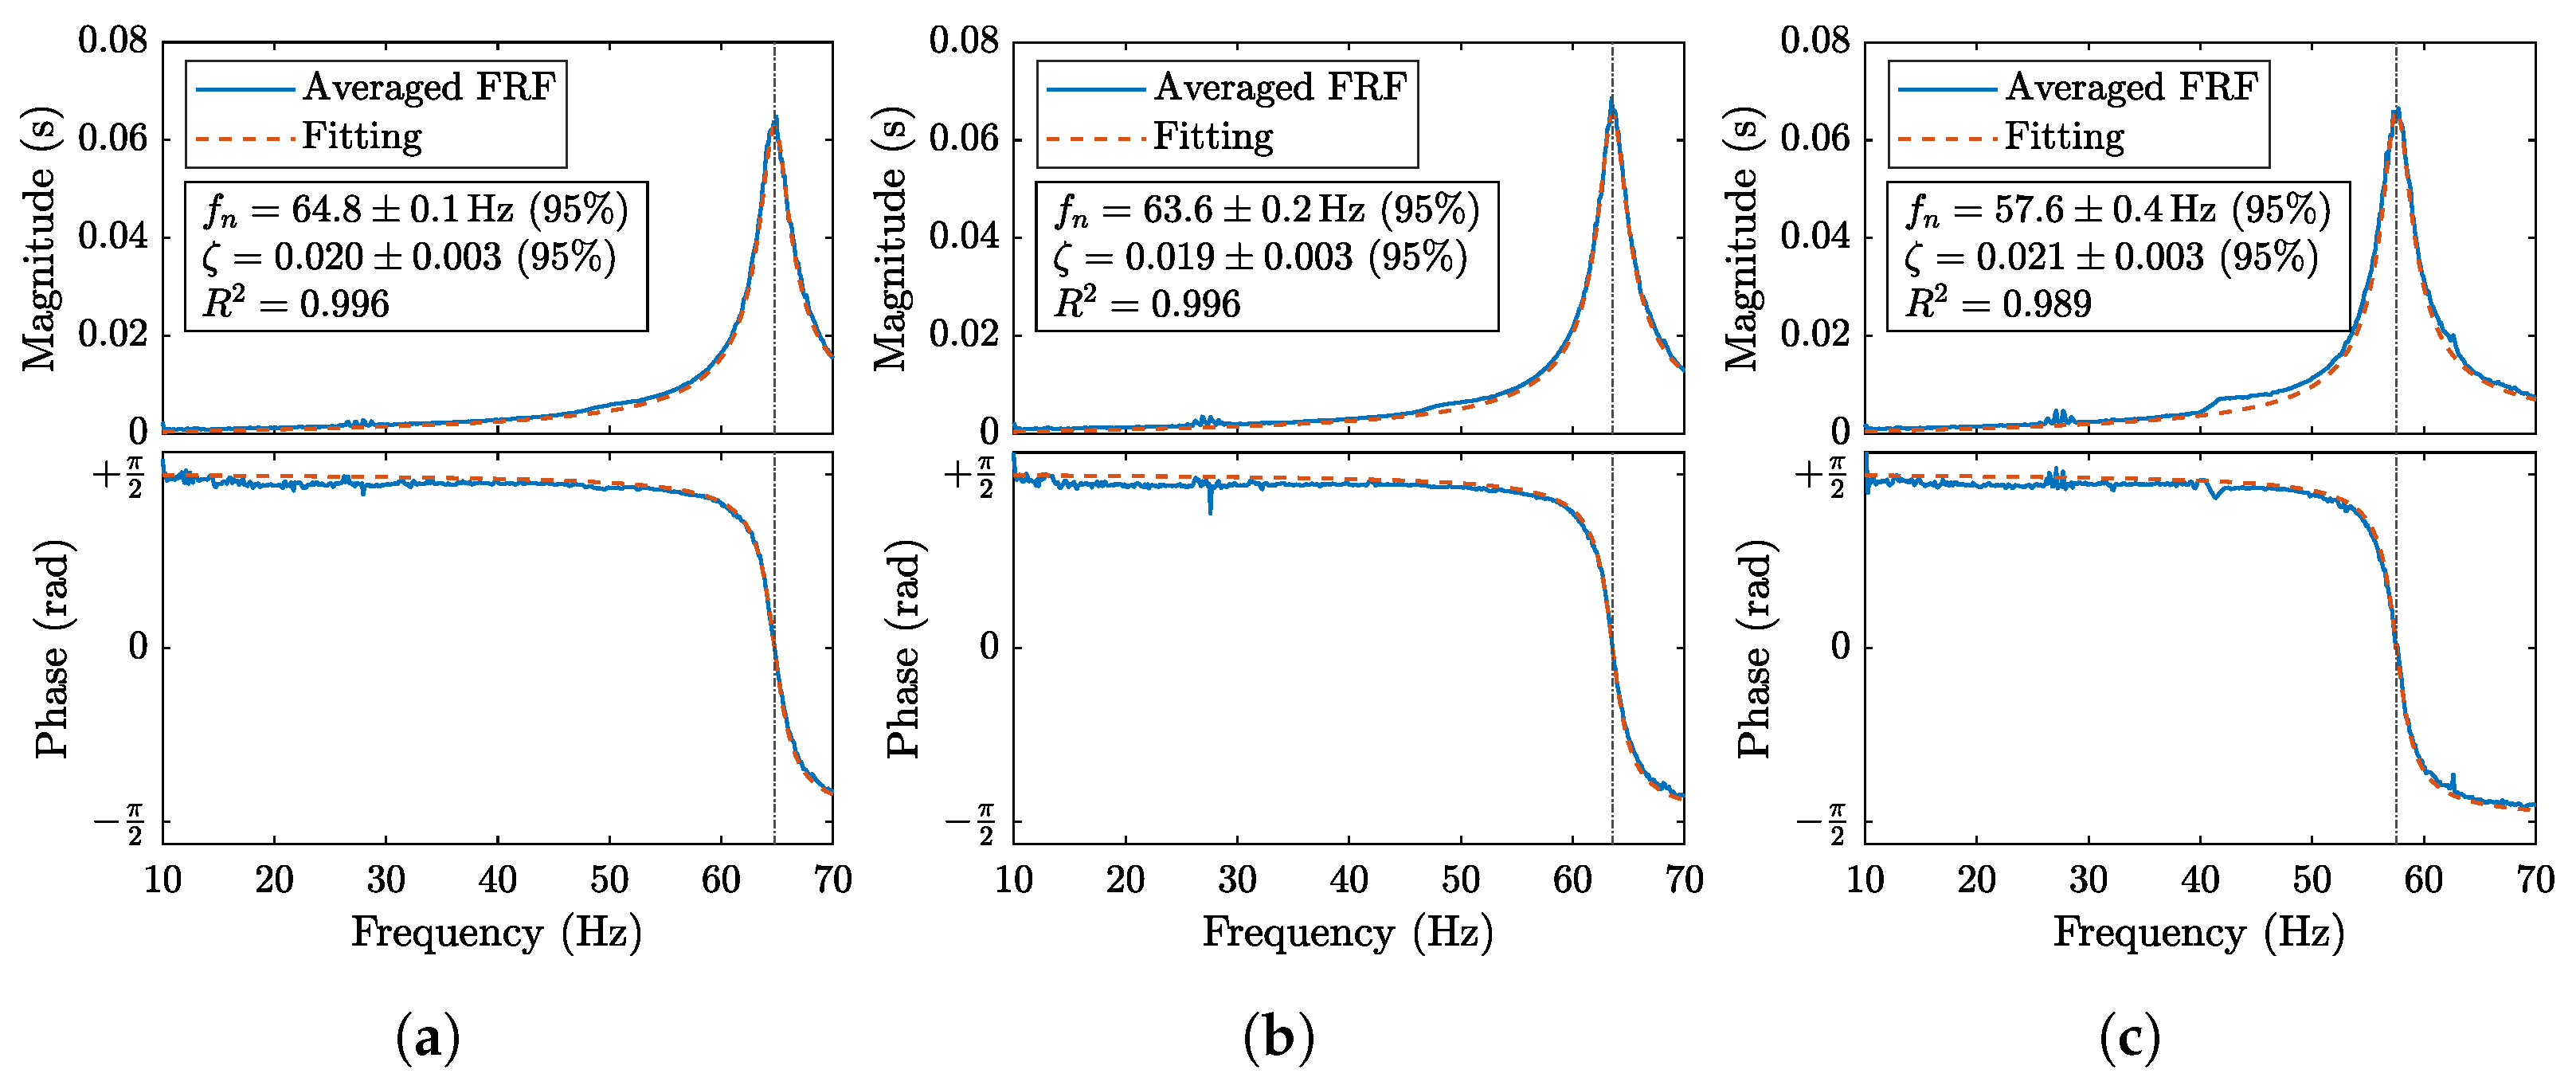
Figure 7 shows the magnitude (top) and phase (bottom) of the averaged FRF (solid blue) at the different levels of stationary transmitted torque. The fitting using the above procedure is shown in dashed red, together with the corresponding fitting parameters f n , ζ and coefficient of determination R 2 . In general, the coefficient of determination is R 2 0.99 , with values near unity at smaller torques. The comparison between the experimental and theoretical FRFs suggests that only a single harmonic behavior is observed, in accordance with (2) that assumes negligible cogging torque. The same trend is also confirmed by the results of the 2D and 3D FEM analysis reported in [13]. Other torque pulsations—e.g., due to cogging—proved negligible.
At T m = 1.5 Nm, the natural frequency is f n = 64.8 ± 0.1 Hz at a confidence level of 95%; see Figure 7a. This value is also roughly the maximum natural frequency f 0 , as T m T M 0.13 < 0.2 . At T m = 3.5 Nm and T m = 7.0 Nm the natural frequencies reduce to f n = 63.6 ± 0.2 Hz and f n = 57.6 ± 0.4 Hz, again at a confidence level of 95%; see Figure 7b and Figure 7c, respectively. The reductions are 1.9% and 11.1%, and are similar to those predicted by (25), which are 2.5% and 11.4% for T m = 3.5 Nm ( T m / T M 0.3 ) and T m = 7.0 Nm ( T m / T M 0.6 ), respectively.
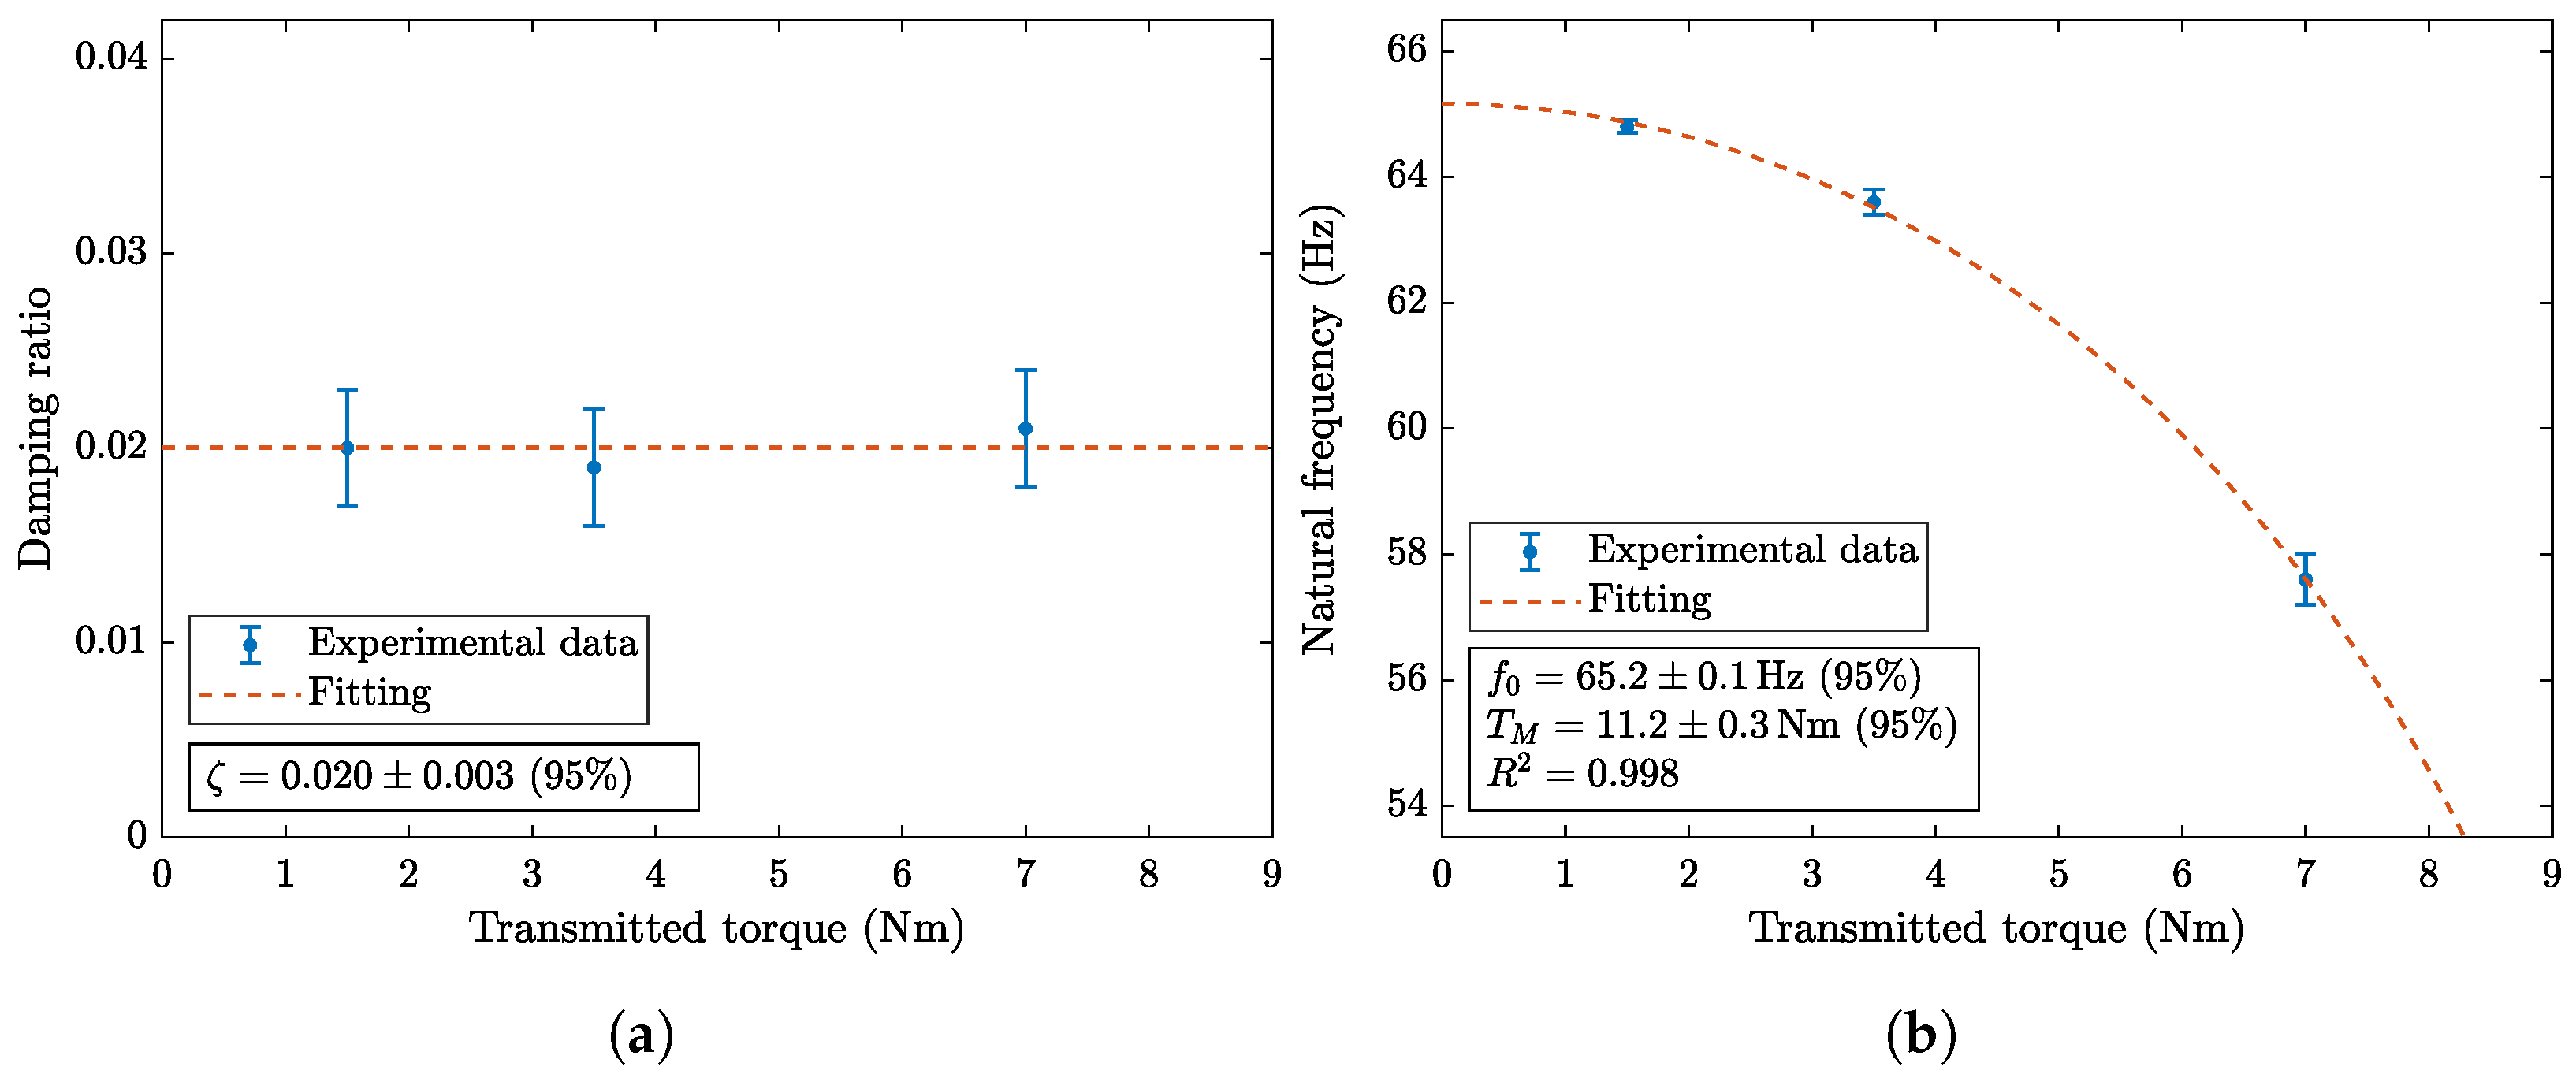
Interestingly enough, the damping ratio remains nearly constant to ζ = 0.020 ± 0.003 , at a confidence level of 95%; see Figure 8a, which shows the damping ratio as a function of the stationary transmitted torque (blue error bars) along with its average value (dashed red). Mechanical planetary gears typically exhibit modal damping in the range 0.01 ÷ 0.03 [26].
As a final remark, the limit torque T M and maximum natural frequency f 0 can be obtained from the fitting of the natural frequency f n as a function of the stationary transmitted torque T m using (25); see Figure 8b, which shows the natural frequency as a function of the stationary transmitted torque (blue error bars) along with the fitted curve (dashed red). The maximum natural frequency and the limit torque at a confidence level of 95% are f 0 = 65.2 ± 0.1 Hz and T M = 11.2 ± 0.3 Nm, respectively. The limit torque fitted from the sweep tests is thus consistent with the one obtained from the ramp-torque tests.

5. Conclusions

This study presents an extensive experimental analysis of a coaxial magnetic gear (MG) prototype developed at the Department of Industrial Engineering of the University of Padova. The results confirm that the prototype offers several of the expected benefits of magnetic gearing technology, including high efficiency and inherent overload protection. Under stationary operating conditions, the MG exhibits a velocity ratio of 0.277 ± 0.001 , closely matching analytical predictions. The efficiency, ranging between 87% and 97%, increases with torque and is competitive with mechanical gear counterparts. Power losses demonstrate a superlinear relationship with speed, consistent with trends reported for electric machines in the literature. Overload protection tests validate the self-limiting torque capability of the gear, with experimental results yielding a limit torque of 11.3 ± 0.4 Nm, again close to the numerically predicted value. The frequency response reveals that while the natural frequency decreases with torque (up to 11% under the tested conditions), it is largely independent of speed, confirming the numerical prediction of the physical model. The damping ratio remains nearly constant to 0.020 ± 0.003 . In conclusion, the proposed coaxial MG prototype proves effective as a speed reducer in applications involving moderate dynamic loads combined with medium-to-high levels of transmitted torque and moderate rotational speeds, and where the advantages of non-contact transmission—such as reduced maintenance and inherent overload protection—are important. Its intrinsic compliance may limit use in scenarios requiring high-frequency dynamic response. However, this is a limitation common to all MG devices. The proposed analysis and insights offer a benchmark for further refinement and application of other MG devices.

Author Contributions

Conceptualization, P.A. and M.M.; methodology, S.L., G.B., L.O. and M.M.; software, S.L. and G.B.; validation, S.L. and M.M.; formal analysis, S.L.; investigation, S.L. and G.B.; resources, P.A. and M.M.; data curation, S.L. and G.B.; writing—original draft preparation, S.L. and M.M.; writing—review and editing, S.L., L.O., R.T., P.A., M.R. and M.M.; visualization, S.L. and M.M.; supervision, M.M.; project administration, M.M.; funding acquisition, M.M. All authors have read and agreed to the published version of the manuscript.

Funding

This research was funded within the BIRD 2022 program by Università degli Studi di Padova—project BIRD220225.

Conflicts of Interest

The authors declare no conflicts of interest.

References

  1. Faus, H. Magnetic Gearing. U.S. Patent 2243555A, 27 May 1941. [Google Scholar]
  2. Martin, J. Magnetic Transmission. U.S. Patent 3378710A, 16 April 1968. [Google Scholar]
  3. Atallah, K.; Howe, D. A novel high-performance magnetic gear. IEEE Trans. Magn. 2001, 37, 2844–2846. [Google Scholar] [CrossRef]
  4. Atallah, K.; Wang, J.; Howe, D. A high-performance linear magnetic gear. J. Appl. Phys. 2005, 97, 10N516. [Google Scholar] [CrossRef]
  5. Wang, Y.; Filippini, M.; Bianchi, N.; Alotto, P. A Review on Magnetic Gears: Topologies, Computational Models, and Design Aspects. IEEE Trans. Ind. Appl. 2019, 55, 4557–4566. [Google Scholar] [CrossRef]
  6. Ikuta, K.; Makita, S.; Arimoto, S. Non-contact magnetic gear for micro transmission mechanism. In Proceedings of the [1991] Proceedings. IEEE Micro Electro Mechanical Systems, Nara, Japan, 30 January–2 February 1991; pp. 125–130. [Google Scholar] [CrossRef]
  7. Mezani, S.; Atallah, K.; Howe, D. A high-performance axial-field magnetic gear. J. Appl. Phys. 2006, 99, 08R303. [Google Scholar] [CrossRef]
  8. Rens, J.; Atallah, K.; Calverley, S.D.; Howe, D. A novel magnetic harmonic gear. In Proceedings of the 2007 IEEE International Electric Machines & Drives Conference, Antalya, Turkey, 3–5 May 2007; Volume 1, pp. 698–703. [Google Scholar] [CrossRef]
  9. Frank, N.W.; Toliyat, H.A. Gearing ratios of a magnetic gear for wind turbines. In Proceedings of the 2009 IEEE International Electric Machines and Drives Conference, Miami, FL, USA, 3–6 May 2009; pp. 1224–1230. [Google Scholar] [CrossRef]
  10. Wang, R.J.; Gerber, S. Magnetically geared wind generator technologies: Opportunities and challenges. Appl. Energy 2014, 136, 817–826. [Google Scholar] [CrossRef]
  11. McGilton, B.; Crozier, R.; McDonald, A.; Mueller, M. Review of magnetic gear technologies and their applications in marine energy. IET Renew. Power Gener. 2018, 12, 174–181. [Google Scholar] [CrossRef]
  12. Scheidler, J.J. NASA’s Magnetic Gearing Research for Electrified Aircraft Propulsion. In Proceedings of the 2018 AIAA/IEEE Electric Aircraft Technologies Symposium, Cincinnati, OH, USA, 9–11 July 2018. [Google Scholar] [CrossRef]
  13. Filippini, M.; Torchio, R.; Alotto, P.; Bonisoli, E.; Dimauro, L.; Repetto, M. A New Class of Devices: Magnetic Gear Differentials for Vehicle Drivetrains. IEEE Trans. Transp. Electrif. 2023, 9, 2382–2397. [Google Scholar] [CrossRef]
  14. Dimauro, L.; Bonisoli, E.; Velardocchia, M.; Repetto, M.; Alotto, P.; Filippini, M.; Torchio, R. Magnetic gearbox for automotive power transmissions: An innovative industrial technology. Eng. Sci. Technol. Int. J. 2023, 46, 101497. [Google Scholar] [CrossRef]
  15. Atallah, K.; Calverley, S.D.; Howe, D. Design, Analysis and Realisation of a High-Performance Magnetic Gear. IEE Proc.-Electr. Power Appl. 2004, 151, 135–143. [Google Scholar] [CrossRef]
  16. Huang, C.C.; Tsai, M.C.; Dorrell, D.G.; Lin, B.J. Development of a Magnetic Planetary Gearbox. IEEE Trans. Magn. 2008, 44, 403–412. [Google Scholar] [CrossRef]
  17. Gerber, S.; Wang, R.J. Evaluation of a prototype magnetic gear. In Proceedings of the 2013 IEEE International Conference on Industrial Technology (ICIT), Cape Town, South Africa, 25–28 February 2013; pp. 319–324. [Google Scholar] [CrossRef]
  18. Ruiz-Ponce, G.; Arjona, M.A.; Hernandez, C.; Escarela-Perez, R. A Review of Magnetic Gear Technologies Used in Mechanical Power Transmission. Energies 2023, 16, 1721. [Google Scholar] [CrossRef]
  19. Shoaei, A.; Wang, Q. A Comprehensive Review of Concentric Magnetic Gears. IEEE Trans. Transp. Electrif. 2024, 10, 5581–5598. [Google Scholar] [CrossRef]
  20. Montague, R.G.; Bingham, C.M.; Atallah, K. Magnetic gear overload detection and remedial strategies for servo-drive systems. In Proceedings of the SPEEDAM 2010, Pisa, Italy, 14–16 June 2010; pp. 523–528. [Google Scholar] [CrossRef]
  21. Filippini, M.; Alotto, P. Coaxial Magnetic Gear Design and Optimization. IEEE Trans. Ind. Electron. 2017, 64, 9934–9942. [Google Scholar] [CrossRef]
  22. Atallah, K.; Wang, J.; Calverley, S.D.; Duggan, S. Design and operation of a magnetic Continuously Variable Transmission. In Proceedings of the 2011 IEEE International Electric Machines & Drives Conference (IEMDC), Niagara Falls, ON, Canada, 15–18 May 2011; pp. 312–317. [Google Scholar] [CrossRef]
  23. Radzevich, S.P. Dudley’s Handbook of Practical Gear Design and Manufacture, 4th ed.; CRC Press: Boca Raton, FL, USA, 2021. [Google Scholar] [CrossRef]
  24. Arnaudov, K.; Karaivanov, D.P. Planetary Gear Trains, 1st ed.; CRC Press: Boca Raton, FL, USA, 2019. [Google Scholar] [CrossRef]
  25. Welch, P. The use of fast Fourier transform for the estimation of power spectra: A method based on time averaging over short, modified periodograms. IEEE Trans. Audio Electroacoust. 1967, 15, 70–73. [Google Scholar] [CrossRef]
  26. Ericson, T.M.; Parker, R.G. Experimental measurement of the effects of torque on the dynamic behavior and system parameters of planetary gears. Mech. Mach. Theory 2014, 74, 370–389. [Google Scholar] [CrossRef]
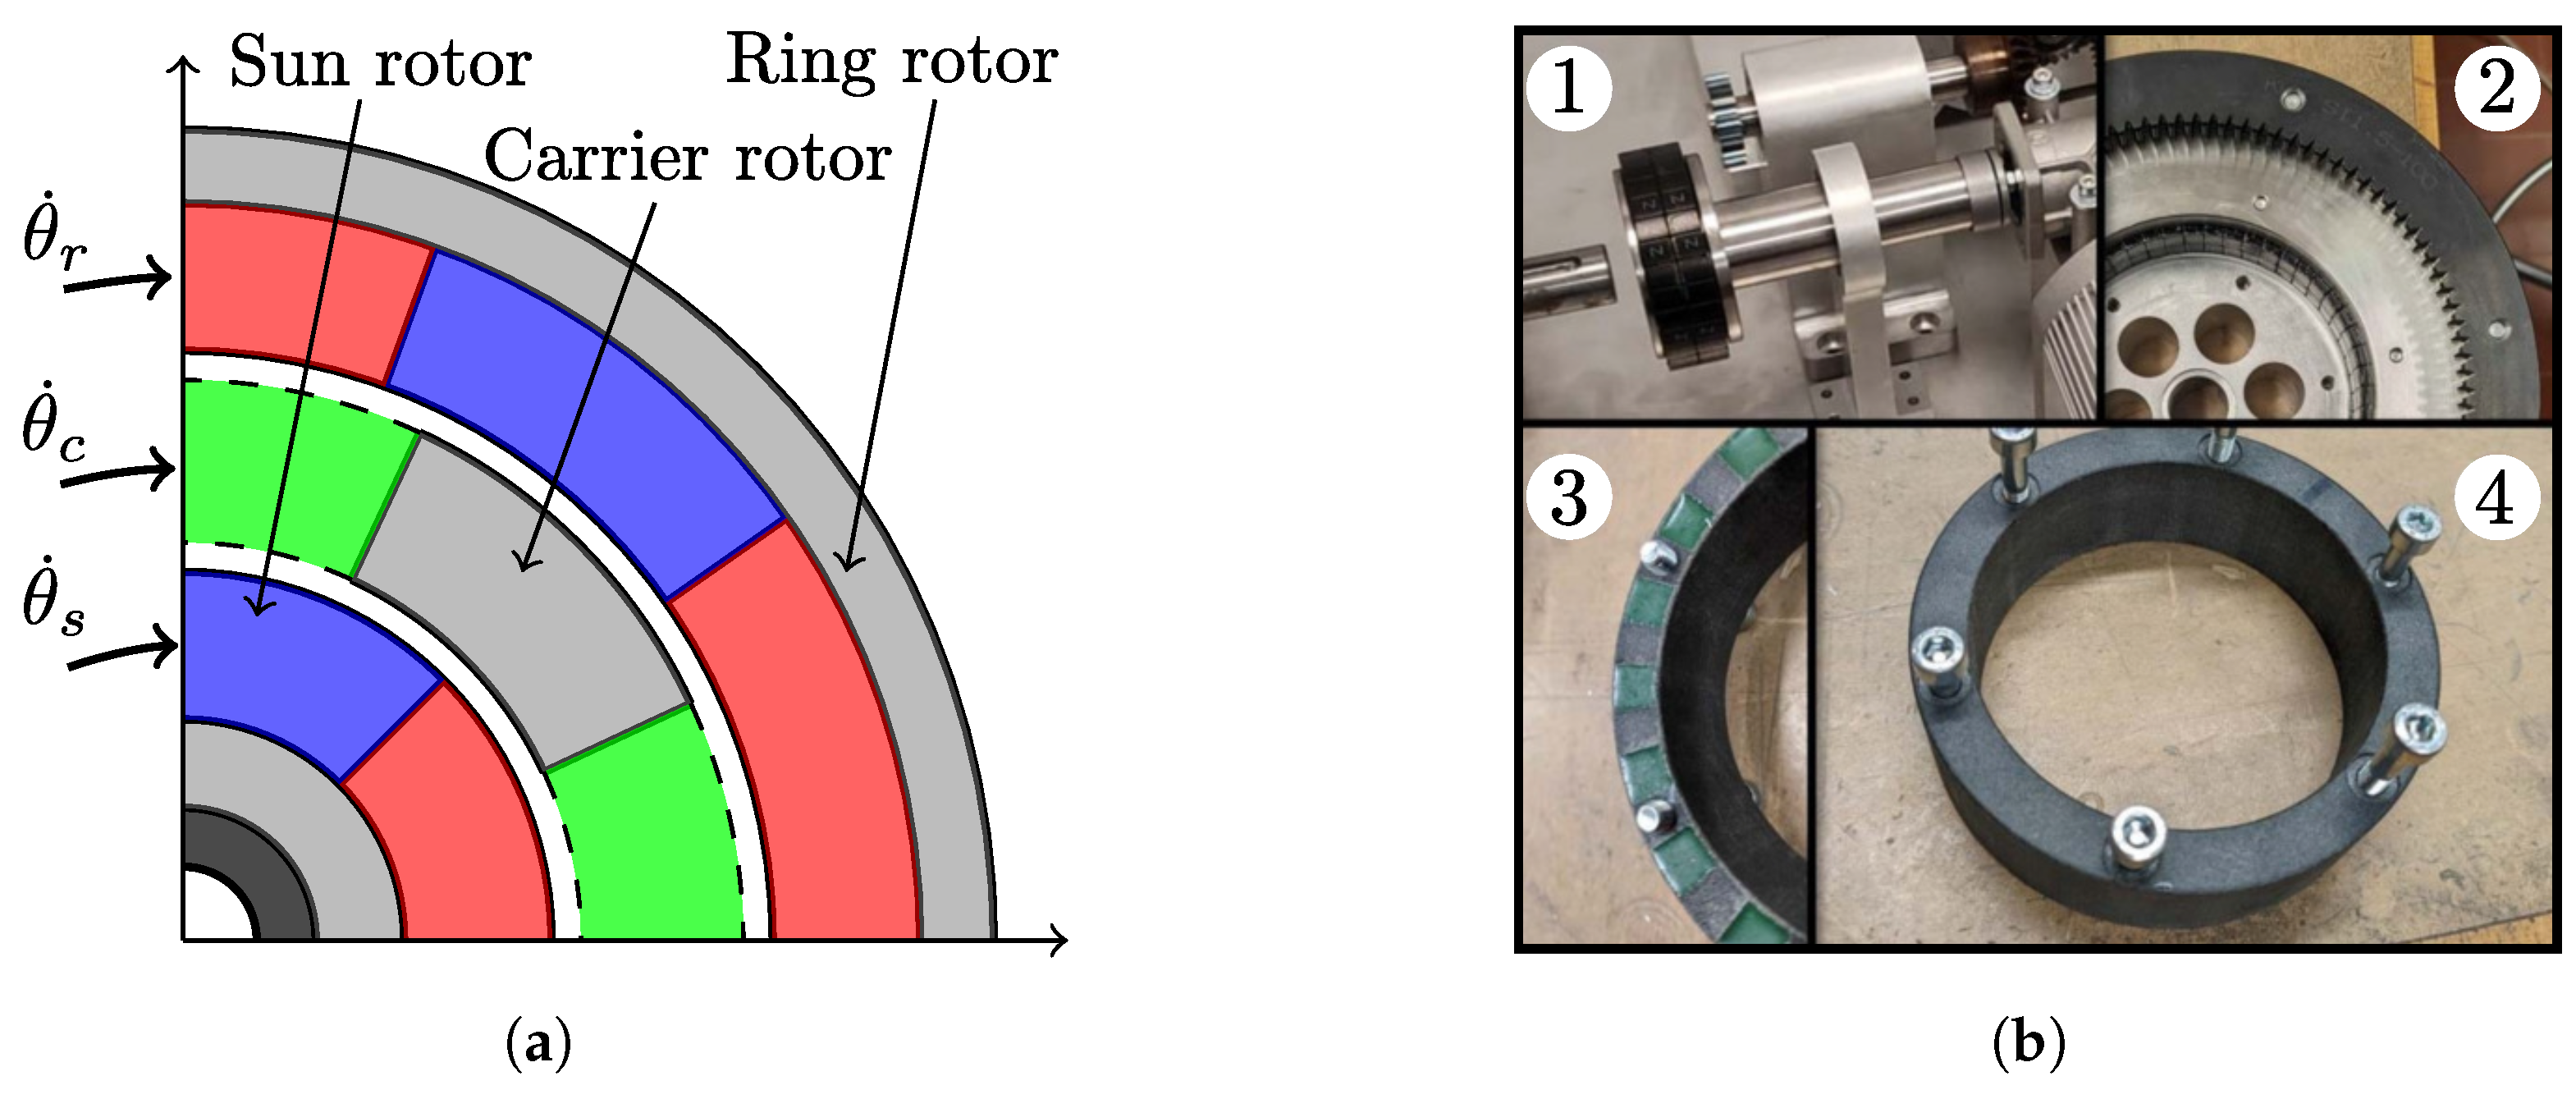
Figure 1. (a) Typical planetary MG layout: magnets (blue/red), ferromagnetic iron (gray), polymer (green), and shaft (black); θ ˙ s , θ ˙ c , θ ˙ r denote the absolute angular velocities of the sun, carrier, and ring rotors, respectively. (b) Components of the MG prototype: (1) sun rotor, (2) ring rotor, (3) carrier rotor (back), and (4) carrier rotor (front) [13].
Machines 13 00716 g001
Figure 2. (a) Natural frequency normalized by f 0 as a function of the ratio T m / T M ; A and B denote 1% and 10% reductions. (b) Magnitude (top) and phase (bottom) of the FRFs from δ γ e to δ θ ˙ e obtained with ζ = 0.02 (thick lines) and ζ = 0 (thin lines); the vertical dash-dot lines denote the resonances.
Machines 13 00716 g002
Figure 3. Experimental set-up: (1) traction electric motor, (2) input torque sensor, (3) magnetic planetary gearbox, (4) output torque sensor, (5) load electric motor.
Machines 13 00716 g003
Figure 4. (a) Power losses and (b) efficiency of the MG at varying input angular velocity with different levels of transmitted torque. The vertical error bars denote the confidence level of 95%.
Machines 13 00716 g004
Figure 5. Filtered output torque (top) and angular velocity (bottom) acquired during three ramp-torque tests. The vertical dotted lines denote the instants when the load motor enters into emergency mode and stops.
Machines 13 00716 g005
Figure 6. Magnitude (top) and phase (bottom) with magnified views around the resonances of the experimental FRF from δ γ e to δ θ ˙ e at 200 rpm, 600 rpm, and 1000 rpm and (a) 1.5 Nm, (b) 3.5 Nm, and (c) 7.0 Nm. The vertical dash-dot lines denote the frequencies at which the phase is almost zero.
Machines 13 00716 g006
Figure 7. Magnitude (top) and phase (bottom) of the averaged FRF from δ γ e to δ θ ˙ e and corresponding fitting at (a) 1.5 Nm, (b) 3.5 Nm, and (c) 7.0 Nm. The fitting parameters (natural frequency f n and damping ratio ζ ) and corresponding coefficient of determination R 2 are reported in each plot at a confidence level of 95%. The vertical dash-dot lines denote the natural frequencies.
Machines 13 00716 g007
Figure 8. (a) Damping ratio and (b) natural frequency as a function of the transmitted torque along with the corresponding fitting. The error bars denote the confidence level of 95%.
Machines 13 00716 g008
Table 1. Characteristics of the experimental set-up.
DescriptionValue
Traction motorLoad motor
Maximum speed3000 rpm1500 rpm
Nominal torque5.2 Nm9.2 Nm
Nominal voltage400 V400 V
Torque constant1.5 Nm/A3.3 Nm/A
Inertia2.88 kg cm24.2 kg cm2
Input torque sensorOutput torque sensor
Maximum torque10 Nm20 Nm
Analog signal range ± 10  V ± 10  V
Sensitivity0.9996 Nm/V1.999 Nm/V
Torsional stiffness855 Nm/rad8690 Nm/rad
Inertia0.03 kg cm20.9 kg cm2
Input elastic jointOutput elastic joint
Torsional stiffness20,000 Nm/rad20,000 Nm/rad
Inertia0.6 kg cm20.6 kg cm2
Table 2. Parameters of the coaxial MG prototype.
DescriptionValue
Number of sun pole pairs N s 5
Number of ring pole pairs N r 13
Number of carrier iron poles Q18
Nominal limit torque at the carrier T M (from 3D FEM)13.1 Nm
Nominal velocity ratio τ (output/input)0.278
Moment of inertia of the sun11.3 kg cm2
Moment of inertia of the carrier12.5 kg cm2
Moment of inertia of the ring313.3 kg cm2
Maximum meshing stiffness at the carrier k M 236 Nm/rad
Maximum meshing stiffness at the sun τ 2 k M 18.2 Nm/rad
Disclaimer/Publisher’s Note: The statements, opinions and data contained in all publications are solely those of the individual author(s) and contributor(s) and not of MDPI and/or the editor(s). MDPI and/or the editor(s) disclaim responsibility for any injury to people or property resulting from any ideas, methods, instructions or products referred to in the content.