Article

Calculation Method and Experimental Investigation of Root Bending Stress in Line Contact Spiral Bevel Gear Pairs

1
ZRIME Gearing Technology Co., Ltd., Zhengzhou 450001, China
2
Key Laboratory of Mechanism Theory and Equipment Design, Ministry of Education, Tianjin University, Tianjin 300350, China
*
Author to whom correspondence should be addressed.
Machines 2025, 13(8), 632; https://doi.org/10.3390/machines13080632
Submission received: 17 June 2025 / Revised: 10 July 2025 / Accepted: 12 July 2025 / Published: 22 July 2025
(This article belongs to the Section Machine Design and Theory)

Abstract

Compared to spiral bevel gear drives with localized conjugation, line contact spiral bevel gears possess a significantly larger meshing area, theoretically achieving full tooth surface contact and substantially enhancing load capacity. To accurately support the root strength calculation and parameter design of line contact spiral bevel gear drives, this paper presents a theoretical analysis and experimental study of the root bending stress of gear pairs. First, based on the analysis of the meshing characteristics of line contact spiral bevel gear pairs, the load distribution along the contact lines is investigated. Using the slicing method, the load distribution characteristics along the contact line are obtained, and the load sharing among multiple tooth pairs during meshing is further studied. Then, by applying a cantilever beam bending stress model, the root bending stress on such a gear drive is calculated. A root bending moment distribution model is proposed based on the characteristics of the line load distribution previously obtained, from which a formula for calculating root bending stress is derived. Finally, static-condition experiments are conducted to test the root bending stress. The accuracy of the proposed calculation method is verified through experimental testing and finite element analysis. The results of this study provide a foundation for designing lightweight and high-power-density spiral bevel gear drives.

1. Introduction

Spiral bevel gears, as fundamental components in mechanical transmission systems, are renowned for their high contact ratio, smooth transmission characteristics, and high load-carrying capacity [1]. They play an irreplaceable role in critical applications such as automotive drivetrains, petroleum drilling machinery, heavy-duty weapon transmission systems, and aerospace power drives.
In long-term service, spiral bevel gear pairs with localized conjugate contact have been found to suffer from severe early-stage surface wear and even tooth breakage [2,3,4,5]. In recent years, certain progress has been made in the research related to the spiral bevel gears with high load carrying capacity and long service life [6,7,8,9,10,11,12,13]. Wang et al. [14,15,16,17] have proposed an efficient manufacturing method for realizing line contact spiral bevel gear pairs through systematic exploration of novel tooth geometry design theories and key innovations in machining technologies. This achievement offers new ideas and directions for the manufacturing and application of spiral bevel gears. Finite element simulations and the rolling test conducted in existing studies [16,17] have shown that, under identical basic geometric parameters, line contact spiral bevel gear pairs exhibit a significantly larger contact area compared to conventional spiral bevel gear pairs. Theoretically, full tooth surface contact can be achieved, resulting in a marked improvement in load-carrying capacity and offering great potential for applications in high-precision and heavy-load fields such as aerospace. However, due to the altered meshing characteristics of line contact spiral bevel gear pairs, existing strength calculation methods are no longer applicable.
Root bending stress, as one of the two fundamental stress types in gear analysis, serves as a key metric for assessing tooth root strength. The current approaches to its evaluation in spiral bevel gear pairs include empirical formulas, finite element analysis (FEA), and experimental methods. However, when applying empirical formula-based methods to analyze the root strength of line contact spiral bevel gear pairs, certain key correction factors in the root bending stress calculation formulas provided by standards such as ISO and AGMA [18,19,20,21] are more suitable for gear pairs with localized conjugate contact. These factors fail to reflect the meshing characteristics of line contact spiral bevel gear pairs with full tooth contact. In order to calculate the bending stress on the root of various gear tooth geometries and explore more accurate analytical algorithms, researchers have conducted extensive research by combining the formula method and simulation method. Simon et al. [22] employed FEA to analyze gear deformation and contact line load distribution under load conditions, offering a theoretical foundation for gear strength design. Li et al. [23] found through FEA that gear profile significantly influences contact stress, load distribution, and meshing stiffness, providing new insights for gear optimization. Sánchez et al. [24] developed a non-uniform load distribution model for spur and helical gears using the minimum elastic potential energy principle, identifying the location and value of the maximum root bending stress in high-contact-ratio gears and proposing a calculation formula. Pedrero [25] proposed a contact line load distribution model for involute helical gears based on the slicing method, which provided the foundation for the calculation of line load distribution on the tooth flank of spiral bevel gears. Liu et al. [26] modified the folded section method based on root fatigue crack paths and derived a root bending stress formula for rough module racks using an integral iteration approach. Yu et al. [27] developed a model for time-varying meshing stiffness and load distribution in non-circular gears with varying contact ratios and derived corresponding root bending stress equations. Zhang et al. [28] proposed an analytical method for calculating bending stress in end-face straight gears based on strength theory. Liu et al. [29] and Huang et al. [30] employed LTCA and FEA to analyze the contact stress of hypoid gear pairs.
Empirical formulas and numerical simulations are commonly used as theoretical tools to verify gear pair designs, but they are insufficient as a theoretical basis during the early design stage. Currently, testing remains the primary method for obtaining basic data on the bending fatigue of gears and for addressing the constraints of current gear industry applications. Xu et al. [31] used the finite element method and photoelastic tests to design a specialized loading device for bending fatigue tests, and the results showed that the load along the contact line was not uniformly distributed. Zhang [32], Long [33], and Wan [34] measured the root bending stress distribution along the face width by attaching strain gauges at the tooth root, and compared the results with finite element analysis, showing generally consistent trends. LISLE et al. [35,36] evaluated spur gear bending stress via ISO standards and ANSYS (2024 R2) FEA, and compared the results with strain gauge measurements. Chen et al. [37] conducted gear bending fatigue tests and proposed a predictive formula for the bending fatigue limit of gears. With increasing demands for safety and reliability in aerospace and other advanced engineering fields, the challenges facing the bending fatigue performance of bevel gears have become more severe. However, the fundamental data obtained from bending fatigue tests of spur and helical gears cannot be directly applied to evaluate the fatigue behavior of bevel gears. Moreover, most existing experimental studies on spiral bevel gear pairs focus on localized contact characteristics, and there is a lack of experimental data that truly reflect the load-carrying capacity of line contact spiral bevel gear pairs. This will make it difficult to fully reflect meshing characteristics, thereby limiting its further application in the field of high-precision, heavy-duty machinery.
Therefore, in order to meet the parametric design of gear pairs under different working conditions in engineering applications, this paper proposes a method for calculating the root bending stress of line contact spiral bevel gear pairs and carries out an experimental study. In this study, the meshing characteristics of line contact spiral bevel gear pairs are analyzed, the line load distribution model of the tooth surface is proposed using the slicing method, the calculation of tooth root bending stress is carried out based on this model, and finally the static tooth root bending stress test is used for verification.

2. Meshing Characteristics of Line Contact Spiral Bevel Gear Pairs

Compared with localized point contact spiral bevel gear drives, line contact spiral bevel gears can theoretically achieve full tooth surface contact. This section demonstrates, through theoretical calculations, simulation analysis, and experimental validation, that the meshing characteristics of line contact spiral bevel gear pairs differ significantly from those of conventional gear pairs, resulting in notable changes in root bending stress behavior.
To investigate the causes of changes in root bending stress, this section analyzes the meshing characteristics of line contact spiral bevel gear pairs. Section 2.1 establishes a cutting motion model of the tool by analyzing the relative motion and spatial positioning between the tool and the workpiece, thereby generating the precise line contact spiral bevel gear model. Section 2.2 conducts finite element analysis of tooth contact for both point contact and line contact spiral bevel gear transmissions with identical basic parameters, examining the differences in root bending stress and the line load distribution characteristics along the contact line. Section 2.3 further verifies the meshing characteristics of the gear pairs through the rolling test.

2.1. Gear Pair Modeling

To establish an accurate model of line contact spiral bevel gear pairs, this section constructs the tooth surface of the gear using the generating method and the tooth surface of the pinion using the tilting method. The fundamental geometrical parameters of the gear pairs are listed in Table 1.
The parameter design of the line contact spiral bevel gear pair includes the selection of fundamental geometric parameters such as the number of teeth z, the outer module m, the outer pitch diameter d, the mean spiral angle βm, the pressure angle αn, and the face width b. In the case presented in this paper, the gear pair has a transmission ratio of 2. The outer pitch diameter and outer module are independently designed parameters, while these two parameters jointly determine the number of teeth for the pinion and the gear. The mean spiral angle, which affects the contact ratio of the gear pair, is selected as 40° to ensure that the contact ratio remains within the range of 2 to 3. The pressure angle, typically 20°, is treated as an independent design parameter. The face width is related to the transmission ratio, the outer pitch diameter, and the shaft angle. For conventional spiral bevel gears, the shaft angle is generally 90°.
As detailed in [16], the machining tooth flank equation of the gear was first derived and set as the datum tooth flank for priority machining. Then, the pinion theoretical tooth flank, which was fully conjugate with the gear tooth flank, was obtained. Subsequently, an improved cutting motion model for the pinion was developed based on the cradle-type bevel gear milling machine equipped with the tilt mechanism, and the corresponding machined tooth flank equation of the pinion was derived. Finally, a mathematical model of the topological deviations was constructed to calculate the deviation between the machined tooth flank of the pinion and the theoretical tooth flank.

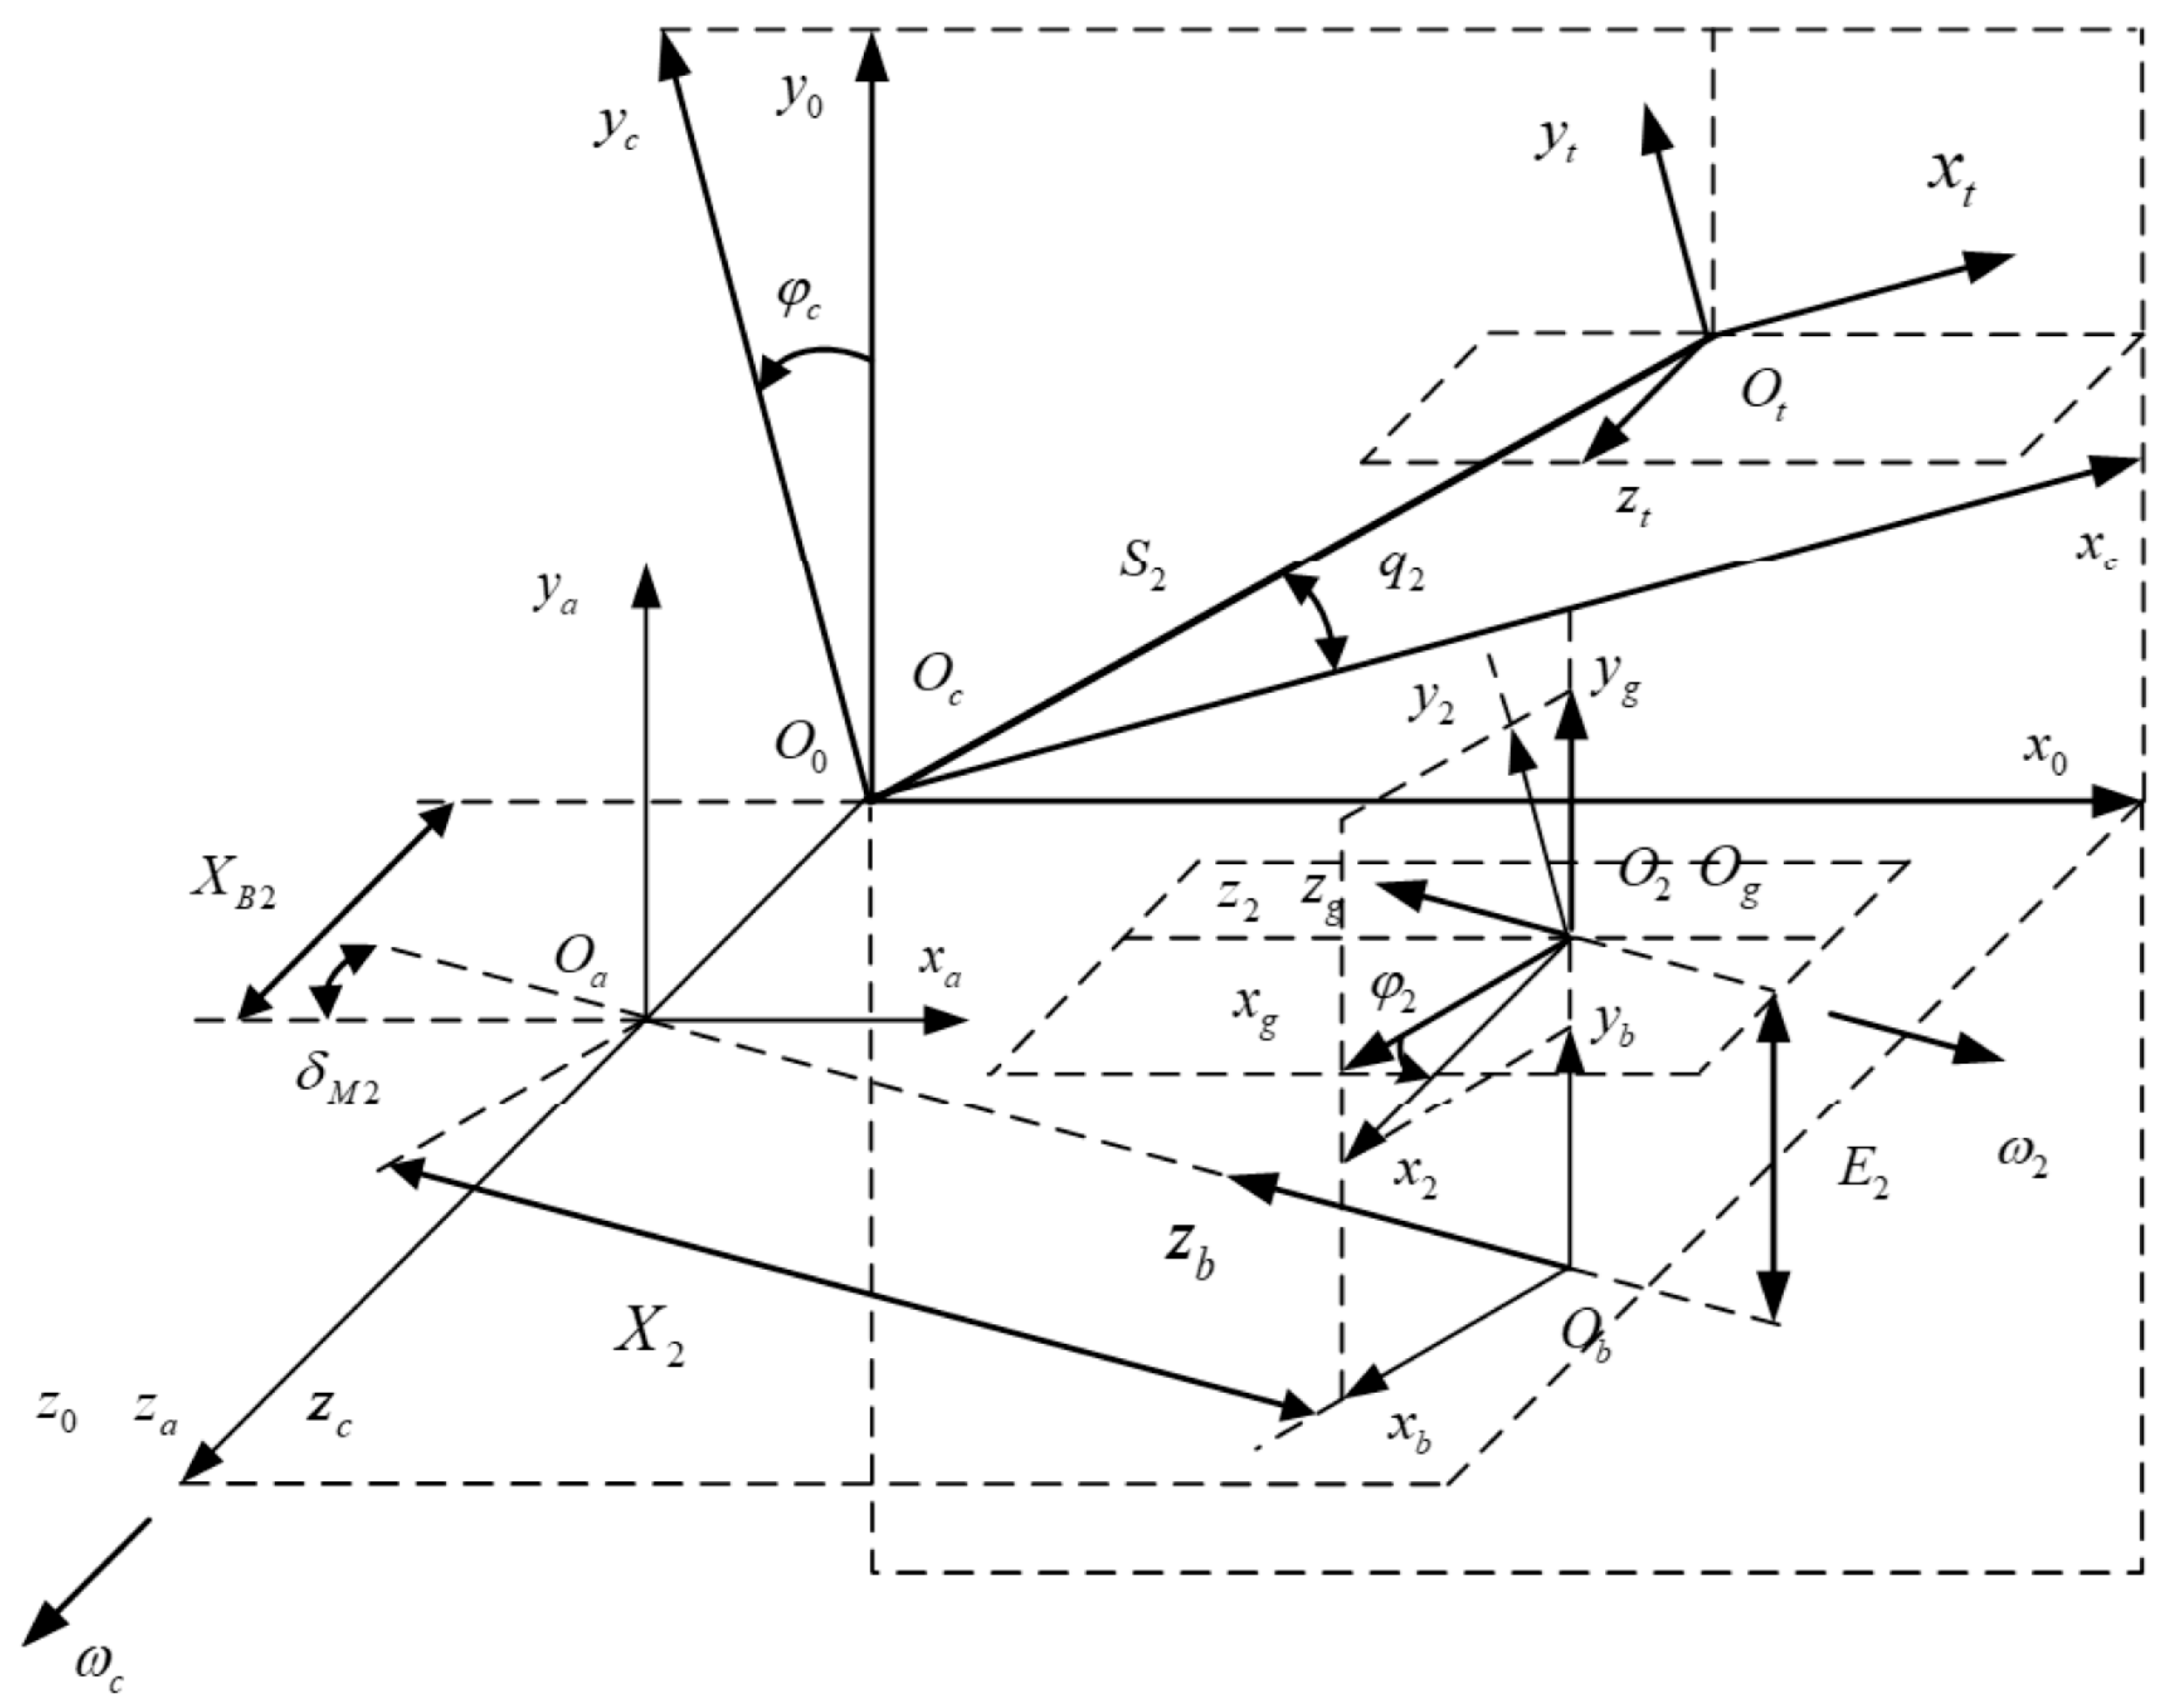
2.1.1. Machining Coordinate Systems for the Gear

According to the cutting model of the cradle-type bevel gear milling machine, a cutting coordinate system for the gear is established based on the generating method, as shown in Figure 1. The coordinate systems St (xt,yt,zt) and S2 (x2,y2,z2) are fixed to the cutterhead and the work gear, respectively. Sc denotes the coordinate system of the generating gear, while S0 represents the machine coordinate system. Sa, Sb, and Sg are auxiliary coordinate systems used to determine the relative position between the cutterhead and the work gear.
By transforming the position vector rt(t) of the tool cutting surface Σt from the coordinate system St to the coordinate system S2, the position vector equation r2(2) of the gear tooth surface Σ2 in the coordinate system S2 can be derived:
r t ( t ) = r t ( t ) ( ξ 2 ) n t ( t ) ( ξ 2 ) v 2 t ( t ) ( ξ 2 , λ 2 , φ c 2 ) = 0 r 2 ( 2 ) = M 2 t ( φ 2 , λ 2 ) r t ( t ) ( ξ 2 )
where nt(t)(ξ2) and v2t(t)(ξ2,λ2,φc2) represent the unit normal vector of the tool cutting surface and the relative motion velocity between the cutterhead and the work gear in coordinate system St, respectively. M2t (φ2, λ2) denotes the coordinate transformation matrix from coordinate system St to S2. The vector ξ2 represents the cutter parameters of the gear, while λ2 denotes the machining parameters of the gear tooth surface and φ2 is the rotation angle of the work gear.
Based on coordinate transformation, the transformation matrix M2t (φ2, λ2) from the position vector of the tool cutting surface rt(t) to the position vector of the gear tooth flank r2(2) can be derived. The detailed expression is provided in Appendix A.

2.1.2. Machining Coordinate Systems for the Pinion

Compared with the gear, the solution process for the pinion tooth surface equation requires the introduction of additional tilt and swivel coordinate systems, necessitating a new modeling approach. Based on the cutting model of the cradle-type bevel gear milling machine [16], the coordinate systems for pinion machining using the tilting method are established in Figure 2. The coordinate systems St (xt,yt,zt) and S1 (x1,y1,z1) are fixed to the cutterhead and the work pinion, respectively. S0 is the fixed coordinate system of the machine tool. The coordinate systems SQ, Sβ, SJ, and SI are associated with the cradle, eccentric cam, cutter spindle, and cutter tilt body, respectively. Sa, Sb, Sc, Sd, Se and Sg are auxiliary coordinate systems used to determine the spatial relationship between the cutterhead and the work pinion.
By transforming the position vector rt(t) of the tool cutting surface Σt from the coordinate system St to the coordinate system S1, the position vector equation r1(1) of the pinion tooth surface Σ1 in the coordinate system S1 can be derived:
r t ( t ) = r t ( t ) ( ξ 1 ) n t ( t ) ( ξ 1 ) v 1 t ( t ) ( ξ 1 , λ 1 , φ c 1 ) = 0 r 1 ( 1 ) = M 1 t ( φ 1 , λ 1 ) r t ( t ) ( ξ 1 )
where nt(t)(ξ1) and v1t(t)(ξ1,λ1,φc1) represent the unit normal vector of the tool cutting surface and the relative velocity between the cutterhead and work pinion in the coordinate system St, respectively. M1t (φ1, λ1) denotes the coordinate transformation matrix from the coordinate system St to S1. The vector ξ1 represents the cutter parameters of the pinion, λ1 denotes the machining parameters of the pinion tooth surface, and φ1 is the rotation angle of the pinion.
To ensure that the machined pinion tooth surface more accurately approximates the theoretical surface for line contact, an additional cutting motion needs to be applied to the cutterhead during the surface modification process. The tooth surface equation for the pinion machined using the tilting method has been derived in the previous section. To introduce adjustable parameters, the roll ratio can be further modified such that it varies continuously according to a defined pattern throughout the cutting process. The relationship between the generating gear rotation angle φc1 and the work pinion rotation angle φ1 follows a modified polynomial function:
φ 1 = i 1 c ( φ c 1 C 0 φ c 1 2 D 0 φ c 1 3 )
where C0 is the second-order ratio, D0 is the third-order ratio, and i1c is the machining roll ratio.
Thus, the equation for the pinion tooth surface may also be represented as:
r t ( t ) = r t ( t ) ( ξ 1 ) n t ( t ) ( ξ 1 ) v 1 t ( t ) ( ξ 1 , λ 1 , φ c 1 ) = 0 r 1 ( 1 ) = M 1 t ( φ 1 , λ 1 ) r t ( t ) ( ξ 1 ) φ 1 = i 1 c ( φ c 1 C 0 φ c 1 2 D 0 φ c 1 3 )
Based on coordinate transformation, the transformation matrix M1t (φ1, λ1) from the position vector of the tool cutting surface rt(t) to the position vector of the pinion tooth flank r1(1) can be derived. The detailed expression is provided in Appendix A.

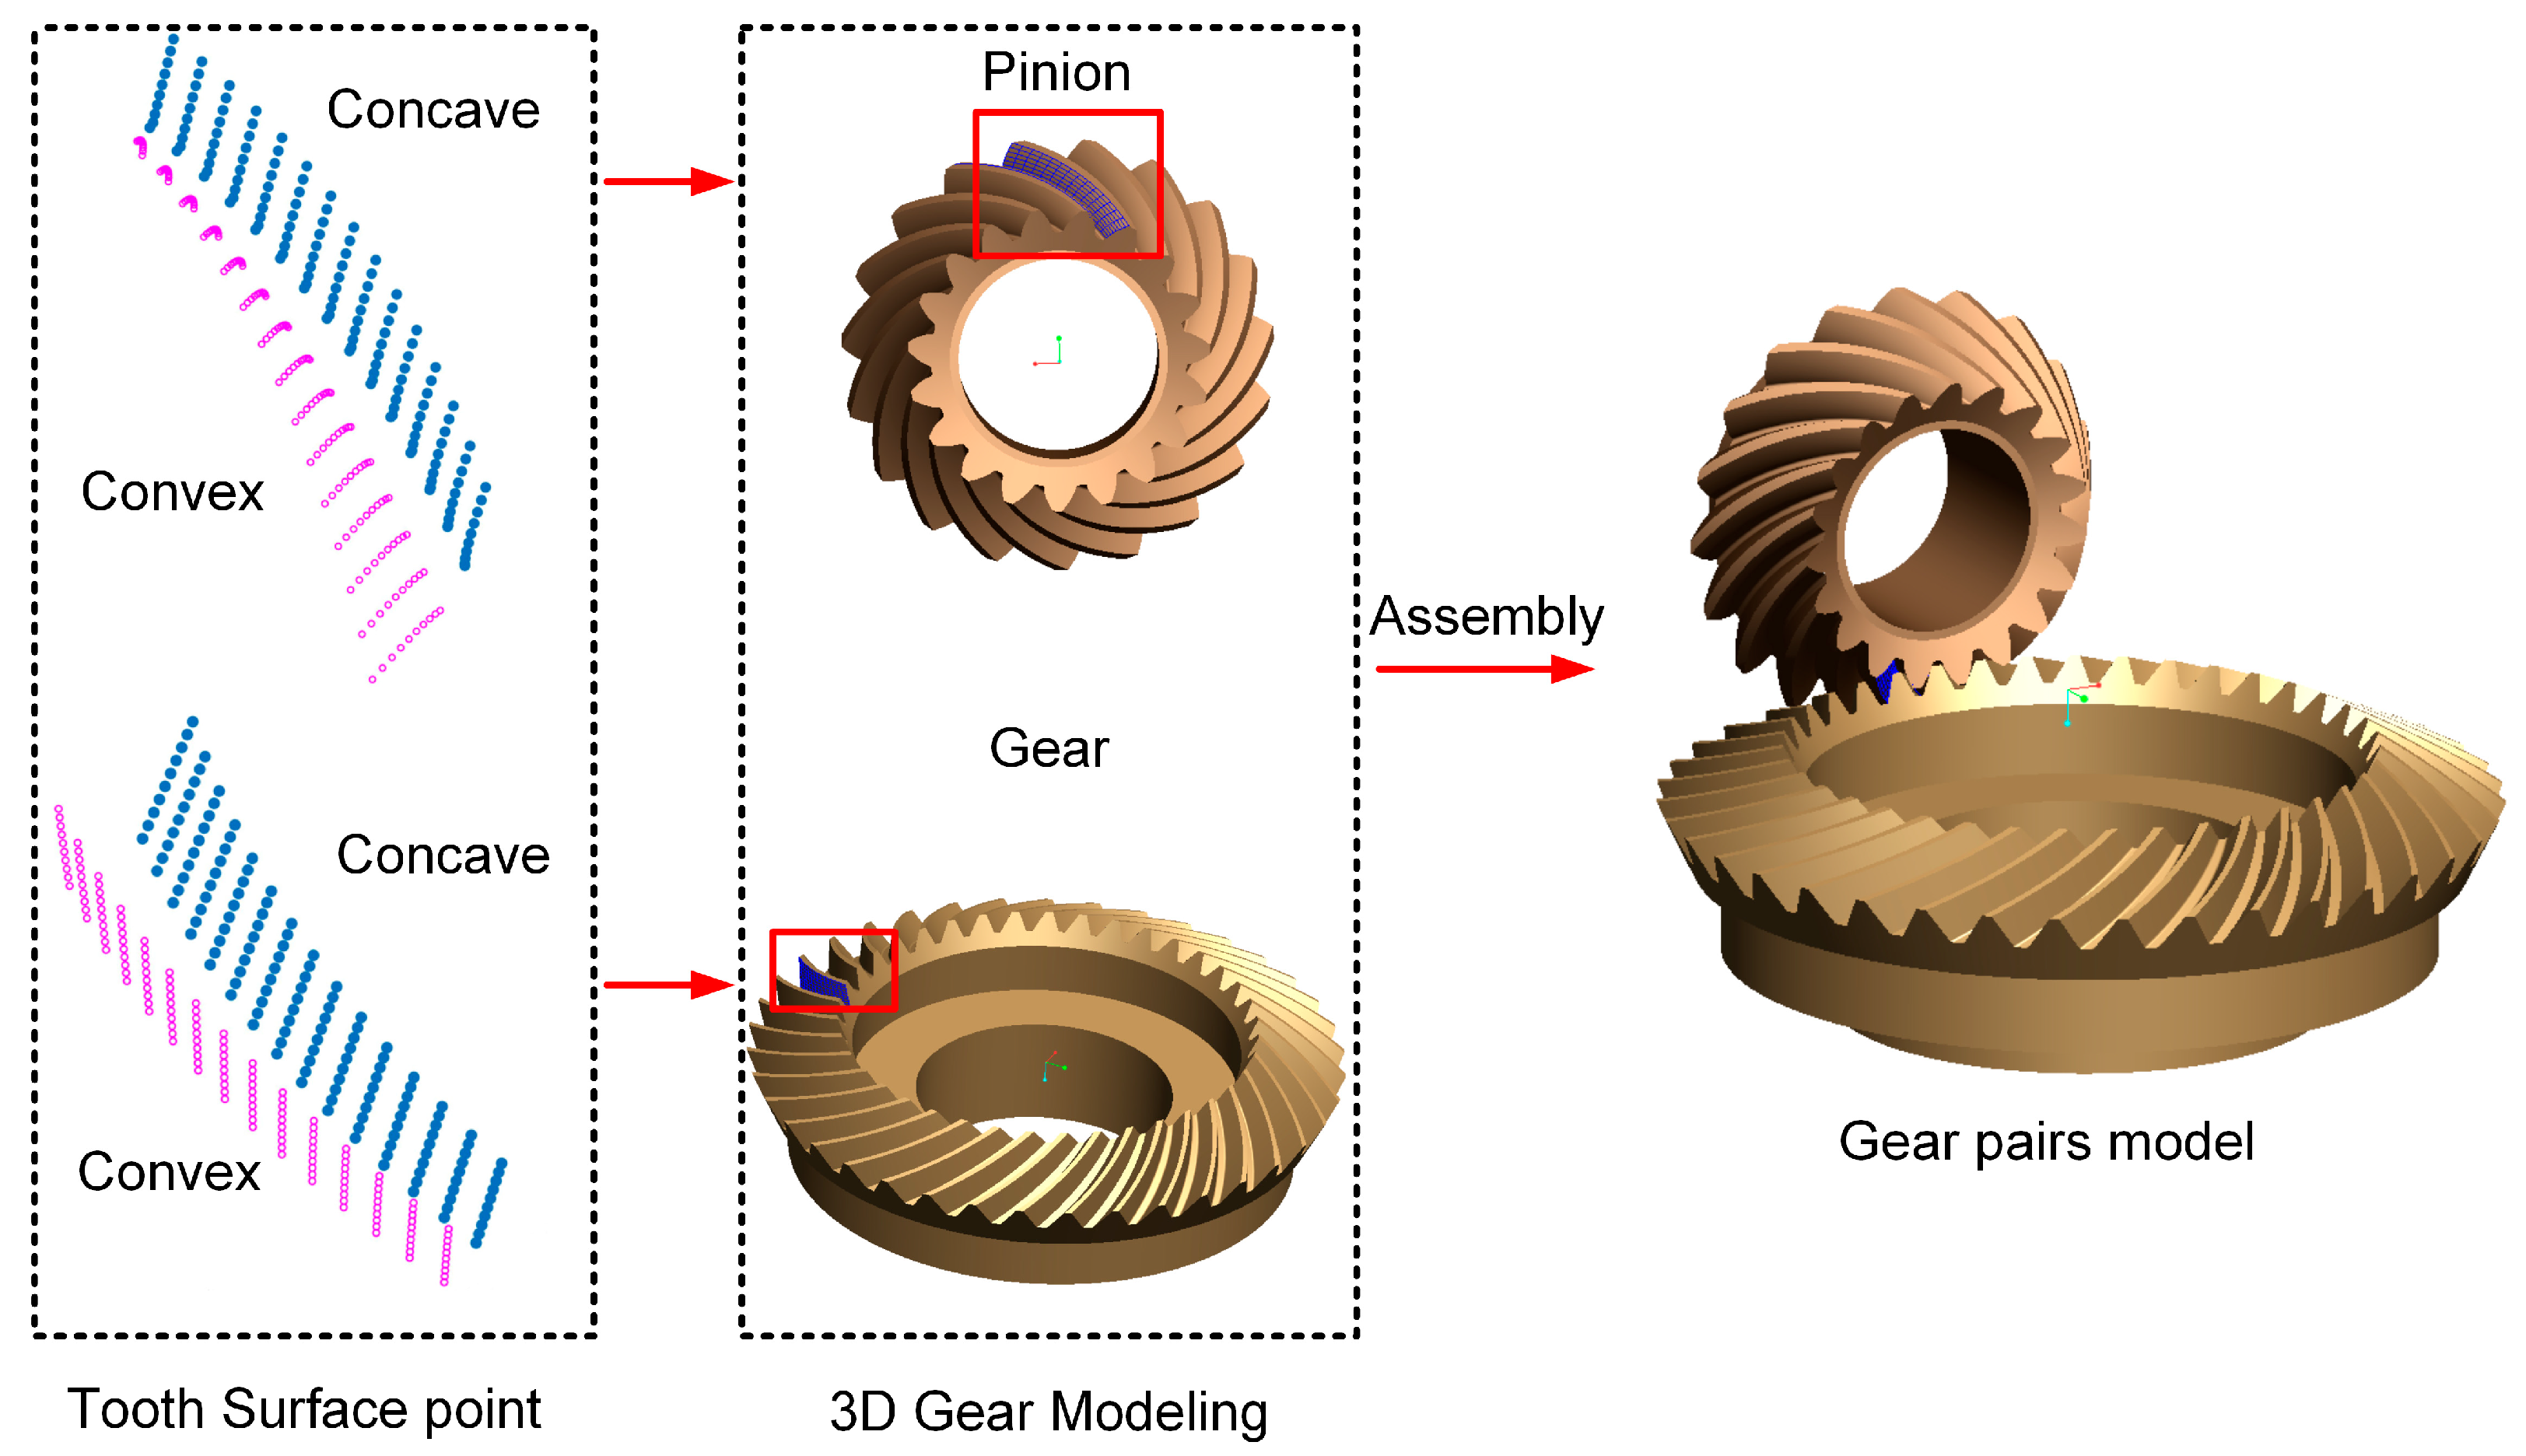
2.1.3. Three-Dimensional Model of the Gear Pairs

Based on the basic parameters of the gear pairs provided in Table 1, the previously derived tooth surface equations for the gear and pinion are solved to obtain the coordinates of the mesh points on the tooth surfaces. These coordinates are then imported into 3D modeling software, where line-to-surface fitting is performed to establish the 3D model of the line contact spiral bevel gear pairs, as shown in Figure 3.
The 3D model of the point contact spiral bevel gear pairs was generated using KISSsoft. After setting the gear pairs’ parameters from Table 1, the Gleason spiral bevel gear model was exported and compared with the model of the line contact spiral bevel gear pair, as shown in Figure 4.

2.2. Meshing Simulation Analysis

The meshing processes of point contact and line contact spiral bevel gear pairs were simulated using finite element software. The gear material had an elastic modulus of 210 GPa, a Poisson’s ratio of 0.25, and a density of 7850 kg/m3. The contact was assumed to be frictionless. The mesh was automatically generated with tetrahedral elements, with a minimum element size controlled at 0.55 mm. The pinion was assigned a rotational speed of 1 r/min, and the gear was subjected to a torque of 500 Nm. Each time step was divided into at least 30 sub-steps. The simulation results for both gear pairs are shown in Figure 5.
Figure 5a shows the meshing simulation results of the point contact spiral bevel gear pair, where the maximum contact stress on the tooth surface is about 900 MPa. The tooth surface stress distribution shows that the effective contact area along the tooth width is elliptical, consistent with the two types of stress calculation specified in the ISO standard for spiral bevel gears. The meshing characteristic features higher stress at the toe of the gear, meaning that the toe bears more load, which aligns well with meshing conditions observed in practical engineering.
Figure 5b shows the meshing simulation results of the line contact spiral bevel gear pairs. Compared with Figure 5a, meshing characteristics change significantly in the following aspects:
(a)
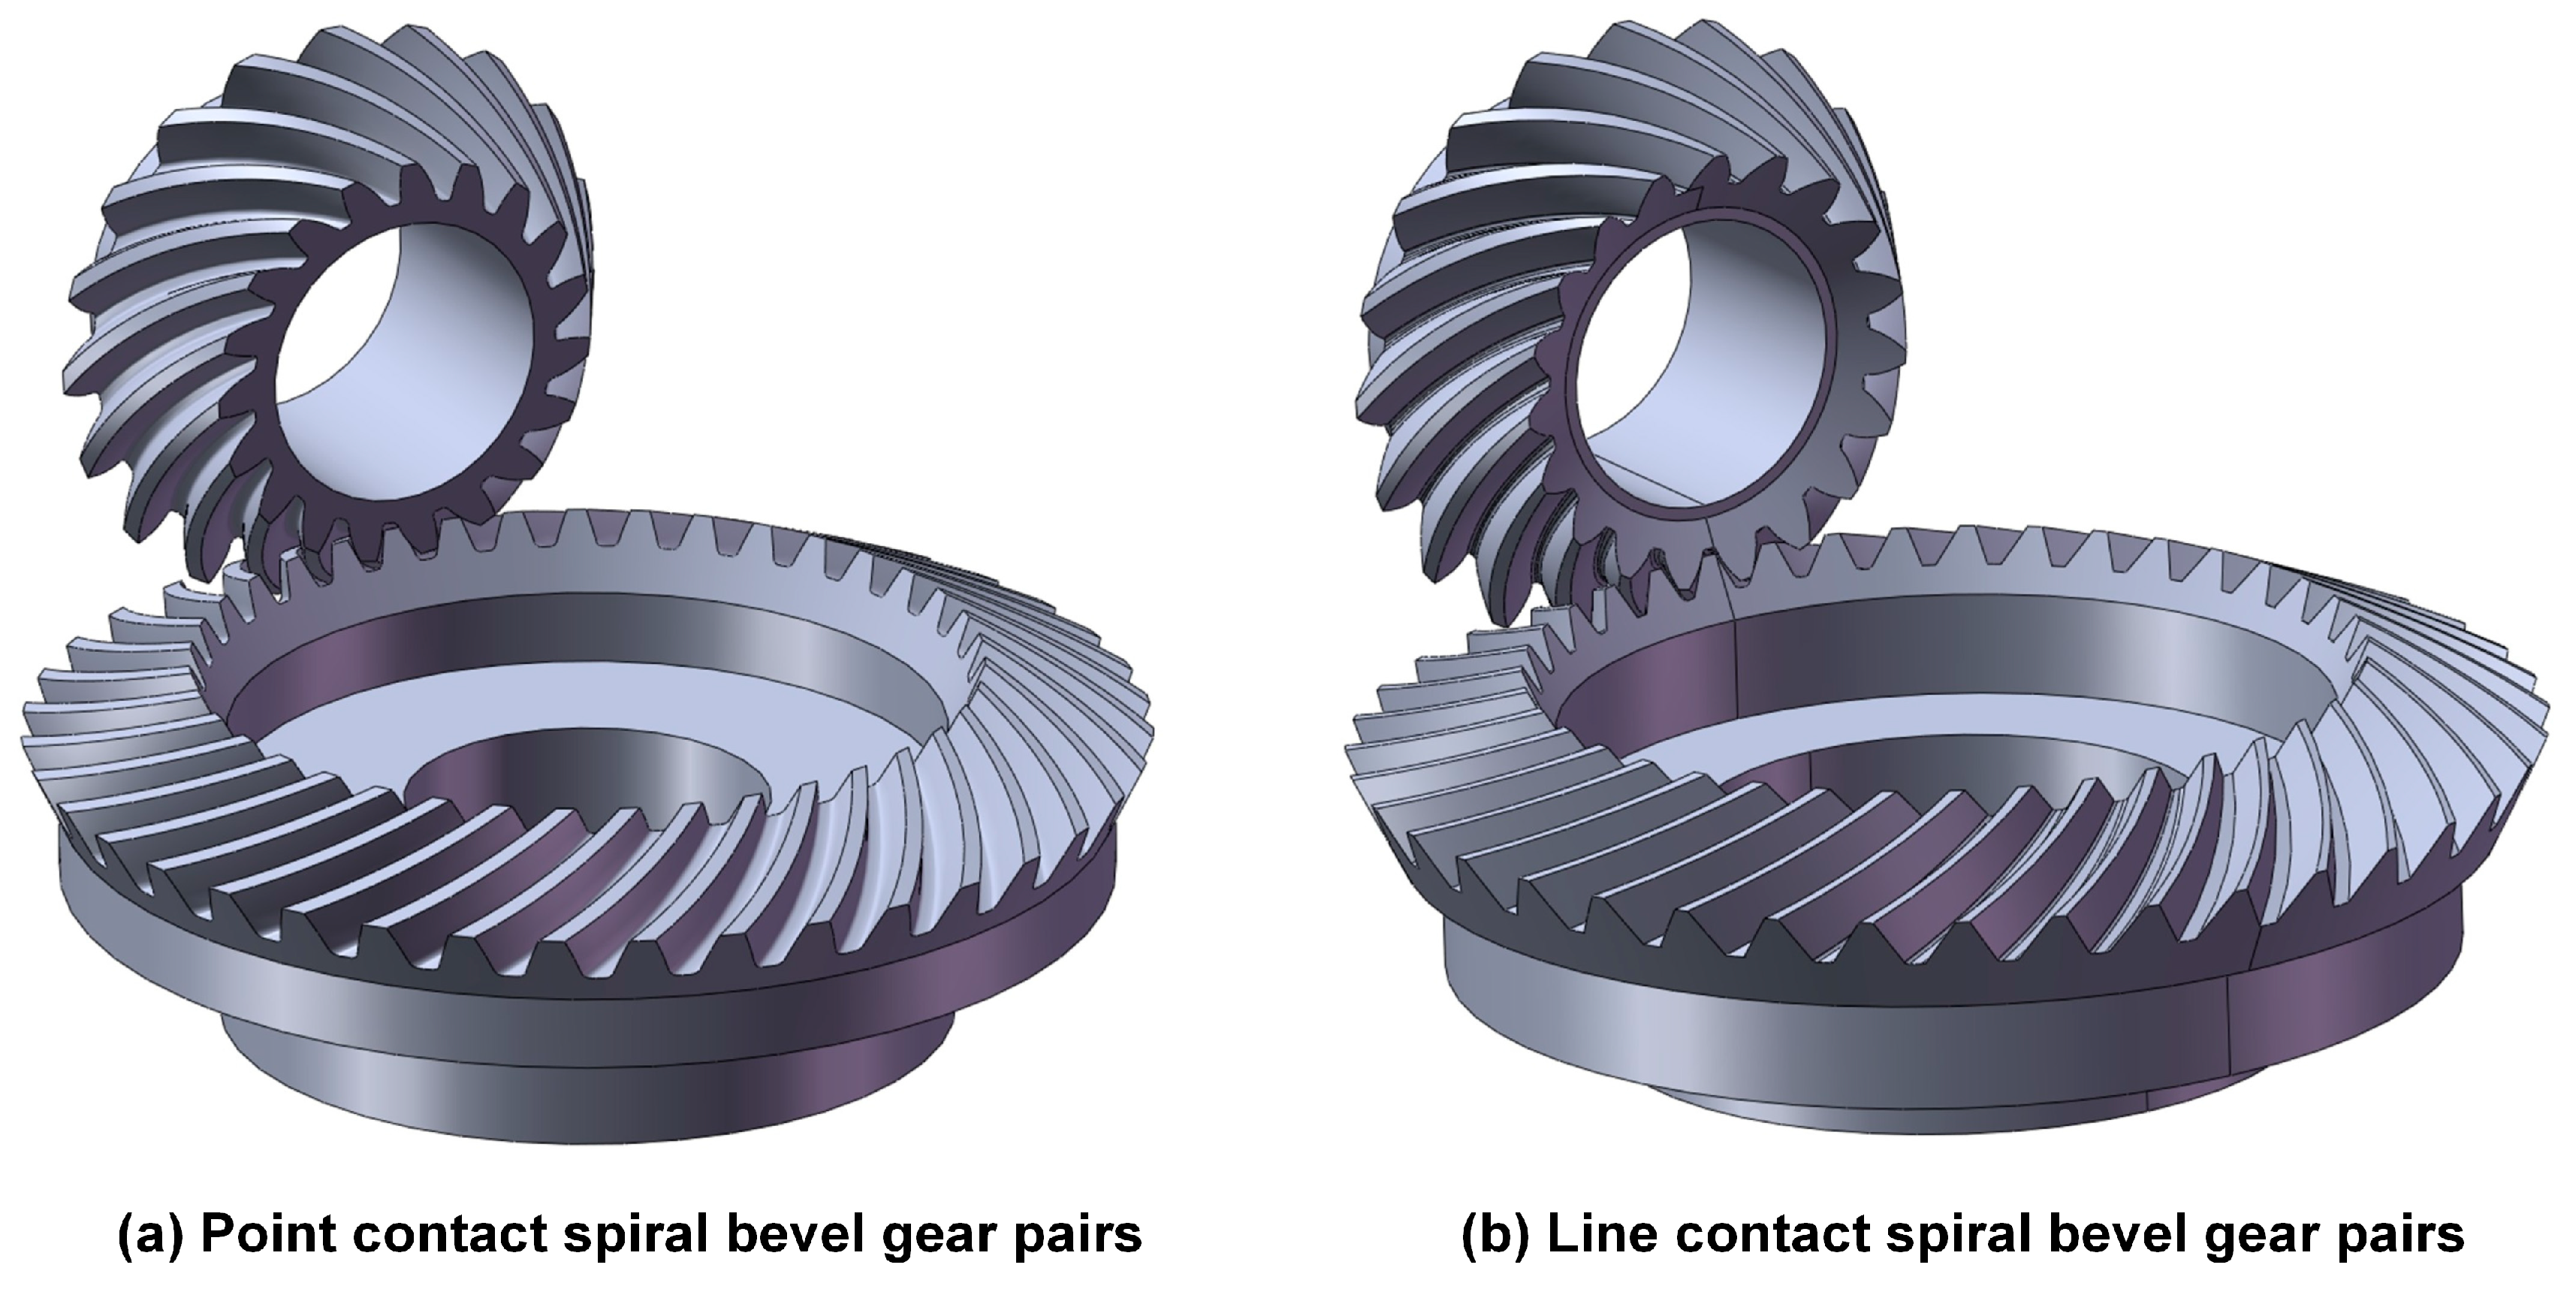
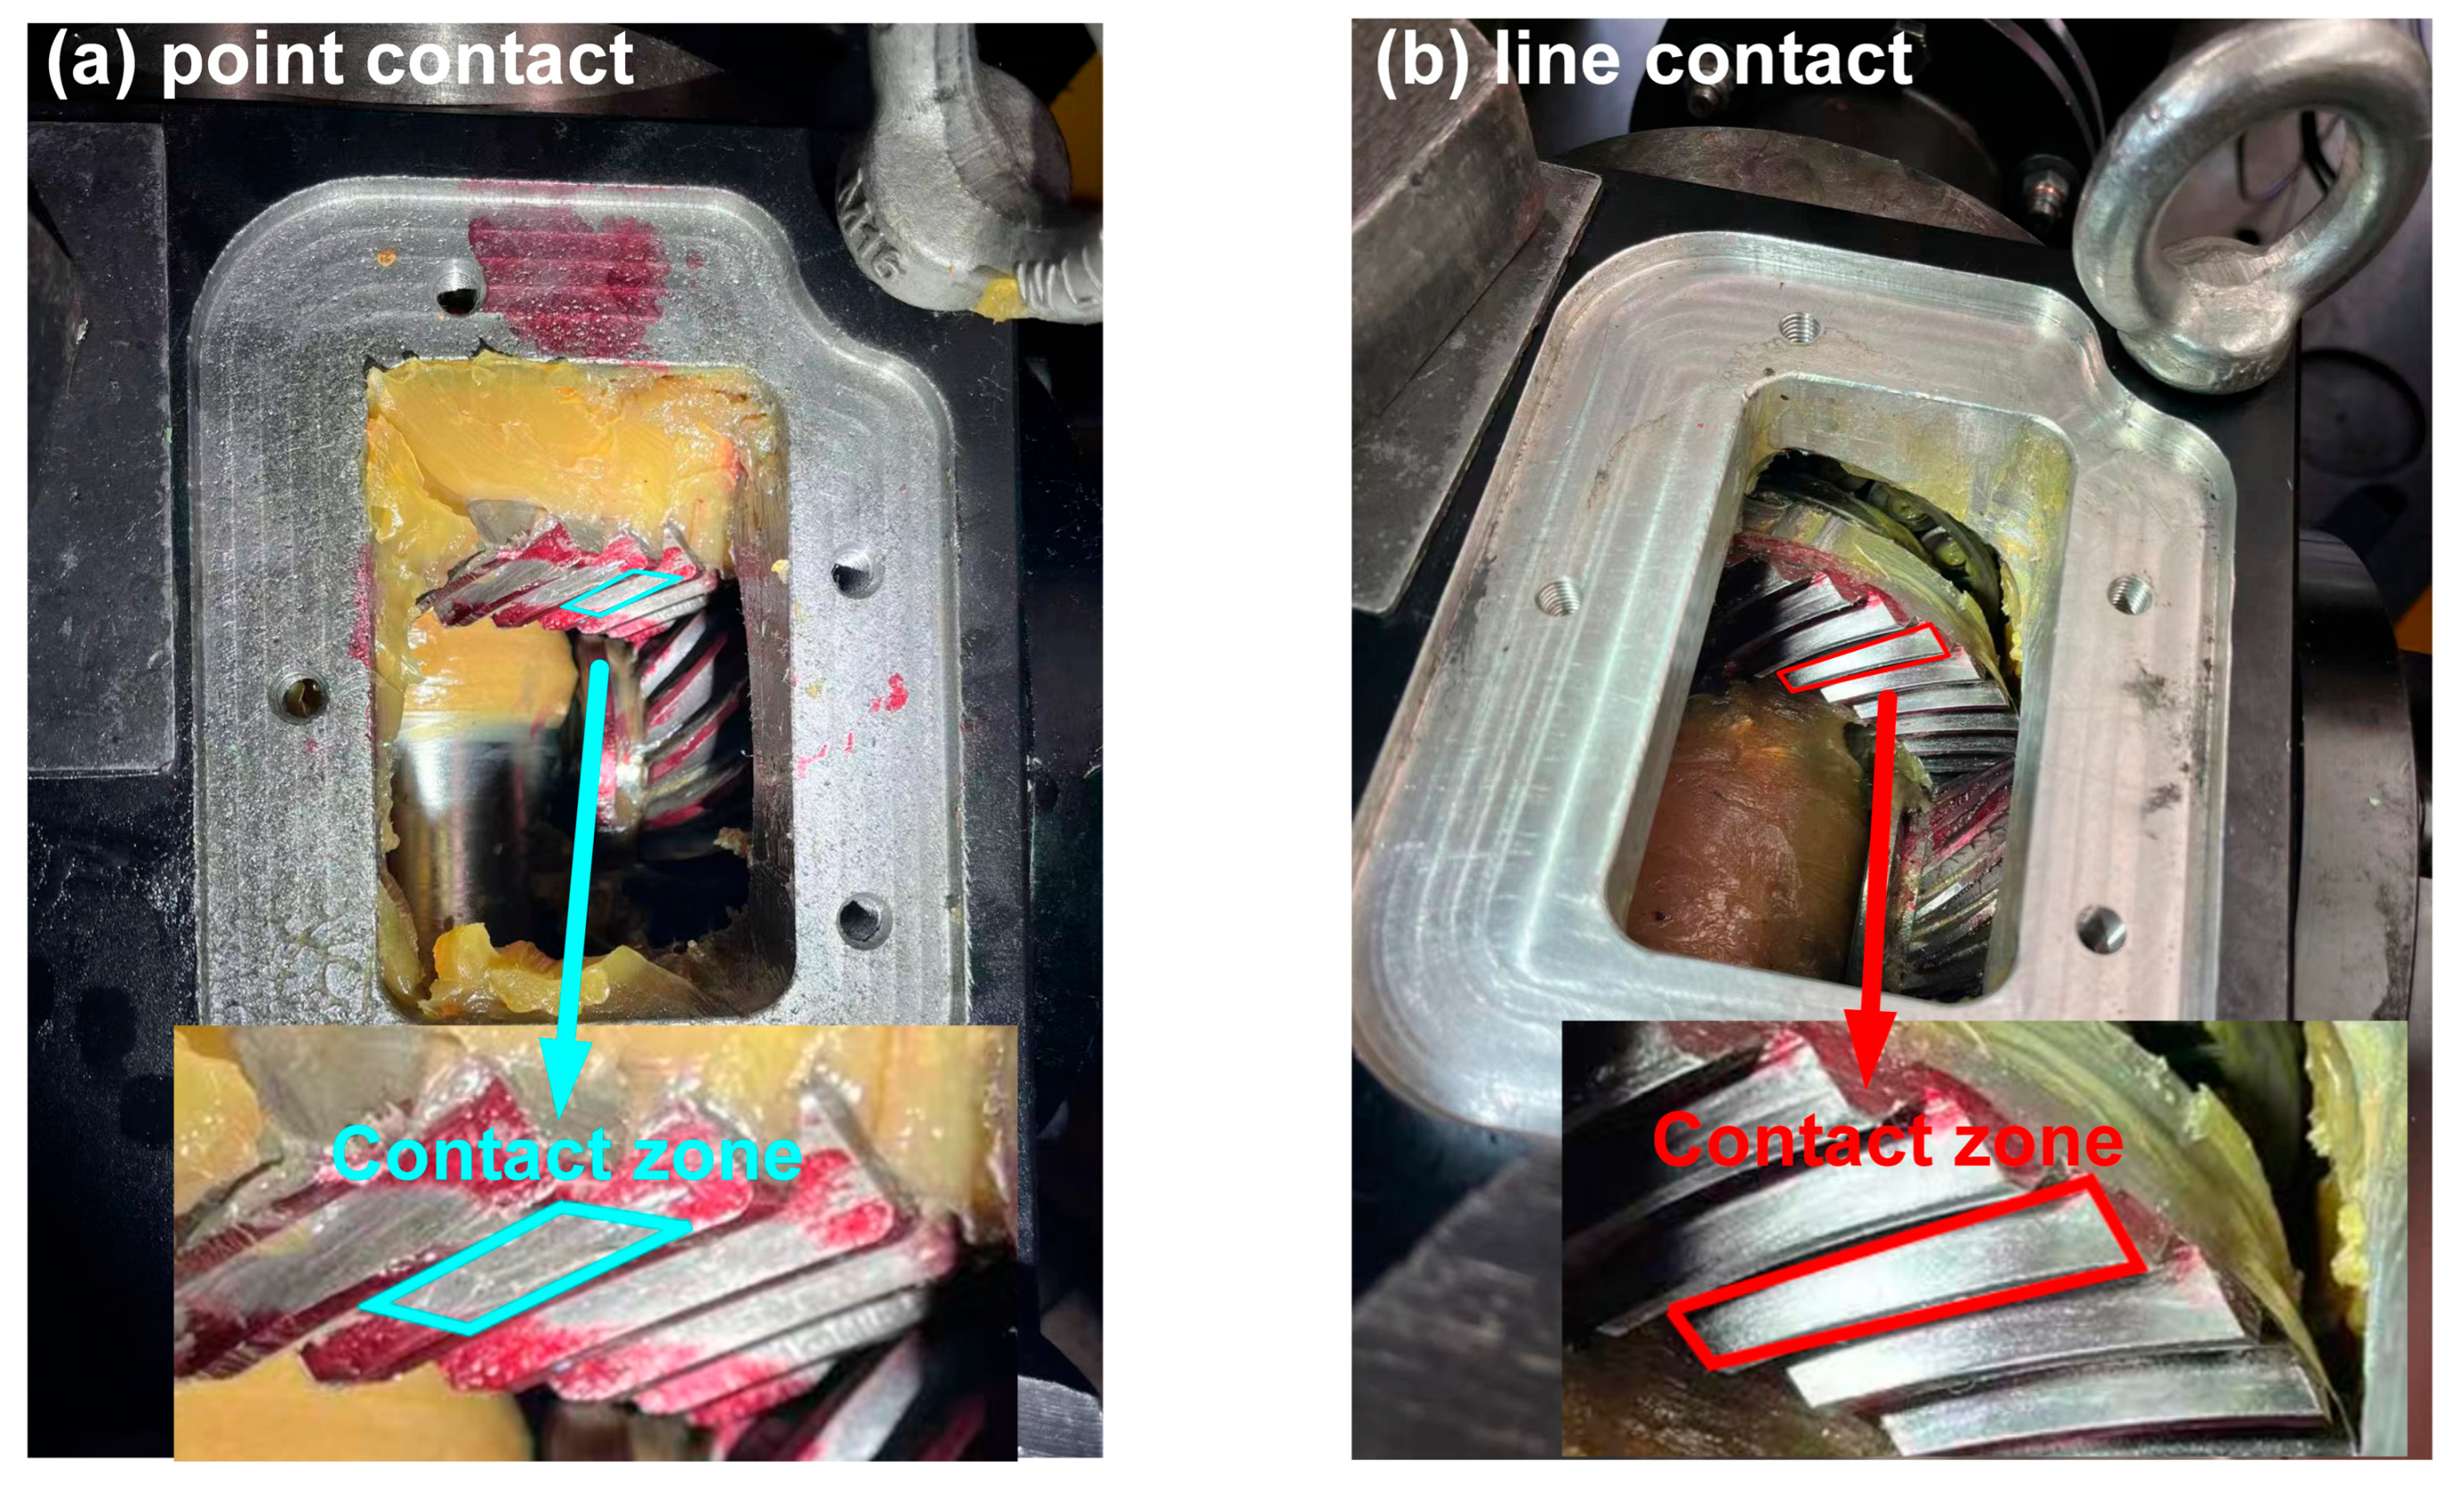
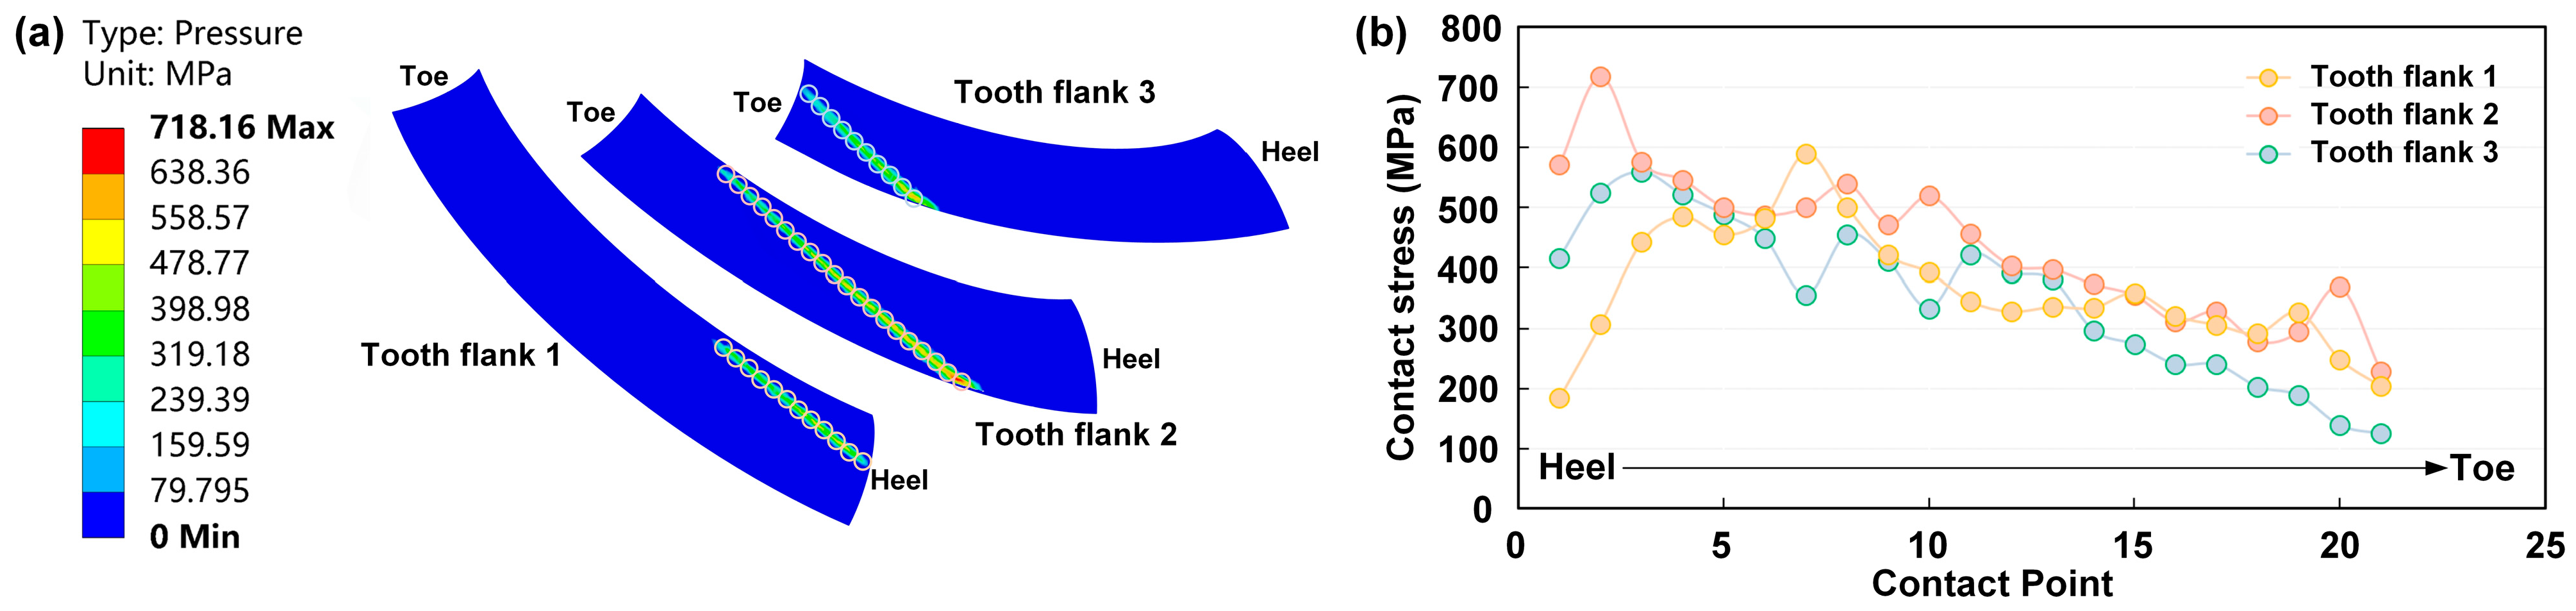
Unlike the elliptical contact area in point contact gears, the effective contact region in the line contact gear pair covers nearly the entire tooth surface.
(b)
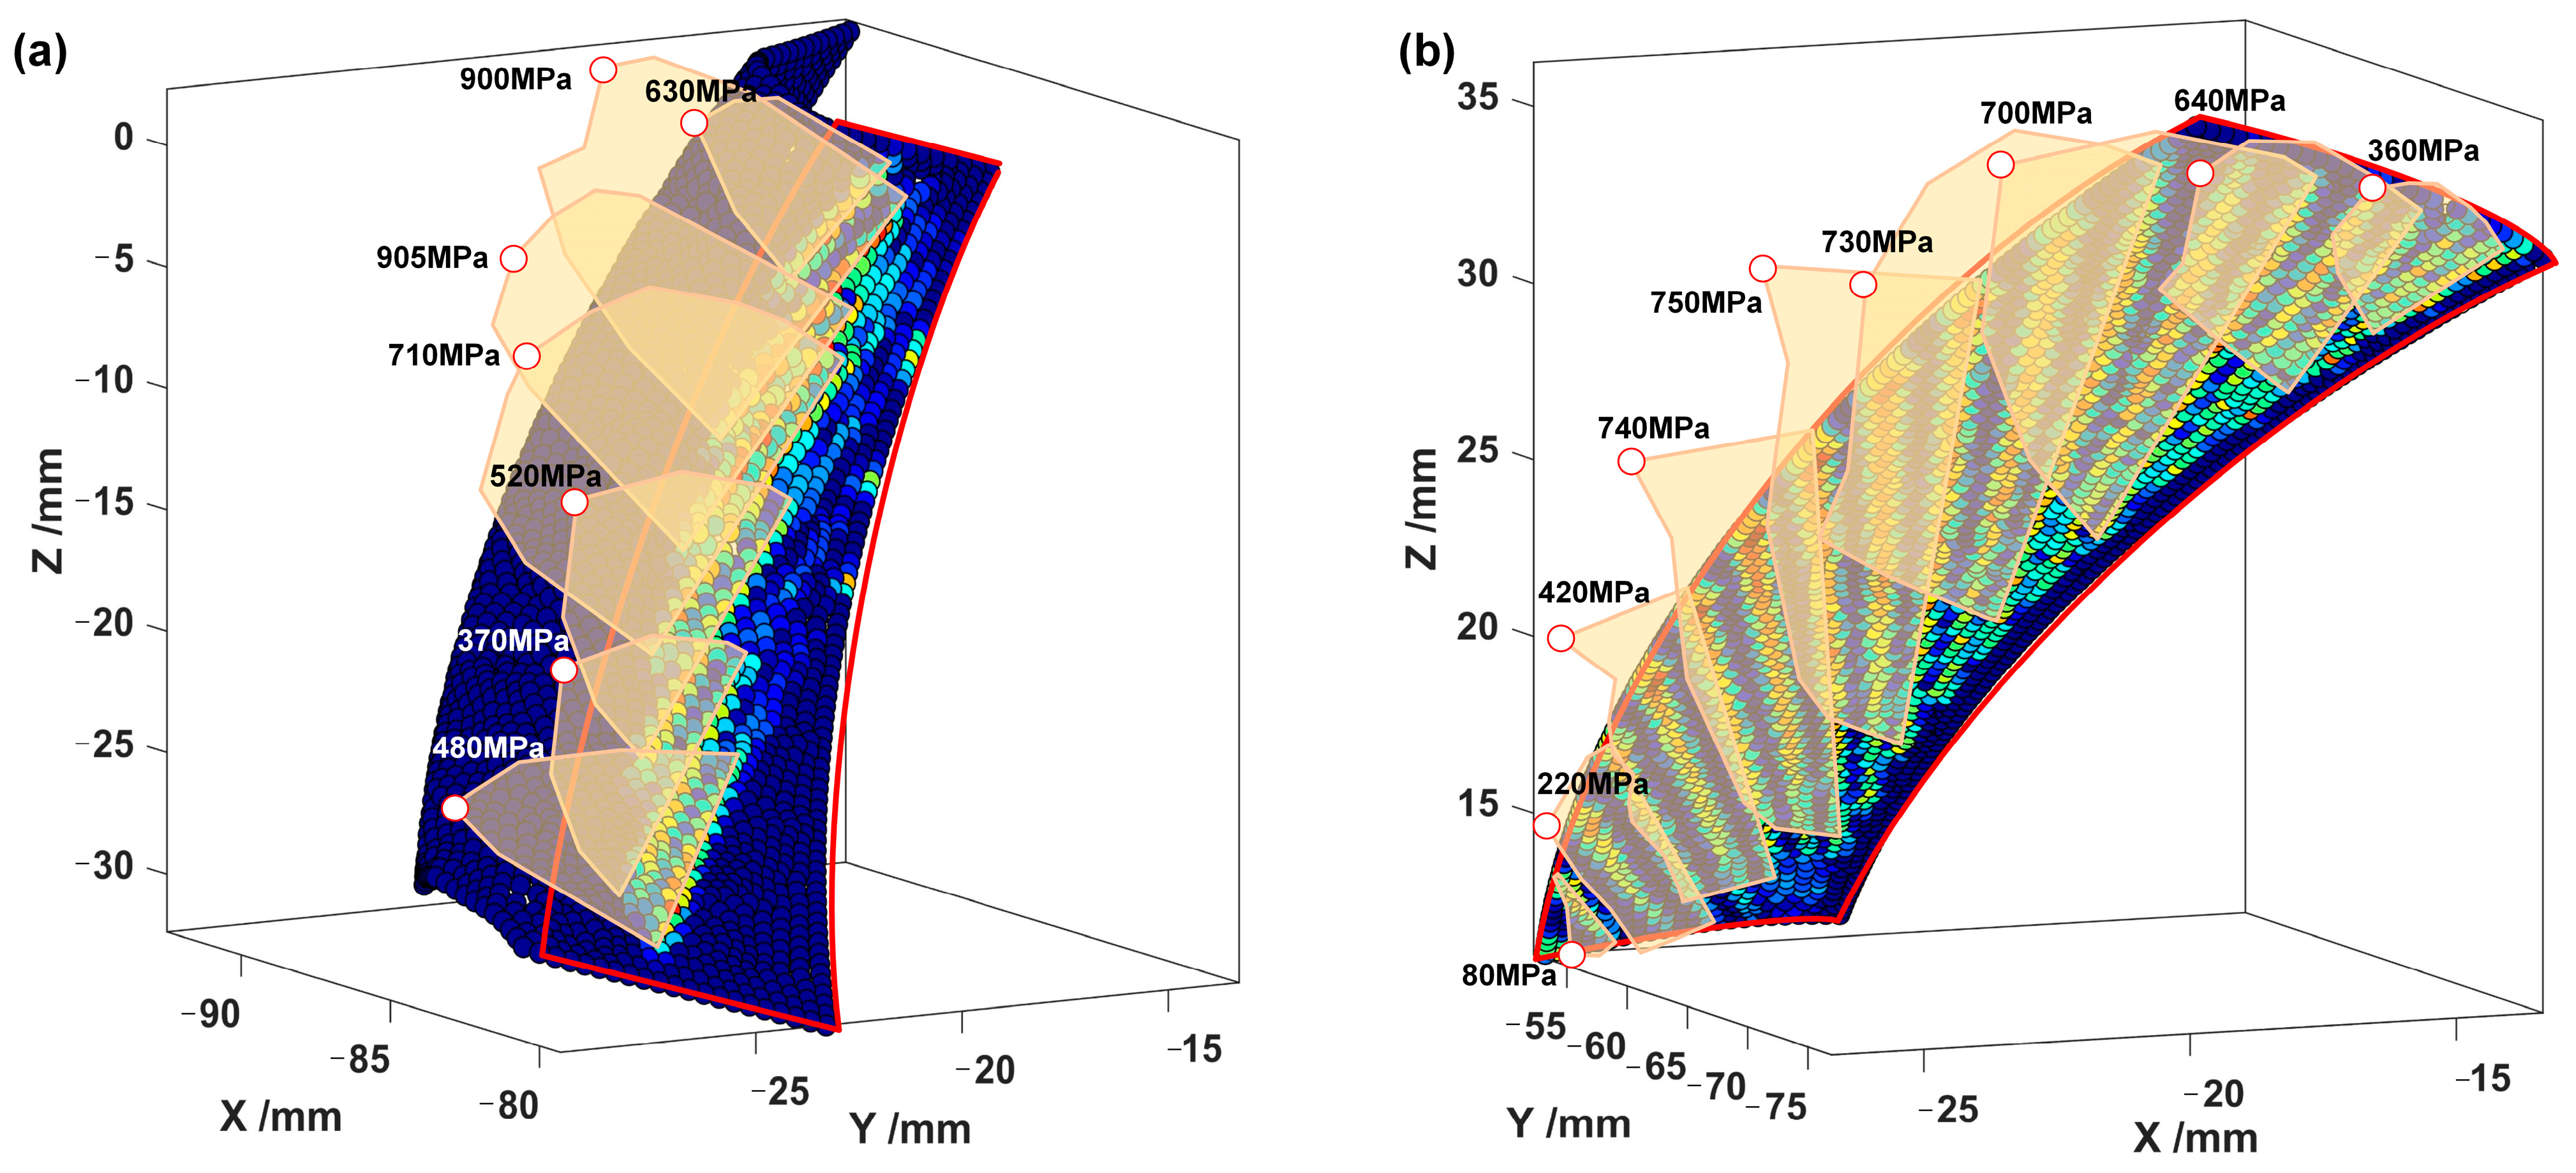
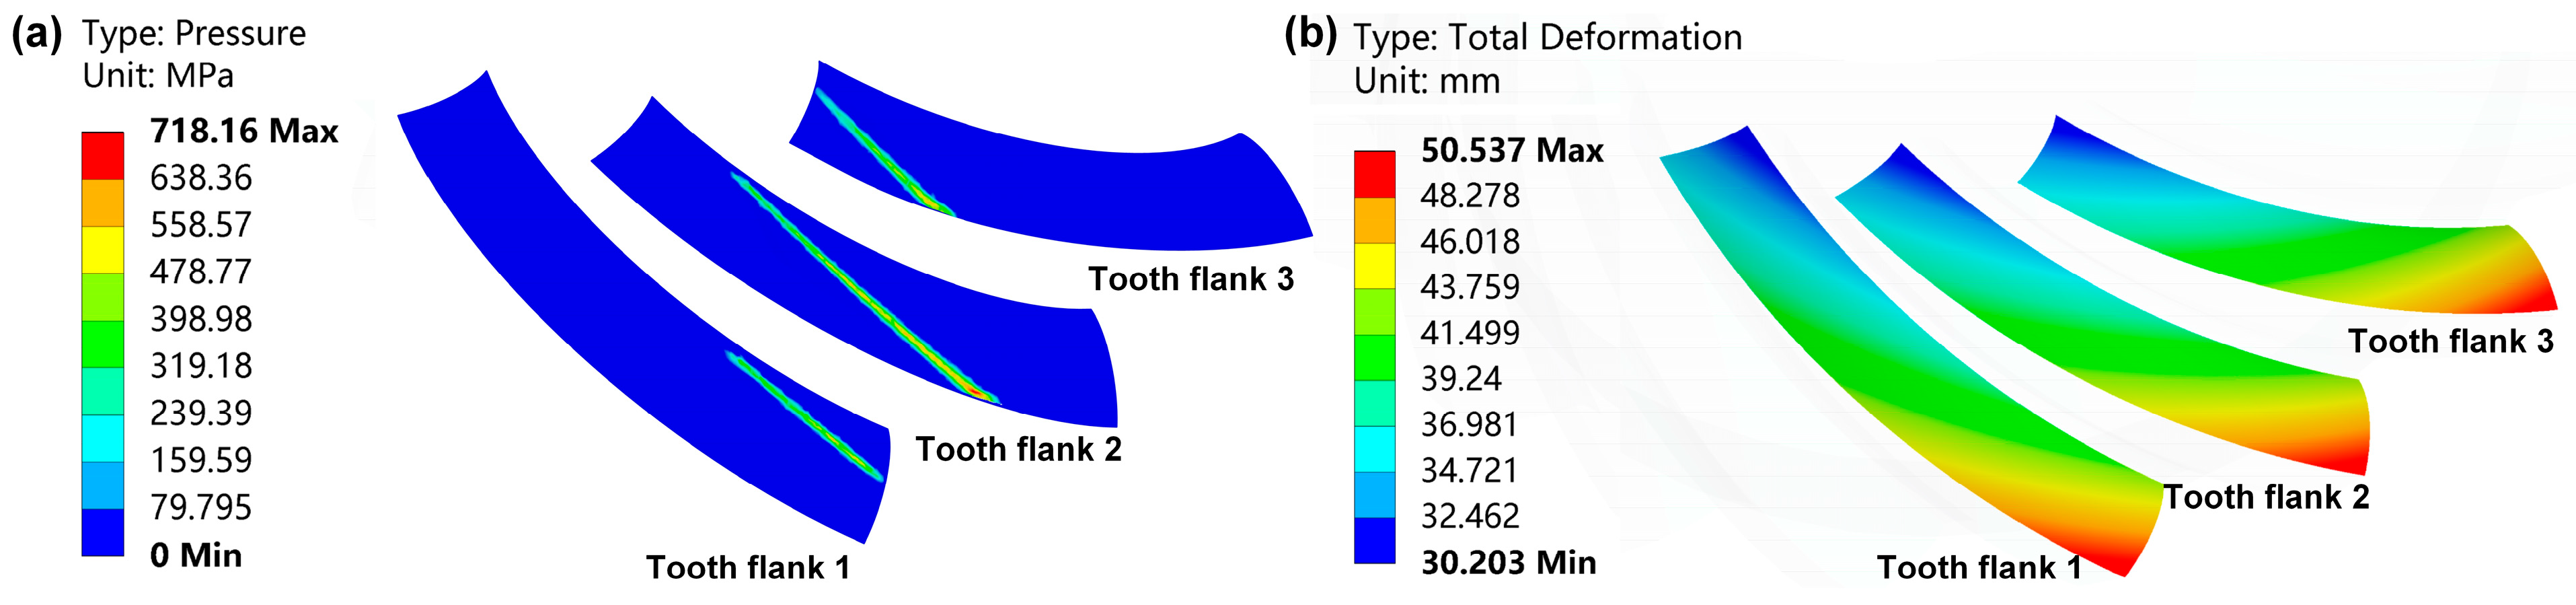
The maximum stress on the tooth surface is about 750 MPa, a reduction of 16.7%.
(c)
The stress distribution shows edge contact along the contact line near the addendum, with the maximum contact stress concentrated in this region. This is attributed to the ideal fully conjugate surface geometry of line contact gears; without profile modification, edge contact tends to occur. However, the overall stress distribution on the tooth surface is relatively uniform, which helps to reduce excessive localized wear and delays the onset of pitting or even tooth breakage.
The contact stress on the corresponding contact line at different moments is further extracted to compare the stress distribution characteristics on the tooth surfaces. The results are demonstrated in Figure 6.
In Figure 6a, the pinion starts to enter engagement from the heel. The maximum tooth contact stress gradually increases from the heel to the toe, with the maximum value appearing near the toe, and then gradually decreases to the end of engagement at the toe. The meshing characteristic indicates that in locally conjugate meshing spiral bevel gear pairs, the toe bears more load. However, due to the smaller tooth thickness at the toe, pitting or even tooth breakage is more likely to occur.
Figure 6b shows the contact stress distributions along the contact lines on the tooth flank of the line contact spiral bevel gear pair at different meshing moments. Due to the increased length of the instantaneous contact lines, the meshing area is further enlarged, resulting in a more uniform stress distribution along the overall contact lines. The stress near the central region of the tooth extending toward the heel is higher than that at the toe, indicating that this region carries a greater portion of the load.
Therefore, gear pairs with fully conjugate tooth surfaces can reduce tooth stress in the early meshing stages and lower the likelihood of early pitting and tooth breakage.
To further investigate the influence of the contact area shape and the line load distribution along the instantaneous contact lines on the tooth root bending stress, Figure 7a compares the dynamic variation of root bending stress throughout the entire meshing process, from engagement to disengagement, for both gear pairs. Figure 7b,c further analyze the stress distribution characteristics along the face width at the time when the maximum bending stress occurs.
According to the comparative analysis of Figure 7, it can be seen that there are similar characteristics in the distribution of bending stresses at the root of the teeth between the gear pairs with point contact and line contact. At the moment of peak bending stress, the stress along the face width first increases and then decreases. However, significant differences are observed in the magnitude and spatial distribution of root bending stress throughout the meshing cycle. Specifically, the point contact gear pairs show a maximum root bending stress of 458.22 MPa, occurring near the toe side of the tooth root along the face width. In contrast, the line contact gear pairs exhibit a reduced maximum stress of 364.79 MPa, a decrease of approximately 20%, located near the heel side of the tooth root. Both theoretical design and simulation results indicate that the two gear pairs differ notably in the shape of the contact area and the line load distribution along the contact path. These changes in meshing characteristics for the line contact spiral bevel gear pair will be further investigated through a load rolling test in Section 2.3.

2.3. Test Validation

Figure 8a,b show the test results of point contact and line contact gear pairs, respectively. The test results show that the length of the contact area of the conventional gear pairs is about 1/2 of the tooth width under load, while the contact area of the line contact gear pairs is almost equal to the entire tooth surface.
Section 2 demonstrates that the meshing characteristics of line contact spiral bevel gear pairs are different from those of conventional spiral bevel gear pairs in terms of theoretical calculations, simulation analysis, and experimental verification. Compared with the conventional spiral bevel gears with identical geometrical parameters, the meshing area of line contact spiral bevel gears increases, the length of the contact line increases, and the distribution characteristics of the bending stresses at the root of the teeth are subsequently changed.
The set of all instantaneous contact lines over one meshing cycle constitutes the tooth contact pattern. The morphology of the tooth contact pattern directly correlates with gear surface fatigue life; the shift to full conjugate meshing elongates the contact pattern along the tooth profile direction, transforming it from elliptical to rectangular, while the distribution pattern of line load along the tooth contact lines concurrently undergoes modification. Consequently, these two factors induce significant alterations in both bending stress amplitude and extreme-value locations at the tooth root for the two meshing modes. Thus, the distribution of root bending stress is governed by the tooth contact pattern morphology and the line load distribution along instantaneous contact lines.
However, based on the line contact assumption, ISO 10300-3 [20] introduces the concept of effective face width, denoted beff. As a default, the standard recommends using 0.85. However, the value of 0.85 is rather conservative. For today’s optimized bevel gear designs, the contact is typically larger. In addition, Method B2 in the ISO standard and the AGMA standard [21] define the tooth contact area of spiral bevel gears as an elliptical region, with the load distribution along the contact line following an elliptical function.
In accordance with the above, ISO and AGMA standards fail to account for this phenomenon in the root strength verification of spiral bevel gear pairs. In practical engineering applications, geometric parameter selection for line contact spiral bevel gears designed using existing verification formulas often proves excessively conservative. This conservatism impedes the evolution toward lightweight, high-power-density transmission systems.
Consequently, it is imperative to establish a root bending strength calculation model based on tooth surface line load distribution characteristics, enabling optimal geometric parameter selection for line contact spiral bevel gear pairs and ultimately achieving high-power-density design. The primary research framework of this study is illustrated in Figure 9.

3. Line Load Distribution Model on the Tooth Surface

The pattern of load distribution along the contact line is a reasonable assumption derived from theoretical deduction or experimental validation. This section primarily investigates the line contact load distribution and tooth load sharing in line contact spiral bevel gear pairs.
First, the FEA is employed to study tooth meshing characteristics, obtaining the conforming deformation behavior of the tooth flank in gear transmissions. Subsequently, the slice method is utilized to analyze the load distribution along the contact line for individual teeth. Building upon this foundation and considering the high contact ratio meshing characteristics of spiral bevel gear pairs, load sharing among different tooth pairs during simultaneous engagement of multiple tooth pairs is further investigated.

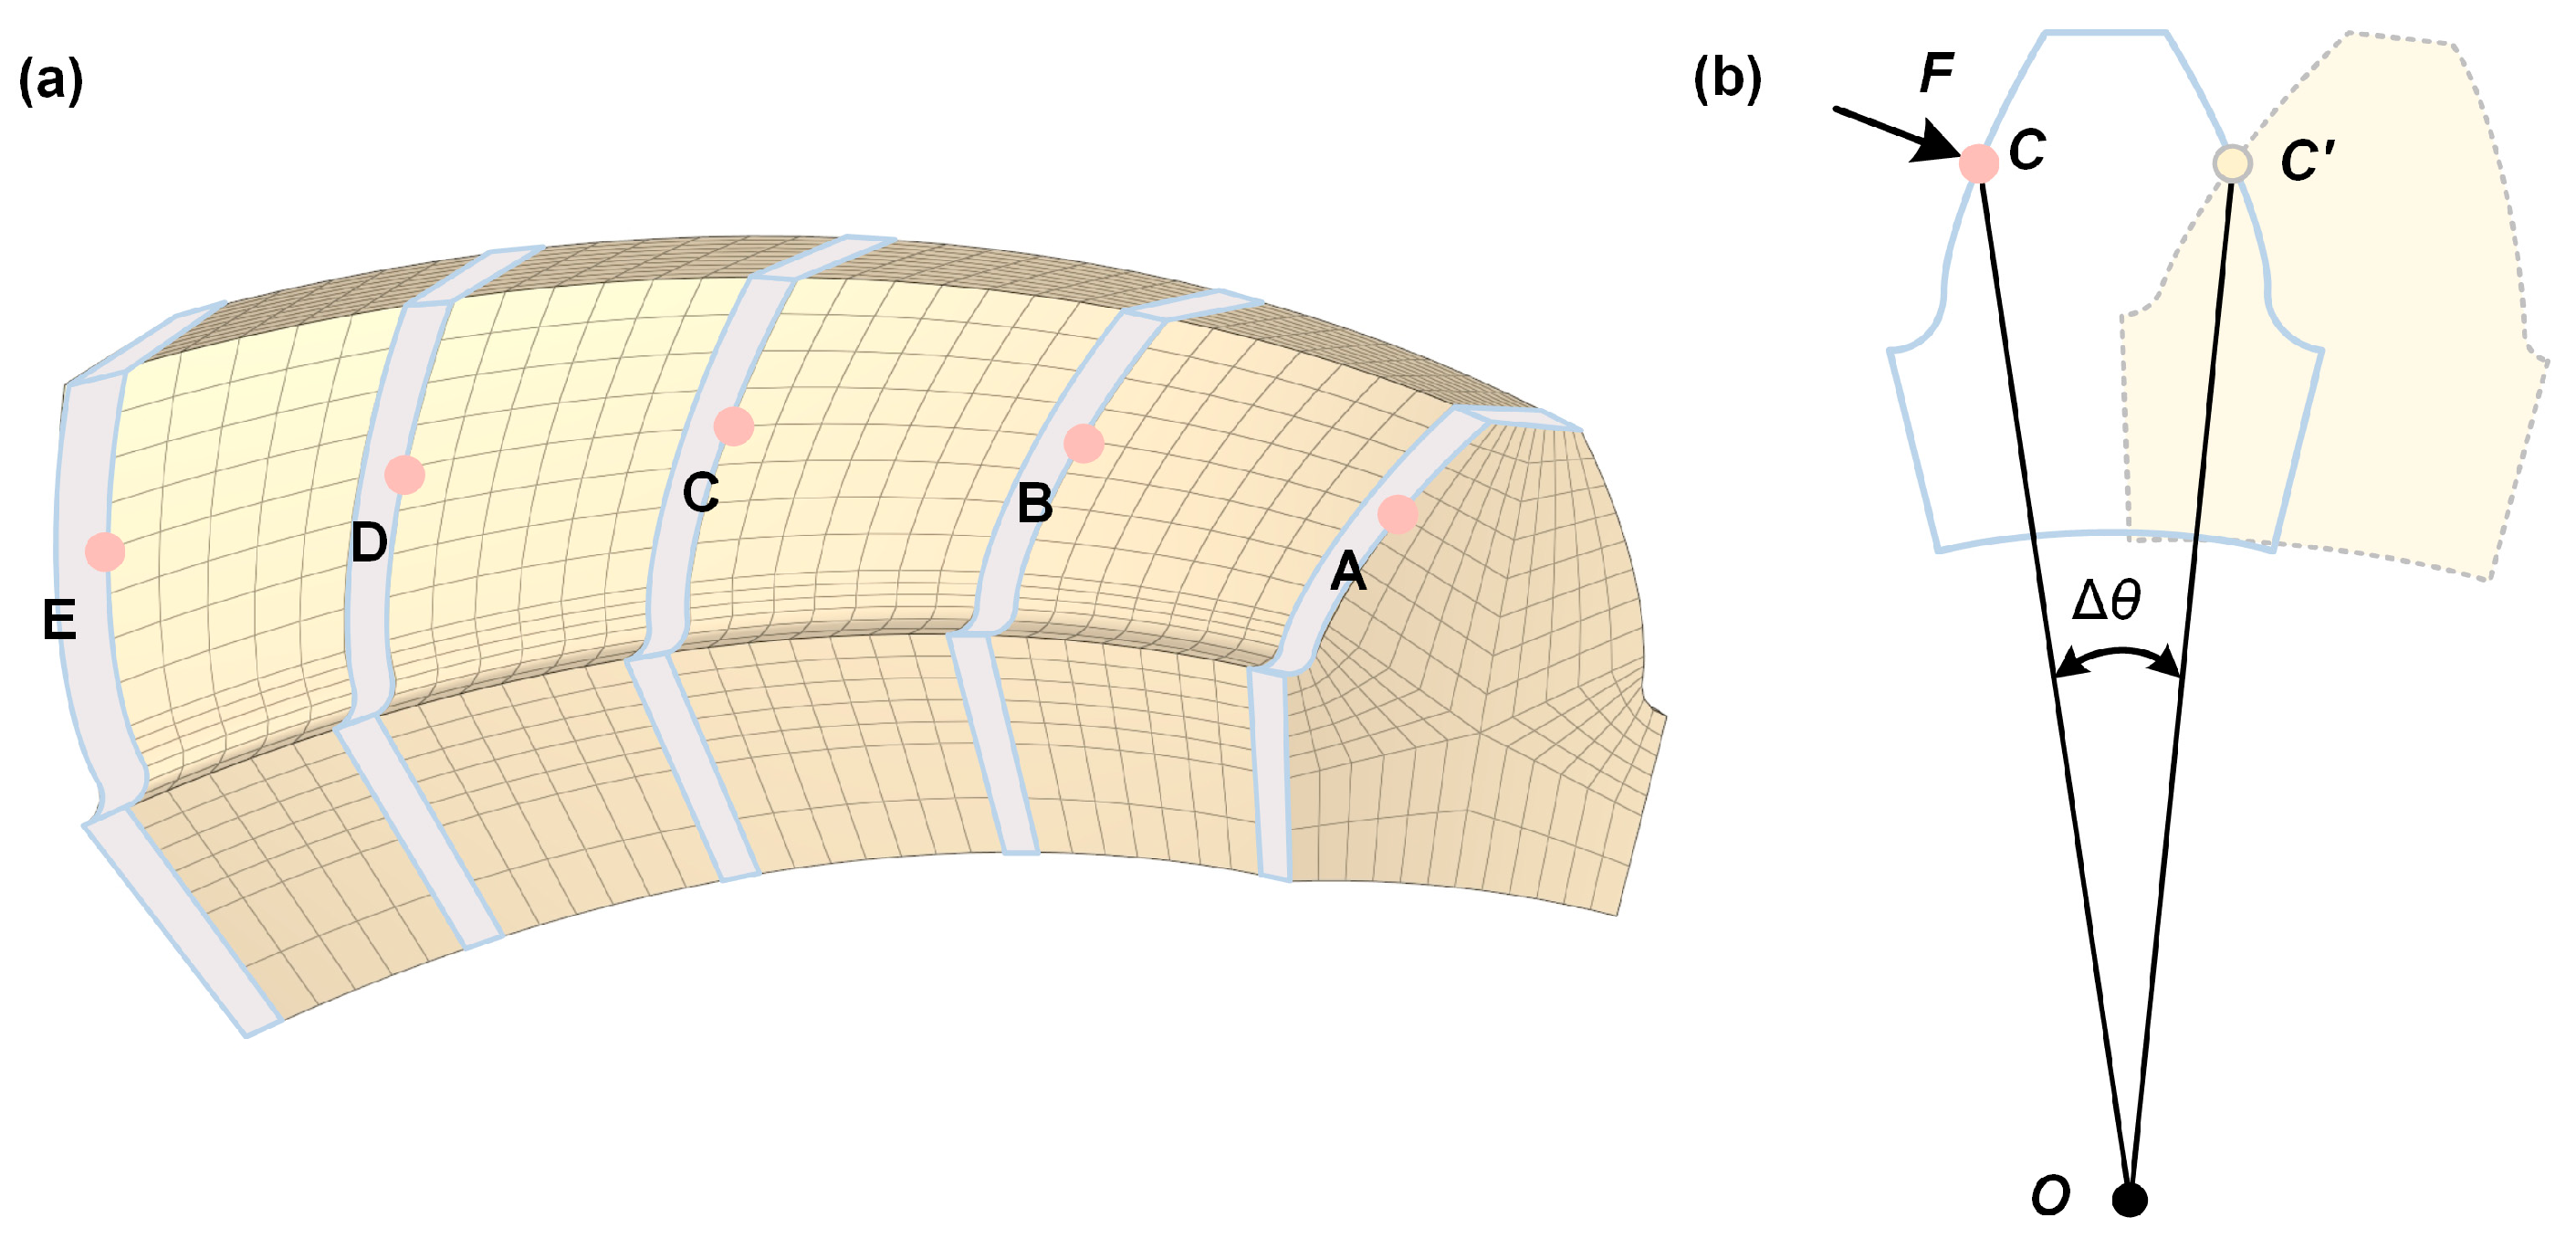
3.1. Analysis of Tooth Surface Conforming Deformation

To accurately calculate the line load distribution on the tooth surfaces of line contact spiral bevel gear pairs, analysis of the conforming deformation characteristics of the tooth surfaces is required. Following the FEA procedure outlined in Section 2.2, tooth contact analysis for multiple tooth pair engagement is performed. The meshing result of the model is presented in Figure 10.
Taking the three pairs of contacting teeth as an example, the tooth contact simulation results are shown in Figure 11a. The loaded deformation results of the pinion tooth surface under multiple tooth pair contacts are presented in Figure 11b.
Five positions (A, B, C, D, and E) are arbitrarily selected along the tooth width direction on the pinion tooth surface, as marked in Figure 12a. The computational procedure for determining angular change at each position before and after deformation is illustrated in Figure 12b.
The coordinate values of point C on the tooth surface before deformation and the point C′ on the tooth surface after deformation are extracted, and the length of CC′ is calculated. The magnitude of CC′ is calculated and defined as the deformation displacement. It is assumed that the lengths of OC and OC′ are equal before and after deformation, so the angular change of each position before and after deformation of the tooth surface is calculated according to the Equation (5):
Δ θ = arccos O C 2 + O C 2 C C 2 2 O C O C
where OC denotes the radial distance from a point on the tooth surface to the gear rotational axis before deformation and OC′ represents the radial distance from the corresponding position to the gear rotational axis after deformation.
The deformation displacement and angular variation at each position on tooth flank 2 are calculated using Equation (5), with results listed in Table 2. The data indicate that angular deformation across different tooth surface locations is approximately 0.057°, demonstrating uniform deformation under load at each position of the tooth surface.
These results confirm that line contact spiral bevel gear drives exhibit coordinated deformation behavior characterized by consistent rotational displacement under load. This section will investigate load distribution on such gear drives based on this deformation characteristic.

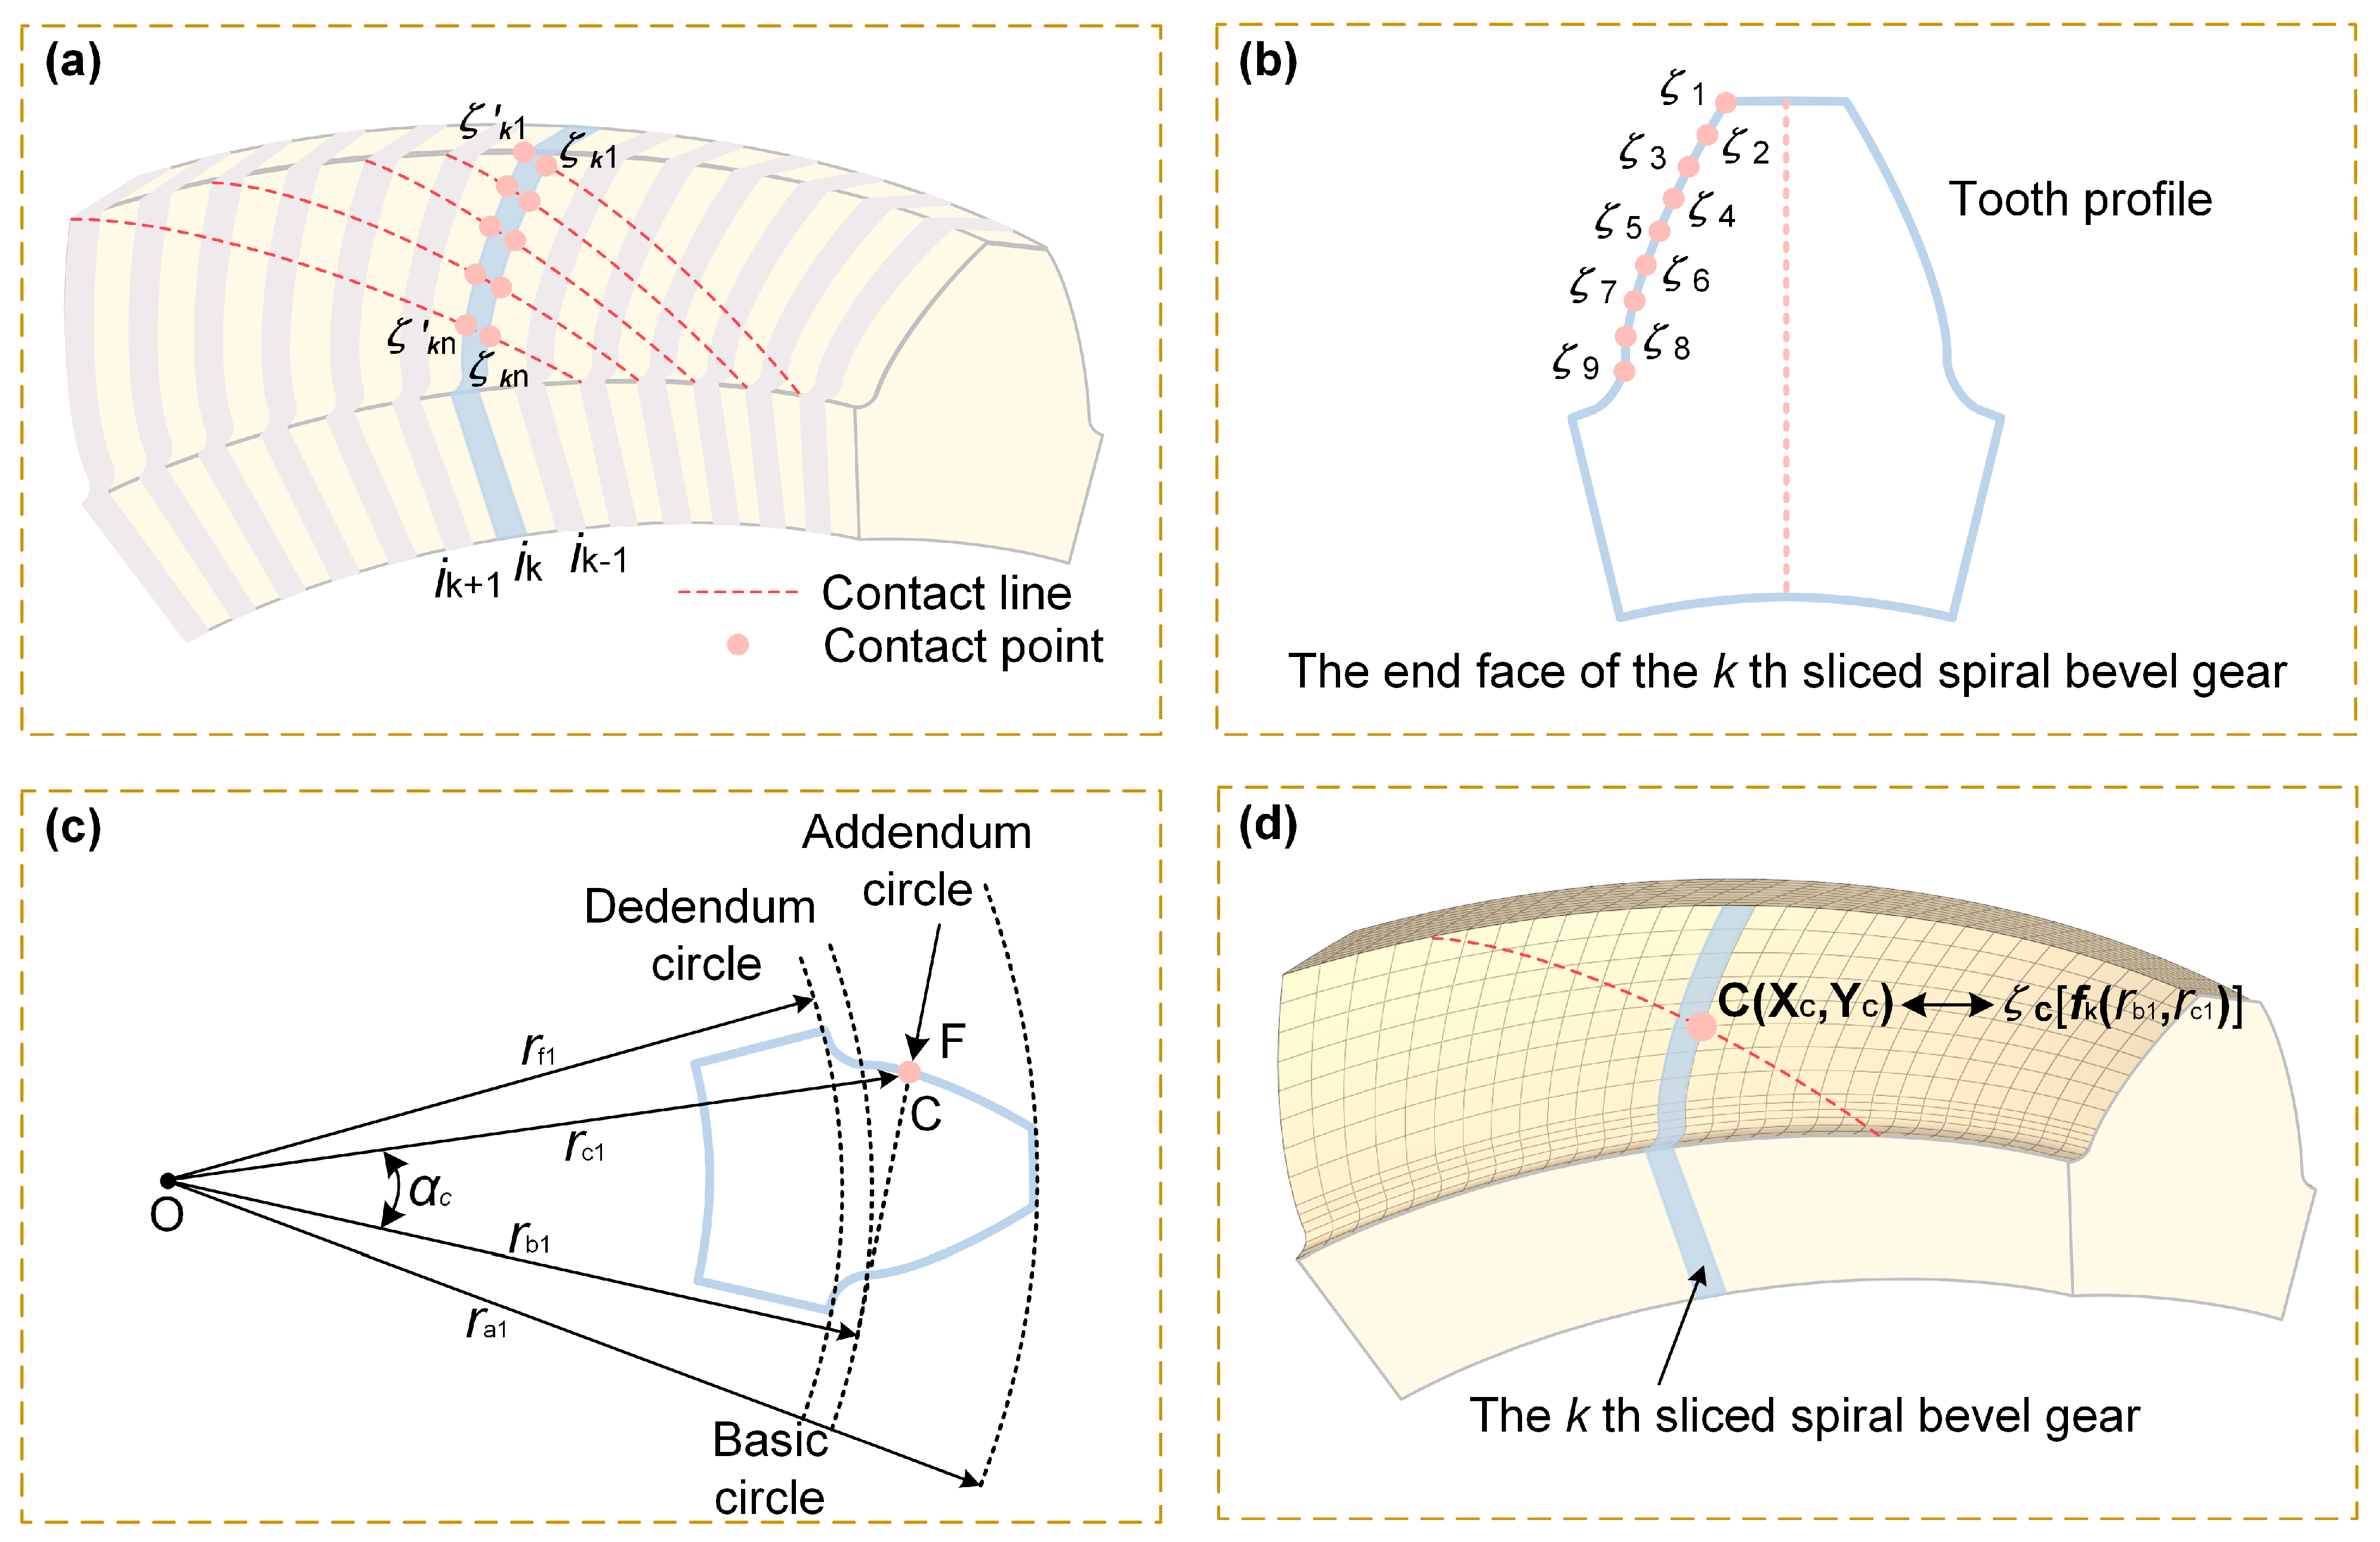
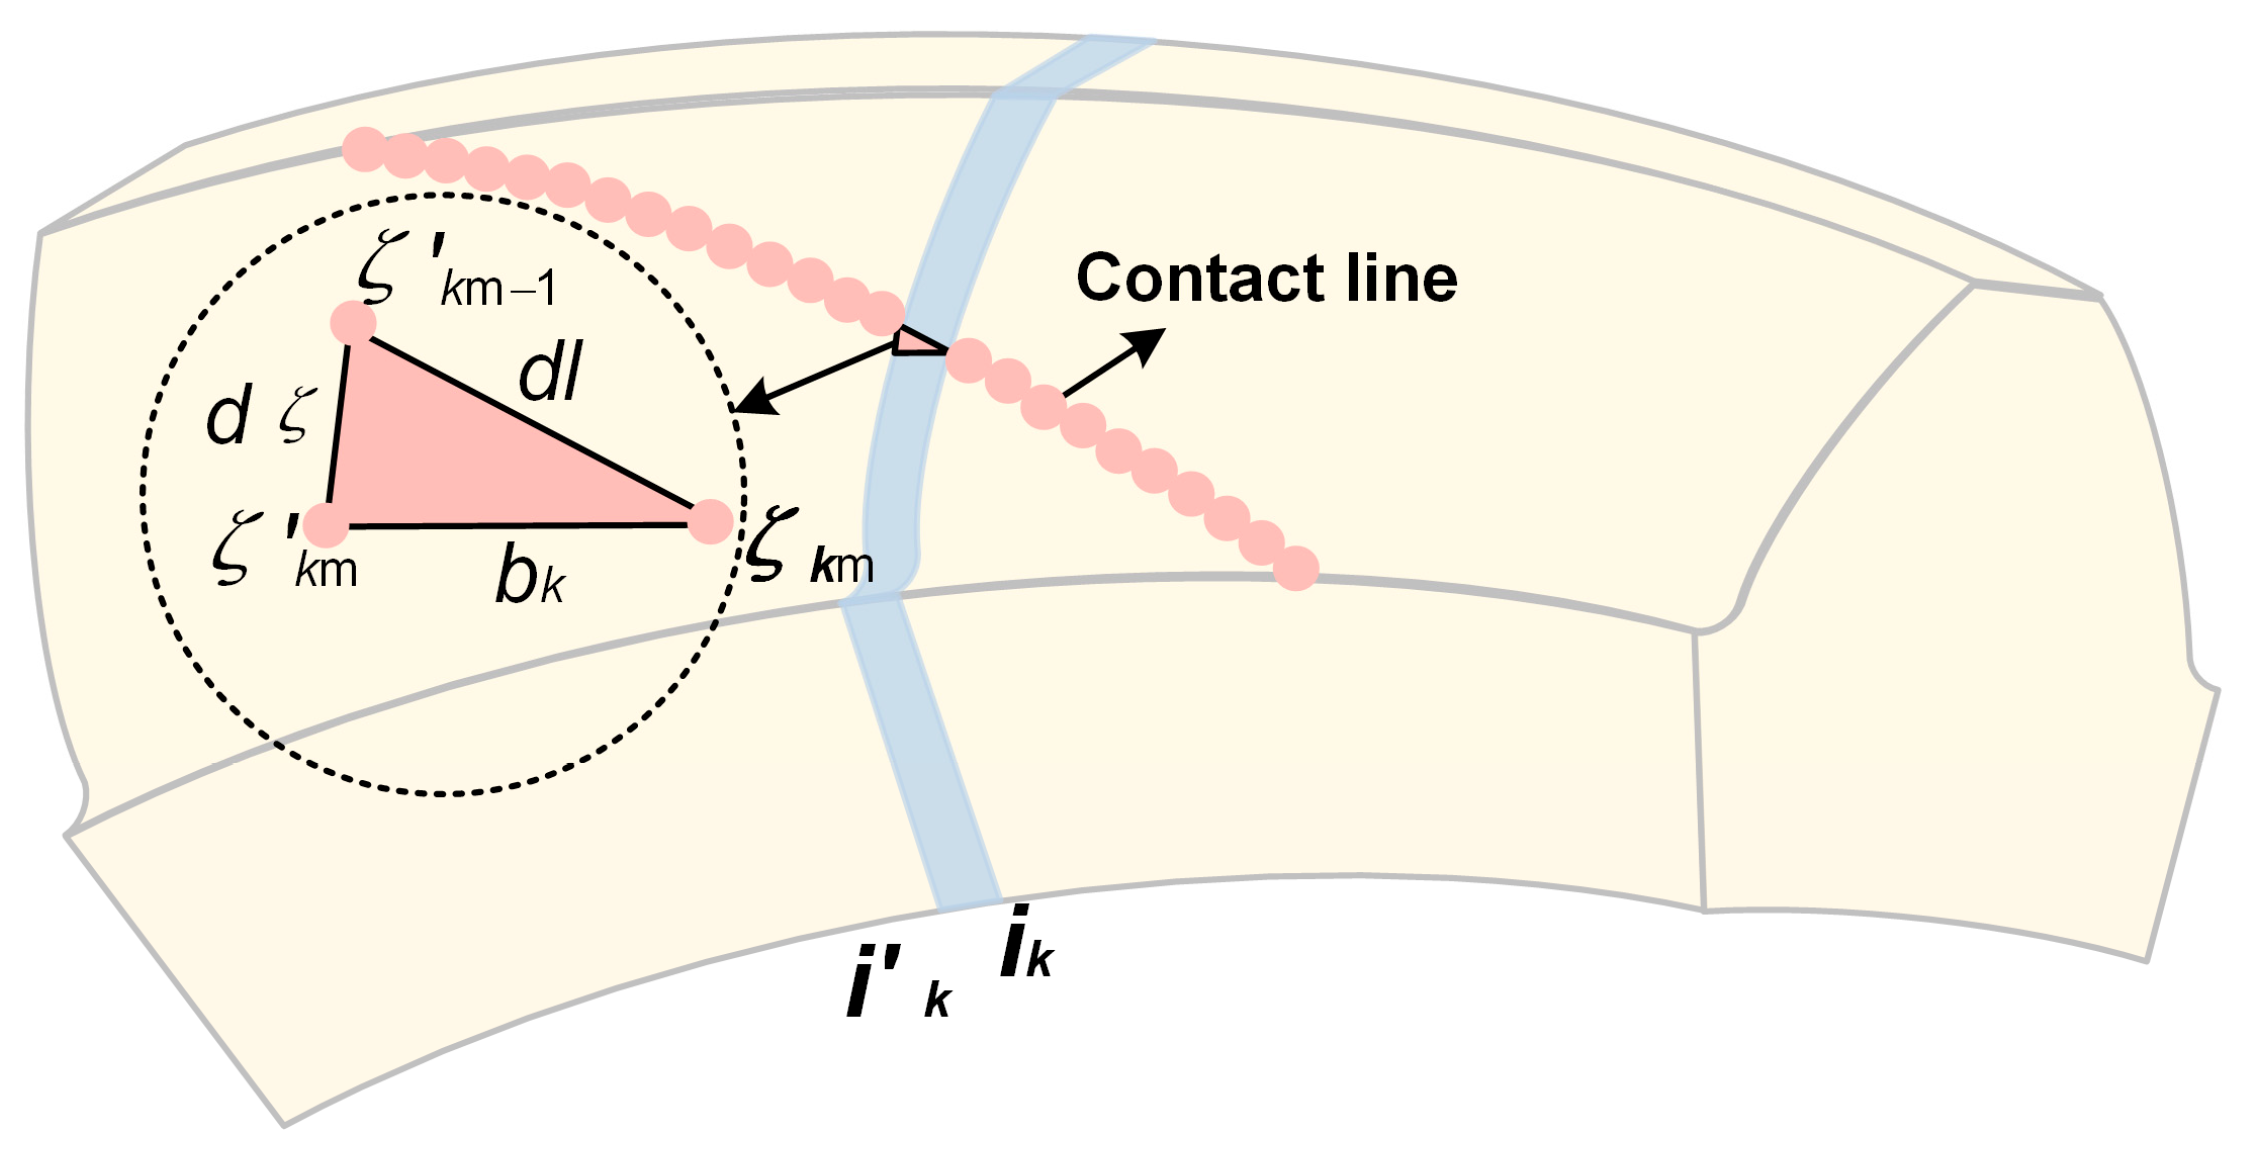
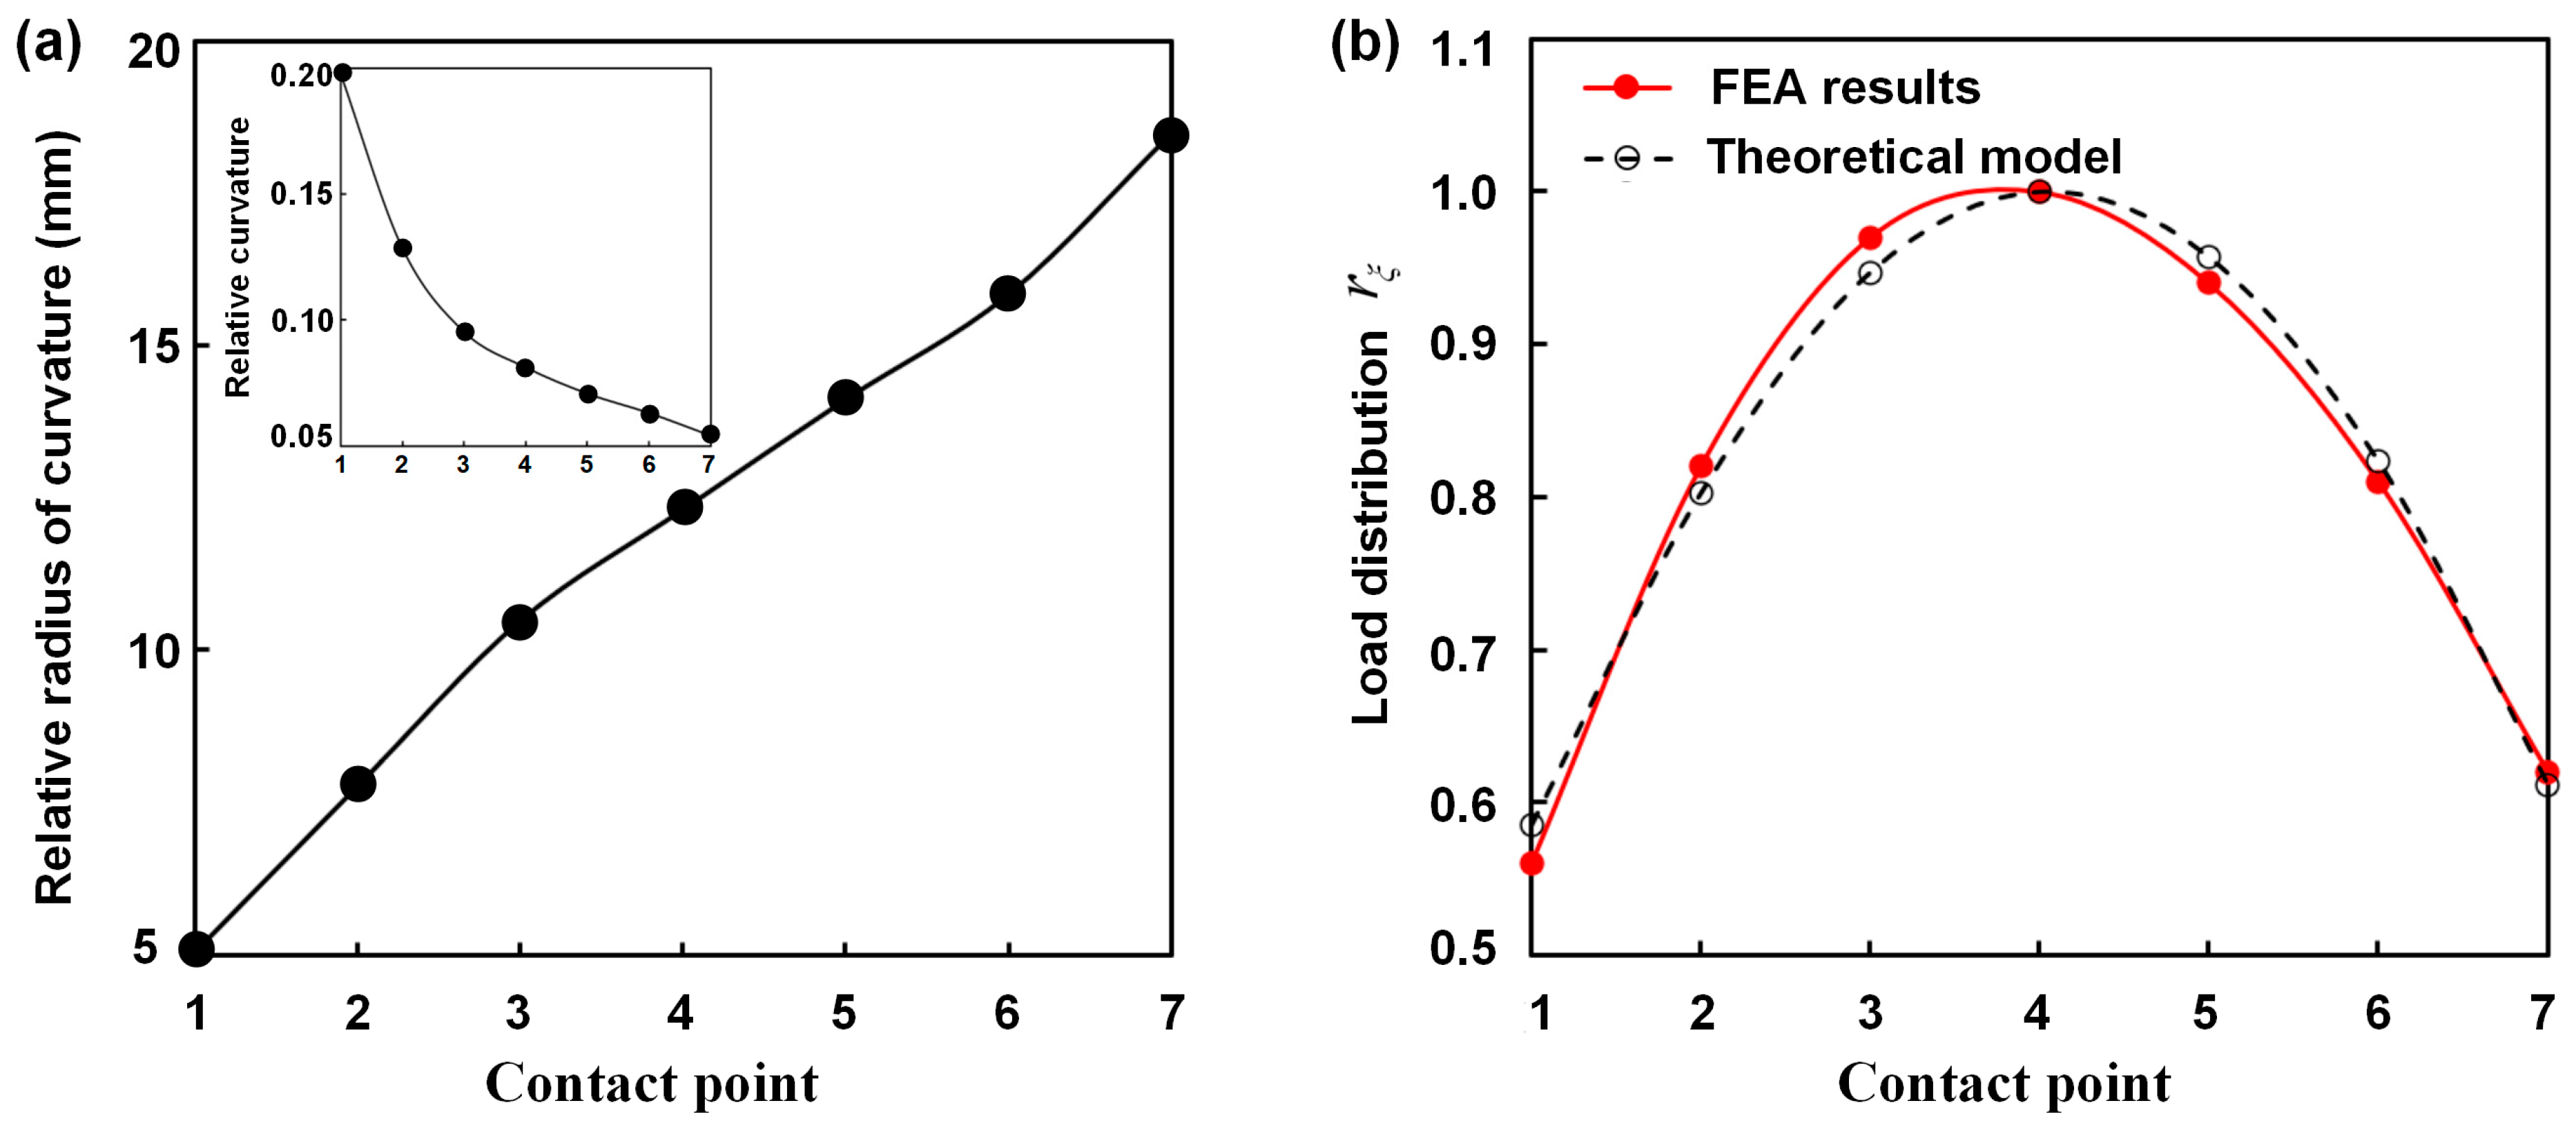
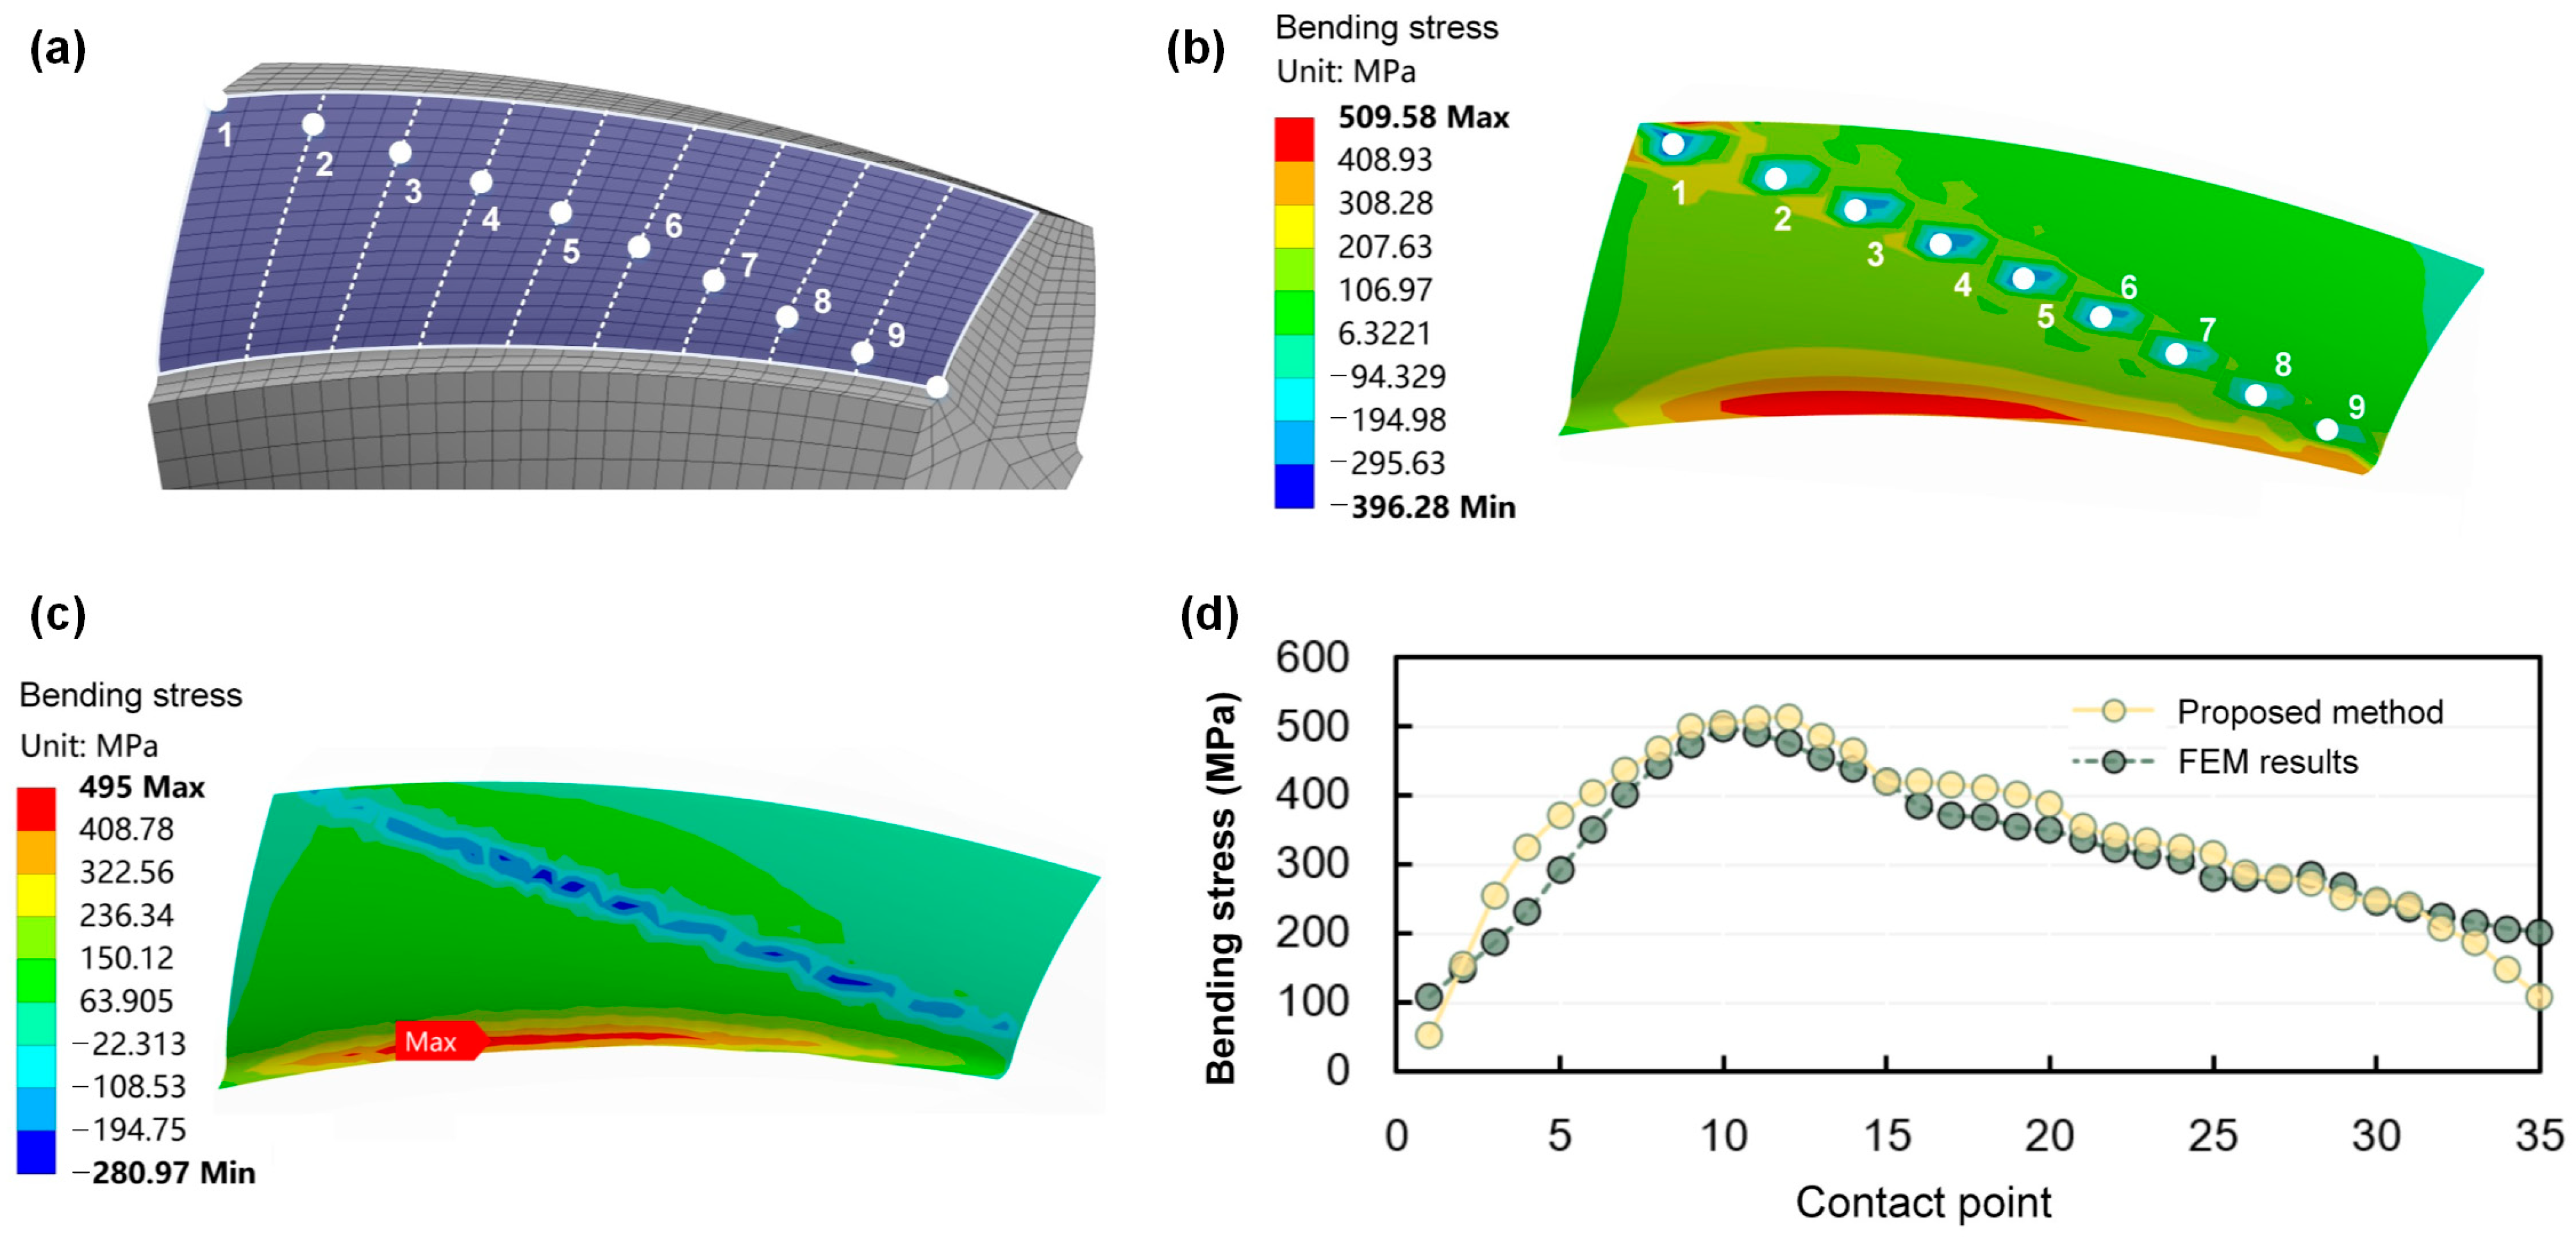
3.2. Calculation of Line Load Distribution on Contact Line

The load distribution calculation is based on the condition that the total angular position variation of the gear teeth being instantaneously in contact under load must be the same. This section employs the slice method to discretize a line contact spiral bevel gear into an integrated assembly of multiple “micro-segment helical gears” (each slice of the spiral bevel gear is approximated as a helical gear). Pedrero [25] employed the slicing method to calculate the line load distribution on the tooth flank of involute cylindrical spur and helical gear pairs. However, unlike involute cylindrical spur and helical gears, spiral bevel gears with tapered teeth exhibit geometric parameters that vary continuously from the toe to the heel, particularly in terms of the spiral angle and tooth height. By adapting the line contact load distribution model for involute cylindrical helical gears proposed by Pedrero, the line contact load distribution (expressed in N/mm of contact line length) on the tooth surface along the meshing line is derived.
According to elastic mechanics, the elastic potential energy U of the gear pairs can be expressed as the sum of the contact potential energy Uc, the bending potential energy Ub, the compression potential energy Ux, and shear potential energy Us, with the following expression:
U = U c + U b + U x + U s
The elastic potential energy components of the gear pair can be derived from elasticity theory and gear geometry parameters. For a helical cylindrical gear pair, the total elastic energy U is expressed as a function of unit energy u:
U = i n F i 2 b u = 1 b i n F i 2 u
where Fi is the normal load on the end face of the ith tooth pair, b is the tooth width (mm), and n is the number of simultaneously meshing tooth pairs.
The principle of minimum potential energy states that, among all possible displacement fields, the actual field minimizes the total potential energy functional. By applying the variational method to Equation (7), the relationship between the unit potential energy u and the load Fi can be obtained when the total elastic potential energy U reaches its minimum:
F i = 1 u i i 1 u i F = v i i v i F
where vi denotes the reciprocal of unit energy ui, and F is the total load on the gear pair.
As illustrated in Figure 13a, the tooth is evenly divided into n thin slices along the face width using the slicing method. Each slice in the spiral bevel gear can be regarded as a micro helical gear segment with different end-face parameters. The unit strain energy per unit face width, u, is a function of the tooth profile parameter ξ at the end-face contact point. However, unlike involute cylindrical helical gears, the spiral bevel gear exhibits varying geometric parameters at different cross-sections due to its tapered tooth structure. To simplify the calculation, the contact points on the end faces of the micro helical gears are evenly distributed, as shown in Figure 13b.
The tooth profile parameter ξC at the contact point C is defined as the ratio of the radius rc1 of curvature at the contact point to the base pitch circle radius. Its expression is given by:
ξ C = z 1 2 π r c 1 2 r b 1 2 1
where z1 is the number of teeth, and rb1 is the base radius.
After obtaining the tooth profile parameter ξ corresponding to the meshing point on the end face of each micro helical gear segment using Equation (9), the load dFk borne by the kth helical gear slice is calculated by Equation (10) [25]:
d F k = f k d l = v k v j j F k
where fk is the load per unit length; dl is the distance between two adjacent contact points along the contact line; vj and vk are the reciprocals of the elastic strain energy u at the contact points on the jth and kth micro helical gear segments, respectively; and Fk is the load on the contact line.
The load per unit length fk is calculated by the Equation (11):
f k = ε β k cos β b k b k v k L c v d ξ F k
where εβk is the overlap ratio, βbk is the base circle helix angle, and bk is the tooth width of the kth micro-segment helical gear. vk is a function of the reciprocal of the elastic potential energy at the contact point k on the contact line. LC is the length of the contact line the kth slice. dξ is the distance between two slices along the tooth height direction, as illustrated in Figure 14.
The Equation (12) provides the calculation formula for vk:
v k = cos 1 2 1 + ε α 2 2 1 1 / 2 ξ ε α 2
where εα denotes the transverse contact ratio of the corresponding sliced gear segment.
Unlike cylindrical helical gears, each sliced segment of the spiral bevel gear exhibits distinct values of overlap ratio εβk and base circle helix angle βbk. Based on these, the line contact load distribution rξk on the tooth surface is derived as follows:
r ξ k = d F k F = ε β k cos β b k v k b L c v d ξ
By changing the pinion rotation angle φ, the positions of three contact lines distributed on the tooth surface are obtained respectively for the toe, tooth middle, and heel, as shown in Figure 15.
According to Equations (11)–(13), the line load distribution results on the contact lines lr, lm, and lt of the gear in Figure 15 are obtained respectively, as shown in Figure 16. The data show that the fitting curves of the load distribution results of gear pairs are approximately similar to the convex upward part of the sine function.

3.3. Verification of Finite Element Simulation

The following uses finite element simulation to verify the above theoretical load distribution results. Following the FEA procedure outlined in Section 2.2, the tooth surface contact stress analysis results corresponding to the three contact lines in Figure 15 are obtained, as shown in Figure 17a. Additionally, the tooth surface contact stress values at each contact point from the addendum to the root along each meshing line are extracted, with the results shown in Figure 17b.
Equation (14) is the calculation formula for the maximum Hertz contact stress between two cylinders, where P represents the applied force and L represents the cylinder length. P/L is approximated as the corresponding line load f at the meshing point, and ρ is the relative curvature radius between the two cylinders.
σ H = Z E P L ρ = Z E f ρ
According to Equations (15) and (16), the line load fk per unit length corresponding to a certain meshing point K on the contact line is calculated as:
f k = σ H K Z E 2 ρ Σ
ρ Σ = ρ 1 ( ξ K ) ρ 2 ( ξ K ) ρ 1 ( ξ K ) + ρ 2 ( ξ K )
where ZE is the elastic coefficient, σHK is the contact stress at the meshing point K, ρΣ is the relative curvature radius at the meshing point K, and ρ1(ξk) and ρ2(ξk) are the radii of curvature on the pinion and gear at the meshing point K, respectively, which are calculated according to:
ρ i ( ξ K ) = r b i 2 π z i ξ K , i = 1 , 2
where rb1 and rb2 are the base circle radii of the pinion and the gear, respectively.
Based on Equations (15) and (16), the relative curvature radii of the contact points on the contact line lm on tooth flank 2 in Figure 17 were calculated, with results shown in Figure 18a. Additionally, the stress values at each contact point in Figure 17b were substituted into Equation (15) to calculate the line loads at different meshing points. These results were compared with those calculated in Figure 16b, yielding the analysis shown in Figure 18b. This validation confirmed the accuracy of the theoretical formulas.

4. Calculation Method for Tooth Root Bending Stress

Based on the cantilever beam model and combined with line contact load distribution characteristics on the tooth surface obtained in Section 3, a method for calculating the bending moment distribution of the tooth root critical section using zone-loading is proposed. Meanwhile, by reconsidering the geometric characteristics of the tooth root critical section, the calculation formula for tooth root bending stress of the gear pairs is derived.

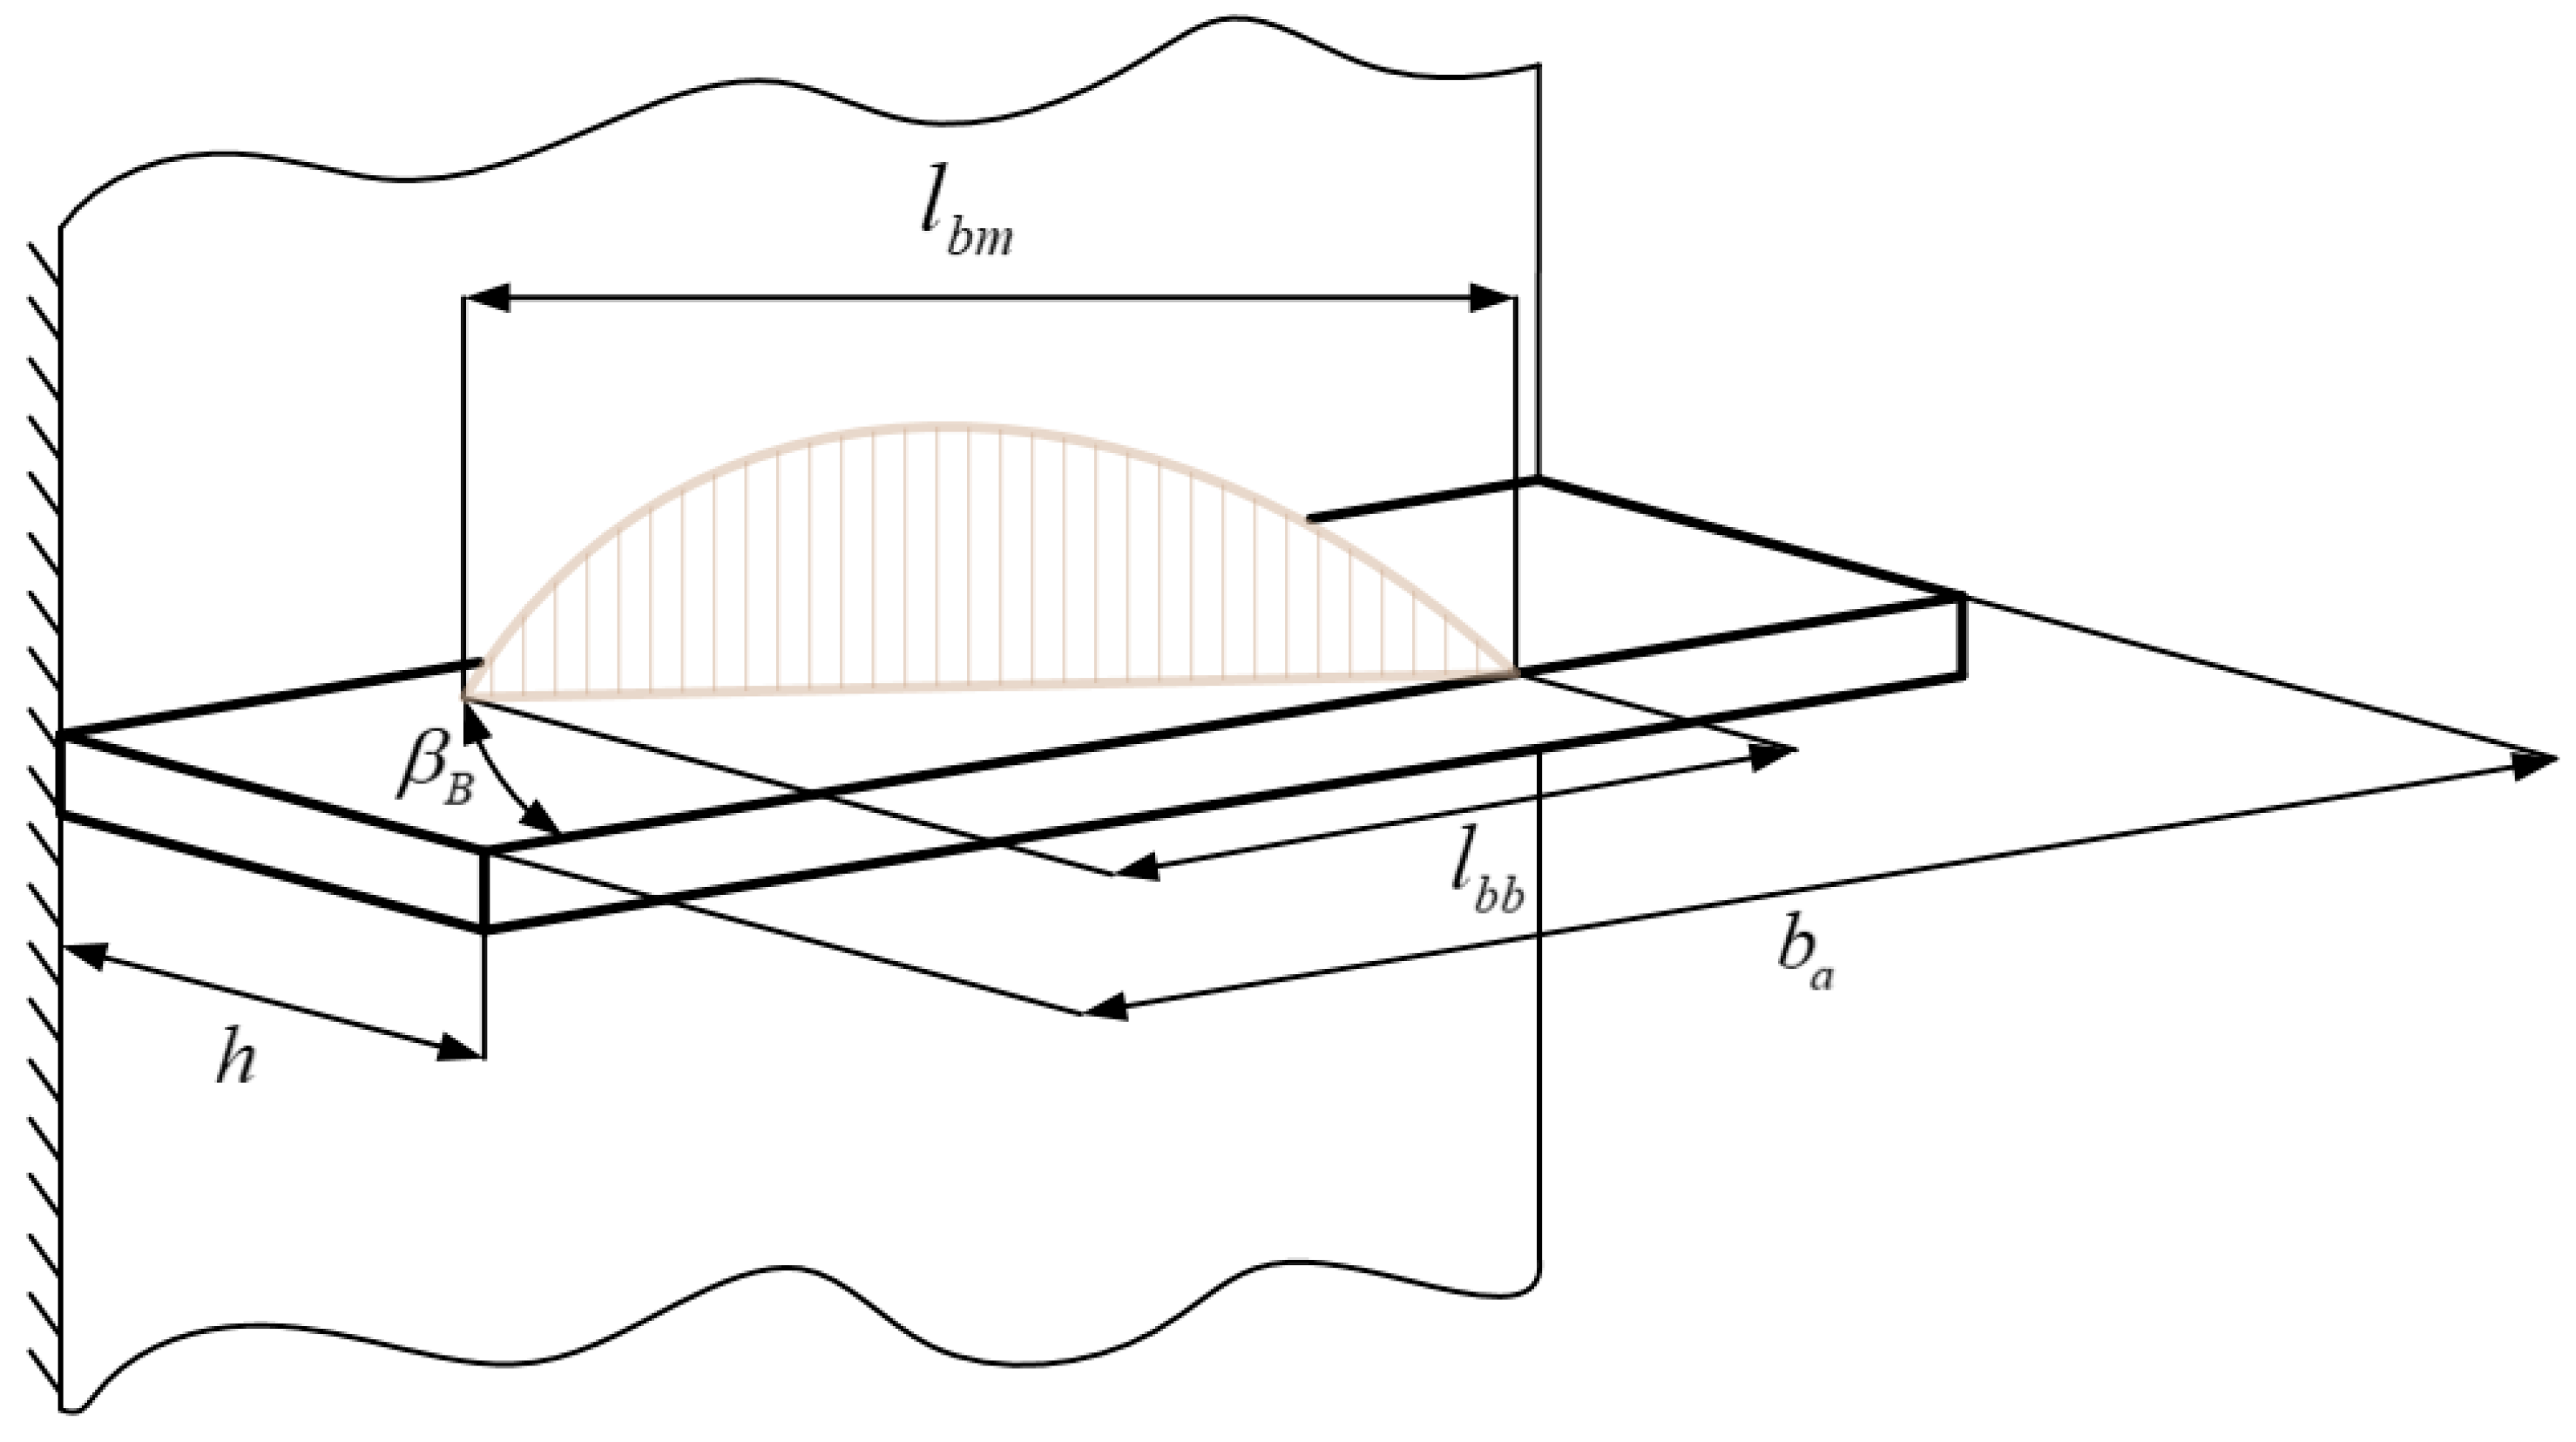
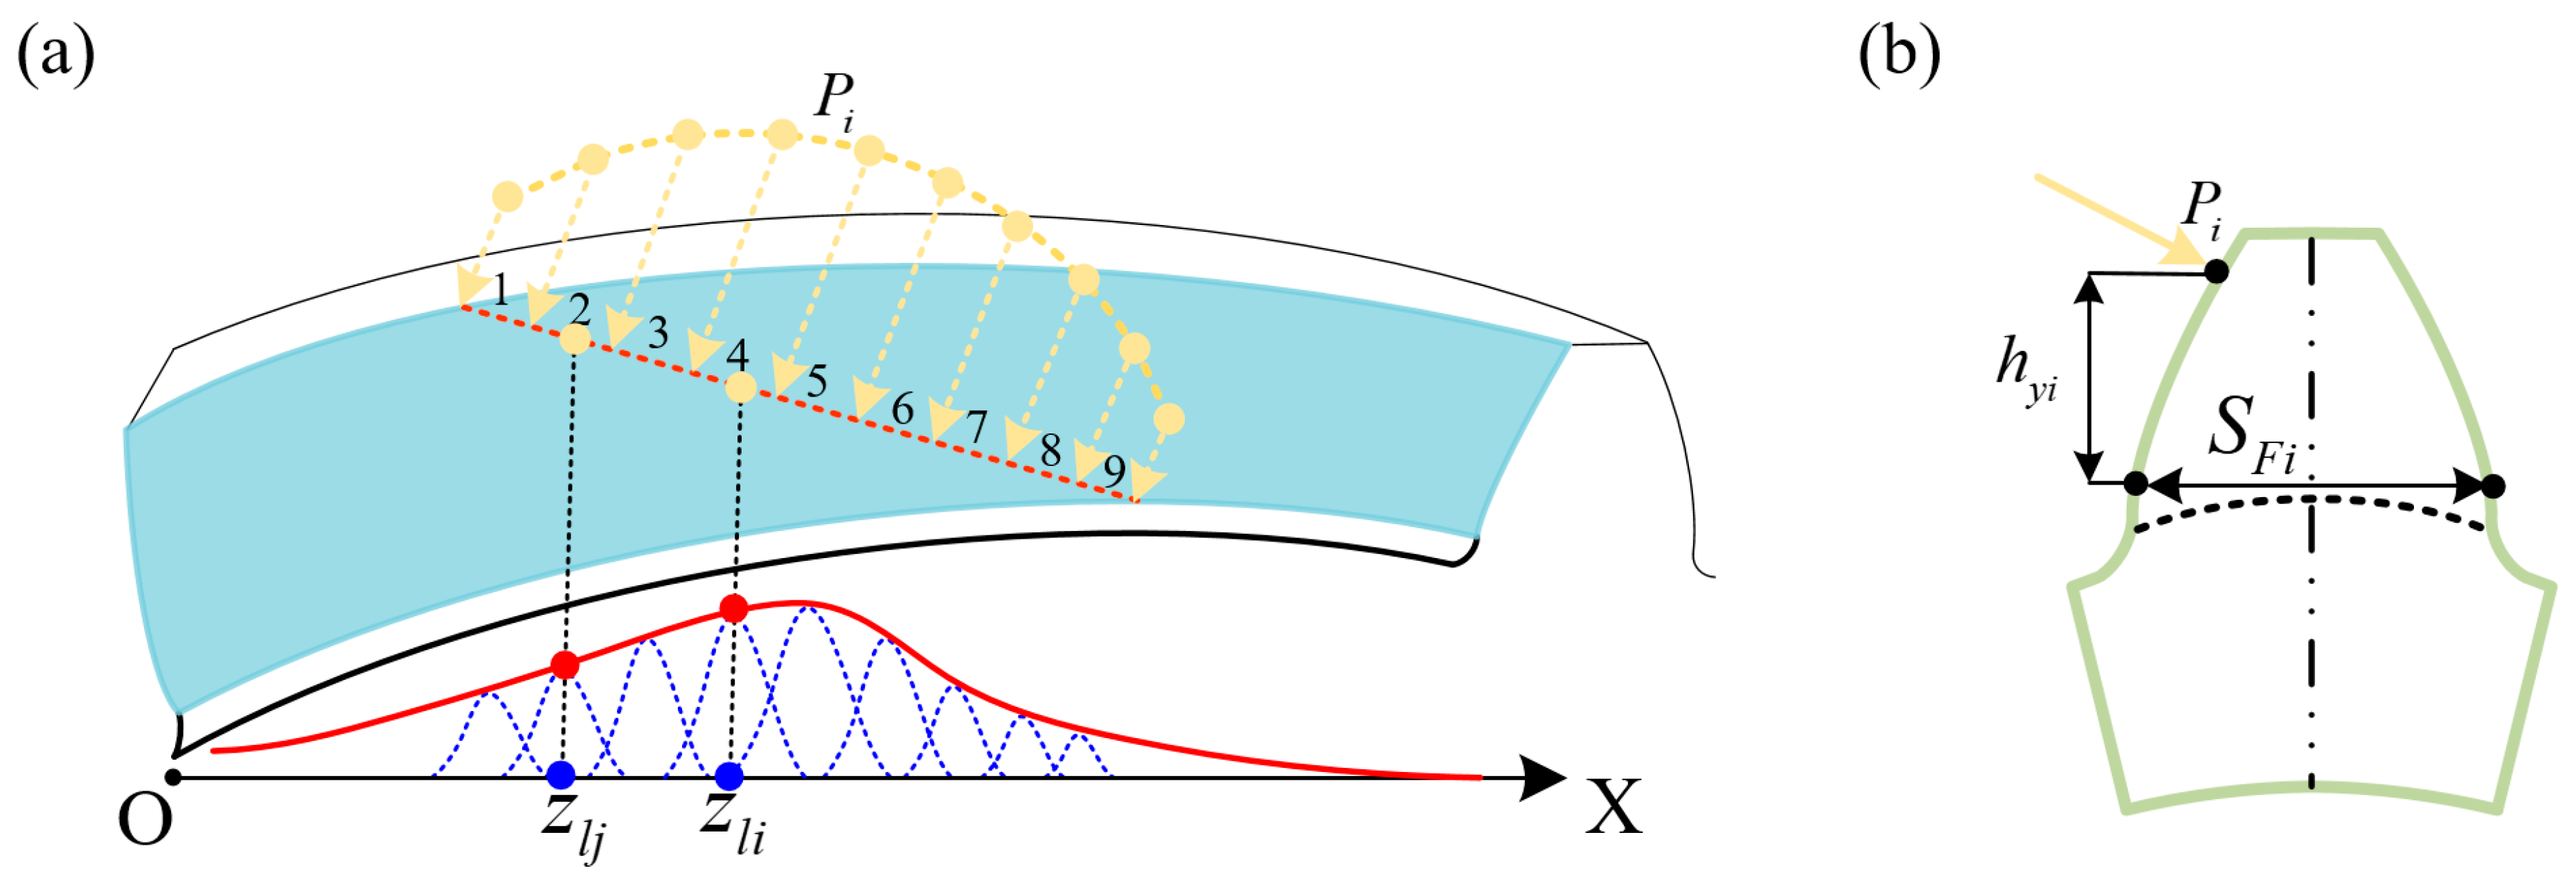
4.1. Bending Moment Distribution of the Tooth Root Critical Section

The calculation of tooth root bending stress is based on the beam bending stress calculation model. According to the cantilever beam model, Equation (18) is taken as the basic form for calculating the tooth root bending stress σF:
σ F = M i max I y
where Mimax represents the maximum bending moment at the critical section of the tooth root, I denotes the torsional constant of the tooth root critical section, and y is the farthest distance from the neutral axis on the cross-section.
The model for calculating bending stress based on the cantilever beam is shown in Figure 19.
When a line load acts on the tooth surface along the contact line, Figure 20a illustrates the calculation method for the bending moment distribution at the critical section of the tooth root. The distances from load points Pi to the critical section of the tooth root are shown in Figure 20b.
As stated in the references [38], the calculation formula for the bending moment distribution coefficient βi(zlj) generated by the force at the meshing point on the critical section of the tooth root is:
β i ( z l j ) = 1 ω a Φ z l j z l i h y i ω a ,   min ( z l j ) z l j max ( z l j ) 0   ,   other
where zli denotes the tooth width direction distance from the midpoint of the region to the heel of the pinion, and zlj is the tooth width direction distance from meshing point j to the end face. hyi is the tooth depth direction distance from the meshing point i to the critical section of the tooth root. ωa is the pressure angle shape influence coefficient, taken as 0.69 in this paper, and φ follows the standard normal distribution.
As shown in Figure 21, according to the full tooth surface load-carrying characteristics of such a gear drive, the tooth is uniformly divided into i regions along the tooth width direction from the heel to the toe (nine regions, as shown in the figure). The inclination angle of the contact line on the tooth surface is βB. The distance from the midpoint of each region to the critical section of the tooth root is hyi, with the corresponding load distribution coefficient being ri. The bending moment distribution of the load at each region on the critical tooth root section follows a normal distribution. Thus, the maximum bending moment Mmax generated by the line load at the critical tooth root section is calculated accordingly.
According to the basic geometric parameters of the gear pair given in Table 1, with a face width coefficient of 0.20, the maximum bending moment Mimax for each segment along the face width is calculated using Equation (20):
M i max = F n r i h y j
where Fn denotes the load by the gear; ri is the load distribution ratio of the contact line in each segment; and hyi is the distance from the midpoint of the contact line in each segment to the tooth root.
The load distribution ratio of the contact lines in Segments 1 to 9 of Figure 21 and the maximum bending moments generated by the load in each segment are listed in Table 3.
According to Equation (21), the bending moment distribution Mi along the tooth width for each segment is calculated as:
M i = M i max β i ( z l j )
The bending moment distribution along the tooth width at the tooth root critical section calculated by Equation (21) is shown in Figure 22.
The following verifies the results of the bending stress distribution along the tooth width obtained using the zoned loading method through FEA. Figure 23a shows the schematic diagram of FEM zoned loading, and Figure 23b presents the tooth root bending stress analysis results. Further meshing simulation analysis was conducted using the gear pair model, with results shown in Figure 23c. A comparison between the tooth root bending stress calculated by the zoned loading method and the FEA results of the gear pair is illustrated in Figure 23d. The comparative results validate the rationality of using the zoned loading method to calculate tooth root bending stress.

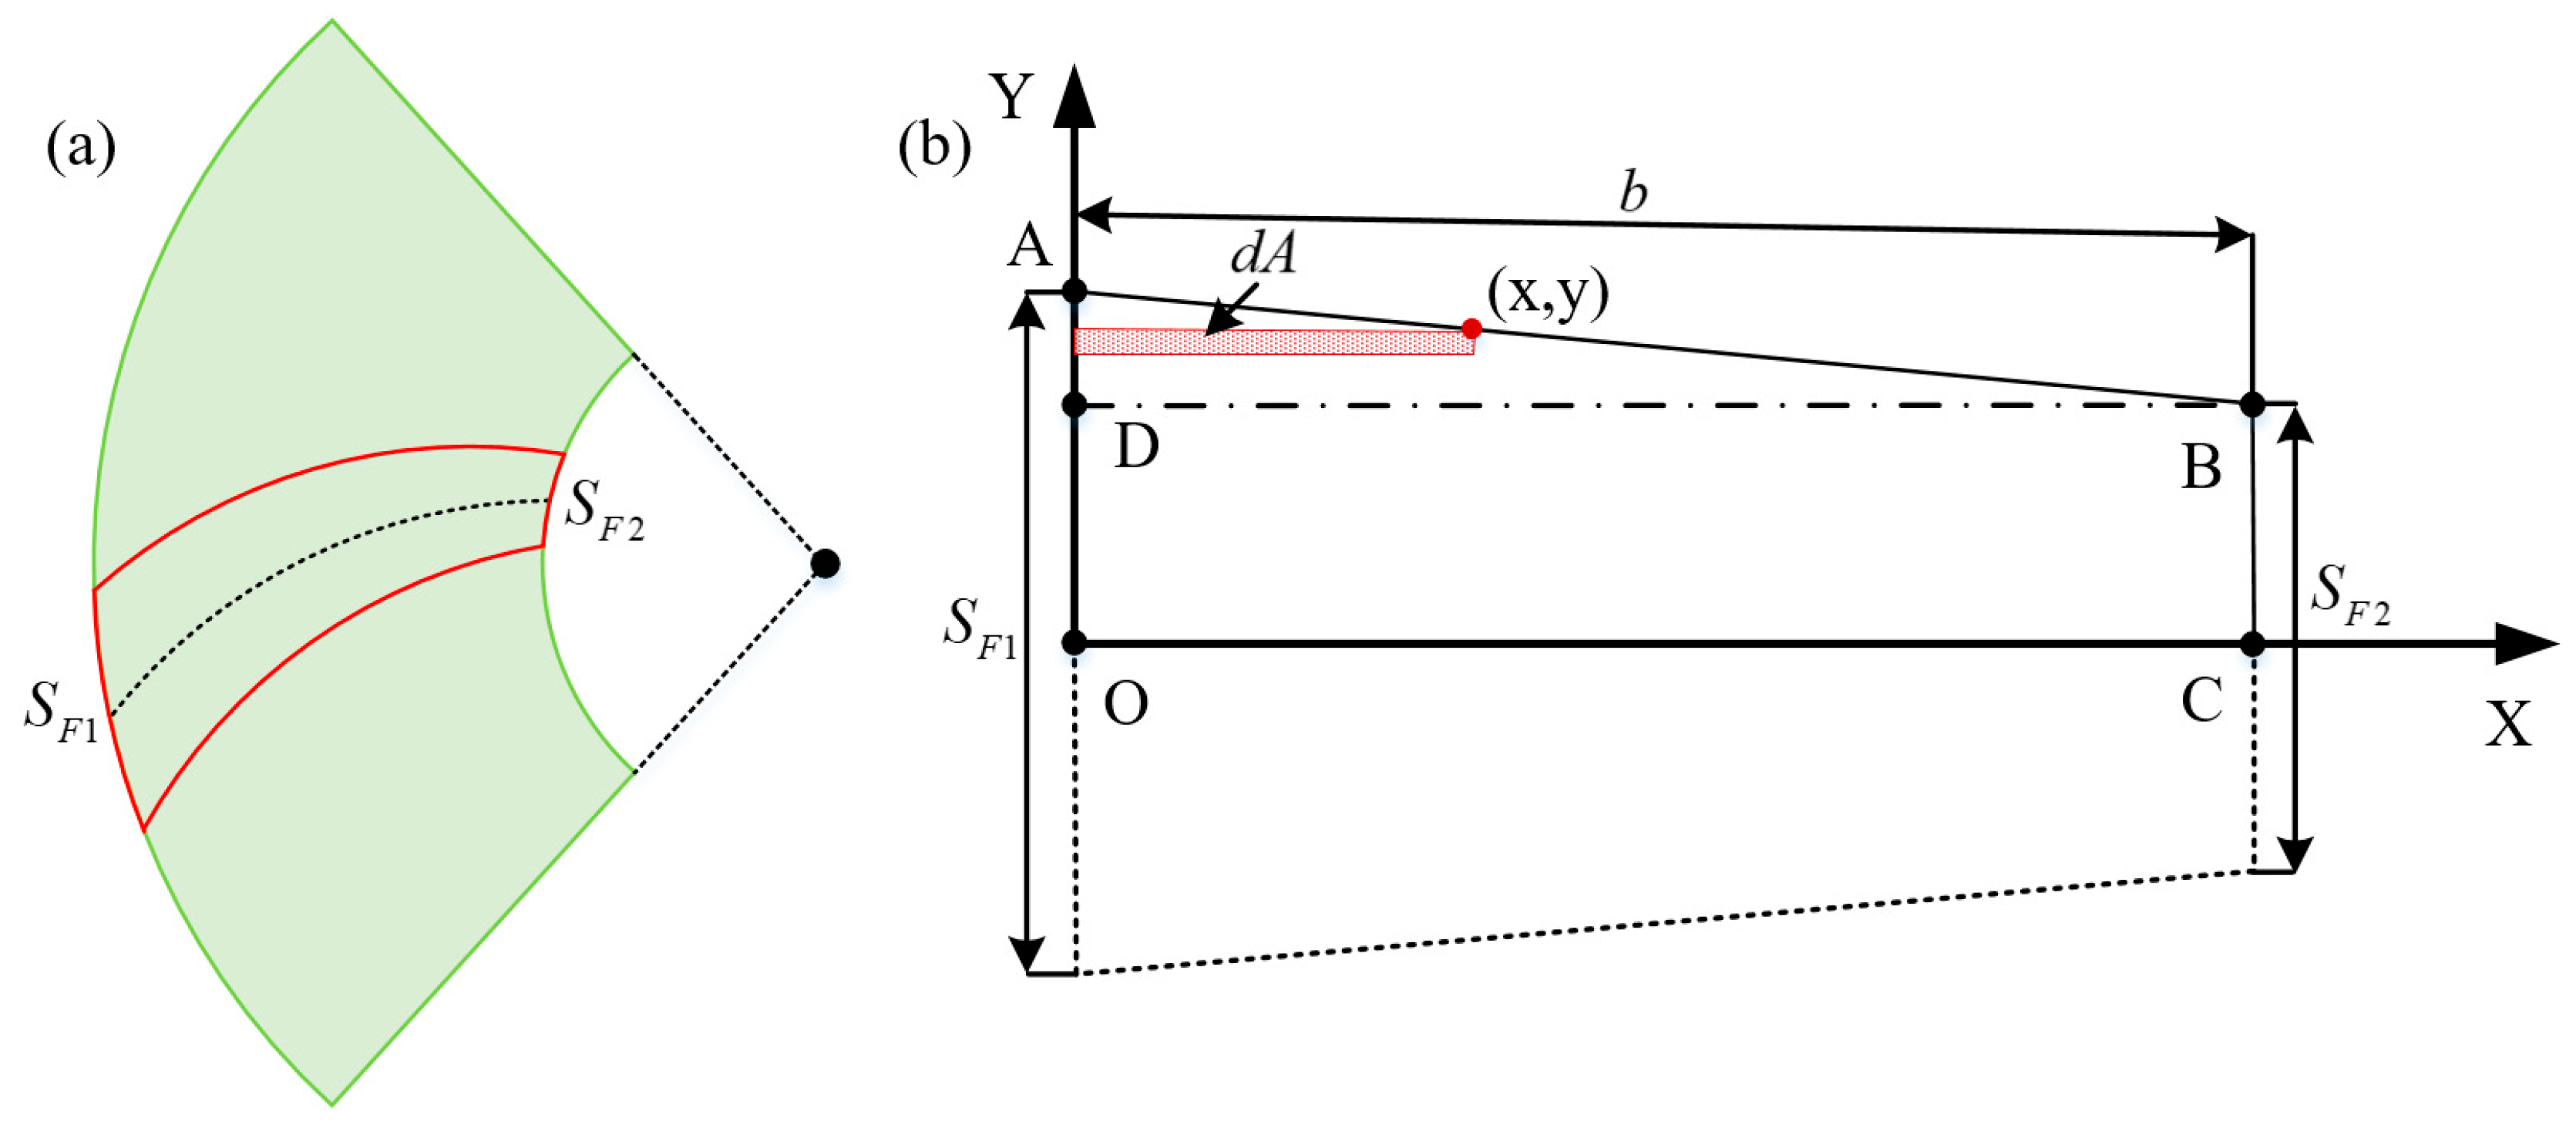
4.2. Calculation of Bending Moment of Inertia at the Critical Root Section

To facilitate calculation, traditional bending stress methods typically approximate the critical tooth root section as a rectangle. However, this simplification does not reflect the actual geometry of spiral bevel gear tooth roots, reducing accuracy. To better represent the geometric characteristics, the critical root section is approximated as a trapezoid in this study, as shown in Figure 24.
The bending moment of inertia of the trapezoidal section is calculated using Equation (22):
I = 2 ( I 1 + I 2 )
where I1 is the bending moment of inertia of rectangle ODBC, calculated by Equation (23), and I2 is that of triangle ABD, calculated by Equation (24):
I 1 = b S F 2 3 24
I 2 = S F 2 / 2 S F 1 / 2 b ( S F 1 2 y ) S F 1 S F 2 y 2 d y = b S F 1 3 S F 2 3 + S F 1 S F 2 ( S F 1 + S F 2 ) 96
where SF1 is the tooth thickness at the heel of the critical section, SF2 is the tooth thickness at the toe of the critical section, and b is the tooth width.

4.3. Derivation and Validation of the Calculation Formula

Substituting Equations (19)–(24) into Equation (18) yields the calculation formula for the root bending stress σF of the line contact spiral bevel gear as follows:
σ F = F n r i h y i β i ( z l j ) I y
where Fn is the gear tooth load on the contact line and ri is the load distribution ratio of the ith segment on the contact line. hyi is the distance from the ith meshing point to the gear root’s critical section along the tooth depth direction. βi(zlj) represents the bending moment distribution coefficient caused by the ith meshing point on the contact line, and y is the distance on the critical section furthest from the location of the neutral axis of the section.
Similarly, the method is compared with the existing ISO and AGMA standards for calculating the root bending stress of spiral bevel gears. The ISO and AGMA standards’ basic formulas for root bending stress are, respectively:
σ F I S O _ B 1 = F m t b m m n Y F a Y S a Y ε Y K Y L S
σ F A G M A = 2000 T 1 b d e 1 Y X m e t Y β Y J
where the conventional design of bevel gears and the usual use of alloy-steel-type material yields the following values: the stress correction factor YSa of 1.650, the tooth form factor YFa of 2.800, the contact ratio factor Yε of 0.625, the spiral bevel gear factor YK of 1.004, and the load distribution factor YLS of 0.945, the size factor YX of 0.5194, the lengthwise curvature factor Yβ of 1.0, and the geometry factor YJ of 0.2.
Finite element simulations were conducted to obtain the tooth root bending stresses under different torques: (a) 50 Nm, (b) 100 Nm, (c) 150 Nm, and (d) 200 Nm. The simulation results, illustrating the stress distributions corresponding to each torque level, are presented in Figure 25.
Figure 26 compares the gear tooth root bending stresses calculated using the method proposed in this study, the ISO and AGMA standards, and finite element simulations. The results show that the ISO and AGMA standards yield conservative stress values for line contact spiral bevel gears. In contrast, the method proposed here closely matches the finite element results, demonstrating higher calculation accuracy. Using the finite element results as a benchmark, the computational errors of ISO, AGMA, and the method proposed in this paper are listed in Table 4.
The root bending strength calculation methods provided by both ISO and AGMA standards are also based on the line contact assumption. However, the method proposed in this paper offers a more comprehensive consideration of the actual meshing characteristics of line contact gear pairs. Specifically, improvements have been made in the shape of the tooth contact area and the distribution function of the line load along the tooth flank. Moreover, both the ISO and AGMA standards assume that the geometry of the critical root section is rectangular, which does not accurately reflect the actual geometry of the critical section. The method proposed in this study addresses this discrepancy by introducing a modified critical section shape. These factors may lead to differences in the calculated results between the standards and the proposed method. In addition, the ISO and AGMA formulas for root bending stress involve numerous correction factors, which are derived from prior experimental data or theoretical analyses. Whether these correction factors can be directly applied to the equations proposed in this study requires further investigation. As shown in Figure 26, the results obtained by the FEM, ISO, and AGMA methods exhibit the same trend as those calculated using the proposed method, indicating that the root bending stress is proportional to the torque applied to the gear pair.

5. Static Tooth Root Bending Test

5.1. Principle of Root Bending Stress Test

A commonly used method for measuring the tooth root bending stress under static conditions involves attaching strain gauges to the critical cross-section on the tensile side of the tooth root. When the gear is subjected to load, the strain in the metal wire inside the strain gauge leads to a change in its electrical resistance. This change generates an electrical signal, which is then converted into the local stress value by a stress–strain analyzer.
The resistance strain gauge is a type of sensitive element used for strain measurement, typically consisting of a substrate, sensing grid, protective coating, and lead wires. The bonding quality of strain gauges directly affects the accuracy of experimental results. To ensure proper bonding, the tooth root area is first polished carefully with sandpaper. Then, the surface is cleaned with acetone or alcohol, taking care to wipe in a single direction. Next, adhesive is applied to the back of the strain gauge, which is quickly placed onto a pre-marked position. Firm pressure is applied to ensure proper adhesion. Due to the small module of the tested gear, a cotton swab is used to press the strain gauge along the tooth root circular arc, ensuring the internal structure of the gauge is not damaged. Five strain gauges are arranged along the face width direction. In order to lead the wire out smoothly and at the same time facilitate the paste of strain gauges, it is necessary to remove the gear on the side of the root of the tooth to be measured. The bonding positions of the strain gauges on the tested tooth root are shown in Figure 27. The gauges used are model 120-3AA (Shenzhen Sensor and Control Company Limited Fujian, Shenzhen, China), offering a measurement accuracy of 0.1 με.

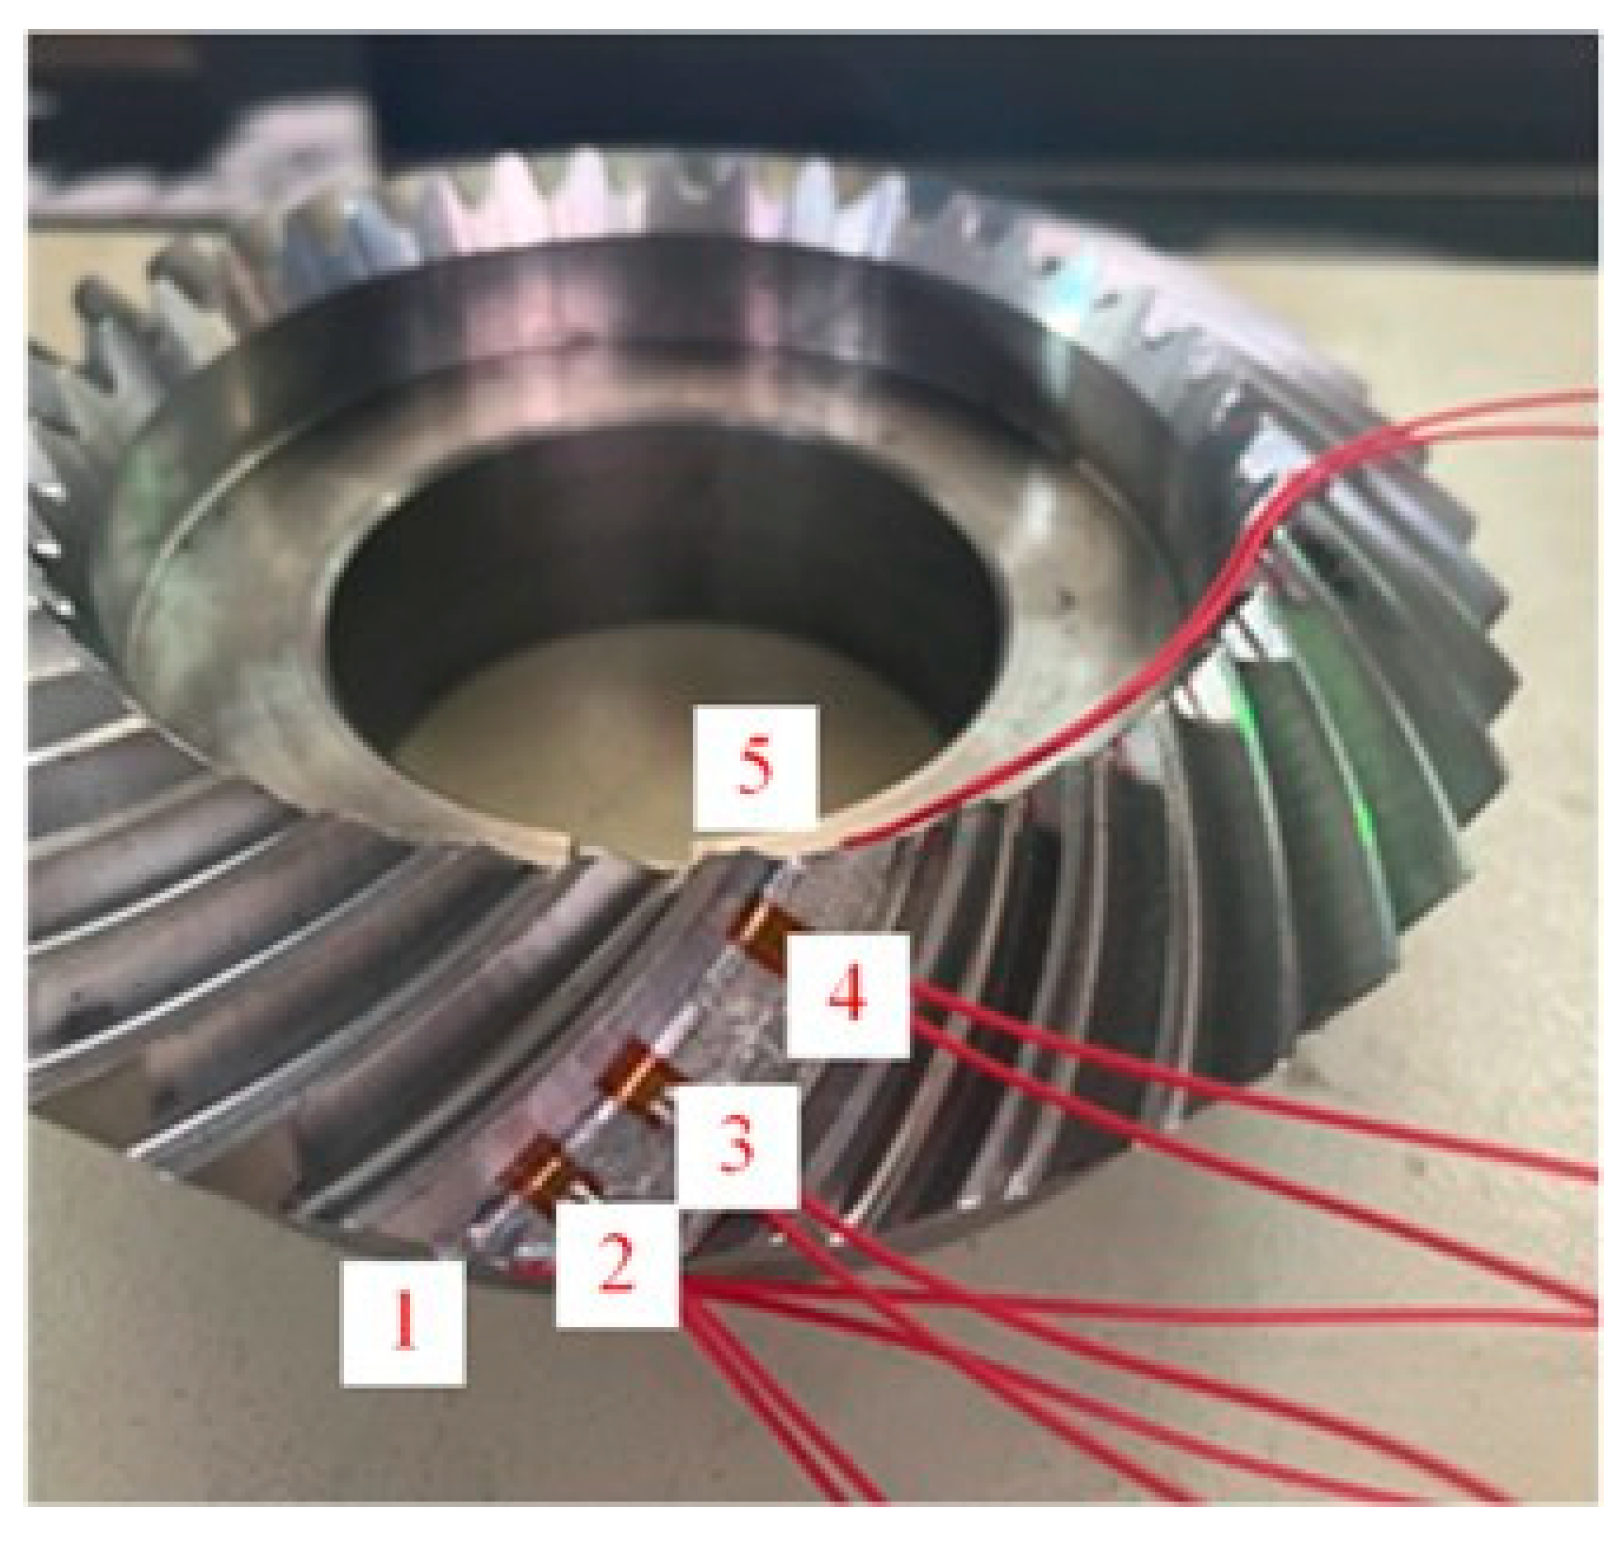
5.2. Test Bench Setup for Root Bending Stress Measurement

The test bench for conducting the tooth root bending stress test is shown in Figure 28. The test equipment primarily consists of a motor, a torque-speed sensor, a test gearbox, and a data acquisition instrument.
The specific models of the equipment used in the experiment are listed in Table 5.
The specific test procedure was as follows:
(1)
The gear with affixed strain gauges was installed in the gearbox, and strain gauge lead wire compression was avoided. Each gauge was checked with a multimeter to detect whether damage had occurred.
(2)
After assembling the motor, torque-speed sensor, and gearbox, the strain gauge resistance was remeasured. Then the strain gauge leads were connected to the data acquisition system.
(3)
To prevent signal interference caused by wire movement, all strain gauge leads were secured to the surface of the gearbox to minimize undesired vibration or displacement during testing.
(4)
The meshing position of the gear pair was adjusted to prevent the addendum from pressing against the strain gauge after fixing and holding the gear pairs in the specified mesh position.
(5)
The motor was started and the torque was set to zero, and an input torque of 50 Nm was applied. The zero point of the data acquisition system was calibrated and the sampling frequency was set to 40 Hz.
(6)
Strain and stress curves could be output simultaneously. To ensure stable signal acquisition under various loading conditions, the sampling duration was set to no less than 1 min.
(7)
The input torque of the motor was increased stepwise to 100 Nm, 150 Nm, and 200 Nm. The above procedures were repeated for each loading condition.

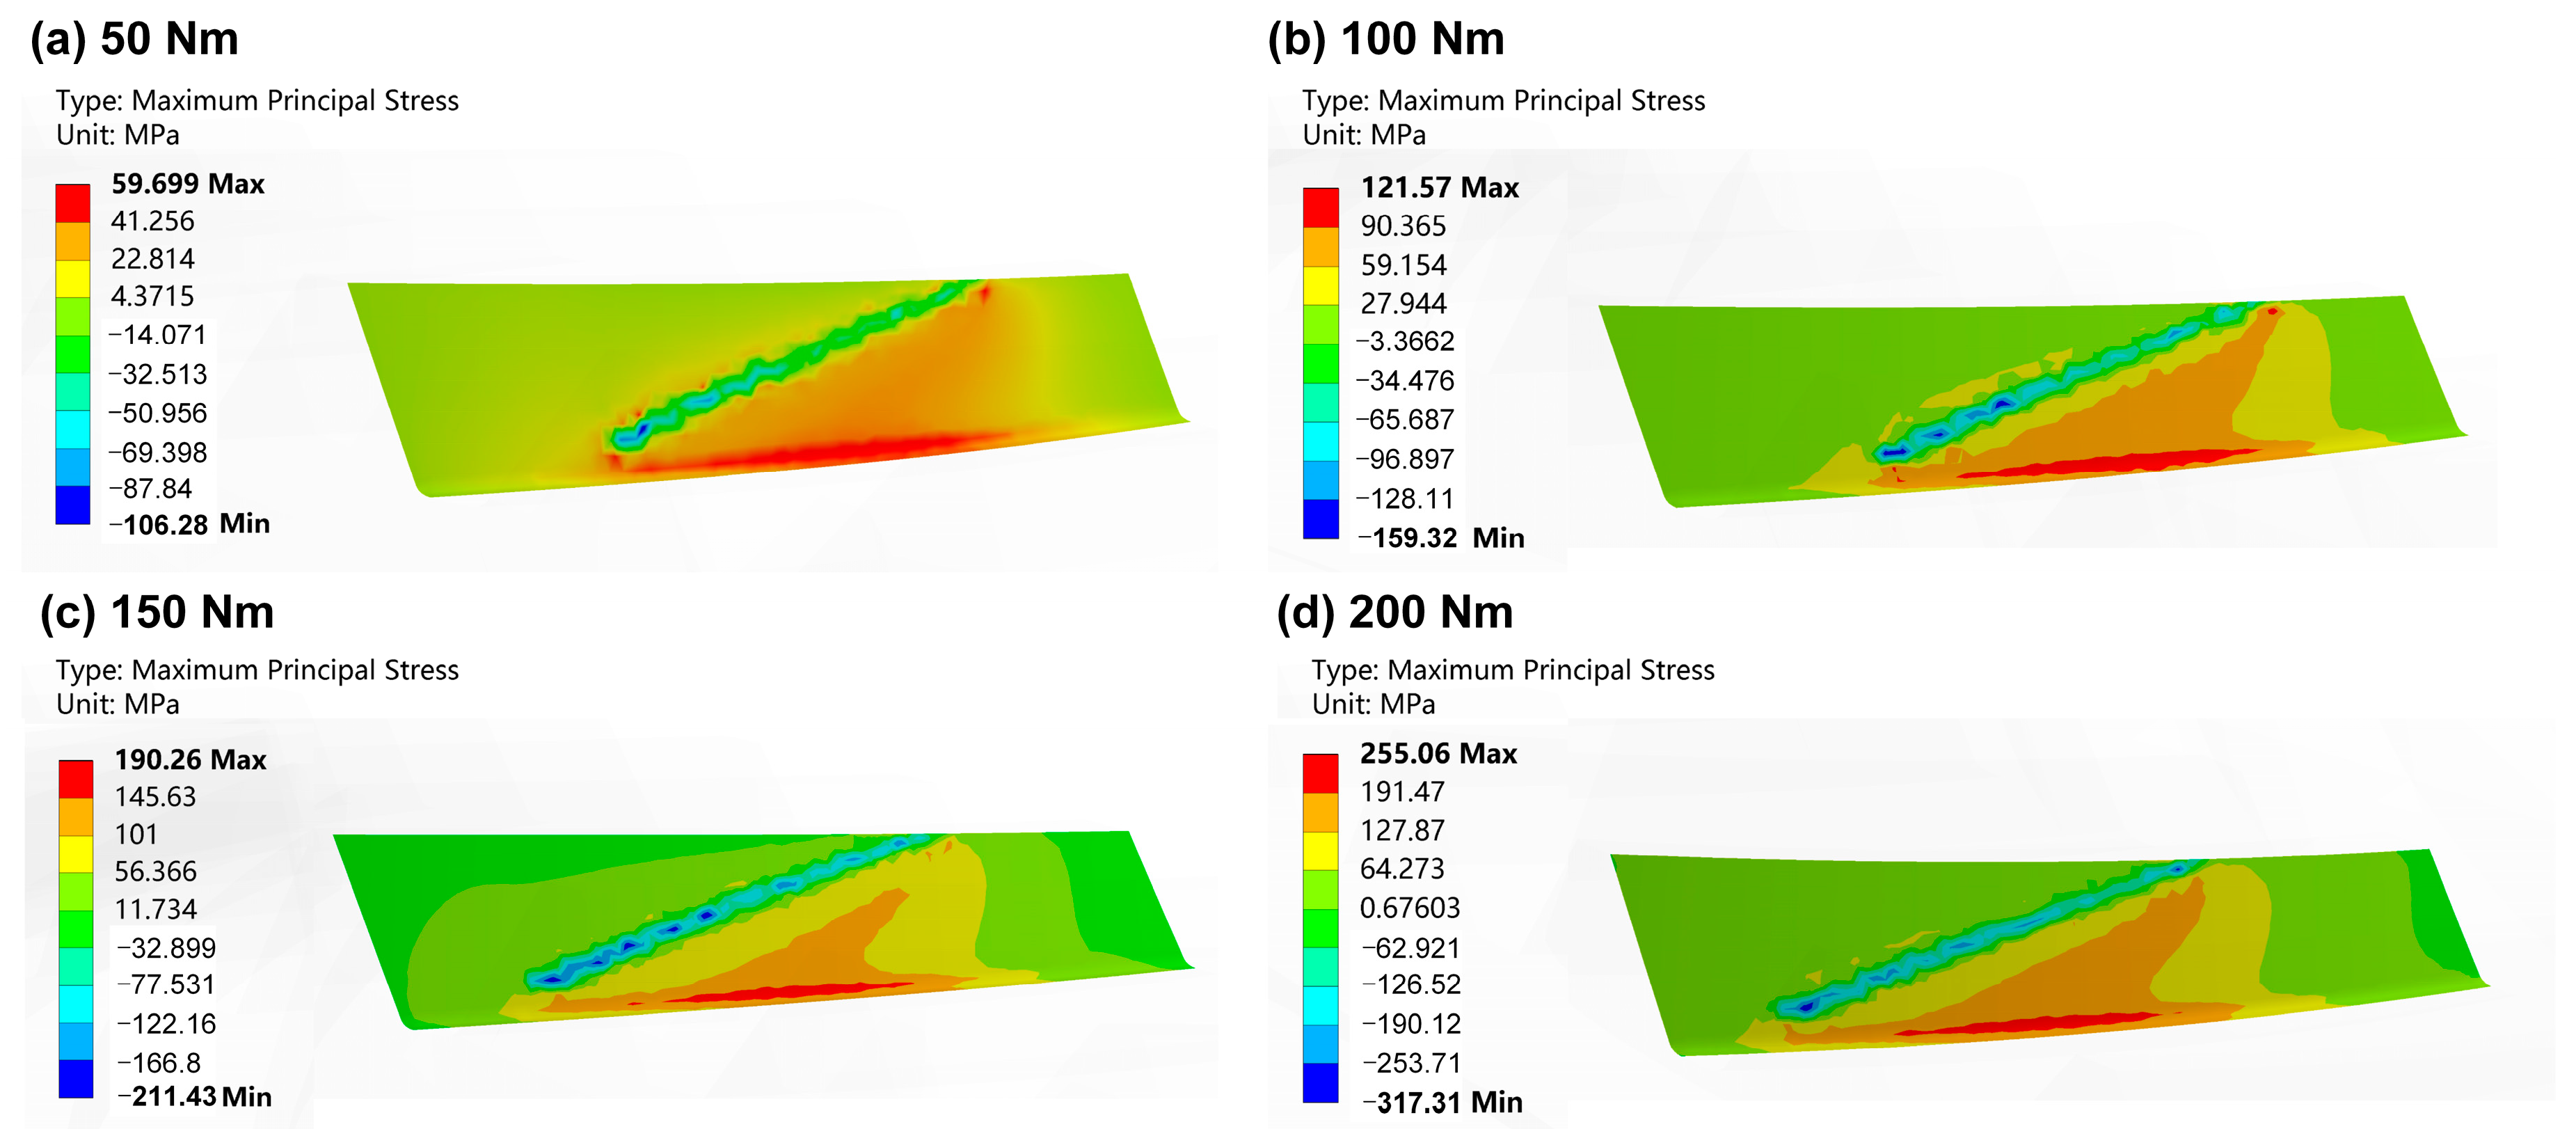
5.3. Results Analysis and Simulation Validation

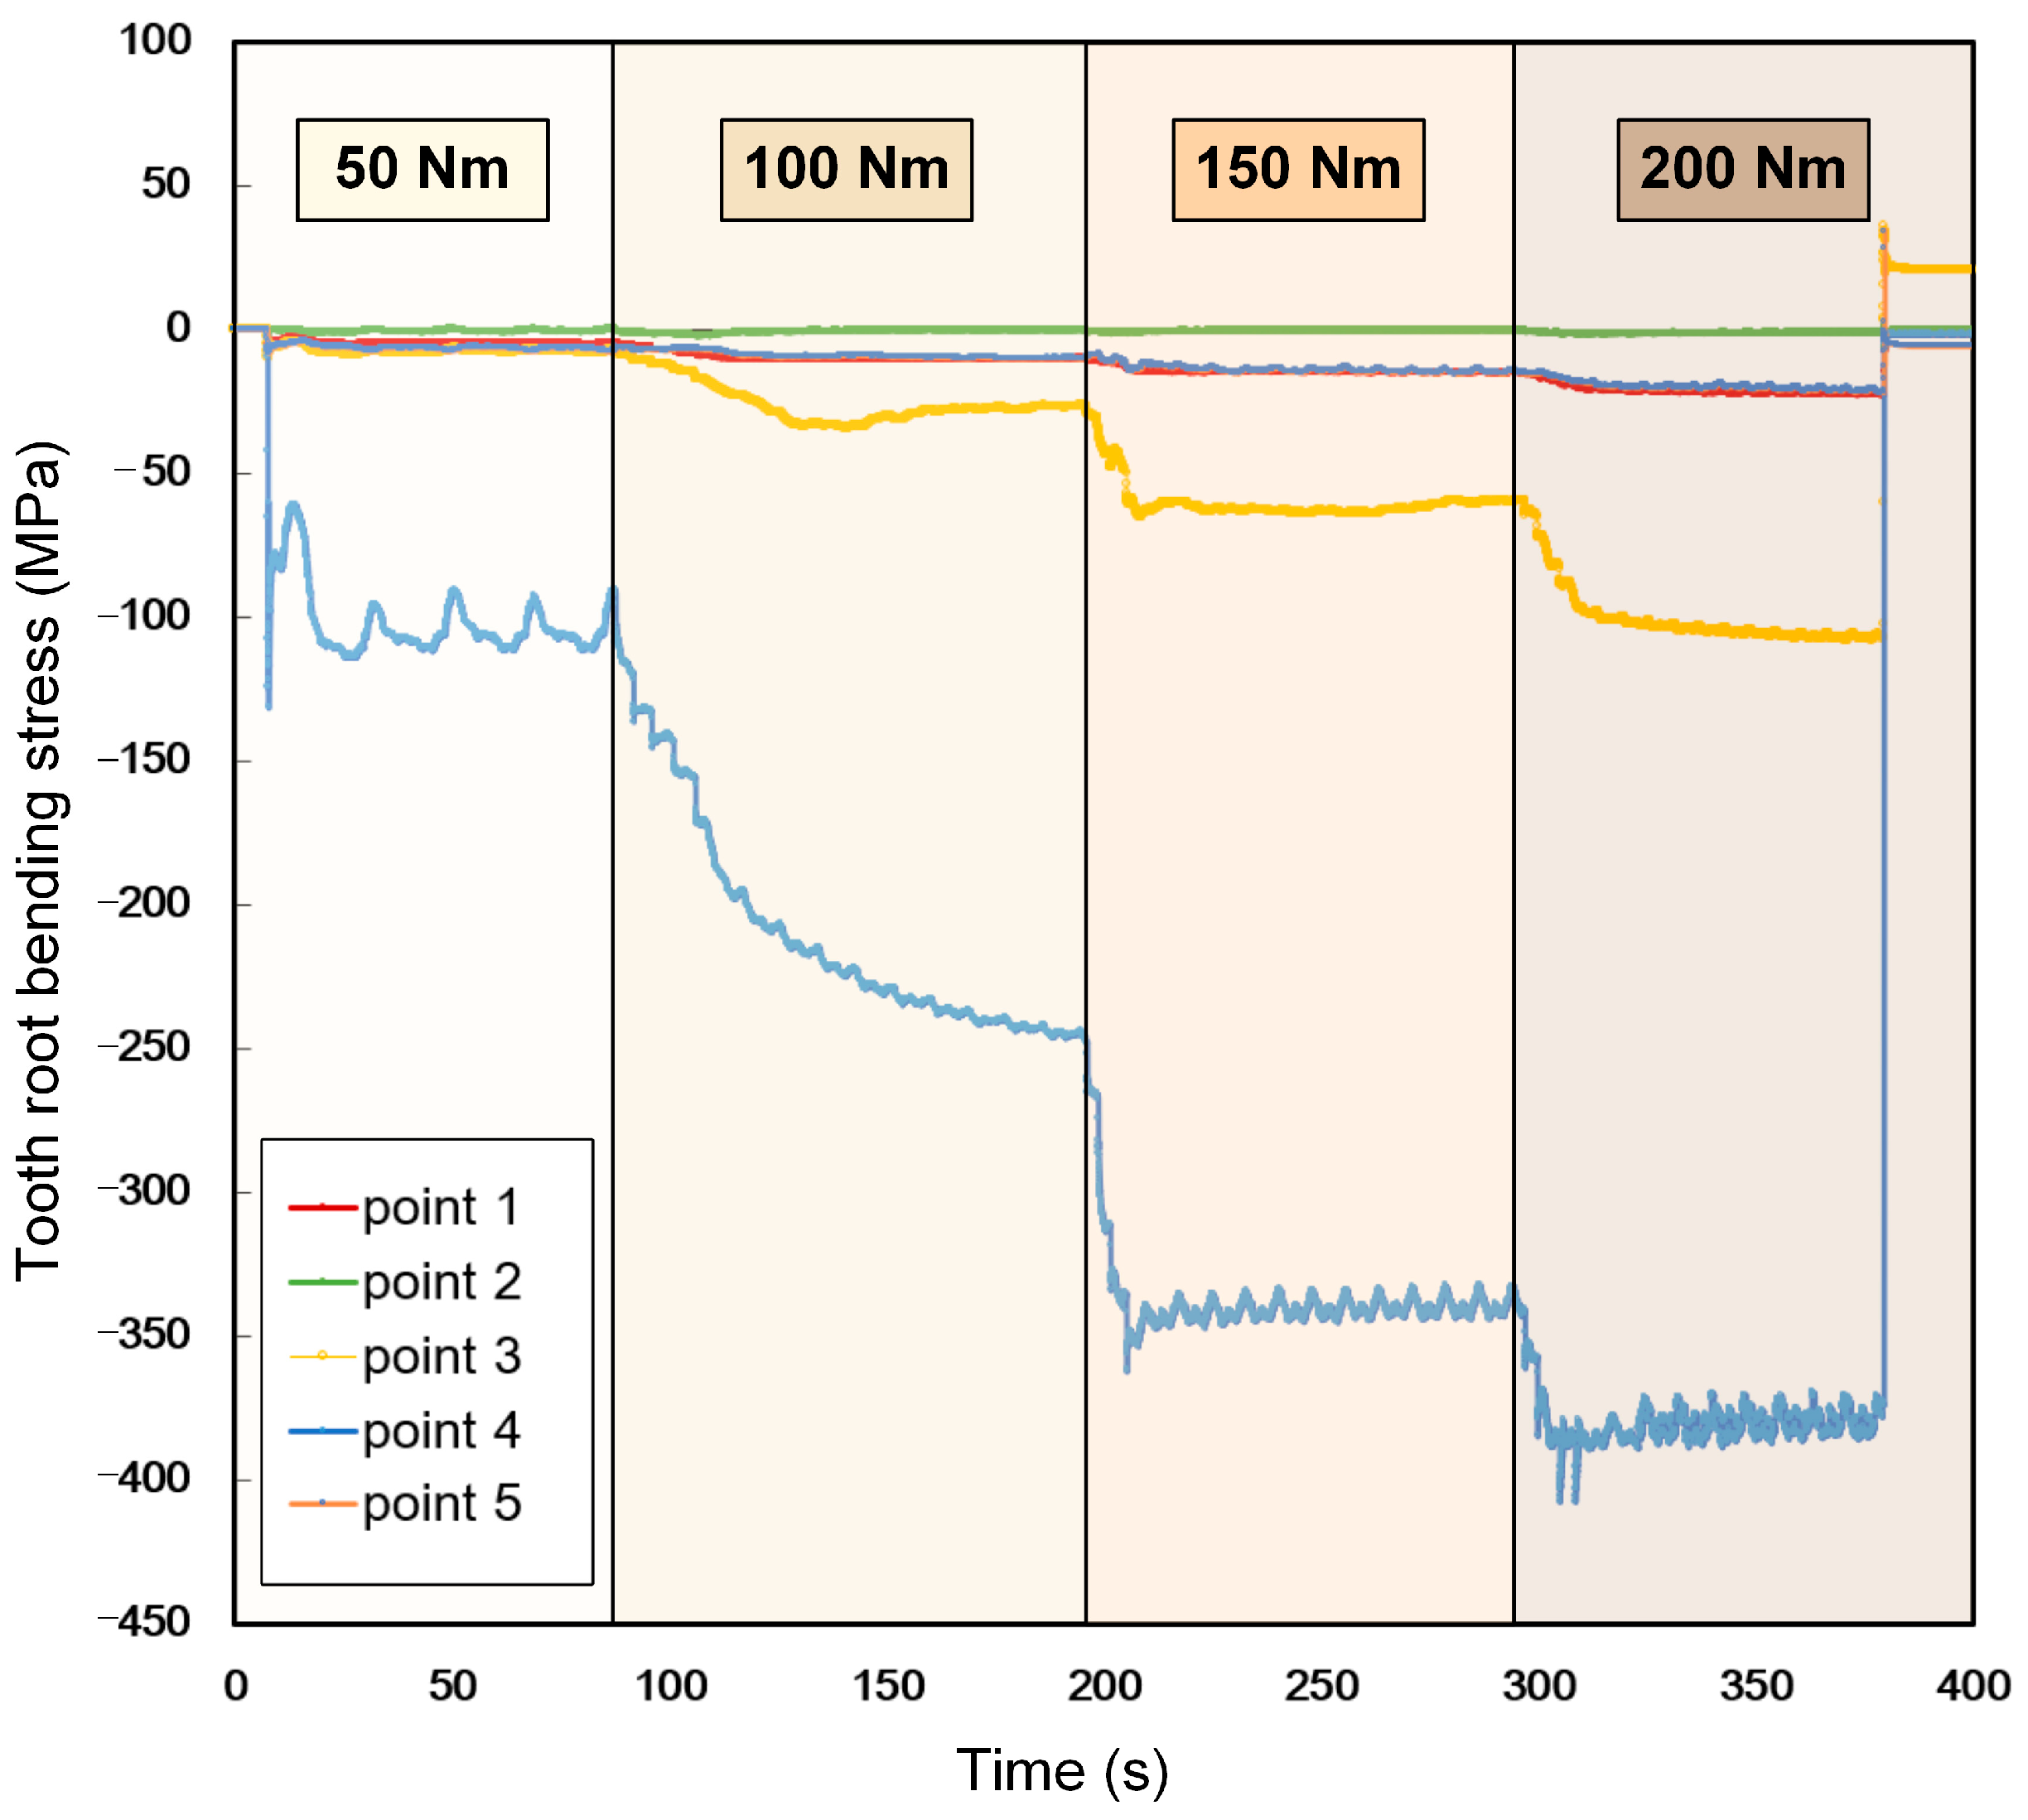
5.3.1. Analysis of Experimental Data

The root bending stresses at each measurement point under four different torque conditions were obtained following the aforementioned procedure. For each torque level, the average bending stress across all measurement points was calculated. The resulting data are summarized in Table 6.
It should be noted that under the various torque conditions listed in Table 6, the measured results at different locations represent the distribution of root bending stress along the face width, as the strain gauges were bonded in the face width direction.
As shown in Figure 29, the torque was 50 Nm from 20 s to 87 s, 100 Nm from 128 s to 198 s, 150 Nm from 211 s to 295 s, and 200 Nm from 315 s to 379 s. Due to experimental constraints, only a set gear pair was tested in this study. To ensure the reliability and validity of the data, the duration of each loading condition was extended, with all load cases maintained for more than 1 min. The data indicated that the root bending stresses at Points 2 and 3 were relatively higher, while those at Points 1, 4, and 5 were lower. This distribution trend was generally consistent with the stress distribution obtained by the formula proposed.

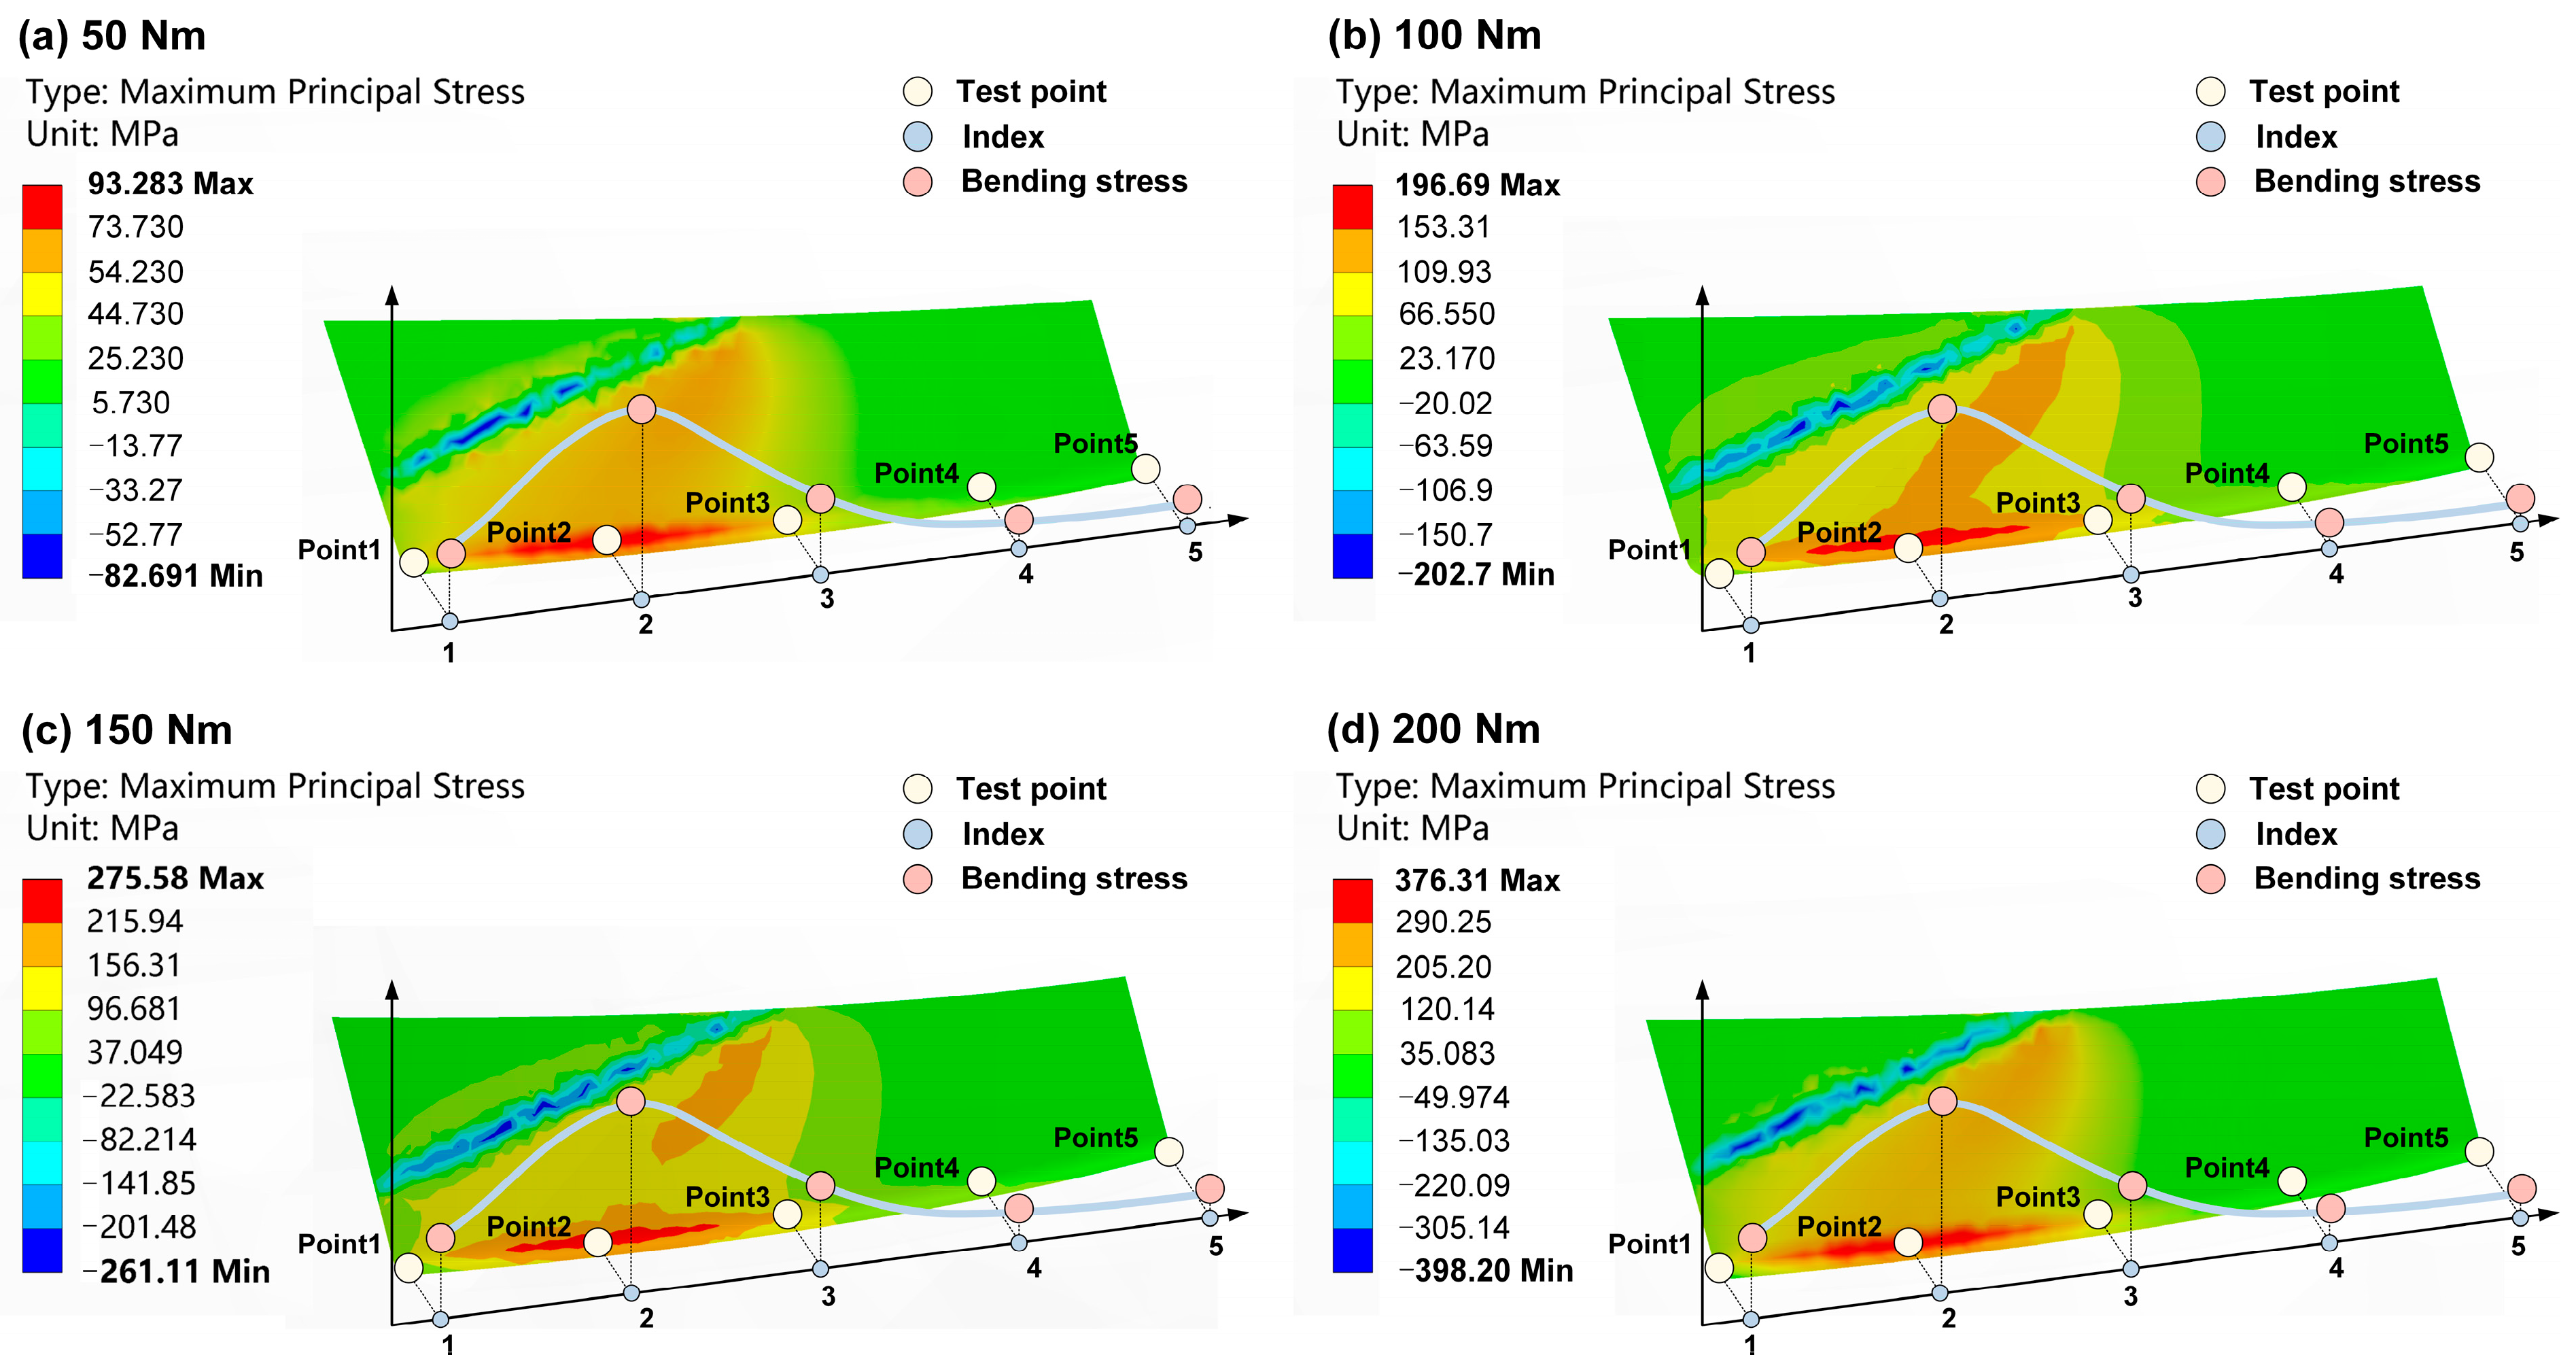
5.3.2. Simulation Validation

Finite element simulations were performed at the meshing position of the gear pair under four torque conditions. The maximum root bending stresses obtained from the simulations are shown in Figure 30. These values were closer to the experimental test results, and the trend of tooth root bending stress distribution along the direction of tooth width was consistent under all working conditions.
The theoretical results were then compared with the simulation and experimental results, as shown in Figure 31. It could be observed that the calculated values were in good agreement with both the experimental data and simulation results, thereby validating the accuracy of the proposed method.

6. Conclusions

To accurately meet the requirements of strength calculation and parameter design for line contact spiral bevel gear drives, this study focuses on the stress analysis and calculation of such gear pairs. The main conclusions are as follows:
(1)
Unlike the elliptical contact area of point contact gear pairs, the effective contact area of line contact gear pairs spans almost the entire tooth surface. Although edge contact may occur on tooth surfaces, the meshing stress distribution remains relatively uniform. For point contact gear pairs, the maximum tooth root bending stress typically appears near the tooth root at the toe. However, for line contact gear pairs, the maximum stress is located near the heel, which is closely related to the load distribution along the contact line.
(2)
The slice method and finite element simulations were employed to investigate the load distribution along the contact line of the gear pairs. Based on these results, the load-sharing ratio of the gear teeth was obtained for the gear pairs with a contact ratio between 2 and 3.
(3)
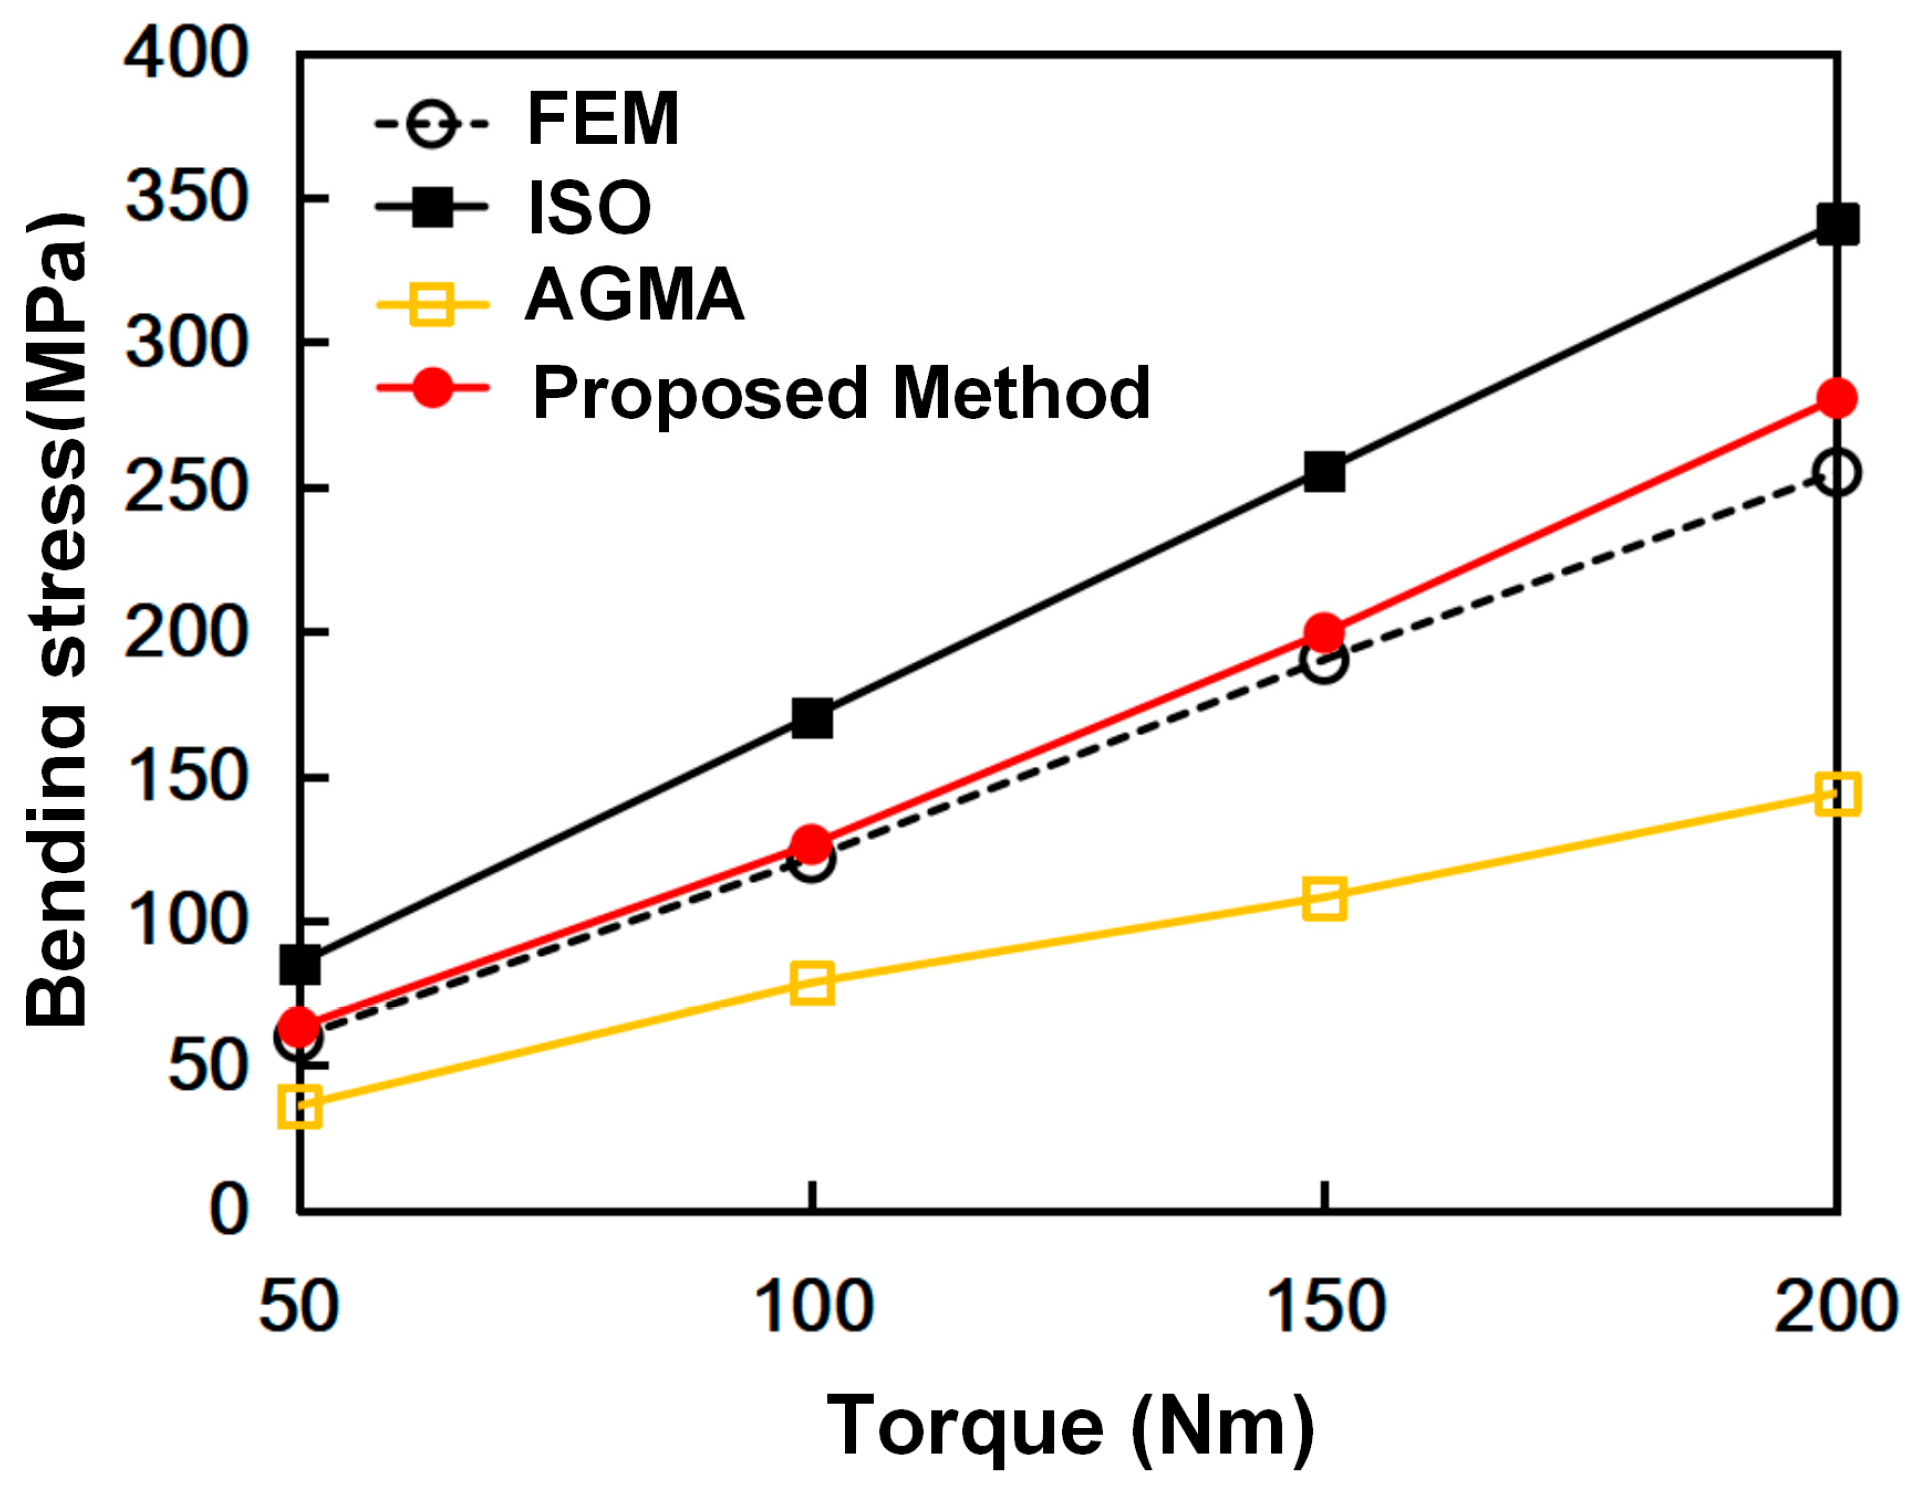
Based on the load distribution along the contact line, a segmented loading approach is employed to derive the bending moment distribution formula for the critical tooth root section. The geometric characteristics of the critical section are analyzed to obtain its moment of inertia against bending, and a formula for calculating the root bending stress of gear pairs is derived. Compared with the results obtained using the existing standard for root bending stress calculation, which exhibits deviations of up to 40% from FEA, the formula proposed in this study achieves deviations within 10%, demonstrating significantly improved accuracy compared to the ISO standard.
(4)
The results of the static tooth root bending stress tests are in good agreement with those obtained from FEA, which almost validates the accuracy of the proposed analytical method for calculating the root bending stress of line contact spiral bevel gear pairs.
This method applies to the strength analysis of gear meshing under quasi-static or low-speed conditions. Due to experimental constraints, the meshing behavior of gear pairs under high-speed dynamic loads has not been considered, and thus, the method cannot be directly applied to such scenarios. In addition, the method assumes idealized contact without accounting for lubrication-induced slip or variations in oil film thickness. In practical gear transmissions, the presence of lubrication can cause micro-slip at the contact interface, which may affect the load distribution and stress calculations. Further research involving advanced tribological models is needed to address these effects.
In future work, we plan to expand upon the current study in the following directions: (I) investigate the applicability of the proposed method across a broader range of geometric parameters to promote its practical application in high-performance spiral bevel gear design; (II) evaluate the suitability of the method under cyclic loading conditions and conduct experimental studies on the dynamic performance of gear pairs; (III) further develop the contact fatigue strength calculation based on the proposed line contact load distribution model, supported by dynamic testing of gear pairs with varying geometric parameters; and (IV) incorporate a line-contact elasto-hydrodynamic lubrication (EHL) model to study the meshing behavior of gear pairs under different lubrication conditions.

Author Contributions

All authors contributed to the study’s conception and design. Methodology, data analysis, investigation, and writing—original draft were performed by S.Z. Review, editing, resources, funding acquisition and supervision were performed by Y.S. and L.C. Software support, and review were provided by S.L. and M.W., and all authors commented on previous versions of the manuscript. All authors have read and agreed to the published version of the manuscript.

Funding

This research was funded by the National Natural Science Foundation of China under Grant No. 51875395 and the ZRIME Gearing Technology Development Foundation of China under Grant No. ZJCD02202402.

Data Availability Statement

Data are contained within the article.

Acknowledgments

The authors would like to thank ZRIME Gearing Technology Co., Ltd. for the technical support for the gear experimental investigation at Tianjin University.

Conflicts of Interest

Authors Shiyu Zuo, Liang Chen, and Simin Li are employed by ZRIME Gearing Technology Co., Ltd. The authors declare that the research was conducted in the absence of any commercial or financial relationships that could be construed as a potential conflict of interest.

Appendix A

Matrix transformation rt(t) to r2(2):
M 2 t = cos φ 2 sin δ M 2 cos φ c 2 sin φ 2 sin φ c 2 cos φ 2 sin δ M 2 sin φ c 2 sin φ 2 cos φ c 2 cos φ 2 cos δ M 2 A sin φ 2 sin δ M 2 cos φ c 2 + cos φ 2 sin φ c 2 sin φ 2 sin δ M 2 sin φ c 2 + cos φ 2 cos φ c sin φ 2 cos δ M 2 B cos φ c 2 cos δ M 2 sin φ c 2 cos δ M 2 sin δ M 2 C 0 0 0 1
A = S 2 sin δ M 2 cos φ 2 cos ( q 2 + φ c ) S 2 sin φ 2 sin ( q 2 + φ c ) + E 2 sin φ 2 X B 2 cos δ M 2 cos φ 2 B = S 2 sin δ M 2 sin φ 2 cos ( q 2 + φ c ) + S 2 cos φ 2 sin ( q 2 + φ c ) E 2 cos φ 2 X B 2 cos δ M 2 sin φ 2 C = S 2 cos δ M 2 cos ( q 2 + φ c ) + X B 2 sin δ M 2 + X 2
where the radial setting is S2, the initial cradle angle setting is q2, the machine root angle is δM2, the vertical offset is E2, the increment of the machine center to the back is X2, and the sliding base feed setting is XB2.
Matrix transformation rt(t) to r1(1):
M 1 t = c 11 c 21 c 31 c 41 c 12 c 22 c 32 c 42 c 13 c 23 c 33 c 43 0 0 0 1 c 11 = a 11 cos i cos φ 1 cos δ M 1 sin i cos ( I ) + a 12 sin ( I ) cos i a 11 sin i + cos φ 1 cos δ M 1 cos i sin i c 12 = a 21 cos i sin φ 1 cos δ M 1 sin i cos ( I ) + a 22 sin ( I ) cos i a 21 sin i + sin φ 1 cos δ M 1 cos i sin i c 13 = a 31 cos i + sin δ M 1 sin i cos ( I ) + a 32 sin ( I ) cos i a 31 sin i sin δ M 1 cos i sin i c 21 = a 11 cos i cos φ 1 cos δ M 1 sin i sin ( I ) + a 12 cos ( I ) c 22 = a 21 cos i sin φ 1 cos δ M 1 sin i sin ( I ) + a 22 cos ( I ) c 23 = a 31 cos i + sin δ M 1 sin i sin ( I ) + a 32 cos ( I ) c 31 = a 11 cos i cos φ 1 cos δ M 1 sin i cos ( I ) + a 12 sin ( I ) sin i + a 11 sin i + cos φ 1 cos δ M 1 cos i cos i c 32 = a 21 cos i sin φ 1 cos δ M 1 sin i cos ( I ) + a 22 sin ( I ) sin i + a 21 sin i + sin φ 1 cos δ M 1 cos i cos i c 33 = a 31 cos i + sin δ M 1 sin i cos ( I ) + a 32 sin ( I ) sin i + a 31 sin i sin δ M 1 cos i cos i c 41 = E 1 sin φ 1 X B 1 cos φ 1 cos δ M 1 K sin φ 1 sin ( Q 0 + φ c 1 ) cos φ 1 sin δ M 1 cos ( Q 0 + φ c 1 ) cos β + sin φ 1 cos ( Q 0 + φ c 1 ) + cos φ 1 sin δ M 1 sin ( Q 0 + φ c 1 ) sin β c 42 = E 1 cos φ 1 X B 1 sin φ 1 cos δ M 1 + K cos φ 1 sin ( Q 0 + φ c 1 ) sin φ 1 sin δ M 1 cos ( Q 0 + φ c 1 ) cos β cos φ 1 cos ( Q 0 + φ c 1 ) sin φ 1 sin δ M 1 sin ( Q 0 + φ c 1 ) sin β
c 43 = X 1 + X B 1 sin δ M 1 + K cos δ M 1 cos ( Q 0 + φ c 1 ) K cos δ M 1 cos ( Q 0 + φ c 1 ) cos β + cos δ M 1 sin ( Q 0 + φ c 1 ) sin β
a 11 = sin φ 1 sin ( Q 0 + φ c 1 ) cos φ 1 sin δ M 1 cos ( Q 0 + φ c 1 ) cos β + sin φ 1 cos ( Q 0 + φ c 1 ) + cos φ 1 sin δ M 1 sin ( Q 0 + φ c 1 ) sin β cos J sin φ 1 sin ( Q 0 + φ c 1 ) cos φ 1 sin δ M 1 cos ( Q 0 + φ c 1 ) sin β sin φ 1 cos ( Q 0 + φ c 1 ) + cos φ 1 sin δ M 1 sin ( Q 0 + φ c 1 ) cos β sin J a 12 = ( sin φ 1 sin ( Q 0 + φ c 1 ) cos φ 1 sin δ M 1 cos ( Q 0 + φ c 1 ) ) cos β + ( sin φ 1 cos ( Q 0 + φ c 1 ) + cos φ 1 sin δ M 1 sin ( Q 0 + φ c 1 ) ) sin β sin J + ( sin φ 1 sin ( Q 0 + φ c 1 ) cos φ 1 sin δ M 1 cos ( Q 0 + φ c 1 ) ) sin β ( sin φ 1 cos ( Q 0 + φ c 1 ) + cos φ 1 sin δ M 1 sin ( Q 0 + φ c 1 ) ) cos β cos J
a 21 = ( cos φ 1 sin ( Q 0 + φ c 1 ) sin φ 1 sin δ M 1 cos ( Q 0 + φ c 1 ) ) cos β ( cos φ 1 cos ( Q 0 + φ c 1 ) sin φ 1 sin δ M 1 sin ( Q 0 + φ c 1 ) ) sin β cos J ( cos φ 1 sin ( Q 0 + φ c 1 ) sin φ 1 sin δ M 1 cos ( Q 0 + φ c 1 ) ) sin β + ( cos φ 1 cos ( Q 0 + φ c 1 ) sin φ 1 sin δ M 1 sin ( Q 0 + φ c 1 ) ) cos β sin J a 22 = ( cos φ 1 sin ( Q 0 + φ c 1 ) sin φ 1 sin δ M 1 cos ( Q 0 + φ c 1 ) ) cos β ( cos φ 1 cos ( Q 0 + φ c 1 ) sin φ 1 sin δ M 1 sin ( Q 0 + φ c 1 ) ) sin β sin J + ( cos φ 1 sin ( Q 0 + φ c 1 ) sin φ 1 sin δ M 1 cos ( Q 0 + φ c 1 ) ) sin β + ( cos φ 1 cos ( Q 0 + φ c 1 ) sin φ 1 sin δ M 1 sin ( Q 0 + φ c 1 ) ) cos β cos J a 31 = ( cos δ M 1 cos ( Q 0 + φ c 1 ) cos β + cos δ M 1 sin ( Q 0 + φ c 1 sin β ) cos J ( cos δ M 1 cos ( Q 0 + φ c 1 ) sin β cos δ M 1 sin ( Q 0 + φ c 1 ) cos β ) sin J a 32 = ( cos δ M 1 cos ( Q 0 + φ c 1 ) cos β + cos δ M 1 sin ( Q 0 + φ c 1 ) sin β ) sin J + ( cos δ M 1 cos ( Q 0 + φ c 1 ) sin β cos δ M 1 sin ( Q 0 + φ c 1 ) cos β ) cos J
where the initial cradle angle is Q0 and the rotation angle of the generating gear is φc1; the eccentric angle is β, the swivel angle is J, the tilt angle is I, the machine root angle is δM1, the vertical offset is E1, the increment of the machine center to the back is X1, the sliding base feed setting is XB1, the distance between the origin Ob of the cutterhead coordinate system is Sb and the origin O of the eccentric drum coordinate system is K, and the rotation angle of the swivel drum coordinate system SJ around its yJ axis is i.

References

  1. Litvin, F.L.; Fuentes, A.; Hayasaka, K. Design, Manufacture, Stress Analysis, and Experimental Tests of Low-Noise High Endurance Spiral Bevel Gears. Mech. Mach. Theory 2006, 41, 83–118. [Google Scholar] [CrossRef]
  2. Fernandes, P.J.L. Tooth Bending Fatigue Failures in Gears. Eng. Fail. Anal. 1996, 3, 219–225. [Google Scholar] [CrossRef]
  3. Hemanshu, J. Mode and Cause of Failure of a Bevel Gear—A Review. Int. J. Adv. Eng. Res. Dev. 2014, 1, 9. [Google Scholar] [CrossRef]
  4. Siddiqui, N.A.; Deen, K.M.; Khan, M.Z.; Ahmad, R. Investigating the Failure of Bevel Gears in an Aircraft Engine. Case Stud. Eng. Fail. Anal. 2013, 1, 24–31. [Google Scholar] [CrossRef]
  5. Gao, Z.; Xing, B.; Bu, J.; Liu, M. Failure Analysis of the Spiral Bevel Gear Made of the 3rd Generation New Low Carbon High Alloy Steel. Aeroengine 2024, 50, 170–174. [Google Scholar] [CrossRef]
  6. Mu, Y.; He, X. Design and Dynamic Performance Analysis of High-Contact-Ratio Spiral Bevel Gear Based on the Higher-Order Tooth Surface Modification. Mech. Mach. Theory 2021, 161, 104312. [Google Scholar] [CrossRef]
  7. Mu, Y.-M.; He, X.-M.; Fang, Z.-D. Design and Dynamic Performance Analysis of High-Contact-Ratio Spiral Bevel Gear Based on Ease-off Technology. Int. J. Precis. Eng. Manuf. 2021, 22, 1963–1973. [Google Scholar] [CrossRef]
  8. Mu, Y.; He, X.; Fang, Z. An Innovative Ease-off Flank Modification Method Based on the Dynamic Performance for High-Speed Spiral Bevel Gear with High-Contact-Ratio. Mech. Mach. Theory 2021, 162, 104345. [Google Scholar] [CrossRef]
  9. Wang, Y.; Wang, H.; Li, K.; Qiao, B.; Shen, Z.; Chen, X. An Analytical Method to Calculate the Time-Varying Mesh Stiffness of Spiral Bevel Gears with Cracks. Mech. Mach. Theory 2023, 188, 105399. [Google Scholar] [CrossRef]
  10. Wang, Y.; Yang, K.; Tang, W. Prediction and Test of Stable Transmission Time of Spiral Bevel Gear during a Loss-of-Lubrication Event in Helicopter Transmission System. Ind. Lubr. Tribol. 2022, 74, 111–117. [Google Scholar] [CrossRef]
  11. Su, J.; Wei, G.; Yang, Y.; Chang, L.; Guo, J. Design and Analysis of Spiral Bevel Gears with Large Contact Ratio. Xi’an Jiaotong Daxue Xuebao 2021, 55, 117–125. [Google Scholar]
  12. Jiang, Z.; Wang, X.; Chi, H.; Zhao, X. Optimization of Tooth Surface Contact Characteristics of Spiral Bevel Gears by Genetic Algorithm. Mech. Sci. Technol. Aerosp. Eng. 2022, 41, 409–413. [Google Scholar]
  13. Zhou, C.; Li, Z.; Hu, B.; Zhan, H.; Han, X. Analytical Solution to Bending and Contact Strength of Spiral Bevel Gears in Consideration of Friction. Int. J. Mech. Sci. 2017, 128–129, 475–485. [Google Scholar] [CrossRef]
  14. Li, L. Research on Machining and Modeling Methods of Line-Contact Spiral Bevel Gears. Master’s Thesis, Tianjin University, Tianjin, China, 2020. [Google Scholar]
  15. Wang, M. Research on NC Machining Methods of Line-Contact Spiral Bevel Gears. Master’s Thesis, Tianjin University, Tianjin, China, 2022. [Google Scholar]
  16. Wang, M.; Sun, Y. Cutterhead Approximation Machining Method of Line Contact Spiral Bevel Gear Pairs Based on Controlling Topological Deviations. Int. J. Adv. Manuf. Technol. 2022, 121, 1623–1637. [Google Scholar] [CrossRef]
  17. Wang, M.; Li, L.; Sun, Y. Tooth Flank Machining and Modelling of Line Contact Spiral Bevel Gears with the Conical Finger-Type Milling Cutter. Int. J. Adv. Manuf. Technol. 2023, 125, 3277–3291. [Google Scholar] [CrossRef]
  18. ISO 10300-1: 2023; Calculation of Load Capacity of Bevel Gear—Part 1: Introduction and General Influence Factors. International Standards Organization: Geneva, Switzerland, 2023.
  19. ISO 10300-2: 2023; Calculation of Load Capacity of Bevel Gear—Part 2: Calculation of Surface Durability (Macropitting). International Standards Organization: Geneva, Switzerland, 2023.
  20. ISO 10300-3: 2023; Calculation of Load Capacity of Bevel Gear—Part 3: Calculation of Tooth Root Strength. International Standards Organization: Geneva, Switzerland, 2023.
  21. ANSI/AGMA 2003-B97; Rating the Pitting Resistance and Bending Strength of Generated Straight Bevel, Zerol Bevel, and Spiral Bevel Gear Teeth. AGMA: Alexandria, VA, USA, 2010.
  22. Simon, V. Load Distribution in Spiral Bevel Gears. J. Mech. Des. 2007, 129, 201–209. [Google Scholar] [CrossRef]
  23. Li, H.; Tang, J.; Chen, S.; Rong, K.; Ding, H.; Lu, R. Loaded Contact Pressure Distribution Prediction for Spiral Bevel Gear. Int. J. Mech. Sci. 2023, 242, 108027. [Google Scholar] [CrossRef]
  24. Sánchez, M.B.; Pleguezuelos, M.; Pedrero, J.I. Tooth-Root Stress Calculation of High Transverse Contact Ratio Spur and Helical Gears. Meccanica 2014, 49, 347–364. [Google Scholar] [CrossRef]
  25. Pedrero, J.I.; Vallejo, I.I.; Pleguezuelos, M. Calculation of Tooth Bending Strength and Surface Durability of High Transverse Contact Ratio Spur and Helical Gear Drives. J. Mech. Des. 2007, 129, 69–74. [Google Scholar] [CrossRef]
  26. Liu, Z.; Yuan, Y.; Xiao, W.; Zhang, H. Method of Calculation Experiment of Bending Stress for Rough Module Racks. Chin. J. Mech. Eng. 2016, 52, 152–159. [Google Scholar] [CrossRef]
  27. Yu, Y.; Lin, C.; Hu, Y. Design Bending Stress Analysis of Non-Circular Gears with Different Contact Ratio. Chin. J. Mech. Eng. 2022, 58, 206–220. [Google Scholar]
  28. Zhang, B.; Sun, T.; Li, D.; Li, J. Analytical Algorithm of Bending Stress for Face Gears. Mach. Des. Res. 2023, 39, 90–94. [Google Scholar]
  29. Liu, Y.; Chen, L.; Mao, X.; Shangguan, D. A Semi-Analytical Loaded Contact Model and Load Tooth Contact Analysis Approach of Ease-Off Spiral Bevel Gears. Machines 2024, 12, 623. [Google Scholar] [CrossRef]
  30. Huang, D.; Li, Y.; Zheng, X.; Li, G. Study on Dynamic Behaviors of Hypoid Gears Under Variable Tidal Current Energy Harvesting Conditions. Machines 2025, 13, 178. [Google Scholar] [CrossRef]
  31. Xu, H.; Zhang, G.; Masana, K. Research for Photoelastic Experiment Bending Strength Experiment of Double Involute Gear with Ladder Shape Teeth. Chin. J. Mech. Eng. 2000, 36, 39–42. [Google Scholar] [CrossRef]
  32. Zhang, J. Design and Experimental Study of High Strength Spiral Bevel Gears. Ph.D. Thesis, Northwestern Polytechnical University, Xi’an, China, 2008. [Google Scholar]
  33. Long, J. Load Capacity Analysis and Bending Stress Measuring for Spiral Bevel Gear. Master’s Thesis, Hunan University, Changsha, China, 2019. [Google Scholar]
  34. Wan, L. Strength Calculation and Experimental Verification for Spiral Bevel Gears. Master’s Thesis, Hunan University, Changsha, China, 2019. [Google Scholar]
  35. Lisle, T.J.; Shaw, B.A.; Frazer, R.C. External Spur Gear Root Bending Stress: A Comparison of ISO 6336:2006, AGMA 2101-D04, ANSYS Finite Element Analysis and Strain Gauge Techniques. Mech. Mach. Theory 2017, 111, 1–9. [Google Scholar] [CrossRef]
  36. Lisle, T.J.; Shaw, B.A.; Frazer, R.C. Internal Spur Gear Root Bending Stress: A Comparison of ISO 6336:1996, ISO 6336:2006, VDI 2737:2005, AGMA, ANSYS Finite Element Analysis and Strain Gauge Techniques. Proc. Inst. Mech. Eng. Part C J. Mech. Eng. Sci. 2019, 233, 1713–1720. [Google Scholar] [CrossRef]
  37. Chen, D.; Liu, H.; Zhang, X.; Lin, Q.; Pan, J. Experimental Study on the Influencing Factors of Bending Fatigue Strength of 18CrNiMo7-6 Gear. Chin. J. Mech. Eng. 2024, 46, 1–15. [Google Scholar] [CrossRef]
  38. Sun, Q. Study on Tooth Shape Design of Gear Drive with Small Number of Pinion Teeth. Ph.D. Thesis, Tianjin University, Tianjin, China, 2020. [Google Scholar]
Figure 1. Coordinate system cutting machining by the generation method for the gear.
Machines 13 00632 g001
Figure 2. Coordinate system of gear cutting on the pinion.
Machines 13 00632 g002
Figure 3. The line contact spiral gear pairs model.
Machines 13 00632 g003
Figure 4. Comparison of 3D models for point contact and line contact spiral bevel gear pairs.
Machines 13 00632 g004
Figure 5. Simulation results of meshing of spiral bevel gear pairs for (a) point contact; (b) line contact.
Machines 13 00632 g005
Figure 6. Comparison of the stress distribution of the contact line on the tooth flank for two types of gear pairs: (a) point contact; (b) line contact.
Machines 13 00632 g006
Figure 7. (a) Comparison of bending stresses in two types of gear pairs; the FEM results of root bending stress for two types of gear pairs: (b) point contact; (c) line contact.
Machines 13 00632 g007
Figure 8. Comparison of test results for two types of gear pairs: (a) point contact; (b) line contact.
Machines 13 00632 g008
Figure 9. Main research content.
Machines 13 00632 g009
Figure 10. Meshing results of the gear pairs.
Machines 13 00632 g010
Figure 11. The FEM results of the pinion under load: (a) contact stress; (b) deformation.
Machines 13 00632 g011
Figure 12. (a) The position of the points along the tooth width; (b) deformation of teeth under load.
Machines 13 00632 g012
Figure 13. (a) Slicing of a tooth along the tooth width; (b) the tooth profile parameter ξ at the end-face contact point; (c) gear geometrical parameters; (d) the function of profile parameter ξc.
Machines 13 00632 g013
Figure 14. The illustration of the calculation of the load carried on the kth slice.
Machines 13 00632 g014
Figure 15. Contact lines in different positions.
Machines 13 00632 g015
Figure 16. Load distribution along (a) contact line lr; (b) contact line lm; (c) contact line lt.
Machines 13 00632 g016
Figure 17. (a) Tooth contact simulation results; (b) tooth surface contact stresses on the three contact lines.
Machines 13 00632 g017
Figure 18. (a) Relative radius of curvature of contact points; (b) comparison of FEA and theoretical model’s results for load distribution.
Machines 13 00632 g018
Figure 19. Schematic calculation of bending stresses for the beam.
Machines 13 00632 g019
Figure 20. (a) Distribution of bending moments along the tooth width; (b) distance from the point of load to the hazardous section.
Machines 13 00632 g020
Figure 21. Calculation of the distribution of bending moments in the hazardous section of the tooth root for loads on the contact line.
Machines 13 00632 g021
Figure 22. Results of the formula for the distribution of bending stresses in the hazardous section of the tooth root.
Machines 13 00632 g022
Figure 23. (a) The zoned loading method; (b) bending stresses on the critical section of the tooth root; (c) FEA results of the tooth root bending stress; (d) comparison of finite element analysis of the two methods.
Machines 13 00632 g023
Figure 24. (a) Critical root section geometry; (b) bending moment of inertia calculation.
Machines 13 00632 g024
Figure 25. Tooth root bending stress distribution under different torques: (a) 50 Nm; (b) 100 Nm; (c) 150 Nm; (d) 200 Nm.
Machines 13 00632 g025
Figure 26. Comparison of maximum tooth root bending stress calculation results of the four methods.
Machines 13 00632 g026
Figure 27. The bonding positions of the strain gauges on the tested tooth root.
Machines 13 00632 g027
Figure 28. Tooth root bending stress test bench.
Machines 13 00632 g028
Figure 29. Test results of tooth root bending stress.
Machines 13 00632 g029
Figure 30. FEA results of meshing gear pairs under four torque conditions: (a) 50 Nm; (b) 100 Nm; (c) 150 Nm; (d) 200 Nm.
Machines 13 00632 g030
Figure 31. Comparison of test results with FEA and formulae for bending stresses on the tooth root under four torque conditions: (a) 50 Nm; (b) 100 Nm; (c) 150 Nm; (d) 200 Nm..
Machines 13 00632 g031
Table 1. Basic parameters of the line contact spiral bevel gear pairs.
ParameterPinionGear
Outer pitch diameter d (mm)74152
Number of teeth z1939
Outer module m (mm)3.895
Pressure angle αn (°)20
Mean spiral angle βm (°)40
Face width b (mm)25
Table 2. Variation of angle under load.
PositionDeformation (mm)Angular Variation Δθ (°)
A0.03990.05713
B0.04270.05689
C0.04560.05681
D0.04880.05707
E0.05170.05701
Table 3. Maximum tooth root bending moment in different areas of the contact line.
NumberLoad Distribution Ratio riDistance hyi(mm)Maximum Bending Moment Mimax (N mm)
10.5006.642171.23
20.7075.904215.22
30.8665.166230.55
40.9664.428220.54
51.0003.690190.26
60.9662.952147.03
70.8662.21498.81
80.7071.47653.80
90.5000.73819.02
Table 4. Comparison of the errors in the calculation results of the four methods.
TorqueBending Stress Calculation Results (MPa)Error
FEMISOAGMAProposed MethodISOAGMAProposed Method
5059.69985.2836.0463.1742.85%39.63%5.81%
100121.57170.5678.56126.3440.30%35.38%3.92%
150190.26255.84108.11199.5134.47%43.18%4.86%
200255.06341.12144.15280.6833.74%43.48%10.04%
Table 5. Tooth root bending stress test equipment type.
Equipment NameTypeCompany
MotorSCVF2-280S-4Shandong Huali Electric Motor Group Co., Ltd, Weihai, China
Torque-speed sensorJC1000Changsha Huxiang Measurement and Controlling Instrument Co., Ltd, Changsha, China.
DAQINV3065N2China Orient Institute of Noise & Vibration, Beijing, China
Table 6. Mean tooth root bending stress corresponding to each load condition.
IndexTooth Root Bending Stress (MPa)
50 Nm100 Nm150 Nm200 Nm
10.721.001.462.04
2109.45216.43340.80379.56
38.1631.5662.59102.98
45.0910.2414.8922.28
50.560.670.581.42
Disclaimer/Publisher’s Note: The statements, opinions and data contained in all publications are solely those of the individual author(s) and contributor(s) and not of MDPI and/or the editor(s). MDPI and/or the editor(s) disclaim responsibility for any injury to people or property resulting from any ideas, methods, instructions or products referred to in the content.

