Article

An Optimized 1-D CNN-LSTM Approach for Fault Diagnosis of Rolling Bearings Considering Epistemic Uncertainty

Department of Mechanical Engineering, Texas Tech University, Lubbock, TX 79409, USA
Machines 2025, 13(7), 612; https://doi.org/10.3390/machines13070612
Submission received: 15 June 2025 / Revised: 7 July 2025 / Accepted: 14 July 2025 / Published: 16 July 2025
(This article belongs to the Section Machines Testing and Maintenance)

Abstract

Rolling bearings are indispensable but also the most fault-prone components of rotating machinery, typically used in fields such as industrial aircraft, production workshops, and manufacturing. They encounter diverse mechanical stresses, such as vibration and friction during operation, which may lead to wear and fatigue cracks. From this standpoint, the present study combined a 1-D convolutional neural network (1-D CNN) with a long short-term memory (LSTM) algorithm for classifying different ball-bearing health conditions. A physics-guided method that adopts fault characteristics frequencies was used to calculate an optimal input size (sample length). Moreover, grid search was utilized to optimize (1) the number of epochs, (2) batch size, and (3) dropout ratio and further enhance the efficacy of the proposed 1-D CNN-LSTM network. Therefore, an attempt was made to reduce epistemic uncertainty that arises due to not knowing the best possible hyper-parameter configuration. Ultimately, the effectiveness of the physics-guided optimized 1-D CNN-LSTM was tested by comparing its performance with other state-of-the-art models. The findings revealed that the average accuracies could be enhanced by up to 20.717% with the help of the proposed approach after testing it on two benchmark datasets.

1. Introduction

Bearings are significant components in rotary machinery, whose failure can lead to a series of consecutive accidents [1]. In the modern industry, the portion of rotating machinery accounts for around 80%, while the literature outlines that 45% to 55% of rotary machinery equipment failures occur due to rolling bearing faults [2,3]. Once bearings fail (or are damaged), their deteriorated operational state will inevitably affect the interconnected equipment’s precision, efficiency, and service life and probably engender an unscheduled maintenance activity that will cause notable financial consequences. Although the bearing itself has a very low cost, ignoring an incipient fault may threaten the safety and reliability of the entire unit and result in the failure of a more complicated and expensive component [4,5]. Therefore, developing artificial intelligence-based practical algorithmic tools has become the research hotspot during the past decade to diagnose the correlation between the bearing failure mode and the raw sensor signal to guide engineering practice for condition monitoring and predictive maintenance purposes [6].
Vibration signals are generally considered among the primary sources of knowledge for data-driven methods for bearing fault classification (or identification) compared to the methods based on wear particle, motor current, acoustic emission, and so on, due to their advantages in terms of convenient implementation, credible effect, and cost [7]. With this said, the time-series raw vibration signals oftentimes exhibit strong nonlinear and nonstationary traits under variable operating (shaft speed and load) conditions, making the identification task challenging. To tackle this problem, early research on bearing fault diagnosis focused on utilizing traditional machine learning algorithms [8]. For example, Alhams et al. [9] measured the vibrational data of faulty bearings with the help of an experimental setup. In the end, their decision tree classifier achieved an accuracy score of approximately 82%. Qi et al. [10] employed three decision tree-based traditional algorithms and reported accuracy scores varied between 90.42% and 95.76% while classifying four fault types. Although such algorithms have lower computing times, they pose risks of overfit or underfit, which typically end up with low accuracy and weak generalization [11]. Simultaneously, traditional machine learning techniques require manual (subjective) extraction of shallow fault-related features before the classification stage, which is a certain limitation [12].
Speaking of, the deep learning (DL) concept avoids manual feature extraction, eliminating the sizable human effort and subjectivity. The literature also shows that DL methods better fit real-life complex operating conditions while performing fault diagnosis [13]. A great body of research works utilized techniques such as deep belief networks, autoencoders, convolutional neural networks (CNNs), recurrent neural networks, and long short term memory (LSTM) networks to classify divergent bearing faults under constant or variable operational conditions with the help of self-made or commercial bearing test benches and open-access benchmark datasets [14,15]. Having touched on it, CNNs have made outstanding achievements in this domain thanks to their ability to capture and extract richer fault-related features from raw sensor data, minimal engagement with signal processing, and higher diagnostic accuracies. Still, CNNs face the vanishing gradient problem as practitioners try to reach out to a deeper CNN (adding more convolution and pooling layers) to increase the model performance for a given scenario [16]. Due to their structural nature, CNNs tend to disregard prolonged temporal dependencies, especially when dealing with protracted time-series problems [17]. To tackle this problem, adding an LSTM layer to the existing CNN structures has become a viable alternative. LSTM compensates for the drawbacks of recurrent neural networks (inability to hold long-term knowledge). Its usage with CNNs opens an avenue for overcoming the gradient descent phenomena and further enhancing condition monitoring and predictive maintenance strategies [18]. In [19], Han et al. put forth an approach combining a gated recurrent unit with a CNN-LSTM-based pipeline. Their research benefited from the Case Western Reserve University (CWRU) dataset and reached an overall classification accuracy of 99.34%.
Although CNN-LSTM-based techniques perform considerably well in the domain, it is known that, for example, the more advanced the CNN architecture, the larger the number of parameters [2]. This corollary inevitably leads practitioners to seek higher hardware equipment requirements. A good deal of strategies have been developed so far for hyper-parameter tuning and enhancing the soft structure to save computational costs or, in other words, wield them more economically [20]. Some of these strategies are (1) combining the pertinent algorithm with other networks, (2) feeding it with manually extracted features, and (3) hyper-parameter optimization [21]. A detailed criticism of the first two is provided in the previous paragraphs. Therefore, this portion will focus more on the significance of utilizing hyper-parameter optimization. The term hyper-parameter stands for parameters utilized to configure a neural network or specifies a network architecture utilized to minimize the selected loss function. With this in mind, searching for the optimal sets of hyper-parameters is tedious and requires exploring numerous possibilities (combinations). The first (and traditional) option practitioners use is manual testing, which is inevitably experience-dependent and labor-oriented. Therefore, it is an ineffective way of exploring the optimal set of hyper-parameters, considering (1) the nonlinear interaction (or correlation) between different hyper-parameters and (2) the method itself is time-consuming [22]. On the other hand, using automatic search methods comes with the advantages of (1) reducing the sizeable human effort, (2) making the model more reproducible, and (3) enhancing the model’s accuracy [23]. For instance, Liu et al. [24] used the particle swarm optimization algorithm to enhance a CNN model’s performance. Specifically, their research focused on optimizing the learning rate while keeping other hyper-parameters, such as the dropout rate, number of epochs, and batch size constant. The proposed method’s performance was tested on the CWRU dataset, and the average accuracies varied between 98.8% and 100%. Dong [25] combined a CNN with the sparrow search algorithm and tested the pipeline on the CWRU dataset. The study focused on optimizing the learning rate while determining the remaining CNN structure by experience and previous studies. With this in mind, these works focused more on optimizing the structural parameters, not the training parameters such as the dropout rate, batch size, and the number of epochs.
To date, in numerous published studies, the input size (or the window size) of many DL algorithms has been determined as 1024, 2048, and so on by experience or the available literature without any particular setting for a specific diagnostics task [26]. These widely employed input sizes (or window sizes) may not be theoretically optimal for a given case or cannot be explained by physics. In physics, any fault to a bearing (rolling element, inner raceway, cage, or outer raceway) has its unique reflection (or characteristics) in the vibration signal. For instance, a peak generally takes place periodically in the time-domain data when a bearing fails in a mechanical system. Having said that, the pertinent period length may change due to the fault location, but it can be computed with the help of fundamental fault characteristic frequency (equations). In theory, the measurement that has been taken during a single fault period includes the complete information regarding the health state of the bearing [27]. Based on it, the input signal fed into the developed DL-based algorithm needs to be long (extensive) enough to enclose the measurement points from a complete fault period under all possible types of faults (or combinations).
Making predictions for future activities based on historical knowledge is surrounded by uncertainties [28]. Relatively speaking, minimizing the associated uncertainties is paramount in scheduling and risk management. Assume the decision-maker has a DL-based predictor (classifier), and it is known that the results may deviate from ground truth every time the relevant code runs. By minimizing uncertainties, the purpose is to minimize this deviation, thus increasing the model’s trustworthiness [29,30]. The available literature reports two major genres of uncertainties: aleatory and epistemic uncertainties [31]. The former is due to the inherent randomness of data, noisy environments, and unreliable acquisition instruments. Therefore, aleatory uncertainty is typically considered the irreducible part of the total uncertainty. On the other hand, the latter appears because the practitioners do not know the best possible hyper-parameter configuration for their DL networks [32]. In this regard, one can reduce the epistemic portion of the total uncertainty with the help of methods like sensitivity analysis and optimization [33]. In a recent study, Mostafavi et al. [28] used a 1-D CNN to classify different gear and bearing faults while benefiting from a Bayesian model averaging to enhance the uncertainty awareness of the predictions. The proposed approach reached an accuracy score between 84.69% and 91.84%. Although the concept of uncertainty has begun to be adopted more frequently in recent publications, there is still more room for further contributions. Typically, even though the authors, for example, applied optimization techniques to enhance their model’s performance, they do not mention the term uncertainty. In other words, they cannot use this information to interpret how the uncertainty in their predictions affected the ultimate trustworthiness [34].
Given the above discussions, the lack of optimized DL-based approaches that can be explained by physics and take epistemic uncertainty into account is noteworthy. The motivation of the present research work is to bridge this gap and contribute to knowledge in this field. From this standpoint, this study combined the 1-D CNN with an LSTM network for fault diagnosis of rolling element bearings (specifically, ball bearings) under divergent operational conditions. The proposed 1-D CNN-LSTM algorithm was enhanced with the help of grid search by optimizing the following training parameters: dropout ratio, batch size, and the number of epochs. Furthermore, the effectiveness of this approach was tested on two prominent benchmark datasets, namely CWRU and Paderborn University (PU). A physics-guided methodology was adopted while determining the optimal input sizes and window sizes. The data partition was performed through the slip technique based on the physics of both datasets. An attempt was also made to reduce epistemic uncertainty (reducible part of total uncertainty) that arises because of not knowing the best possible hyper-parameter configuration to enhance the model’s trustworthiness. Ultimately, the findings of this optimized 1-D CNN-LSTM were compared with other state-of-the-art methods, such as non-optimized 1-D CNN and 1-D CNN-LSTM algorithms and an optimized 1-D CNN. The contributions of this study can be elucidated as follows:
  • A physics-guided method based on fault characteristic frequencies was developed to take sections (optimal sizes) from the original signals, containing information regarding all possible types of ball bearing faults;
  • Grid search was utilized to optimize the training parameters to enhance the classification accuracy and reduce associated epistemic uncertainty;
  • The proposed optimized 1-D CNN-LSTM methodology outscored other state-of-the-art algorithms while testing under different operational conditions with limited data for two benchmark datasets.

2. Materials and Methods

This work utilized CWRU and PU datasets to test its physics-guided input size selection process and evaluate the performance of its optimized 1-D CNN-LSTM network, considering epistemic uncertainty. The following subsection aims to introduce these datasets and highlight some of their features that will be decisive in the upcoming results, such as the bearing types, sampling frequencies, and fault types (labels) [2,26].

2.1. Preliminaries of Experimental Datasets

2.1.1. CWRU Dataset

Figure 1 visualizes the scheme of the CWRU test bench [5,35]. This bearing test bench includes a drive motor, a torque transducer/encoder, and a dynamometer (loads). The experiments were performed under divergent operational conditions ranging between 0 and 3 HP (indicating the motor load) and 1730 to 1797 rpm (indicating the motor speed). With this said, singular point faults ranging between 0.007 inches and 0.021 inches were introduced to SKF (Svenska-Kullager-Fabriken, Gothenburg, Sweden) 6205-2RS JEM ball bearings. The present work selected the drive-end data collected at 48 kHz to achieve its ends, compatible with a significant body of research in the literature [2]. The selected portion of the CWRU dataset includes acceleration signals for bearings with the balls, inner raceway, and outer raceway faults. In this respect, this study extracted 10 signals (classes) out of the CWRU dataset collected for the above-mentioned health statutes for three fault diameters (0.007″, 0.014″, and 0.021″) besides the healthy condition (3 × 3 + 1 = 10). Although the data were collected for multiple loading and speed stages, the present work benefited from the vibration signals measured at 0 HP and 1797 rpm. For the outer raceway fault, the signals collected through an accelerometer centered at the 6:00 position were adopted [35]. As a note, the ball and pitch diameters of 6205-2RS deep groove ball bearings were 0.3126 and 1.537 inches, respectively. Moreover, the number of rolling elements was 9, while the contact angle was 0°.

2.1.2. PU Dataset

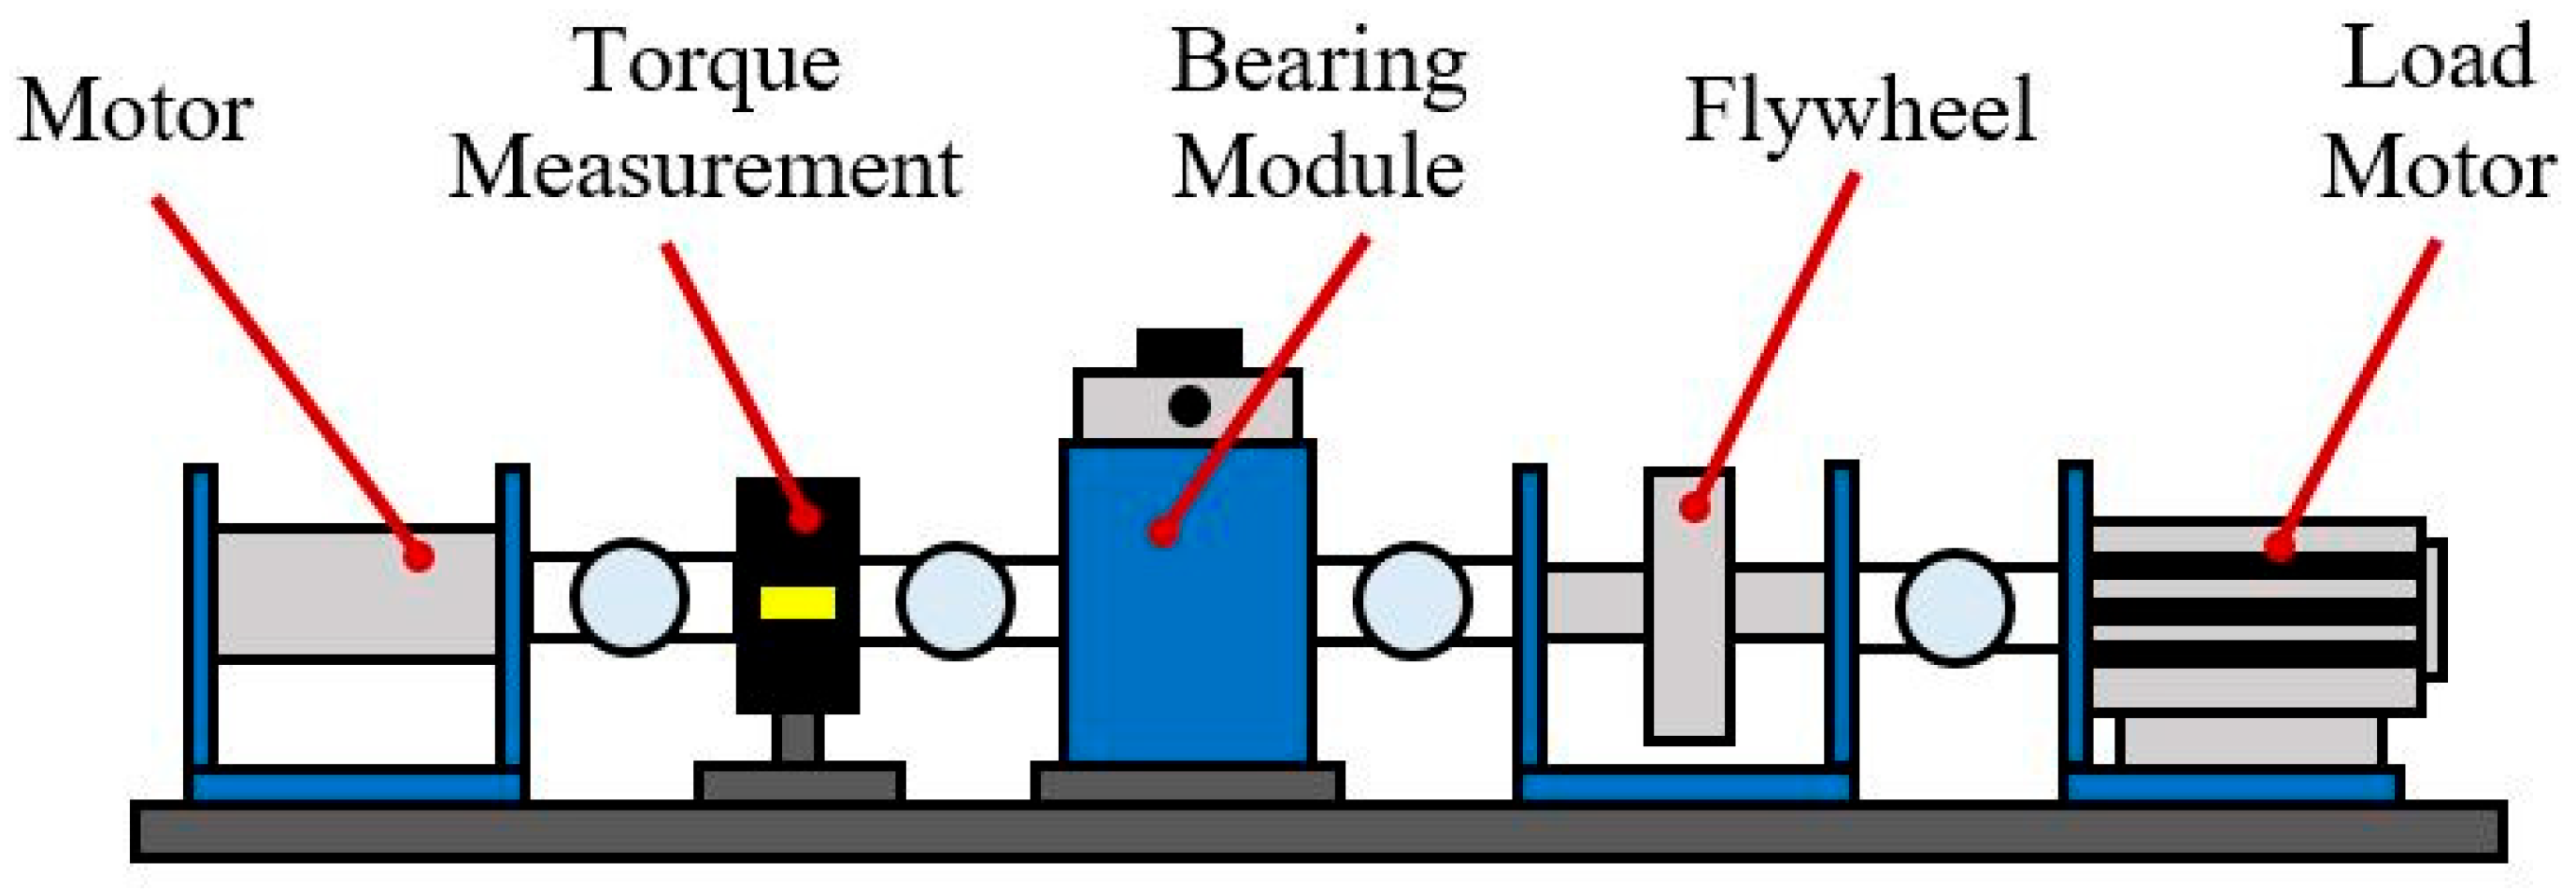
Figure 2 depicts the PU test setup [36]. The pertinent test rig includes a motor, a bearing test module, a flywheel, and the load element (also a motor). As opposed to the CWRU dataset, Type 6203 ball bearings were utilized, and the sampling rate was 64 kHz. The PU dataset includes the vibrational signals of bearings with inner raceway and outer raceway faults, besides the healthy condition. Having touched on it, this study extracted six vibrational signals (classes) from the PU dataset. The selected portion of the dataset consists of the vibrational signals for the healthy state and bearings with the inner raceway and outer raceway faults collected at 900 and 1500 rpm and the 0.7 Nm load. It means that this study kept the load constant and evaluated the influence of variable shaft speeds on the performance of its DL-based approaches (3 × 2 = 6 classes). As an additional note, the fault level was the same for all faulty scenarios [26]. The ball and pitch circle diameters of 6203 bearings were 0.2657 and 1.124 inches, respectively. The number of rolling elements was 8 [36].

2.2. Physics-Guided Input Size Selection

Vibration (acceleration) signals are the most fruitful state for bearing fault classifications and condition monitoring [37]. Data collected through sensors are typically sampled perpetually using a fixed sampling rate in engineering practice. Having touched on it, the original (full) signal needs to be sliced into portions (or samples) while utilizing it to train a DL-based algorithm. Suppose one utilizes a sample length that is too small. In that case, this will cause adversity for fault diagnosis as the pertinent sample (portion) will not contain enough information regarding the bearing health state. Speaking of the opposite case, the practitioners will face information redundancy if the sample length is too long. However, the literature generally determines the sample length as 1024, 2048, 4096, and so on by experience or previous research [26]. Integrating the fundamentals of physics into this process may make the relevant selection more explainable.
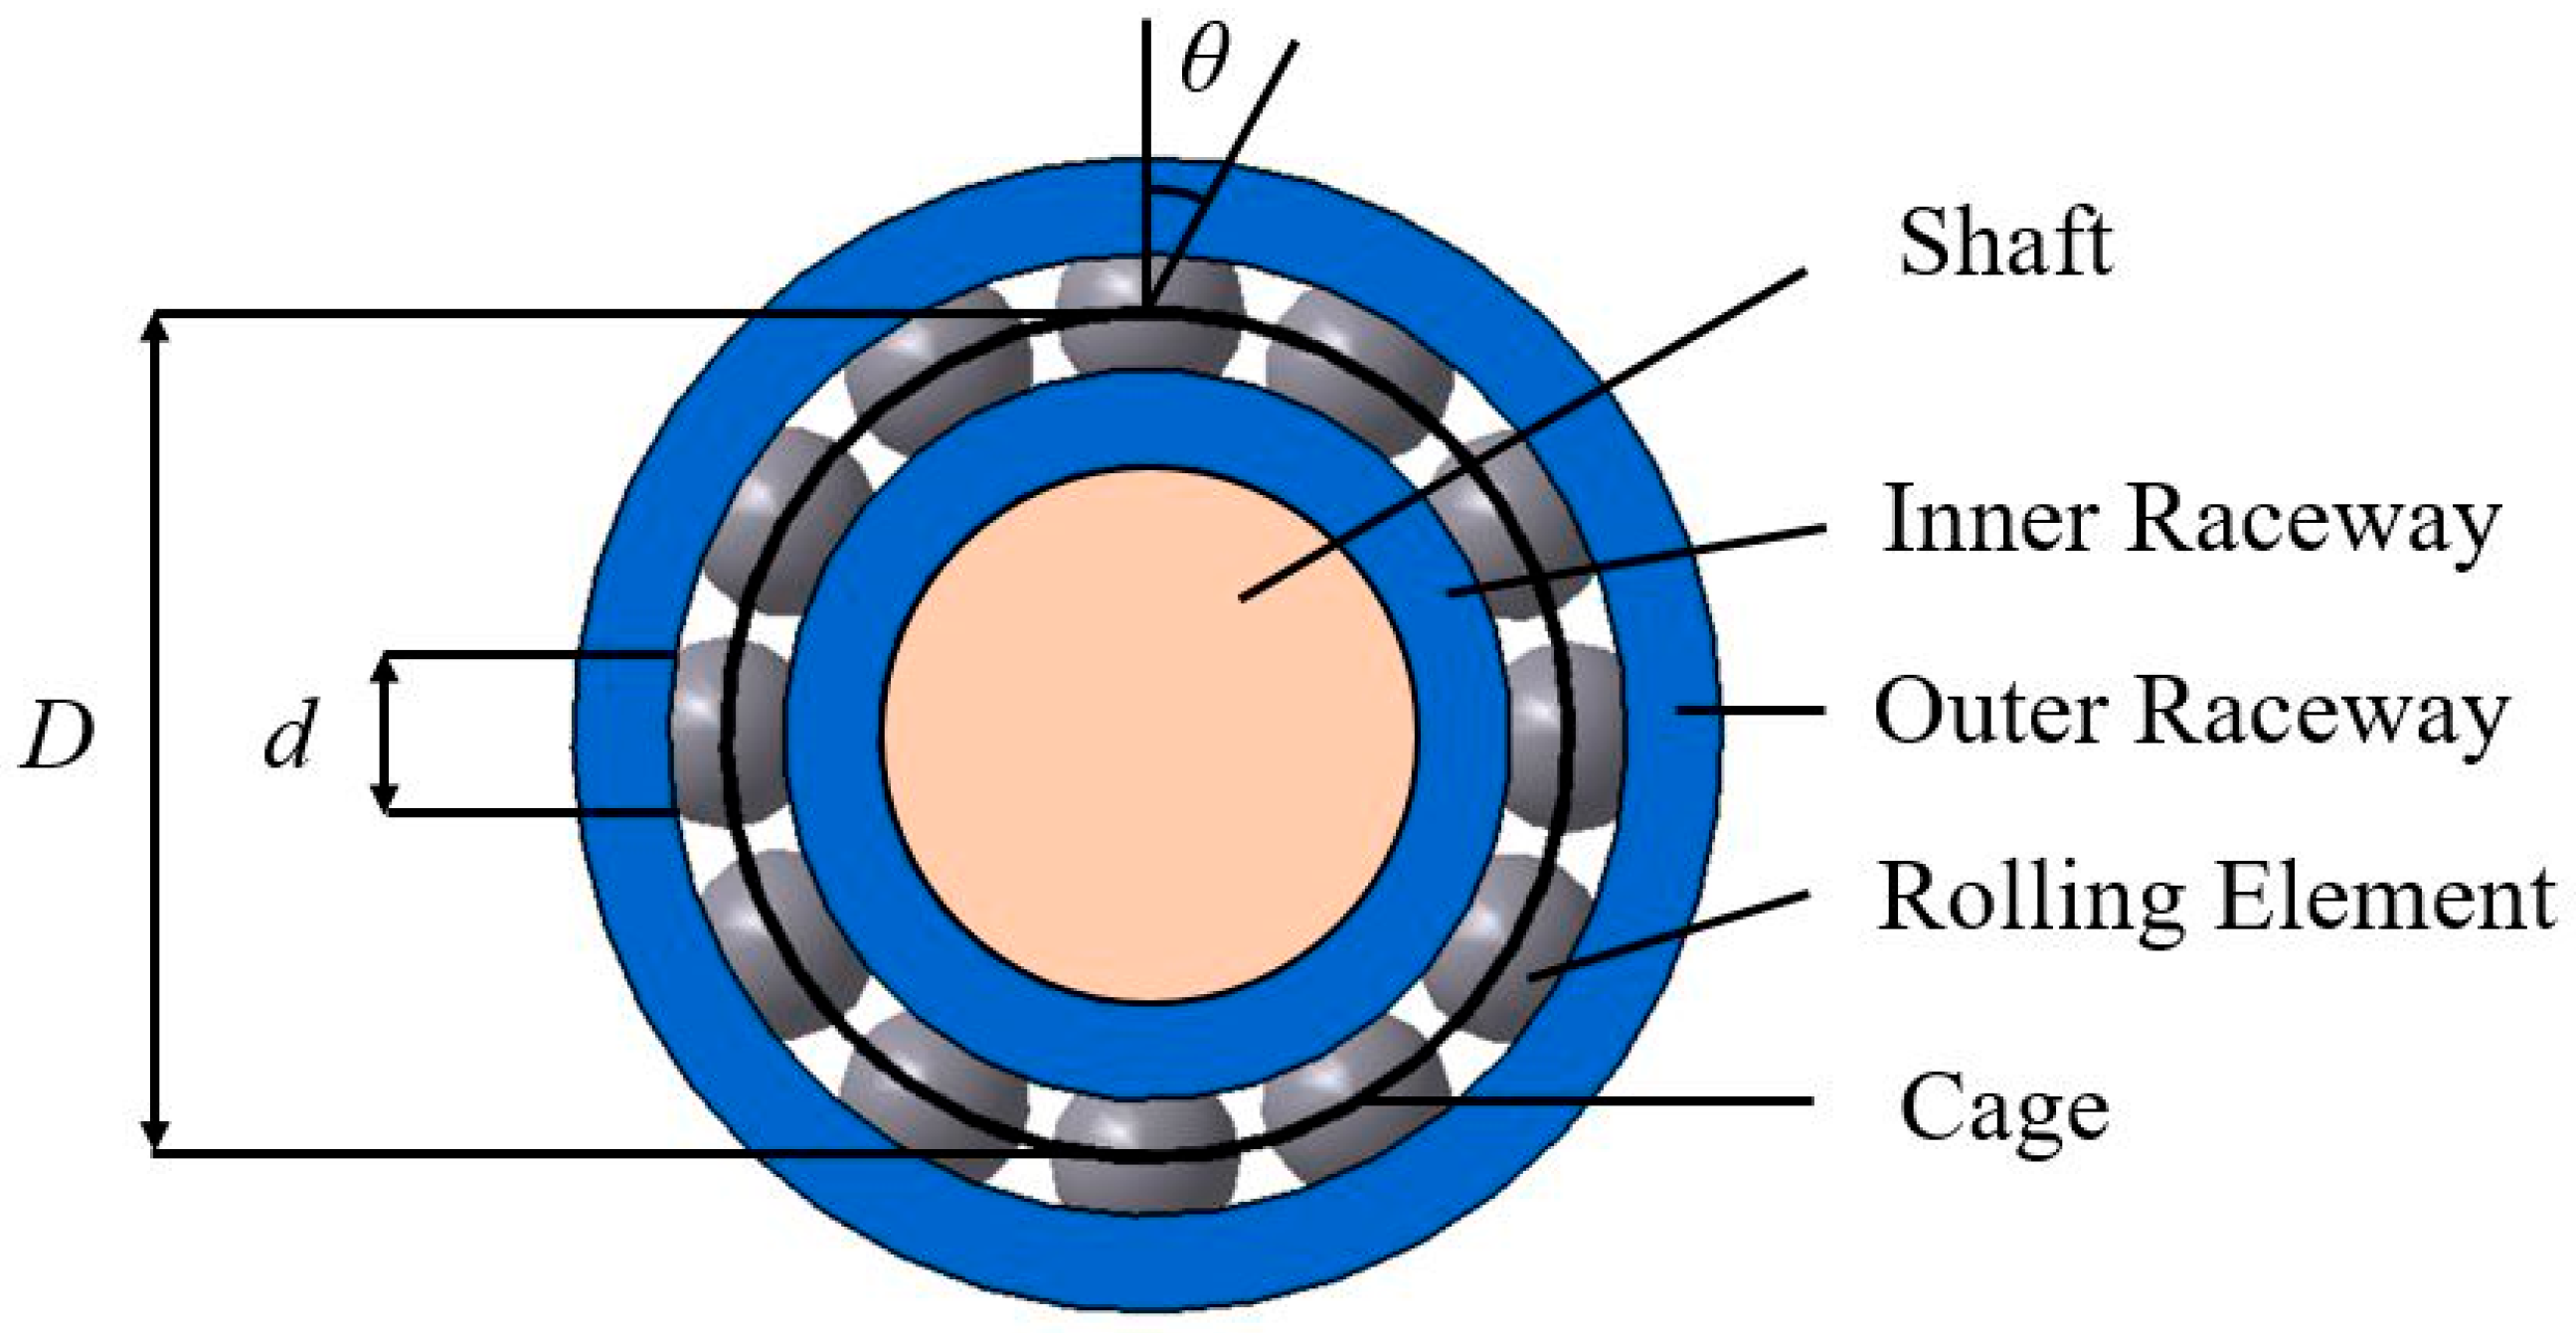
For instance, a fault may occur in either a bearing’s rolling elements or raceways. The impulse generated when the rolling elements (specifically, balls in this work) pass through the relevant fault location will repeat itself periodically with a fixed interval, namely, the fault period. In this respect, the fault period defines the minimum but complete unit window size in which one can record the bearings’ vibrational signals under the relevant fault. Therefore, the selected sample length L s should be equal to or slightly greater than this unit window size. The fault characteristic frequency of all bearing components (ball, outer raceway, and inner raceway) can be calculated with the help of Equations (1)–(3). Indeed, the cage is one of the key components of a bearing. Still, its equations are excluded because the datasets utilized in this study do not include any cage fault. Figure 3 illustrates the key components of a bearing and some nomenclature to make Equations (1)–(4) more explainable. In Figure 3, d represents the ball diameter, D implies the pitch diameter, and θ is the contact angle. Specifically, the term pitch diameter corresponds to the diameter of an imaginary circle that passes through the rolling elements’ centers and can approximately be computed as the mean of the outer and hub diameters. On the other hand, the term contact angle (θ) represents the angle that is formed where the rolling element makes contact with the outer or inner raceways. It also dictates how a bearing handles radial or axial loadings.
f O R = N 2 × f r × 1 d D × cos θ ,
f I R = N 2 × f r × 1 + d D × cos θ ,
f b a l l = D 2 × d × f r × 1 d D × cos θ 2 ,
L s 1 α × f s min f O R , f I R , f b a l l .
In the equations, the subscripts of OR and IR stand for outer and inner raceways. In this regard, N is the number of rolling elements (i.e., balls), and the fr is the shaft frequency. In Equation (4), the term fs represents the sampling frequency, while α (α ≥ 2) represents the sampling factor determined based on the Shannon theorem [26]. The term L s 1 is our first condition while defining the physics-guided sample length, and it sets the boundaries for the first limit. Still, we need to separate fault characteristics frequency peaks from different orders and fault locations. Based on this, Equation (5) presents the second limit that will set the boundary to ensure that the frequency resolution simultaneously differentiates diverse fault characteristic frequency peaks in the spectrum.
L s 2 = f s min f F C F × i f F C F × j ,
where the term fFCF represents one among all possible fault characteristic frequencies (fFCF ∈ {fball, fIR, and fOR}). Further, the symbols i and j represent the fault characteristic frequency orders, i, j = 1, 2, 3, …, n. Whichever is higher between L s 1 and L s 2 is the ultimate sample length. For example, Table 1 represents fault frequencies for the CWRU dataset [35]. If we multiply these values with the given shaft frequency (1797 rpm; 29.95 Hz), one can calculate fault characteristics frequencies for the relevant dataset using Equations (1)–(3). Having said that, Table 2 represents the first five orders of fault characteristic frequencies for the CWRU dataset. In the end, the physics-guided sample length was calculated as 21,060 (for example, L s 1 was 895 Hz) and 7400 [26,36] for CWRU and PU datasets, respectively.
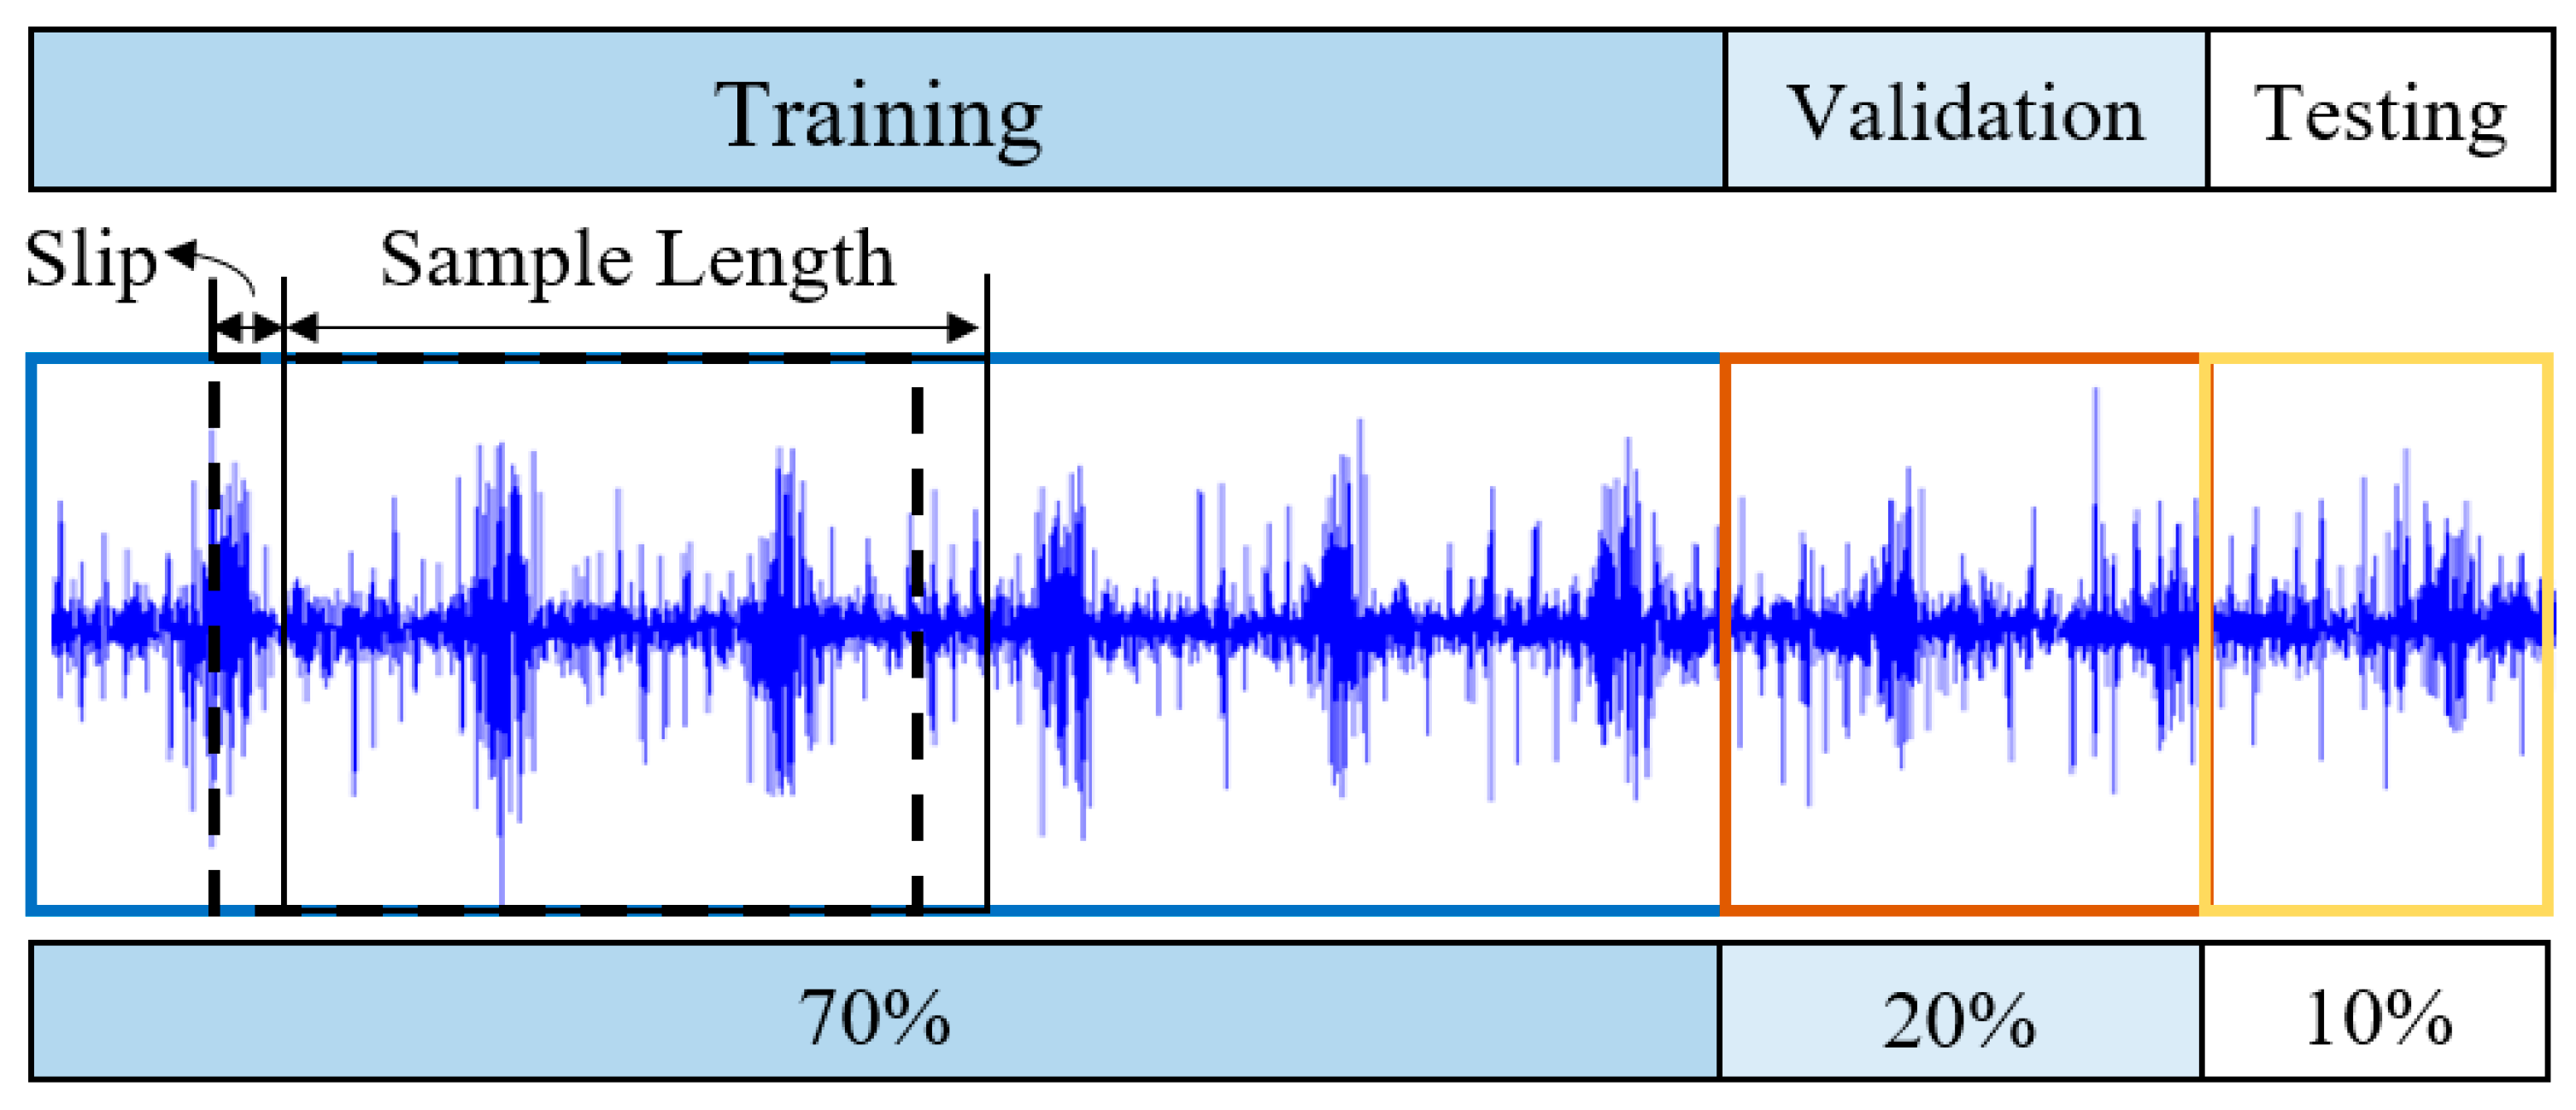
The present study utilized the slip approach while intercepting the original (full) raw acceleration data. The methodology is adopted from Ref. [2]. In this respect, a new sample was acquired by slipping the prior sample by a specific (see Equation (6)) distance.
s l i p = l p l s + 1 n s .
In Equation (6), the term lp denotes the length of data points of the raw signals, while ls represents sample length ( L s 1 and L s 2 ). Finally, ns is the number of samples. For example, assume we have 243,938 data points, and the sample length is 2048. In that case, the practitioner can set the slip value as 240 (≤241.89) to collect 1000 samples (training, validation, and testing) in the aggregate. To further elaborate, assume that the sample length is set to 2048. In this scenario, the user initially utilizes the first 2048 data points (ls) of the relevant signal to obtain the first sample, considering the first data point as the datum/origin. Then, the datum/origin is slipped by a specific distance (e.g., 240), and a new sample is acquired with a length of 2048 (whatever the defined ls is). Finally, the initial 700 samples that have been taken were used while creating the training dataset. The next (in the respective order) 200 samples were used to generate the validation dataset, while the last 100 samples were used to generate the testing dataset. Each sample was employed only once, and no sample in a specific set was shared with other sets [2]. Figure 4 illustrates this process.

2.3. The Proposed Optimized 1-D CNN-LSTM Method

2.3.1. Convolutional Neural Networks

A traditional CNN model consists of (1) an input layer, (2) hidden layer(s), which are the combination of one or multiple convolution and pooling layers, and (3) the fully connected (FC) layer. Next, the output layer benefits from a Softmax classifier to conclude the relevant classification task. In the convolution layer, either one or multiple kernels extract the fault-related features with the help of convolutional filters. In this regard, Equation (7) recaps the 1-D convolution as follows:
k 1 i = b i + w x i x = 1 m r x .
In Equation (7), the symbol k(i) stands for the extracted fault-related (balls, outer raceway, and inner raceway) features through the ith kernel. The term wx presents the weight of a kernel, while bi is the bias term. Finally, rx is the 1-D input of the model, and the term m is the number of the pertinent input’s (rx) data points. In the literature, it became a vivid alternative to place the CNN at the forefront (as an input) of an LSTM layer for extracting the sequence segments [17,19]. Having said that, the present research employed the rectified linear unit (ReLU) as the activation function in its CNN-associated part since the usage of ReLU tends to enhance the convergence speed [38].
The purpose of using pooling layers in a neural network is to retain useful knowledge while eliminating redundant data with the help of the sub-sampling process. In Ref. [39], Scherer et al. demonstrated that utilizing max-pooling over the average pooling layer may provide significant advantages to practitioners in terms of generalization. In light of these findings, this work adopts the max-pooling strategy to fulfill its ends (see Equation (8)).
p m a x l g ,   j = m a x j 1 v < u < j v t l g ,   u .
In Equation (8), the term tl(h,u) stands for the uth neuron of the gth feature map in the lth layer [2]. Furthermore, v presents the relevant kernel’s width, and the jth pooling layer is symbolized by j. Ultimately, one or multiple FC layers follow the hidden layer and unify the extracted fault-related features with the help of a weight matrix.

2.3.2. Long Short-Term Memory

The literature names the LSTM as an advanced type of recurrent neural network due to its ability to capture the whole history of a given time-series signal. Although recurrent neural networks typically suffer from the gradient explosion, LSTM overcomes this drawback by utilizing three gate units: forget, input, and output [40]. This modification lets the algorithm learn long-term dependencies (unlike recurrent neural networks) and enhances its classification accuracy. The functions of all three gates are represented mathematically in Equations (9)–(11).
f t = σ W i x t + V i h t 1 + b f ,
i t = σ W i x t + V i h t 1 + b i ,
o t = σ W o x t + V o h t 1 + b o .
In Equations (9)–(11), the term σ specifies the activation function, while t denotes the updating step. Further, the symbol W implies the input’s weight, the x is the input, and V, on the other hand, specifies the hidden layer’s weight. Finally, the term ht−1 represents the previous layer’s output, and b is the bias term. Equations (12) and (13), respectively, present the cell and hidden states mathematically to provide a complete picture. As the only non-described parameter, c stands for the cell state.
c t = f t c t 1 + i t tanh W c x t + V c h t 1 + b c ,
h t = o t tan h c t .
Although various types of optimizers like stochastic gradient descent, RMSProp, and AdaGrad have been utilized for bearing fault classification so far, the literature shows that the Adam optimizer outperforms others in many applications [12]. Based on this, the current study also employs the Adam optimizer to achieve its ends.

2.3.3. Proposed Methodology

This study benefited from two open-access benchmark datasets, namely the CWRU and PU datasets, to test the efficacy of its physics-guided optimized 1-D CNN-LSTM network. The former dataset was used to test the proposed method under constant operating conditions and classify four bearing health statuses (10 classes in the aggregate). With this said, this work utilized the latter dataset (PU) to test its algorithm under variable working conditions (shaft speeds) and classify three bearing health statuses (6 classes in the aggregate). The relevant fault classes and operating conditions will be detailed later. Relatively speaking, this study attempts to improve its model’s performance and makes the sample length selection process more explainable by incorporating physics. Therefore, the initial results were generated using a non-optimized baseline 1-D CNN to reveal the significance of integrating physics while determining the optimal sample length. The baseline sample lengths used for the relevant comparison were selected as 1024, 2048, and 4096, which the existing literature frequently utilizes [2,20]. The average classification accuracies obtained utilizing these sample lengths were then compared with those acquired using the physics-guided optimal value with the help of the baseline 1-D CNN model. A great body of research defines the sample length based on experience or the literature, ignoring the influence of critical factors such as the bearing configuration, sampling ratio, or the shaft speed. In other words, these studies are not able to explain why the selected input lengths are the most suitable for a given scenario. The present work eliminates these limitations by incorporating the fundamentals of physics while computing the optimal sample length to take sections from the signal containing information regarding all possible types of faults.
The non-optimized baseline 1-D CNN model includes five convolution and five pooling layers. The first three convolution layers have four filters with a kernel size of one. The last two, on the other hand, have eight filters with the same kernel size configuration. With this in mind, the baseline model uses the Adam optimizer and cross-entropy loss function. The initial (non-optimized) batch sizes, dropout ratio, and the number of epochs were set to 110, 0.55, and 10, respectively, following Ref. [26].
Table 3 represents the general structure of the proposed 1-D CNN-LSTM algorithm. In this respect, the structure of this 1-D CNN-LSTM model is exactly the same as the baseline 1-D CNN model introduced in the previous paragraph regarding the number of convolutional and pooling layers, the number of filters, and the kernel size. Adding an LSTM layer that includes 32 units was the only modification. This research intentionally kept the general structure alike to make the upcoming comparison between these two approaches more reasonable. Additionally, the following hyper-parameters were also optimized with the help of grid search within the defined search ranges [20]. Many studies in the literature focused more on optimizing the structural parameters, not the training parameters. In addition, although the optimization methods have begun to be utilized more frequently recently, the quantification of uncertainty in the model prediction has been overlooked. The proposed method also attempts to reduce the epistemic uncertainty using the grid search.
  • Batch size: 32~256;
  • Dropout rate: 0.3~0.6;
  • Number of epochs: 10~50.
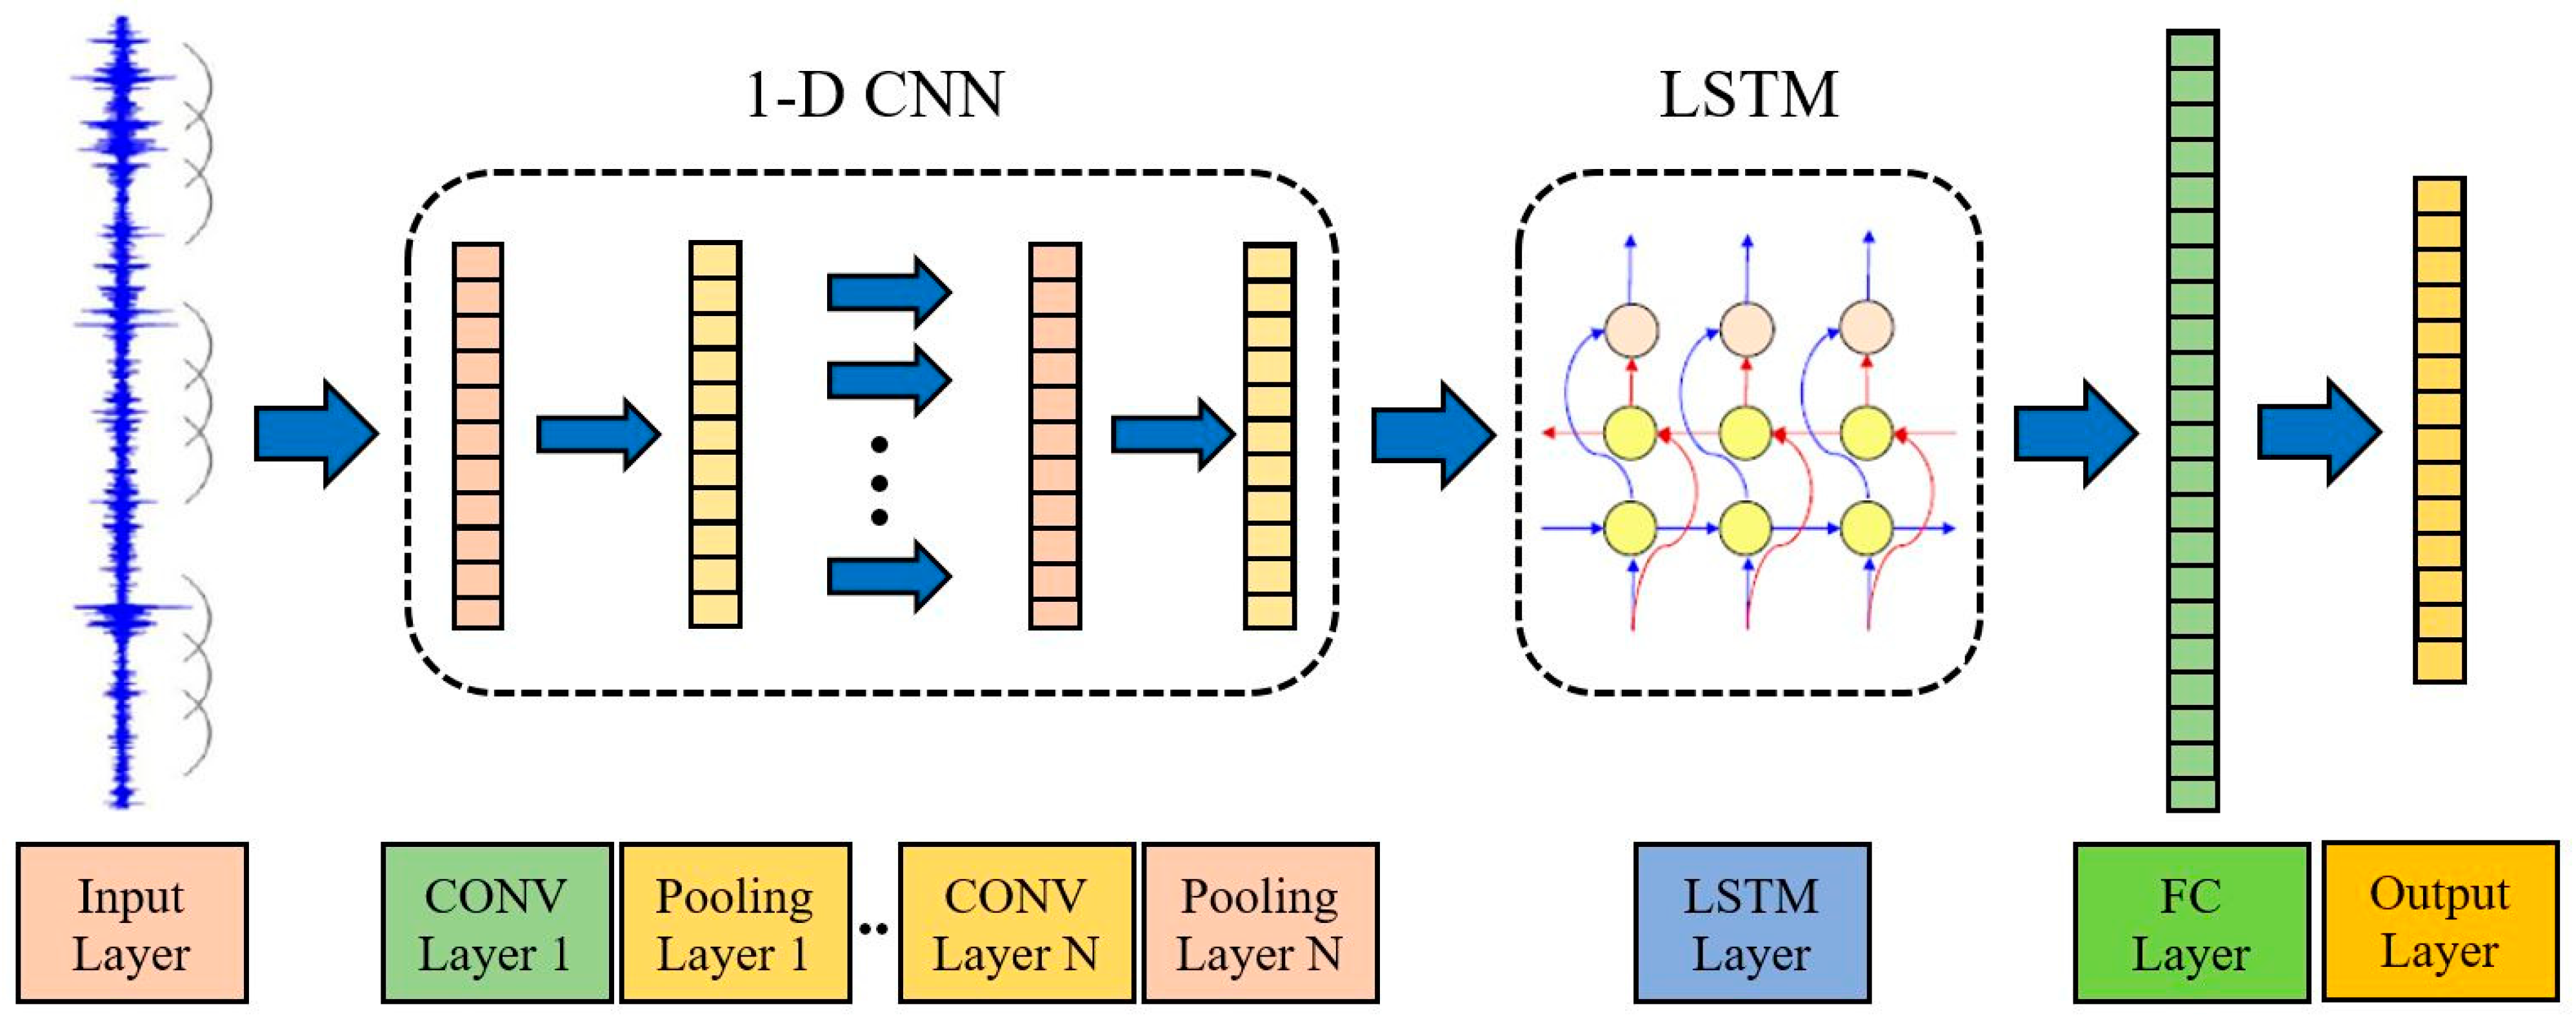
The proposed 1-D CNN-LSTM network also utilizes the Adam optimizer and cross-entropy loss function thanks to their high generalization abilities and convergence speeds [38]. As an additional note, the non-optimized 1-D CNN-LSTM architecture uses the same batch size, dropout rate, and number of epochs as the baseline 1-D CNN. For each model, the present work generated 1000 samples for the CWRU dataset and utilized 70% (700) of it for training, 20% (200) for validation, and 10% (100) for testing. As we have selected ten classes for this dataset, the final number of samples was 7000, 2000, and 1000, respectively. These values were 4200, 1200, and 600, respectively, for the PU dataset, as this study dealt with six classes in the aggregate for the pertinent dataset (see Figure 4). In summary, Figure 5 visualizes the proposed 1-D CNN-LSTM model, while Table 4 and Table 5 recap the classes identified for both datasets, along with some supporting numbers. The terms BF, IRF, and ORF stand for the ball, inner raceway, and outer raceway faults, respectively. In Table 5, terms 1500 and 900 indicate the relevant shaft speeds (rpm). As a note, this work utilized the time-domain raw vibration signals as the input while feeding its DL-based networks.

2.4. Uncertainty in Machine Learning

Uncertainty is a vital notion within the DL methodology [34]. Using explainable and trustworthy artificial intelligence networks will not only enhance the accuracy of predictions but will also make the relevant algorithms more interpretable. The main purpose of considering and minimizing uncertainties in the prediction is to generate more consistent results or, in other words, enhance reliability [41]. Having said that, epistemic uncertainty can be handled by gathering more information regarding the given system with the help of (1) collecting more data, (2) interval analysis, (3) hyper-parameter optimization, and (4) sensitivity analysis. Therefore, the present research utilized a grid search-based optimization method to reduce the epistemic uncertainty. Equation (14) shows how one can disentangle the total uncertainty into aleatory and epistemic portions. As a reminder, this work did not touch on the aleatory but attempted to minimize epistemic uncertainty.
σ * 2 x = E i σ i 2 x A l e a t o r y + V a r i [ μ i ( x ) ] E p i s t e m i c .
In Equation (14), the term σ * 2 represents the predictive uncertainty (variance), while E is the expected value. Finally, the term μ symbolizes the mean value [42].

3. Results

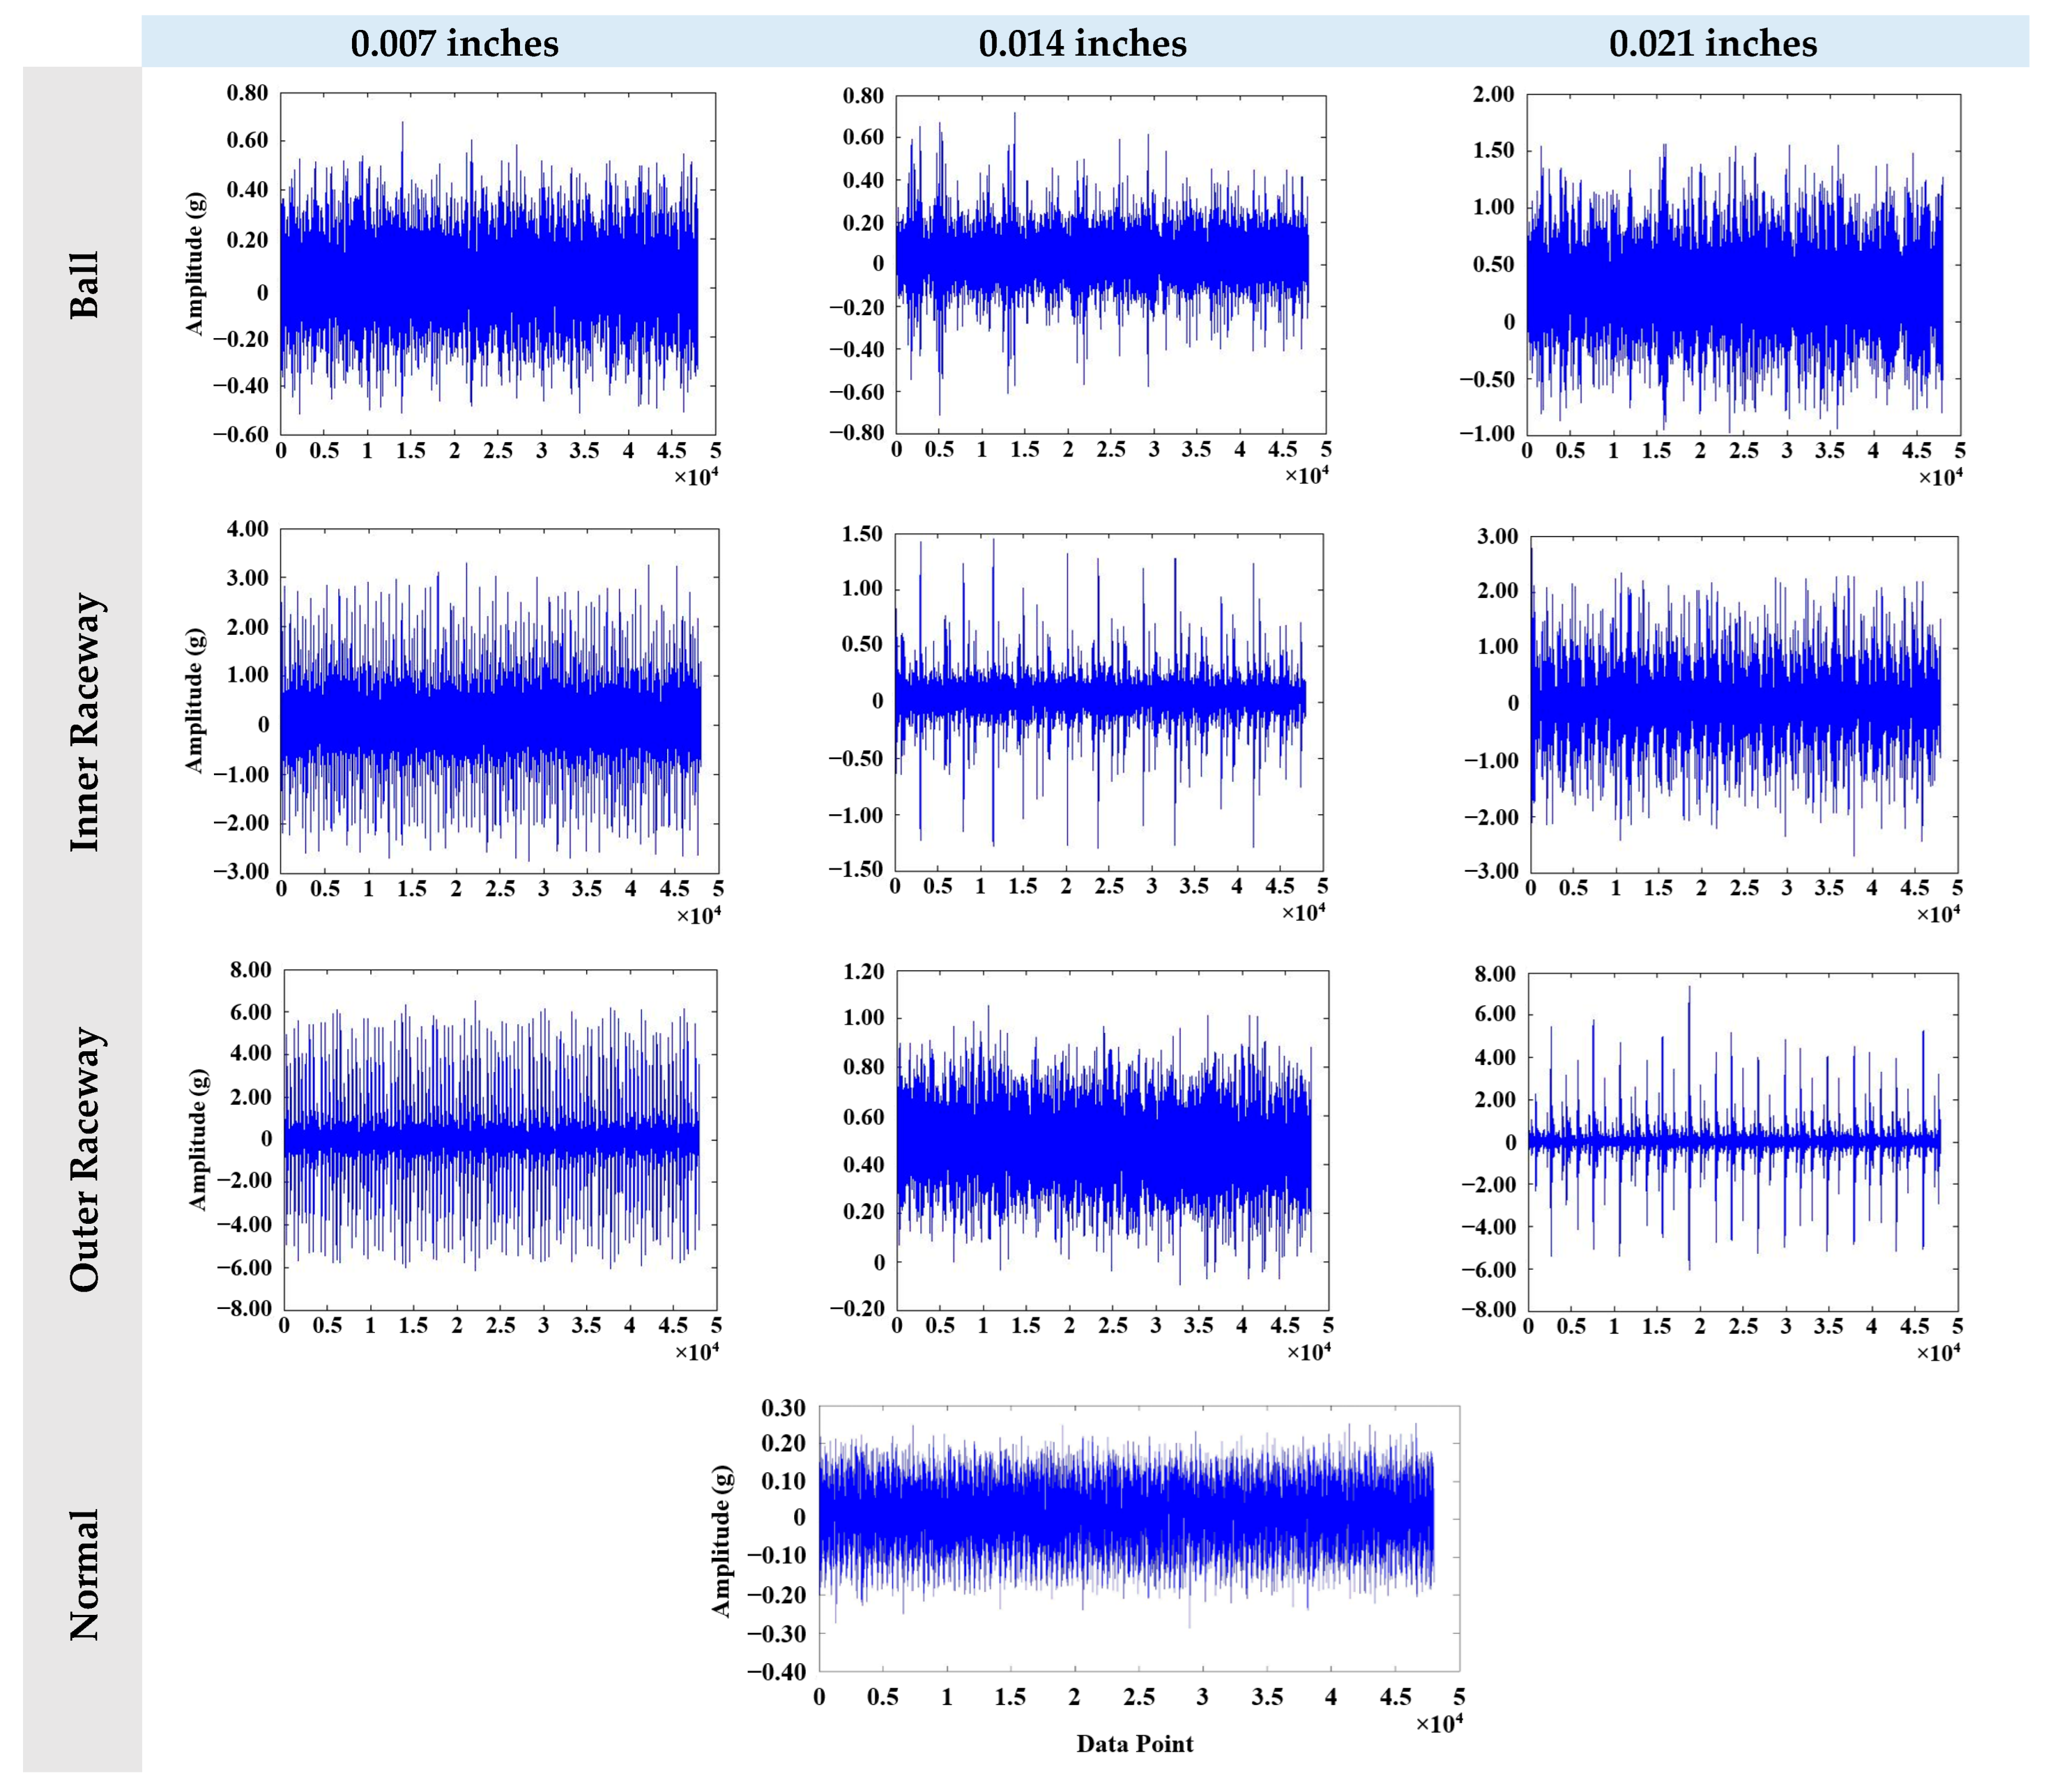
The present study extracted 10 and 6 vibration signals (classes) from the CWRU and PU datasets, respectively, to achieve its ends. This section will first introduce the pertinent signals for readers to perceive the input of the DL-based method visually. Figure 6 demonstrates the vibration signals extracted from the CWRU dataset, considering different fault locations and diameters.
Based on this, one can conclude that the amplitudes of the vibration signals increased in the presence of any bearing fault. Moreover, the relevant variation has its own pattern and characteristics for each fault location. As a note, the vibration data represented solely denote the first 48,000 data points (sampling ratio) for the relevant health condition to ease tracking (see Figure 6).
Figure 7, on the other hand, presents vibration signals extracted from the PU dataset. The primary focus while dealing with this dataset was to evaluate the influence of different shaft speeds (operating conditions) and fault modes on the classification accuracies of the utilized DL-based networks. Like the CWRU dataset, the time-series acceleration data are represented for the PU dataset, considering the first 64,000 data points (sampling rate). As expected, the amplitude of the vibration signals increased as the shaft speed increased.

3.1. Input Length

This work benefited from physics-based fault characteristic frequencies for each dataset to calculate an optimal input length (window size). Still, the present study first used a baseline 1-D CNN model to compare the influence of different input lengths on the fault classification accuracy rather than blindly saying that the proposed values are the best. In this respect, the influence of the calculated physics-based input lengths (21,060 and 7400) was assessed by comparing them with other commonly used values (1024, 2048, and 4096) in the literature [2,26]. Emphasizing that employing a constant (the same) input length for different datasets, as widely preferred in the literature, (in a sense) overlooks the dynamic characteristics of divergent datasets is also noteworthy.
Table 6 presents the classification accuracies acquired utilizing the baseline 1-D CNN model for the CWRU and PU datasets. Again, the purpose was to demonstrate the effects of selecting the correct (or optimal) input size on the model performance. Each experiment was repeated four times to mitigate the randomness in the testing results [38].
The results indicated that the overall classification accuracy of the baseline 1-D CNN model was enhanced when the optimal lengths were used for both datasets. Specifically, Table 6 reveals that the overall accuracy increased by up to 12.749% for the CWRU dataset. With this said, the same value was reckoned as 27.649% for the PU dataset. Based on these results, this research benefited from the optimal lengths (21,060 and 7400) while generating its DL-based outputs thereafter (the optimized 1-D CNN-LSTM, etc.).
As a supplementary result, the loss-versus-epoch and accuracy-versus-epoch graphs of the best-performing tests among the four tests for the PU dataset are presented in Figure 8. The aim was to provide more insights regarding the impact of using the input size determined based on physics. The findings demonstrated that the baseline 1-D CNN model converged faster and reached notably higher accuracy for the scenario where the user assigned the input size as 7400. In Figure 8, the present research only benefited from validation loss and validation accuracy values to provide an example.

3.2. Evaluation of the Proposed Optimized 1-D CNN-LSTM Model

The performance of the proposed optimized 1-D CNN-LSTM algorithm was assessed by comparing its average classification accuracy with other state-of-the-art methods, such as non-optimized 1-D CNN, non-optimized 1-D CNN-LSTM, and the optimized 1-D CNN algorithms. In addition, the variation in the model-related epistemic uncertainty was comparatively investigated by interpreting the pertinent value calculated before and after the optimization (see Equation (14)). Table 7 and Table 8, respectively, report the findings obtained for the CWRU and PU datasets. In these tables, the “Parameters” column was ordered in the following manner: [Epochs; Batch Size; Dropout Rate]. For non-optimized algorithms, the hyper-parameters designated in Section 2.3.3 [10; 110; 0.55] were utilized [26]. On the other hand, the outputs of the grid search determined the optimal parameters within the search space for the optimized 1-D CNN and 1-D CNN-LSTM. The aim of the optimization process was to maximize the accuracy or, in other words, minimize the loss [20].
The matter of calculating epistemic uncertainty may need further clarification as one should have multiple mean values to calculate it (see Equation (14)). The present research divided its four tests for each model into two groups by pairing the first two and the last two. For example, for the 1-D CNN (CWRU), the mean of the first two (μ1 = 0.92) and the last two tests (μ2 = 0.946) were used to calculate the mean of mean values (μm = 0.933). Even though the present study also calculated the same values with the help of more tests (ensemble and sample), only the values obtained for four tests are presented in Table 7 and Table 8 for conciseness, as adding more tests did not change the ultimate conclusion of applying optimization makes the predictions more consistent and reduces epistemic uncertainty.
The present study concluded the following based on Table 7 and Table 8:
  • If we compare the non-optimized cases, the 1-D CNN model outscored the 1-D CNN-LSTM regarding its overall accuracy for both datasets. The difference was 13.365% in favor of 1-D CNN for the CWRU dataset, while the difference was 5.893% for the PU dataset. Still, one should remember that these structures were run considering a baseline model [10; 110; 0.55], and, for the CWRU dataset, the 1-D CNN-LSTM algorithm needs more epochs to enhance (or maximize) its performance.
  • Following the optimization, the average accuracy of the 1-D CNN algorithm was enhanced by around 5.359% and 2.140% for the CWRU and PU datasets, respectively. The increment in performance seems to be low for the PU dataset, as even the baseline algorithm performed relatively well for this dataset (>95%).
  • A considerable performance increment was observed in favor of the 1-D CNN-LSTM model following the optimization process. The pertinent improvement was 20.717% and 8.523% for the CWRU and PU datasets, respectively.
  • Following the optimization, the models’ performance became notably stable and consistent. This enhancement can also be seen in minimal epistemic (model-related) uncertainties. The translation of the relevant improvement is that the models’ accuracy deviates each time the user runs the code, but the deviations happen within a narrow band. Therefore, incorporating optimization enhances the trustworthiness of the predictions [34,42]. Its impact was the most on 1-D CNN-LSTM for both datasets.
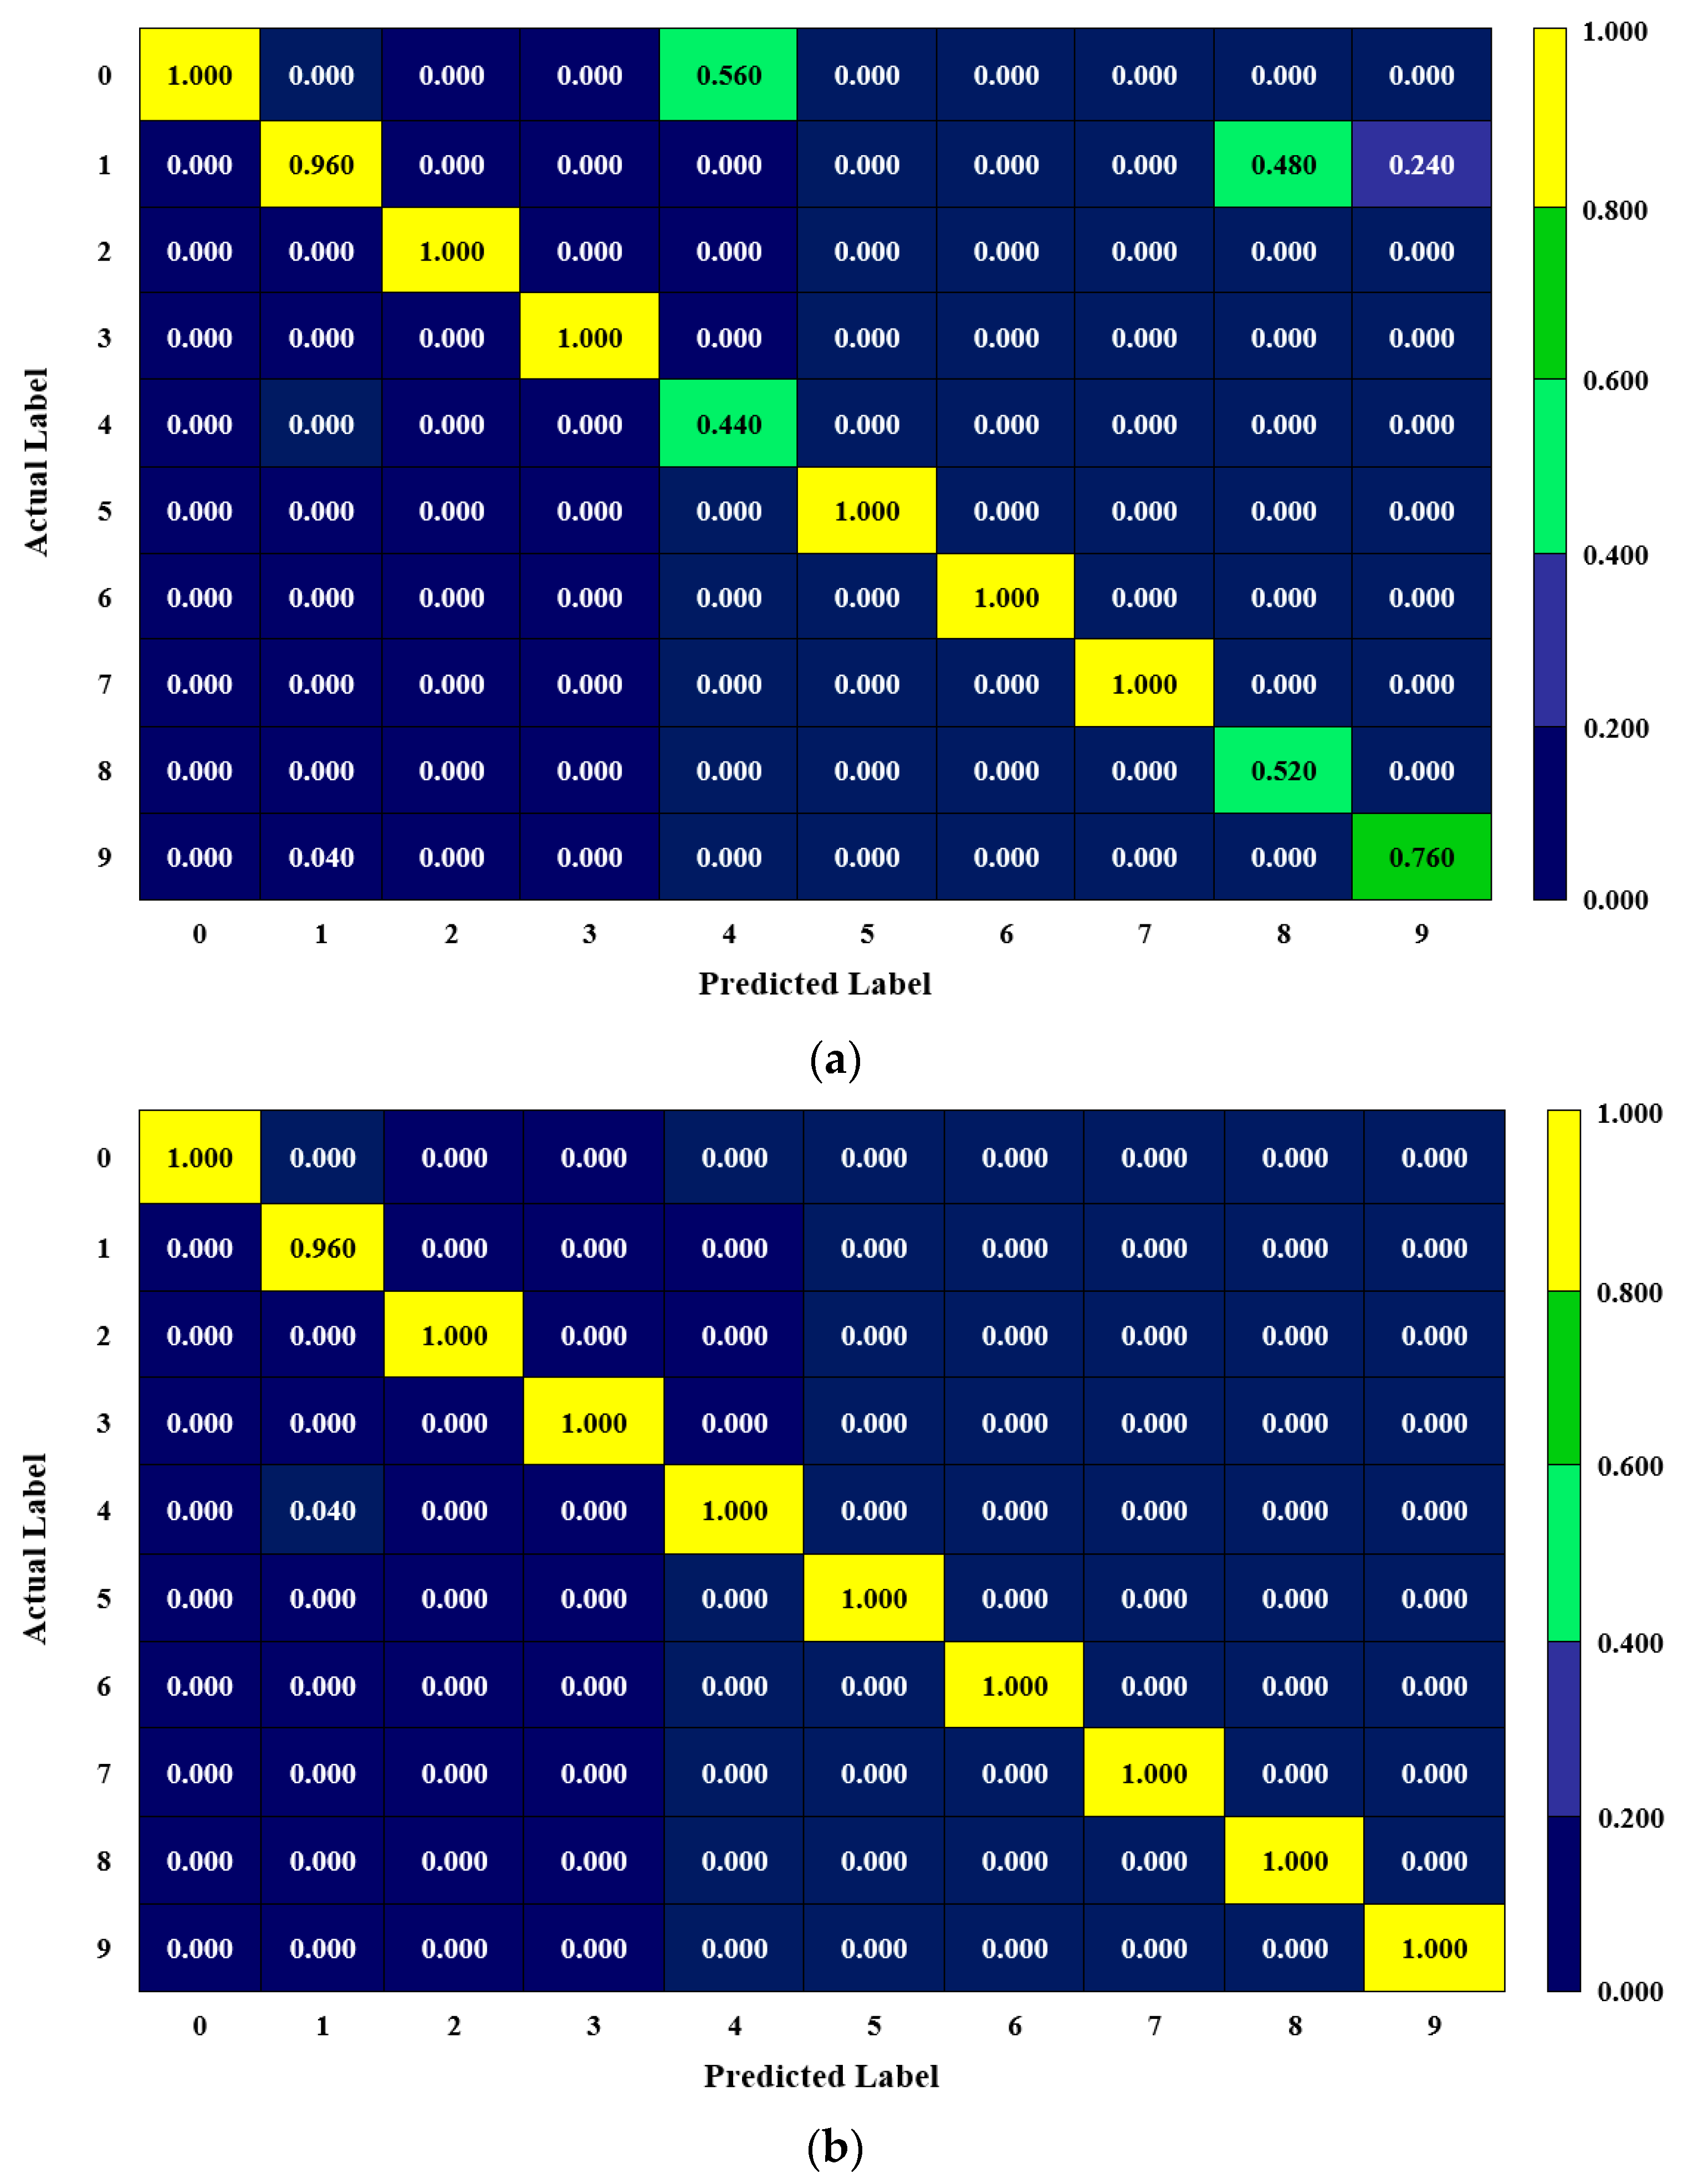
Following this part, the present work plotted the confusion matrices for its 1-D CNN-LSTM-related results for both datasets, as evaluating the LSTM-based models was the primary concern. In this respect, the confusion matrices were generated in this paper for only the best-performing tests among the four trials, considering conciseness. For instance, the confusion matrices were plotted for “Test-2” (86.800%) and “Test-3” (99.600%) for the non-optimized and optimized 1-D CNN-LSTM structures, respectively, for the CWRU dataset. In this respect, Figure 9 represents the confusion matrices plotted for the best-performing tests (Test-2 and Test-3) for the CWRU dataset.
For the non-optimized model, Figure 9 shows that the 1-D CNN-LSTM model experienced a notable confusion between Label 0 (Normal) and Label 4 (0.007″ IRF), and Label 1 (0.007″ BF) and Label 8 (0.014″ ORF). It was also observed that the non-optimized model faced confusion while classifying Label 1 (0.007″ BF) and Label 9 (0.021″ ORF) but with a relatively minor error. In the end, the classification accuracy acquired for this test (Test-2) was 86.800%. For the optimized case, the proposed physics-guided 1-D CNN-LSTM algorithm performed significantly well in classifying divergent bearing health conditions. The model only had confusion between Label 1 (0.007″ BF) and Label 4 (0.007″ IRF), resulting in an accuracy of 99.600%. As a note, it is evaluated that the non-optimized model’s relatively poor performance was due to its necessity for more epochs to converge [5,38].
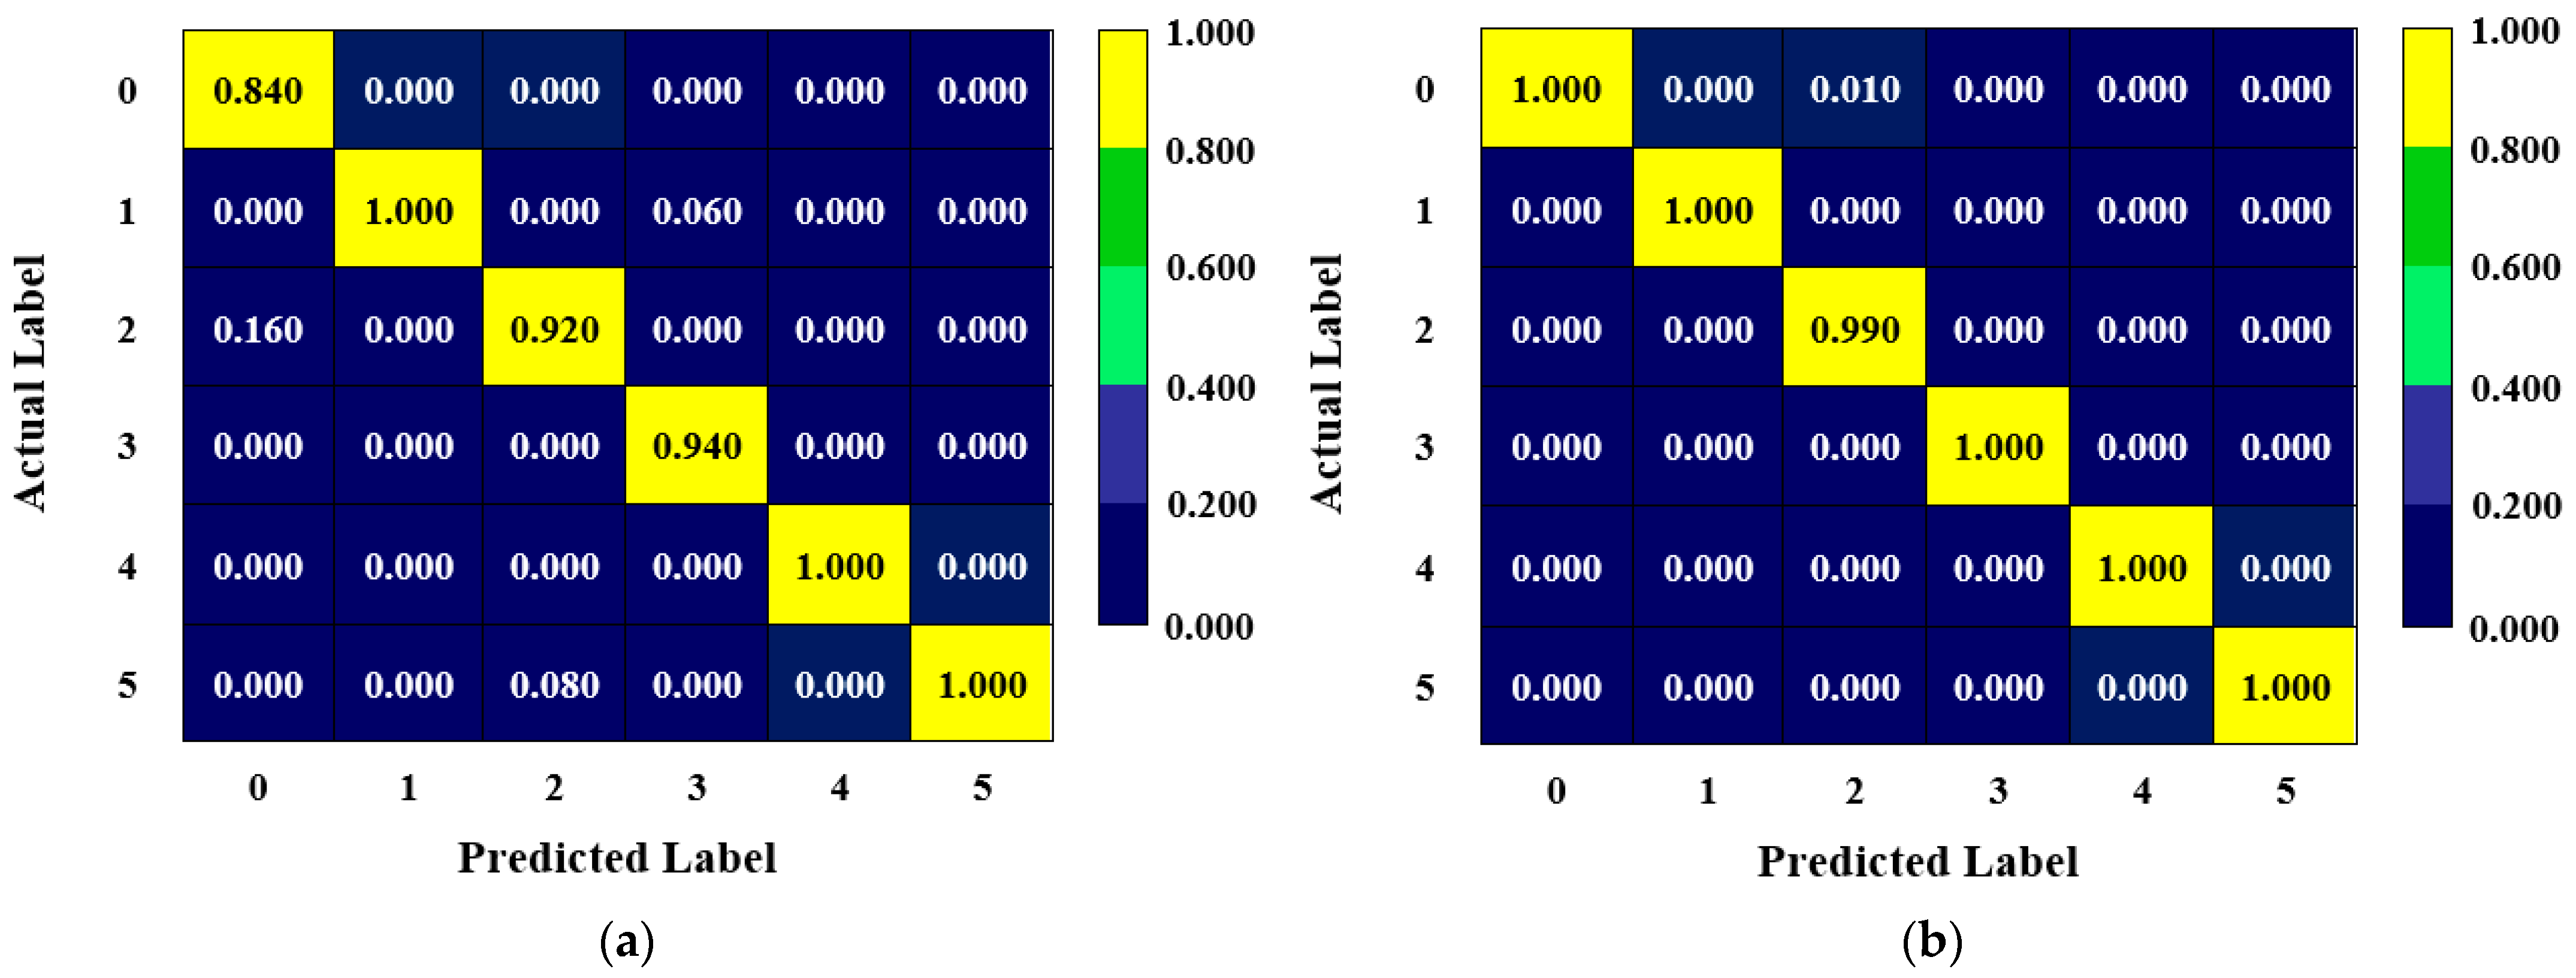
Figure 10 denotes the same results for the PU dataset. As a reminder, Test-4 and Test-2 were the best-performing tests for non-optimized and optimized 1-D CNN-LSTM models within this dataset (see Table 8). Figure 10a shows that the non-optimized version of the 1-D CNN-LSTM experienced confusion between Label 0 (Normal @ 1500) and Label 2 (IRF @ 1500). The second relatively major confusion was between Label 2 (IRF @ 1500) and Label 5 (ORF @ 900). Still, the structure reached a classification accuracy of 95.000%, even for the non-optimized architecture. Lastly, the physics-guided optimized 1-D CNN-LSTM model had only a minor confusion while classifying Label 0 (Normal @ 1500) and Label 2 (IRF @ 1500), resulting in an accuracy of 99.833% in the aggregate (see Table 8).
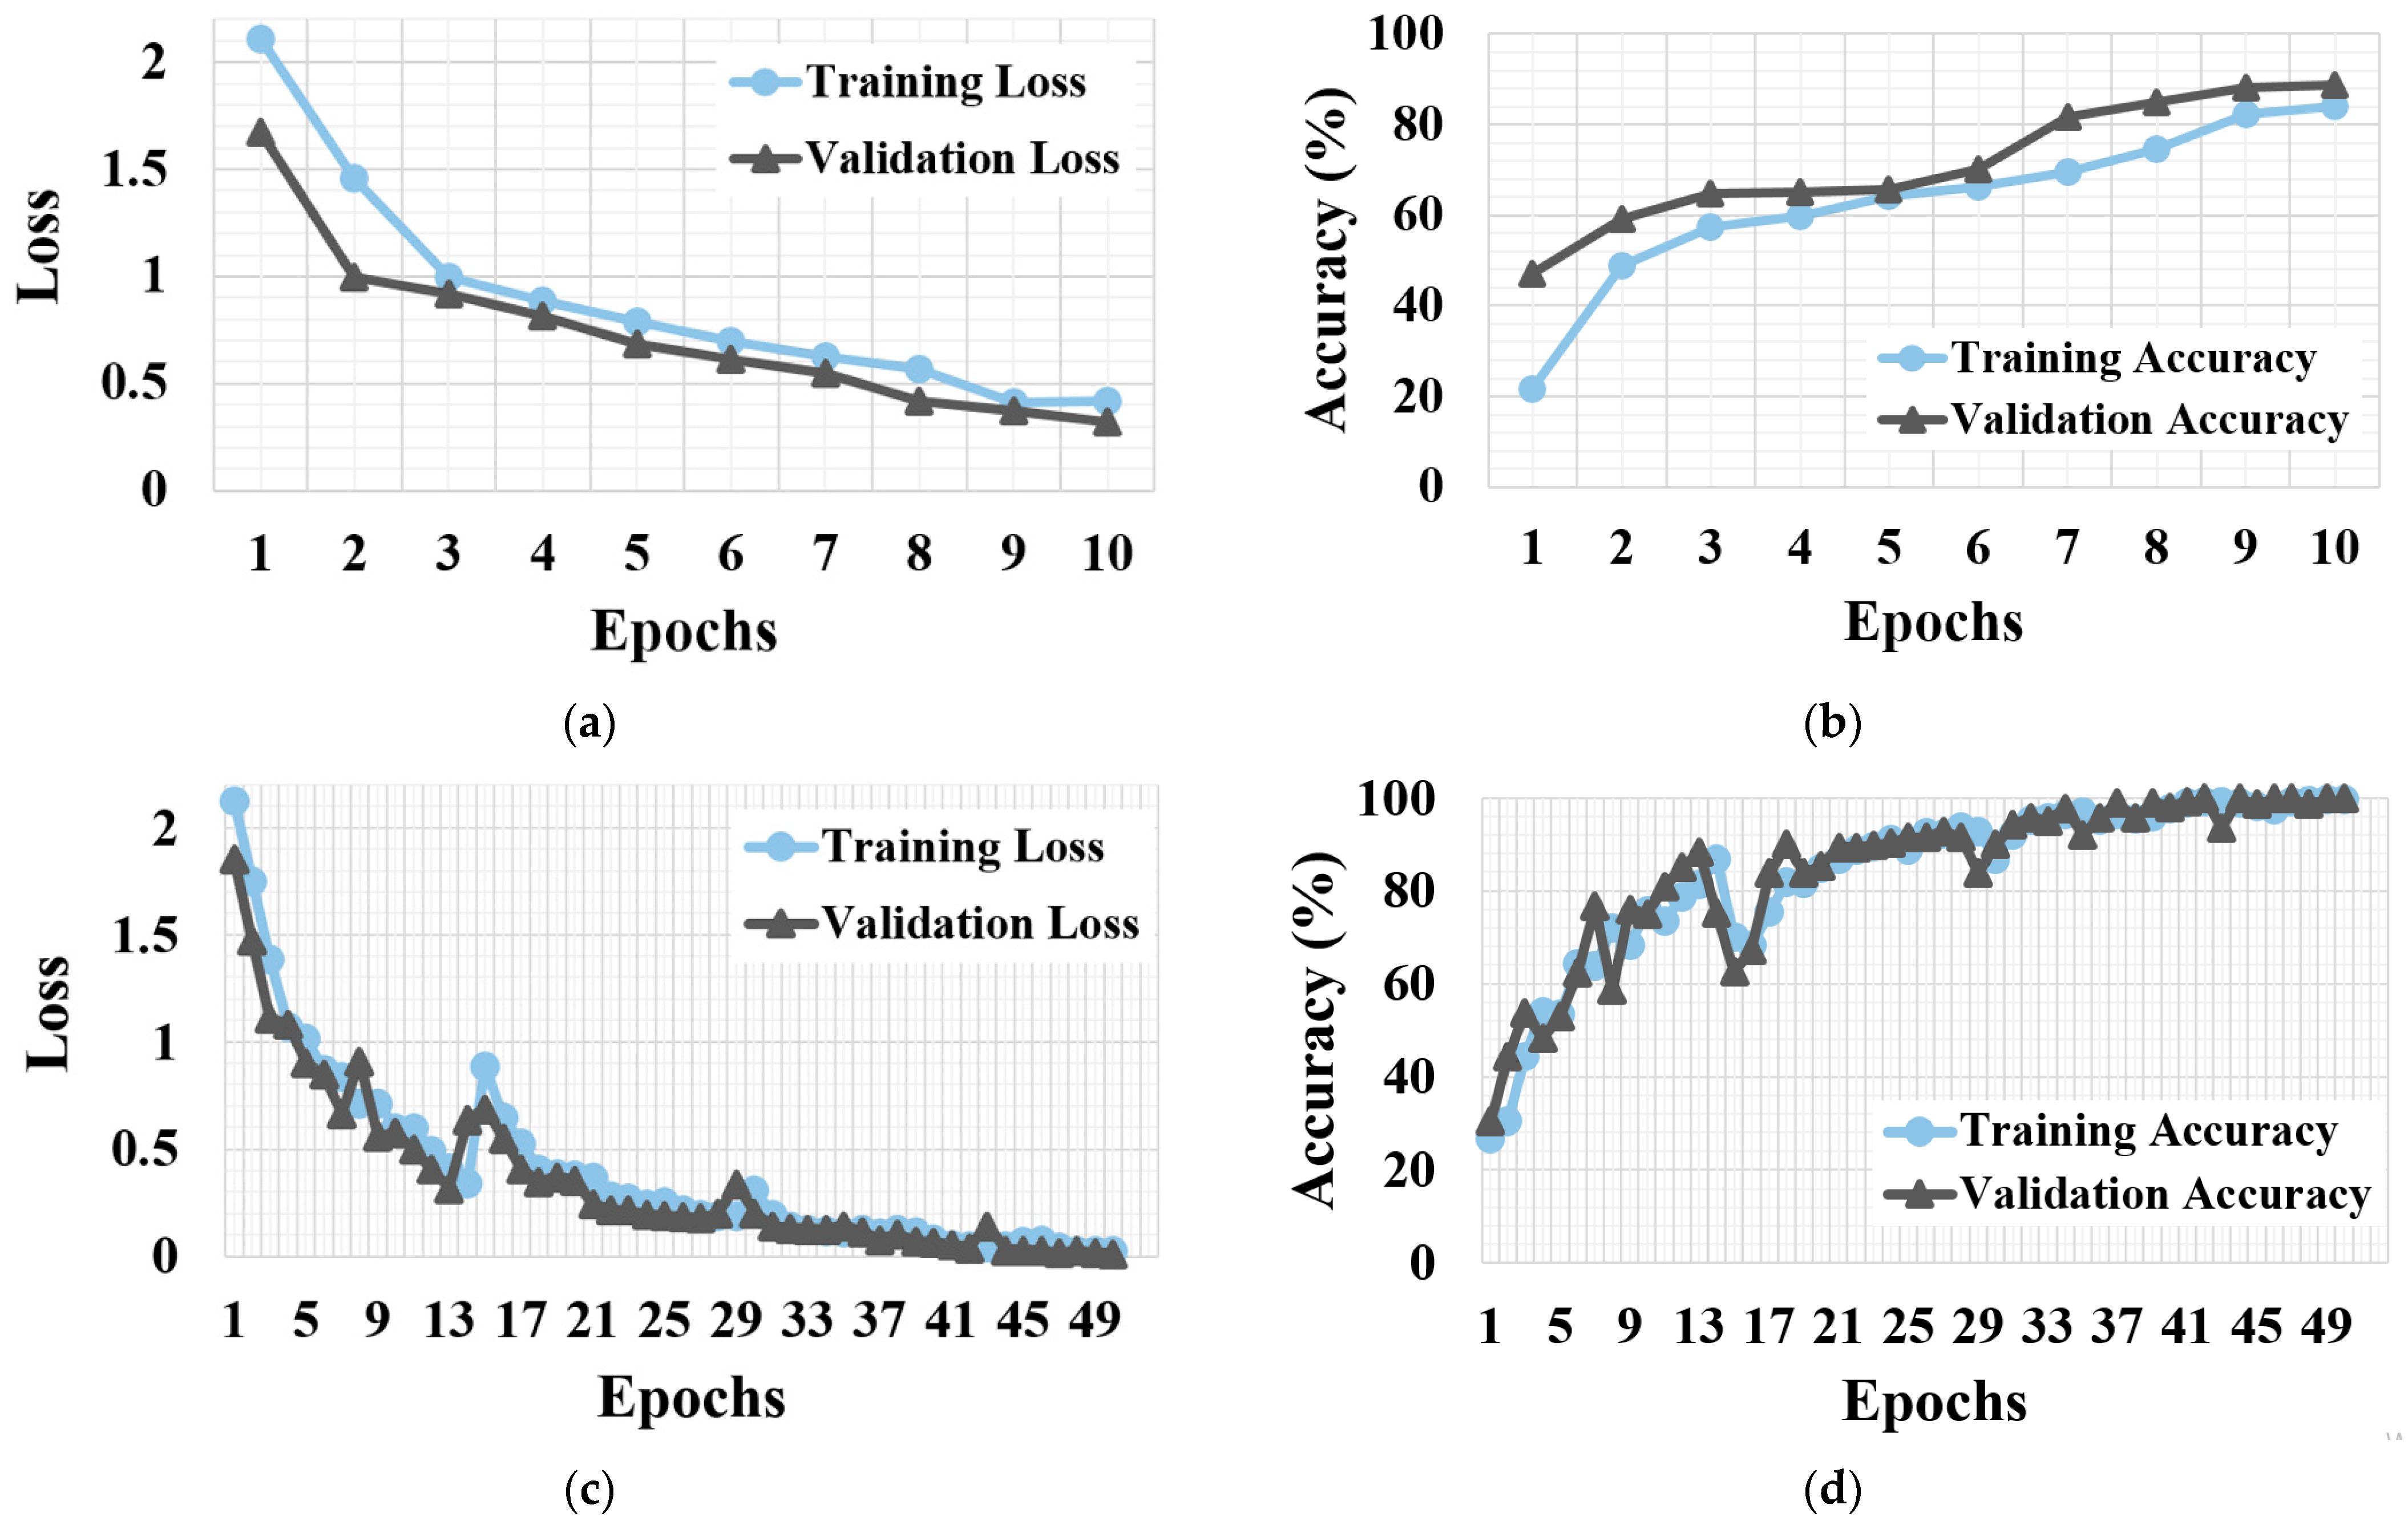
This work also plotted the loss and accuracy curves acquired for the best-performing tests detailed in Figure 9 and Figure 10. Again, the comparison was between the non-optimized and optimized 1-D CNN-LSTM structures within both datasets. In this respect, Figure 11 and Figure 12, respectively, denote the loss-versus-epoch and accuracy-versus-epoch graphs for the CWRU and PU datasets. In all figures, one can notice that the accuracy has improved, and the loss value decreased as the number of epochs increases. Figure 11 and Figure 12 showed that using optimization also contributed to the models’ performance. The proposed algorithm has especially converged faster for the PU dataset following the optimization.
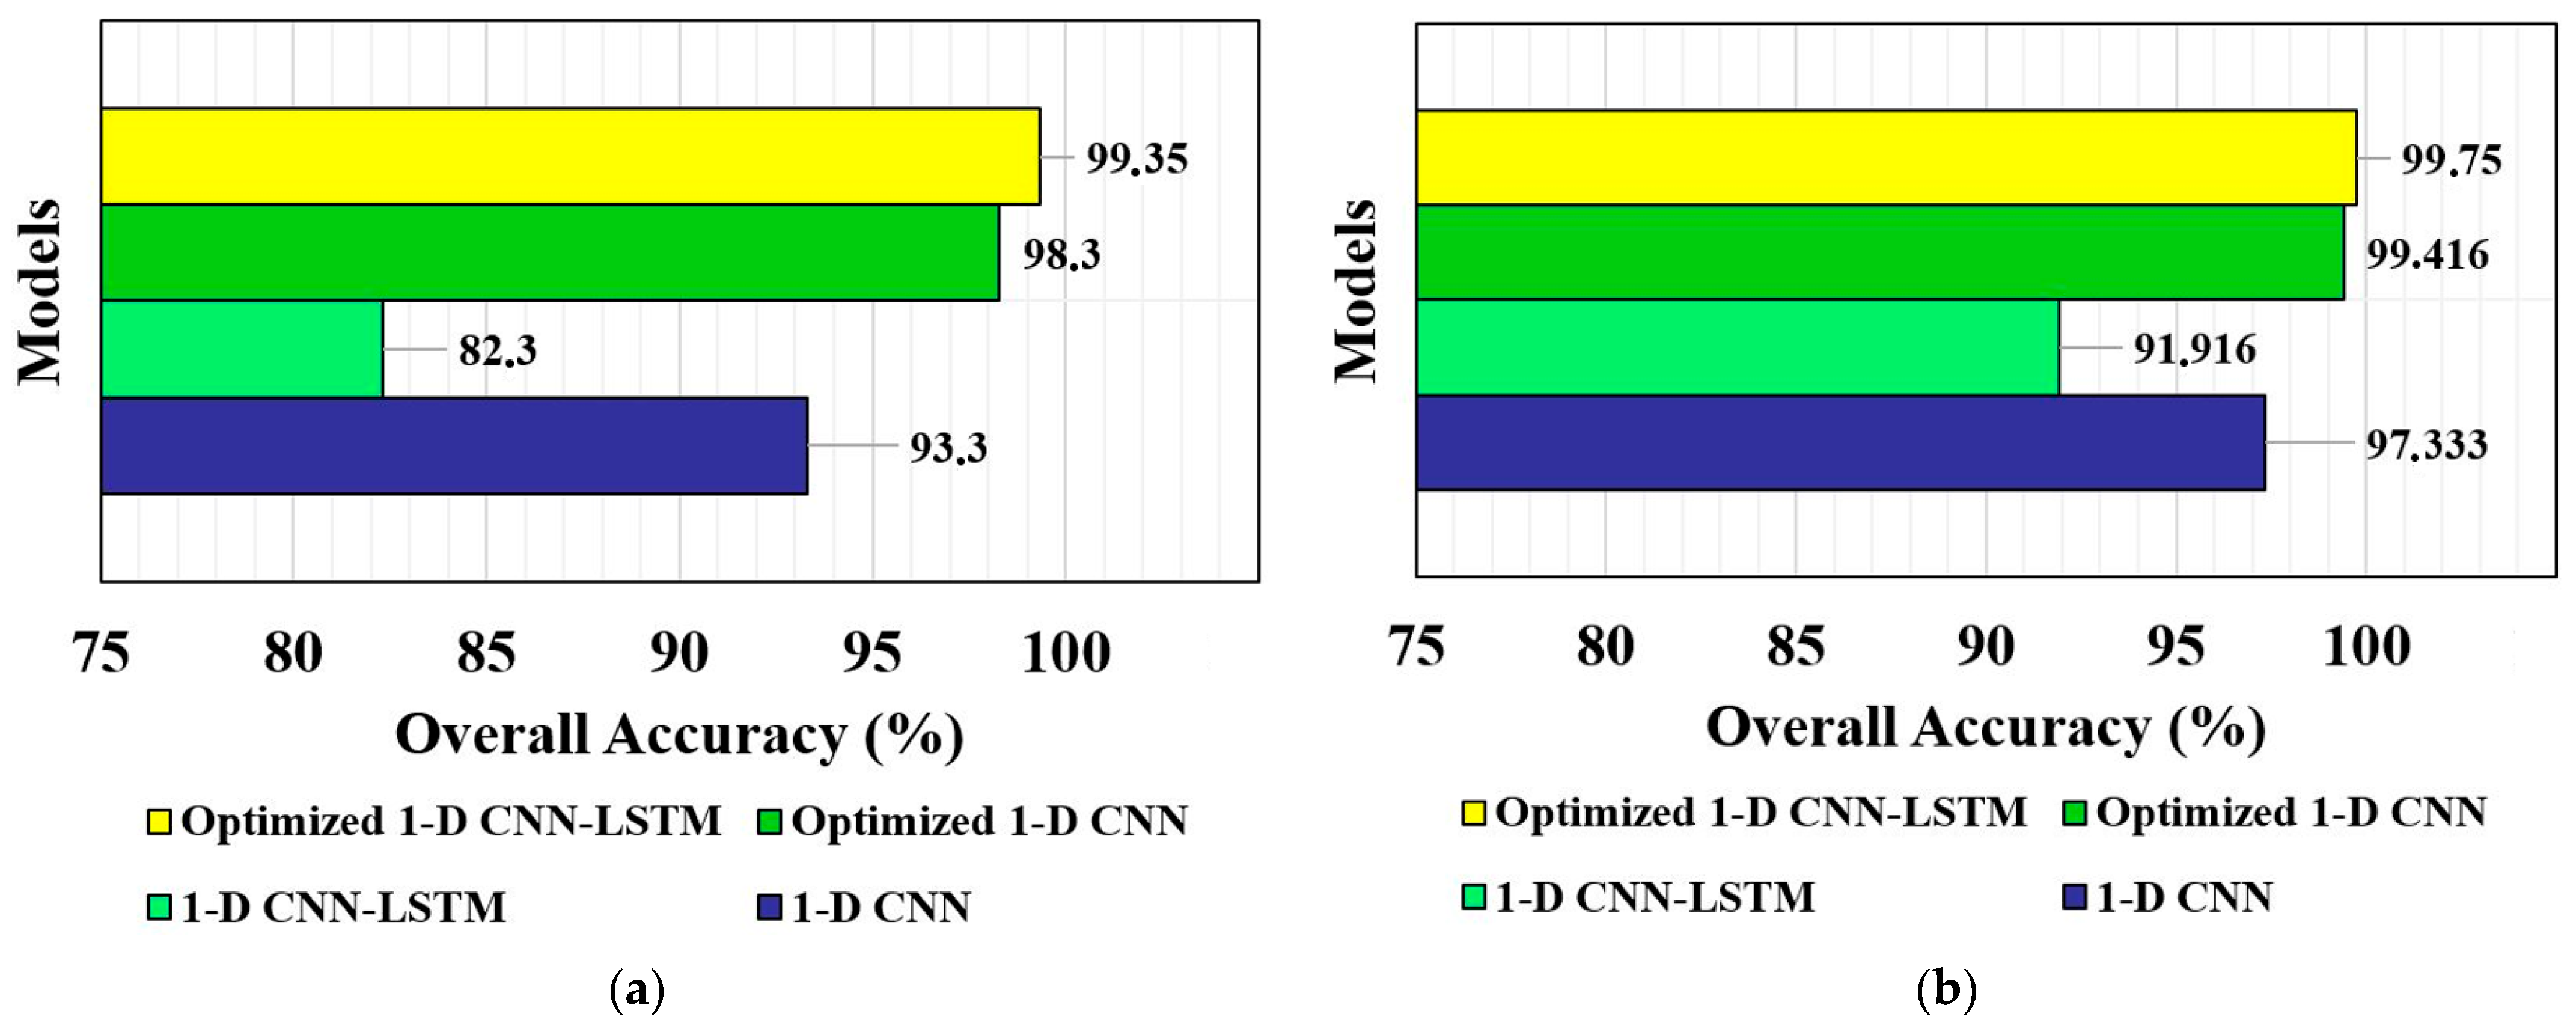
Before finalizing this section, Figure 13 also recaps the information provided in both Table 7 and Table 8 and visualizes the overall classification accuracies acquired for each model with bar charts. The purpose was to ease tracking for readers. In conclusion, the proposed optimized 1-D CNN-LSTM algorithm outscored other state-of-the-art algorithms in terms of accuracy, and the optimized models provided lower epistemic uncertainty.

4. Discussion

Rolling bearings are indispensable but also among the most fault-prone components of rotating machinery widely used in fields such as wind energy, power transmission systems, and manufacturing [5,8]. Safety and reliability, on the other hand, are pivotal in any kind of industrial operation [1]. Any failure of a bearing (a machine typically has multiple bearings) may trigger a series of concatenate accidents as the operational state of a fundamental component has a decisive role in all other interconnected equipment’s health state [4]. Although using artificial intelligence-based algorithmic tools has become mainstream in health management, the answers to the question of “How trustworthy, explainable, and interpretable are their predictions?” are still insufficient [34]. Therefore, this field still has room for further research and investigations. Additionally, the existing literature typically individually addresses the concepts of physics-guided design, uncertainty, and optimization. The lack of studies that handle all at once to enhance the reliability and explainability of their predictions is noteworthy [20,26].
To eliminate these concerns, the present study first benefited from the fundamentals of physics to make the selection of sample length more explainable. Evidence in the literature shows that the research community has utilized various sample lengths, such as 864 [12], 1024 [2], 2048 [20], 4096 [43], 12,800 [6], and 25,000 [8] for bearing condition monitoring. However, the majority of these published works do not explain why the selected sample lengths are optimal for a given problem. The answer to this question is worth emphasizing in engineering practice, as the sample length being too small or too large may result in information scarcity or redundancy [26]. Based on physics, the factors such as the physical characteristics of bearings, sampling rate, and the shaft speed play a key role in defining the optimal sample length rather than the selected network itself. Having touched on it, the present work computed the optimal sample length as 21,060 and 7400 for the CWRU and PU datasets, respectively. As a result, the overall classification accuracies reached up to 99.350% and 99.750% with the help of the grid search-based optimization. Two concerns may arise at this point. Firstly, although the sample lengths were defined based on physics in this work, the performance (accuracy) of the proposed 1-D CNN-LSTM network should still be competitive. In this respect, Table 6 clearly reveals the significance of selecting the best possible sample length on the model performance. Table 7 and Table 8, on the other hand, demonstrated that the proposed optimized 1-D CNN-LSTM model outscored other state-of-the-art DL algorithms. Still, comparing the outputs of this work with other studies that also employ the CWRU and PU datasets could open an avenue to generalize the methodology detailed within this paper. To this end, Table 9 and Table 10 compare the findings of this study with others, considering factors such as accuracy, sampling rate, and sample length.
Table 9 and Table 10 reveal that the physics-guided optimized 1-D CNN-LSTM algorithm proposed within this work performed competitively among others for both datasets. With this in mind, the classification accuracy of a network does not solely depend on the sample length but is affected by other aspects such as the kernel size, the number of convolutional and pooling layers, the optimization algorithm preference, boundaries of the hyperspace, and the operating conditions under which the data was collected. The scope of this paper is limited to optimizing the sample lengths and three training hyper-parameters within a defined hyperspace [20], considering non-optimized kernel size and layer configurations. In this respect, there is still room for future studies to enhance the methodology proposed in this paper. The importance of the operational conditions (shaft speeds and load) on the ultimate classification accuracy is also uncontroversial [19]. For example, the average classification accuracy was reported as 99.290% in Ref. [19] when the proposed structure was tested with the help of the data collected at 0 HP loading (see Table 9). However, this value increased to 99.900% when the network was fed with signals collected at 3 HP. In Ref. [20], Song et al. reached a mean classification accuracy of 99.285% when they tested their CNN-LSTM-based network optimized with the help of the grid search by using signals collected at 0 HP. Like the previous example, the mean accuracy reached 99.875% when the loading increased. In Table 9, the results obtained at 0 HP are represented for these two examples, as the present work also benefited from the acceleration signals collected at 0 HP and 1797 rpm for the CWRU dataset. Table 10, on the other hand, clearly shows that the increment of the sample length does not necessarily improve the classification accuracy [43,44], and the ultimate result depends on many other factors, such as the network configuration.
The second concern could be regarding the computational cost of the proposed physics-based approach, as the calculated optimal values are relatively high compared to values such as 1024 and 2048, especially for the CWRU dataset [2,12]. For the optimized 1-D CNN-LSTM-related results, the average computational (training + implementation) times were recorded as around 930 s and 395 s for the CWRU and PU datasets, respectively. For example, increasing the size of the model input (sample length) while keeping the general network architecture (kernel size, layer configurations, and hyper-parameters) will surely increase the computational burden, which can be naturally considered a disadvantage. In this respect, it is worth highlighting that the computational cost of the proposed approach is highly competitive compared to other studies in the literature. In Ref. [2], Xue et al. used a feature-level fusion method to classify different bearing health conditions with the help of the CWRU dataset. Although the sample length was 1024, the study reported a training time of 2787.8 s and the implementation time of 125.4 s for the best-performing (98.500%) scenario. Similarly, Song et al. [20] benefited from a CNN and bidirectional LSTM network and assigned the sample length as 2048. Still, their research reported a computational time of 2292 s when employing a grid search-based optimization approach to achieve an accuracy of 99.295%. These studies also simulated scenarios (fault types and diameter, operating conditions, etc.) that were very similar to those simulated in the present work. In conclusion, the present research achieved similar and relatively higher (99.350% and 99.750%) accuracies compared to other studies in the available literature, with a reasonable computational burden (approximately 930 s and 395 s). Evidence in the literature, combined with the outputs of the present work, showed that the sample length impacts the computational burden, but it is not the only decisive factor. The physics-guided sample lengths obtained within this study could have been lower or higher if the type of bearings, sampling ratio, and the shaft speeds differed for the relevant datasets (see Equations (1)–(3)). Similarly, if the limit for the number of epochs was 100 or 25 instead of 50 within the present research, using a lower or higher sample length might not change the ultimate computational cost. Therefore, future works can focus on expanding the hyperspace boundary, increasing the number of hyper-parameters to be optimized, and testing their models on diverse datasets to further reduce the computational burden. This research contributes to putting the sample length selection process into perspective with physics and showing the impact of optimization on epistemic uncertainty [45,46,47].
In summary, the evidence in the literature shows that utilizing DL-based approaches to classify different bearing health states has become a research hotspot. Still, many more are in progress as the desire to maximize the performance of the relevant algorithms and make their decision-making more explainable continues. In this respect, incorporating optimization, physics, and uncertainty is a solid alternative to achieve both ends. Although using optimization techniques has become common in practice, the scarcity of works considering physics and uncertainty (individually or simultaneously) is also worth highlighting [48]. From this standpoint, the present work aims to bridge the pertinent gap by proposing a physics-based optimized 1-D CNN-LSTM to classify divergent bearing faults under constant (CWRU) and variable (PU) operational conditions in the presence of limited data. The present work is limited to benefiting from physics principles while defining an optimal sample length (input size). More parameters, such as the kernel size, can potentially be optimized with the guidance of physics [49]. In addition, the validity of the proposed approach can be tested on more datasets (bearings, planetary gearbox, etc.) under divergent operating conditions. Relatively speaking, the proposed approach, on the other hand, can be generalized for other critical power transmission components, such as gears. Although the present work benefited from time-series vibrational sequences as its input, the detailed methodology (incorporating physics) can be generalized and utilized by studies where the set of images is used as the model input [50].

5. Conclusions

The present study proposed a physics-guided optimized 1-D CNN-LSTM algorithm to classify divergent bearing health conditions, considering epistemic uncertainty. In this respect, the equations of fault characteristic frequencies were utilized to determine an optimal input size (window sizes) for both enhancing the proposed DL-based networks’ performance and making the pertinent process more explainable. Ultimately, two benchmark datasets, namely, CWRU and PU, were employed to test the efficacy of the proposed optimized 1-D CNN-LSTM network. By comparing its performance with other state-of-the-art methods, the following conclusion can be drawn:
  • The results showed that the average accuracy of the physics-guided 1-D CNN-LSTM model was enhanced approximately by up to 20.717% and 8.523% for CWRU and PU datasets, respectively, following the optimization;
  • Incorporating the optimization also made the model predictions more consistent and trustworthy by reducing (model-related) epistemic uncertainties.
As a result, the proposed optimized 1-D CNN-LSTM model outscored the non-optimized 1-D CNN-LSTM, non-optimized 1-D CNN, and optimized 1-D CNN models when tested under both constant (CWRU) and variable (PU) operational conditions. The developed methodology that integrates the concepts of physics, optimization, and uncertainty can be used to enhance existing maintenance strategies.
Future studies will focus on generalizing the pertinent methodology with the help of more datasets. Incorporating physics may also open new avenues to find the optimal values of more CNN-related design parameters, such as the kernel size.

Funding

This research received no external funding.

Data Availability Statement

Data utilized in this article is openly available in the CWRU repository at https://engineering.case.edu/bearingdatacenter/download-data-file (accessed on 8 June 2025).

Conflicts of Interest

The author declares no conflicts of interest.

References

  1. Wang, X.; He, Y.; Wang, H.; Hu, A.; Zhang, X. A novel hybrid approach for damage identification of wind turbine bearing under variable speed condition. Mech. Mach. Theory 2022, 169, 104629. [Google Scholar] [CrossRef]
  2. Xue, F.; Zhang, W.; Xue, F.; Li, D.; Xie, S.; Fleischer, J. A novel intelligent fault diagnosis method of rolling bearing based on two-stream feature fusion convolutional neural network. Meas. J. Int. Meas. Confed. 2021, 176, 109226. [Google Scholar] [CrossRef]
  3. Sun, H.; Cao, X.; Wang, C.; Gao, S. An interpretable anti-noise network for rolling bearing fault diagnosis based on FSWT. Meas. J. Int. Meas. Confed. 2022, 190, 110698. [Google Scholar] [CrossRef]
  4. Zhu, Y.; Xie, B.; Wang, A.; Qian, Z. Fault diagnosis of wind turbine gearbox under limited labeled data through temporal predictive and similarity contrast learning embedded with self-attention mechanism. Expert. Syst. Appl. 2024, 245, 123080. [Google Scholar] [CrossRef]
  5. Karpat, F.; Kalay, O.C.; Dirik, A.E.; Karpat, E. Fault classification of wind turbine gearbox bearings based on convolutional neural networks. Transdiscipl. J. Eng. Sci. 2022, SP-2, 71–83. [Google Scholar] [CrossRef]
  6. Li, H.; Wu, X.; Liu, T.; Li, S.; Zhang, B.; Zhou, G.; Huang, T. Composite fault diagnosis for rolling bearing based on parameter-optimized VMD. Meas. Int. J. Meas. Confed. 2022, 201, 111637. [Google Scholar] [CrossRef]
  7. Xu, Z.; Li, C.; Yang, Y. Fault diagnosis of rolling bearing of wind turbines based on the variational mode decomposition and deep convolutional neural networks. Appl. Soft Comput. 2020, 95, 106515. [Google Scholar] [CrossRef]
  8. Karpat, F.; Kalay, O.C.; Dirik, A.E.; Doğan, O.; Korcuklu, B.; Yüce, C. Convolutional neural networks based rolling bearing fault classification under variable operating conditions. In Proceedings of the IEEE International Conference on Innovations in Intelligent Systems and Applications, Kocaeli, Turkey, 25–27 August 2021. [Google Scholar] [CrossRef]
  9. Alhams, A.; Abdelhadi, A.; Badri, Y.; Sassi, S.; Renno, J. Enhanced bearing fault diagnosis through trees ensemble method and feature importance analysis. J. Vib. Eng. Technol. 2024, 12, 109–125. [Google Scholar] [CrossRef]
  10. Qi, M.; Zhou, R.; Zhang, Q.; Yang, Y. Feature classification method of frequency cepstrum coefficient based on weighted extreme gradient boosting. IEEE Access 2021, 9, 72691–72701. [Google Scholar] [CrossRef]
  11. Alzubaidi, L.; Zhang, J.; Humaidi, A.J.; Al-Dujaili, A.; Duan, Y.; Al-Shamma, O.; Santamaría, J.; Fadhel, M.A.; Al-Amidie, M.; Farhan, L. Review of deep learning: Concepts, CNN architectures, challenges, applications, future directions. J. Big Data 2021, 8, 1–74. [Google Scholar] [CrossRef] [PubMed]
  12. Zhang, X.; Han, P.; Xu, L.; Zhang, F.; Wang, Y.; Gao, L. Research on bearing fault diagnosis of wind turbine gearbox based on 1DCNN-PSO-SVM. IEEE Access 2020, 8, 192248–192258. [Google Scholar] [CrossRef]
  13. Hatipoğlu, A.; Süpürtülü, M.; Yılmaz, E. Enhanced fault classification in bearings: A multi-domain feature extraction approach with LSTM-attention and LASSO. Arab. J. Sci. Eng. 2024, 1–18. [Google Scholar] [CrossRef]
  14. Neupane, D.; Seok, J. Bearing fault detection and diagnosis using Case Western Reserve University dataset with deep learning approaches: A review. IEEE Access 2020, 8, 93155–93178. [Google Scholar] [CrossRef]
  15. Yu, T.; Li, C.; Huang, J.; Xiao, X.; Zhang, X.; Li, Y.; Fu, B. ReF-DDPM: A novel DDPM-based data augmentation method for imbalanced rolling bearing fault diagnosis. Reliab. Eng. Syst. Saf. 2024, 251, 110343. [Google Scholar] [CrossRef]
  16. Gong, W.; Chen, H.; Zhang, Z.; Zhang, M.; Wang, R.; Guan, C.; Wang, Q. A novel deep learning method for intelligent fault diagnosis of rotating machinery based on improved CNN-SVM and multichannel data fusion. Sensors 2019, 19, 1693. [Google Scholar] [CrossRef] [PubMed]
  17. Sahu, D.; Dewangan, R.K.; Matharu, S.P.S. Hybrid CNN-LSTM model for fault diagnosis of rolling element bearings with operational defects. Int. J. Interact. Des. Manuf. 2025, 19, 5737–5748. [Google Scholar] [CrossRef]
  18. Zhou, Q.; Tang, J. An interpretable parallel spatial CNN-LSTM architecture for fault diagnosis in rotating machinery. IEEE Internet Things J. 2024, 11, 31730–31744. [Google Scholar] [CrossRef]
  19. Han, K.; Wang, W.; Guo, J. Research on a bearing fault diagnosis method based on a CNN-LSTM-GRU model. Machines 2024, 12, 927. [Google Scholar] [CrossRef]
  20. Song, B.; Liu, Y.; Fang, J.; Liu, W.; Liu, X. An optimized CNN-BiLSTM network for bearing fault diagnosis under multiple working conditions with limited training samples. Neurocomputing 2024, 574, 127284. [Google Scholar] [CrossRef]
  21. Huang, T.; Zhang, Q.; Tang, X.; Zhao, S.; Lu, X. A novel fault diagnosis method based on CNN and LSTM and its application in fault diagnosis for complex systems. Artif. Intell. Rev. 2022, 55, 1289–1315. [Google Scholar] [CrossRef]
  22. Novello, P.; Poëtte, G.; Lugato, D.; Congedo, P.M. Goal-oriented sensitivity analysis of hyperparameters in deep learning. J. Sci. Comput. 2023, 94, 45. [Google Scholar] [CrossRef]
  23. Yang, L.; Shami, A. On hyperparameter optimization of machine learning algorithms: Theory and practice. Neurocomputing 2020, 415, 295–316. [Google Scholar] [CrossRef]
  24. Liu, X.; Wu, R.; Wang, R.; Zhou, F.; Chen, Z.; Guo, N. Bearing fault diagnosis based on particle swarm optimization fusion convolutional neural network. Front. Neurorobot. 2022, 16, 1044965. [Google Scholar] [CrossRef] [PubMed]
  25. Dong, S. An integrated method of rolling bearing fault diagnosis based on convolutional neural network optimized by sparrow optimization algorithm. Sci. Program. 2022, 6234169. [Google Scholar] [CrossRef]
  26. Ruan, D.; Wang, J.; Yan, J.; Gühmann, C. CNN parameter design based on fault signal analysis and its application in bearing fault diagnosis. Adv. Eng. Inform. 2023, 55, 101877. [Google Scholar] [CrossRef]
  27. Shenfield, A.; Howarth, M. A novel deep learning model for the detection and identification of rolling element-bearing faults. Sens. 2020, 20, 5112. [Google Scholar] [CrossRef] [PubMed]
  28. Mostafavi, A.; Siami, M.; Friedmann, A.; Barszcz, T.; Zimroz, R. Probabilistic uncertainty-aware decision fusion of neural network for bearing fault diagnosis. In Proceedings of the 8th European Conference of the Prognostics and Health Management Society, Prague, Czech Republic, 3–5 July 2024. [Google Scholar] [CrossRef]
  29. Zhou, T.; Zhang, L.; Han, T.; Lopez Droguett, E.; Mosleh, A.; Chan, F.T.S. An uncertainty-informed framework for trustworthy fault diagnosis in safety-critical applications. Reliab. Eng. Syst. Saf. 2023, 229, 108865. [Google Scholar] [CrossRef]
  30. Lin, Y.-H.; Li, G.-H. Uncertainty-aware fault diagnosis under calibration. IEEE Trans. Syst. Man. Cybern. Syst. 2024, 54, 6469–6481. [Google Scholar] [CrossRef]
  31. Das, L.; Gjorgiev, B.; Sansavini, G. Uncertainty-aware deep learning for monitoring and fault diagnosis from synthetic data. Reliab. Eng. Syst. Saf. 2024, 251, 110386. [Google Scholar] [CrossRef]
  32. Ren, J.; Wen, J.; Zhao, Z.; Yan, R.; Chen, X.; Nandi, A.K. Uncertainty-aware deep learning: A promising tool for trustworthy fault diagnosis. IEEE/CAA J. Autom. Sin. 2024, 11, 1317–1330. [Google Scholar] [CrossRef]
  33. Kafunah, J.; Ali, M.I.; Breslin, J.G. Uncertainty-aware ensemble combination method for quality monitoring fault diagnosis in safety-related products. IEEE Trans. Industr. Inform. 2024, 20, 1975–1986. [Google Scholar] [CrossRef]
  34. Hüllermeier, E.; Waegeman, W. Aleatoric and epistemic uncertainty in machine learning: An introduction to concepts and methods. Mach. Learn. 2021, 110, 457–506. [Google Scholar] [CrossRef]
  35. Case Western Reserve University Bearing Data Center. Available online: https://engineering.case.edu/bearingdatacenter/welcome (accessed on 8 June 2025).
  36. Lessmeier, C.; Kimotho, J.K.; Zimmer, D.; Sextro, W. Condition monitoring of bearing damage in electromechanical drive systems by using motor current signals of electric motors: A benchmark data set for data-driven classification. In Proceedings of the 3th European Conference of the Prognostics and Health Management Society, Bilbao, Spain, 5–8 July 2016. [Google Scholar] [CrossRef]
  37. Magadán, L.; Ruiz-Cárcel, C.; Granda, J.C.; Suárez, F.J.; Starr, A. Explainable and interpretable bearing fault classification and diagnosis under limited data. Adv. Eng. Inform. 2024, 62, 102909. [Google Scholar] [CrossRef]
  38. Kalay, O.C.; Karpat, F. A comparative experimental research on the diagnosis of tooth root cracks in asymmetric spur gear pairs with a one-dimensional convolutional neural network. Mech. Mach. Theory 2024, 201, 105755. [Google Scholar] [CrossRef]
  39. Scherer, D.; Müller, A.; Behnke, S. Evaluation of pooling operations in convolutional architectures for object recognition. In Proceedings of the International Conference on Artificial Neural Networks, Thessaloniki, Greece, 11–15 September 2010. [Google Scholar] [CrossRef]
  40. Ravikumar, K.N.; Yadav, A.; Kumar, H.; Gangadharan, K.V.; Narasimhadhan, A.V. Gearbox fault diagnosis based on multi-scale deep residual learning and stacked LSTM model. Meas. J. Int. Meas. Confed. 2021, 186, 110099. [Google Scholar] [CrossRef]
  41. Zhou, X.; Liu, H.; Pourpanah, F.; Zeng, T.; Wang, X. A survey on epistemic (model) uncertainty in supervised learning: Recent advances and applications. Neurocomputing 2022, 489, 449–465. [Google Scholar] [CrossRef]
  42. Valdenegro-Toro, M.; Mori, D.S. A deeper look into aleatoric and epistemic uncertainty disentanglement. In Proceedings of the 2022 IEEE/CVF Conference on Computer Vision and Pattern Recognition Workshops, New Orleans, LA, USA, 19–20 June 2022. [Google Scholar] [CrossRef]
  43. Hou, L.; Jiang, R.; Tan, Y.; Zhang, J. Input feature mappings-based deep residual networks for fault diagnosis of rolling element bearing with complicated dataset. IEEE Access 2020, 8, 180967–180976. [Google Scholar] [CrossRef]
  44. Karpat, F.; Kalay, O.C.; Dirik, A.E.; Karpat, E. Fault diagnosis of rolling bearing under variable operating conditions based on deep learning. In Proceedings of the 10th International Scientific Conference on Research and Development of Mechanical Elements and Systems, Belgrade, Serbia, 26 May 2022. [Google Scholar]
  45. Wang, C.; Chen, X.; Qiang, X.; Fan, H.; Li, S. Recent advances in mechanism/data-driven fault diagnosis of complex engineering systems with uncertainties. AIMS Math. 2024, 9, 29736–29772. [Google Scholar] [CrossRef]
  46. Qiang, X.; Wang, C.; Fan, H. Hybrid interval model for uncertainty analysis of imprecise or conflicting information. Appl. Math. Model. 2024, 129, 837–856. [Google Scholar] [CrossRef]
  47. Wang, C.; Qiang, X.; Xu, M.; Wu, T. Recent advances in surrogate modeling methods for uncertainty quantification and propagation. Symmetry 2022, 14, 1219. [Google Scholar] [CrossRef]
  48. Tian, H.; Fan, H.; Feng, M.; Cao, R.; Li, D. Fault diagnosis of rolling bearing based on HPSO algorithm optimized CNN-LSTM neural network. Sensors 2023, 23, 6508. [Google Scholar] [CrossRef] [PubMed]
  49. Xu, Z.; Zhao, K.; Wang, J.; Bashir, M. Physics-informed probabilistic deep network with interpretable mechanism for trustworthy mechanical fault diagnosis. Adv. Eng. Inform. 2024, 62, 102806. [Google Scholar] [CrossRef]
  50. Chen, J.; Jiang, J.; Guo, X.; Tan, L. A self-adaptive CNN with PSO for bearing fault diagnosis. Syst. Sci. Control. Eng. 2021, 9, 11–22. [Google Scholar] [CrossRef]
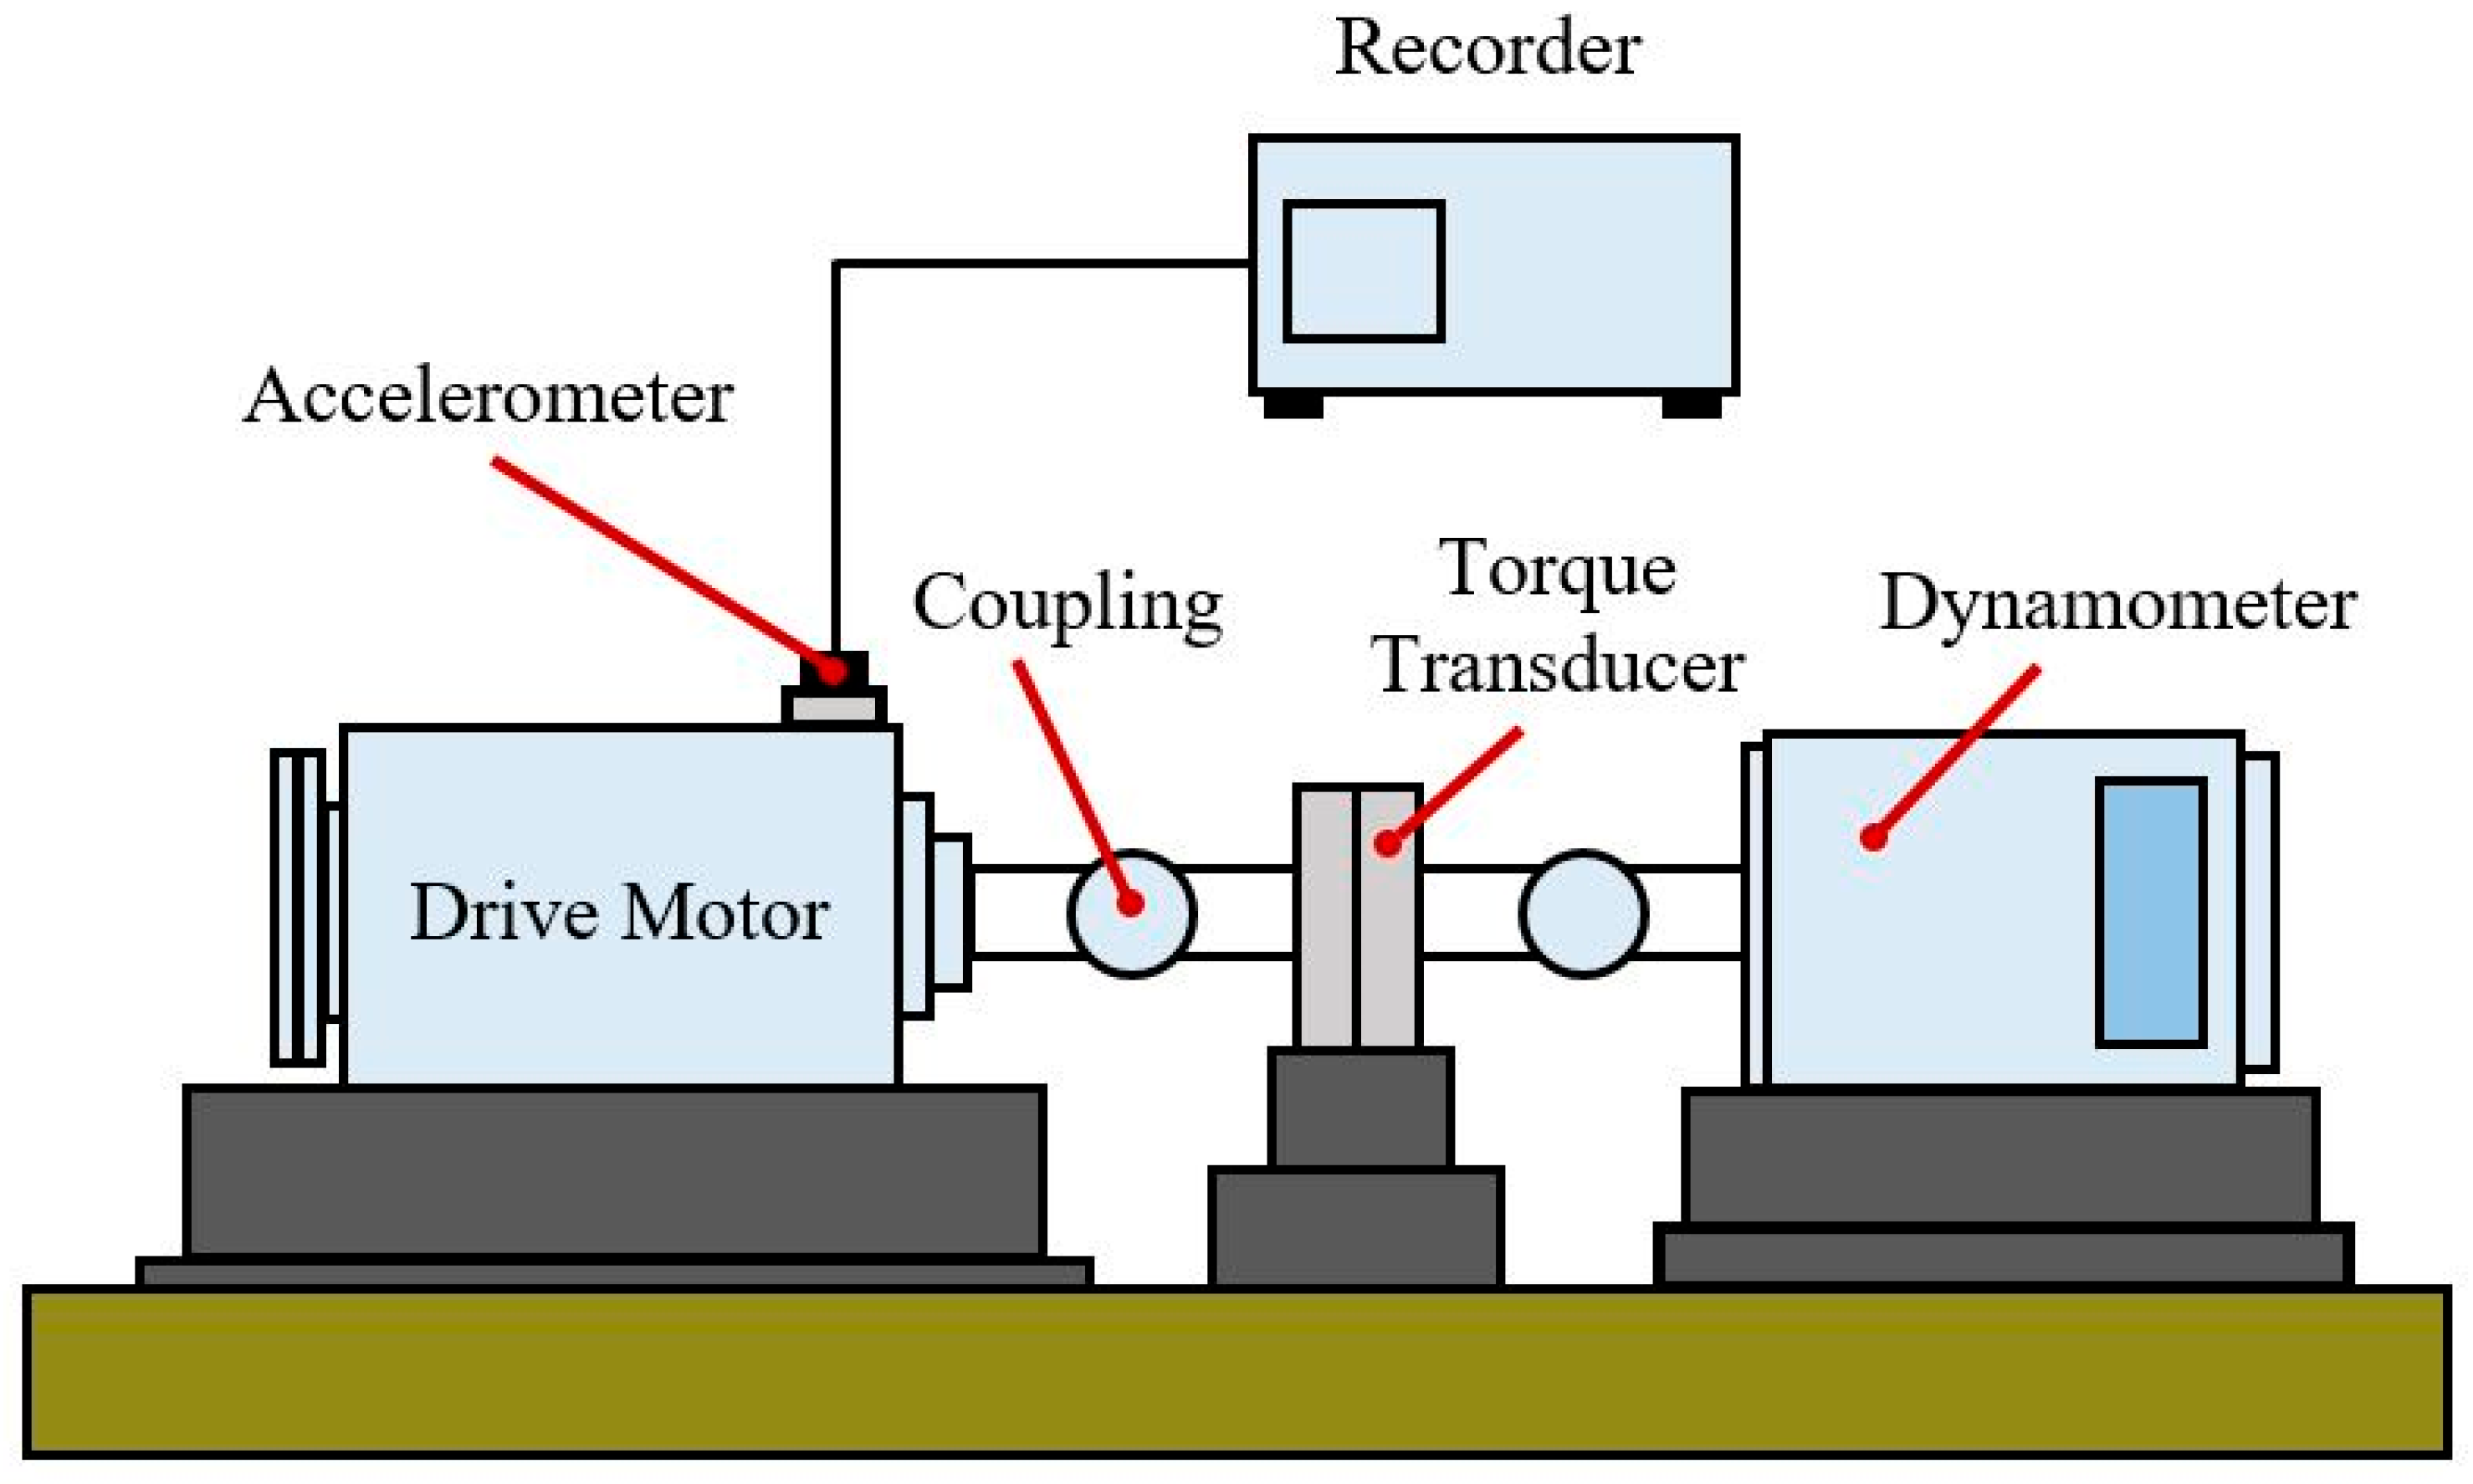
Figure 1. The CWRU test bench.
Machines 13 00612 g001
Figure 2. The scheme of the PU test bench.
Machines 13 00612 g002
Figure 3. The fundamental parts and dimensions of a ball bearing.
Machines 13 00612 g003
Figure 4. The definition of the slip method.
Machines 13 00612 g004
Figure 5. Representation of the proposed 1-D CNN-LSTM algorithm.
Machines 13 00612 g005
Figure 6. Vibration signals extracted from the CWRU dataset.
Machines 13 00612 g006
Figure 7. Vibration signals extracted from the PU dataset.
Machines 13 00612 g007
Figure 8. Comparison of evaluation metrics for the best-performing tests within the PU dataset: (a) loss versus epochs; (b) accuracy versus epochs.
Machines 13 00612 g008
Figure 9. Confusion matrices for the best-performing tests among the four trials for the CWRU dataset: (a) non-optimized (Test-2); (b) optimized 1-D CNN-LSTM (Test-3).
Machines 13 00612 g009
Figure 10. Confusion matrices for the best-performing tests among the four trials for the PU dataset: (a) non-optimized (Test-4); (b) optimized 1-D CNN-LSTM (Test-2).
Machines 13 00612 g010
Figure 11. Performance metrics for the CWRU dataset: (a,b) non-optimized; (c,d) optimized 1-D CNN-LSTM.
Machines 13 00612 g011
Figure 12. The plotted performance metrics for the PU dataset: (a,b) non-optimized; (c,d) optimized 1-D CNN-LSTM.
Machines 13 00612 g012
Figure 13. Recapping the overall accuracies obtained for each algorithm: (a) CWRU; (b) PU dataset.
Machines 13 00612 g013
Table 1. Defect frequencies for the CWRU dataset [35].
Fault LocationBallInner RacewayOuter Raceway
4.7135 Hz5.4152 Hz3.5848 Hz
Table 2. The first five orders of characteristic frequencies calculated for the CWRU dataset *.
Fault Characteristic Frequency (Hz)Order
1st2nd3th4th5th
fball141.16282.32423.48564.64705.8
fIR162.18324.36486.54648.72810.9
fOR107.36214.72322.08429.44536.8
* Highlighted (bold) values were used to calculate L s 2 in Equation (5).
Table 3. The recap of the structure of the proposed 1-D CNN-LSTM network *.
LayerOutput ShapeNumber of Parameters
Conv1D(None, 21,060, 4)8
MaxPooling1D(None, 10,530, 4)0
Conv1D(None, 10,530, 4)20
MaxPooling1D(None, 5265, 4)0
Conv1D(None, 5265, 4)20
MaxPooling1D(None, 2632, 4)0
Conv1D(None, 2632, 8)40
MaxPooling1D(None, 877, 8)0
Conv1D(None, 877, 8)72
MaxPooling1D(None, 292, 8)0
Dropout(None, 292, 8)0
LSTM(None, 32)5248
Flatten(None, 32)0
Dense(None, 256)8448
Dense(None, 128)32,896
Dense(None, 64)8256
Dense(None, 10)650
* The output shape and the number of parameters are denoted for the CWRU dataset.
Table 4. Sample distribution and classes identified for the CWRU dataset.
Health StatusData Points
lp
Slip Length
Slip
Number of Samples
ns
Label
Normal243,93822010000
0.007″ BF244,73922010001
0.014″ BF249,14622010002
0.021″ BF243,93822010003
0.007″ IRF243,93822010004
0.014″ IRF63,7884010005
0.021″ IRF244,33922010006
0.007″ ORF243,53822010007
0.014″ ORF245,14022010008
0.021″ ORF246,34222010009
Table 5. Sample distribution and classes identified for the PU dataset.
Health StatusData Points
lp
Slip Length
Slip
Number of Samples
ns
Label
Normal @ 1500257,40724510000
Normal @ 900256,60824510001
IRF @ 1500256,00124510002
IRF @ 900256,76224510003
ORF @ 1500256,00024510004
ORF @ 900256,00024510005
Table 6. The influence of using different input lengths.
DatasetInput LengthTest-1Test-2Test-3Test-4Overall
Accuracy
CWRU102482.500%83.000%83.700%81.800%82.750%
204888.100%89.800%90.100%89.500%89.375%
409689.900%90.600%91.100%90.700%90.575%
21,06090.000%94.000%94.400%94.800%93.300%
PU102475.333%75.500%77.500%76.667%76.250%
204888.500%90.667%87.833%88.833%88.958%
409697.333%96.667%96.000%93.167%95.791%
740095.500%98.500%97.167%98.167%97.333%
Table 7. Comparison of DL results for the CWRU dataset.
AlgorithmTest-1Test-2Test-3Test-4Overall
Accuracy
ParametersEpistemic
Uncertainty
1-D CNN90.000%94.000%94.400%94.800%93.300%[10; 110; 0.55]16.900 × 10⁻⁵
1-D CNN-LSTM81.600%86.800%78.400%82.400%82.300%[10; 110; 0.55]36.100 × 10⁻⁵
Optimized 1-D CNN98.400%97.200%98.400%99.200%98.300%[30; 32; 0.5]2.500 × 10⁻⁵
Optimized 1-D CNN-LSTM99.100%99.200%99.600%99.500%99.350%[50; 192; 0.6]0.400 × 10⁻⁵
Table 8. Comparison of DL results for the PU dataset.
AlgorithmTest-1Test-2Test-3Test-4Overall
Accuracy
ParametersEpistemic
Uncertainty
1-D CNN95.500%98.500%97.167%98.167%97.333%[10; 110; 0.55]1.112 × 10⁻⁵
1-D CNN-LSTM86.333%92.000%94.333%95.000%91.916%[10; 110; 0.55]75.625 × 10⁻⁵
Optimized 1-D CNN99.000%99.500%99.333%99.833%99.416%[30; 256; 0.45]0.277 × 10⁻⁵
Optimized 1-D CNN-LSTM99.833%99.833%99.667%99.667%99.750%[20; 64; 0.5]0.068 × 10⁻⁵
Table 9. Comparison of the classification results with the literature for the CWRU dataset.
Algorithm *Overall AccuracySampling RatioNumber of ClassesSample Length
Xue et al. [2]TSFFCNN-PSO-SVM98.500%48 kHz101024
Zhang et al. [12]1-D CNN-PSO-SVM98.200%48 kHz10864
Han et al. [19]CNN-LSTM with Gated Recurrent Unit99.290%10
Song et al. [20]CNN-BiLSTM with Grid Search99.285%12 kHz102048
Proposed MethodOptimized 1-D CNN-LSTM99.350%48 kHz1021,060
* Key: TSFFCNN: two-stream feature fusion CNN; PSO: particle swarm optimization; SVM: support vector machine; BiLSTM: Bidirectional LSTM.
Table 10. Comparison of the classification results with the literature for the PU dataset.
Algorithm *Overall AccuracySampling RatioNumber of ClassesSample Length
Ruan et al. [26]PGCNN99.719%64 kHz57921
Hou et al. [43]IFMs-based ResNet99.700%64 kHz44096
Karpat et al. [44]1-D CNN96.670%64 kHz625,000
Proposed MethodOptimized 1-D CNN-LSTM99.750%64 kHz67400
* Key: PGCNN: physics-guided CNN; IFMs-based ResNet: input feature mappings-based deep residual network.
Disclaimer/Publisher’s Note: The statements, opinions and data contained in all publications are solely those of the individual author(s) and contributor(s) and not of MDPI and/or the editor(s). MDPI and/or the editor(s) disclaim responsibility for any injury to people or property resulting from any ideas, methods, instructions or products referred to in the content.