Abstract
This paper presents a digital twin-driven multi-objective optimization approach for enhancing the performance and productivity of a multi-product manufacturing system under complex operational challenges. More specifically, the concept of digital twin is applied to virtually replicate a physical system that leverages real-time data fusion from Internet of Things devices or sensors. JaamSim serves as the platform for modeling the digital twin, simulating the dynamics of the manufacturing system. The implemented digital twin is a manufacturing system that incorporates a three-stage production line to complete and stockpile two gear types. The production line is subject to unpredictable events, including equipment breakdowns, maintenance, and product returns. The stochasticity of these real-world-like events is modeled using a normal distribution. Manufacturing control strategies, such as CONWIP and Kanban, are implemented to evaluate the impact on the performance of the manufacturing system in a simulation environment. The evaluation is performed based on three key indicators: service level, the amount of work-in-progress items, and overall system profitability. Multiple objective functions are formulated to optimize the behavior of the system by reducing the work-in-progress items and improving both cost-effectiveness and service level. To this end, the proposed approach couples the JaamSim-based digital twins with evolutionary and swarm-based algorithms to carry out the multi-objective optimization under varying conditions. In this sense, the present work offers an early demonstration of an industrial digital twin, implementing an offline simulation-based manufacturing environment that utilizes optimization algorithms. Results demonstrate the trade-offs between the employed strategies and offer insights on the implementation of hybrid production control systems in dynamic environments.
1. Introduction
Manufacturing companies are consistently pressured to optimize manufacturing systems due to ever-changing demand and emerging environmental requirements. The aim of this optimization is the improvement of manufacturing aspects, including increasing throughput and reducing costs, to satisfy customers and comply with the changing regulatory landscape. In this regard, production lines become complex and multifaceted, as they are subject to frequent reconfigurations, disruptions, and tighter sustainability regulations. Given this, traditional scheduling and control methods are no longer sufficient. Instead, advanced optimization frameworks should be adopted by manufacturing companies to handle uncertainty, competing objectives, and real-time decision-making [1].
In the literature, smart manufacturing systems often implement production process control optimization methodologies, including digital twins [2] and reinforcement learning [3]. Focusing on the former, a digital twin is a virtual representation of physical manufacturing systems, which is maintained through continuous updates using real-time data from Internet of Things (IoT) and sensor devices. This data ensures that the operational behavior and performance is accurately reflected [4]. In this regard, a digital twin is a dynamic digital replica that integrates sensor data, records, and advanced modeling techniques, facilitating the simulation of real-world manufacturing dynamics and operations, including predictive maintenance [2,5]. These dynamics are stochastic and frequently modeled using a distribution, such as an exponential distribution. Thus, digital twins provide a plausible solution for improving decision-making in virtual replicas of manufacturing systems, implementing optimization-based control and data fusion techniques [6,7]. They have been successfully applied in several manufacturing domains, including oil and gas [8]. Similarly, simulation tools and surrogate models attempted to improve defect detection and production cycle time with multi-objective optimization algorithms [9].
Despite their efficiency, the application of digital twins in real-world industrial contexts is associated with several challenges, as presented in the relevant literature. First, they are applied to aspects of the production process, relying on assumptions that might limit their real-world applicability [4]. In this regard, the adoption and integration of digital twin-based solutions are hindered by a lack of standardized frameworks that enable scalability and interoperability [5]. This is complemented by the absence of well-defined objectives and evaluation metrics due to the relatively early-stage nature of the concept of digital twins [10]. This limitation is heavily correlated with the fact that there are no widely adopted standards and established methodologies for assessing their long-term impact and performance. Given this absence, it would be challenging for manufacturers to optimize the performance and resource allocation in manufacturing systems. Finally, the literature often highlights the necessity of learning-based production control systems that couple several activities, such as maintenance and quality control, to ubiquitously optimize operations of smart factories [11]. This concept has been implemented in stochastic, multi-stage manufacturing lines embedding simulation-based frameworks.
The present paper proposes a digital twin-driven optimization framework for enhancing the efficiency of manufacturing processes that integrate IoT or sensor devices. JaamSim is employed to formulate virtual replicas of two-product production lines. These digital twins incorporate stochastic aspects that correspond to real-world events, such as breakdowns, deterioration, product returns, etc., to model fluctuations in system operation more accurately. The stochastic events in the system assume a normal distribution. Furthermore, the formulated digital twins integrate variations of well-known production control strategies, such as Kanban, Base Stock, and CONWIP.
It is noteworthy that the present work serves as a step toward full digital twin implementation. It focuses on an offline what-if simulation environment that integrates optimization algorithms, rather than an operational twin. The aim is to support effective decision-making based on key performance indicators, such as work-in-progress (WIP) items. Multiple objective functions are designed and optimized using evolutionary and swarm-based algorithms, including genetic algorithms and particle swarm optimization. Through continuous optimization, the offline digital twin implementation provides useful insights on proactively enhancing productivity and efficiency.
The main contributions of this paper are as follows:
- A multi-objective evolutionary and swarm-integrated framework is proposed to optimize digital twins of manufacturing systems. The optimization intends to balance the number of WIP along with improvements in service level, resource management, and cost-effectiveness. Such an approach will provide holistic improvements in system performance.
- Four widely known optimization algorithms, including genetic algorithms and proximal swarm optimization, are compared and evaluated under real-world-like fluctuating manufacturing events. This comparison provides a critical evaluation of the algorithms’ performance in a simulated environment.
- Robust solutions are determined through a three-stage filtering methodology. This methodology utilizes a variety of pull and push production control mechanisms, such as Kanban and Base Stock, to generate an initial set of solutions. These solutions are afterward assessed on the basis of the simulation output, inventory levels, and production control overhead.
- Experimental analysis reveals useful insights into the performance of hybrid production control optimization frameworks in terms of sustainability, resilience, resource management, and throughput. It demonstrates the benefits of the proposed holistic production optimization framework.
The rest of this paper is organized as follows. Section 2 reviews the relevant literature. Section 3 describes the examined manufacturing system and the proposed framework. Section 4 evaluates the performance of the presented methodology. Section 5 summarizes the findings and provides directions for future research.
2. Related Work
The literature has made substantial advances in the development of pull production control systems to optimize the manufacturing process. Pull-based systems, such as Kanban and CONWIP, have been widely studied to balance WIP levels and adapt to varied customer demand [12]. Onyeocha et al. [13] conducted a comparative study of various pure and hybrid production control policies, including Kanban and CONWIP, in a multi-product manufacturing system. They demonstrated that hybrid policies can improve cost-effectiveness by reducing WIP. Paraschos et al. [14] expanded this concept by including reinforcement learning in lean-green pull production to create a smart, sustainable circular manufacturing environment under stochastic failures. These advances illustrate the growing interest in developing adaptive, data-driven methods for production control.
The concept of digital twin has also attracted a lot of research interest, given its capability of simulating and optimizing physical manufacturing systems [7]. For example, aiming to handle routing and decisions, digital twin-integrated optimization frameworks have been utilized to couple fuzzy logic with simulation for job-shop scheduling [15]. Ricondo et al. [16] presented a digital twin architecture that fuses live data into virtual manufacturing models. A similar approach was followed in the study of Mei et al. [17]. The authors applied intelligent decision-making methods to reduce the unexpected downtime of CNC equipment. Ivanov et al. [5] discussed the concept of designing and adapting digital twins within the supply chain, identifying the challenges of such application. Despite the great promise of digital twins in the manufacturing context, many studies focus on specific production aspects (e.g., inventory control [2]) or challenges (e.g., technical and integration issues [18]). Given this, the relevant research has yet to address the broader interdependencies within complex manufacturing systems, such as multi-product lines [6,19].
Moreover, other studies (e.g., [20,21,22]) attempted to implement optimization approaches to enhance performance and sustainability in production control. Fu et al. [23] integrated and optimized a multi-objective open-shop model using a simulation-based optimizer, addressing product delivery, energy consumption, and manufacturing costs. Tran et al. [24] employed ant-colony optimization to dynamically schedule multiple operations, including maintenance and repair, minimizing tardiness and makespan. Focusing on disassembly line balancing, Wei et al. [25] utilized metaheuristics to improve efficiency and operator safety, considering several human ergonomic factors, such as standing. Jung et al. [26] compared multi-objective metaheuristic methods within the context of injection molding, demonstrating that Bayesian methods are more efficient at improving the process when the data is limited. Babor et al. [27] applied NSGA-II to improve scheduling so as to reduce the idle time in the bakery flow-shop system. Baghizadeh et al. [28] presented a multi-product inventory model formulated under assumptions, such as capacity and demand uncertainty. They optimized and evaluated the model using several optimization algorithms, such as differential evolution.
In a distributed manufacturing context, hybrid optimization frameworks displayed high scalability across domains. Guo et al. [29] addressed batch scheduling under constraints with a genetic algorithm, reducing makespan by 8%. Similar reductions have been highlighted by Bi et al. [30]. In their study, the authors employed proximal swarm optimization to improve the stamping workshop layout. Hou et al. [31] combined metaheuristics with deep reinforcement learning to improve job-shop scheduling, addressing machine failures and demand fluctuations. Vaidya and Jethava [32] proposed a hybrid metaheuristic model to scale decision-making within the smart factory ecosystem, leveraging cloud computing across connected devices and sensors.
Despite their effectiveness, the literature review in this section reveals several gaps and challenges. First, the integration of digital twins with metaheuristic algorithms is still underexplored, as few studies (e.g., [5,7]) attempted to present such an application. Secondly, most of the reviewed optimization approaches [23,24,32] are often applied under key assumptions, without considering the complexity and stochasticity of the real-world manufacturing context. Furthermore, they are focused on optimizing specific aspects of the production process, such as machine utilization, without considering the joint optimization performance metrics, such as service level and profitability [33,34,35]. This is a significant limitation, as modern manufacturing systems require prompt responsiveness to unpredictable operational disruptions, such as breakdowns.
Based on these limitations, the present paper proposes a holistic digital twin-driven optimization framework that couples discrete-event simulation with evolutionary and swarm-integrated optimization algorithms, such as genetic algorithms and differential evolution. The framework attempts to jointly optimize WIP, profitability, and service level in digital replicas of multi-product production lines under dynamic events. By implementing both digital twins and advanced optimization methods, the proposed approach offers a structured method to handle the complex trade-offs found in modern manufacturing environments. That is, it contributes to the ongoing effort of the relevant literature in developing a unified and adaptive framework for dynamic manufacturing contexts.
3. Material and Methods
3.1. Manufacturing System
The production line produces two types of gears: gear A and gear B. The production process operates based on the push system and consists of 3 production stages: (a) Turning and Manufacturing (), (b) Profile Processing (), and (c) Cleaning and Polishing (). The merging of the stages facilitates the representation of the system in the simulation environment. Each gear has different processing times per stage: for gear A, it is 17, 10, and 22 min, and for gear B, it is 20, 13, and 18 min. The production line operates for 6 days a week, and production remains active for 16 h a day.
The production system implements IoT or sensor devices to track the customer demand, the manufacturing process, and forecast unexpected events, such as breakdowns. Given the latter, the system operates under stochastic events as follows. At each processing stage, failures (B) occur, repairs (R) are made, and scheduled maintenance (M) is performed. Due to the failures, defective products are generated. These products are withdrawn from central production and recycled to be sold for scrap (). Given the rising demand, any pending orders should be satisfied in a relatively short time. Any unsatisfied order is considered a lost sale (). A probability is set that some customers may not be satisfied with the products and return them (). The raw materials () are received by the system at regular intervals.
Figure 1 depicts the workflow followed by the investigated manufacturing system, which is structured around the concepts of pull production, quality control, and waste management. According to the figure, the manufacturing process initiates when the raw materials arrive in the system. The material is conveyed through the processing machines, denoted as “MP1”, “MP2”, and “MP3”, which perform the specific task given the stage they are placed in. Each processed item is stockpiled in the inventories, designated as “I1”, “I2”, and “I3”. Given the product type, the inventories are denoted as two nodes in the figure. The processed items are subject to strict quality control standards, given that recurring faults deteriorate the quality of the equipment and the process. Upon the completion of the process and quality inspections, the final gears are given to customers, satisfying pending orders. The detected defective products are sent directly to “Scrap” for scrapping. The scrapped items are reworked and recycled in an effort to acquire revenue. The recycling activities ensure the reduction of resource waste and support sustainable manufacturing operations.
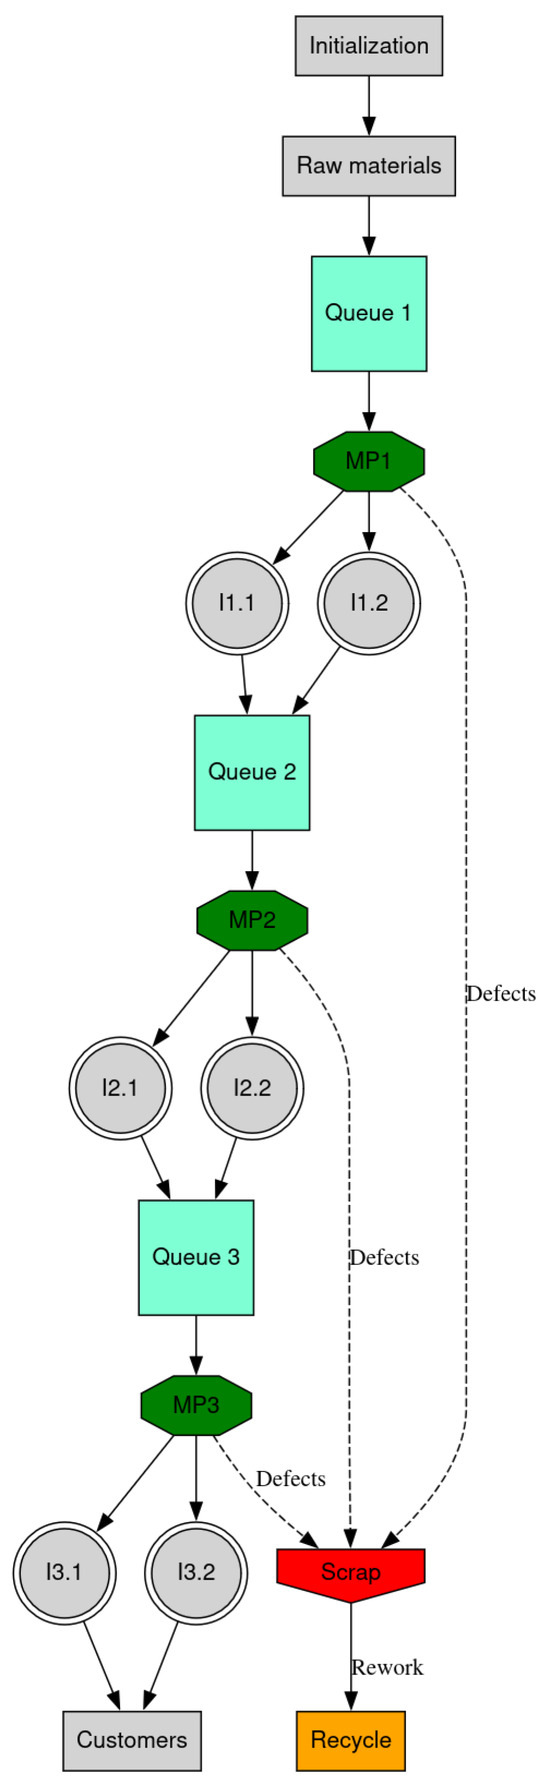
Figure 1.
A visualization of the workflow followed by the manufacturing system.
3.2. Multi-Objective Optimization Problem
The paper aims to optimize the performance of the manufacturing system in terms of processed items and cost-effectiveness. To this end, it was necessary to identify suitable criteria to measure the system’s efficiency to achieve optimal performance. The primary criteria are the number of tasks per stage (WIP), the service level (), and the overall profitability (). For each criterion, objective functions are mathematically formulated to reflect the processes of the manufacturing line and express the relationships between the system parameters.
The first set of objective functions concerns the minimization of the WIP per manufacturing stage. It formulates relationships of the quantities of components or control cards that are in the waiting queues at each stage. For example, the formula acts as a capacity constraint that limits the number of items that can be included in the machine’s queue at each stage. In control-based systems, such as CONWIP and Kanban, each item must be associated with a control card. In the formula, and are the maximum number of cards and are currently processing items at stage i. Given this, there are cards available for waiting-to-be-processed items. This directly leads to the short derivation . Consequently, the formulation estimates the maximum number of items that can wait in the queue. This ensures that the total WIP does not exceed the card limit imposed by the control policies. All parameters can take non-negative values.
The objective functions and the associated constraints are formulated in two variations as the different production control policies are implemented in the manufacturing system. The policies are BK-CONWIP, HK-CONWIP, D-KAP, and S-KAP. BK-CONWIP (Base Stock–Kanban–Constant Work-in-Progress) and HK-CONWIP (Hybrid Kanban–CONWIP) are production control polices that manage WIP in complex production systems. By adopting the principles of Base Stock, Kanban, and CONWIP [36,37], BK-CONWIP focuses on minimizing the bottleneck in the manufacturing system, maintaining WIP caps. This policy reduces the number of WIPs within the manufacturing system, ensuring optimal resource management under fluctuating demand. In contrast, HK-CONWIP uses Kanban cards to manage inventory and production at each production station, controlling the WIP level across the system under CONWIP. This hybrid strategy attempts to balance efficiency and versatility, facilitating material flow and preventing overproduction.
The Dedicated Kanban Allocation Policy (D-KAP) and the Shared Kanban Allocation Policy (S-KAP) are two Kanban-based production authorization methods for multi-product manufacturing lines. D-KAP assigns a set of Kanban cards to each product type to satisfy the defined inventory capacity and reduce product overlapping. On the other hand, S-KAP uses a common pool of Kanban cards for several product types. This strategy allows dynamic reallocation of the cards corresponding to the demand variance.
Given the aim of the present work, BK-CONWIP and HK-CONWIP are combined with D-KAP and S-KAP to control the studied multi-product manufacturing system. For production strategies implementing D-KAP, the objective functions are:
with constraints
- HK-CONWIP:
- BK-CONWIP:
In the formulation above, the mathematical notation is defined as follows. and correspond to the processing capacities of production lines 1 and 2 in stage 1; and represent the respective capacities in stage 2; and denote the final product inventories of each production line in stage 3; and and are control parameters for both production lines. Finally, the weights , , , , , and define the significance of each aspect of the objective functions. The values assumed by the parameters ensure that the processing and inventory capacities adhere to the constraints defined for HK-CONWIP and BK-CONWIP. That is, the defined constraints dictate that the processing capabilities of each manufacturing station must be within the buffer limits at stage 3. These ensure that the manufacturing system operates under feasible limits, optimizing WIP at every processing stage.
For S-KAP-based production control policies, the objective functions are the following:
with constraints
- HK-CONWIP:
- BK-CONWIP:
In the formulation specified for the S-KAP variations, and represent the processing capacities of stages 1 and 2; and refer to the inventory capacities of production lines 1 and 2 in stage 3; The parameter C acts as a capacity limit for the whole manufacturing system. The weights , , , , and define the significance of the objective functions’ aspects. Equation (12) strives to ensure balanced product processing, reducing the variance in capacity utilization across the stages. Equations (13) and (14) attempt to control the flow of WIP between stages and buffers, allowing operational versatility across the manufacturing system. These equations adhere to the constraints introduced by HK-CONWIP and BK-CONWIP. With the constraints, these policies endeavor to eliminate excessive material accumulation while preserving processing and storage limitations.
To express the influence of the realistic events over the system, as well as the system’s response to the changes, counters were placed for the quantities of final products (F) and inventories (I), the number of orders that entered the system and how many were not fulfilled, and the number of components that were recycled () or returned (). To correlate all this data, the second objective function () was devised corresponding to the cost-effectiveness of the manufacturing system, in which the influence and significance are expressed with a positive or negative sign through a coefficient that multiplies the corresponding quantity.
In Equation (22), the is positively affected by and , which refer to the quantities of finished gears A and B sold to customers. Along with these quantities, the recycled items, denoted as , have a positive influence on the objective function as well. Their influence on the finished gears and recycled items is weighted by their respective coefficients , , and . In contrast, several costs negatively affect the cost-effectiveness of the system. These costs are denoted as follows: B, M, and R are the breakdowns, the number of authorized maintenance actions, and the authorized system repairs; denotes the inventory of finished items; and refer to the lost sales and procured raw material; and are the returned products. The coefficients , , , , , , and define the negative effect of the costs on the cost-effectiveness of the manufacturing system. The objective function endeavors to balance productivity with cost-effectiveness, reducing resource wastage and inefficiencies.
Completing the section, it is worth mentioning the function for estimating the service level ():
measures the capability of the manufacturing system in meeting customer demand. It is a ratio involving the available inventory. It divides the sum of finished goods (), the inventory of finished items (), recycled items (), and returned products () by the customer demand (D). The recycled and returned products are reintegrated into the production cycle to be reprocessed or recovered. Once reprocessed or recovered, these items are available to satisfy customer demand. Given this, the formulation of provides insights into the system’s fulfillment capacity in terms of inventory availability and system efficiency. However, the metric may overestimate the ability of the system to satisfy pending orders, as it does not consider the reprocessing time required by the recycled and returned products. Thus, the implemented can be considered a metric that measures service coverage rather than an indicator of delivery capability. After the initial testing during the setup of the digital twins, we concluded that the acceptance limit for this task would be 94.9–101.0%.
3.3. Optimization Method
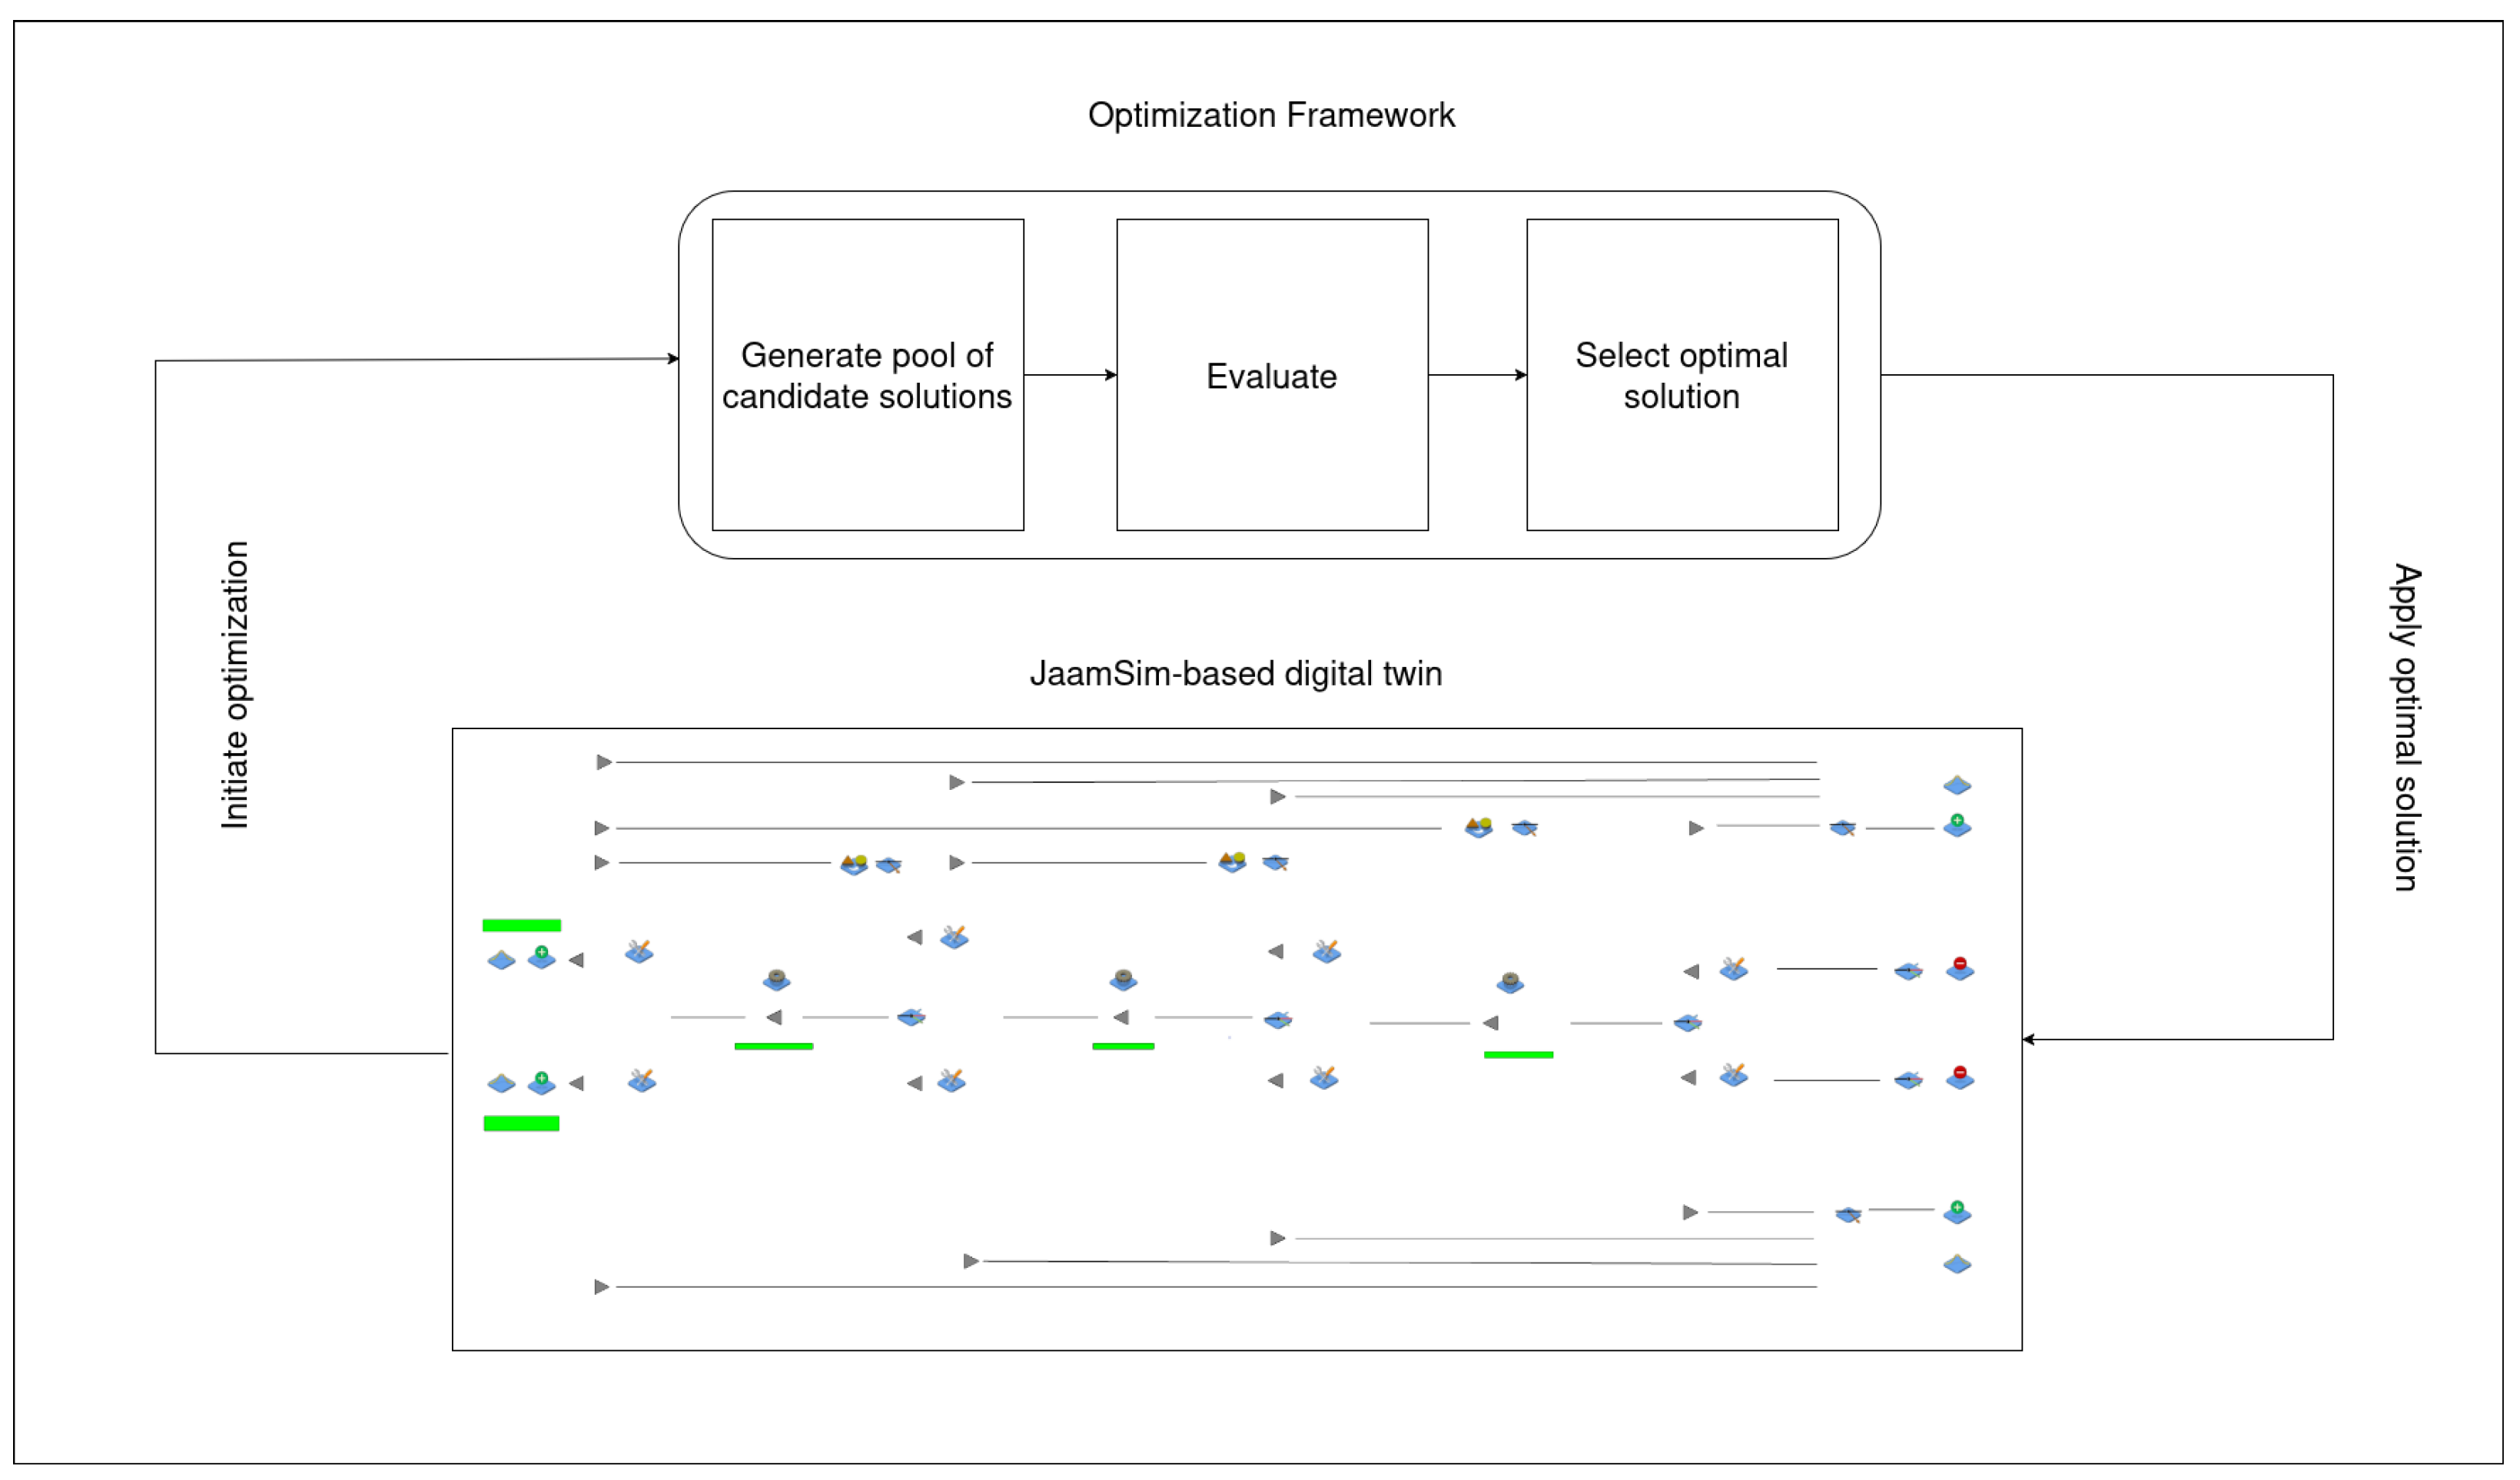
The proposed digital twin-driven optimization method is applied to the studied manufacturing system under BK-CONWIP, HK-CONWIP, D-KAP, and S-KAP to optimize the objective functions described above. This method aims to search for the optimal parameter settings for the production control policies. Integrating operation visualization and event scheduling, the approach couples the digital twin of the production system with optimization algorithms, such as genetic algorithms, for solving objective functions. The proposed approach is depicted in Figure 2.
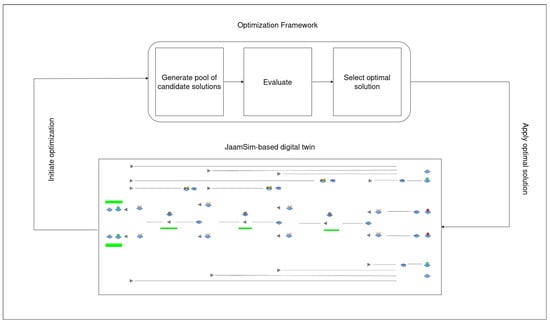
Figure 2.
A block diagram illustrating the proposed approach.
3.3.1. JaamSim
JaamSim 2024-09 is used for modeling and optimizing the digital replicas of the studied production system. Using its interface, four digital twins of the studied manufacturing system were formulated by representing the aspects of the production lines using entities and icons. These twins represent variations of the same system operating under the implemented production control policies. They implement the BK-CONWIP policy combined with D-KAP (BDOP) and S-KAP (BSOP) strategies, along with HK-CONWIP policy combined with D-KAP (HDOP) and S-KAP (HSOP) strategies.
The following operation rules were defined for each model:
- The transfer time for the cards and processed items is negligible.
- The system consists of 3 processing stages involving similar machines with unlimited capacity in the queues for processing.
- In each queue, the components are arranged in FIFO order, and one unit is processed at a time.
- The orders for each product are placed by different customers.
- A production week is considered 96 h (6 days × 16 h).
- Lost sales are considered the pending orders that remain unsatisfied when the system has more than 5 production requests in the queue of the 3rd stage, and simultaneously, there is no available inventory of finished goods.
- The probability of product returns is defined by a normal distribution with values ranging from [0.005–0.1] and a mean of 0.02.
The frequency of the occurring events, such as breakdowns, maintenance, and repairs, is defined using average rates. These rates assume a normal distribution since real-world processes exhibit variability around a central tendency. The normal distribution is one of the widely employed distributions that model events where outcomes are symmetrically distributed around a mean value. As noted in [38,39,40], this type of distribution is frequently used in materials management, production processes, quality control, and simulation due to its mathematical simplicity and capability to generate the effect of multiple factors. This is highly relevant for simulating fluctuating events using variables, such as processing times and maintenance intervals, where the variability is assumed to be symmetrical.
For the model observation to be unbiased and unaffected by the initial state of the system, a period of 1000 h was set. The goal is to complete a significant number of unscheduled events in the system. After this period, the system’s performance measurements begin. This method is widely used in several simulation studies as a warm-up period. Each round of experiments consisted of 30 repetitions of 9000 h, approximately one year of operation of the production line.
To understand the formulation of the JaamSim-based digital twins, let us consider the case of the BDOP model. The model illustrates the manufacturing system wherein jobs are generated by EntityGenerators (e.g., C1, CUSTOMER1) and subsequently processed at the machines MP1, MP2, and MP3. Before transitioning to their next processing stages, jobs advance through queues (e.g., Q1, Q2). To regulate WIPs and improve throughput, Kanban and CONWIP strategies are implemented. When defective items are produced, the system routes them to components related to scraping and recycling. Failure and maintenance events are encompassed in the model. The processing stations undergo downtime to receive maintenance and repair actions before resuming production activities. Performance metrics, such as machine utilization and WIP levels, are used for the evaluation of the manufacturing system and the optimization algorithms used.
3.3.2. Optimization Algorithms
To optimize the objective functions, a variety of optimization algorithms were utilized. These algorithms are the following: genetic algorithm (GA), particle swarm optimization (PSO), differential evolution (DE), and evolution strategy (ES). GA draws inspiration from biological evolution, as it involves characteristics, such as mutation, to evolve a pool of solutions across generations. Mimicking birds’ social behavior, PSO strives to solve optimization problems by iteratively moving a population of solutions, referred to as particles, around the search space. DE endeavors to improve the quality of the solution through vector differences, searching large solution spaces. ES optimizes the search for solutions by employing self-evolving parameters, such as recombination. Given that every algorithm has its strengths and weaknesses, they were selected to explore their efficiency and behavior within the context of the addressed problem.
In order to be optimized by the employed algorithms, the objective functions were coded in Python 3.11. The constraints and value limits of the variables were translated so that the algorithm could recognize them. The results of the optimization algorithms were extracted in the form of a table that contains 30 different combinations of values for the variables K, C, and S. In the form of code, the import of the combinations was programmed to occur one at a time in each iteration in JaamSim. More specifically, we carried out a three-stage sorting and selection process to select optimal solutions:
- The first stage is focused on generating a pool of candidate solutions according to the performance of the digital twins in JaamSim 2024-09. We used the Pareto front for non-dominated solutions to identify the optimal trade-offs between the competing objectives, according to the service level, the inventory, and the profit . This methodology produces a pool of optimal, or near-optimal, solutions used in the subsequent stages.
- The second stage is based on defining the total number of cards, which correspond to Kanban and CONWIP-based policies. Initially, using the pool of solutions generated in the first stage, the average values of the cards of CONWIP and Kanban are calculated. A function is used to evaluate which ones manage to have a value lower than the average. The filtered solutions are transferred to the last step.
- The final step involves the definition of the quantity of initial stock. Using the remaining solutions, the average quantity is calculated. The solution that achieved the smallest average initial stock is retained. This ensures that the digital twins under the selected solutions are resource-efficient by minimizing the initial resources and maintaining high-quality output.
The final two filters above were defined to ensure the efficient and sustainable operation of digital twins. They similarly impose limits on the processing and stockpiling of items, providing an additional measure for resource management. More specifically, the average value of the cards was used to minimize redundant stockpiling. This ensures that the produced items are within the acceptable threshold. The final filter checks the quantity of the initial stock, acting as a capacity constraint to prevent over-processing of materials.
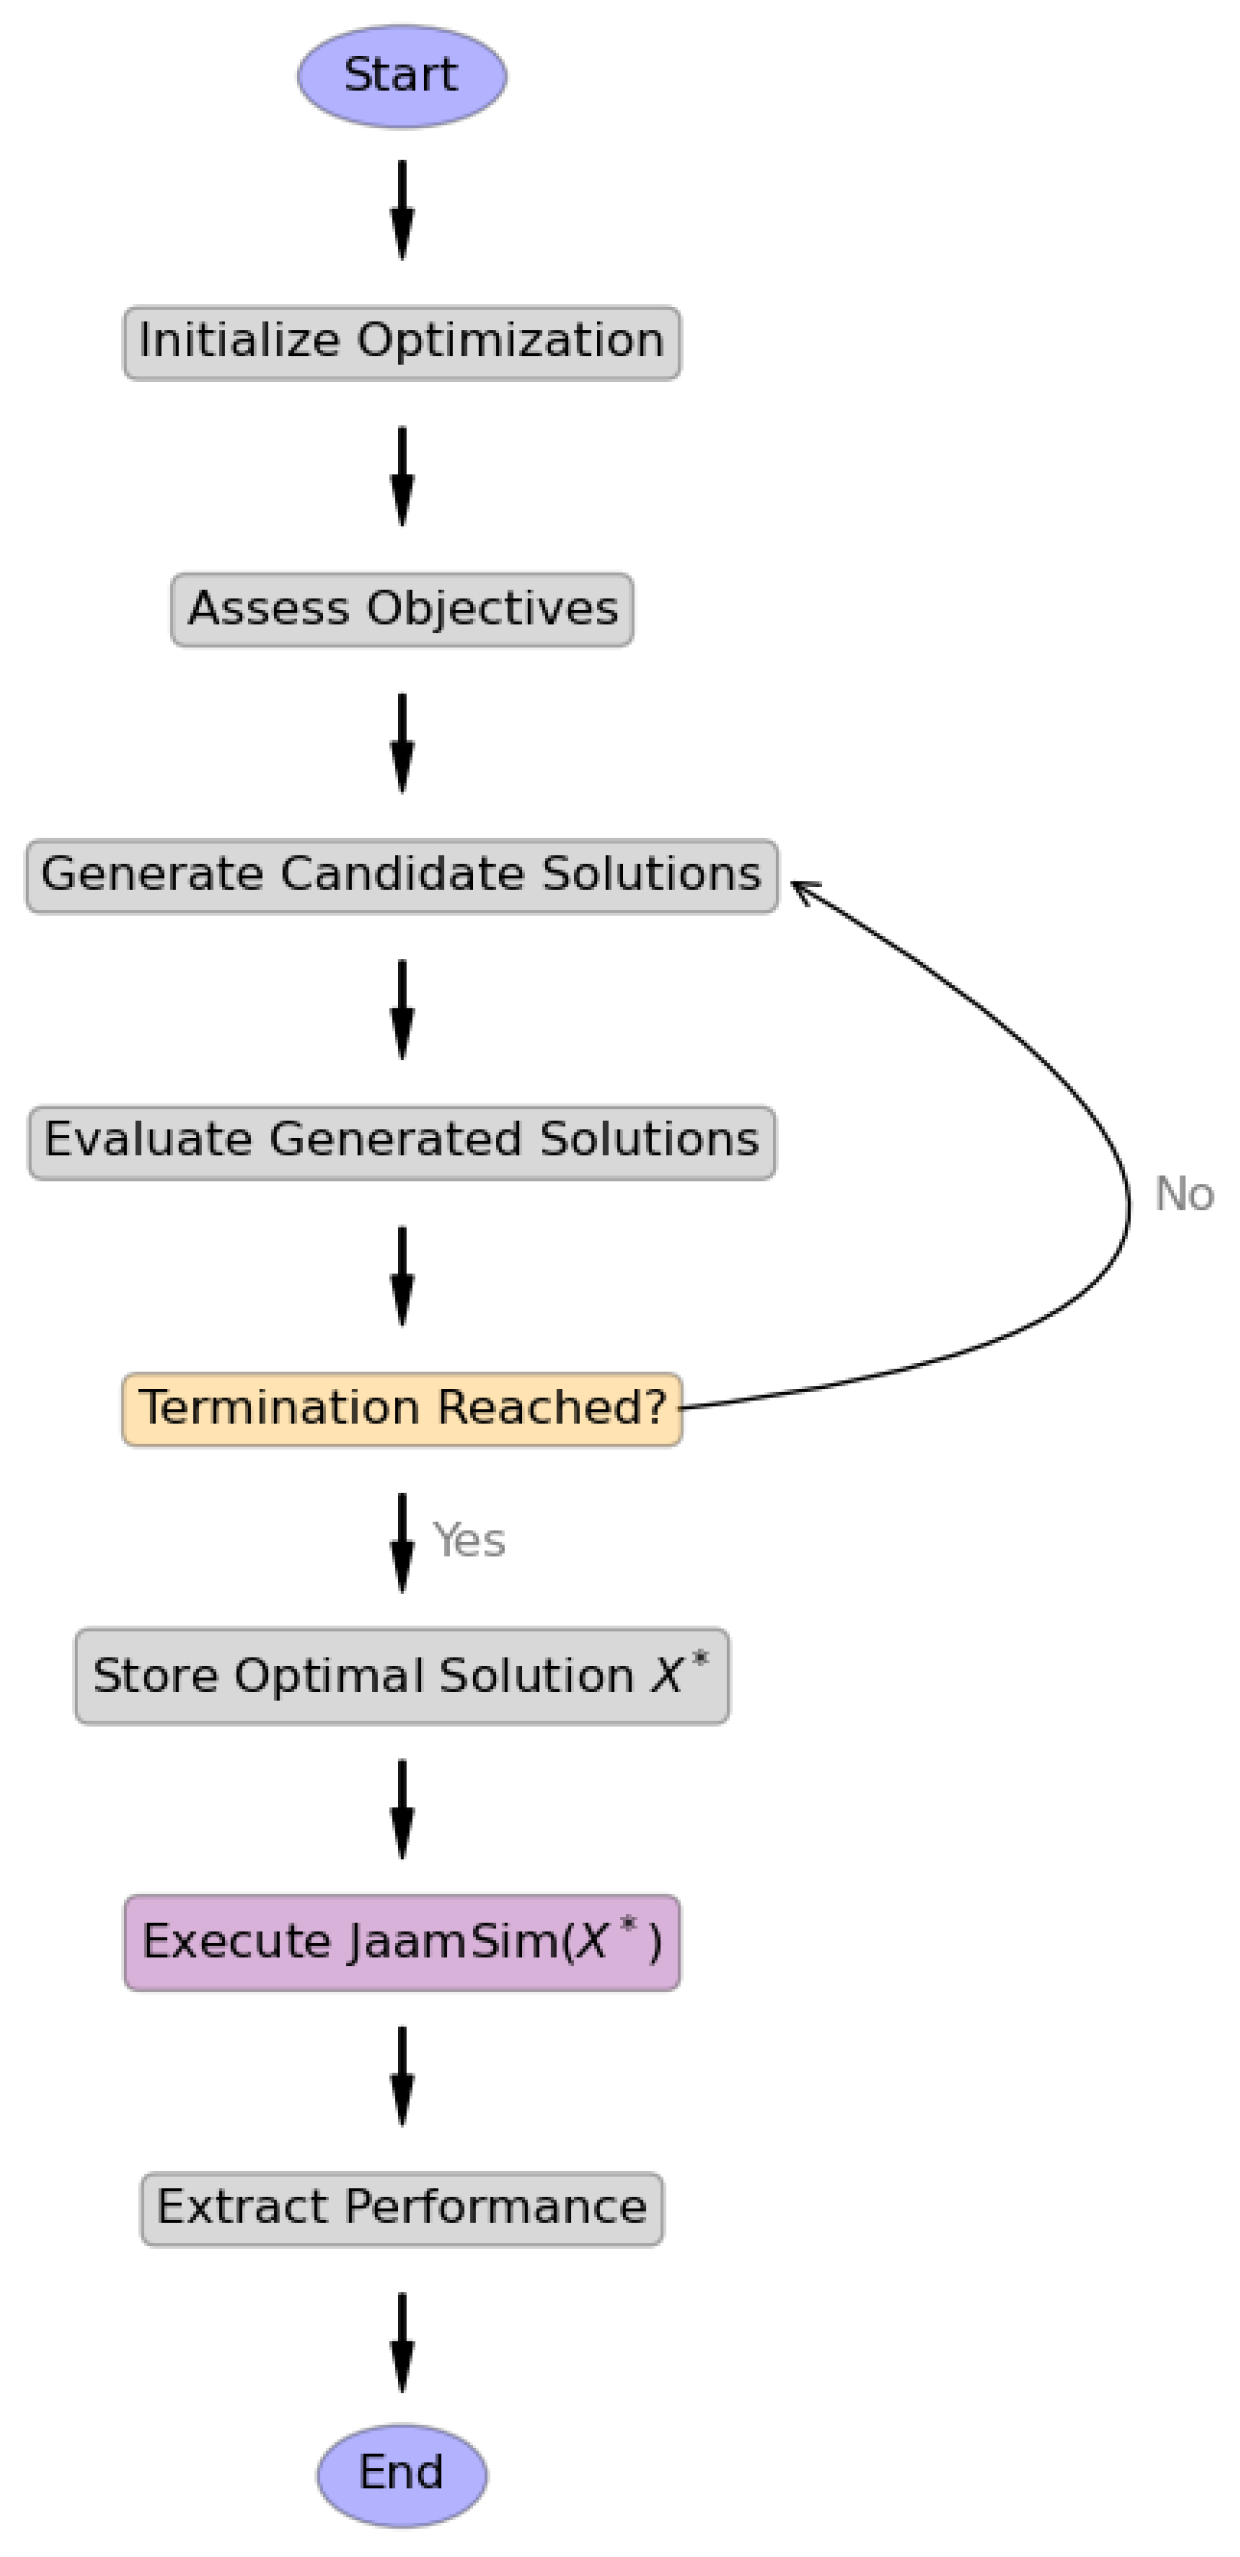
The solution chosen is the optimal one based on the criteria in this work. Afterward, the solution is again applied to the digital twins. Algorithm 1 illustrates the optimization process and the execution of JaamSim-based digital twins under optimal solutions.
Figure 3 presents the proposed optimization process in JaamSim. According to Algorithm 1, the key aspect is the OPTIMIZE function, which describes the iterative optimization process using an algorithm A, including GA and DE. The aim is to determine an optimal solution within the limits (, ). Candidate solutions are produced and assessed using the objective functions () at each iteration. This assessment determines the favourable ones for the next generations. The optimization loop concludes when the termination criteria are met (e.g., the maximum number of iterations ). The determined solution is transmitted to the Executed_JaamSim function. This function writes the optimal parameter values to a solution file and initiates simulation in JaamSim. Upon completion of the simulation, the results are extracted from the output using a set of performance metrics .
| Algorithm 1 Multi-Objective Optimization and Execution in JaamSim |
| Require: Objective functions |
| Require: Decision variables with bounds |
| Require: Optimization algorithm |
| Require: JaamSim model |
| Require: Maximum iterations |
|

Figure 3.
The optimization steps followed by the proposed framework.
4. Experimental Analysis
4.1. Setup
The proposed approach was evaluated over several digital twins of the studied manufacturing system under a series of experimental scenarios. The following digital twins were developed in JaamSim: BDOP, BSOP, HDOP, and HSOP. Given that simulations are a compute-intensive task, they were run in real-time on a laptop with an Intel i7-12650H CPU and NVIDIA RTX-3050 GPU. Apart from JaamSim, the library pymoo [41] was used for implementing and running optimization algorithms.
Table 1 presents the experimental scenarios, which represent manufacturing events that refer to dynamic conditions within the multi-product manufacturing system. Each scenario is defined based on seven average rates: PRO, RAW, REP, MAIN, BREAK, REC, and DEM; PRO and RAW refer to average rates of product production and raw material procurement; REP and MAIN denote the average rates for repair and maintenance activities; and BREAK and REC represent the average rates for system failures and recycling activities. DEM denotes the average rate of the arriving customer orders. The combination of these rates reflects fluctuating conditions of demand, breakdowns, and resource availability. The aim is to evaluate the performance of the digital twins under a variety of scenarios, where the conditions are dynamic and unpredictable. For example, in Scenario 21, the digital twin of the manufacturing system is evaluated under conditions of high demand and low reliability, where the manufacturing system must satisfy a high number of orders and cope with frequent operational disruptions. On the other hand, the manufacturing system in Scenario 1 is faced with low customer demand and infrequent disruptions. In this case, the system operates under less stressful conditions. The combinations of average rates were selected to evaluate the digital twins in terms of resilience, to identify their bottlenecks, and to understand how the fluctuating conditions affect their reliability and performance.

Table 1.
Average rates used in the digital twins during experimental scenarios.
Table 2 summarizes the values assumed by the coefficients found in the functions within the context of the present experimental analysis. Each of the assumed values affects the estimation of the key objectives, that is, the minimization of WIPs, the cost-effectiveness , and the service level . To select these values as optimal ones, we conducted a preliminary experimental analysis using Scenario 1 listed in Table 1 as a baseline. More specifically, the weights and illustrate the importance of production and inventory variables included in D-KAP- and S-KAP-based production policies, respectively. The coefficients of cost and revenue parameters (e.g., , , , etc.) of represent the significance of each parameter in the estimation of the manufacturing system’s performance in terms of cost-effectiveness.
Table 2.
The parameter values used in the experimental analysis of the JaamSim-based digital twins’ performance.
Throughout this section, the performance of the formulated digital twins and the integrated methodologies is assessed through a series of metrics. The implemented methodologies are the following: GA, PSO, ES, DE, and plain policies. Considering the latter, “plain policies” refers to the JaamSim-based digital twin that was not optimized by any optimization algorithm. The performance of the digital twins is evaluated in terms of inventory levels, service level, recycled items, and returned products. This evaluation will provide insights into the behavior of the manufacturing system within the manufacturing context.
Furthermore, we evaluate the simulation repetition and cost performance across the implemented methods. For the sake of the evaluation, the BSOP-based digital twins were used, and Scenario 1 was used as a baseline. Table 3 and Table 4 summarize the results from the one-way ANOVA analysis and the Tukey HSD post hoc test. A total of 30 replications per group were performed to ensure the statistical power requirements for detecting differences in group means. ANOVA tests the null hypothesis that the group means are equal. The analysis indicates that there is a statistically significant difference (p-value ≤ 0.05) and thus, the null hypothesis is safely rejected. The post hoc pairwise comparisons revealed that PSO, ES, and DE perform similarly, as no significant statistical differences have been detected (p-values > 0.85). In contrast, GA and plain policies have substantially lower mean values compared to their counterparts (p-values < 0.001). However, these methods display similar performance since there is no statistical difference between them (p-value = 0.97).
Table 3.
The table summarizes one-way ANOVA performed on the implemented methods.
Table 4.
Post hoc pairwise comparisons (Tukey HSD) of group means.
Table 5 presents statistics, computational costs, and 95% confidence intervals. The confidence intervals of PSO, ES, and DE are relatively similar and demonstrate higher performance than those of GA and the plain policies. These observations further support the evidence presented in Table 3 and Table 4. Considering the computational cost, the ES manages to optimize the objective functions at 3.24 s. It is the lowest computation cost compared to those of the other optimization methods, demonstrating the computational efficiency of ES. The discrepancy in the computational costs is due to the different mechanisms of each method, such as update rules and search strategies.
Table 5.
Statistics and 95% confidence intervals (CIs) for each implemented method.
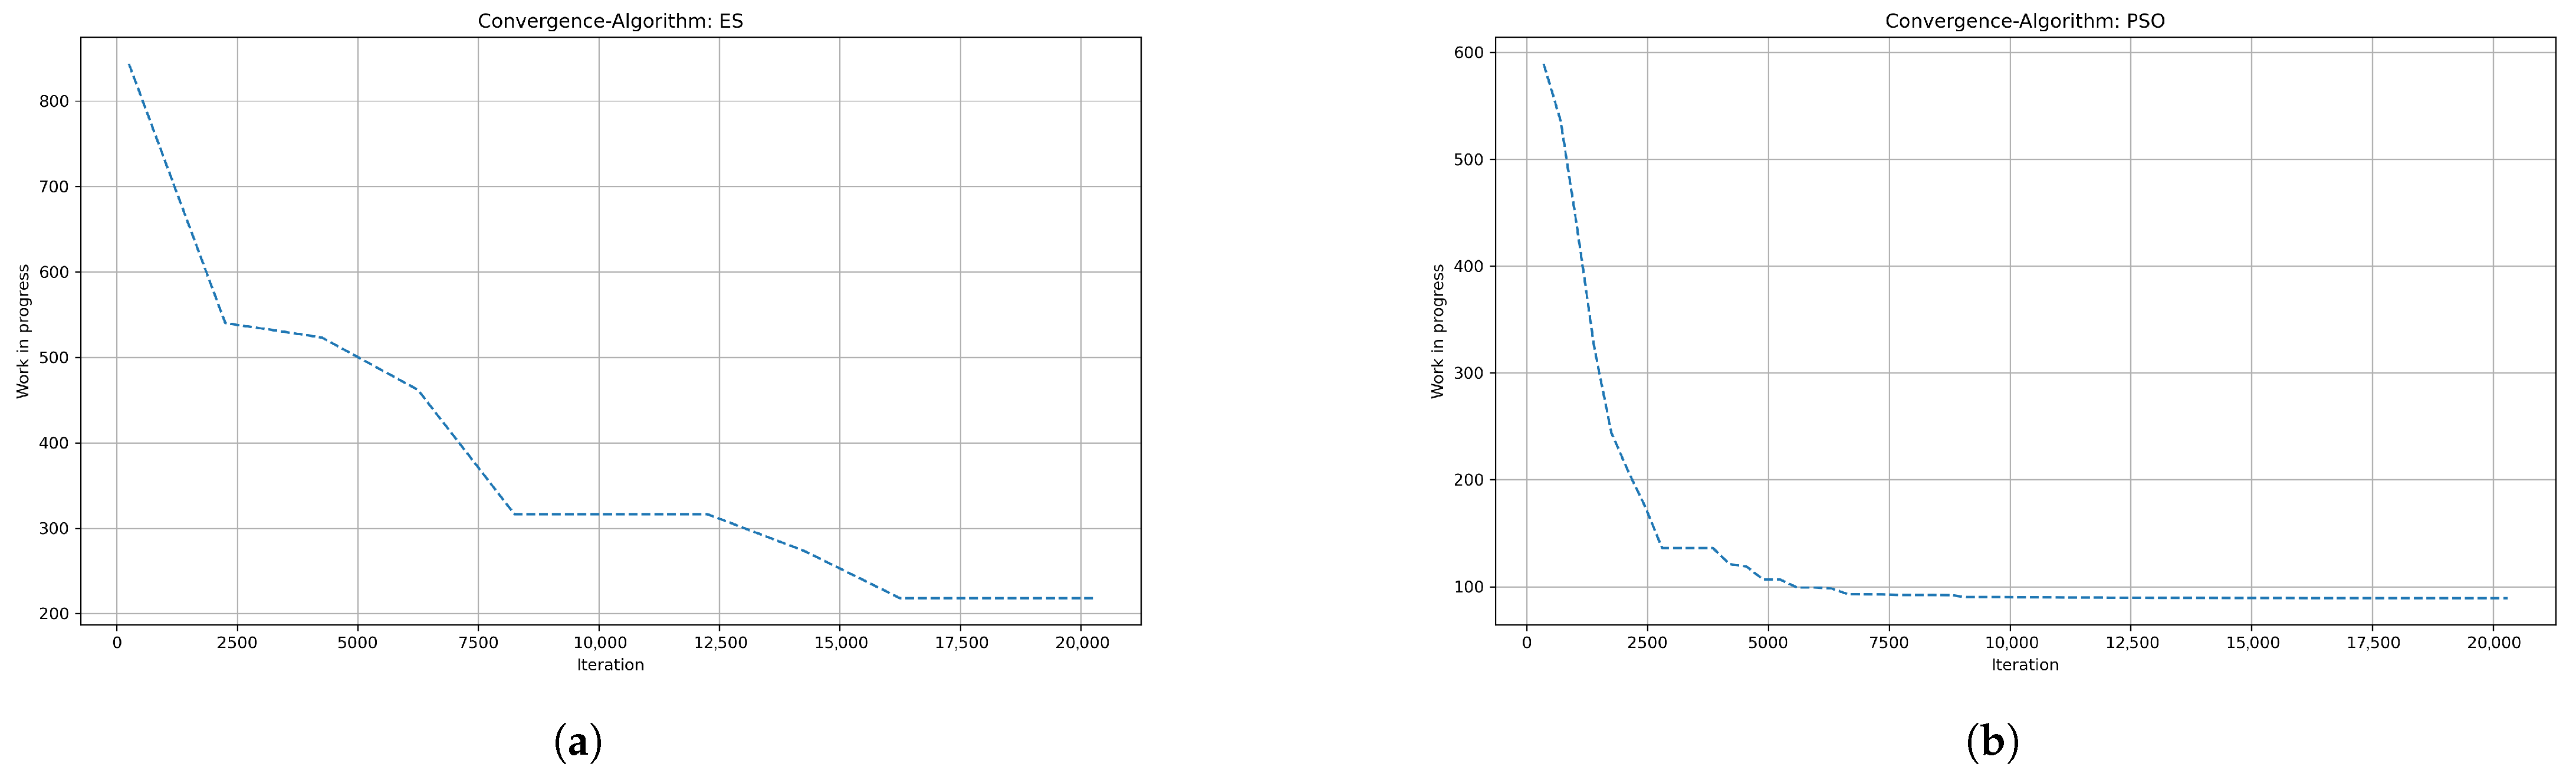
Finally, we evaluate the convergence curves of ES and PSO since they have the shortest and longest computation times, respectively. Again, the BSOP-based digital twins and Scenario 1 were considered. The performance of the algorithms is depicted in Figure 4. Both algorithms demonstrate an initial decline in WIP. This behavior can be attributed to the mechanisms implemented by the algorithms. ES exhibits faster decline due to the decentralized evaluation and selection, promptly eliminating suboptimal solutions. In contrast, PSO converges more slowly by progressively updating positions according to personal and global best solutions. These differences are prominent when the addressed problem is scaled to longer lines or finer scheduling resolutions. In that case, ES would maintain its fast convergence capability under the increased complexity, although it would require fine-tuning to keep solution diversity in large spaces. PSO, despite its initial slowness, would perform more reliably and consistently in complex and time-extended scheduling scenarios. Nevertheless, the next sections examine the performance of PSO and ES, along with their counterparts, in terms of cost-effectiveness, inventory, and service level.
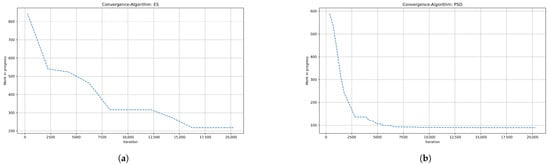
Figure 4.
Convergence curves of (a) ES and (b) PSO during the optimization of WIP.
4.2. Performance
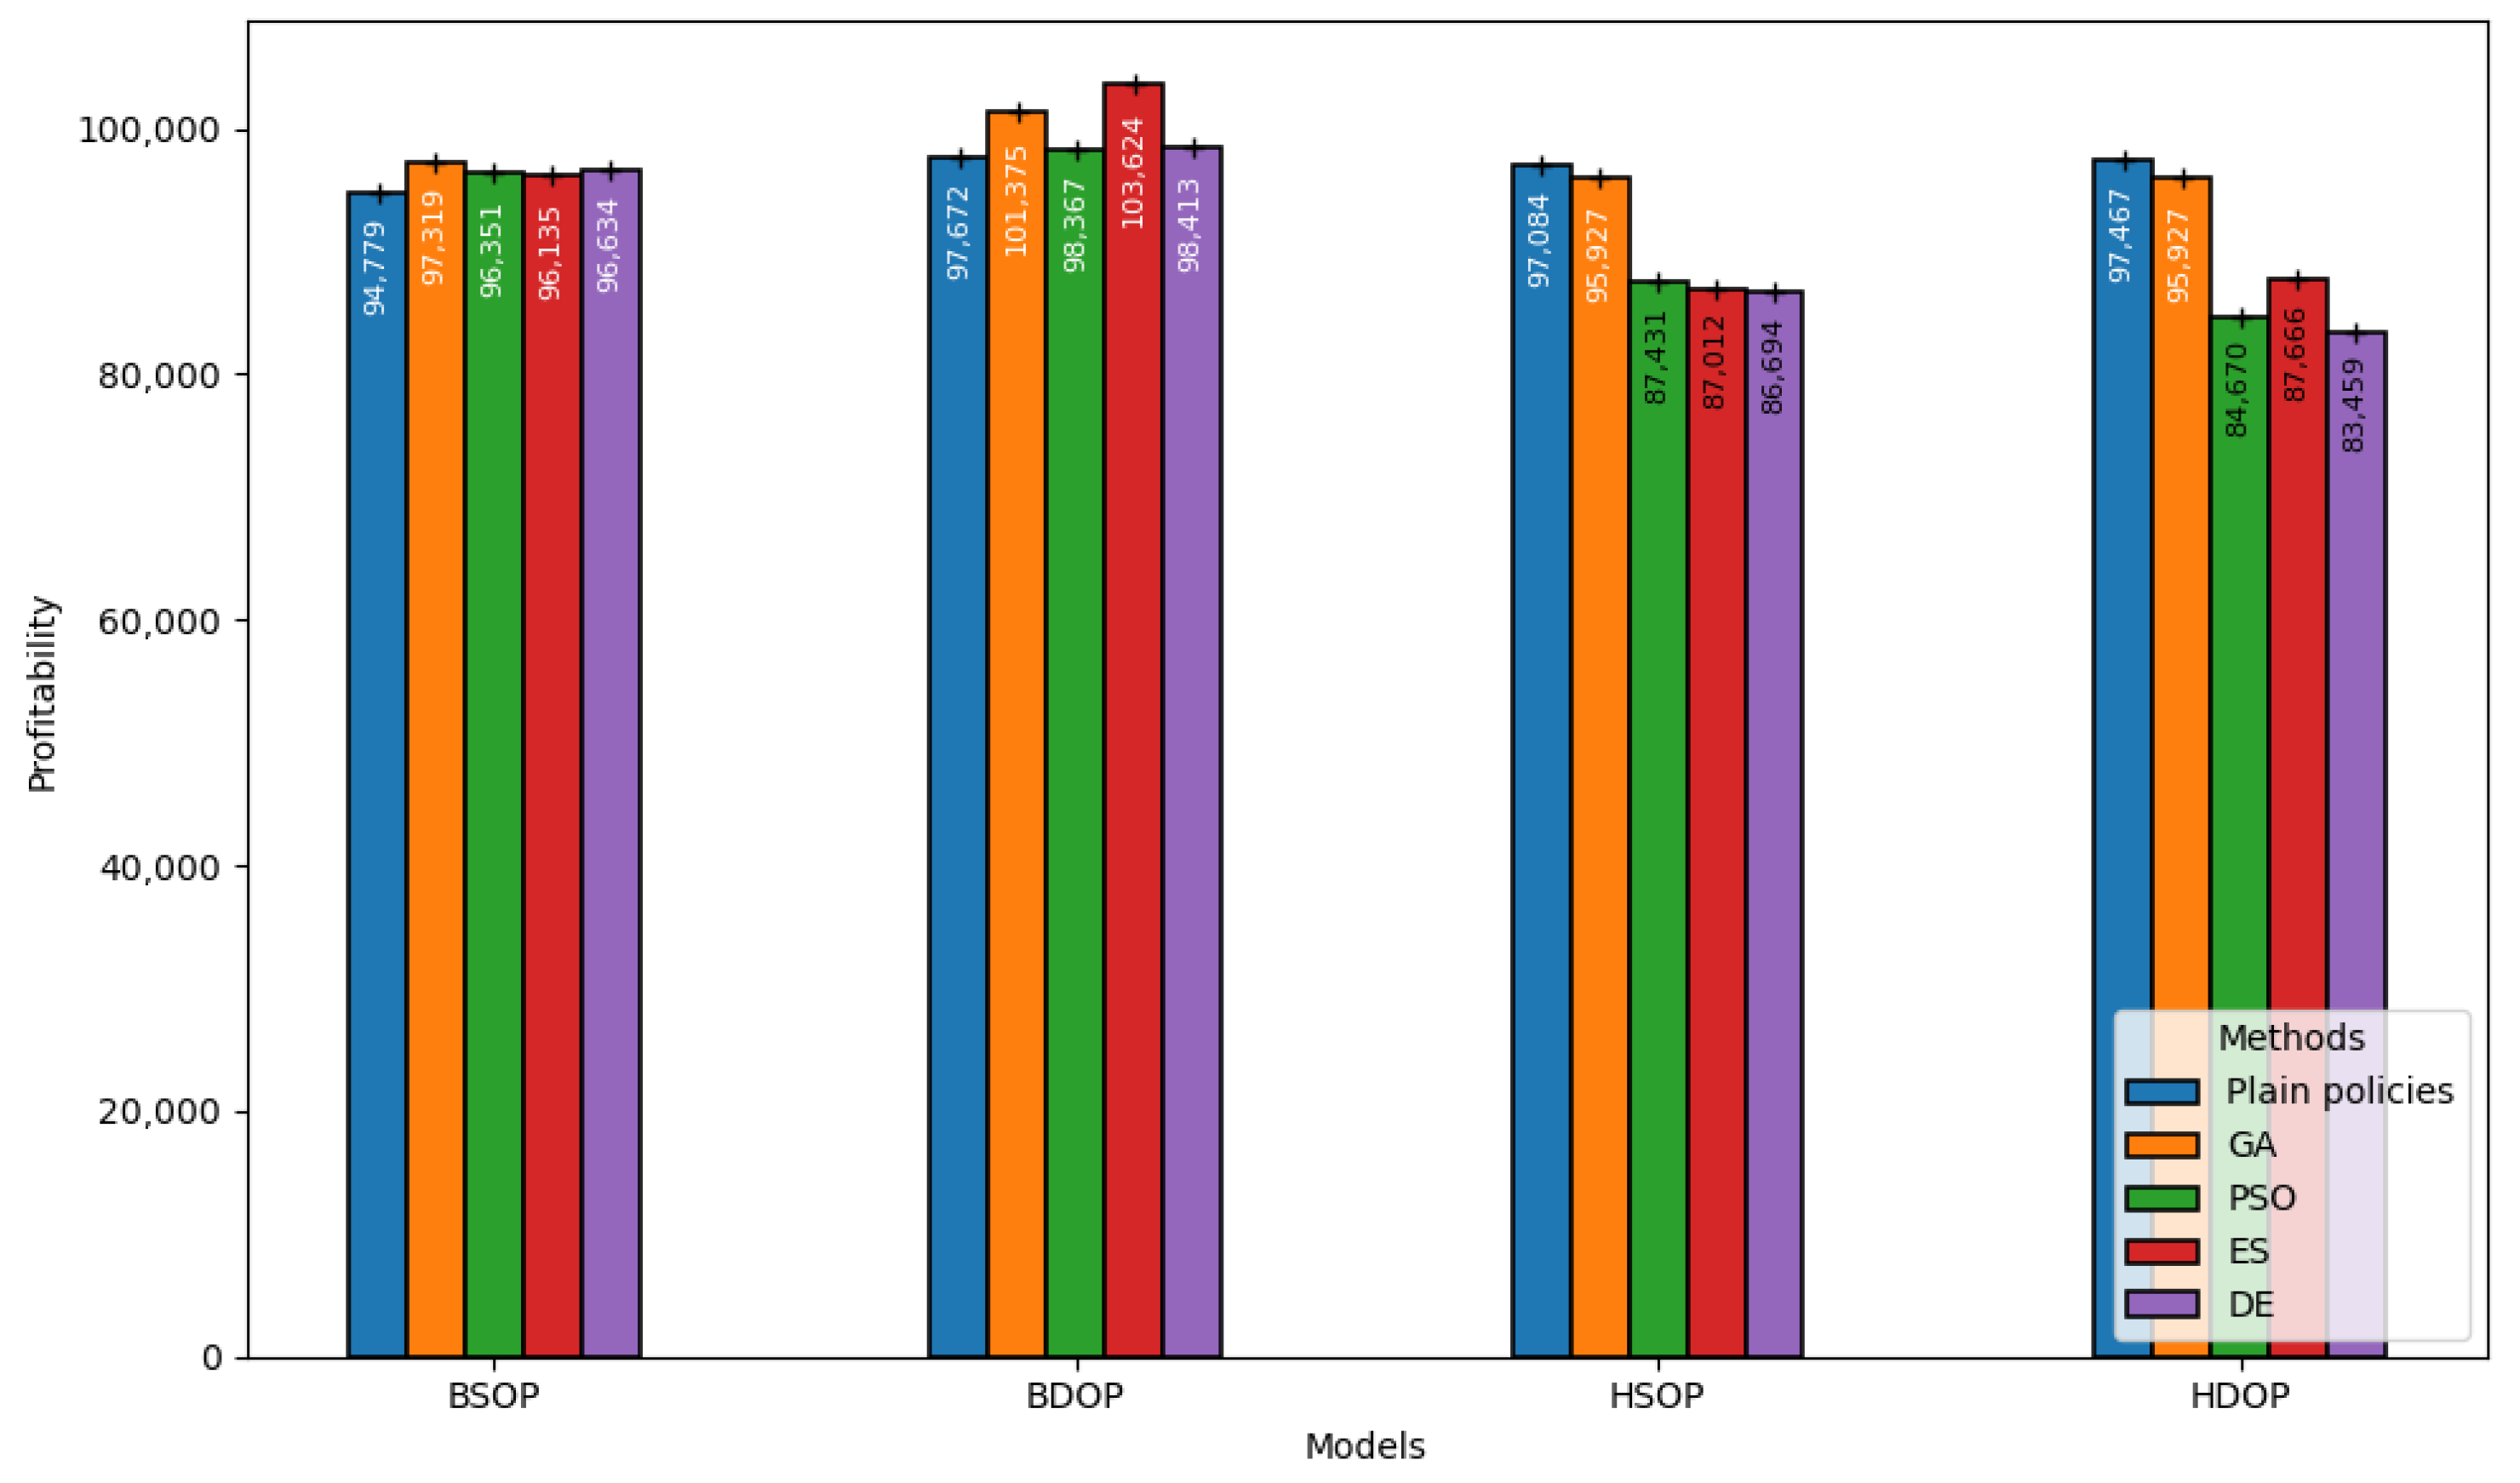
Figure 5 demonstrates the cost-effectiveness of the implemented JaamSim-based digital twins under each optimization algorithm. In general, the employed optimization algorithms improved the performance of the digital twins, except for the cases of HSOP and HDOP. It is illustrated that BDOP is the most performant model under the employed methods in the figure. More specifically, GA and ES considerably enhance the performance of the production policy. This demonstrates the efficacy of the optimization algorithm in optimizing both productivity and output. HSOP and HDOP obtain lesser profits when they are employing optimization algorithms, such as PSO and ES. This suggests that advanced optimization algorithms might not be effective for HSOP and HDOP, requiring further fine-tuning. Nevertheless, the improvement over the traditional ones is evident in the figure, as optimization algorithms are capable of determining optimal solutions given the defined objective functions.

Figure 5.
Performance of the JaamSim-based digital twins in terms of cost-effectiveness.
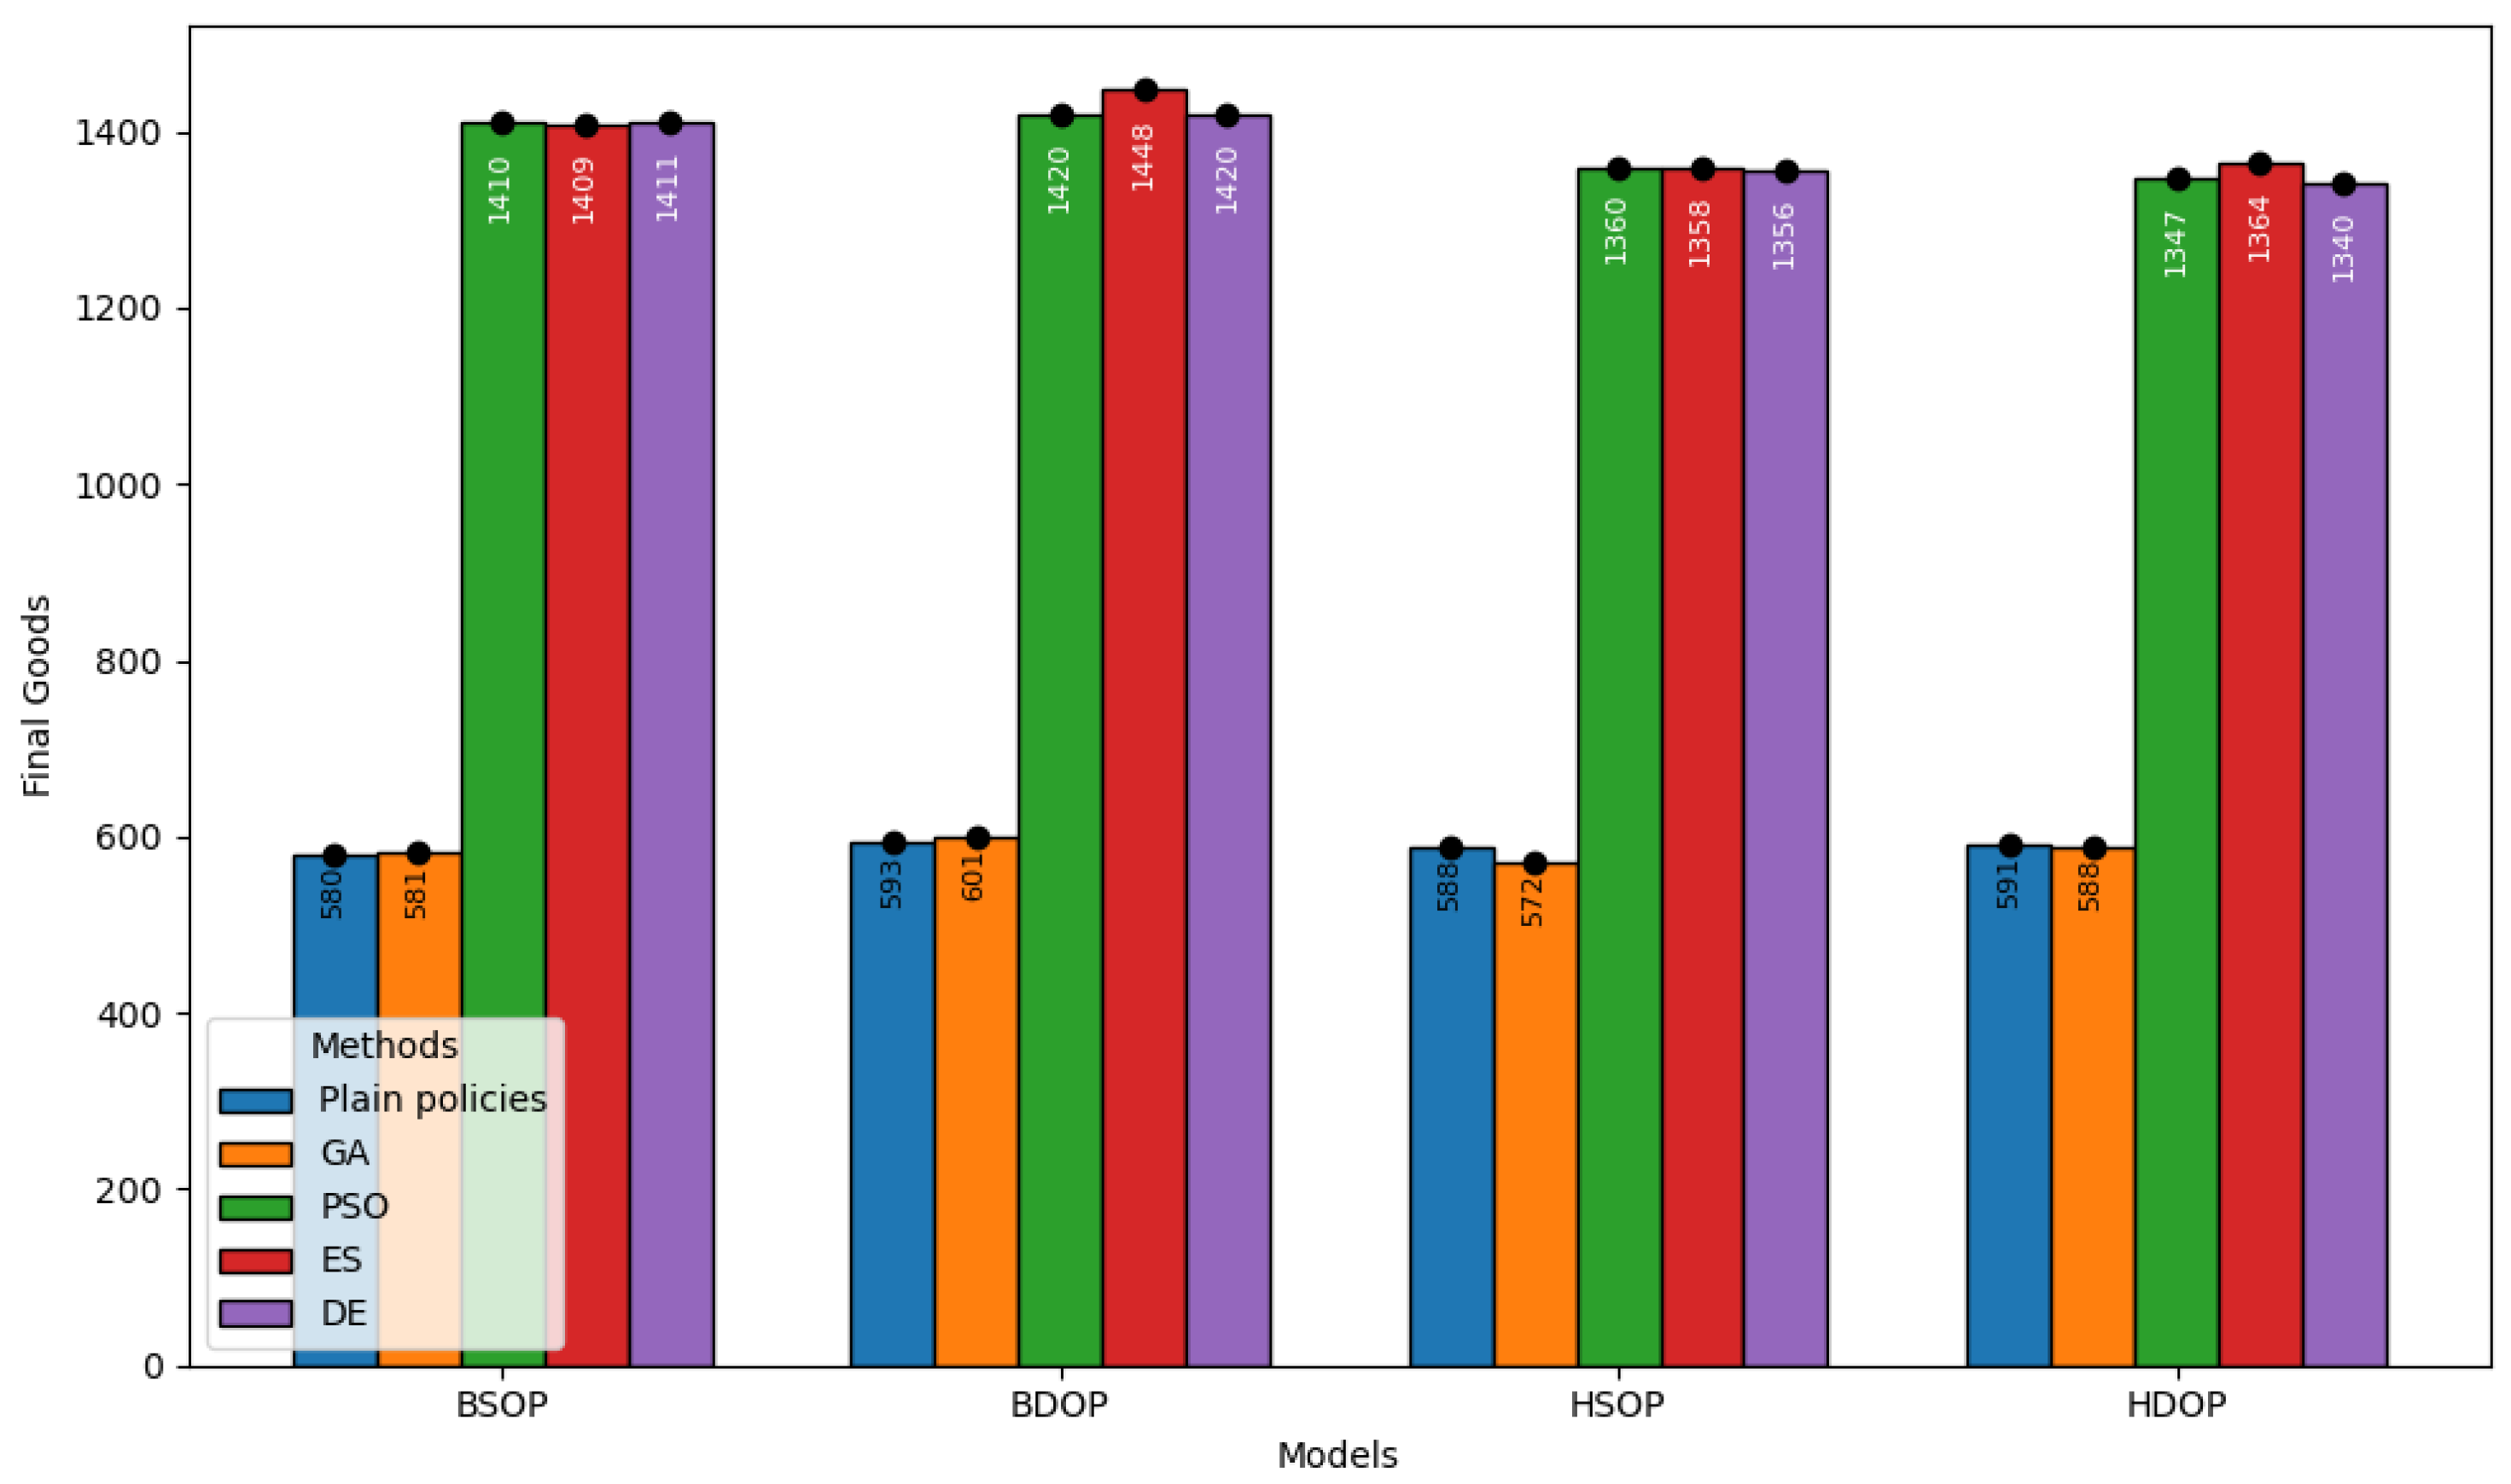
The finished goods stockpiled by each manufacturing model are given in Figure 6. Notably, BDOP under ES accumulated the largest number of finished goods. ES is efficient at optimizing production processes, achieving high productivity. The same trend is displayed by BSOP and BDOP implementing DE and PSO. GA achieved modest results across the digital twins compared to the ones optimized by PSO, DE, and ES. Plain manufacturing control policies yielded the lowest output across the digital twins. This demonstrates the inefficiency of traditional methods in improving production efficiency and profitability. This is a trend that necessitates the utilization of sophisticated methods to optimize dynamic and complex manufacturing systems. In this regard, optimization algorithms facilitate decision-making in manufacturing systems under unpredictable events, which contribute negatively to the system’s operation. Considering the efficiency of the digital twins, BDOP is the most performant one, yielding high product output. HSOP and HDOP generate fewer products than BDOP and BSOP. Thus, the BDOP-based models may be less efficient under dynamic conditions.

Figure 6.
Finished goods stored in the manufacturing system under control policies.
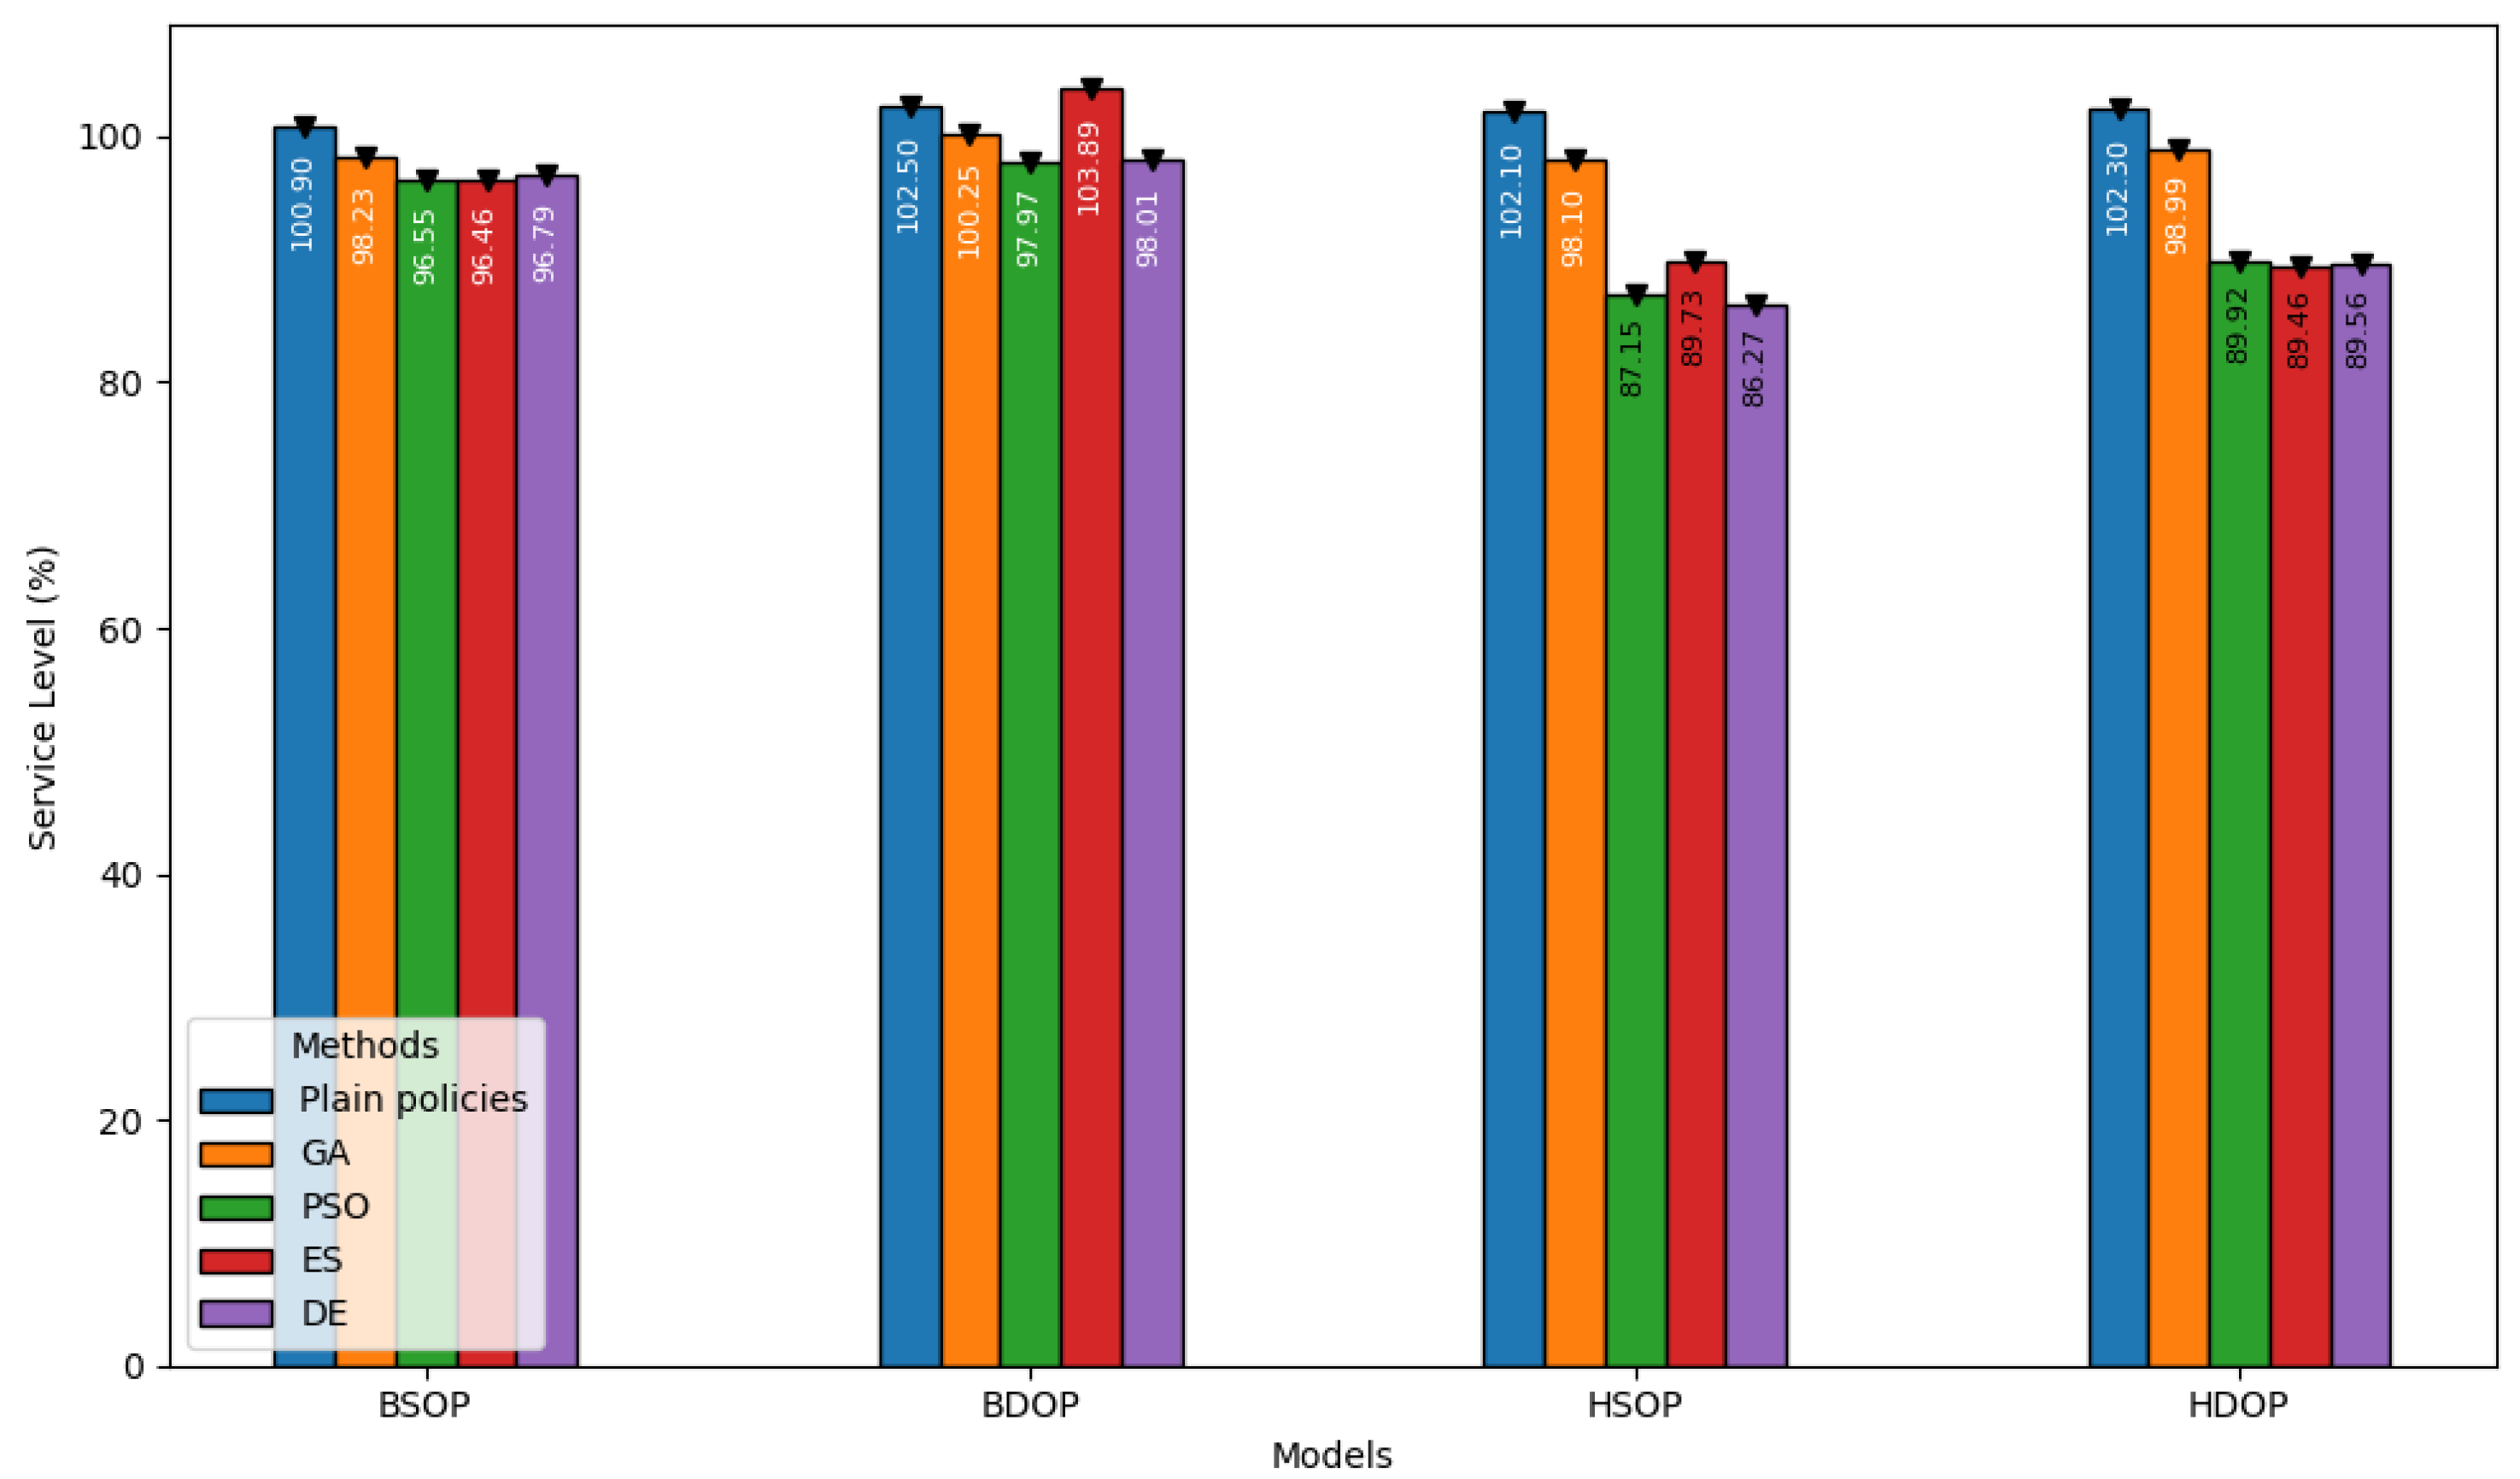
Figure 7 focuses on the service level achieved by the digital twins during simulation. BDOP and BSOP consistently achieved substantial service levels when they implemented only manufacturing control policies. This is an interesting observation highlighting the reliance of the manufacturing system on plain production control policies. A noteworthy note can be made for BSOP. The optimization methods, such as GA and PSO, yielded slightly lower service levels (between 96–98%) than the plain control policy. This suggests that there is a small trade-off between optimization and reliability due to peculiarities of the optimization algorithms. These prioritize short-term gains, aiming to improve both profitability and productivity. Under these terms, the excessive optimization occurs at the expense of long-term stability, resulting in reduced robustness in a varied manufacturing environment. This increases the variability and reduces the capacity to keep up with the demand. In combination with limitations of the optimization algorithms, the BSOP-based digital twin may fail to balance conflicting objectives, substantially affecting the service levels. In the case of HSOP and HDOP, PSO, ES, and DE achieved moderate service levels (under 90%), indicating that these digital twins under evolutionary and swarm-based algorithms might not be effective and productive. Finally, traditional digital twins, especially in the case of BDOP, displayed extremely high service levels. Given the above, it is clear that optimization algorithms may favor performance and profitability over system reliability under fluctuating manufacturing conditions.
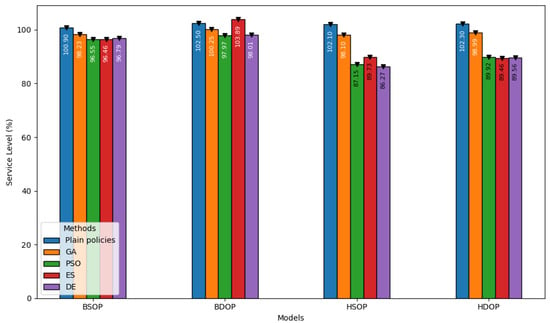
Figure 7.
Service level attained by the implemented JaamSim-based digital twins.
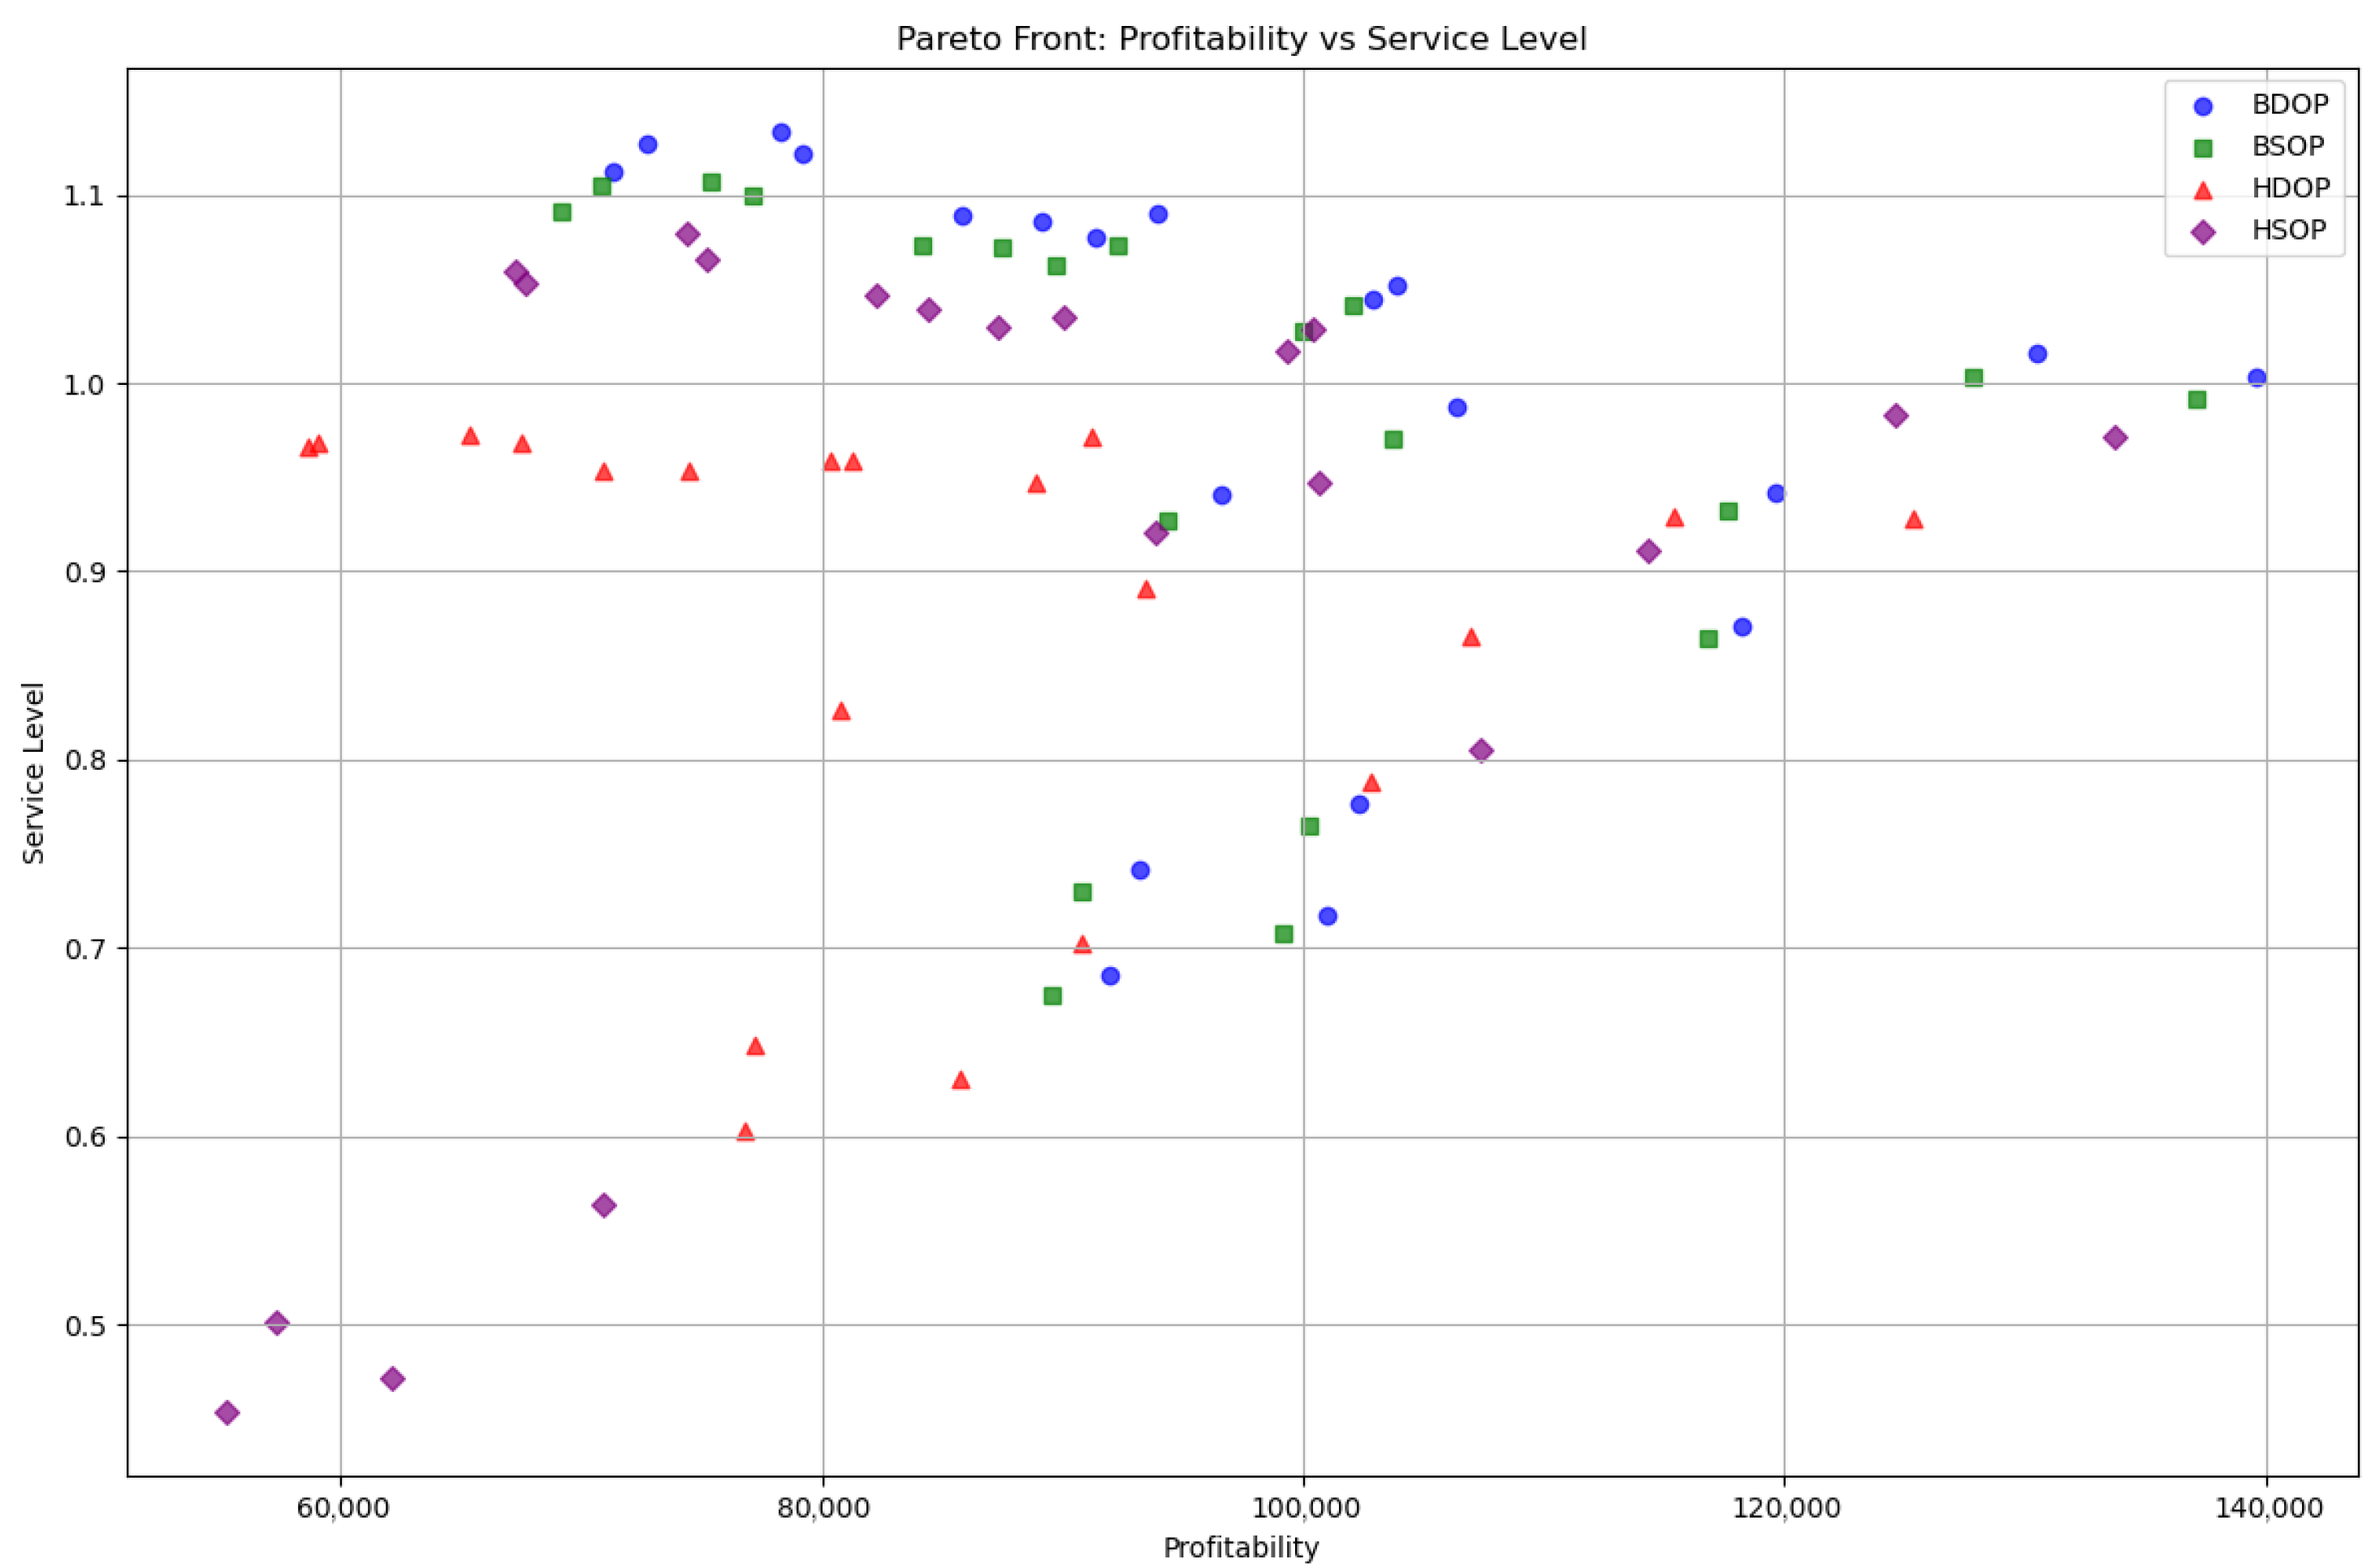
Figure 8 illustrates the cost-effectiveness vs. service levels within the context of the PSO-optimized digital twins. The plot indicates the following trends: the service levels tend to increase across the digital twins as the profitability of the digital twin increases. This correlation is present across the formulated digital twins, although they differ in terms of uniformity and scattering. For example, BSOP and BDOP present tight clustering in the upper-right quadrant. This suggests that they achieved both high profitability and service levels throughout the experimental scenarios. HDOP presents variability since it attained high service levels with average revenues. HSOP exhibits substantially lower service levels despite displaying moderate profitability in several scenarios. This observation indicates a potential inconsistency in the aforementioned production system. It is a key limitation of PSO as it tends to search for solutions that maximize cost-effectiveness without considering the service levels. Thus, some of the generated solutions converge to high revenues at the expense of service levels, explaining the reason why PSO may lead to reduced service levels.
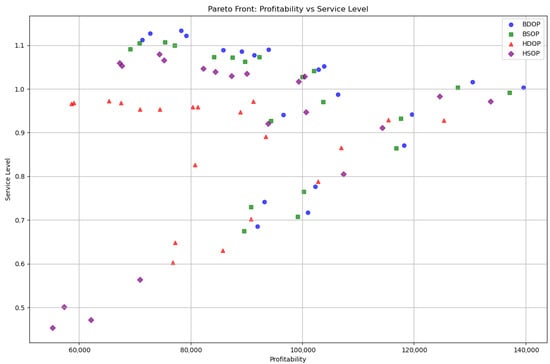
Figure 8.
Pareto front comparing profitability vs. service levels in the case of PSO-optimized digital twins.
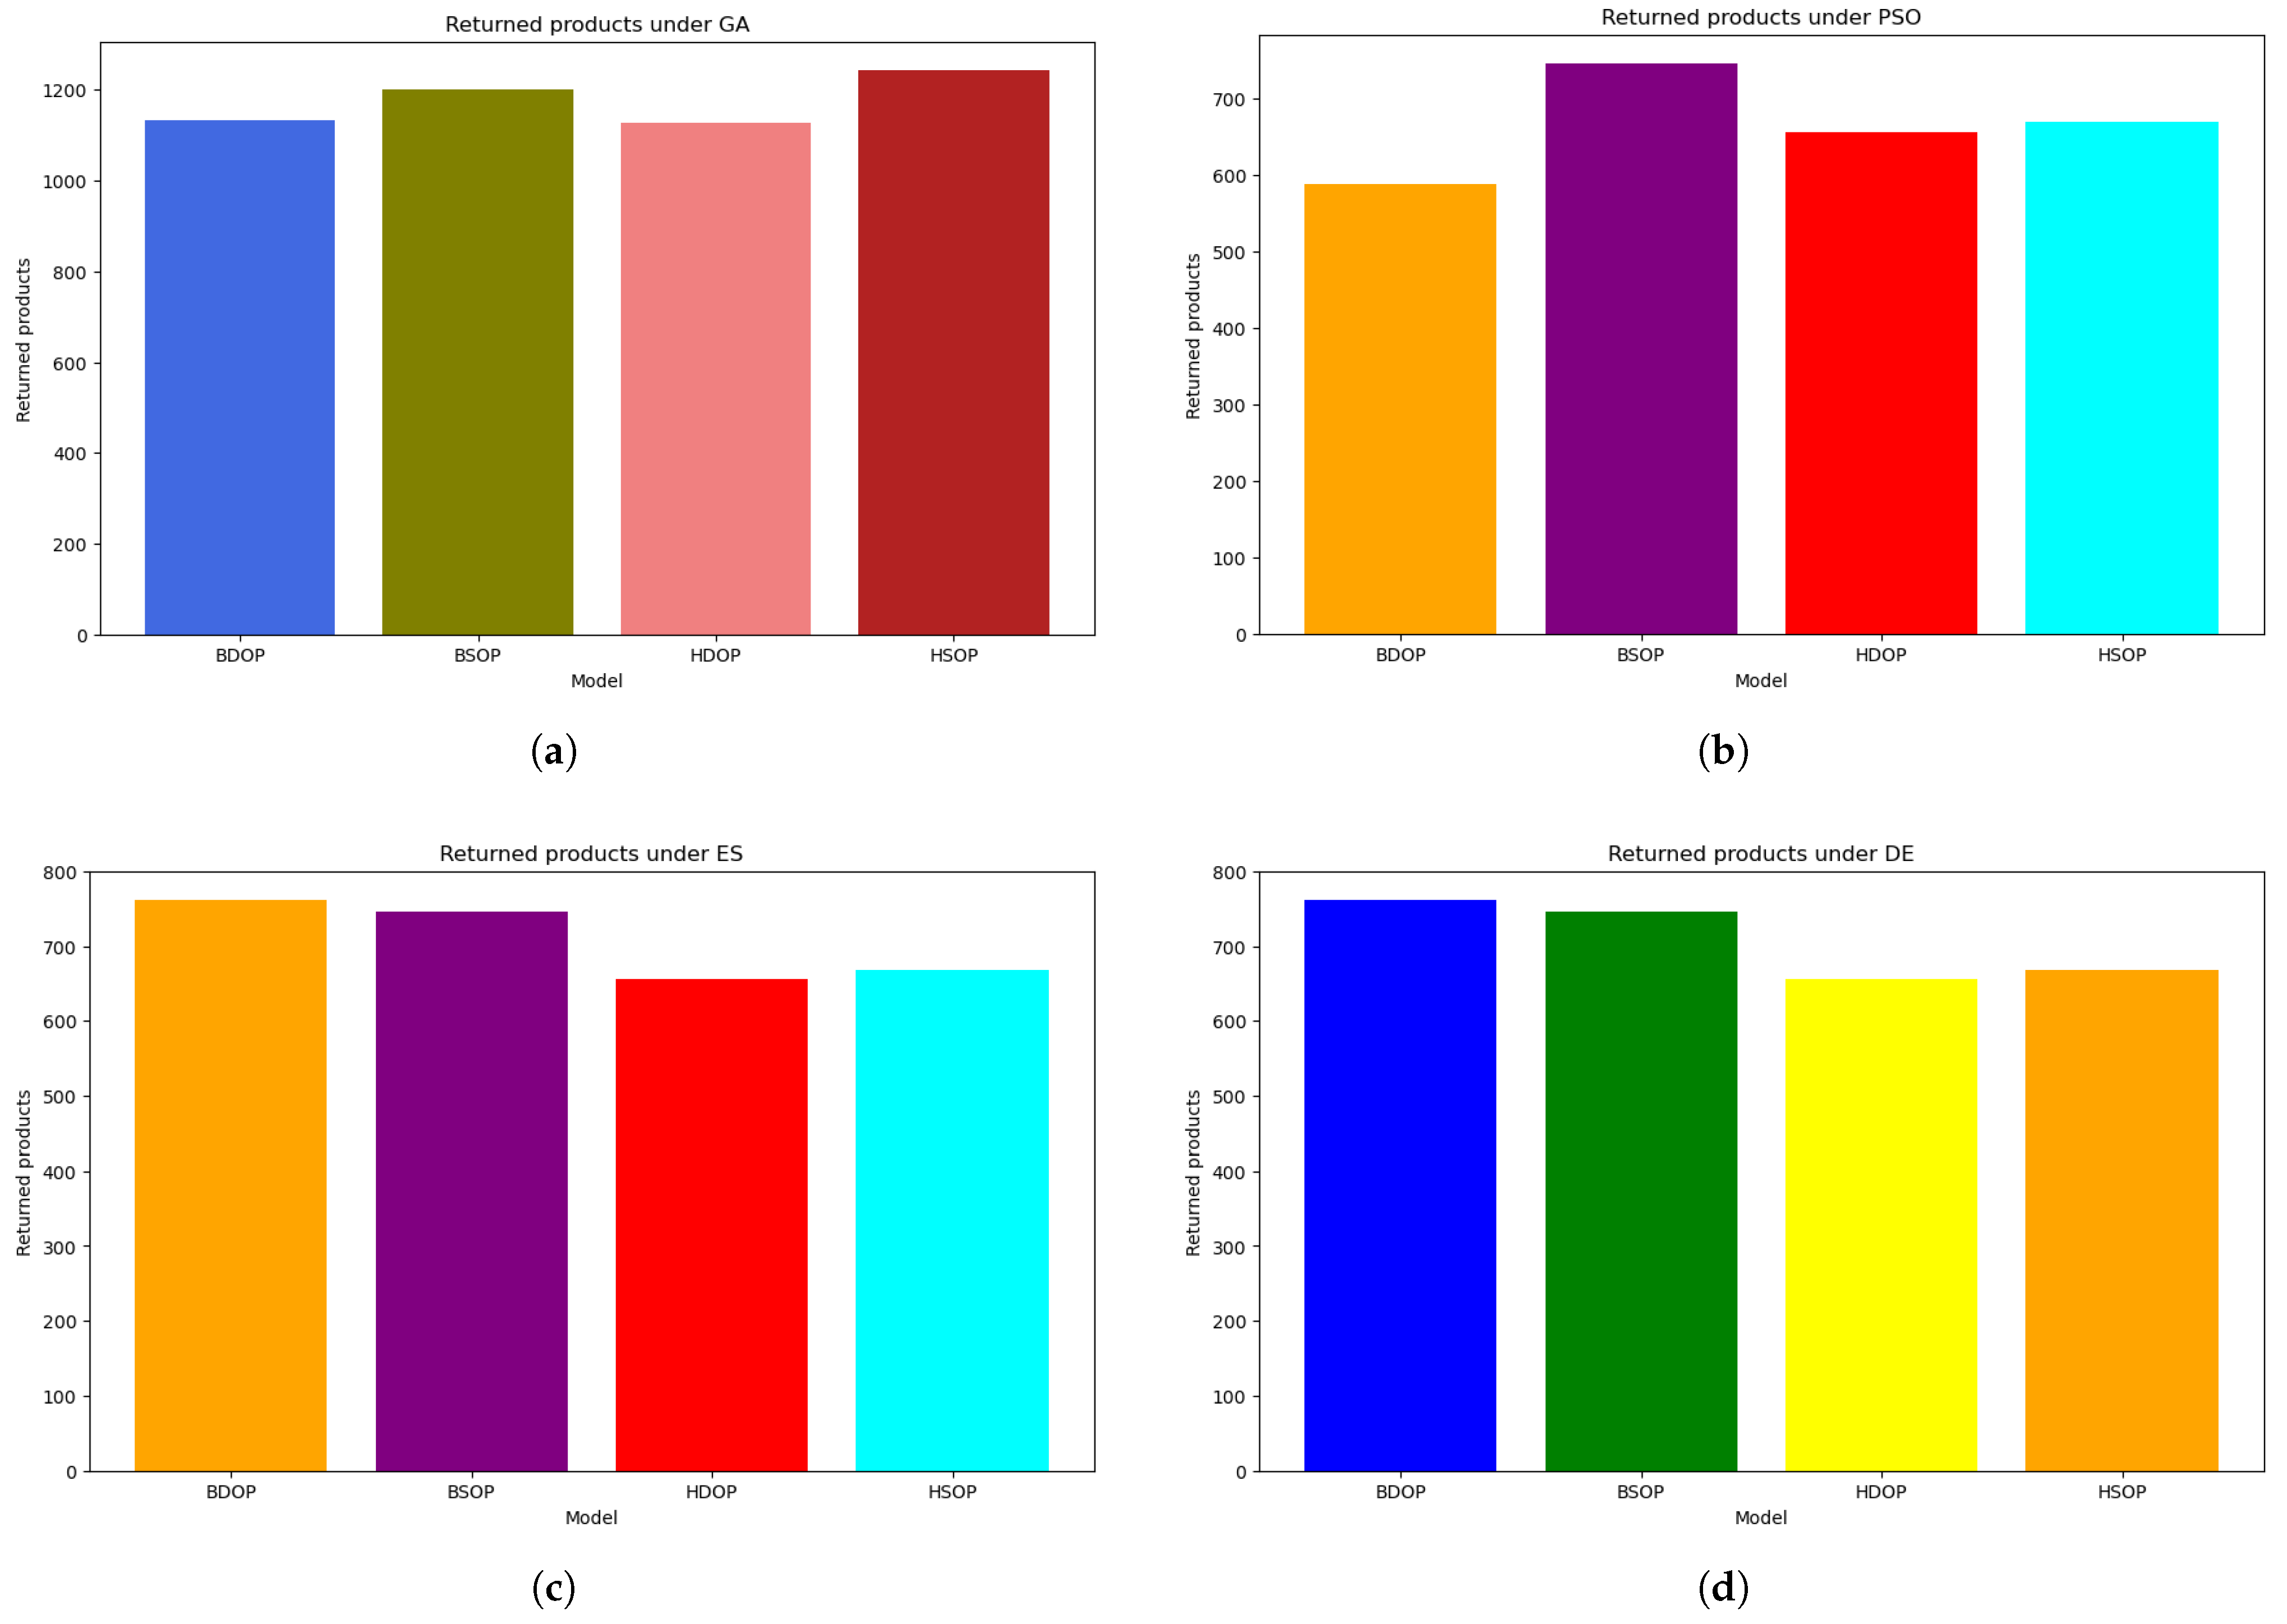
Figure 9a–d display the number of items recycled by each manufacturing model. In Figure 9a, PSO, ES, and DE achieve equal performance by recycling 3111 items. This is an indication supported by Figure 6. It is suggested that the digital twins under these algorithms produced a small number of defective items compared to alternative methods. On the other hand, GA recycled 3341 items. This suggests that the algorithm opted for solutions that favored recycling over producing activities, being efficient at satisfying pending orders, as already supported in Figure 6. Figure 9b demonstrates the items recycled under BSOP. PSO and DE recycled 3175, achieving a similar performance in terms of authorizing recycling activities. GA outperformed the other optimization algorithms by recycling 3337 items. This can be attributed to the capability of GA in evolving solutions over generations. As a result, the generated results are substantially optimized in terms of the recycling process.
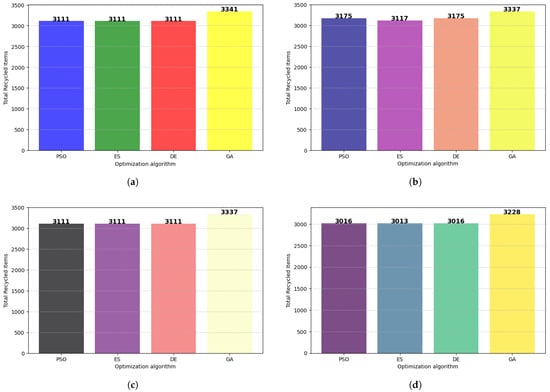
Figure 9.
Recycled products per model. (a) BDOP, (b) BSOP, (c) HDOP, and (d) HSOP.
Figure 9c shows the performance of HDOP in terms of recycling. The performance of the optimization algorithms is equivalent to the one depicted in Figure 9a. HDOP under GA recycles 3337 items, being the most efficient model in managing defective items. PSO, DE, and ES demonstrated moderate success in attaining 3111 recycled items. Given the above, GA is again the best algorithm for authorizing recycling activities in the studied manufacturing system. Finally, Figure 9d illustrates the quantity of recycled items under HSOP. In this figure, PSO and DE attained equivalent performance, recycling 3175 items. GA accumulated the majority of recycled items, while ES recycled fewer items. Still, GA displayed superior performance compared to the other optimization algorithms, as it generated solutions favoring recycling activities. While they demonstrated moderate success in recycling items, PSO and DE seemingly produce a few defective items, given the performance in Figure 6.
Figure 10a–d illustrate the returned items across the implemented digital twins. The subfigures reveal a trend: BDOP and BSOP attained a high number of returned products. This indicates that there are issues related to design, manufacturing, or quality control. In this regard, customers are dissatisfied with the quality of the acquired products, and thus, they returned them to the manufacturing system. This trend may also reflect the challenges of the BDOP and BSOP production policies to meet the current demand. As both production control policies prioritize demand and scheduling-based responsiveness, the digital twin may face issues related to delayed order arrival or inaccurate demand forecasts. This can lead to either overproduction or the production of items of inconsistent quality. In addition, the objective function of cost-effectiveness (Equation (22)) may not sufficiently penalize product returns. That is, focuses on short-term improvement of the system’s profitability, without considering long-term costs, such as loss of customer trust and reprocessing products.

Figure 10.
Returned products per optimization algorithm. (a) GA, (b) PSO, (c) ES, and (d) DE.
However, as indicated in Figure 6 and Figure 7, BDOP and BSOP achieved a substantial service level and stockpiled a high number of final goods. Despite their weakness in producing high-quality products, both digital twins under the optimization algorithms are substantially productive and profitable. On the other hand, Figure 10 illustrates that there is a high degree of customer satisfaction with the final goods produced by HDOP and HSOP. Both digital twins produced a significant number high quality final goods, maintaining their equipment in good condition.
5. Conclusions
This paper used evolution and swarm-based optimization algorithms and JaamSim-based digital twins to improve efficacy, cost-effectiveness, and resource management in manufacturing systems. The proposed method was tested and implemented in several digital twins of the studied manufacturing system, namely, BDOP, BSOP, HDOP, and HSOP. The evaluation was performed under dynamic events, which affected the operability of the digital twins. Results demonstrated the superiority of optimization algorithms in terms of probability, service level, and production events. In this regard, ES and DE performed better compared to traditional manufacturing control policies and other optimization algorithms. Considering recycling, GA exhibited superior performance, frequently authorizing recycling activities to minimize the number of defective products.
The findings of this paper highlight the necessity of incorporating advanced optimization algorithms in real-world manufacturing systems to optimize them according to dynamic and unpredictable circumstances. They also suggest that evolution-based optimization algorithms improve decision-making, maximizing productivity and resilience in several manufacturing areas, such as customer satisfaction and waste reduction.
The present research can be expanded in several ways in the future. First, the evolution and swarm-based algorithms can be combined with each other to exploit their strengths and improve the quality of the generated solutions. Machine learning can also be employed to optimize in real time the JaamSim-based digital twins under fluctuating conditions. This would improve the responsiveness and versatility of the proposed framework when implemented in dynamic manufacturing environments. Furthermore, the present study focuses on capturing system responsiveness through the service level metric, without accounting for the role of product quality in the system performance evaluation. Quality-based key performance indicators, such as first-pass yield, will be implemented in the future to tackle this limitation. Such a metric requires the implementation of a granular defect tracking mechanism in digital manufacturing environments. Finally, it would be interesting to explore the scalability and practicality of the approach by adopting it in multi-faced industrial settings through digital twins.
Author Contributions
Conceptualization, P.D.P., G.P., and D.E.K.; methodology, P.D.P., G.P., and D.E.K.; software, P.D.P. and G.P.; validation, P.D.P., G.P., and D.E.K.; investigation, P.D.P., G.P., and D.E.K.; formal analysis, P.D.P.; data curation, P.D.P. and G.P.; writing—original draft preparation, P.D.P.; writing—review and editing, P.D.P., G.P., and D.E.K.; visualization, P.D.P.; supervision, D.E.K. All authors have read and agreed to the published version of the manuscript.
Funding
This research received no external funding.
Data Availability Statement
The original contributions presented in this study are included in the article. Further inquiries can be directed to the corresponding author.
Conflicts of Interest
The authors declare no conflicts of interest.
References
- Paraschos, P.D.; Koulouriotis, D.E. Learning-based production, maintenance, and quality optimization in smart manufacturing systems: A literature review and trends. Comput. Ind. Eng. 2024, 198, 110656. [Google Scholar] [CrossRef]
- Park, K.T.; Son, Y.H.; Ko, S.W.; Noh, S.D. Digital Twin and Reinforcement Learning-Based Resilient Production Control for Micro Smart Factory. Appl. Sci. 2021, 11, 2977. [Google Scholar] [CrossRef]
- Samsonov, V.; Hicham, K.B.; Meisen, T. Reinforcement Learning in Manufacturing Control: Baselines, challenges and ways forward. Eng. Appl. Artif. Intell. 2022, 112, 104868. [Google Scholar] [CrossRef]
- Sharma, A.; Kosasih, E.; Zhang, J.; Brintrup, A.; Calinescu, A. Digital Twins: State of the art theory and practice, challenges, and open research questions. J. Ind. Inf. Integr. 2022, 30, 100383. [Google Scholar] [CrossRef]
- Ivanov, D. Conceptual and formal models for design, adaptation, and control of digital twins in supply chain ecosystems. Omega 2025, 137, 103356. [Google Scholar] [CrossRef]
- Loaiza, J.H.; Cloutier, R.J. Analyzing the Implementation of a Digital Twin Manufacturing System: Using a Systems Thinking Approach. Systems 2022, 10, 22. [Google Scholar] [CrossRef]
- Yao, J.F.; Yang, Y.; Wang, X.C.; Zhang, X.P. Systematic review of digital twin technology and applications. Vis. Comput. Ind. Biomed. Art 2023, 6, 10. [Google Scholar] [CrossRef] [PubMed]
- Belo, R.C.; Pimenta, M.S.; Salvador, T.T.; Petry, R.H.; Abel, M. Fundamental requirements of Digital Twins for production system in Oil and Gas Industry: A systematic literature review. Inf. Softw. Technol. 2025, 184, 107742. [Google Scholar] [CrossRef]
- Gaspar-Cunha, A.; Melo, J.; Marques, T.; Pontes, A. A Review on Injection Molding: Conformal Cooling Channels, Modelling, Surrogate Models and Multi-Objective Optimization. Polymers 2025, 17, 919. [Google Scholar] [CrossRef] [PubMed]
- Kober, C.; Buxbaum-Conradi, S.; Fette, M.; Wulfsberg, J.P. Digital Twins: A Critical Perspective and Research Trends. In Proceedings of the 2024 IEEE International Conference on Industrial Engineering and Engineering Management (IEEM), Bangkok, Thailand, 15–18 December 2024; pp. 749–754. [Google Scholar] [CrossRef]
- Malik, S.; Kim, D. Improved Control Scheduling Based on Learning to Prediction Mechanism for Efficient Machine Maintenance in Smart Factory. Actuators 2021, 10, 27. [Google Scholar] [CrossRef]
- Ata, M.; Corum, A. The Impact of Return Disposal on Order Variance in a Hybrid Manufacturing and Remanufacturing System. IEEE Trans. Eng. Manag. 2022, 70, 2574–2583. [Google Scholar] [CrossRef]
- Onyeocha, C.E.; Khoury, J.; Geraghty, J. A comparison of Kanban-Like control strategies in a multi-product manufacturing system under erratic demand. In Proceedings of the 2013 IEEE Winter Simulations Conference (WSC), Washington, DC, USA, 8–11 December 2013; pp. 2730–2741. [Google Scholar] [CrossRef]
- Paraschos, P.D.; Koulinas, G.K.; Koulouriotis, D.E. Reinforcement Learning-Based Optimization for Sustainable and Lean Production within the Context of Industry 4.0. Algorithms 2024, 17, 98. [Google Scholar] [CrossRef]
- Chen, Z.; Zou, J.; Wang, W. Digital twin-oriented collaborative optimization of fuzzy flexible job shop scheduling under multiple uncertainties. Sādhanā 2023, 48, 78. [Google Scholar] [CrossRef]
- Ricondo, I.; Porto, A.; Ugarte, M. A digital twin framework for the simulation and optimization of production systems. Procedia CIRP 2021, 104, 762–767. [Google Scholar] [CrossRef]
- Mei, S.; Xie, Y.; Liu, J.; Wu, J.; Zhang, C. Physics-based modeling and intelligent optimal decision method for digital twin system towards sustainable CNC equipment. Robot. Comput.-Integr. Manuf. 2025, 95, 103028. [Google Scholar] [CrossRef]
- O’Connell, E.; O’Brien, W.; Bhattacharya, M.; Moore, D.; Penica, M. Digital Twins: Enabling Interoperability in Smart Manufacturing Networks. Telecom 2023, 4, 265–278. [Google Scholar] [CrossRef]
- Moiceanu, G.; Paraschiv, G. Digital Twin and Smart Manufacturing in Industries: A Bibliometric Analysis with a Focus on Industry 4.0. Sensors 2022, 22, 1388. [Google Scholar] [CrossRef] [PubMed]
- Liu, Q.; Wang, X.; Guan, Z.; Li, Z.; Yang, L. Ply Optimization of Composite Laminates for Processing-Induced Deformation and Buckling Eigenvalues Based on Improved Genetic Algorithm. Materials 2025, 18, 345. [Google Scholar] [CrossRef] [PubMed]
- Peng, S.; Du, L.; Che, L.; Jin, Z. Dimensional multi-objective optimization design for 2RPU-RPS parallel mechanism. Robotica 2025, 43, 1087–1109. [Google Scholar] [CrossRef]
- Ren, J.; Wang, S.; Ren, K. Multi-objective optimization of grinding process parameters for complicated worm space surface based on the grey wolf optimization algorithm. Adv. Mech. Eng. 2025, 17. [Google Scholar] [CrossRef]
- Fu, Y.; Zhou, M.; Guo, X.; Qi, L.; Gao, K.; Albeshri, A. Multiobjective Scheduling of Energy-Efficient Stochastic Hybrid Open Shop with Brain Storm Optimization and Simulation Evaluation. IEEE Trans. Syst. Man Cybern. Syst. 2024, 54, 4260–4272. [Google Scholar] [CrossRef]
- Tran, L.V.; Huynh, B.H.; Akhtar, H. Ant Colony Optimization Algorithm for Maintenance, Repair and Overhaul Scheduling Optimization in the Context of Industrie 4.0. Appl. Sci. 2019, 9, 4815. [Google Scholar] [CrossRef]
- Wei, T.; Guo, X.; Zhou, M.; Wang, J.; Liu, S.; Qin, S.; Tang, Y. A Multiobjective Discrete Harmony Search Optimizer for Disassembly Line Balancing Problems Considering Human Factors. IEEE Trans. Hum.-Mach. Syst. 2025, 55, 124–133. [Google Scholar] [CrossRef]
- Jung, J.; Park, K.; Lee, H.; Cho, B.; Ryu, S. Comparative Study of Multi-objective Bayesian Optimization and NSGA-III based Approaches for Injection Molding Process. Adv. Theory Simul. 2024, 7, 2400135. [Google Scholar] [CrossRef]
- Babor, M.; Pedersen, L.; Kidmose, U.; Paquet-Durand, O.; Hitzmann, B. Application of Non-Dominated Sorting Genetic Algorithm (NSGA-II) to Increase the Efficiency of Bakery Production: A Case Study. Processes 2022, 10, 1623. [Google Scholar] [CrossRef]
- Baghizadeh, K.; Ebadi, N.; Zimon, D.; Jum’a, L. Using Four Metaheuristic Algorithms to Reduce Supplier Disruption Risk in a Mathematical Inventory Model for Supplying Spare Parts. Mathematics 2022, 11, 42. [Google Scholar] [CrossRef]
- Guo, S.; Huang, Y.; Guo, J.; Peng, Z.; Du, B. Modeling and optimization of batch scheduling problem considering the process granularity in shared manufacturing. Comput. Ind. Eng. 2025, 205, 111198. [Google Scholar] [CrossRef]
- Bi, Y.; Ning, X.; Zhao, S. Optimization of stamping workshop line layout based on improved PSO algorithm. Discov. Appl. Sci. 2025, 7, 267. [Google Scholar] [CrossRef]
- Hou, Y.; Liao, X.; Chen, G.; Chen, Y. Co-Evolutionary NSGA-III with deep reinforcement learning for multi-objective distributed flexible job shop scheduling. Comput. Ind. Eng. 2025, 203, 110990. [Google Scholar] [CrossRef]
- Vaidya, S.; Jethava, G. Elevating manufacturing excellence with multilevel optimization in smart factory cloud computing using hybrid model. Clust. Comput. 2025, 28, 342. [Google Scholar] [CrossRef]
- Novarika, W.; Sinaga, S.B.; Prayogi, S.Y. Reducing operational costs in a manufacturing system that incorporates quality assurances, probabilistic failures, overtime and outsourcing. East.-Eur. J. Enterp. Technol. 2024, 4, 19–30. [Google Scholar] [CrossRef]
- Qu, L.; Liao, J.; Gao, K.; Yang, L. Joint Optimization of Production Lot Sizing and Preventive Maintenance Threshold Based on Nonlinear Degradation. Appl. Sci. 2022, 12, 8638. [Google Scholar] [CrossRef]
- Paraschos, P.D.; Gasteratos, A.C.; Koulouriotis, D.E. Deep learning model for optimizing control and planning in stochastic manufacturing environments. Expert Syst. Appl. 2024, 257, 125075. [Google Scholar] [CrossRef]
- Paraschos, P.D.; Xanthopoulos, A.S.; Koulinas, G.K.; Koulouriotis, D.E. Machine learning integrated design and operation management for resilient circular manufacturing systems. Comput. Ind. Eng. 2022, 167, 107971. [Google Scholar] [CrossRef]
- Onyeocha, C.E.; Wang, J.; Khoury, J.; Geraghty, J. A comparison of HK-CONWIP and BK-CONWIP control strategies in a multi-product manufacturing system. Oper. Res. Perspect. 2015, 2, 137–149. [Google Scholar] [CrossRef]
- Thomopoulos, N.T. Standard Normal and Truncated Normal Distributions. In Demand Forecasting for Inventory Control; Springer International Publishing: Cham, Switzerland, 2015; pp. 137–148. [Google Scholar] [CrossRef]
- Borucka, A.; Kozłowski, E.; Antosz, K.; Parczewski, R. A New Approach to Production Process Capability Assessment for Non-Normal Data. Appl. Sci. 2023, 13, 6721. [Google Scholar] [CrossRef]
- Abid, M.; Sun, M.; Shabbir, A.; Bakr, M.E.; Abbas, T. An enhanced nonparametric quality control chart with application related to industrial process. Sci. Rep. 2024, 14, 13561. [Google Scholar] [CrossRef] [PubMed]
- Blank, J.; Deb, K. Pymoo: Multi-Objective Optimization in Python. IEEE Access 2020, 8, 89497–89509. [Google Scholar] [CrossRef]


Disclaimer/Publisher’s Note: The statements, opinions and data contained in all publications are solely those of the individual author(s) and contributor(s) and not of MDPI and/or the editor(s). MDPI and/or the editor(s) disclaim responsibility for any injury to people or property resulting from any ideas, methods, instructions or products referred to in the content. |
© 2025 by the authors. Licensee MDPI, Basel, Switzerland. This article is an open access article distributed under the terms and conditions of the Creative Commons Attribution (CC BY) license (https://creativecommons.org/licenses/by/4.0/).