1. Introduction
Railway trains are transitioning toward higher speeds to better support national economic development. However, this transition leads to more pronounced vibrations in vehicle components, potentially leading to fatigue failure. Among the critical components of railway trains, bogies are particularly prone to fatigue failure due to their role as the main load-bearing structure. The safety and reliability of the vehicle bogie are therefore key to ensuring operational safety.
The fatigue strength of the bogie frame of railway vehicles has been analyzed extensively using numerical methods. Kim et al. [
1] investigated the strength evaluation procedure of a bogie frame for tilting railway vehicles. They derived the loading conditions imposed on the tilting train and evaluated the static and fatigue strength of the bogie frame using multi-body dynamic analyses and finite element analysis (FEA). The results of this study aided in ensuring the structural safety of the bogie frame. Seo et al. [
2] conducted a fatigue design evaluation of a railway bogie frame through full-scale fatigue testing. Strength analysis was performed using FEA to identify stress concentration areas. Dynamic stress was measured using strain gauges, revealing multiaxial loading conditions. Fatigue strength evaluations were then conducted by employing a critical plane approach. Kraus et al. [
3] conducted a study on the development of bogie frames for rail vehicles from a strength and fatigue life perspective. The development process included stress calculations, static and fatigue tests, and validation of fatigue life data through stress monitoring during test runs on an actual track. Ji et al. [
4] developed a virtual track irregularity (VTI) and simplified dynamics model (SVDM) method for load spectrum generalization across high-speed train bogies. They found that the VTI-SVDM combination accurately predicts frame-specific load histories, enabling reliable cross-configuration load transfer while preserving damage equivalence in bogie frame assessments. Yang et al. [
5] demonstrated in their study that the semi-active inertial suspension effectively improves vibration isolation and minimizes fatigue-induced performance losses over the entire frequency spectrum. In another study, Yamazaki et al. [
6] proposed a fatigue assessment method for bogie frames by estimating dynamic stresses through finite element analysis using axle box acceleration data, enabling fatigue life prediction and damage visualization across the entire structure. Han et al. [
7] developed a 3D rigid–flexible coupling model of a high-speed train, incorporating gear meshing dynamics and wheel polygonization, to assess bogie frame fatigue damage using finite element analysis and rainflow counting. Sanikhani et al. [
8] developed a data-driven surrogate model using CatBoost—selected as the optimal ML algorithm among nine candidates—to assess the fatigue failure probability of bogie frames under parameter variability, achieving 99.34% reliability over 30 years while demonstrating effectiveness with limited training data. Sun et al. [
9] developed a flexible multibody dynamics model incorporating wheel–rail contact nonlinearities to investigate wheel out-of-roundness (OOR)-induced bogie frame vibrations, employing modal stress recovery to analyze dynamic stresses and establish safe OOR amplitude limits through comprehensive time–frequency domain simulations. Wang et al. [
10] developed an extreme value theory-based time–domain extrapolation method for the accurate fatigue life assessment of railway structures using limited short-term stress data. In the aforementioned studies, the researchers investigated the fatigue strength of vehicles using simulations. However, numerical simulation methods sometimes struggle in reproducing real service conditions. In contrast, measurement methods can aid in more accurately determining the real stress results of the bogie and are more suitable for analyzing fatigue strength.
In addition, fatigue failure of mounted components also occurs frequently, particularly for the traction motor, the mass of which is greater than that of other components [
11]. These components are excited by the random vibration of the bogie frame. The quantitative expression of these vibrations is crucial for analyzing fatigue strength [
12,
13,
14,
15,
16,
17,
18]. For this purpose, the International Electrotechnical Commission (IEC) published the IEC 61373 standard to define these vibration characteristics using the power spectral density (PSD) [
19]. After its publication, Mu et al. [
20] utilized the IEC 61373 standard to analyze the axle box. Zhang et al. [
21] also utilized the IEC 61373 standard to analyze their measured data.
It should be noted, however, that the IEC 61373 standard cannot fully express the actual vibration characteristics of the bogie frame, which are non-Gaussian and non-stationary. At present, there have been few studies on the description and statistical generalization of this vibration in the railway vehicle field. Despite this, in other fields of transportation engineering, such as the aerospace and military fields, researchers have begun to study the random vibration environment of airborne equipment with a method referred to as spectrum synthesis. Jang et al. [
22] refined the Damage Potential (DP) method from MIL-STD-810 for vibration fatigue analysis. While DP’s simplified FDS approach works for test standard comparisons, it has limitations for vibration synthesis. This approach, when applied to generate vibration fatigue load spectra for equipment mounted on a railway vehicle, therefore has the potential to address the limitations of the IEC 61373 standard spectrum. By using this approach, the obtained vibration spectrum can accurately quantify the vibration characteristics of the bogie frame.
In summary, analyzing the fatigue damage of the bogie frame and the mounted traction power in actual service environments plays an important role in ensuring the operational safety of vehicles. In this study, a well-prepared measurement plan is utilized to obtain the dynamic stress and vibration of the bogie frame. The developed spectrum synthetic method is utilized to generate the vibration excitation spectrum of the traction motor, in which a method for processing multipoint random vibrations from the bogie frame is proposed. Thereafter, the fatigue damage to the bogie frame and the mounted motor is analyzed with respect to the different operational speeds.
The remaining sections of this paper are organized as follows: in
Section 2, the dynamic stress of the bogie frame is determined and the fatigue damage is analyzed; in
Section 3, the spectrum synthesis method is proposed to generate the vibration excitation spectrum; in
Section 4, the fatigue damage of the traction motor is analyzed with from these loads; lastly, the conclusion is presented in
Section 5.
3. Vibration Load of the Traction Motor
The installation seat of the traction motor bears the random vibration of the bogie frame caused by random wheel–rail unevenness during service. Analyzing these random vibrations is important for studying the vibration and fatigue of motor-installed seats. The input random vibration environment data samples were summarized, organized, and compiled into environmental spectra.
3.1. Vibration Testing at the Installation Site of the Traction Motor
Measurements were performed on a bogie motor mount to obtain the equipment vibration load data. In this test, four three-direction vibration acceleration sensors were arranged to measure the vibration load of the motor equipment during the operation of the train at speeds of 300, 350, 380, and 400 km/h, with a sampling frequency of 2000 Hz. The arrangement of the measurement points is illustrated in
Figure 6. Positions 1 to 4 are the four vibration acceleration measurement points.
3.2. Methods for Defining Vibration Environments
The time–domain vibration acceleration data were collected from the measurement-point channels of the bogie motor (at least 20 s per segment). First, the power spectra of all of the samples were calculated and denoted as Gk (i, j) (i = 1, 2, …, L; j = 1, 2, …, M; k = 1, 2, …, N), where i represents the channel number, L represents the total number of channels, j represents the sample number, M represents the total number of samples, k represents the spectral line number, and N represents the total number of spectral lines. For the k-th dimension, we took the root mean square value of Gk (i, j) and denoted it as R (i, j).
For different channels, the mean
Xi and variance
of sequence
R(
i,
j) were estimated separately [
26]:
The a-th and b-th channels were selected, and the statistics F(a, b) and t(a, b) were computed using the estimated means and variances.
If the power spectra of channels a and b belong to the same general population,
F(
a,
b) obeys the
F-distribution with degrees of freedom (
M − 1,
M − 1), and
t(
a,
b) obeys the central
t-distribution with degrees of freedom 2(
M − 1), which implies that it holds for a given confidence level 1 − α. Conversely, they do not belong to the same aggregate.
The data belonging to the same channel were grouped together to form the feature sample Gk (p, q) (p = 1, 2, …, P; q = 1, 2, …, Q; k = 1, 2, …, N), where p represents the feature channel serial number, P represents the total number of feature channels (less than or equal to the total number of channels), q represents the sample serial number, and Qp represents the number of samples in the p-th feature channel.
The definitions are as follows:
We estimated the mean
Xk(
p) and variance
of sample
xk(
p,
q), that is,
Thereafter, we calculated the upper tolerance coefficient
F1 for a confidence level of (1 −
α) and a quantile point of
β, i.e.,
α = 0.05,
β = 0.9.
where
Zβ is the normal quantile point satisfying
P(
Z ≤
Zβ) =
β;
is the χ
2 distribution α quantile point whose degree of freedom is
Qp − 1.
The upper tolerance limit is estimated for the
p-th sample, i.e.,
The above results in the measured spectrum of the random vibration of the bogie motor, i.e., Gk(p).
3.3. Vibration Environment Spectrum
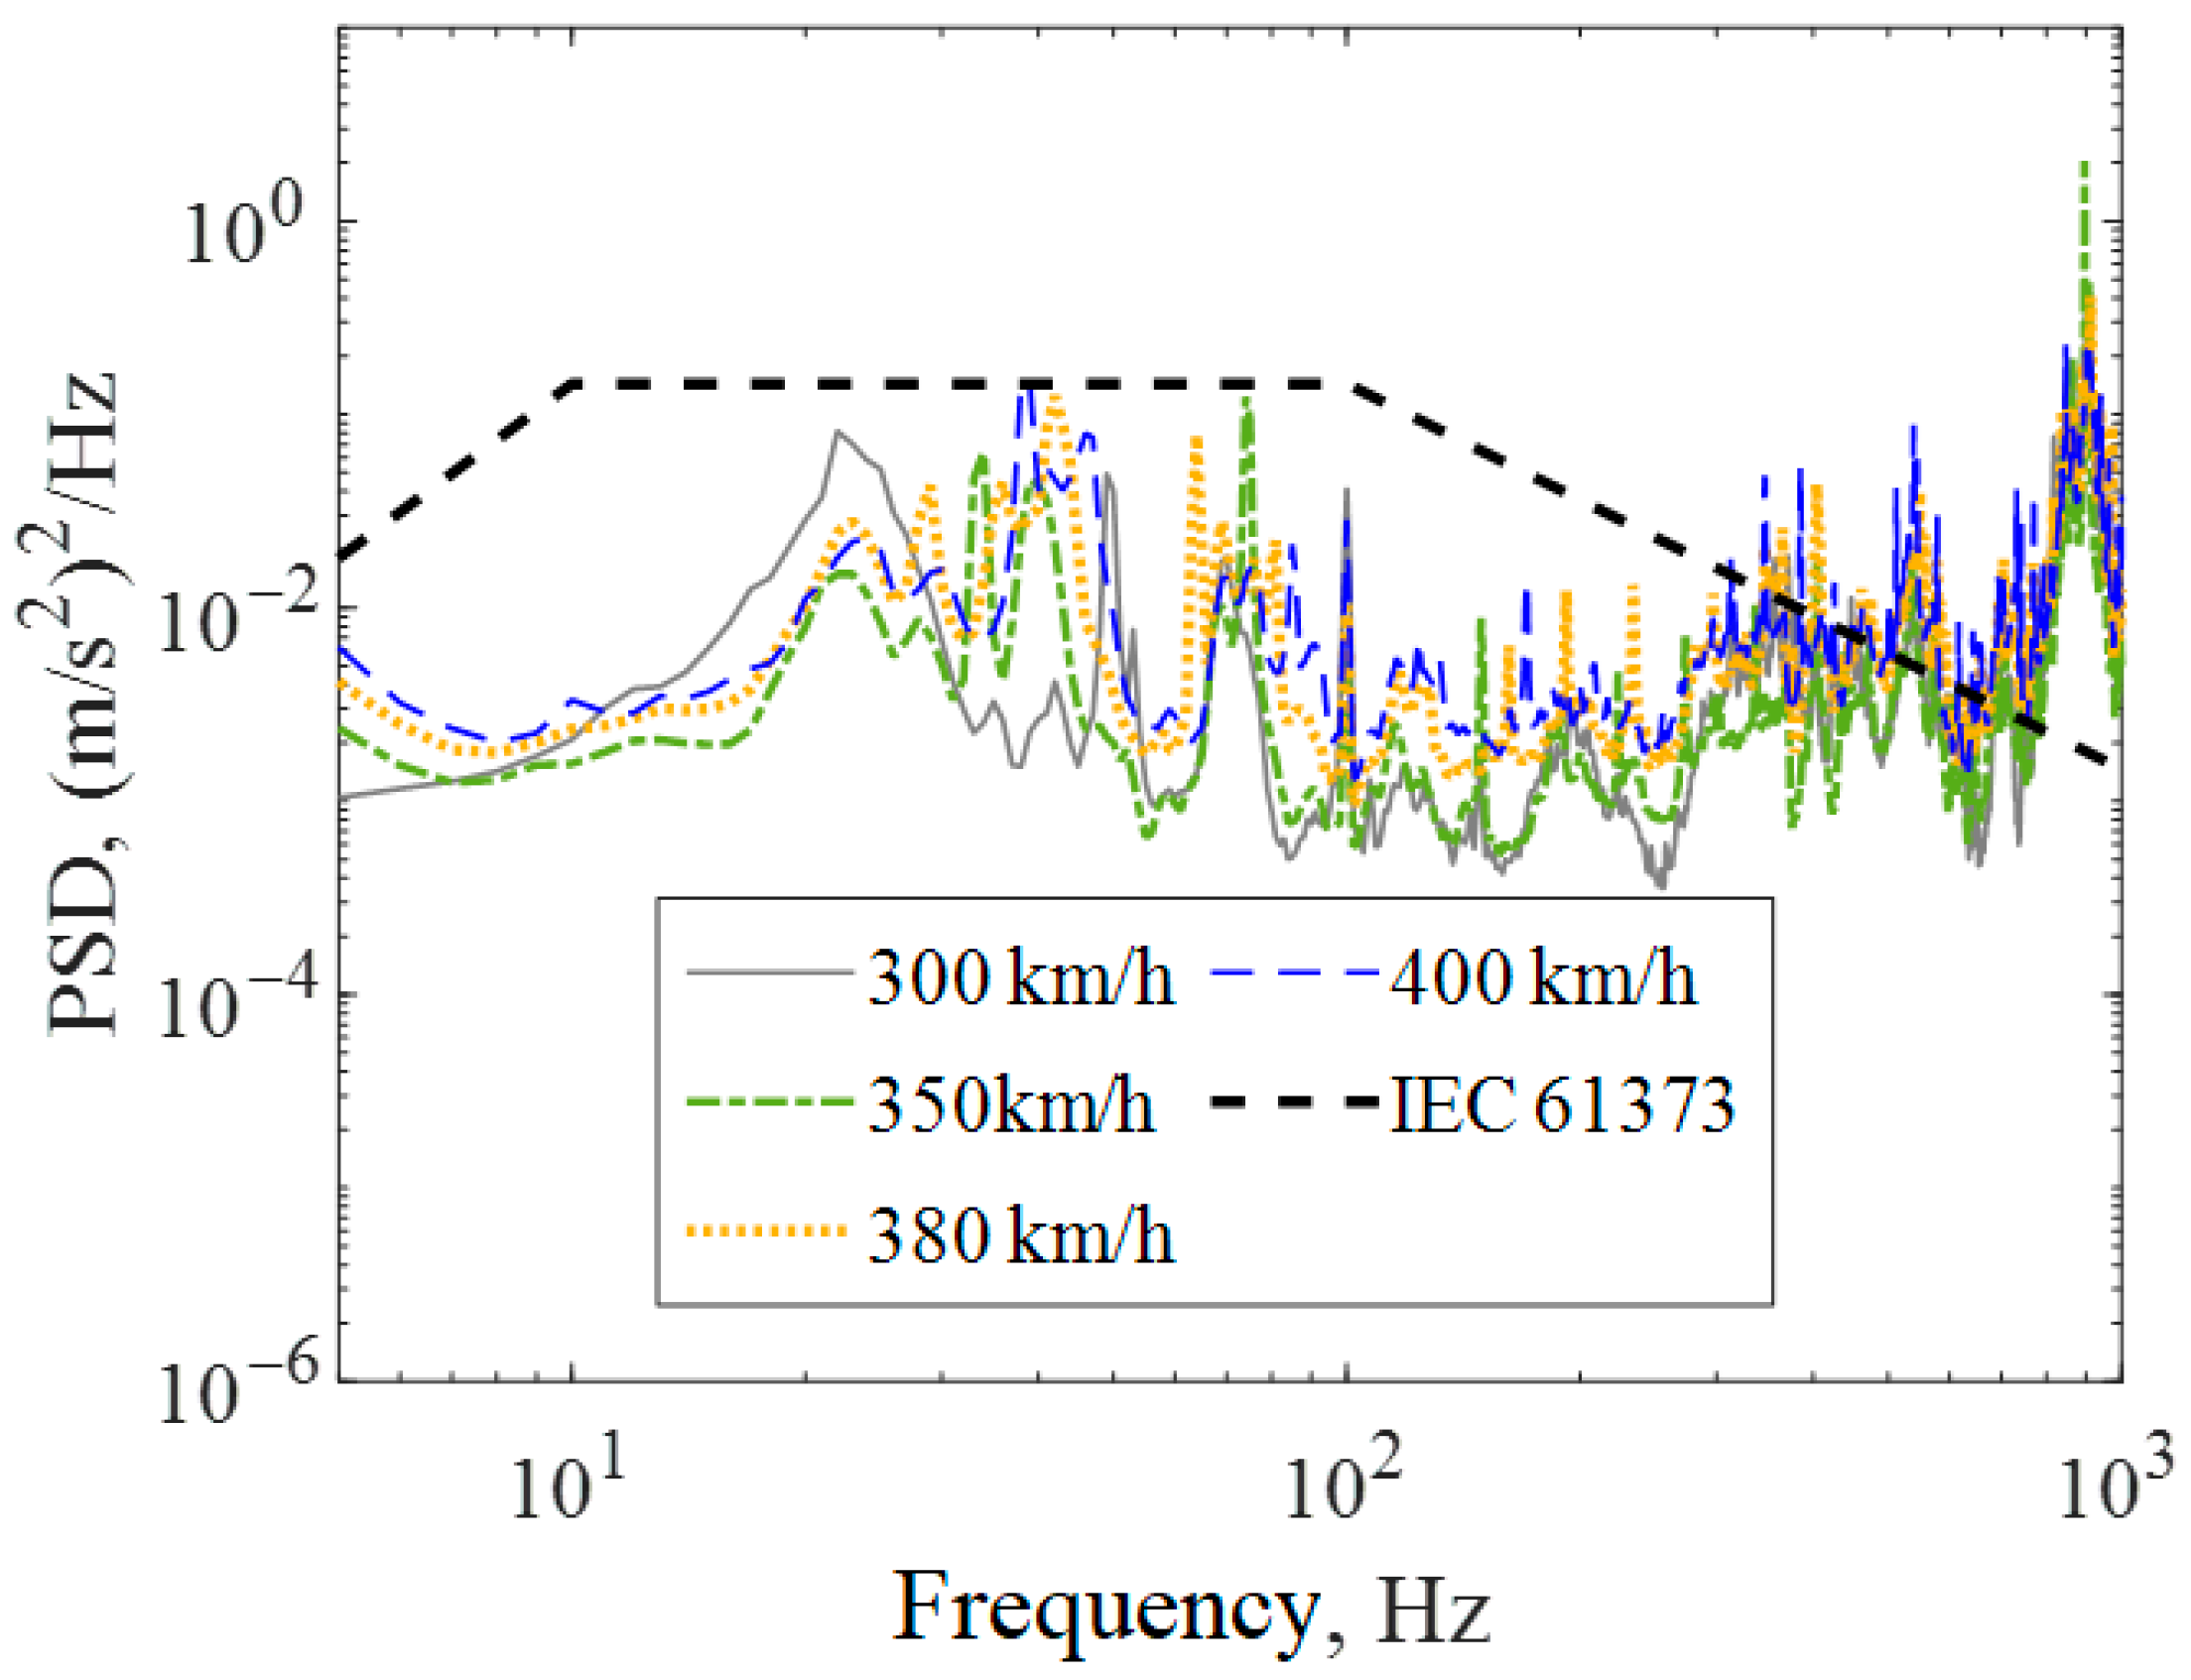
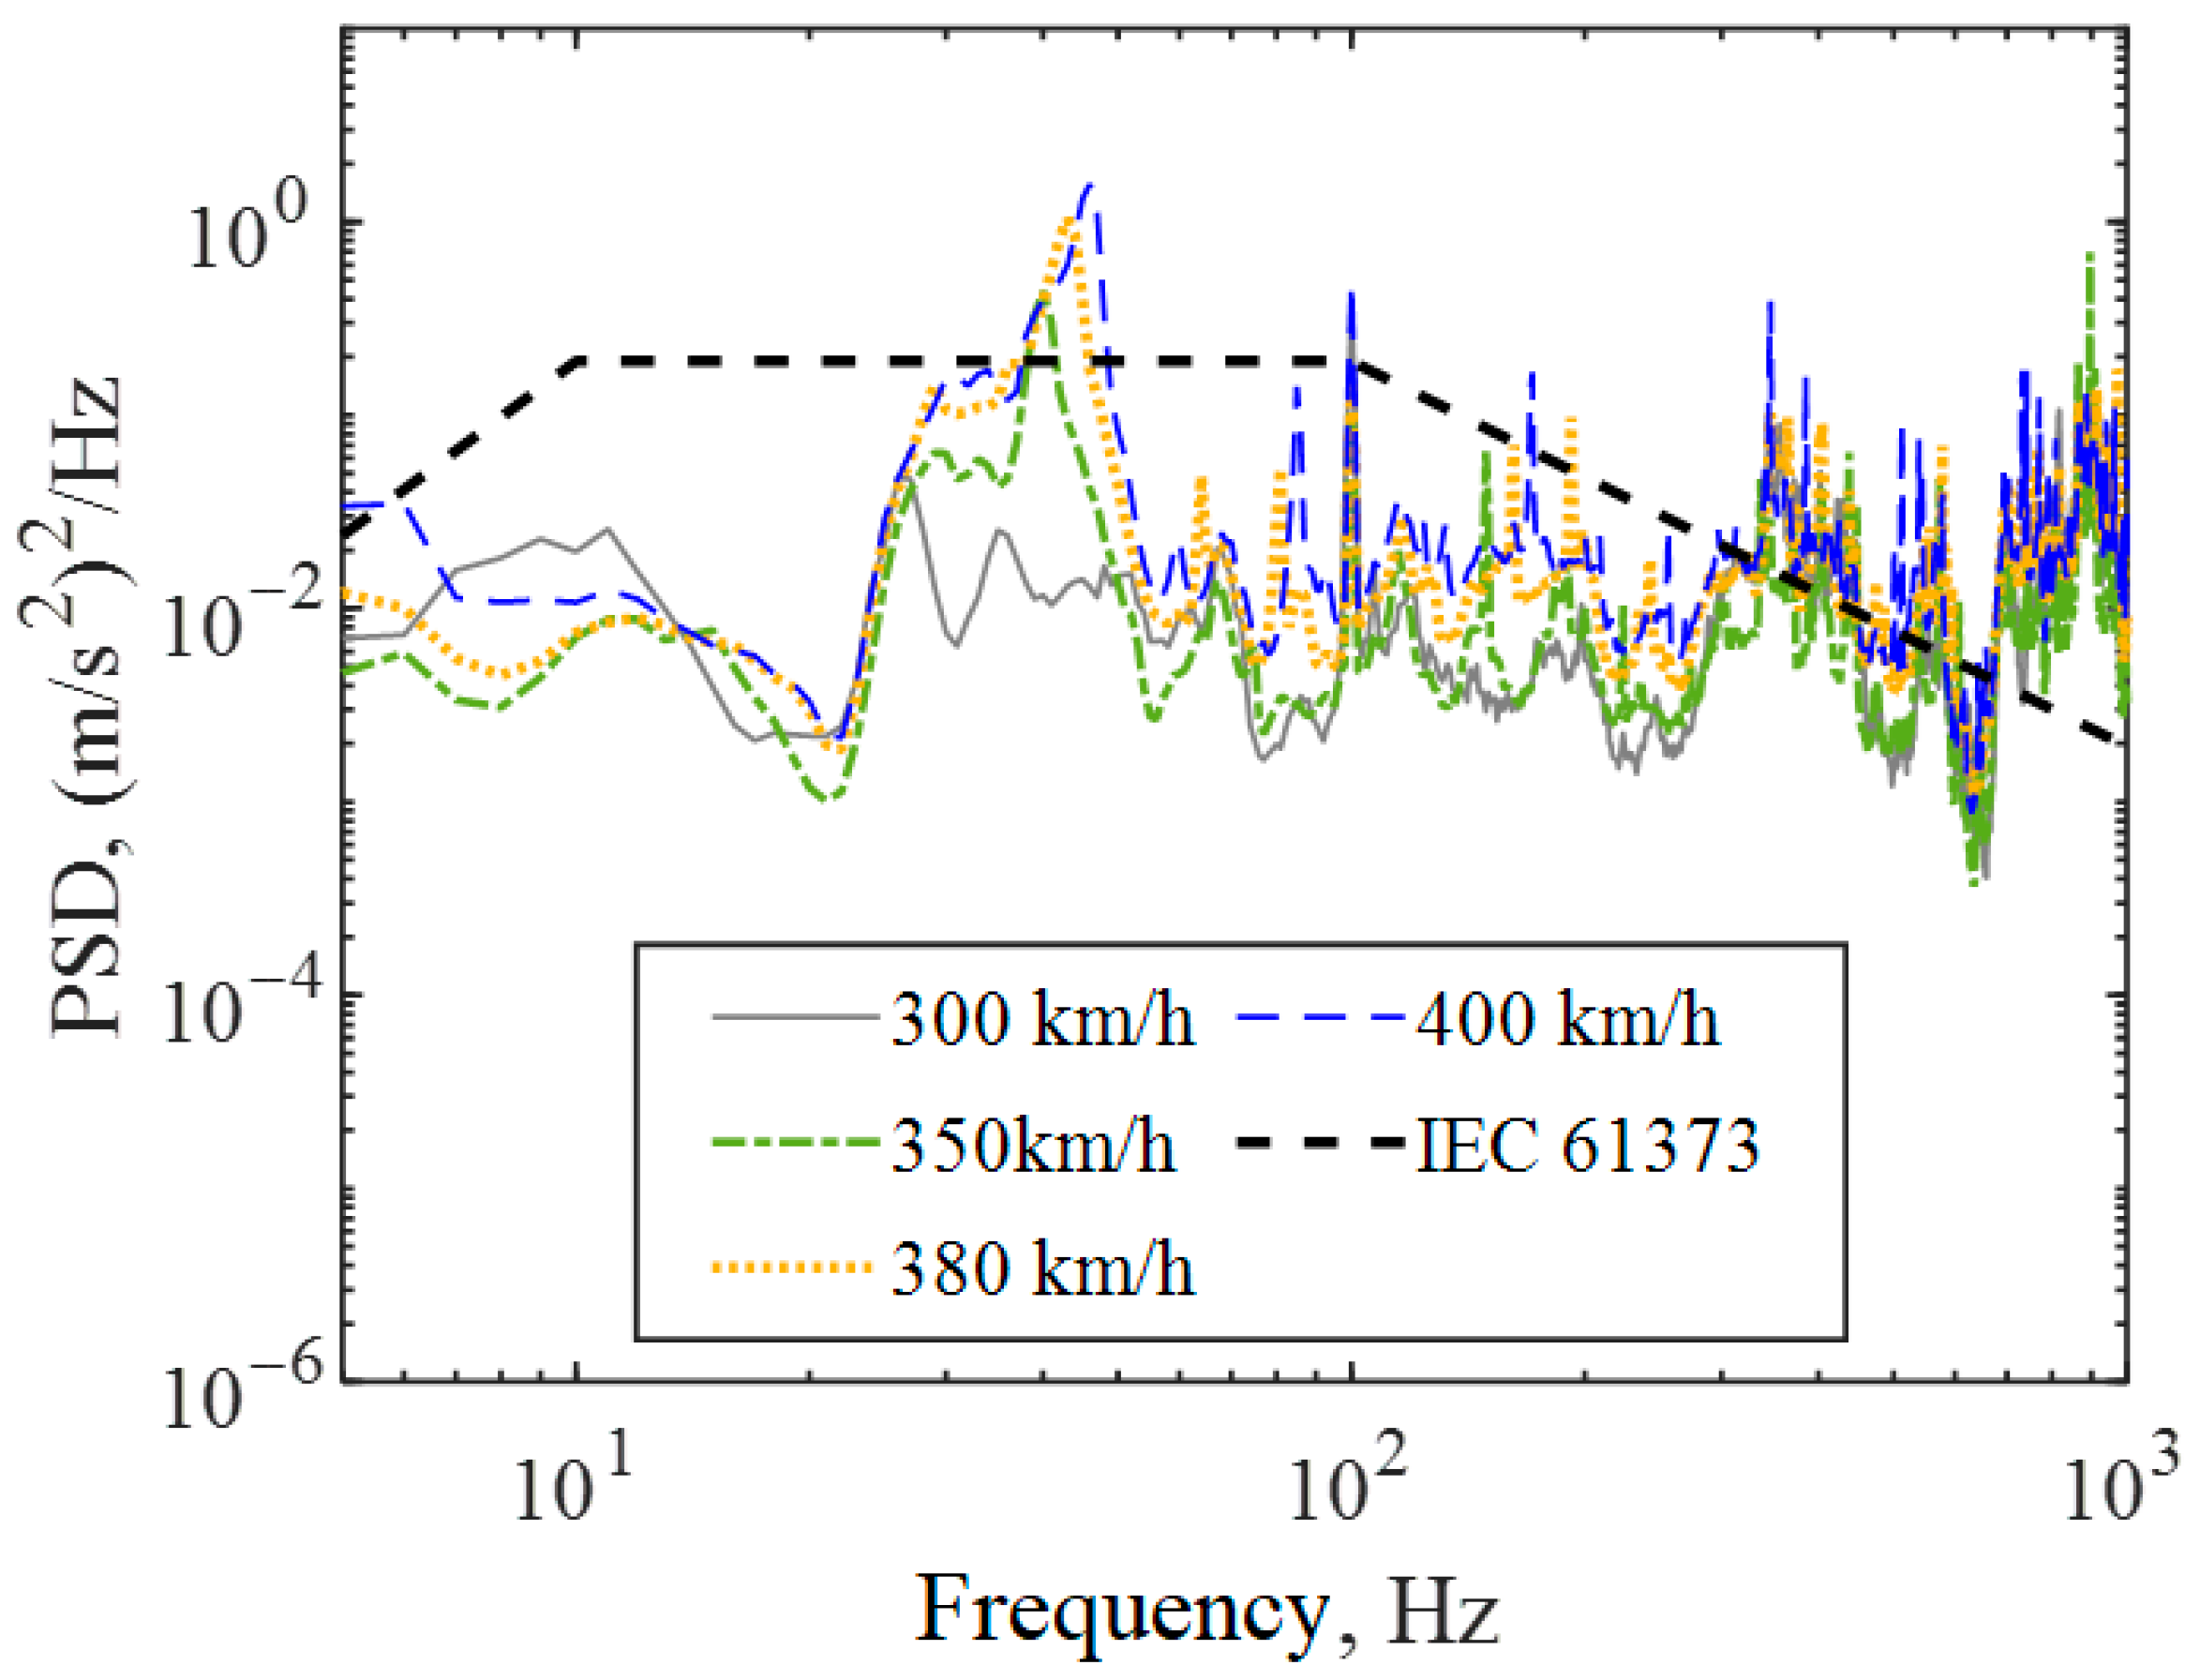
Based on the measured data collected from the vibration mounting seat of the bogie motor, the environment spectrum of the motor vibration at different operating speeds was compiled using the aforementioned method, which facilitated the subsequent analysis of the frequency–domain distribution characteristics. The vibration spectra of high-speed rolling stock bogie motors under different operating speeds are shown in
Figure 7,
Figure 8 and
Figure 9.
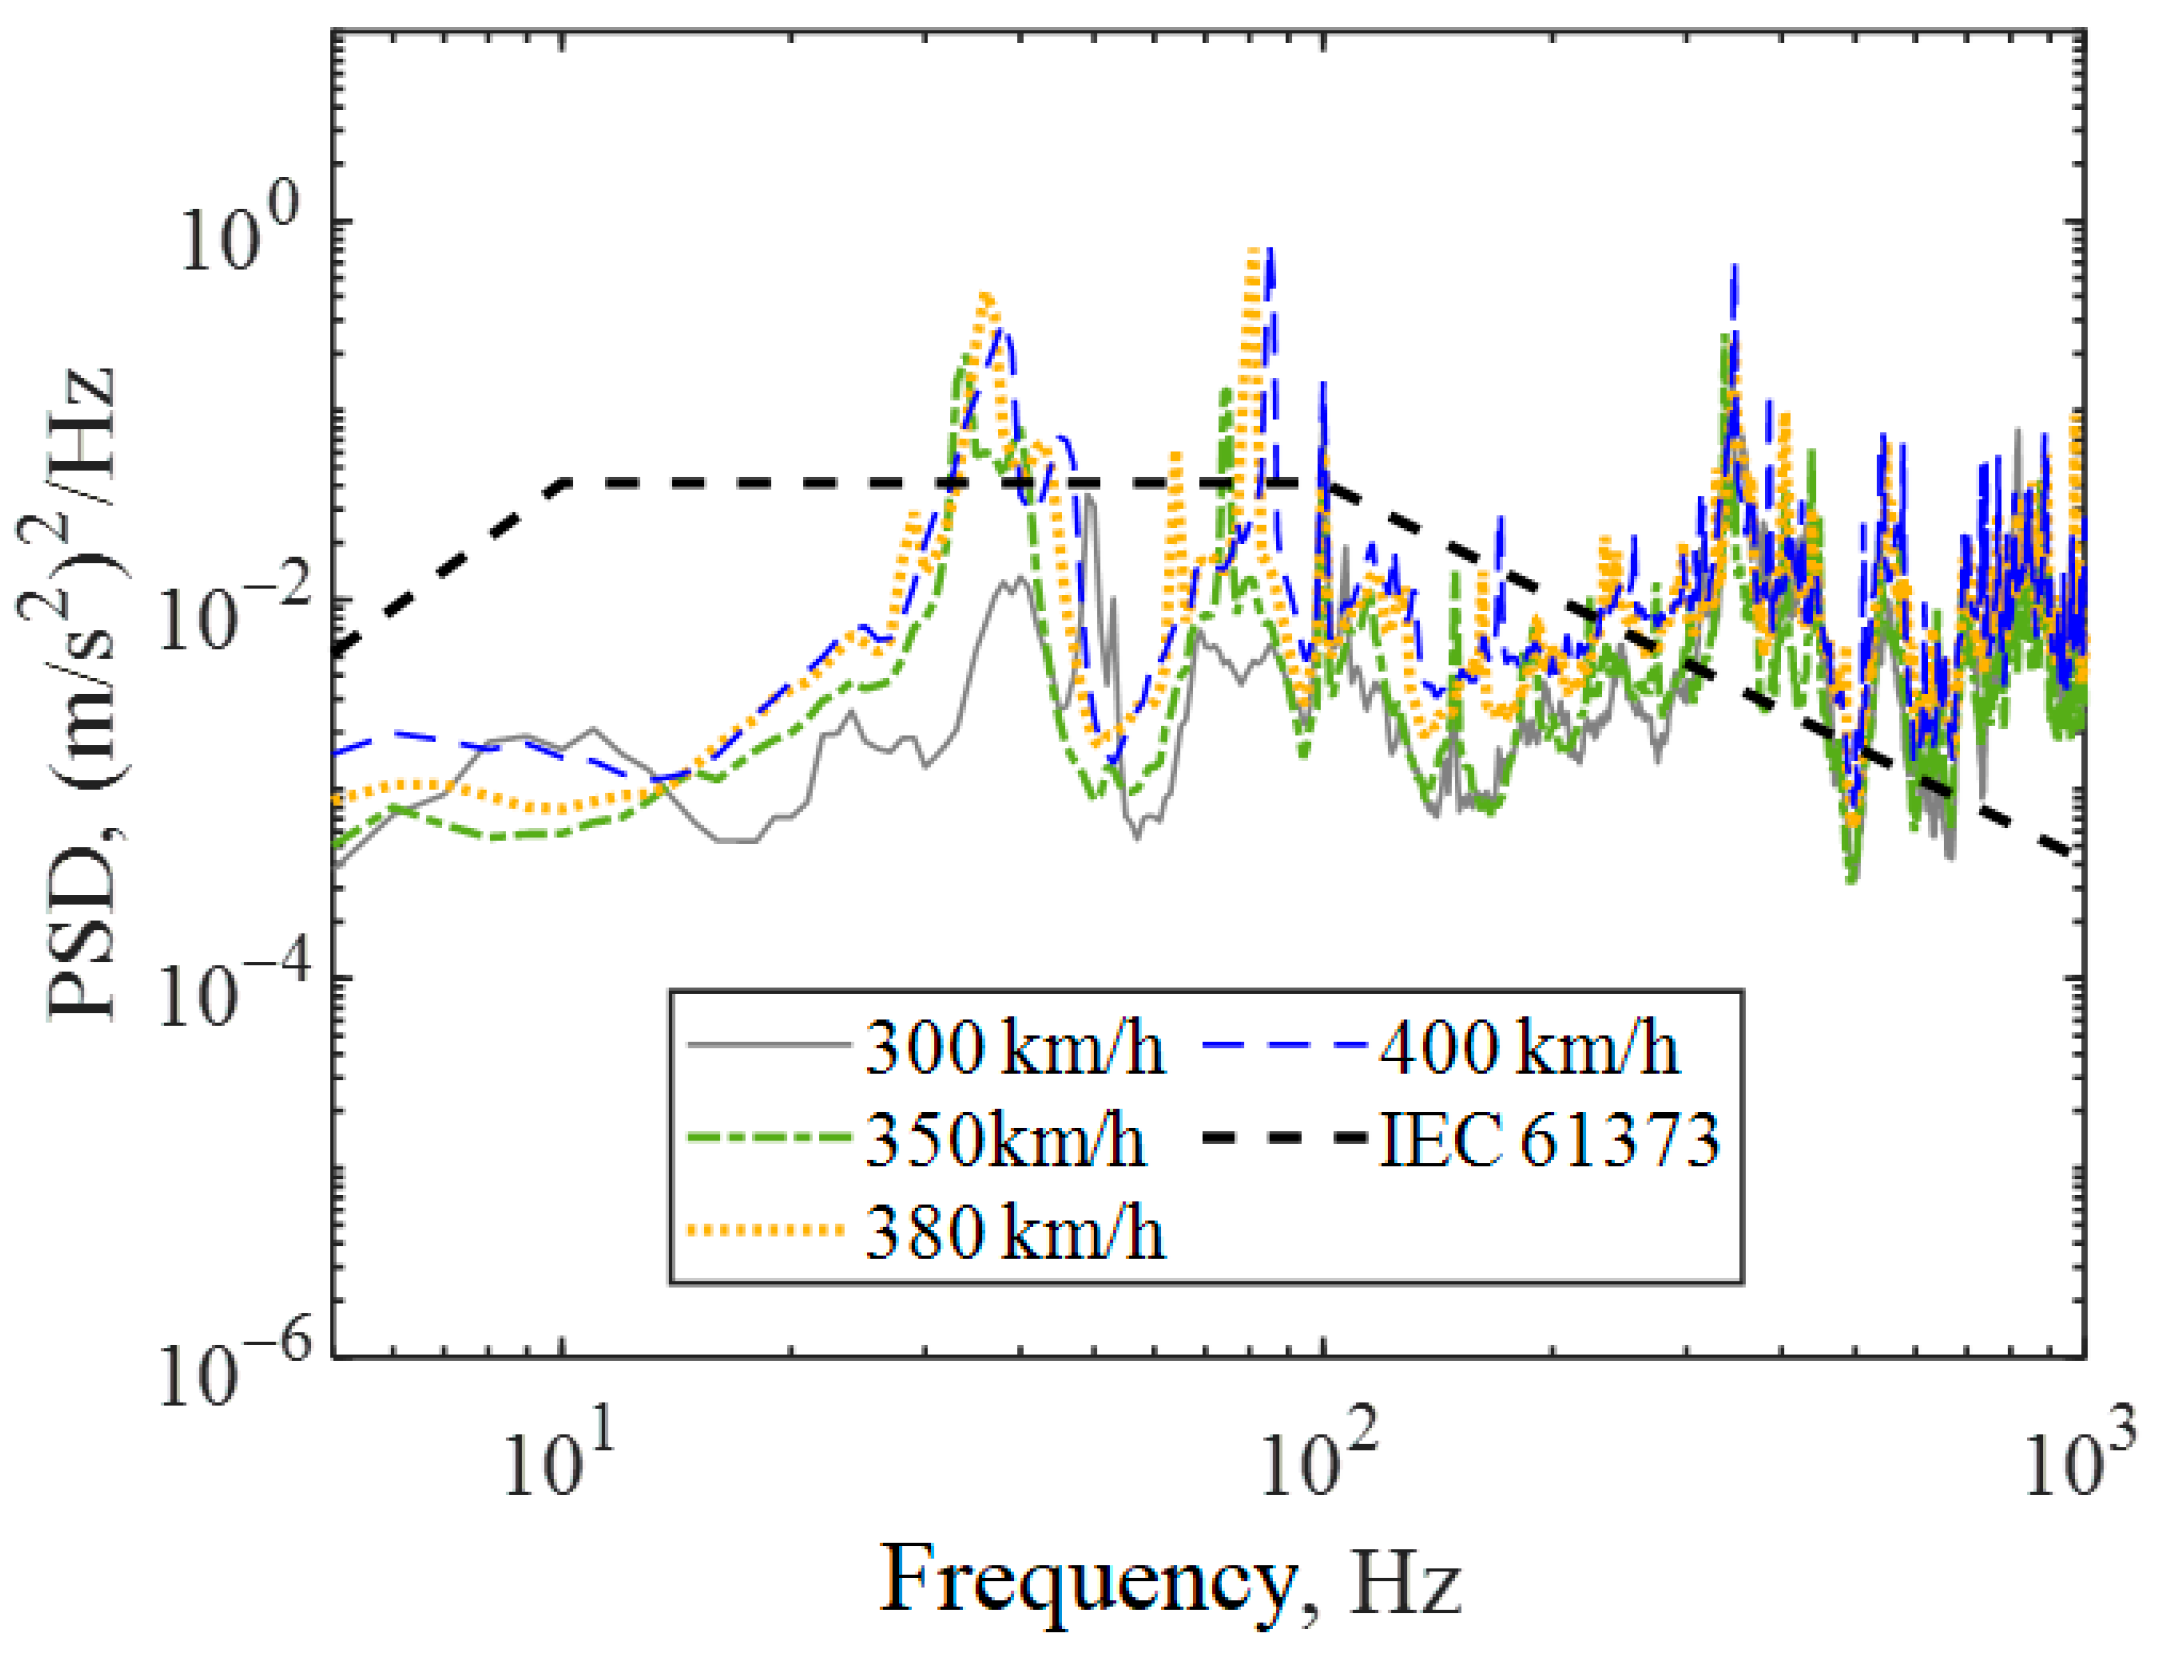
At different speeds, the vibration energy values of the bogie motor vary, and the frequency–domain distribution characteristics are essentially identical; however, the peak appeared to shift to the right as the speed increased. First, in the X-direction, 300, 350, 380, and 400 km/h speeds under the bogie motor vibration energy value exhibited minimal difference at 3.5, 3.3, 4.2, and 4.4 m/s2, respectively, in agreement with the characteristics of the energy value with the increase in speed, and were higher than the IEC standard provisions of 2.5 m/s2. In the low-frequency band, the vibration environment spectrum value of the bogie motor was lower than the standard spectrum value, and the peak appeared to shift to the right with the increase in speed. In contrast, in the high-frequency region, the vibration environment spectrum of the bogie motor was far higher than the standard spectrum value.
In the Y-direction, 300, 350, 380, and 400 km/h speeds under the bogie motor vibration energy value exhibited minimal difference, at 4.9, 5.0, 5.3, and 5.3 m/s2, respectively, in agreement with the idea that the energy value increases with the increase in speed, with a value slightly greater than the stipulated IEC standard of 4.7 m/s2. In the low-frequency band, the bogie motor vibration spectral value was lower than the standard spectral value; in contrast, in the high-frequency band, the vibration spectral value of the bogie motor was significantly higher than the standard spectral value.
In the Z-direction, 300, 350, 380, and 400 km/h speeds under the bogie motor vibration energy value exhibited minimal difference, respectively, at 4.7, 4.3, 5.5, and 6.1 m/s2, in agreement with the characteristics of the energy value increases with the increase in speed, essentially close to the IEC standard of 5.5 m/s2. In the low-frequency band, the bogie motor vibration environment spectrum value was lower than the standard spectrum value; in the high-frequency band, in comparison, the vibration environment spectrum value was far higher than the standard spectrum value.
4. Fatigue Analysis of the Traction Motor
The fatigue performance of the traction motor is critical to ensuring the reliability of high-speed train operation. To evaluate its structural behavior under dynamic loads, a finite element model was established to enable stress and fatigue assessment.
4.1. Finite Element Model of the Traction Motor
The geometric model of the motor was imported into Hypermesh 2021 software to establish the FE model. The PSHELL elements were used to discretize the traction motor. Constraints were applied to the mounting positions to restrict displacements in longitudinal (X), transverse (Y), and vertical (Z) directions. The finite element model after discretization is shown in
Figure 10, where different colors represent different components. Three progressively refined meshes (15 mm, 10 mm, and 5 mm element sizes) were evaluated, with less than 5% variation observed in maximum displacement results at the mounting positions, confirming mesh independence. All elements satisfy ASME V&V 10.1–2012 quality criteria [
27].
Special refinement was implemented at mounting interfaces (with the element size reduced to 3 mm) to capture stress concentrations, utilizing unstructured mesh patterns in these critical regions. The final model contains 2.23 million elements, representing the cast iron material (Young’s modulus = 110 GPa; Poisson’s ratio = 0.3; density = 7850 kg/m3) of the bogie frame. The total model mass converged to 175 kg, matching the physical prototype within 1.5%.
4.2. Fatigue Analysis of Traction Motors Based on UIC Standards
Based on UIC 615-4, the acceleration corresponding to the inertial load of the traction motor under operating conditions was applied according to the following principles: the longitudinal acceleration of the traction motor is ±2.5 g, the lateral acceleration is ±5.0 g, the vertical acceleration is ±6.0 g, and the number of cycles is 107.
Based on the fatigue condition requirements, the motor was loaded to obtain the first principal stress under longitudinal, transverse, and vertical vibration conditions at the evaluation position. Based on the UIC standard, the allowable stress range is 40 MPa, and the curve slope m is 3. The calculation results are presented in
Table 3.
As shown in
Table 2, after 1 × 10
7 cycles, the cumulative fatigue damage in the suspension was <1, which satisfied the fatigue–strength requirements. The fatigue damage under the lateral vibration level was significant, reaching 0.032, but remained within a safe range.
4.3. Fatigue Analysis of Traction Motors Based on Environment Spectrum
In real-world operating conditions, traction motors are subjected to complex random vibration loads that necessitate the use of spectral analysis methods for accurate fatigue evaluation. The frequency–domain approach provides an effective solution for processing these stochastic loadings through advanced cycle counting techniques.
4.3.1. Fatigue Analysis Theory in the Frequency Domain
To determine the stress response spectrum of the bogie frame motor, the Dirlik rainflow amplitude probability density function was used to calculate the number of stress cycles. The Dirlik rainflow counting method is based on the results of numerous Monte Carlo simulations and employs a purely empirical closed-form expression [
28] that approximates the probability density function of the rainflow amplitude, consisting of one exponential and two Rayleigh distributions. The expressions are as follows:
where
,
,
,
,
,
,
, and
.
The one-sided stress response PSD function is defined by
M0,
M1,
M2, and
M3. With the 0th-, 1st-, 2nd-, and 4th-order moments of the stress response, then Mi is defined as follows:
The Dirlik fatigue damage model for the time period τ is expressed as follows:
where
represents the peak crossing rate of the one-sided PSD function of the stress response, and
C and
m are the material constants of the power-function expression of the S-N curve of the material.
The input load is described by the PSD function, the stress response PSD function of the structure is obtained via frequency response calculation and modal analysis of the system, and the fatigue life of the system is calculated according to the fatigue failure model and the fatigue properties of the material.
4.3.2. Fatigue Analysis
To calculate the stress response spectrum, it is necessary to solve the frequency response function from frame vibration to motor stress based on the finite element model of the motor established in
Section 4.1. In this case, unit vertical, lateral, and longitudinal accelerations at each frequency are applied to the bolt hole, and the corresponding frequency response functions are solved separately, as shown in
Figure 11.
The obtained stress spectra of the bogie motor at operating speeds of 300, 350, 380, 400 km/h, and IEC 61373 were analyzed. The rainflow counting method was used to determine the stress amplitudes and cycles, as shown in
Figure 12.
With a small number of cycles, the stress amplitude increased from 41.1 to 79.4 MPa as the operating speed increased. At a low stress amplitude, the number of cycles required to reach the fatigue limit increased as the operating speed increased. The stress amplitude was higher than the results obtained based on the IEC61373 standard.
Based on the data obtained using the rainflow counting method, the fatigue damage of the bogie frame mounting seat at different speeds was determined, as shown in
Figure 13.
With the increase in operating speed, the fatigue damage increased exponentially. The maximum damage (0.73) occurred at 450 km/h, namely, <1.0, i.e., within the safe range.
From
Figure 13, it can be seen that the fatigue damage of the traction motor obtained with the generated vibration spectra is larger than that from the loads defined in the standards. This finding is the result of the generated vibration environment spectrum exhibiting a peak in the 50–60 Hz frequency band, which is consistent with the peak frequency of the FRFs of the traction motor, as shown in
Figure 11, meaning that the excitation generated by frame vibration may resonate with the motor mode. This resonance characteristic cannot be achieved by the standard spectrum, reflecting the superiority of the generated spectra.
5. Conclusions
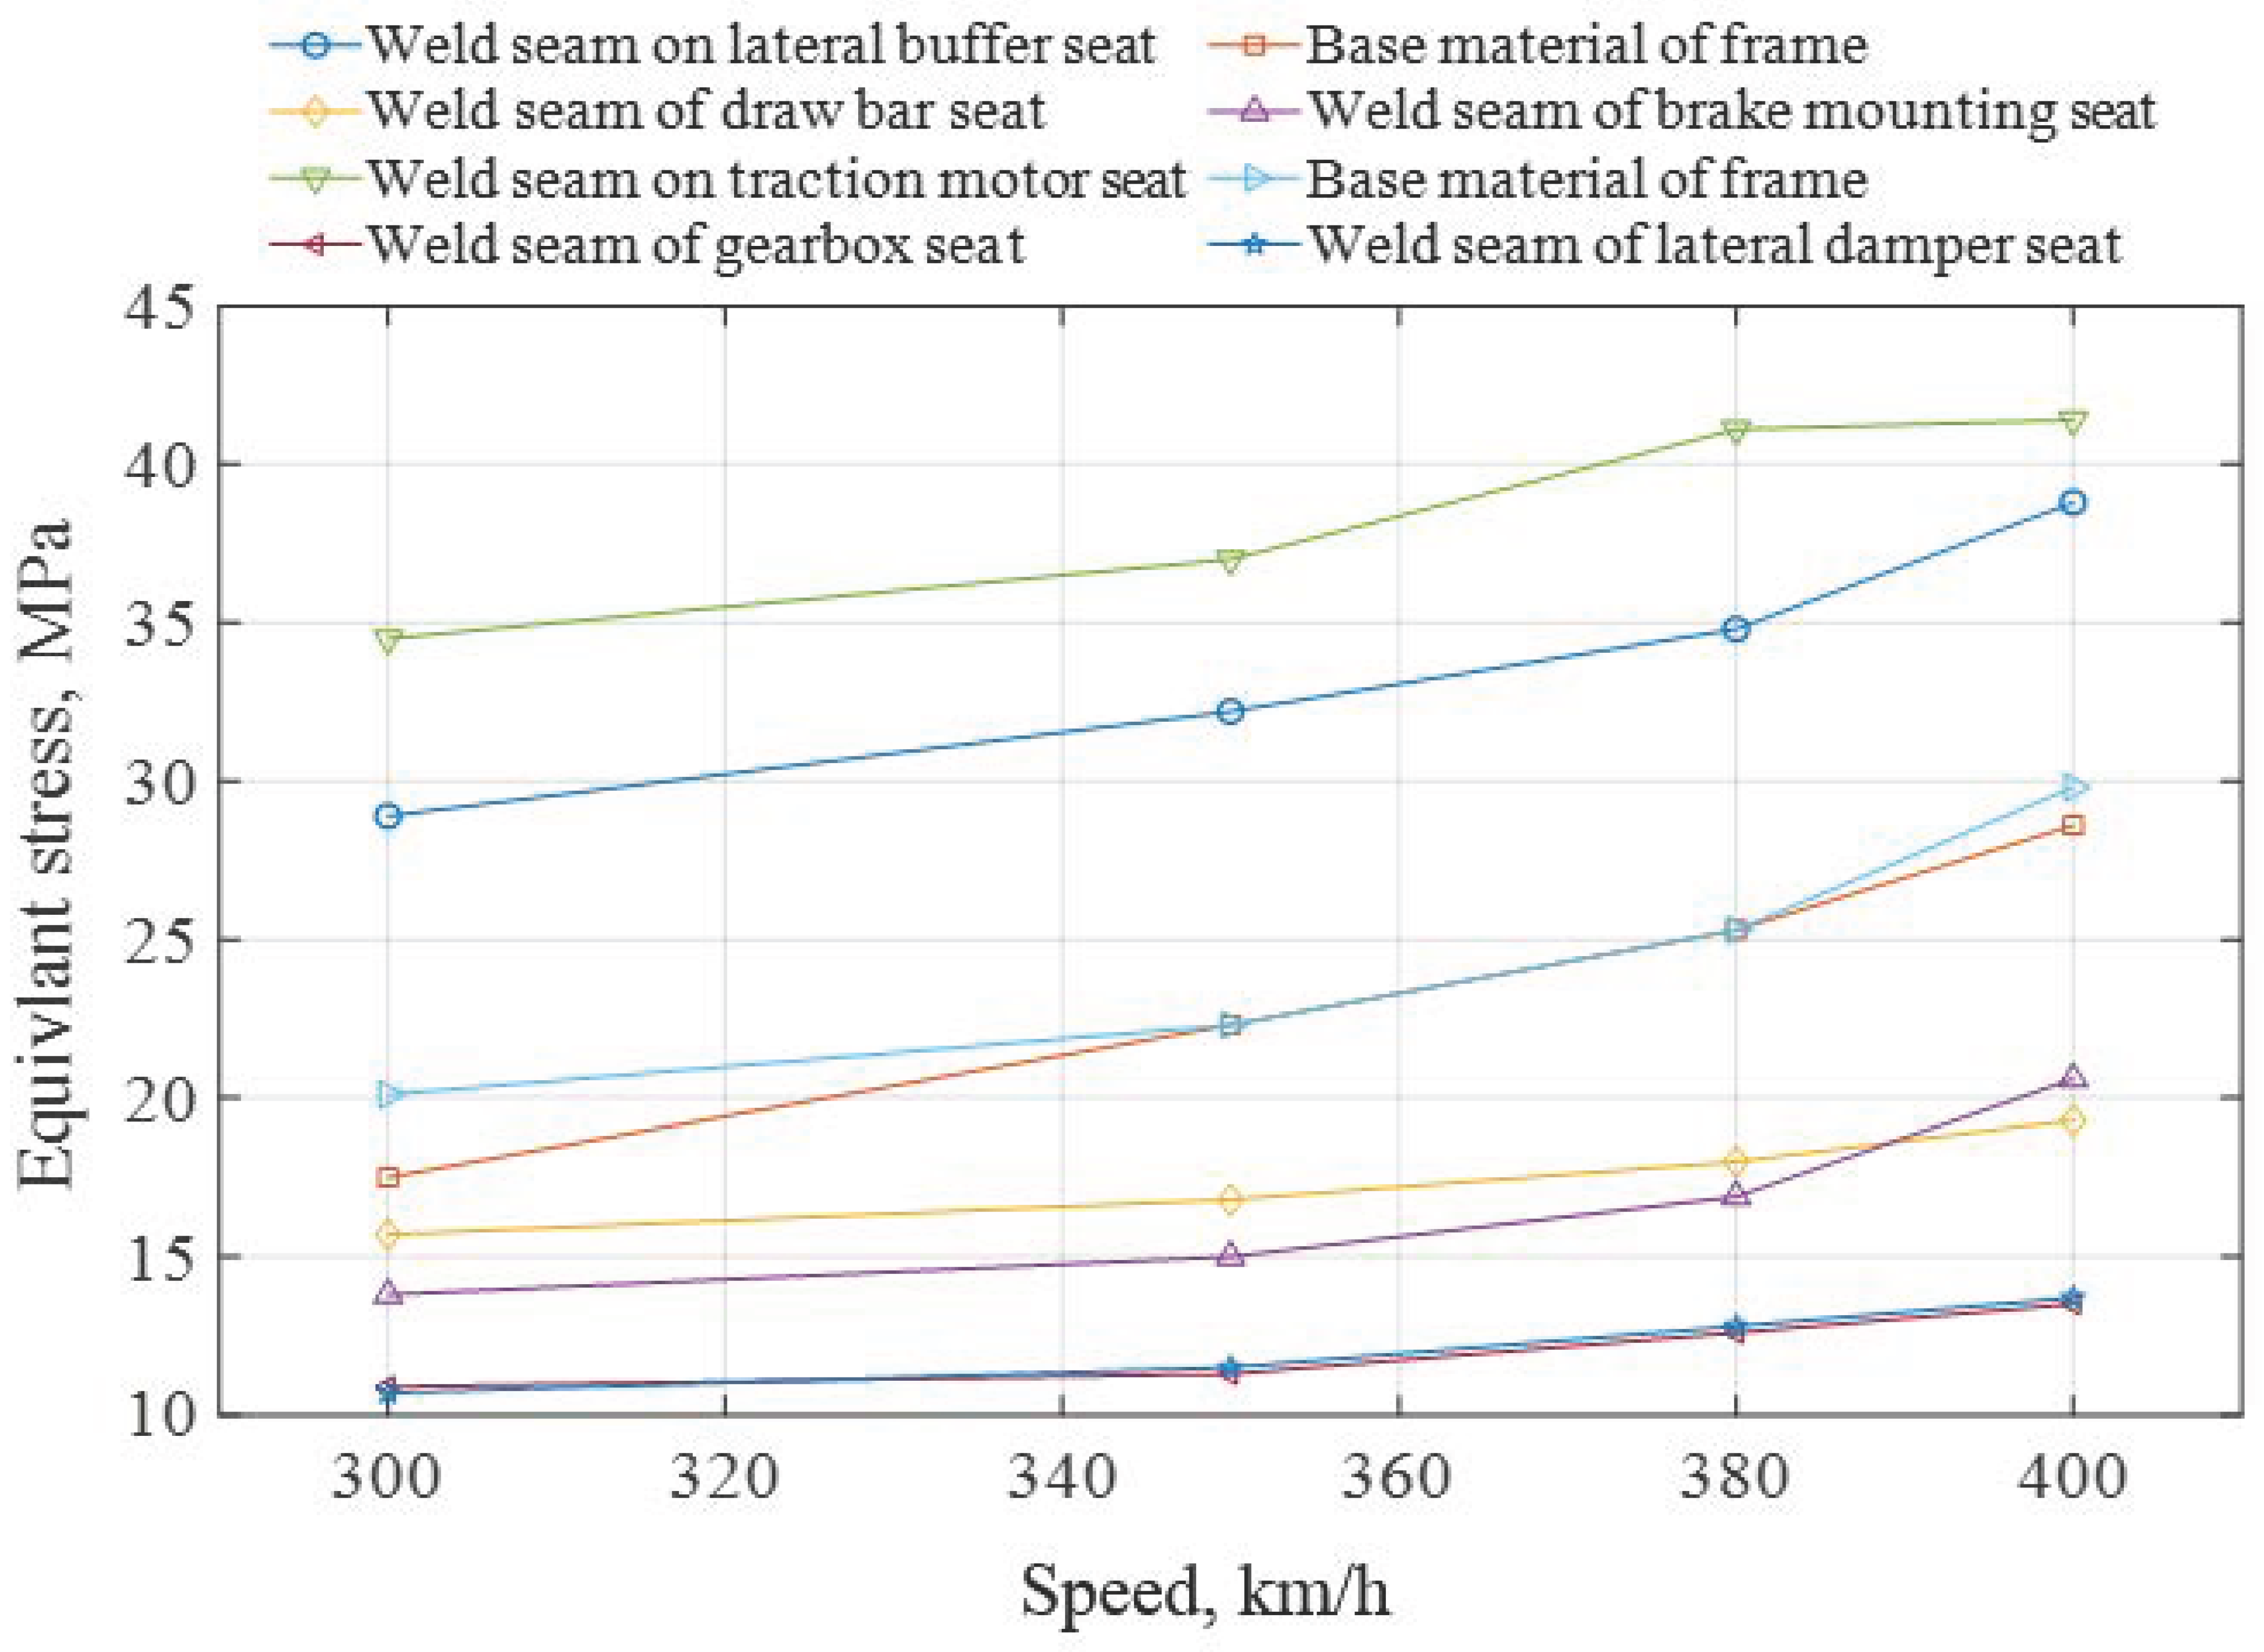
In the study presented herein, a fatigue analysis of the bogie frame and mounted traction motor of a high-speed train was performed. A meticulously designed on-site testing method was used to accurately determine the dynamic stress of the bogie frame, and the result is more accurate than the dynamic stress values obtained using existing numerical methods. The fatigue damage of the bogie frame increases linearly with speed. The weak location of the maximum fatigue damage to the bogie frame is the weld at the traction motor seat, whose equivalent stress is 41.4 MPa.
A spectrum synthesis method for the multichannel vibration data of the mounting position of traction power is proposed, which provides a novel method for generating the vibration load spectrum of vehicle structures. The generated vibration spectra can characterize vibration characteristics in the frequency domain of the mounting position of the traction motor, thus effectively analyzing motor fatigue damage compared with the vibration spectra defined in the IEC 61373 standard and the vibration level of the motor defined in the UIC 615-4 standard.
The peak frequency of FRFs is consistent with peaks of the vibration spectra for the traction motor, which causes significant fatigue damage. Moreover, the fatigue damage of the mounted traction motor increases exponentially with increasing speed.

