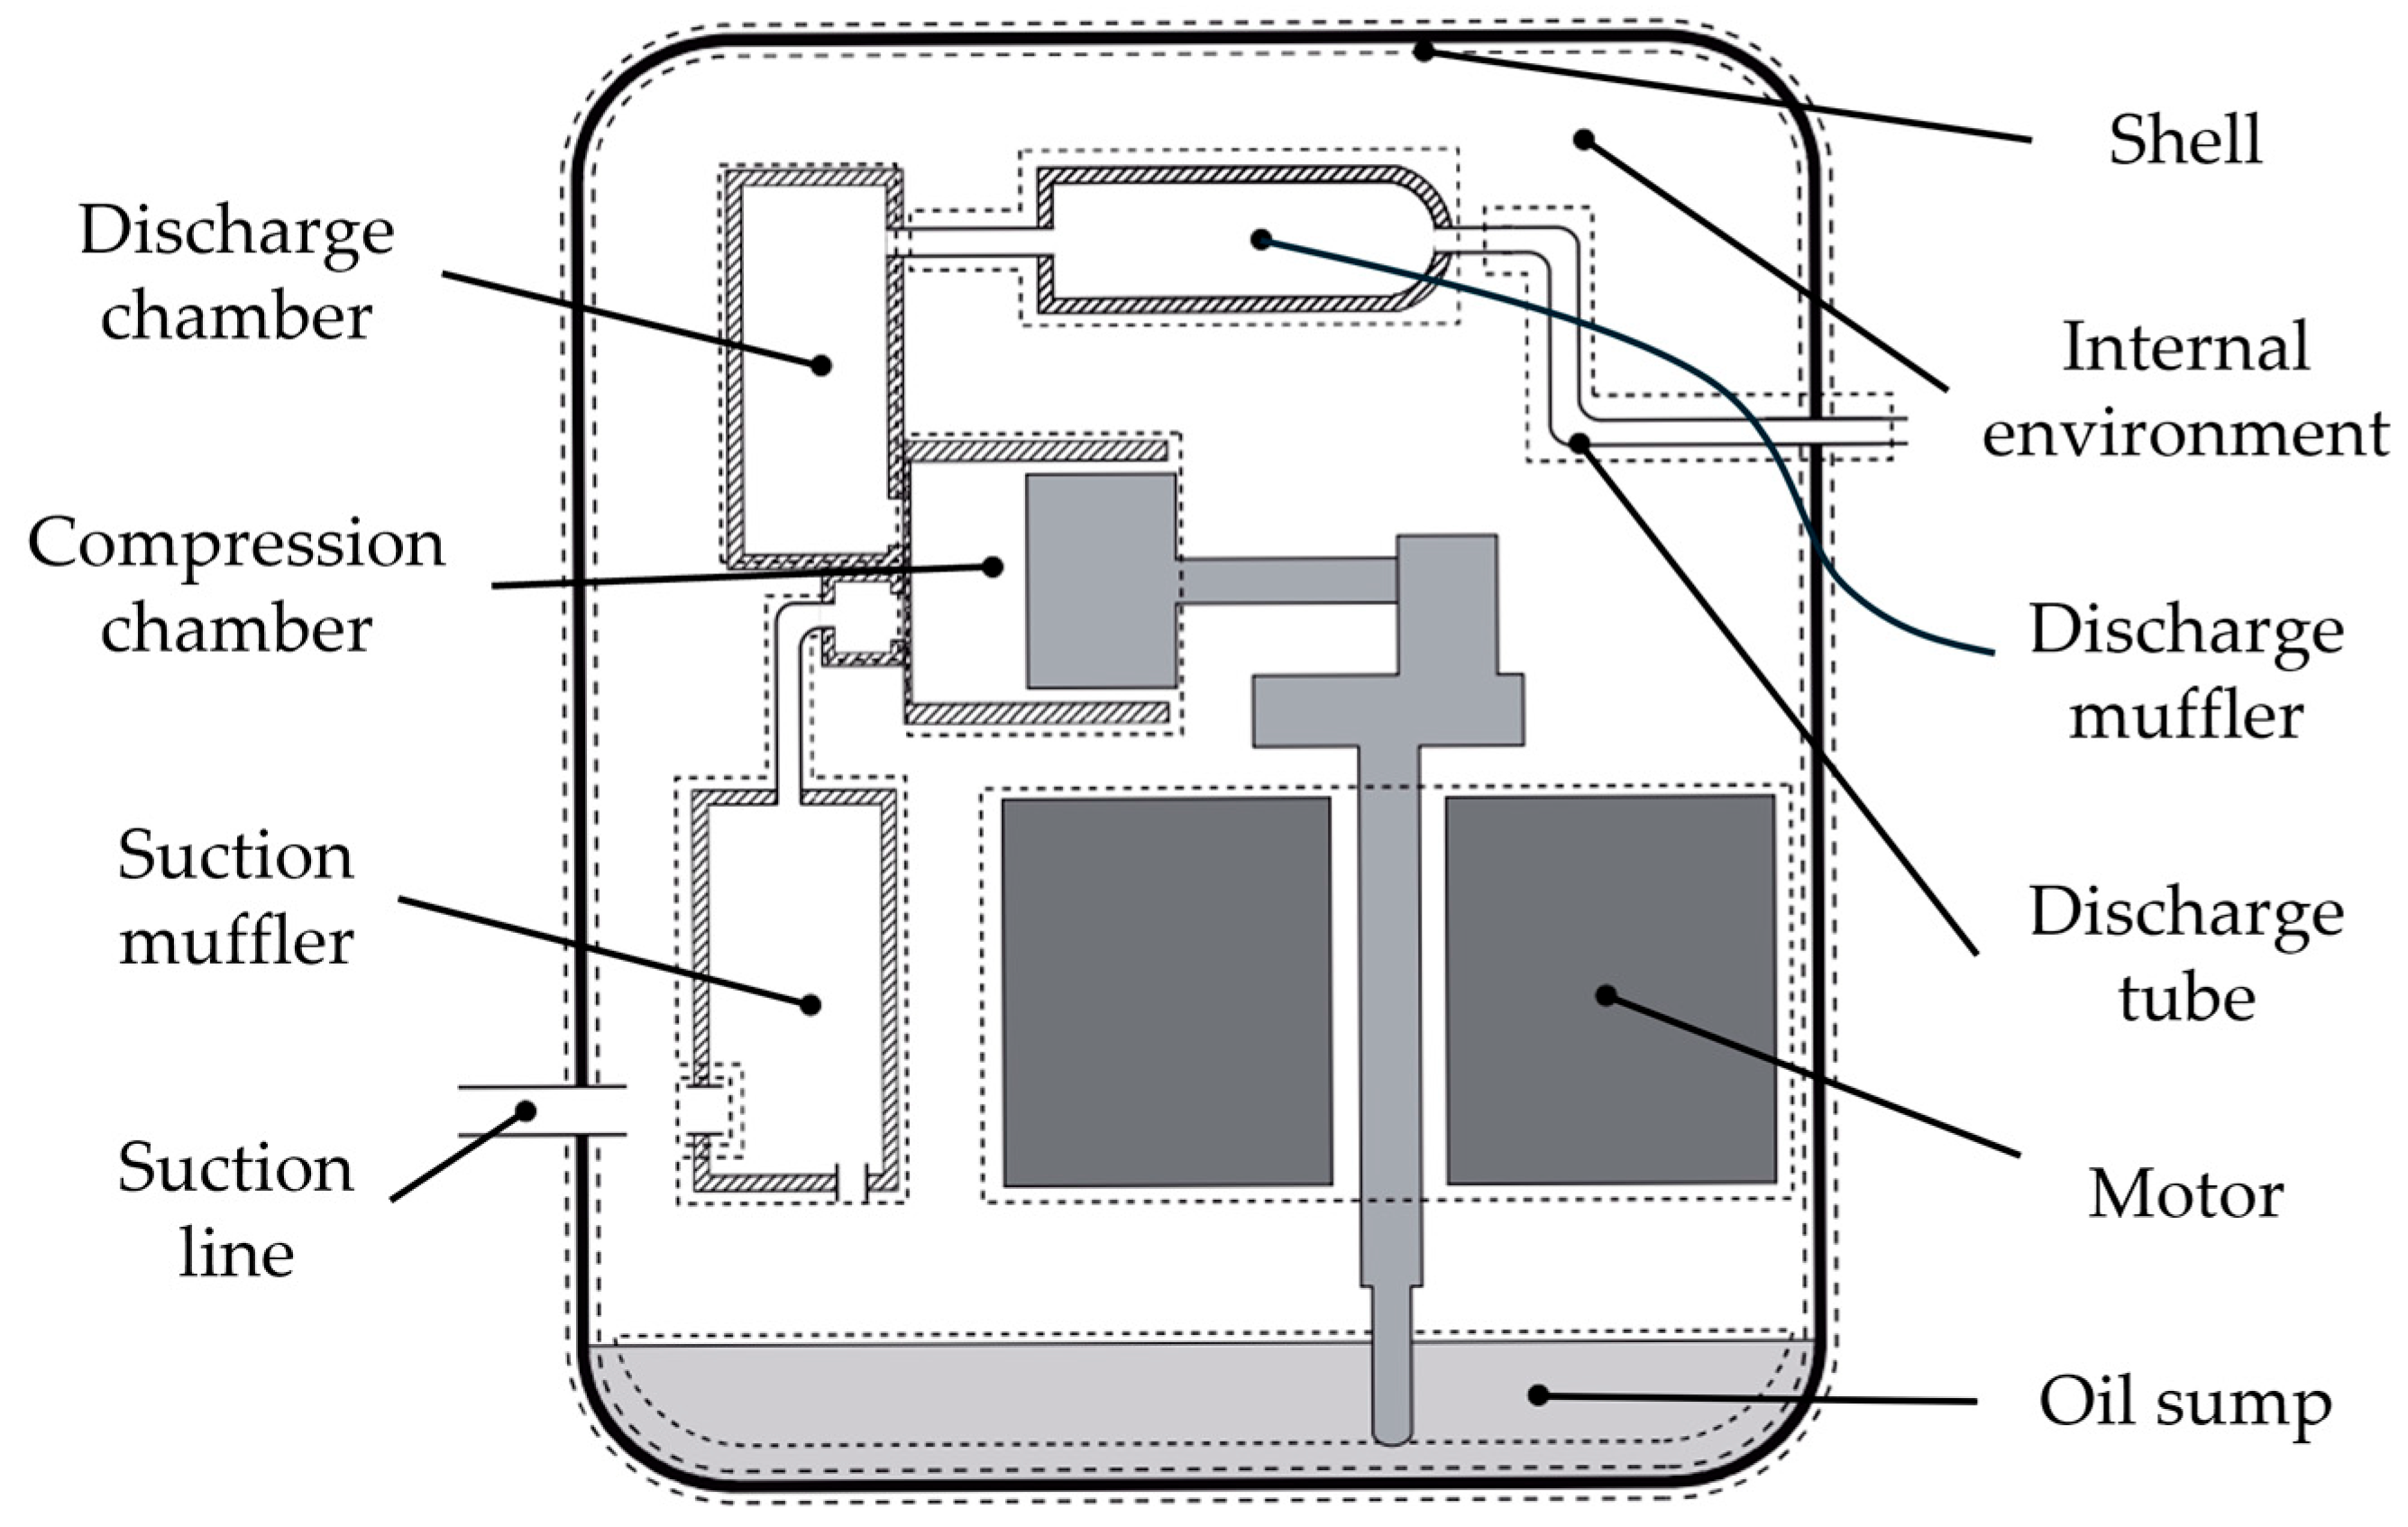
The analyses were conducted on a variable-speed hermetic reciprocating compressor (VSRC) with a 6.5 cm3 displacement, using R-600a as the refrigerant. This compressor features two distinct suction valves and two identical discharge valves. The study investigated rotational speeds from 1800 to 6300 rpm across various evaporating and condensing temperatures, with ambient and suction tube temperatures maintained at 32.2 °C.
3.1. Validation
Prior to experimental validation, a grid convergence study assessed numerical errors arising from the spatial discretization of the suction and discharge muffler tubes and chambers. Discretization errors were evaluated using the Grid Convergence Index (GCI) methodology proposed by Roache [
16], which is based on Richardson’s extrapolation method. The ASHRAE low back pressure (LBP) condition (evaporating temperature
= −23.3 °C, condensing temperature
= 54.4 °C) at 1800 rpm and 6300 rpm (the lowest and highest speeds analyzed) was selected for this study. The results indicated that exergy loss predictions achieved asymptotic values with increasing grid refinement, and the solutions were confirmed to be in the asymptotic range of convergence. For the finest grid analyzed, the estimated errors for suction muffler exergy loss were 0.04% (at 1800 rpm) and 0.21% (at 6300 rpm). For the discharge muffler under the same conditions, the errors were 0.17% and 0.78%, respectively. The muffler discretization corresponding to this finest grid was used for all subsequent analyses.
The numerical model predictions were validated against experimental data obtained from a hot gas cycle calorimeter. The validation covered several key performance indicators, including p–V diagrams within the compression cylinder, pressure pulsations in the suction and discharge mufflers, refrigerant mass flow rates, compressor power consumption, and temperatures at various compressor components. The test bench allows the compressor to be evaluated independently of other refrigeration system components, ensuring well-defined and reproducible operating conditions.
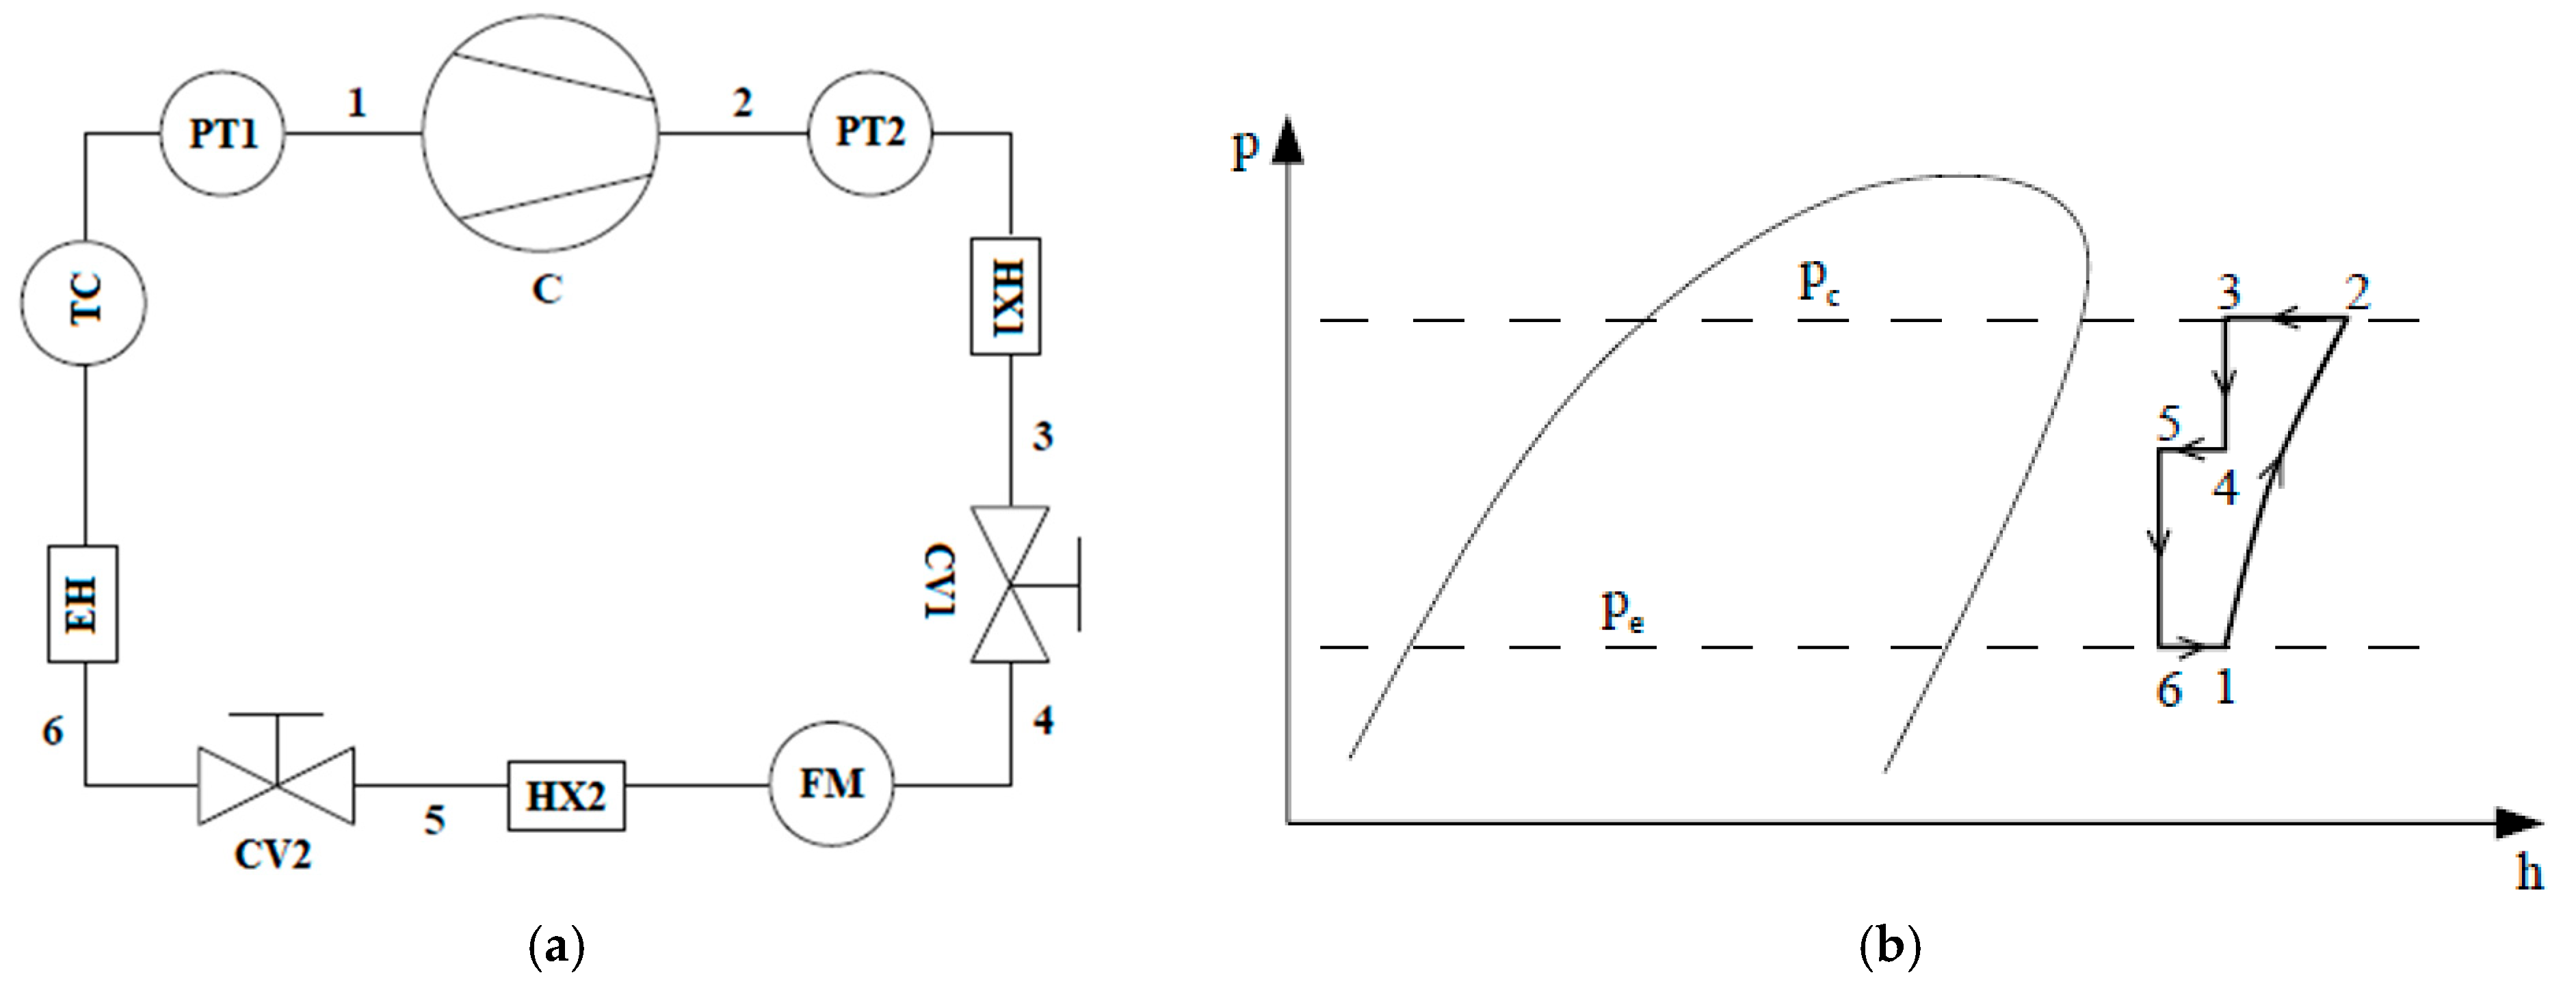
As shown in the schematic diagram of the calorimeter (
Figure 2a), the experimental setup includes pipelines, servo-controlled needle valves (CV1 and CV2), a mass flow meter (FM), heat exchangers (HX1 and HX2), a thermocouple (TC), and pressure transducers (PT1 and PT2). The needle valves CV1 and CV2 are used exclusively to reduce the pressure from the condensing level to the evaporating level. This type of valve is particularly suitable for compressor testing, as it allows for the precise and independent control of suction and discharge pressures. By adjusting these valves, the compressor can be accurately set to operate under any desired condition.
The calorimeter is designed to ensure that the refrigerant flows through both the high- and low-pressure lines in a superheated state, as shown in the pressure–enthalpy diagram (
Figure 2b). In this setup, refrigerant from the suction line (1) enters the compressor (C) and is compressed to the system’s condensing pressure
(point 2). Pressure transducers PT1 and PT2 monitor the suction and discharge pressures, respectively. The fluid then passes through heat exchanger HX1, where its temperature is reduced (point 3), and is adiabatically expanded through control valve CV1 to an intermediate pressure (point 4). After the mass flow rate is measured by the flow meter FM, the fluid is further cooled in heat exchanger HX2 (point 5) and adiabatically expanded again through control valve CV2 to the evaporating pressure
(point 6). Finally, an electrical heater (EH) and a thermocouple (TC) are used to adjust the fluid temperature in the suction line, returning it to the initial condition (point 1).
The thermodynamic conditions at the suction (1) and discharge (2) lines, and thus the operating conditions experienced by the compressor, are controlled by adjusting the refrigerant charge, the openings of the control valves, and the amount of thermal energy exchanged in the heat exchangers and by the electrical heater. In addition to the mass flow rate, the following parameters were measured during compressor operation: crankshaft angle, pressures in the suction and compression chambers, temperatures in the suction chamber and cylinder wall, and the suction valve opening. The experimental procedure involved mounting the compressor into the system, evacuating it to create a vacuum, admitting the desired amount of refrigerant, starting the compressor, and adjusting the control valves to establish the target operating conditions.
Measurements were conducted after the compressor had been operating for at least two hours to ensure that it reached a fully cyclic steady state regime. Data were then collected over a 30 min interval. Each test was repeated three times, with global parameters of the compression cycle (such as mass flow rate, indicated power, and local temperatures) reported as mean values. Parameters that vary with the crankshaft angle, such as p-V diagram, pressures in the suction and compression chambers, were taken from the cycle in which the global parameters most closely matched the overall mean.
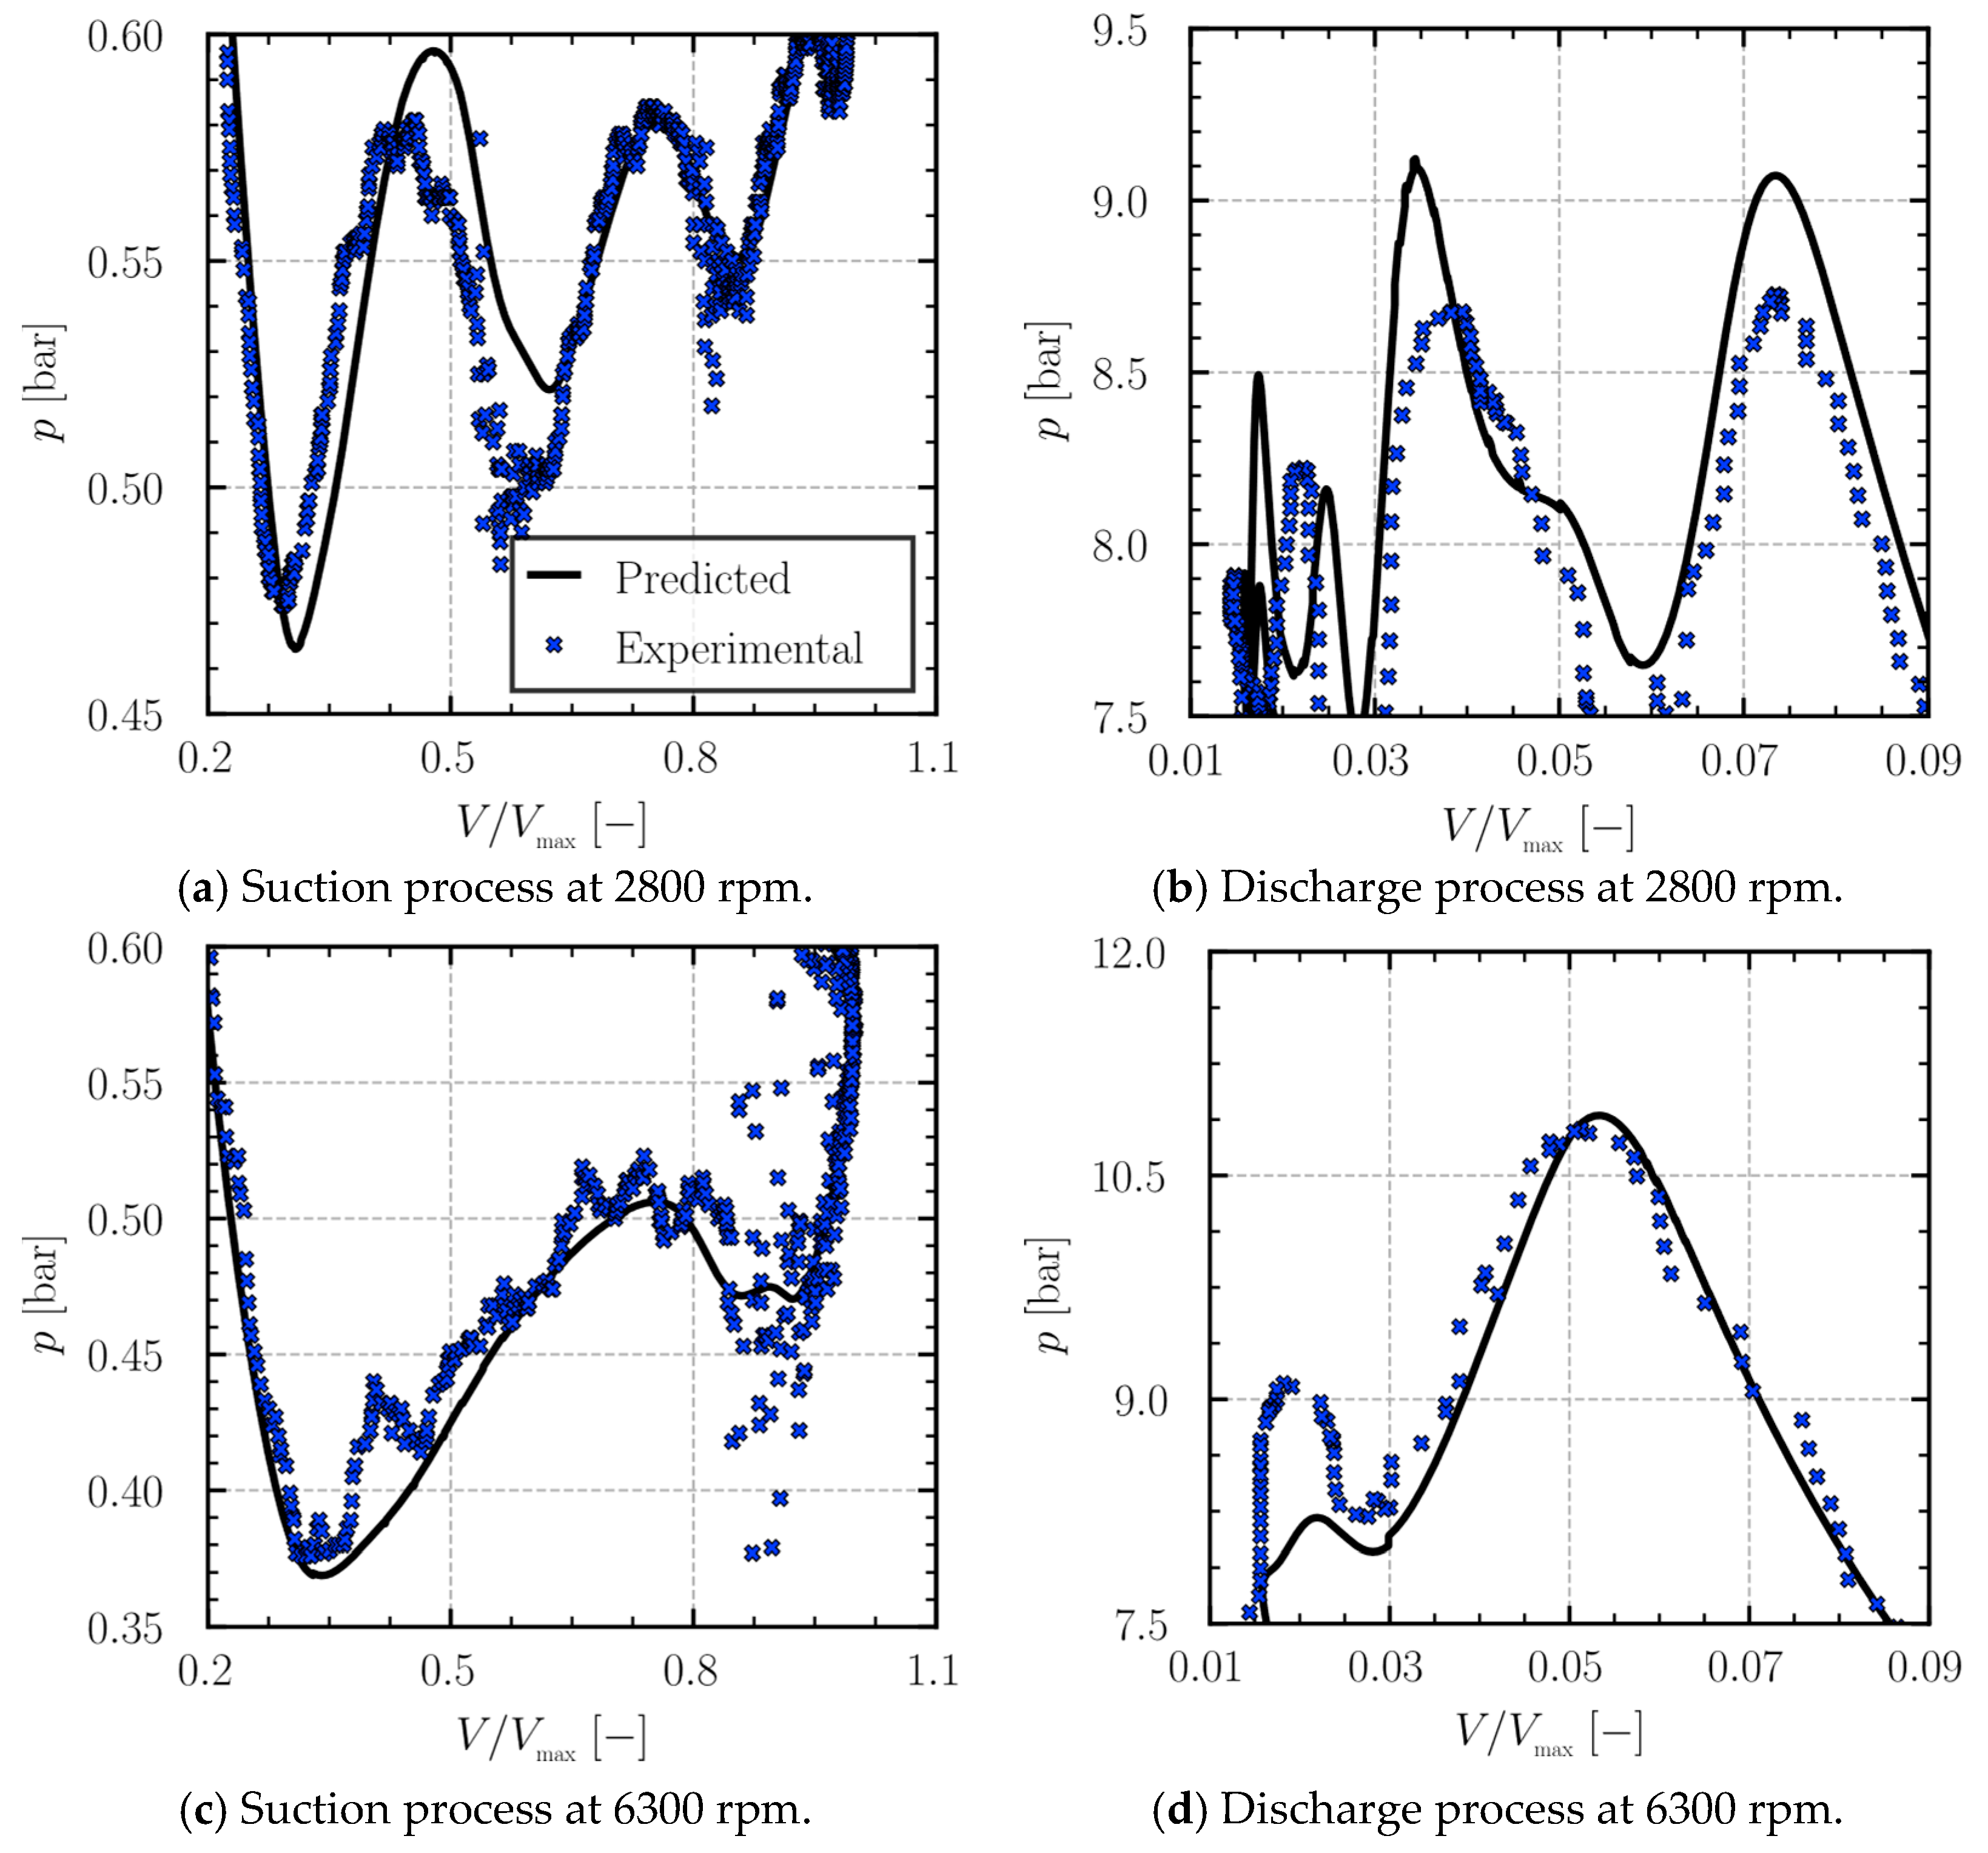
The p-V diagrams shown in
Figure 3 for compressor speeds of 2800 and 6300 rpm demonstrated good agreement between predictions and measurements. Some minor deviations were observed, particularly during the discharge process at 2800 rpm. These discrepancies could be attributed to factors not fully captured by the model, such as the drilled channel in the cylinder wall for pressure transducer placement (which might induce high-frequency pulsations in the measurements) or simplifications in modeling valve phenomena like oil stiction on the seat and the precise assessment of effective force and flow areas.
Pressure pulsation predictions in both suction and discharge chambers (
Figure 4) also aligned well with experimental data for 2800 and 6300 rpm. The model successfully captured the increase in pulsation amplitude with rising rotational speed, an effect also noted by Liu and Soedel [
17]. Any slight differences observed may be due to the positioning of pressure transducers in the experimental setup or simplifications in the acoustic muffler and valve dynamic models.
Results of volumetric efficiency from predictions and measurements (
Table 4) across the 1800–6300 rpm range showed good agreement, with deviations falling within experimental uncertainty. Similarly, predicted power consumption (
Table 5) matched experimental values closely. Finally, measured and numerically predicted temperatures at the suction chamber, discharge chamber, cylinder wall, and compressor shell are presented in
Table 6. The thermal model global conductances were calibrated using data from LBP conditions at rotational speeds ranging from 2800 to 6300 rpm. With these calibrated conductances, the simulation model demonstrated its ability to accurately predict compressor temperatures, including at speeds such as 2200 rpm, which is outside the direct calibration range but within the model’s predictive capability.
These comprehensive comparisons confirm that the simulation model can accurately predict p-V diagrams, pressure pulsations, mass flow rates, power consumption, and component temperatures across different rotational speeds. The developed simulation model is therefore considered validated and suitable for undertaking the subsequent performance analyses presented herein.
3.2. Volumetric Efficiency Analysis
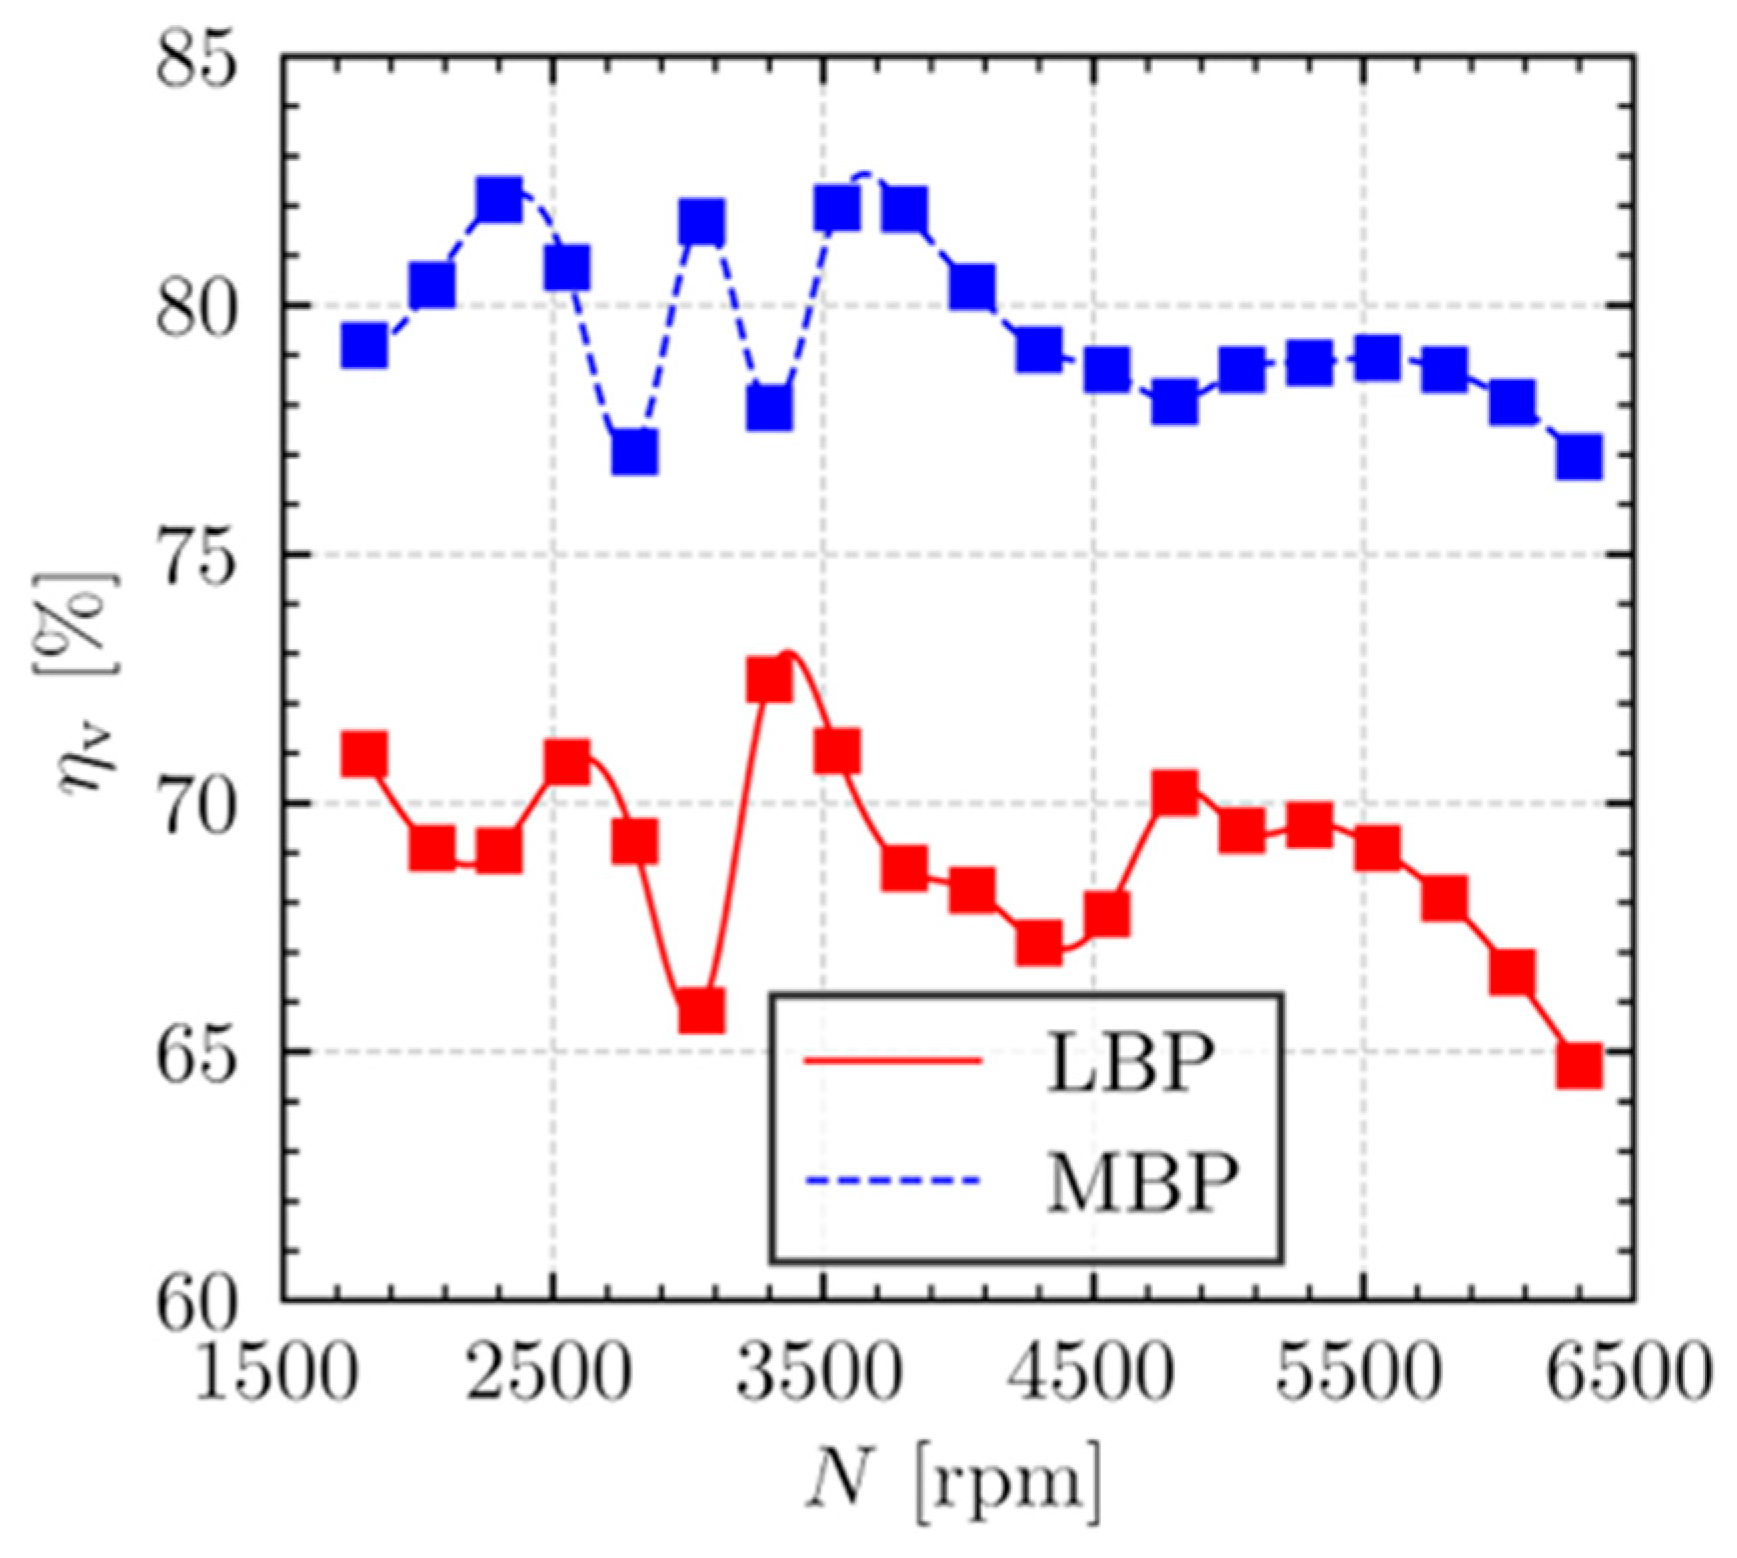
The relationship between overall volumetric efficiency and rotational speed, under the LBP (
= −23.3 °C,
= 54.4 °C) and MBP (
= −6.7 °C,
= 54.4 °C) operating conditions, is illustrated in
Figure 5. Across the analyzed speed range of 1800–6500 rpm, a non-monotonic variation in volumetric efficiency is evident for both LBP and MBP conditions. Such oscillatory behavior with rotational speed is consistent with previous observations reported by Tao et al. [
18]. Beyond the final efficiency peak observed around 3500 rpm, further increases in rotational speed predominantly led to a decline in the compressor volumetric efficiency under both operating conditions.
The volumetric inefficiencies that reduce the mass flow rate are associated with the individual sources (
Table 2) under different operating conditions and compressor speed. It is important to note, however, that volumetric inefficiency due to motor slip is excluded from this specific breakdown, as detailed electric motor modeling is beyond the scope of the present study.
3.2.1. Suction Muffler
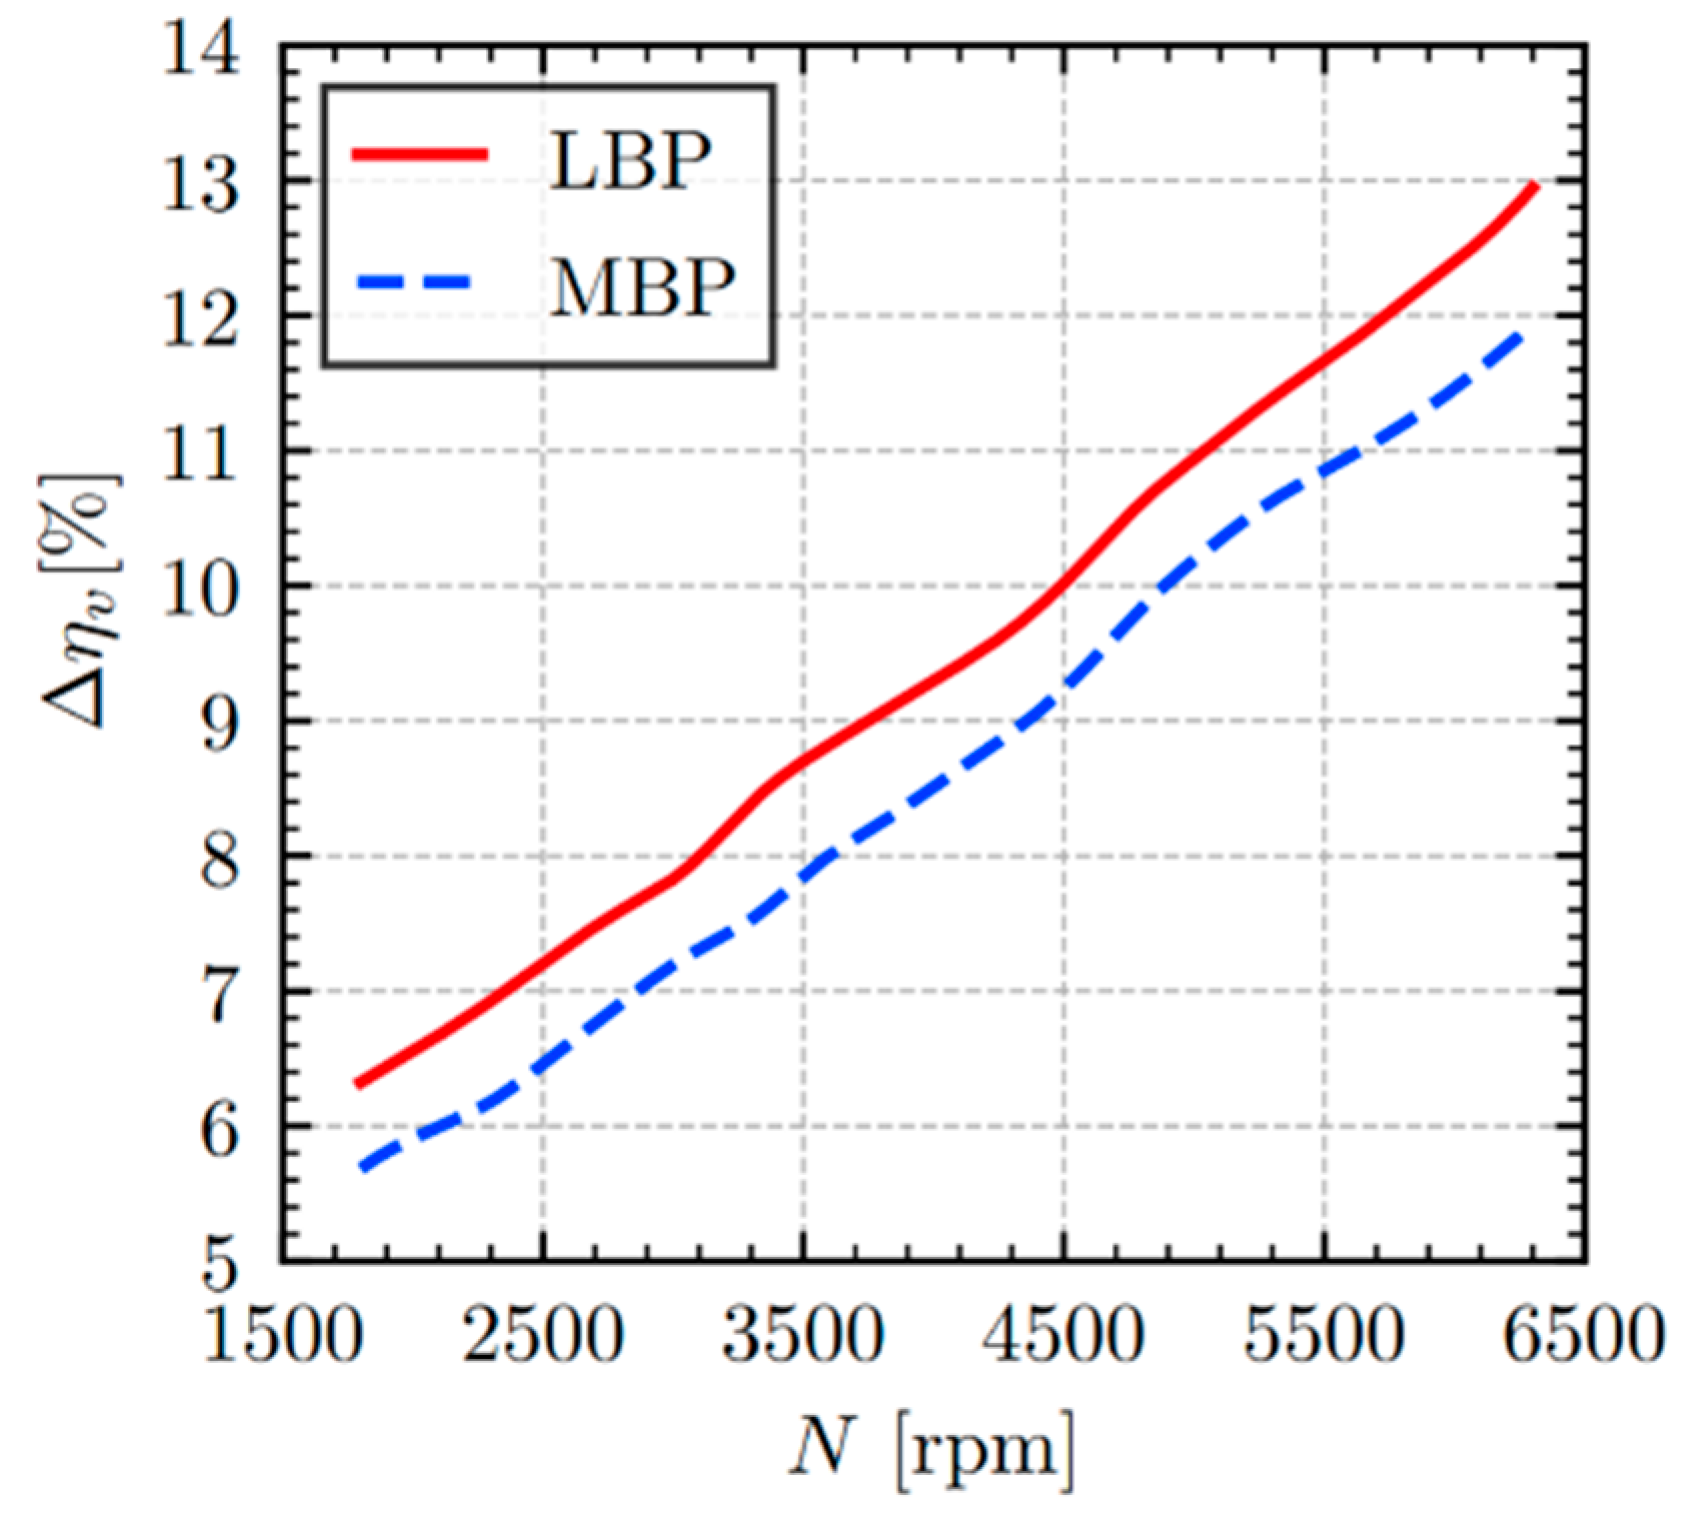
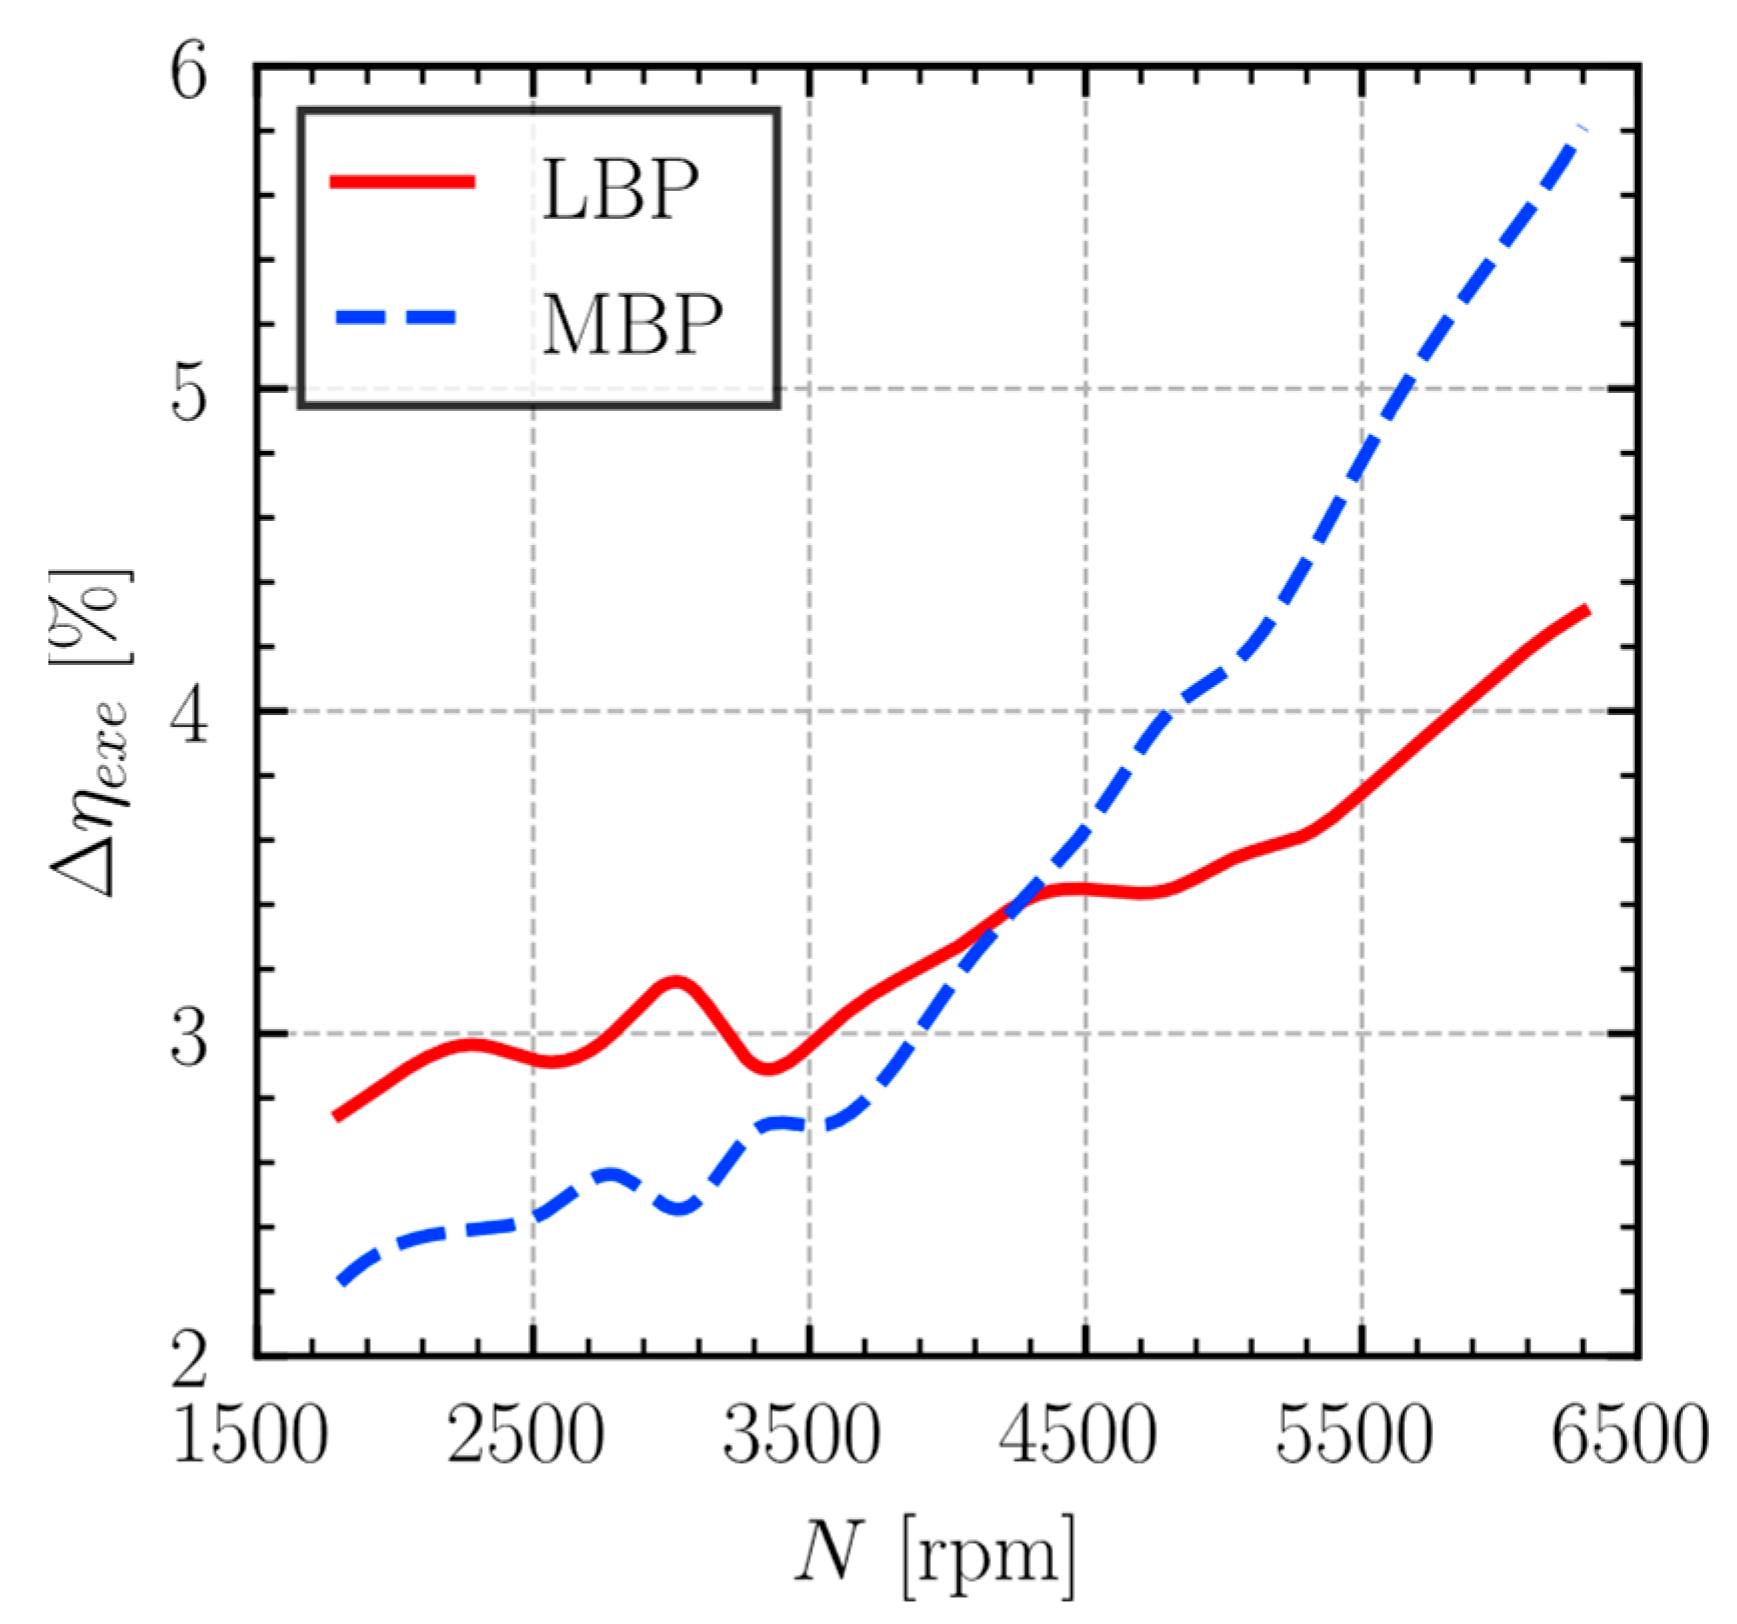
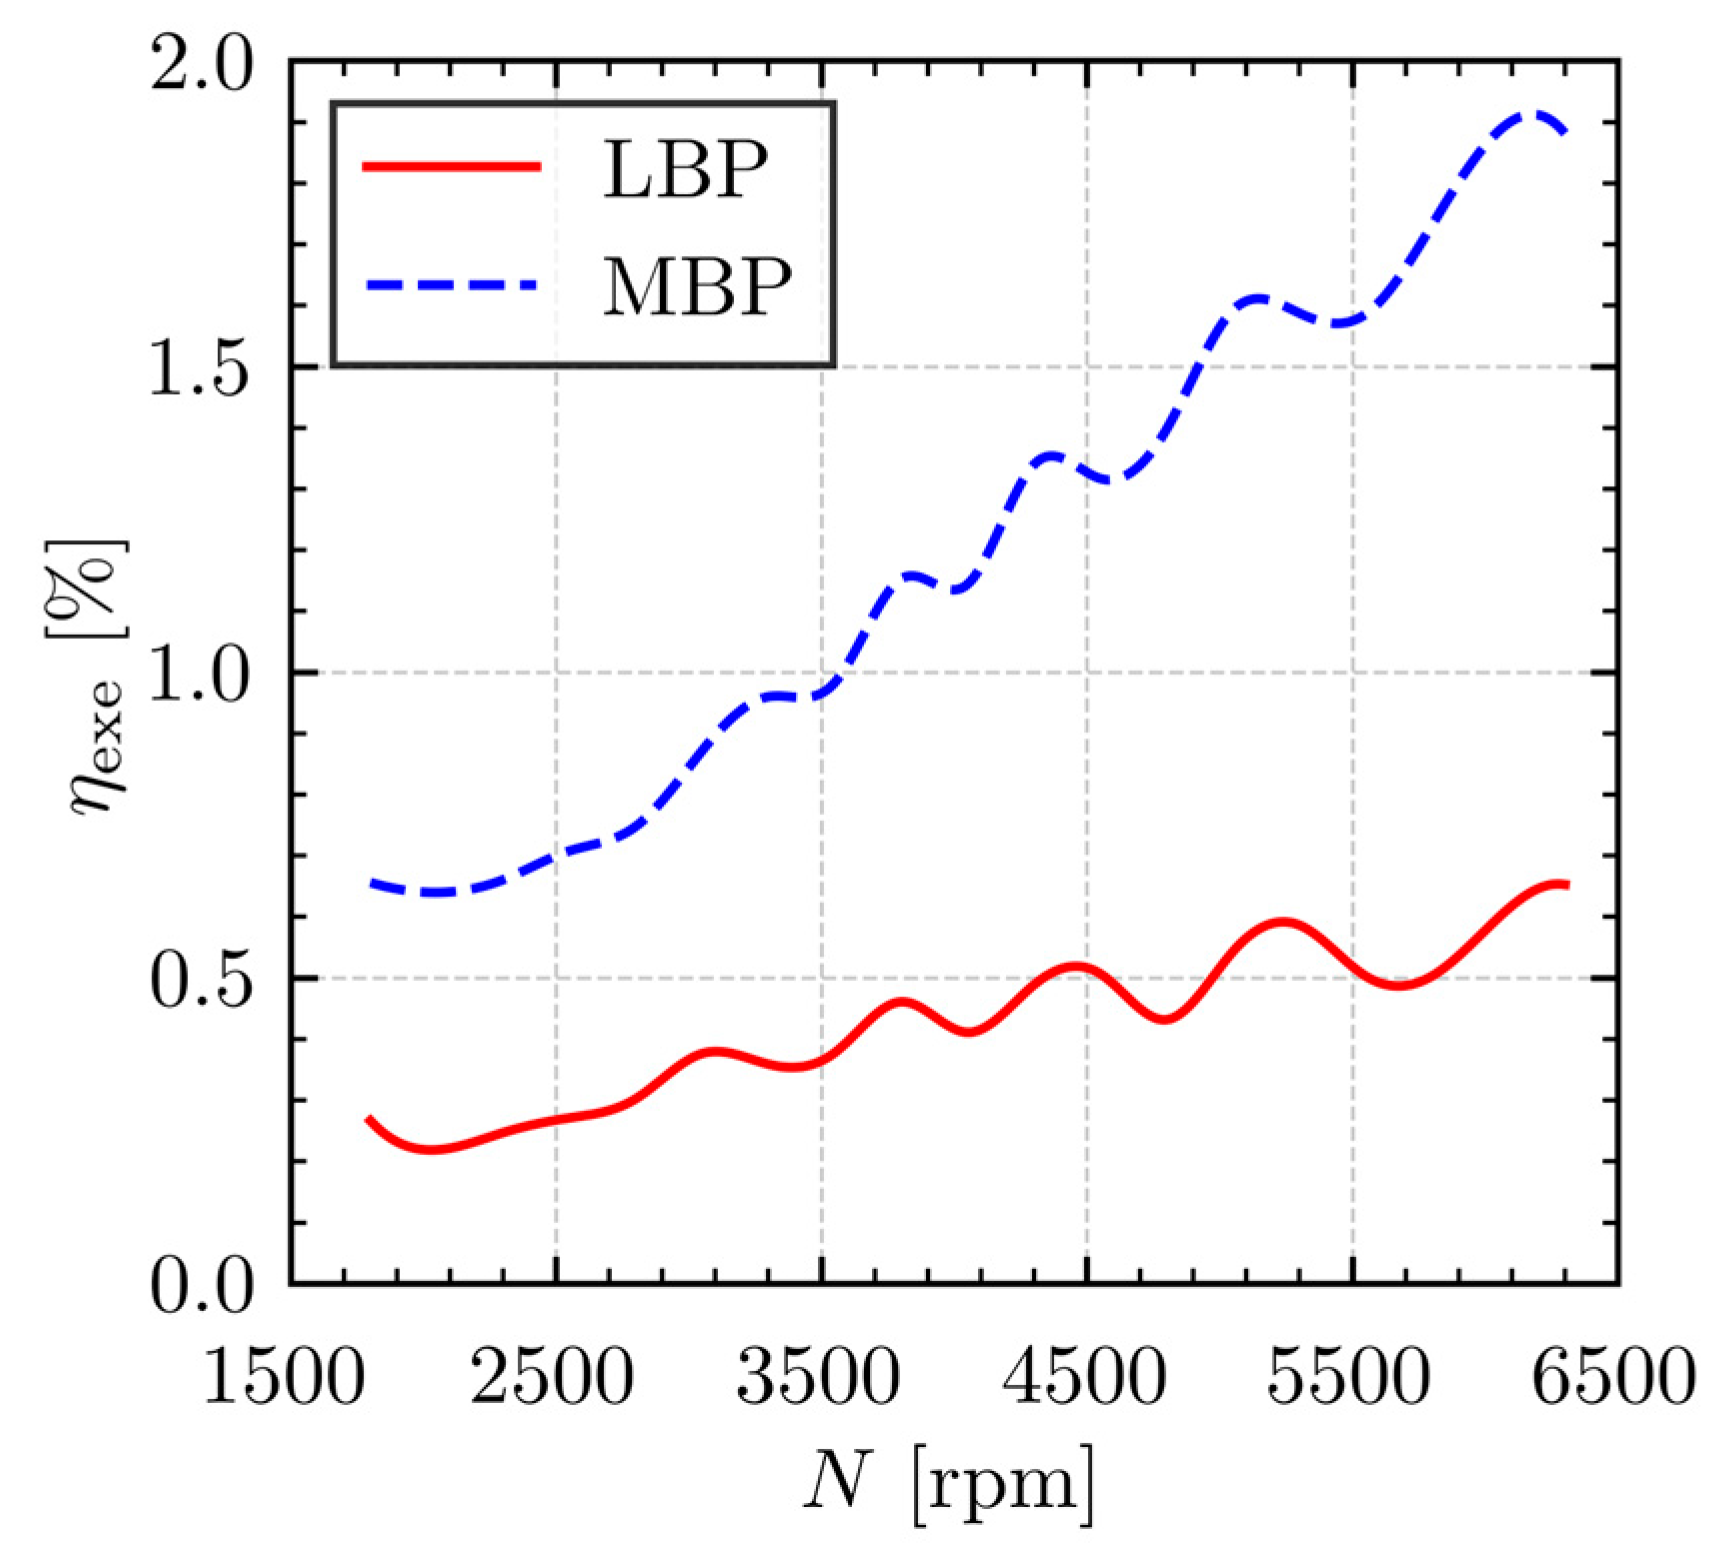
The volumetric inefficiency associated with fluid flow through the suction muffler increases significantly with compressor rotational speed, as shown in
Figure 6 for both the LBP and MBP operating conditions. The LBP condition consistently exhibits higher levels of inefficiency across the entire speed range analyzed. The suction muffler volumetric inefficiency can be attributed to the following two primary components: losses due to viscous friction (pressure loss, Δη
v,hl) and heat transfer (gas superheating, Δη
v,ht).
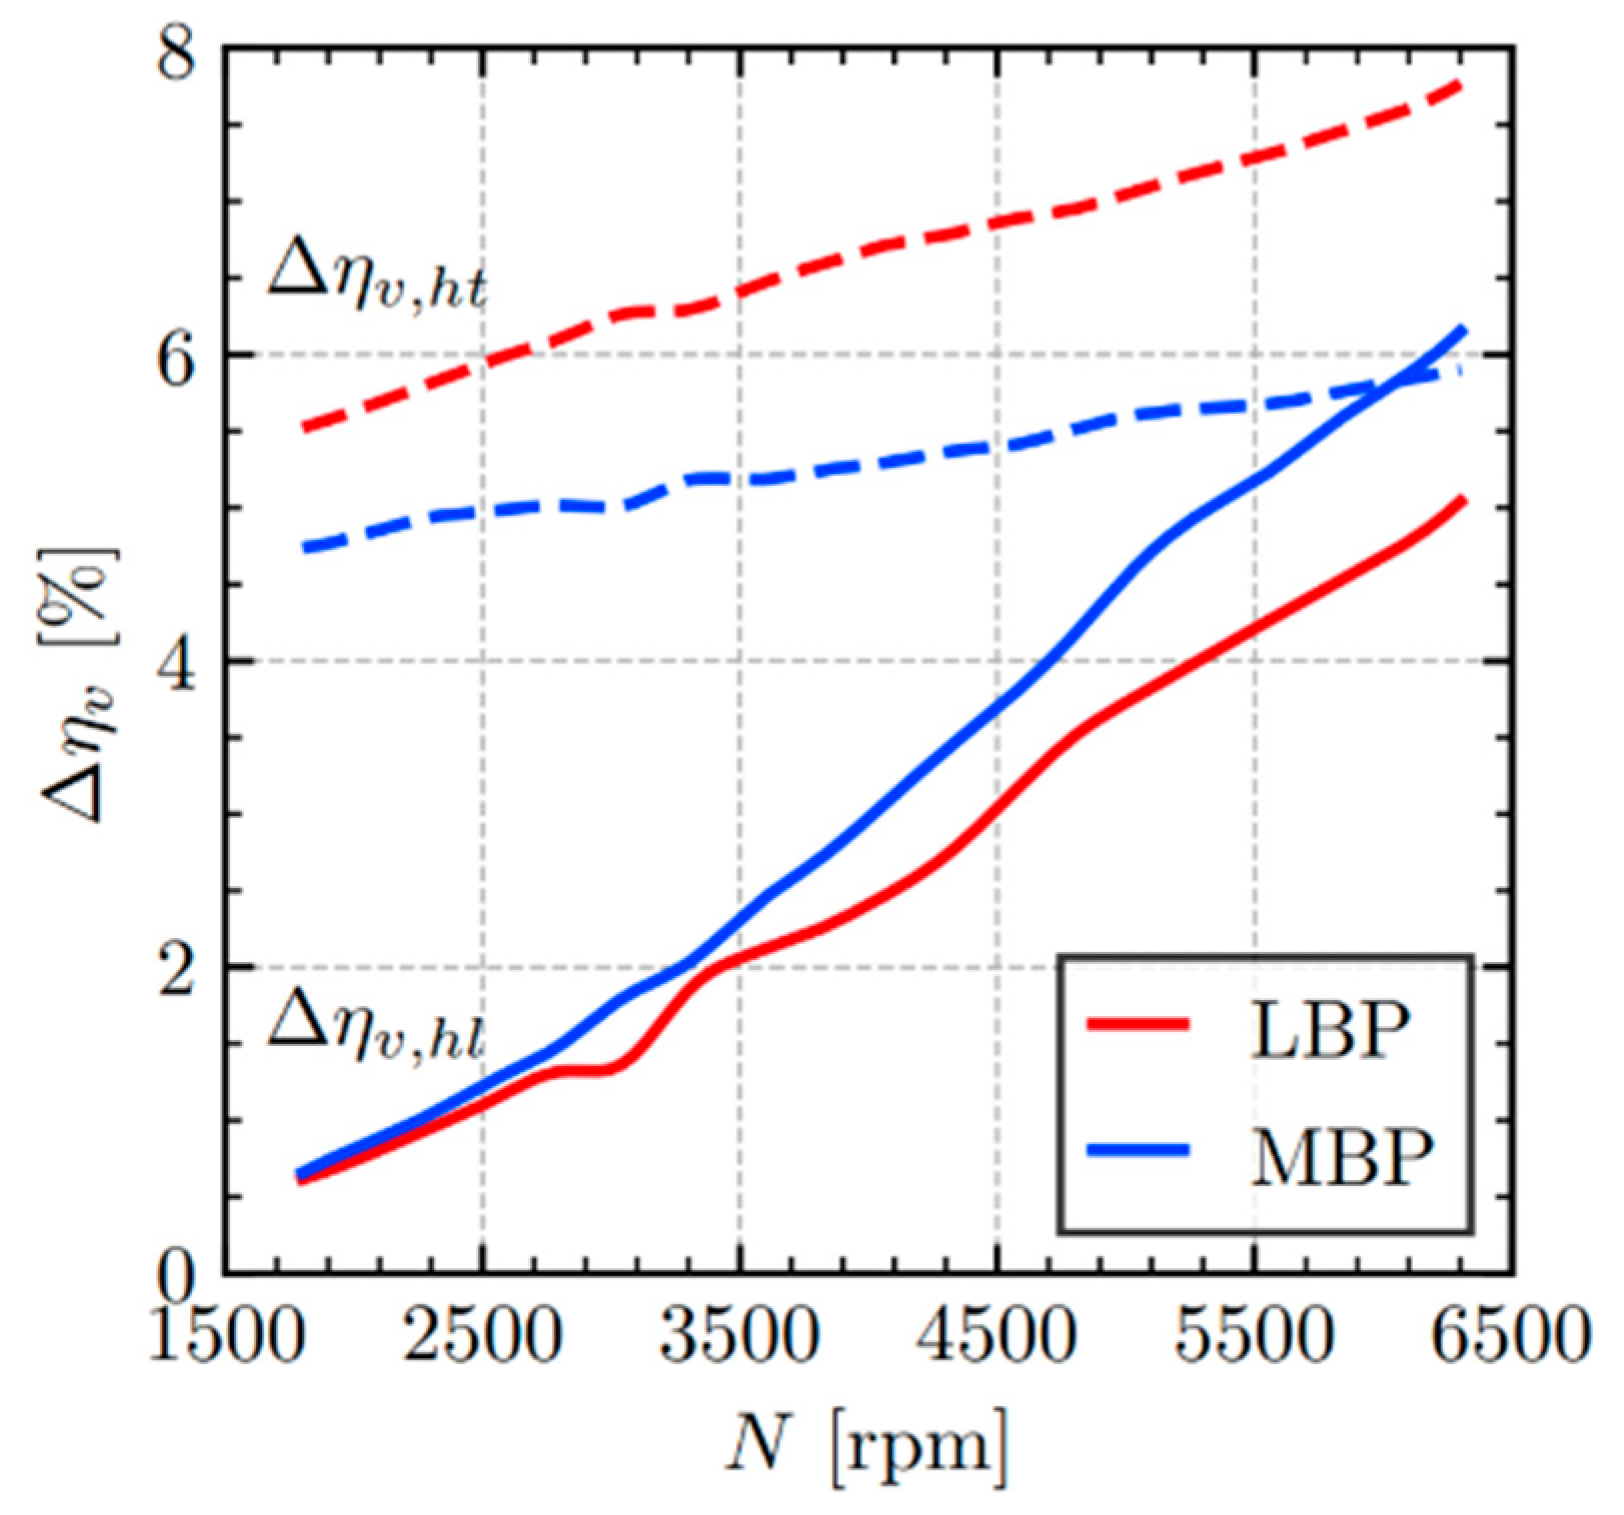
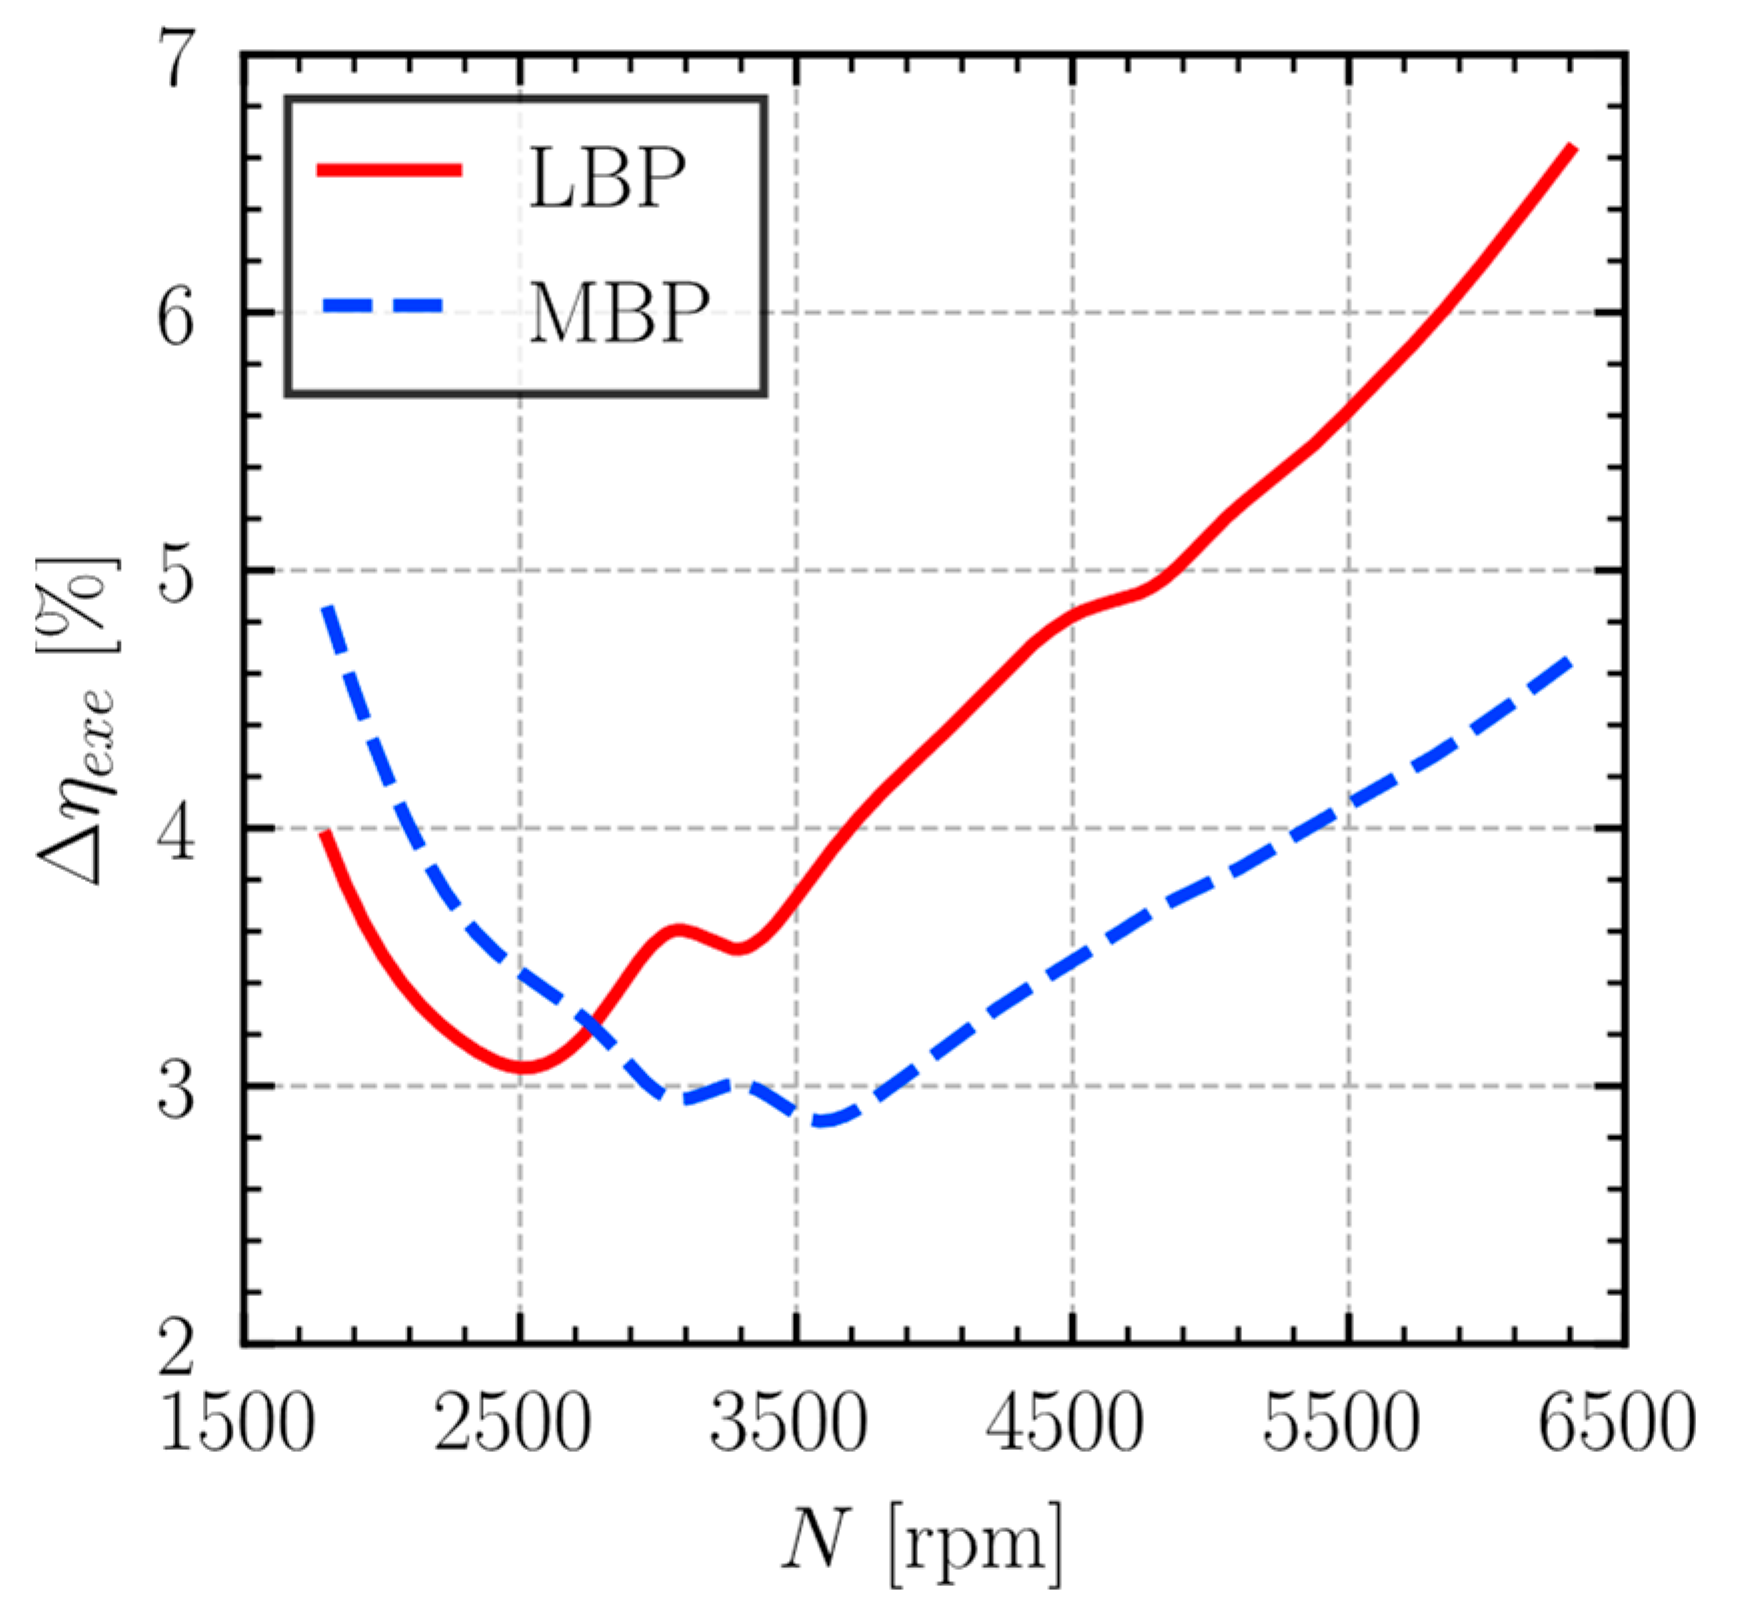
Figure 7 indicates that heat transfer (dashed line) accounts for much of the suction muffler inefficiency under both LBP and MBP conditions. However, the contribution from pressure loss (solid line) becomes significantly more pronounced with increasing rotational speed, rising from 0.6% at 1800 rpm to 6.2% at 6300 rpm under MBP conditions and from 0.6% to 5.1% under LBP conditions over the same speed range. The volumetric inefficiency linked to pressure loss is consistently greater for the MBP condition. This is a direct consequence of the higher mass flow rates inherent to MBP operation, which, when coupled with increasing compressor speed, result in greater refrigerant velocities within the muffler, thereby intensifying viscous friction and intensifying pressure loss. In contrast, the heat transfer component of inefficiency demonstrates less sensitivity to rotational speed and is typically more significant under the LBP condition.
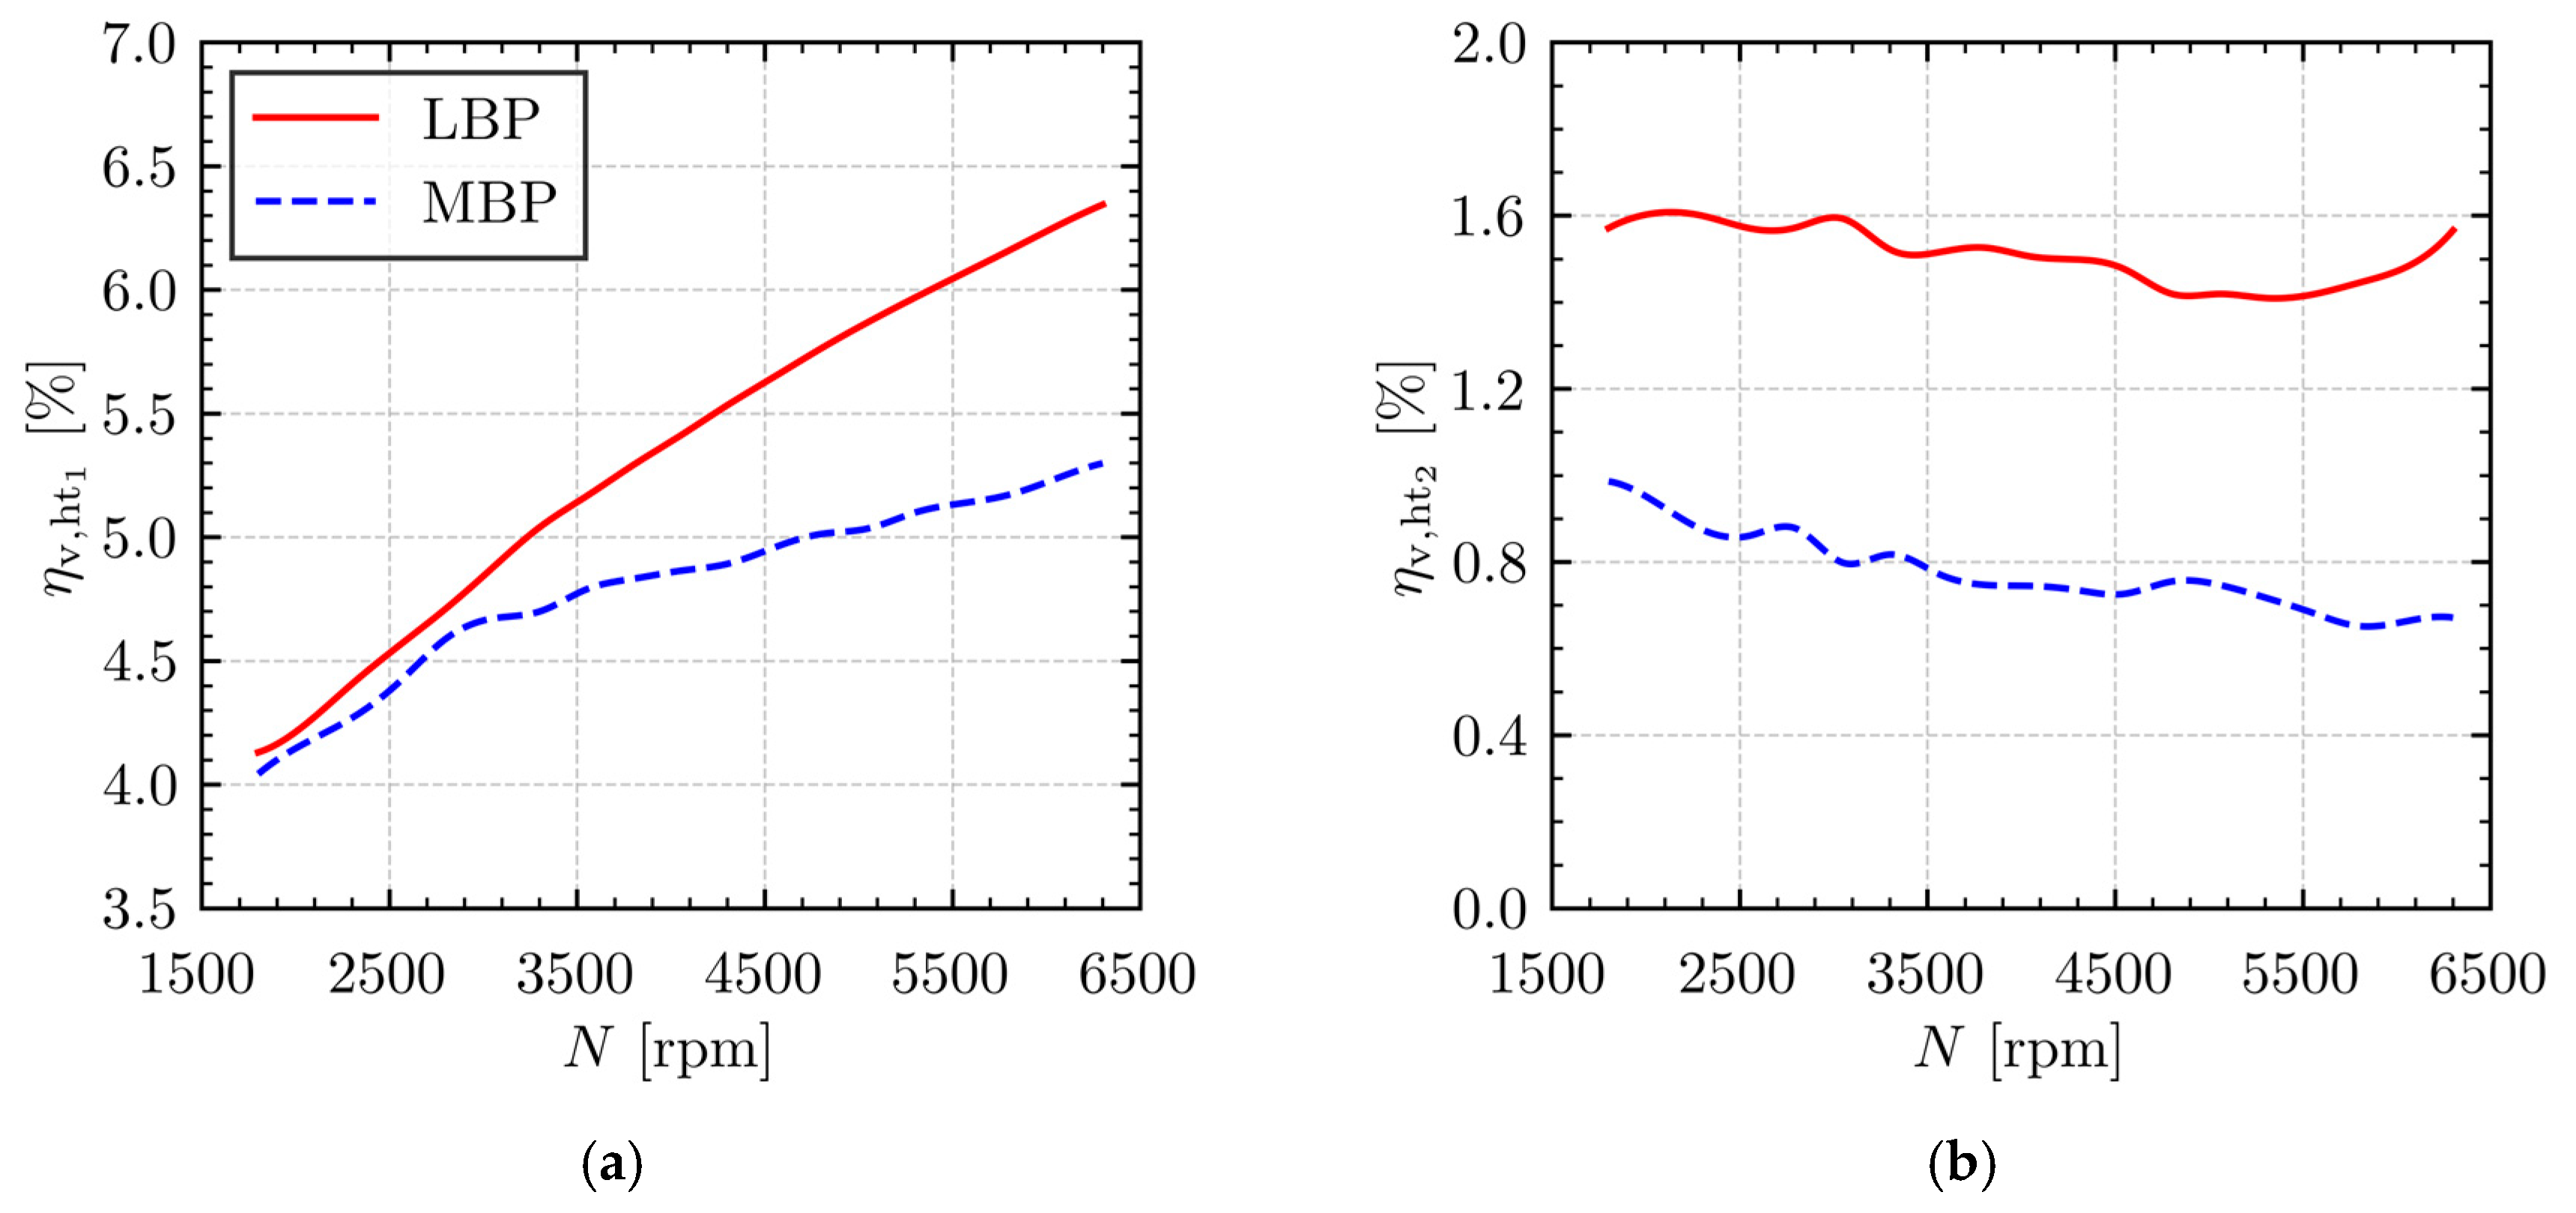
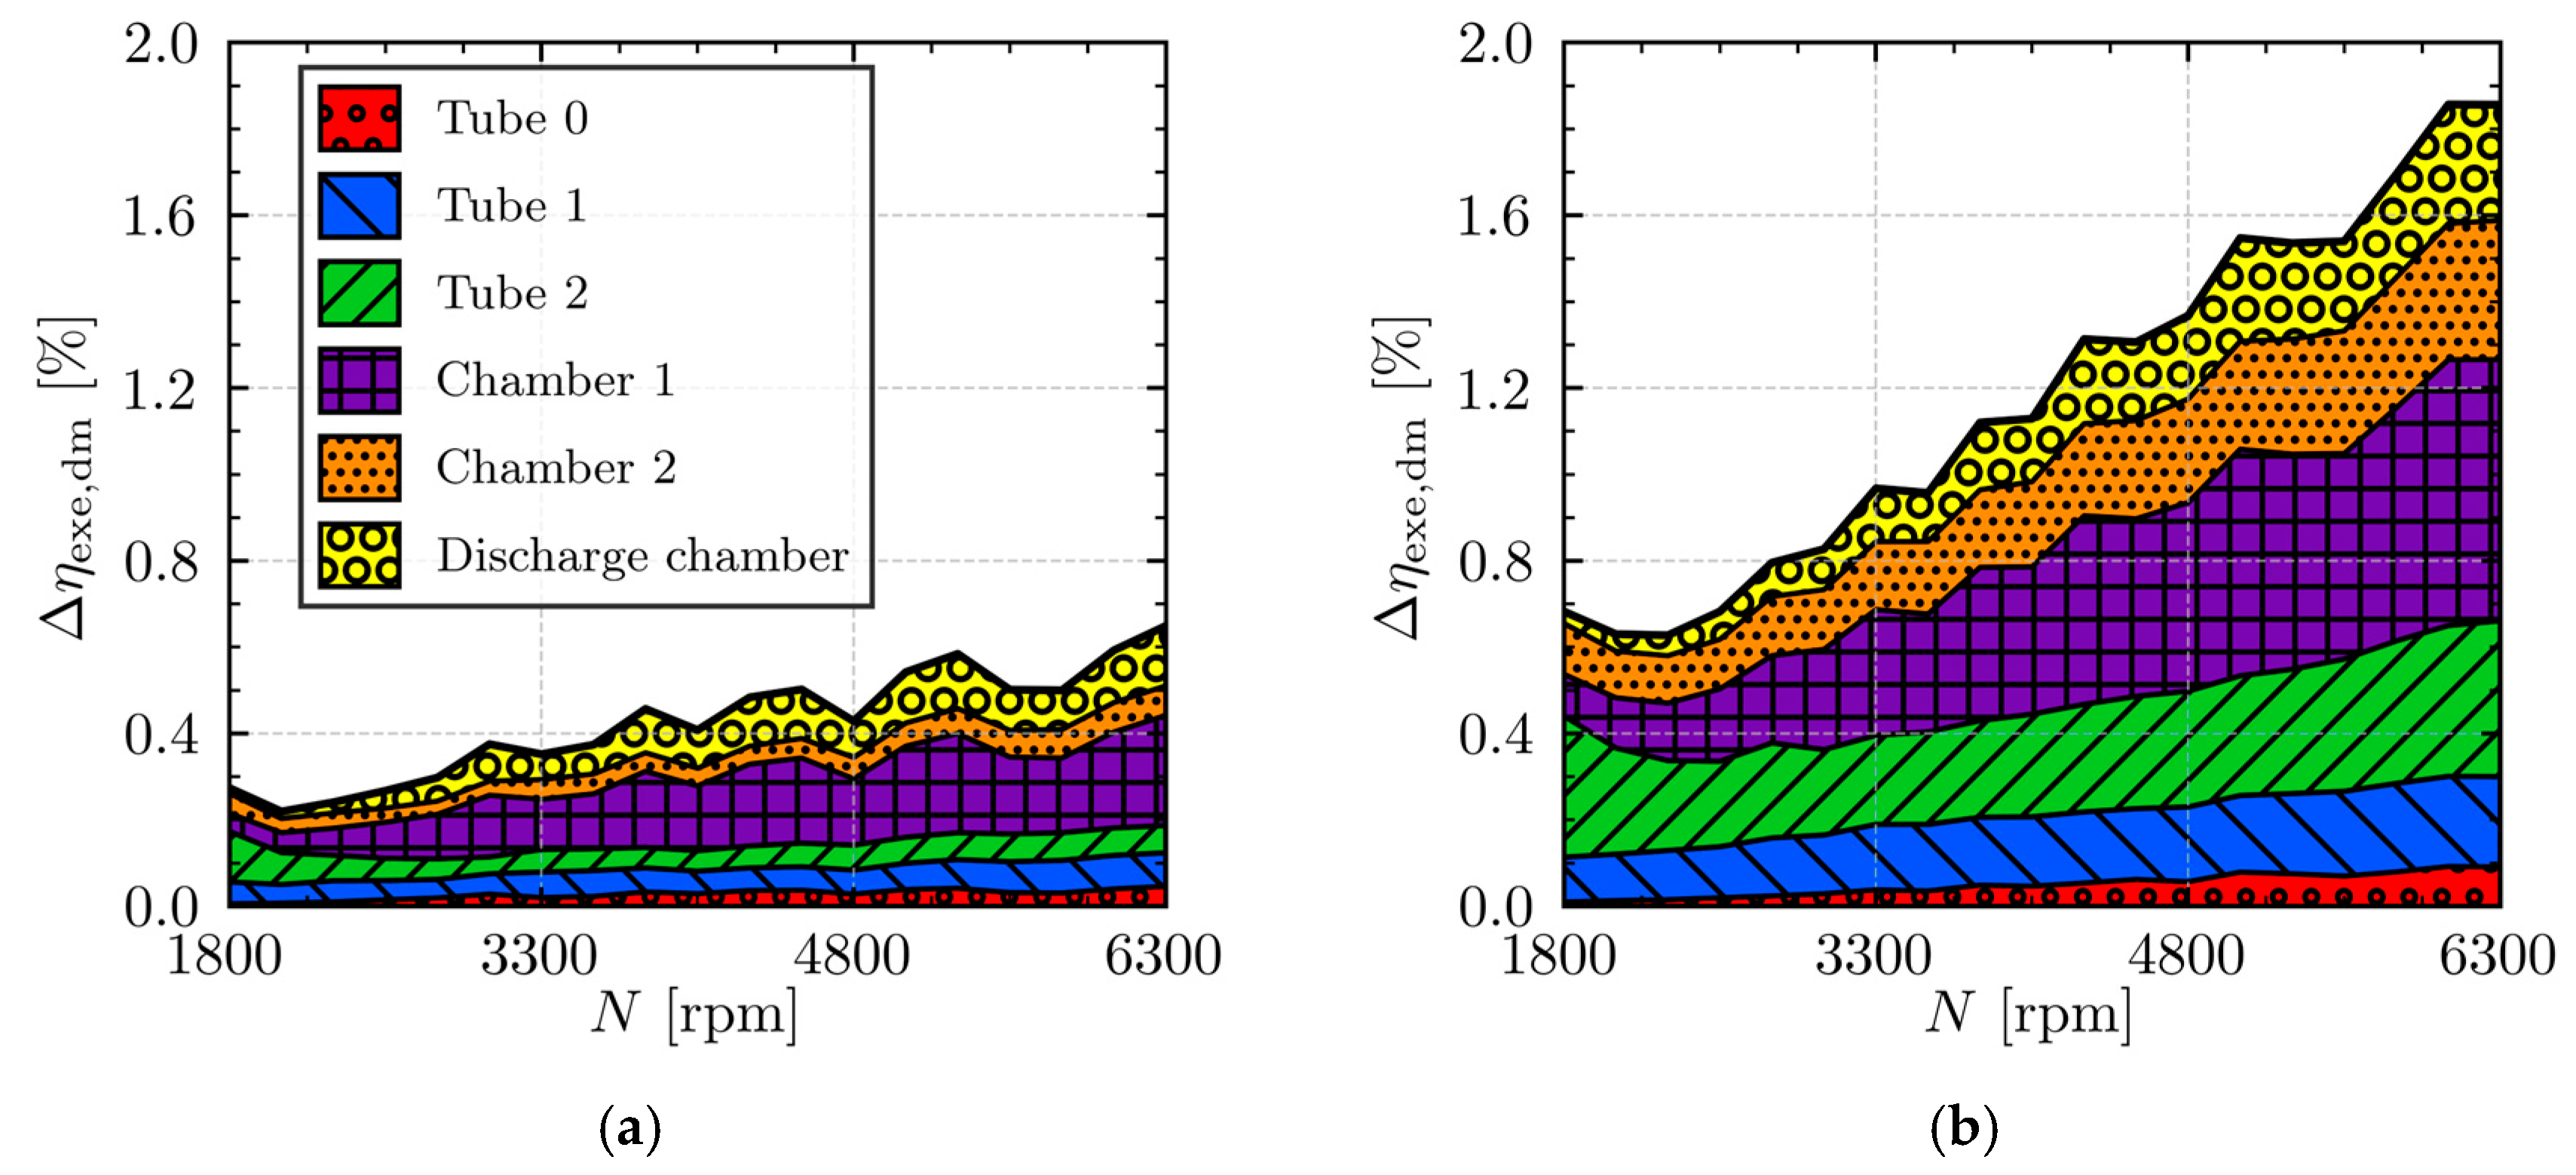
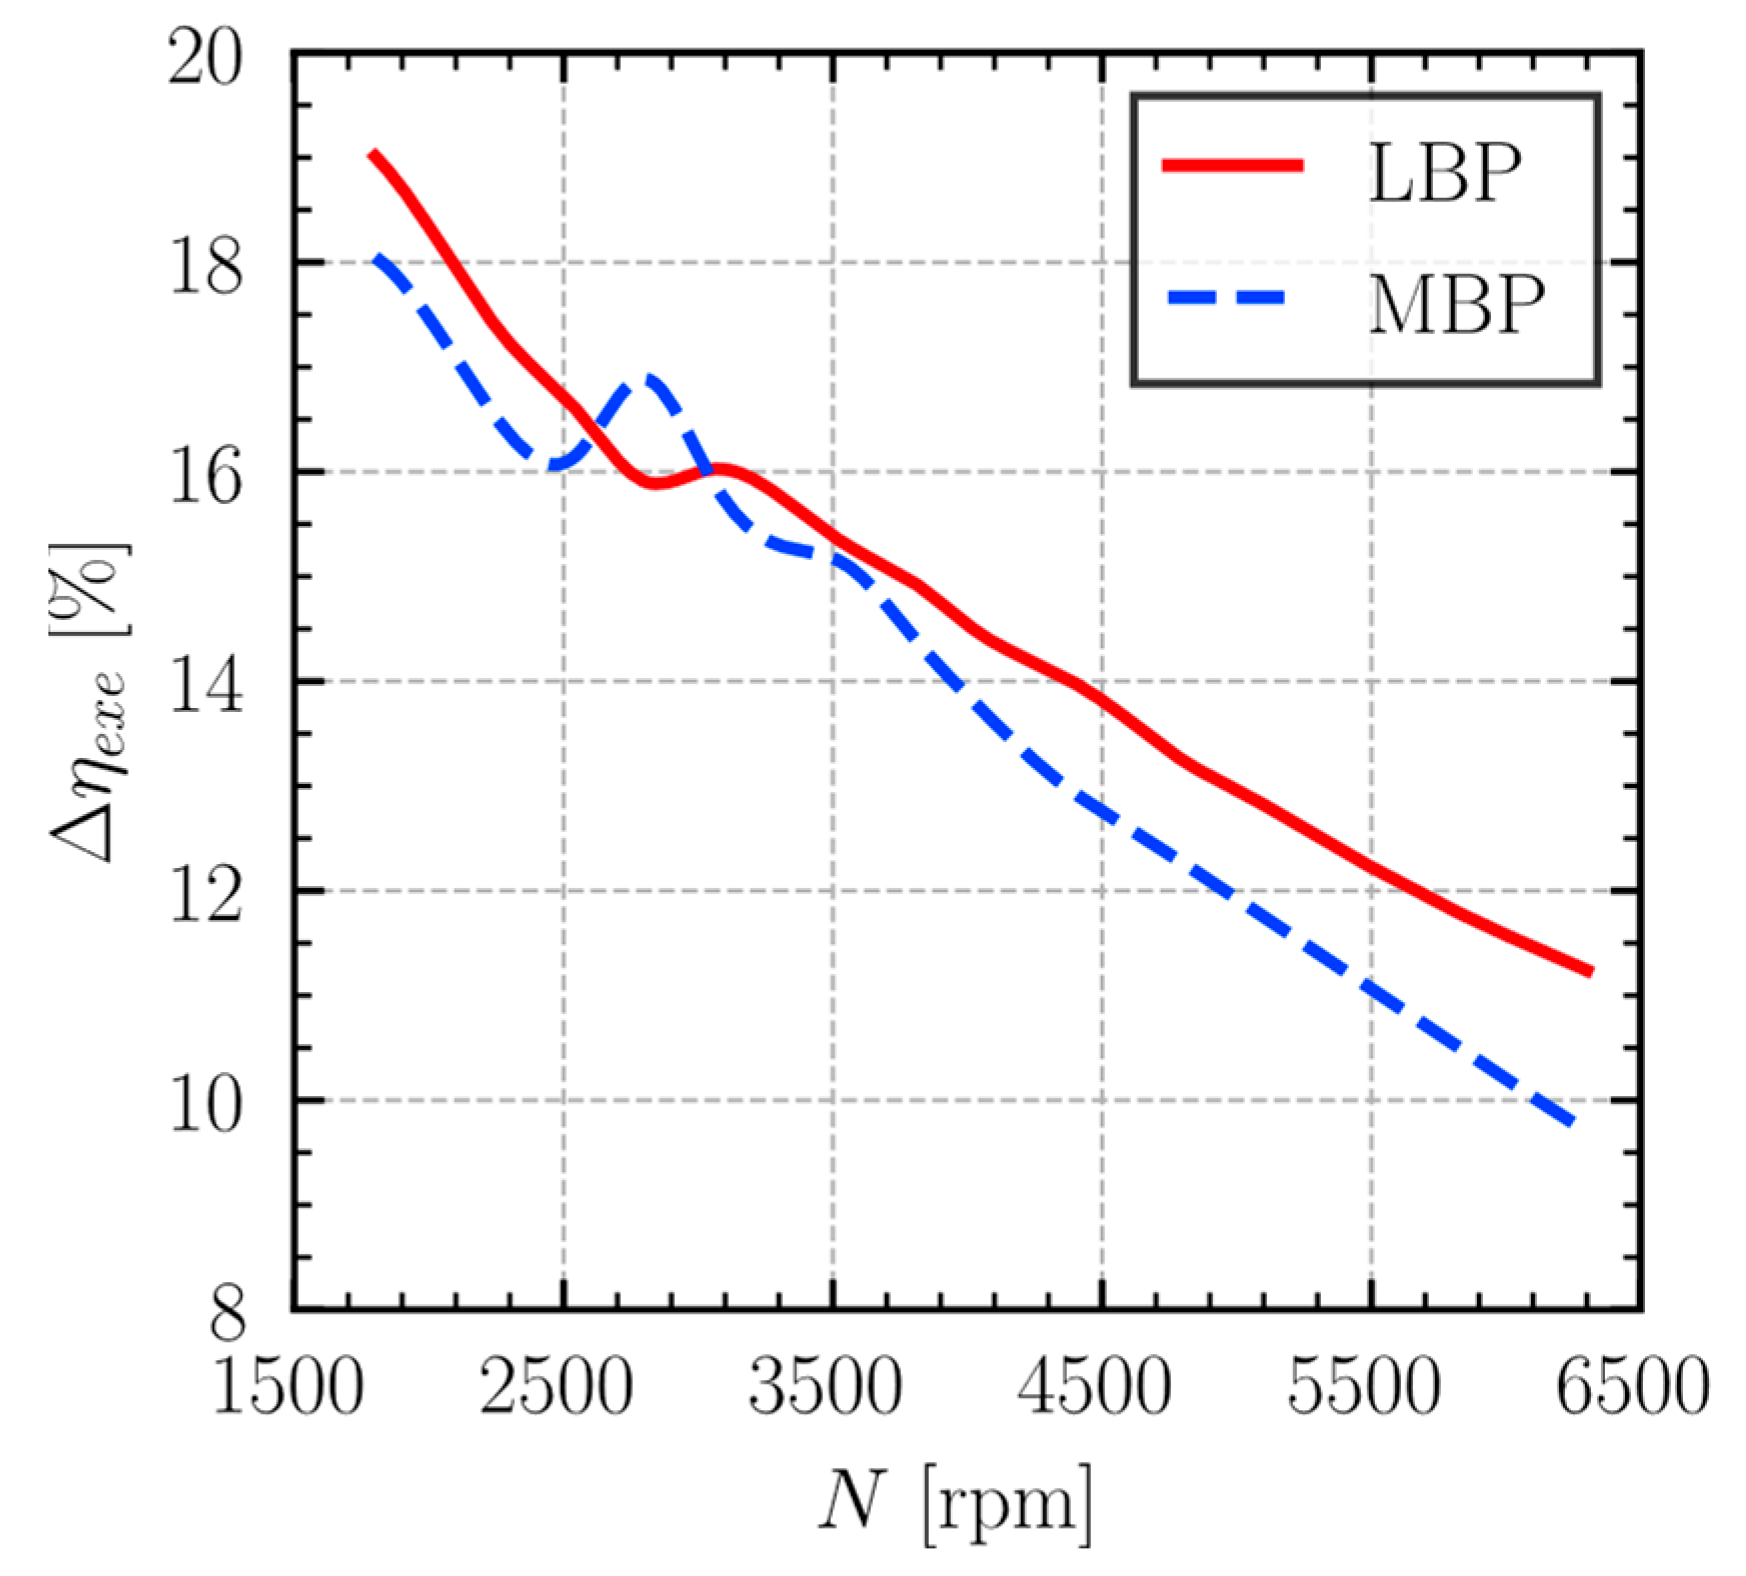
As shown in
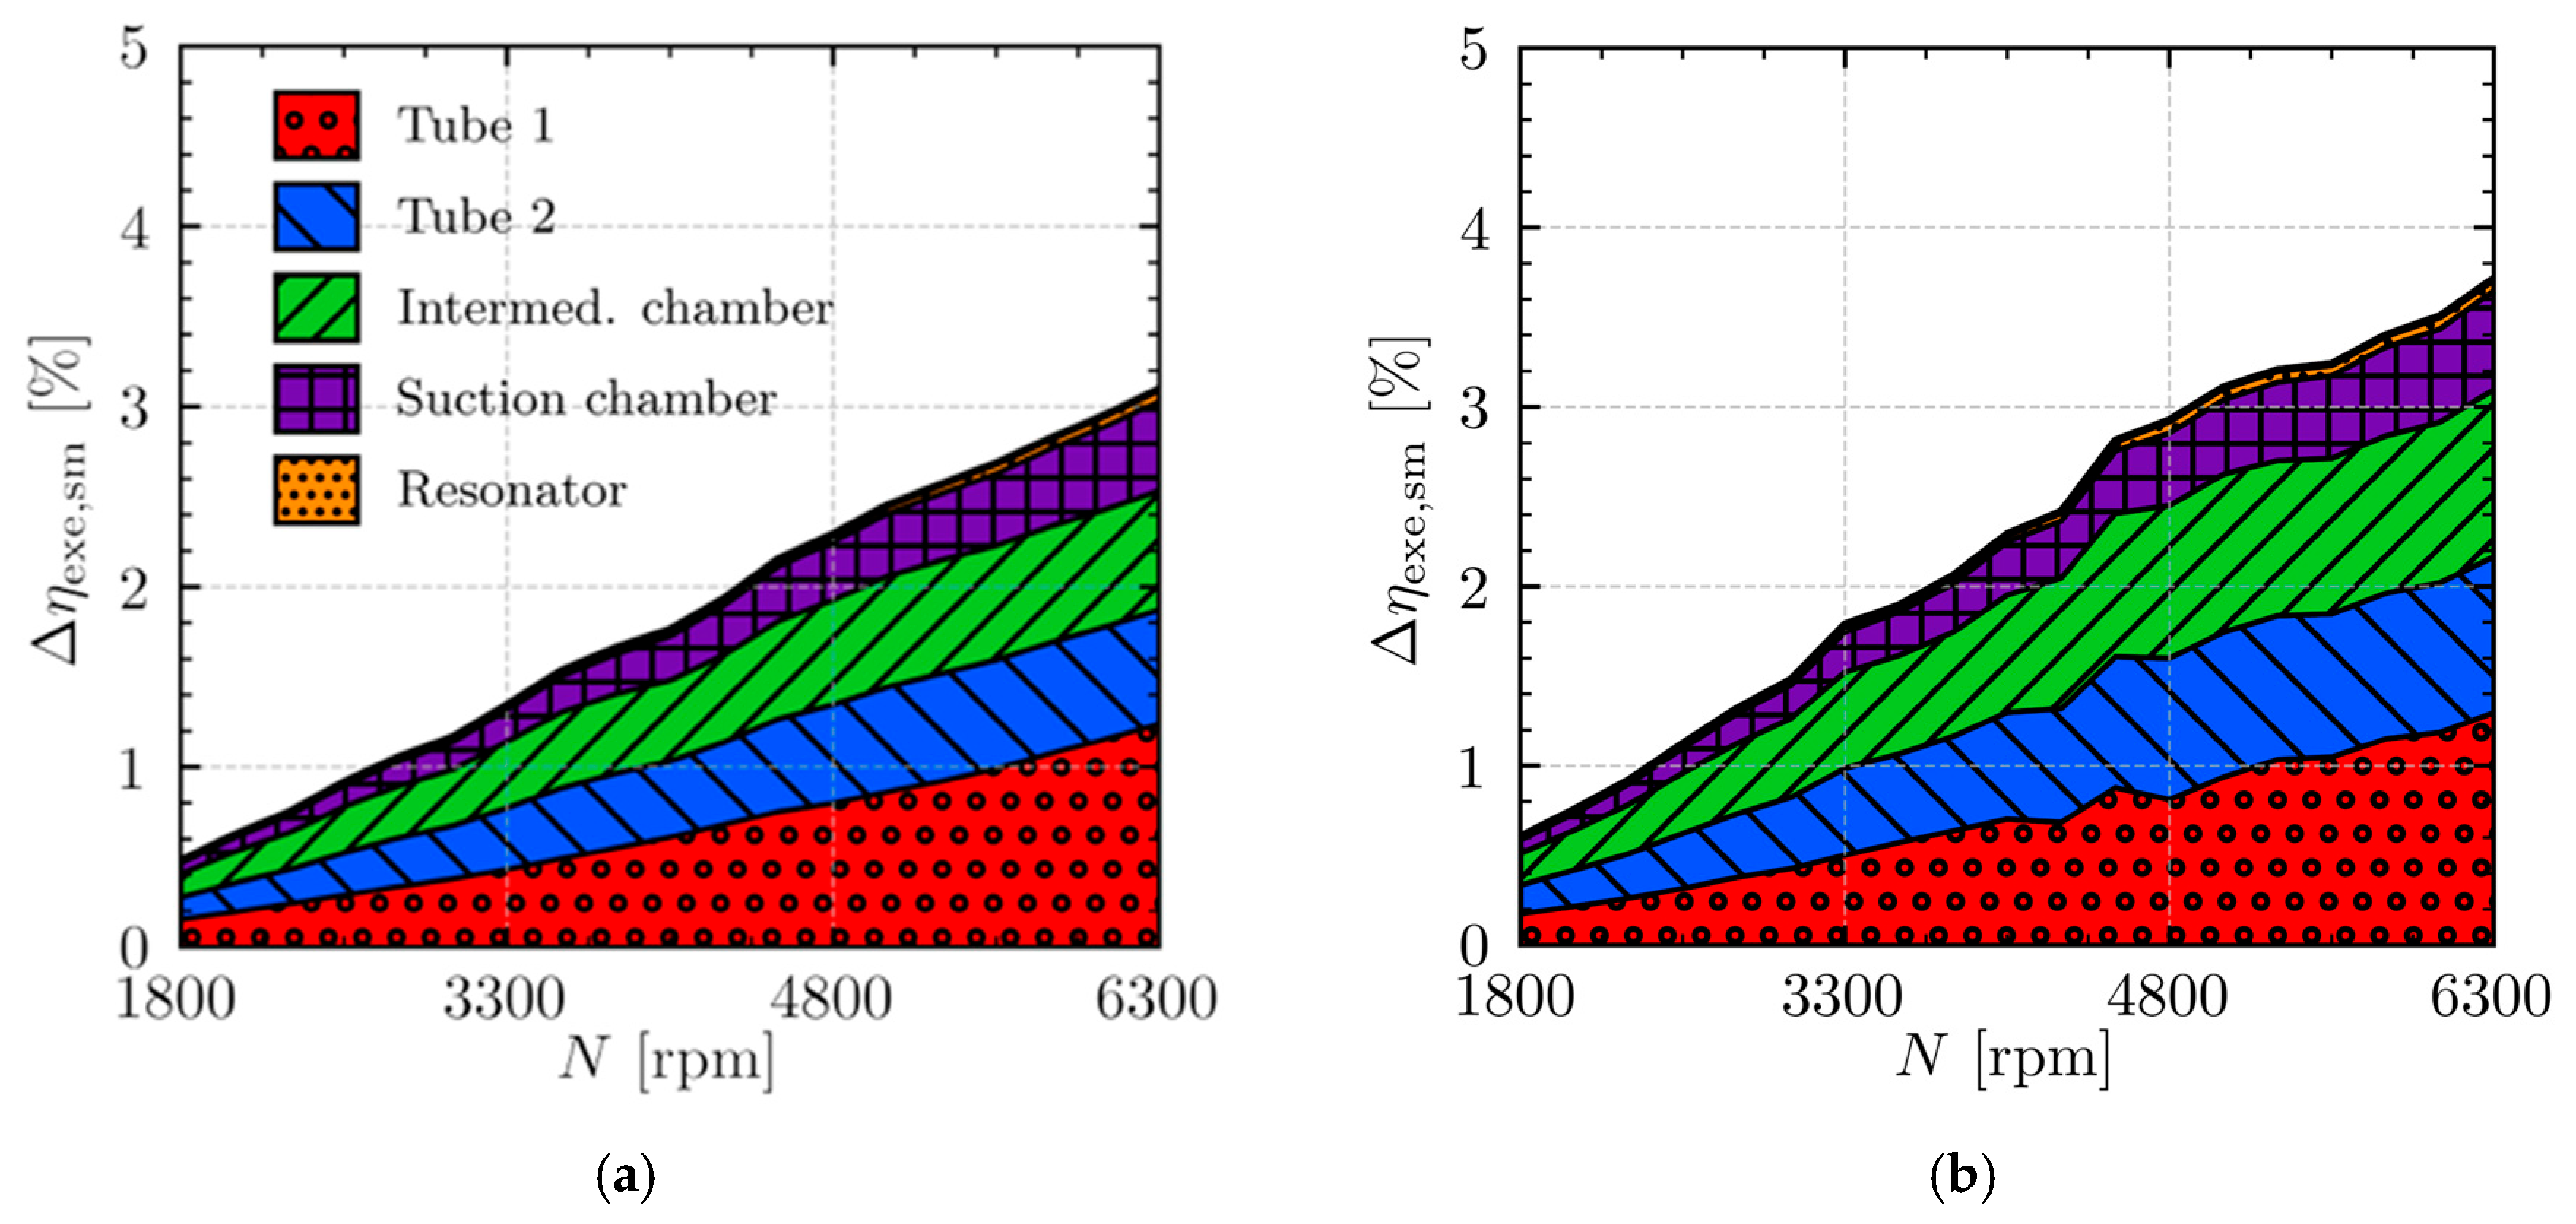
Figure 8, the volumetric inefficiency related to heat transfer can be divided into the following two components: one associated with indirect suction (
Figure 8a) and the other with heat exchange between the muffler wall and the refrigerant fluid (
Figure 8b). The results indicate that the greatest inefficiency arises from indirect suction, which leads to the mixing of gas portions at different temperatures coming from the suction line and the internal environment of the compressor. Moreover, this inefficiency increases with compressor speed, reaching 6.4% under LBP conditions and 5.2% under MBP conditions at 6300 rpm. On the other hand, the inefficiency caused by heat transfer throughout the suction muffler is considerably lower and shows little sensitivity to compressor speed, though it is also greater under LBP conditions. This occurs because, although the convective heat transfer coefficient increases with speed, this increase is not sufficient enough to offset the rise in the fluid’s thermal capacity due to higher mass flow rates. As a result, the temperature difference of the refrigerant at the inlet and outlet of the suction muffler decreases as the operating speed increases.
3.2.2. Clearance Volume
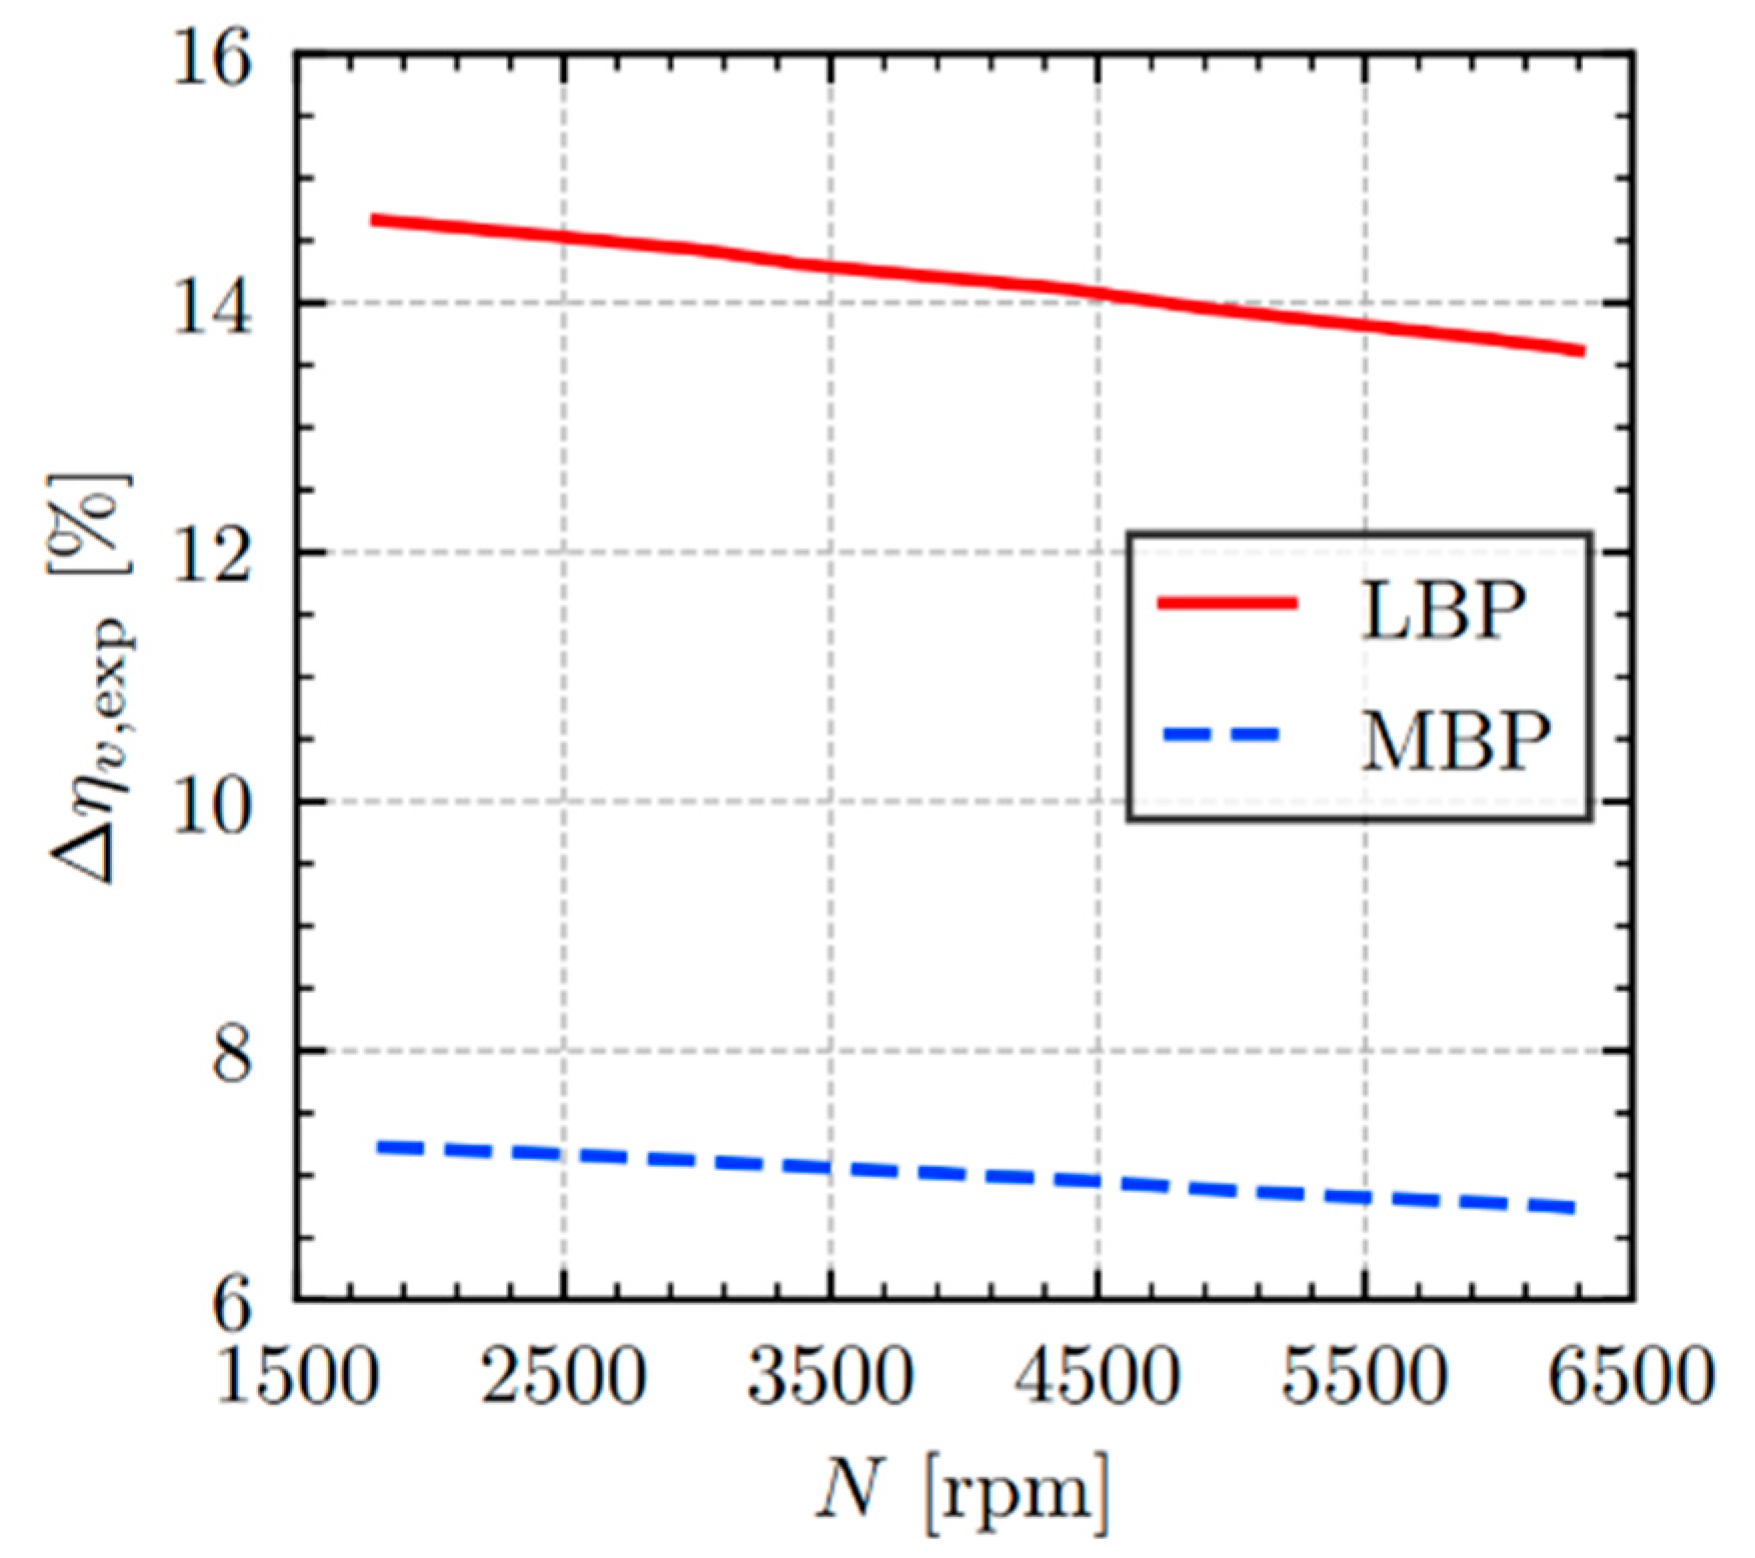
Reciprocating compressors feature a clearance volume in the compression chamber for operational reliability. Consequently, residual gas trapped in this volume at the end of the discharge process must expand before the next suction stroke can begin. The volumetric inefficiency component (Δη
v,exp) due to the isentropic re-expansion of real gas from condensing pressure to evaporating pressure is detailed in
Figure 9. The extent of this re-expansion, and thus its contribution to volumetric inefficiency, directly correlates with the compressor pressure ratio. This explains why the re-expansion inefficiency is notably more critical under the LBP condition, which involves higher pressure ratios. The results indicate that rotational speed exerts only a small influence on this specific inefficiency, decreasing it by 0.8% for the LBP condition and by 0.4% for the MBP condition as the operational speed increases from 1800 to 6300 rpm.
Another minor factor is the non-isentropic nature of the re-expansion process for residual gas trapped in the clearance volume, which occurs due to concurrent heat transfer and refrigerant leakage. Simulation results indicate that this volumetric inefficiency source is small across the entire speed range for both LBP and MBP operating conditions, reaching a maximum absolute value of only 0.8%.
3.2.3. Suction Valve
Ideally, the suction process in reciprocating compressors would occur isobarically. In practice, however, refrigerant is admitted into the cylinder through suction valves that inherently restrict the flow, leading to pressure loss. As a result, the actual suction process is non-isobaric, with the in-cylinder pressure during intake typically falling below the pressure maintained in the suction chamber.
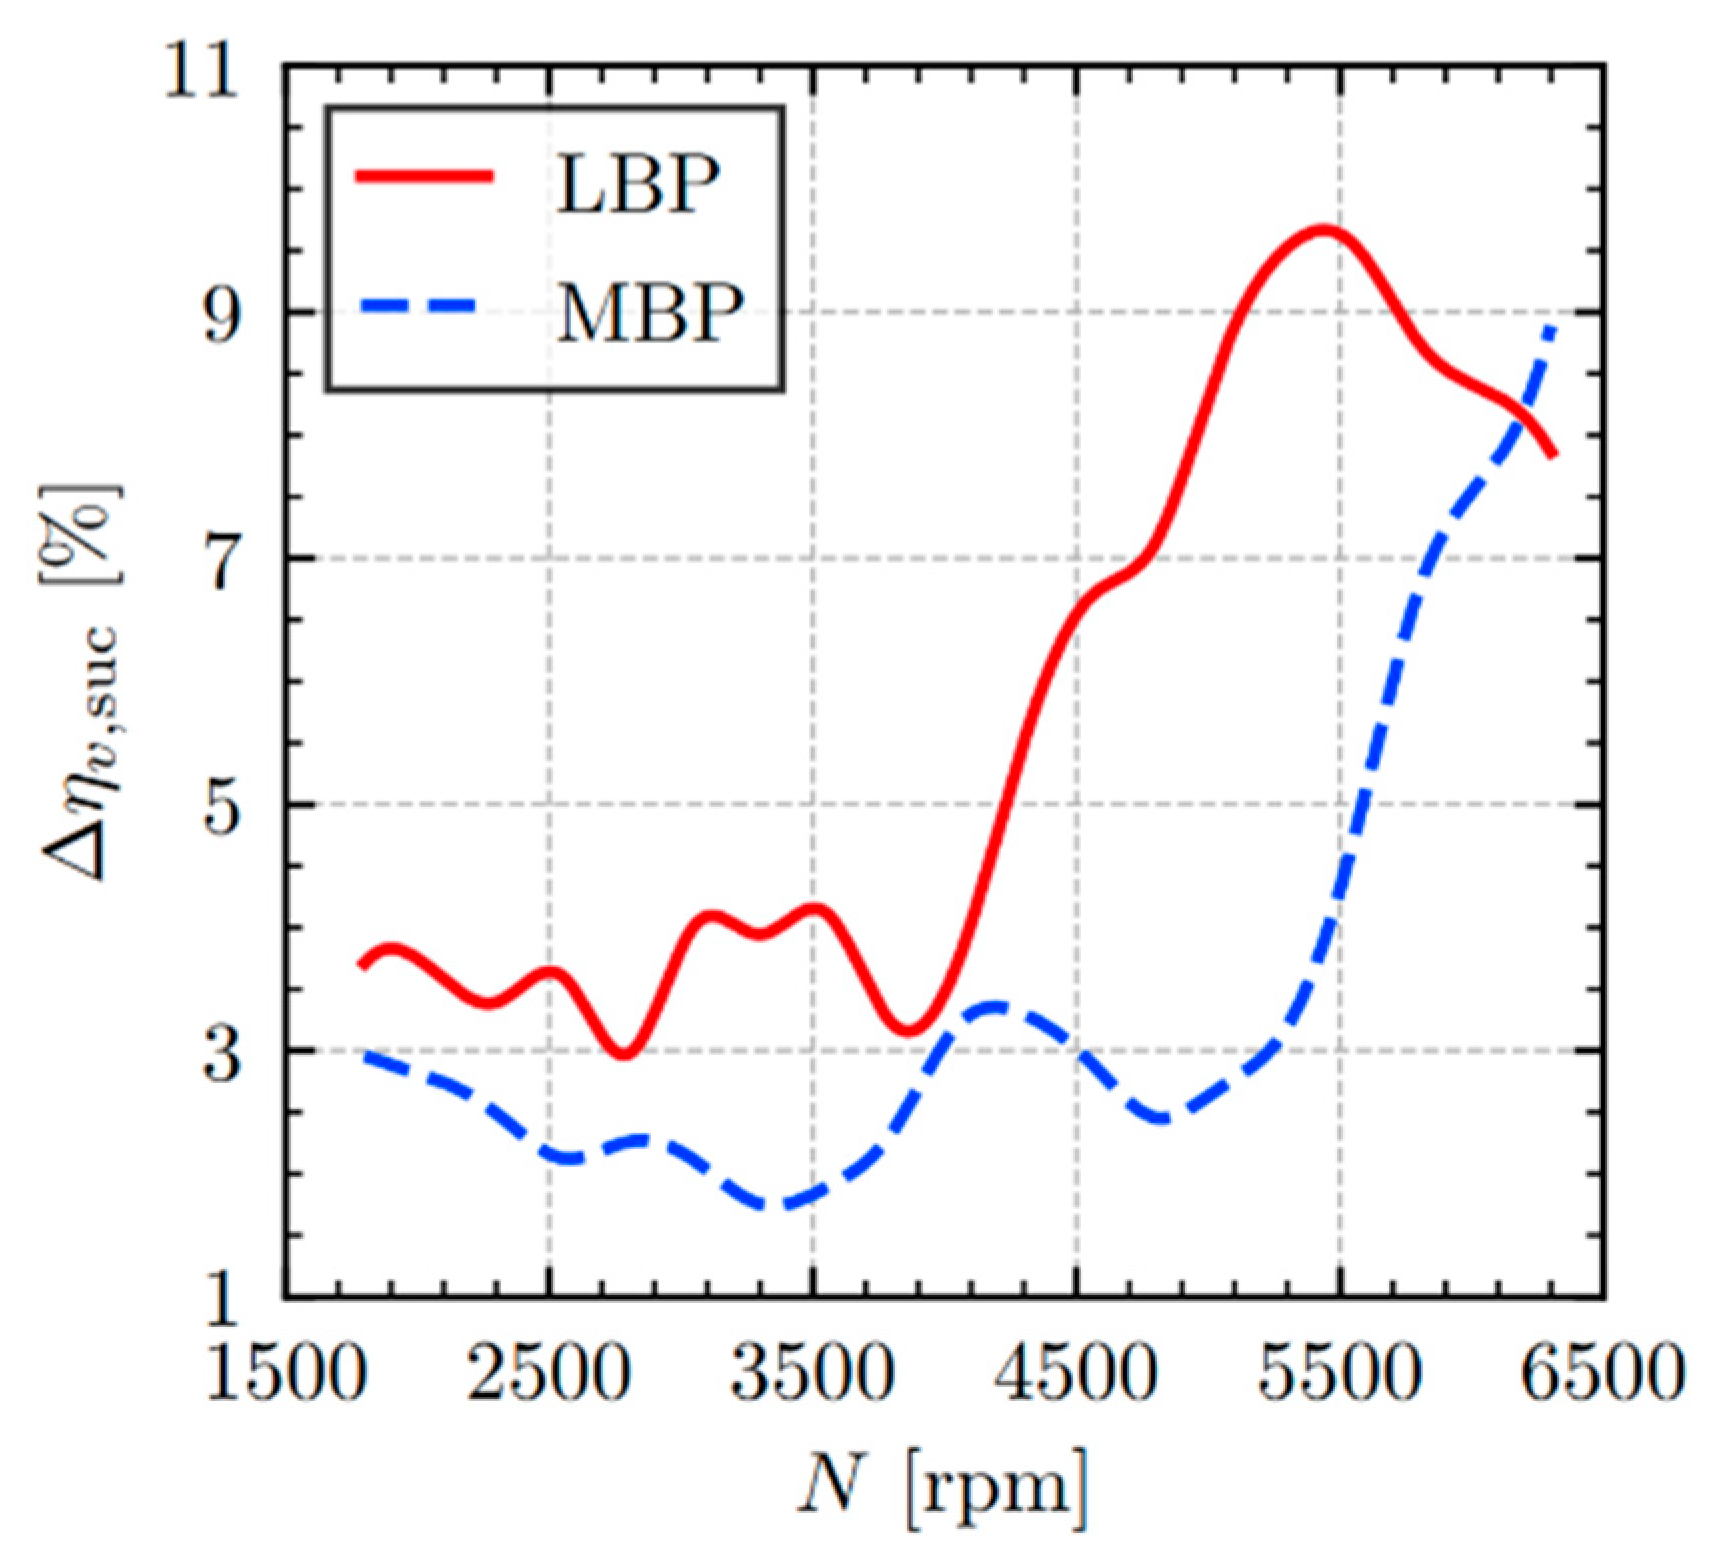
The volumetric inefficiencies specifically arising from this non-ideal suction process (Δη
v,suc) are detailed as a function of compressor speed for both LBP and MBP operating conditions in
Figure 10. For most of the analyzed speed range, suction process inefficiencies are generally more pronounced under the LBP condition compared to the MBP condition. This difference is primarily attributed to the shorter duration of the suction process characteristic of LBP operation. During this shorter period, inducting the required mass of refrigerant requires higher instantaneous gas velocities through the valve, which in turn leads to greater pressure loss.
However, this general trend reverses at very high speeds, where the suction process inefficiency under MBP conditions can surpass that observed for the LBP condition. This behavior is linked to the complex dynamics of the valve reed. At these high speeds, especially under MBP conditions, the valve motion can be affected in such a way that it leads to an increased effective restriction to the flow, thereby altering the typical trend observed at lower and mid-range speeds.
In fact, valve dynamics, in conjunction with pressure pulsations within the suction and discharge chambers, frequently cause valve closure to lag relative to the timing in an idealized compressor cycle. This closure delay can have either a detrimental or a beneficial impact on the compressor volumetric efficiency. If, for instance, refrigerant flows in the reverse direction during this lag period, i.e., from the cylinder back into the suction chamber, a net reduction in the delivered mass flow rate occurs as previously discharged fluid returns via backflow. Conversely, should flow inertia cause refrigerant to continue entering the cylinder from the suction chamber while the valve is in the process of closing, an additional mass intake takes place. This phenomenon, also known as supercharging, enhances the compressor volumetric efficiency.
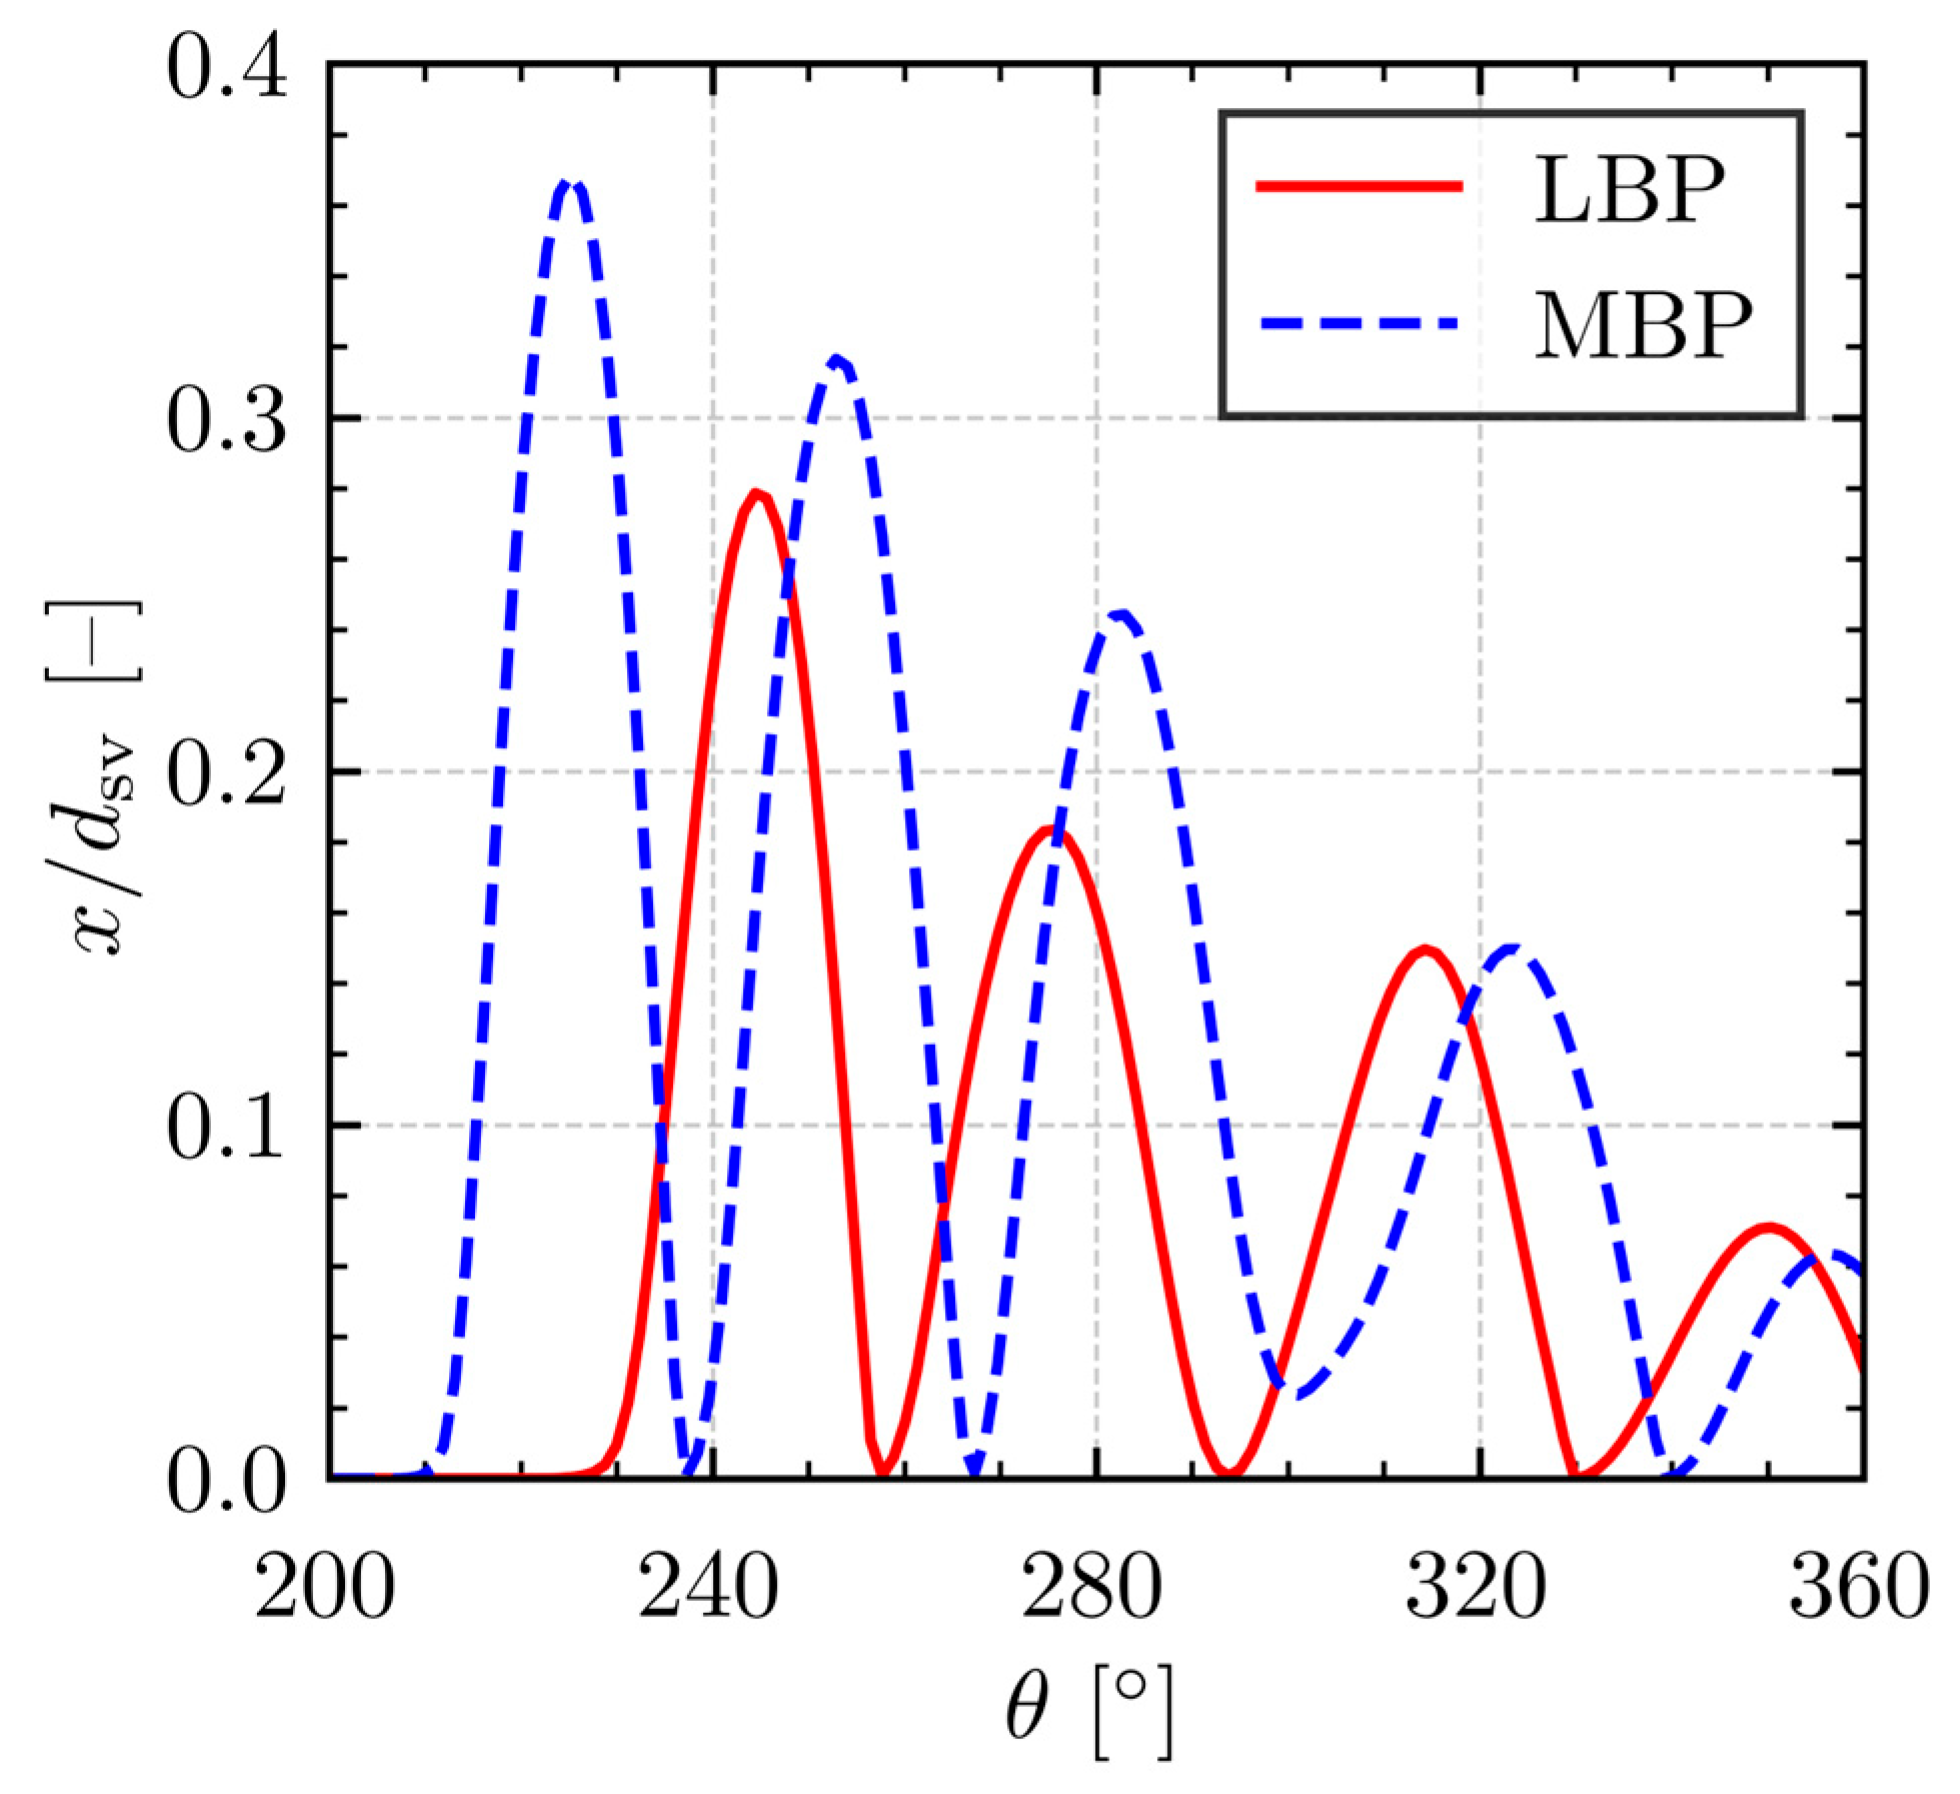
The volumetric inefficiency component specifically attributed to this supercharging effect (Δη
v,sch) is presented as a function of rotational speed in
Figure 11a, in which negative values of inefficiency signify an increase in mass flow rate relative to an ideal compressor that features no valve closing delay. As previously indicated, the supercharging effect is primarily driven by the inertia of the flowing refrigerant, although it is also influenced by pressure pulsations within the suction chamber. The results for supercharging-related inefficiency demonstrate an oscillatory behavior with rotational speed. However, a substantial increase in mass flow rate (represented as significant negative inefficiencies) is consistently observed at the highest rotational speeds. This occurs because the refrigerant velocity through the valve escalates with increasing compressor speed, thereby enhancing flow inertia and, consequently, maximizing the supercharging phenomenon.
It should be noted that the positive impact of supercharging on volumetric efficiency tends to be more pronounced under LBP conditions than under MBP conditions. The higher-pressure ratio characteristic of the LBP operation leads to a longer expansion process, which in turn reduces the time available for the suction process. Therefore, for any given rotational speed, the gas velocity through the suction valve is typically greater under LBP conditions compared to MBP conditions. This higher velocity translates to increased flow inertia, thereby amplifying the supercharging effect observed.
On the other hand, simulation results depicted in
Figure 11b indicate that the impact of backflow on this compressor volumetric efficiency is typically less pronounced than the gains from supercharging. Specifically, backflow-induced inefficiency remains negligible up to a rotational speed of 3800 rpm. Beyond this speed, under MBP conditions, the inefficiency due to backflow increases, reaching a peak of approximately 1% near 5100 rpm. Under LBP conditions, the impact of backflow is insignificant up to approximately 5500 rpm, reaching a maximum of 1.4%.
3.2.4. Piston–Cylinder Clearance
Reciprocating compressors have two primary refrigerant leakage paths that can be thermodynamically detrimental, which are the piston–cylinder clearance and the valve reed–seat gap.
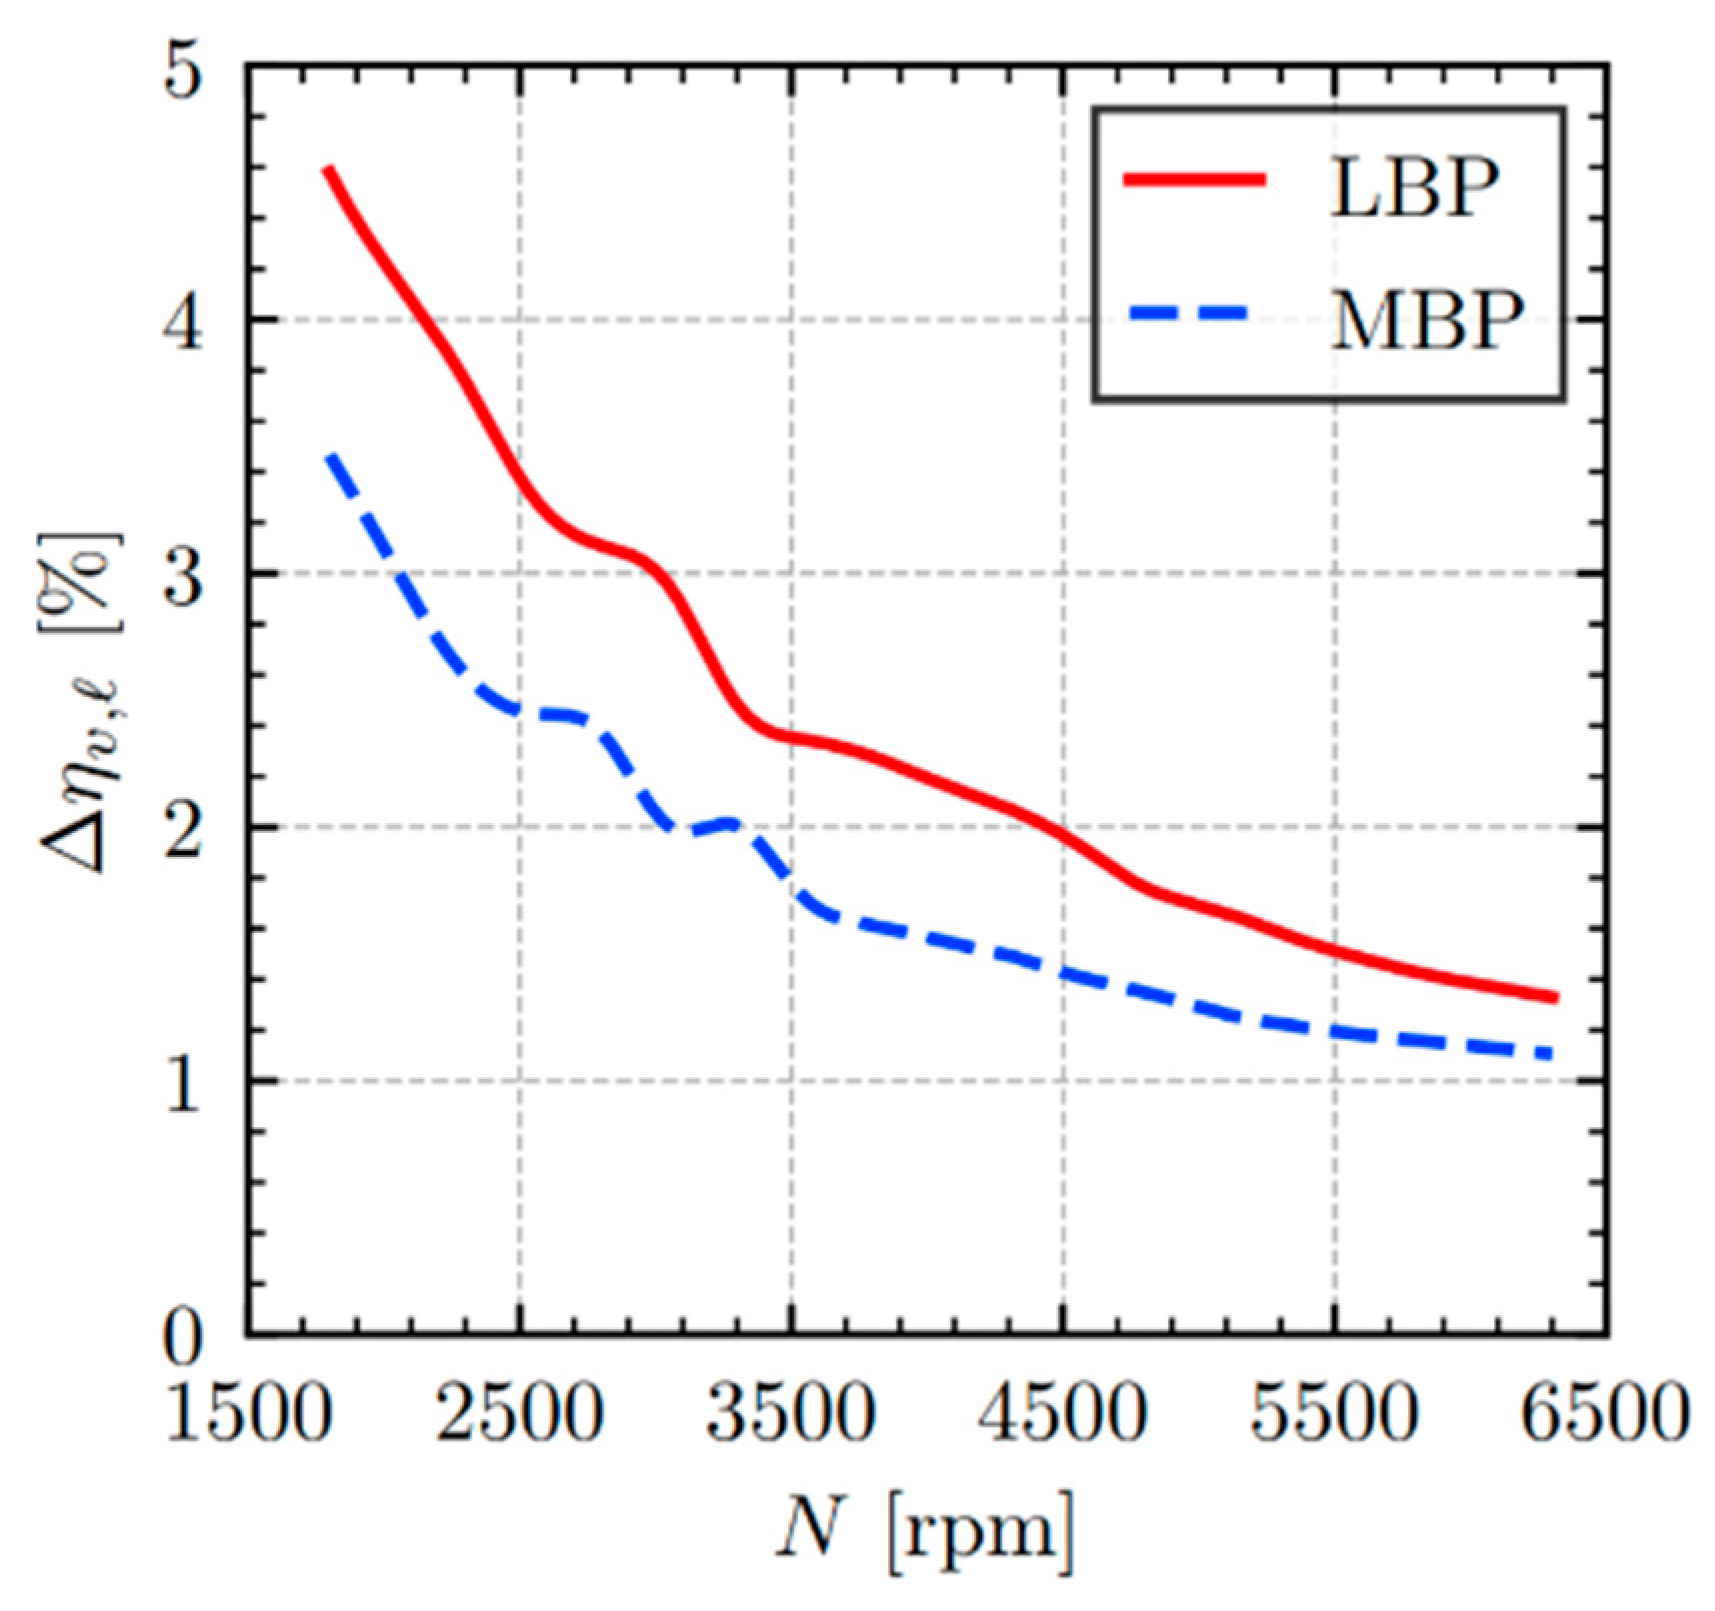
Figure 12 illustrates the volumetric inefficiencies arising from the piston–cylinder clearance (
), revealing that this inefficiency is notably greater under the LBP condition compared to the MBP condition. This is because the pressure difference between the compression chamber and the compressor internal environment is the main driving force for this leakage, which is significantly larger under LBP conditions. In contrast, leakage through the suction valve reed–seat gap is found to be negligible for this compressor across all analyzed rotational speeds, contributing a maximum of only 0.08% to volumetric inefficiency.
Leakage inefficiencies are generally more significant at lower rotational speeds, a trend consistent with findings in the literature [
19]. The mass flow rate due to leakage is largely independent of rotational speed, being primarily a function of the piston–cylinder gap size and the pressure difference determined by the operating condition. Given that the ideal theoretical mass flow rate increases with rotational speed, the relative impact of this leakage on the compressor net mass flow rate diminishes at higher speeds, as depicted in
Figure 12.
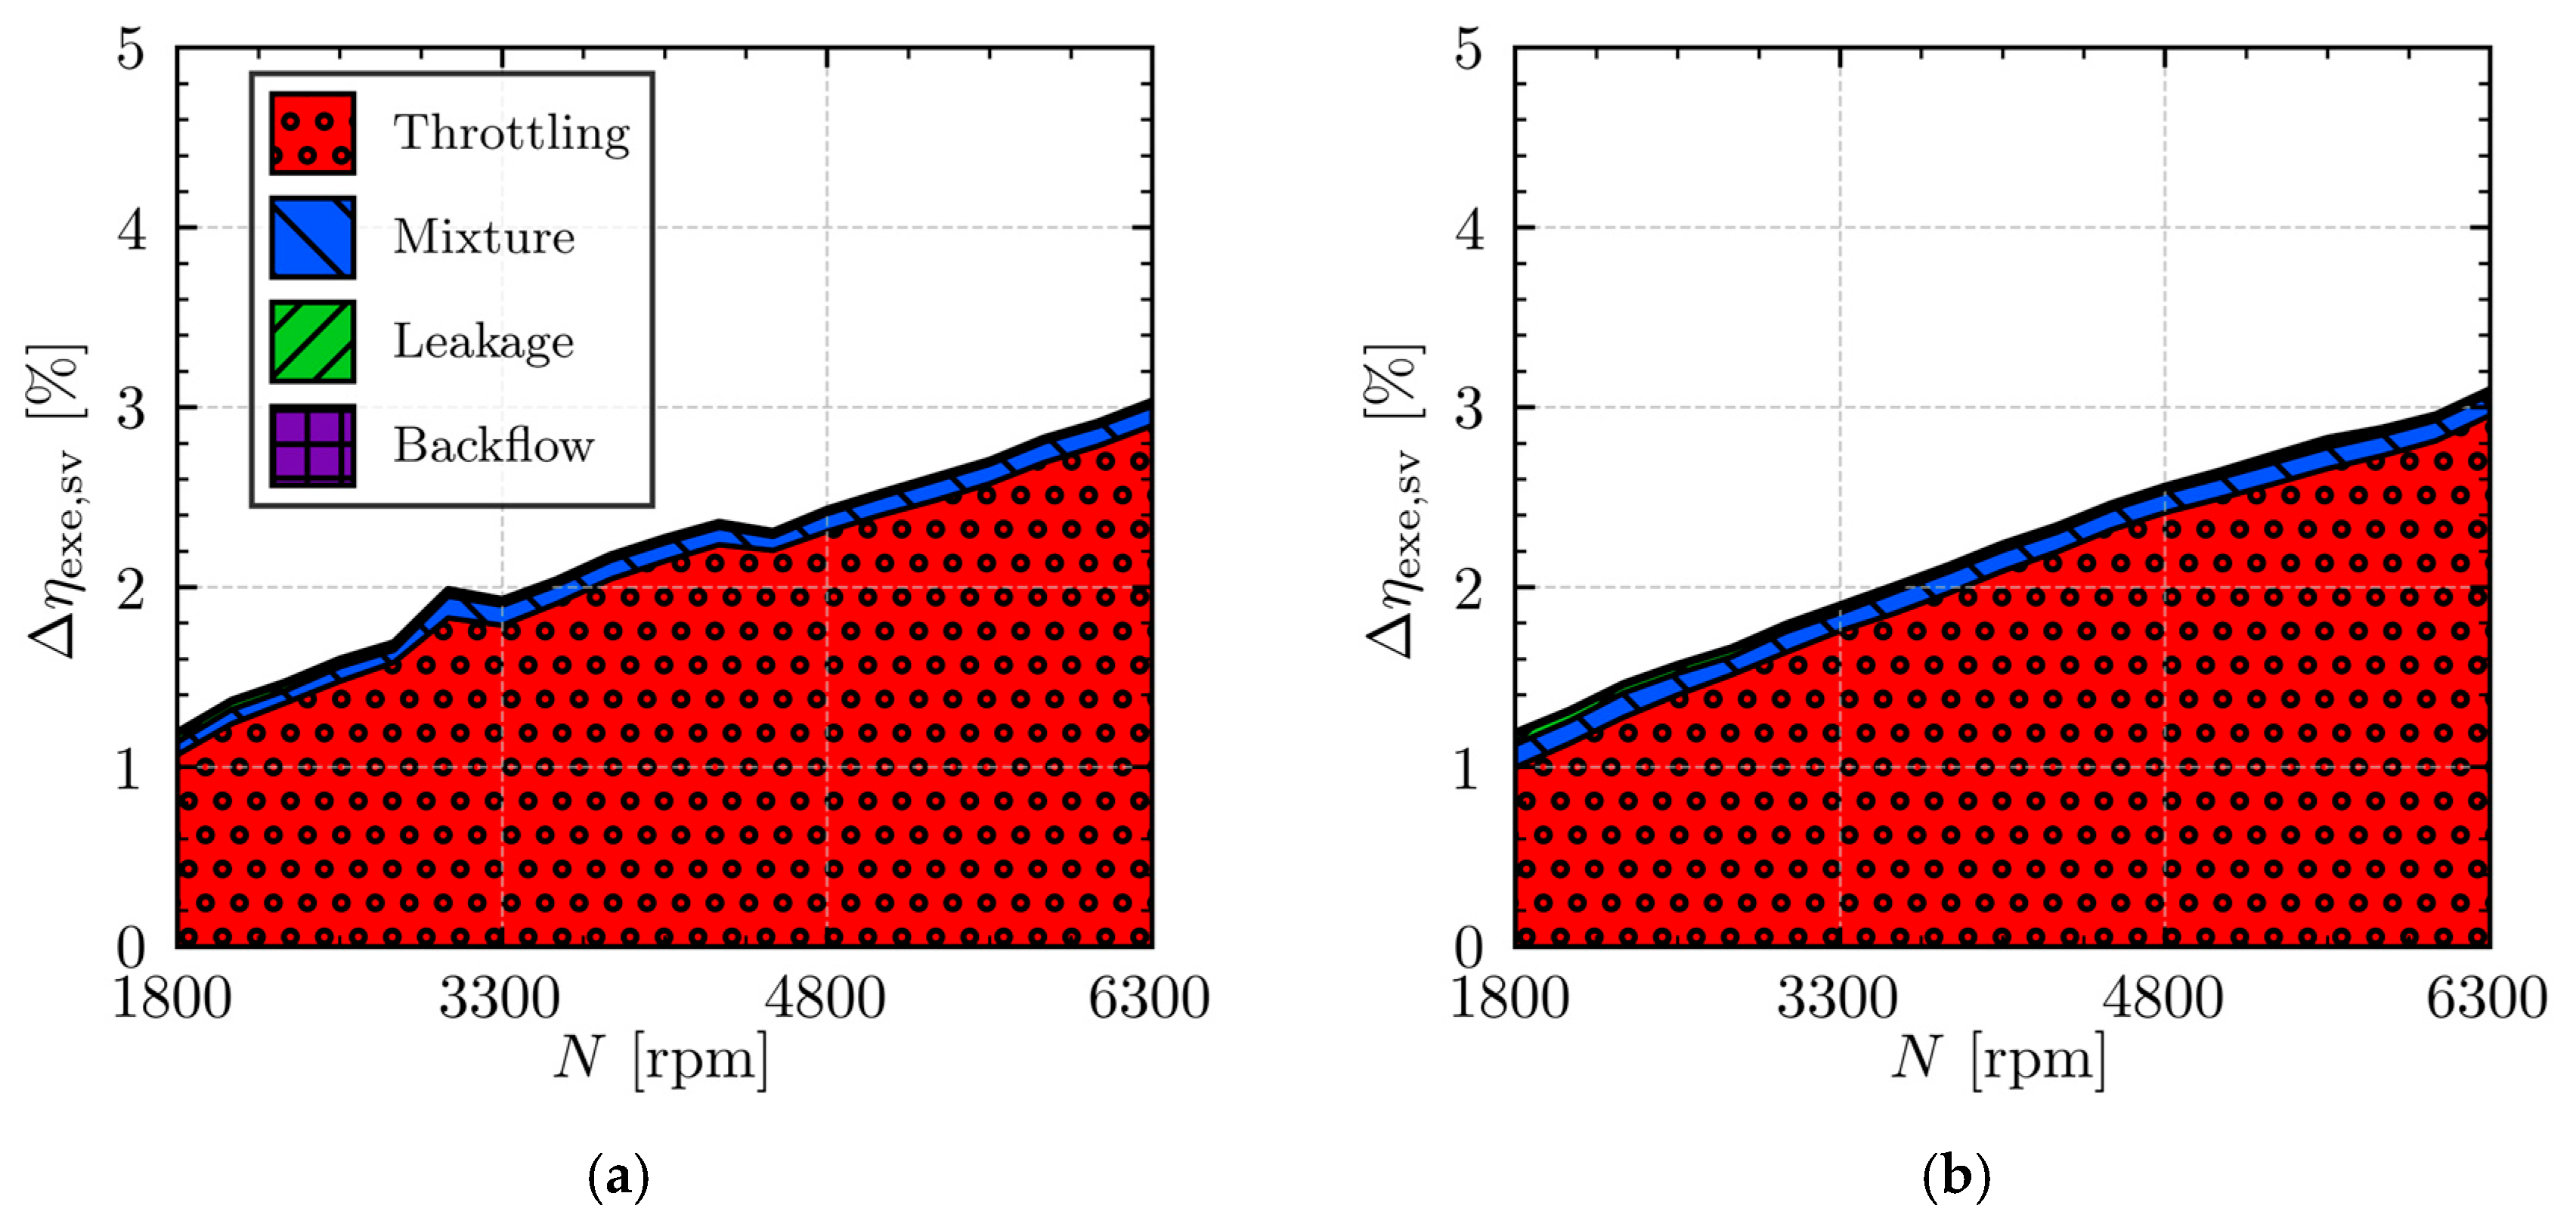
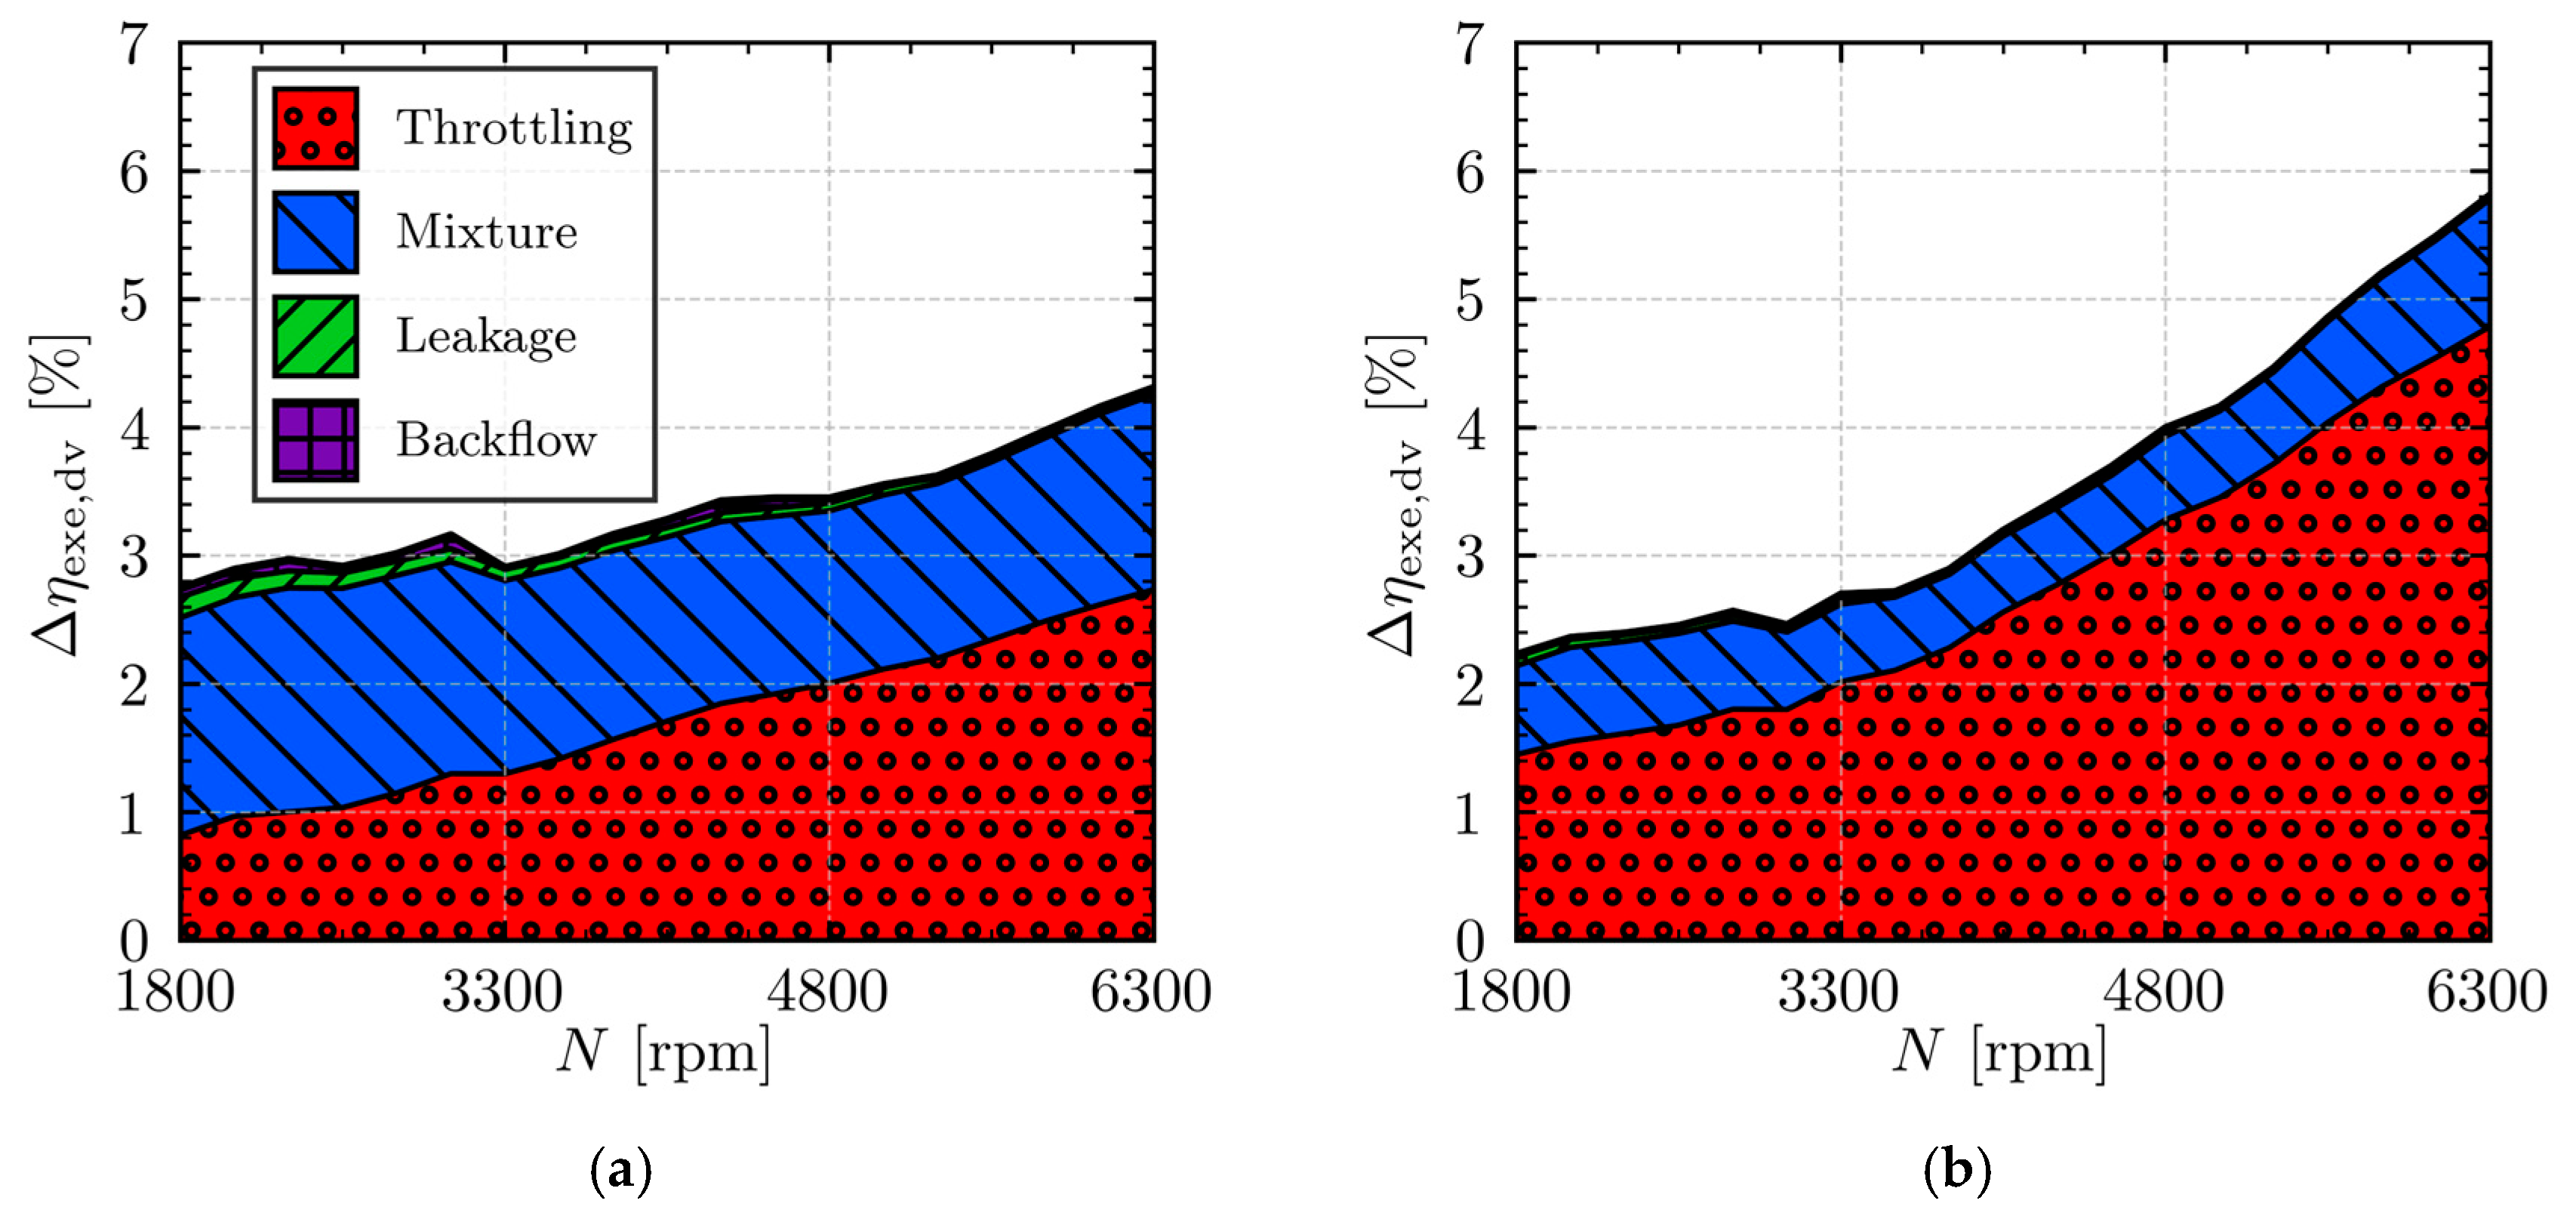
3.2.5. Discharge Valve
Figure 13a shows the inefficiencies caused by overpressure during the discharge process. The discharge valve exhibits significant flutter, leading to multiple overpressure peaks in the cylinder during discharge. As a result, the associated inefficiency fluctuates considerably, with no clear trend in relation to rotational speed. Moreover, both negative and positive inefficiency values are observed, indicating that the pressure in the compression chamber when the piston reaches top dead center can be either above the condensation pressure, resulting in a longer expansion process, or below it, leading to a shorter expansion phase.
Figure 13b illustrates the effect of discharge valve closure delay on volumetric inefficiency, which may be either positive (pressure-boosted discharge) or negative (backflow). Within the range of speeds analyzed, the delay leads to a positive effect only at 3050 rpm under LBP conditions and at 3550 rpm under MBP conditions. The tendency toward a negative effect is greater because, unlike the supercharging observed on the suction side, the expansion process occurs faster than the compression process. After passing the top dead center, the piston reverses direction and quickly increases the chamber volume, which rapidly decreases the refrigerant pressure. This sharp pressure drop causes a strong deceleration of the flow through the discharge port, reversing its direction more quickly than the valve’s response time, favoring backflow.
Furthermore, like what was observed during suction, the inefficiency associated with discharge valve delay fluctuates with rotational speed, showing two local maxima under MBP conditions (2800 and 3300 rpm) and three under LBP conditions (2050, 3050, and 4800 rpm). These inefficiency peaks lead to corresponding oscillations in the compressor’s overall volumetric efficiency, as shown in
Figure 5. These results are consistent with the observations of [
18], although their study did not account for the influence of a valve opening limiter, which affects both the dynamics and oscillation behavior of the reed valve.


