Article

Numerical and Experimental Study on Deicing of Wind Turbine Blades by Electric Heating Under Complex Flow Field

by
Jianwei Li
1,
Panpan Yang
1,2,
Xuemei Huang
1,2,*,
Leian Zhang
1,2 and
Jinghua Wang
1,2
1
School of Mechanical Engineering, Shandong University of Technology, Zibo 255000, China
2
Shandong Key Laboratory of Wind Power Equipment Testing, Evaluation and Service Support Technology, Zibo 255000, China
*
Author to whom correspondence should be addressed.
Machines 2025, 13(6), 483; https://doi.org/10.3390/machines13060483
Submission received: 31 March 2025 / Revised: 14 May 2025 / Accepted: 19 May 2025 / Published: 3 June 2025
(This article belongs to the Section Turbomachinery)

Abstract

:
Wind turbine blades are prone to icing in cold environments, which leads to decreased aerodynamic performance, increased power loss, and even endangers the safe and stable operation of wind turbines. Electric heating anti-deicing method is the most effective solution because of its flexible control, rapid response, and high deicing efficiency. However, in the process of blade high-speed rotation, the complex flow field effect significantly affects the blade heat transfer performance, which leads to the problems of high energy consumption, low heat utilization, and uneven heating of traditional electric heating anti-icing/deicing methods, limiting their application effect in complex working conditions. Based on the physical mechanism and heat exchange characteristics of electric heating deicing of wind turbine blades, a coupled flow–heat transfer numerical model suitable for complex flow field conditions was constructed in this study, aiming to realize the dynamic simulation of the global temperature field and the phase transition process of ice sheets under different heating modes. Furthermore, the deicing efficiency characteristics of continuous heating and cyclic heating modes were compared and analyzed. The blade tip section of a Sinoma87.5 was taken as the experimental object, and the deicing experiment of blade by electric heating was carried out under artificial ice-covering laboratory conditions. The simulation and experimental results show that the deicing process by electric heating can be divided into three typical stages: initial temperature rise, stagnation, and rapid temperature rise. Under the influence of incoming flow conditions, the temperature rise of the front stagnation point region lags behind that of the windward side, and the steady-state peak temperature is lower. Compared with the cyclic heating mode, the continuous heating mode can enter and cross the stagnation period more quickly. The peak steady-state temperature of the continuous heating mode is 24.2 °C, and the deviation from the simulation result is only 2.8 °C, which is within the acceptable error range, effectively verifying the reliability of the numerical calculation model established.

1. Introduction

As a clean and efficient renewable energy source, wind energy continues to account for an increasing share in the global energy mix [1,2]. Due to the superior wind speed conditions in mountain, ridge, and high-altitude areas, the site selection of wind farms is often concentrated in these areas [3,4]. However, due to the influence of micro-topography and meteorological conditions, especially in winter, extreme weather phenomena such as frost, rime, and cold wave occur frequently, resulting in increasingly serious wind turbine blade icing problems [5,6,7,8,9], as shown in Figure 1. Ice adhesion not only changes the geometric profile of the blade, leading to deterioration of aerodynamic performance and reduction of output power [10], but also may lead to structural imbalance and safety risks [11,12,13].
Among the many deicing methods, the electric heating deicing method has been widely used because of its advantages of flexible control, rapid response, and high deicing efficiency. At present, the main technical means to study the problem of wind turbine blade deicing are numerical calculation methods and experimental research [14]. In terms of numerical calculation, the numerical theory and method of aero wing deicing is relatively mature. Makkonen et al. [15] of the Finnish Technical Research Center (VTT) first applied the research results of wing icing to the field of wind power, and developed the first code TURBICE specifically for the numerical calculation of wind turbine icing. Subsequently, the majority of relevant researchers have conducted a lot of research work on the problem of wind turbine blade deicing. Battisti et al. [16] established a two-dimensional numerical calculation model for wind power blade deicing. In this model, cyclic heating is adopted to carry out periodic deicing of blades and its technical feasibility is evaluated from the perspective of heating cycle time and energy consumption. Villalpando et al. [17] established a numerical model for the icing growth of wind turbine blades by using Fluent 16.0 and Matlab 2016a software and estimated the critical deicing power of blades under different working conditions, and the calculated results were basically consistent with the experimental results. In addition, Hochart, Han, Barber et al. [18,19,20] used Lewice v1.0 software to conduct a numerical simulation of the deicing of the typical airfoil of a wind turbine, and systematically analyzed the influence of the icing position on the deicing performance of the wind turbine. These studies provide theoretical support for further optimizing the deicing system design of wind power blades.
In terms of experimental research, thanks to sound frozen wind tunnel facilities and advanced and diversified experimental methods, a relatively complete experimental research system has been formed in the field of space, but there are few ice wind tunnels applied to the field of wind power. Currently, the main known ones are cyclic closed ice wind tunnels of the University of Quebec in Canada and Iowa State University in the United States, and natural low-temperature ice wind tunnels of Tottori University in Japan. Bose [21] conducted a study on the field icing experiment process of a small wind turbine in a natural environment, obtained ice profile and quality data, and further analyzed the influence of ice profile on the aerodynamic performance of the wind turbine. Mayer et al. [22] studied the deicing performance of an NACA63415 blade airfoil after model shrinkage through an artificial icing wind tunnel experiment and systematically analyzed the interaction law between blade surface convective heat transfer performance and meteorological conditions, heating power, and surface temperature. Shu et al. [23] carried out a deicing experiment under the natural environment of Xue-feng Mountain, and the experimental results verified the accuracy of the calculation model of the critical deicing power of wind turbine blades. Liang et al. [24,25] conducted an ice-coating experiment on a small horizontal axis wind turbine in an artificial climate chamber to study the effect of ice coating and ice coating on the aerodynamic performance of the wind turbine. Guo et al. [26] studied the icing condition of wind-electric blades of an NACA0018 under different climatic conditions and the deicing effect of electric heating through ice wind tunnel experiments. The thermal resistance arrangement is shown in Figure 2. The results show that the deicing effect of electric heating is closely related to the icing time and ambient wind speed.
Although the problem of deicing has been extensively investigated through numerical simulations and experimental studies, most existing research has focused on aerospace wings, while studies specifically targeting wind turbine blade deicing remain relatively limited [27,28,29]. The current literature primarily emphasizes the effects of supercooled water droplets during the initial icing stage, ice growth prediction, and the estimation of deicing power using simplified equivalent slab or cylindrical models. These approaches typically consider only a single physical field and often overlook the coupled heat transfer processes occurring on wind turbine blades under complex flow conditions. Moreover, the scarcity and high cost of advanced icing wind tunnel facilities limit the experimental validation of numerical simulation methods.
To address these aforementioned problems, this study proposes a coupled flow–heat transfer numerical modeling approach for electric heating deicing of wind turbine blades, which comprehensively considers the interaction between flow dynamics and heat transfer. A low-temperature artificial icing experimental platform was independently constructed to validate the proposed numerical method. Furthermore, the temperature evolution of the blade surface and the melting characteristics of the ice layer under different heating modes were analyzed in detail. The findings of this study provide new insights and a theoretical foundation for the optimization and design of electric heating deicing systems for wind turbine blades.

2. Calculation Method

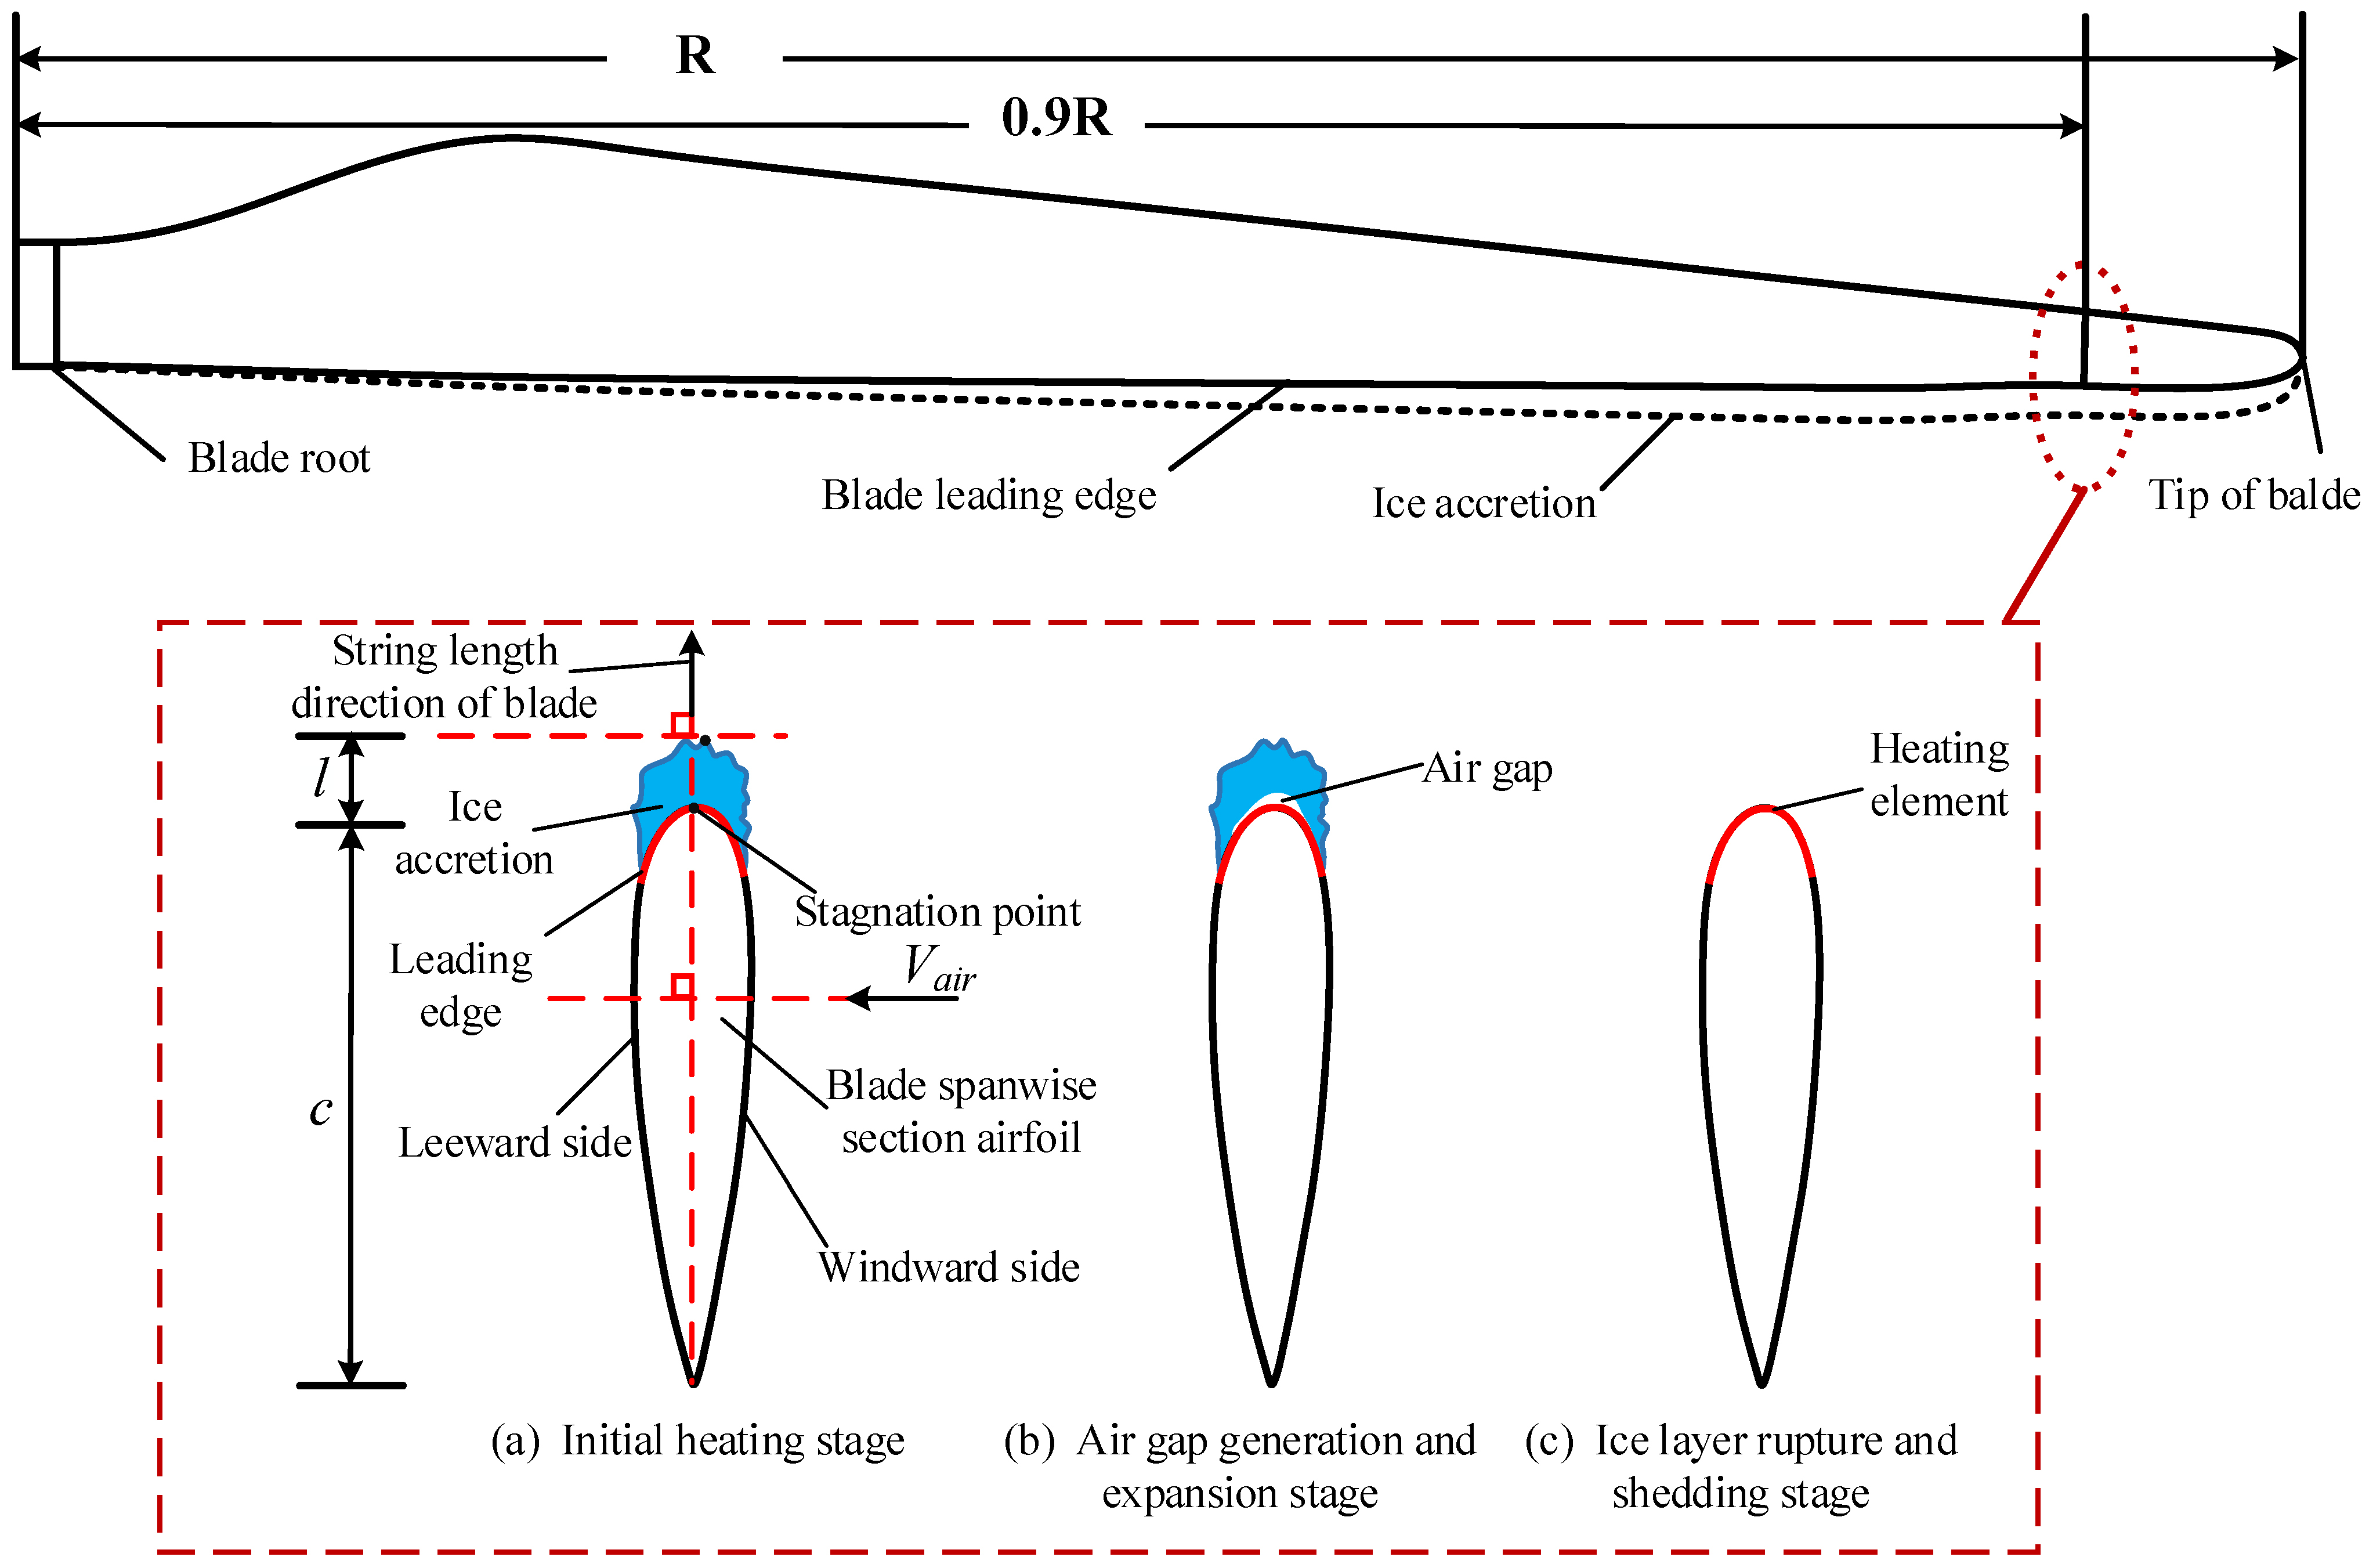
2.1. Physical Process

The deicing process of wind turbine blades by electric heating is mainly divided into three stages: initial heating stage, air gap generation, and expansion stage, and ice rupture and shedding stage, as shown in Figure 3. The heat transfer process is essentially a complex thermophysical process involving air flow, heat conduction, phase change heat transfer, and other energy exchange mechanisms.
Under the action of the electric heating element, heat is transferred to the ice-covered surface of the leading edge of the blade in the form of heat conduction, and the interface temperature between the ice sheet and the blade increases, making the interface temperature reach 0 °C, and a phase transition occurs and air gap is formed. At the same time, some of the heat is transferred to the outer surface of the ice sheet and is lost to the surrounding air by convection and radiation. The process mainly includes three forms of heat flow terms (as shown in Figure 4): heat conduction, heat convection, and latent heat of phase transition. These forms run through the whole deicing process and show different leading roles at different stages.

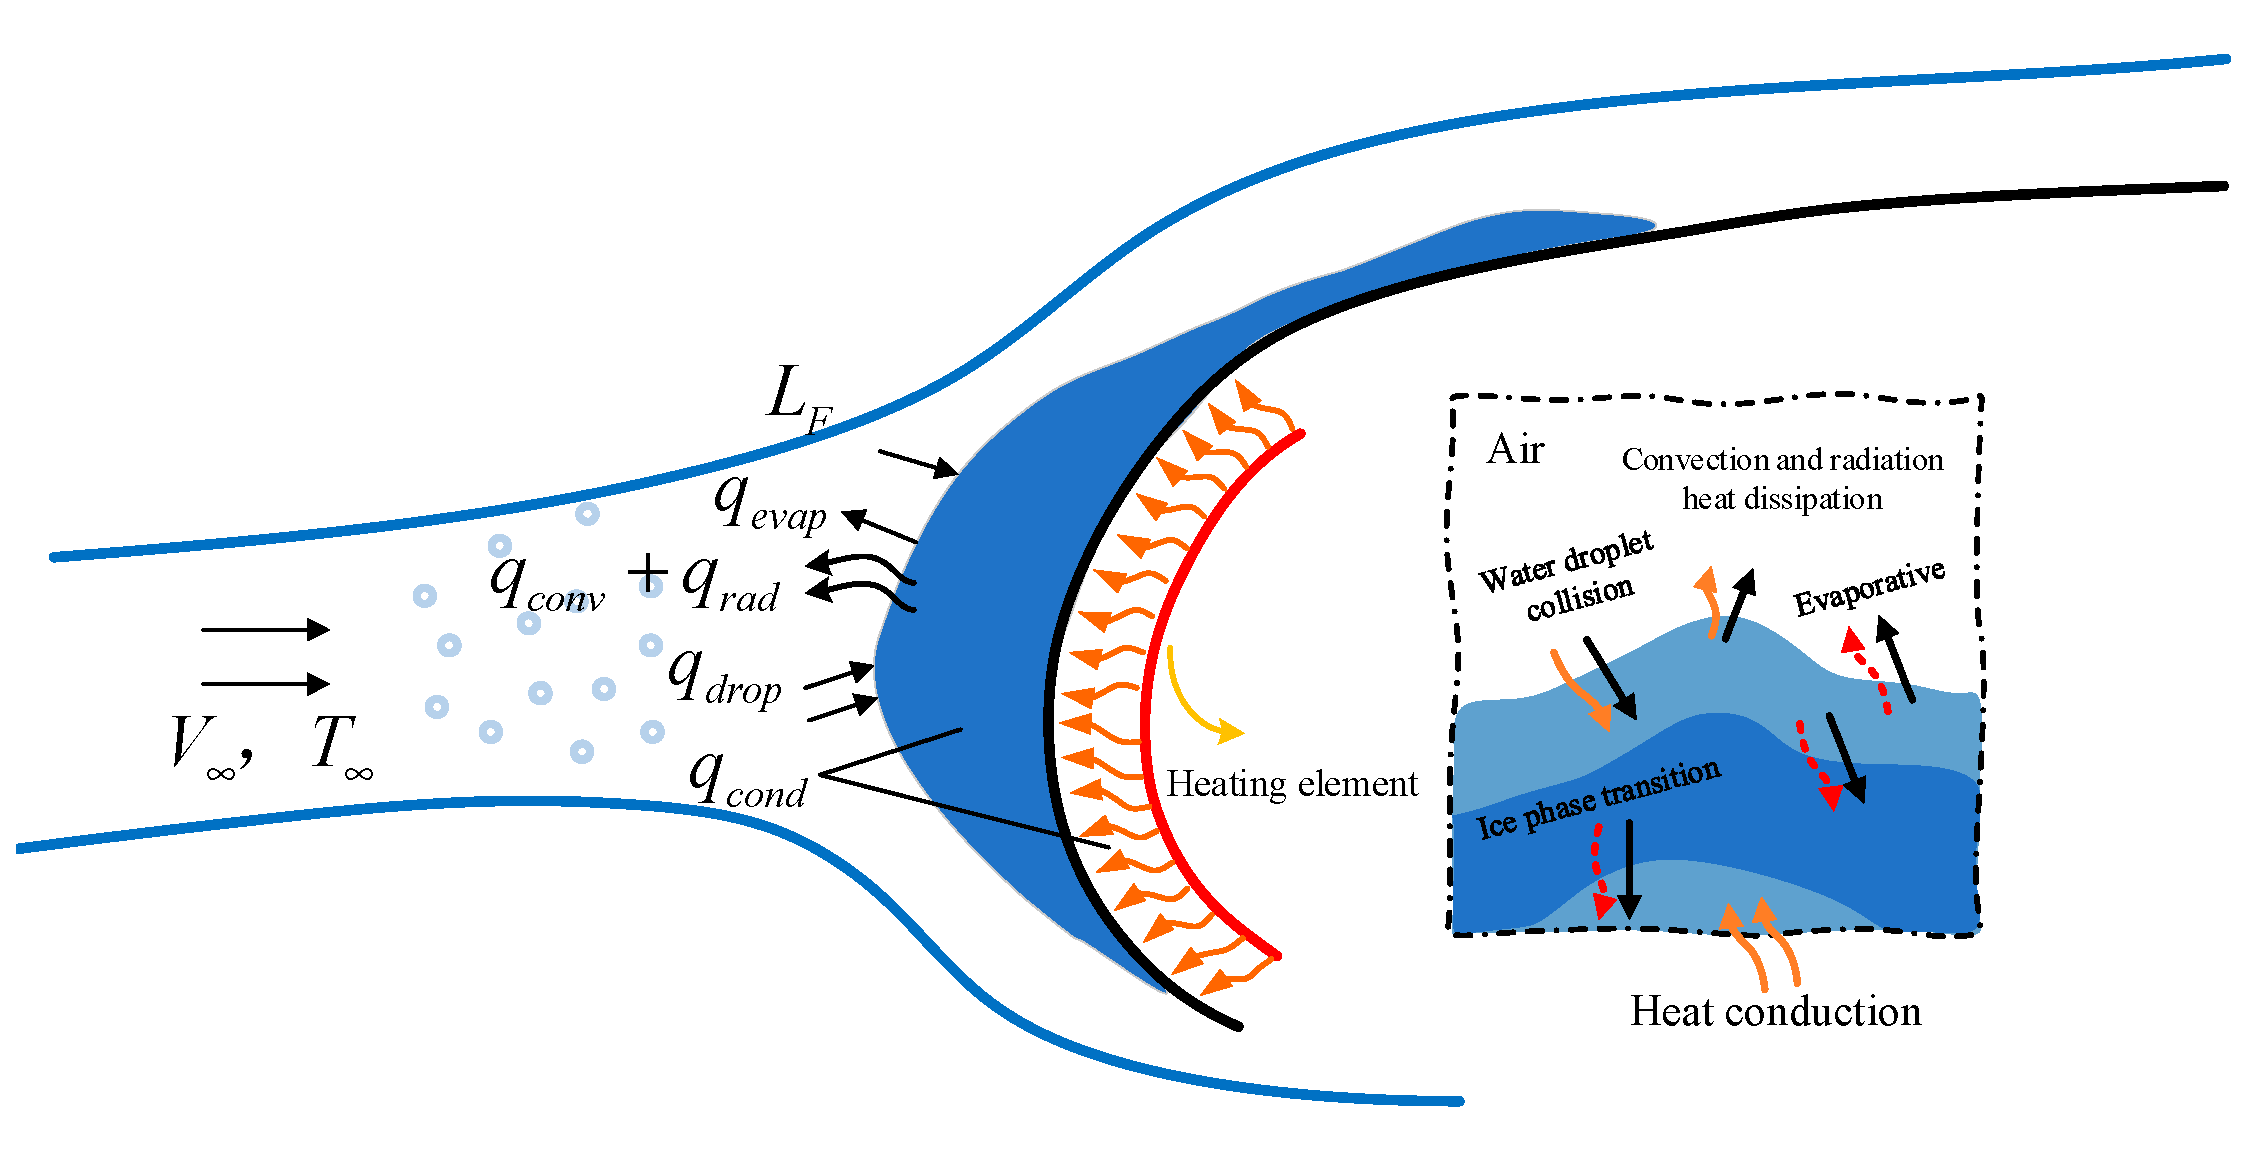
2.2. Heat Balance Process

According to the heat transfer path analysis, the main destination of the heat provided by the heating element is: Heat conduction ( q c o n d ) in the blade, inside the ice sheet and air gap, heat flow terms such as forced convection and radiation between the ice sheet surface and air ( q c o n v , q r a d ), heat flow terms of supercooled water droplets ( q d r o p ) captured on the outer surface of the ice sheet (including the total heat of water droplet collision, warming, freezing, and other processes), heat flow terms L F absorbed by the latent heat of the ice sheet phase transition. According to the principle of conservation of energy, the heat balance equation of electric heating deicing process can be obtained as follows:
q e S e d t + q d r o p S i a d t = S i a ( q c o n v + q r a d + q e v a p ) d t + ρ i L F d V m + k = i , b , a g ρ k V k c k d T k
where, q e is the applied heat source term and the water droplet impact heat source term respectively, W/m2; S e is the contact area between the blade surface and the ice sheet, m2; S i a is the contact area between ice surface and air, m2; ρ k is the density of each material, kg/m3, k = i , b , a g , corresponding to the ice inside, blade, and air gap; L F is the latent heat absorbed by ice melting; d V m is the amount of ice melting in the time interval d t , m3; d T k is the temperature rise of each heat transfer region, °C; q d r o p and q e v a p are the heat flow terms caused by the impact of supercooled water droplets on the ice surface and the heat flow terms caused by water evaporation, respectively, which can be solved by numerical software or empirical formulas.
Forced convection and radiation effect are the main heat dissipation mechanisms for the heat exchange between the ice surface and the outside air. According to the convection heat transfer coefficient h c and the Stefan–Boltzman constant, the empirical formula can be expressed as follows:
q c o n v = h c ( T i a T a )
q r a d = ε σ ( T i a 4 T a 4 )
where, T i a is the temperature of the outer surface of the ice sheet, °C; h c is the convective heat transfer coefficient between the outer surface of the ice sheet and the air, W/(m °C); ε is the emissivity of the ice surface, generally 0.95; σ is the Stefan–Boltzman constant, σ = 5.567 × 10 8 W / ( m 2 · K 4 ) .
Whether it is the blade domain, the ice domain or the air gap domain, the main form of internal heat conduction is mainly, which satisfies the solid heat conduction equation:
ρ C p T f t + u T f + ( k T f ) = 0

2.3. Air Flow Field

The air flow field around the blade is usually described by the Navier–Stokes equation. Considering the high Reynolds number condition of ice-covered blades for a long time and the complex airfoil structure, RANS simulation method is chosen in this paper, and k ω  SST model is used to solve the turbulent flow model. The model has higher accuracy and adaptability in the aspects of near-wall turbulence characteristic capture, boundary layer heat transfer characteristic, and flow separation, etc. Its turbulent kinetic energy transport and specific dissipation rate equations are as follows:
ρ k t = τ i j u β ρ ω k + [ ( μ + σ k μ t ) k ]
ρ ω t = γ v t τ i j u β ρ ω 2 + [ ( μ + σ ω μ t ) ω ] + 2 ( 1 F 1 ) σ ω 2 ρ ω k ω
where, k and ω represent turbulent kinetic energy and eddy dissipation rate, respectively; τ i j is the Reynolds stress tensor, which represents the momentum transport caused by turbulent pulsation; μ and μ t are molecular viscosity and turbulent viscosity, respectively; β * , β , σ k , σ ω and σ ω 2 are the empirical coefficients; F 1 is a mixed function, which can effectively limit the flow in the boundary layer of the wall. It is related to the distance between the grid nodes of the first layer and the wall and the viscosity of the fluid.

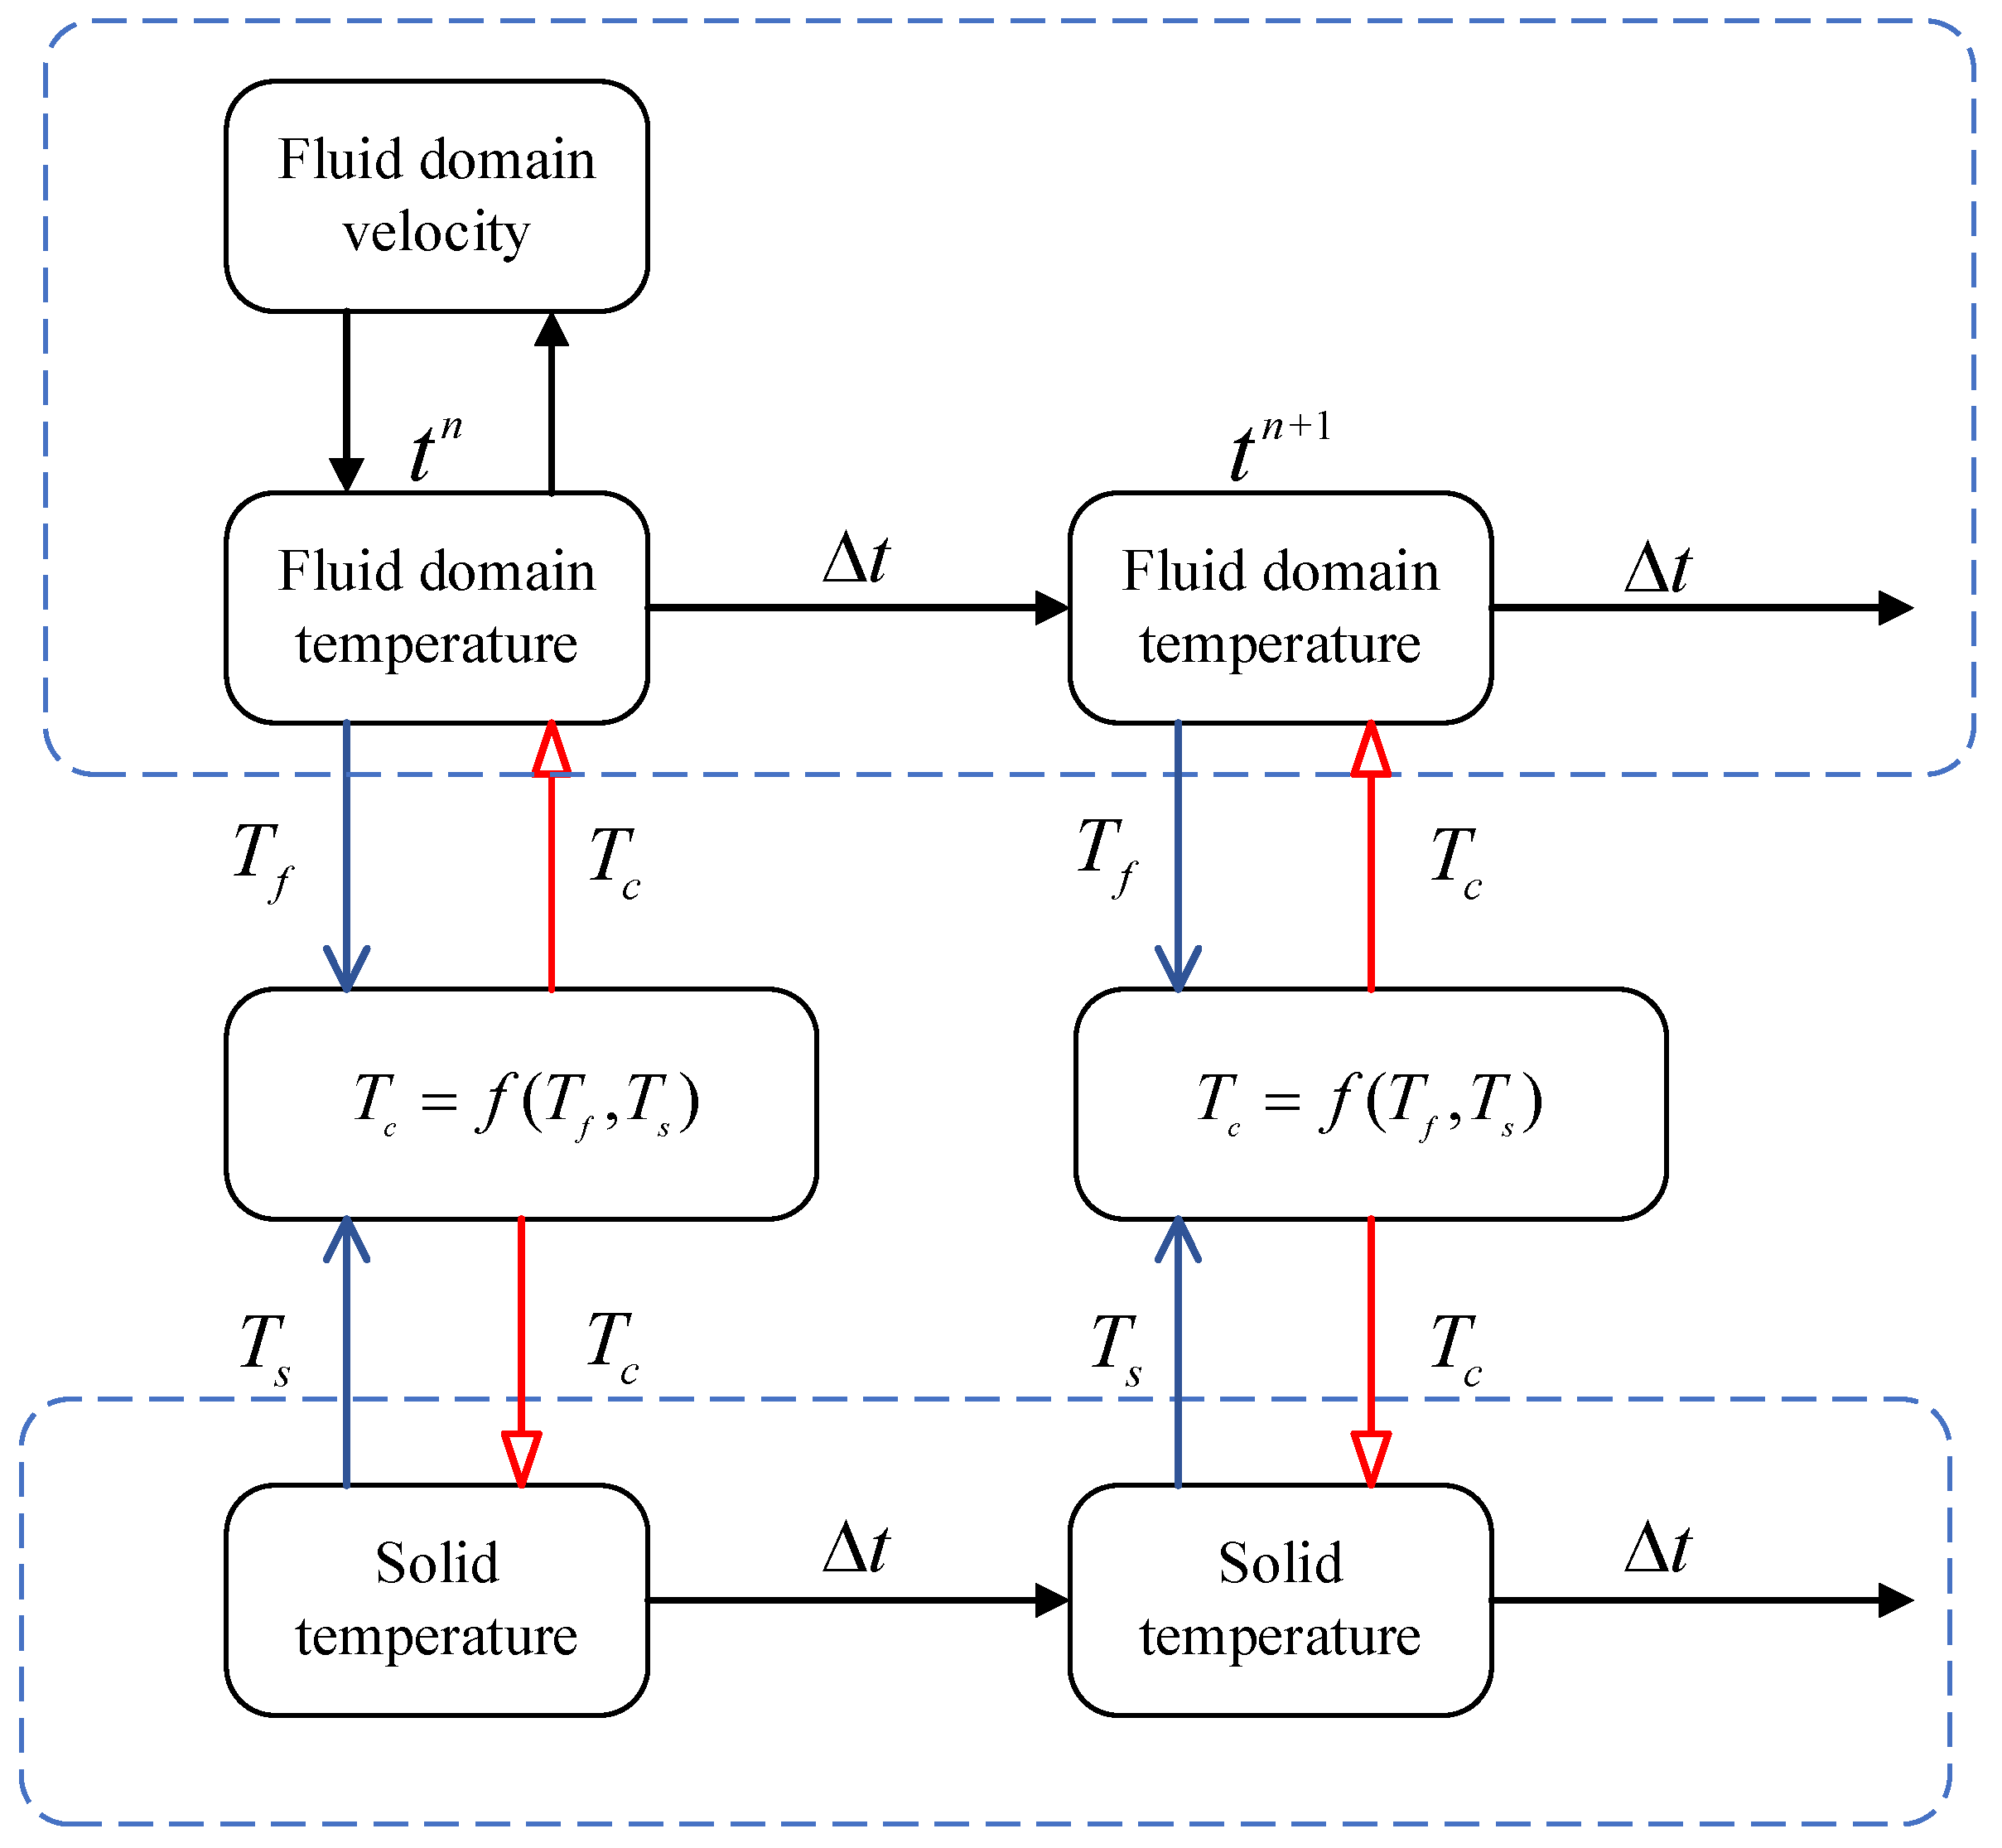
2.4. Coupling Calculation Method

In order to ensure the continuous heat flow on the fluid–structure coupling interface, the temperature field in the solid domain should be coupled with the velocity field and temperature field in the fluid domain at the same time. The solution idea of the coupling calculation method proposed in this paper is shown in Figure 5 and its specific steps are as follows:
(1)
Initialization: Set the initial temperature field and velocity field of the fluid domain and the solid domain. The boundary of the flow field is adopted as non-slip adiabatic boundary.
(2)
Interface coupling: According to the heat flux continuity of the coupled interface, the temperature T c of the coupled interface is calculated and applied to the temperature field calculation of the fluid domain and the solid domain as the coupling boundary condition. The calculation formula is as follows:
λ s · T c T s Δ n s = λ f · T f T c Δ n f
where, λ s , T s and λ f , T f represent the temperature and thermal conductivity coefficient and temperature at the coupling interface of the solid domain and the flow field domain, respectively; Δ n s and Δ n f represent the distance between the flow field domain and the center of the first layer grid cell of the solid domain from the interface.
(3)
Iterative update: According to the same time step, iteratively solve and update the temperature field in the fluid domain and the solid domain until the maximum iteration time or convergence standard is reached.

3. Computational Implementation

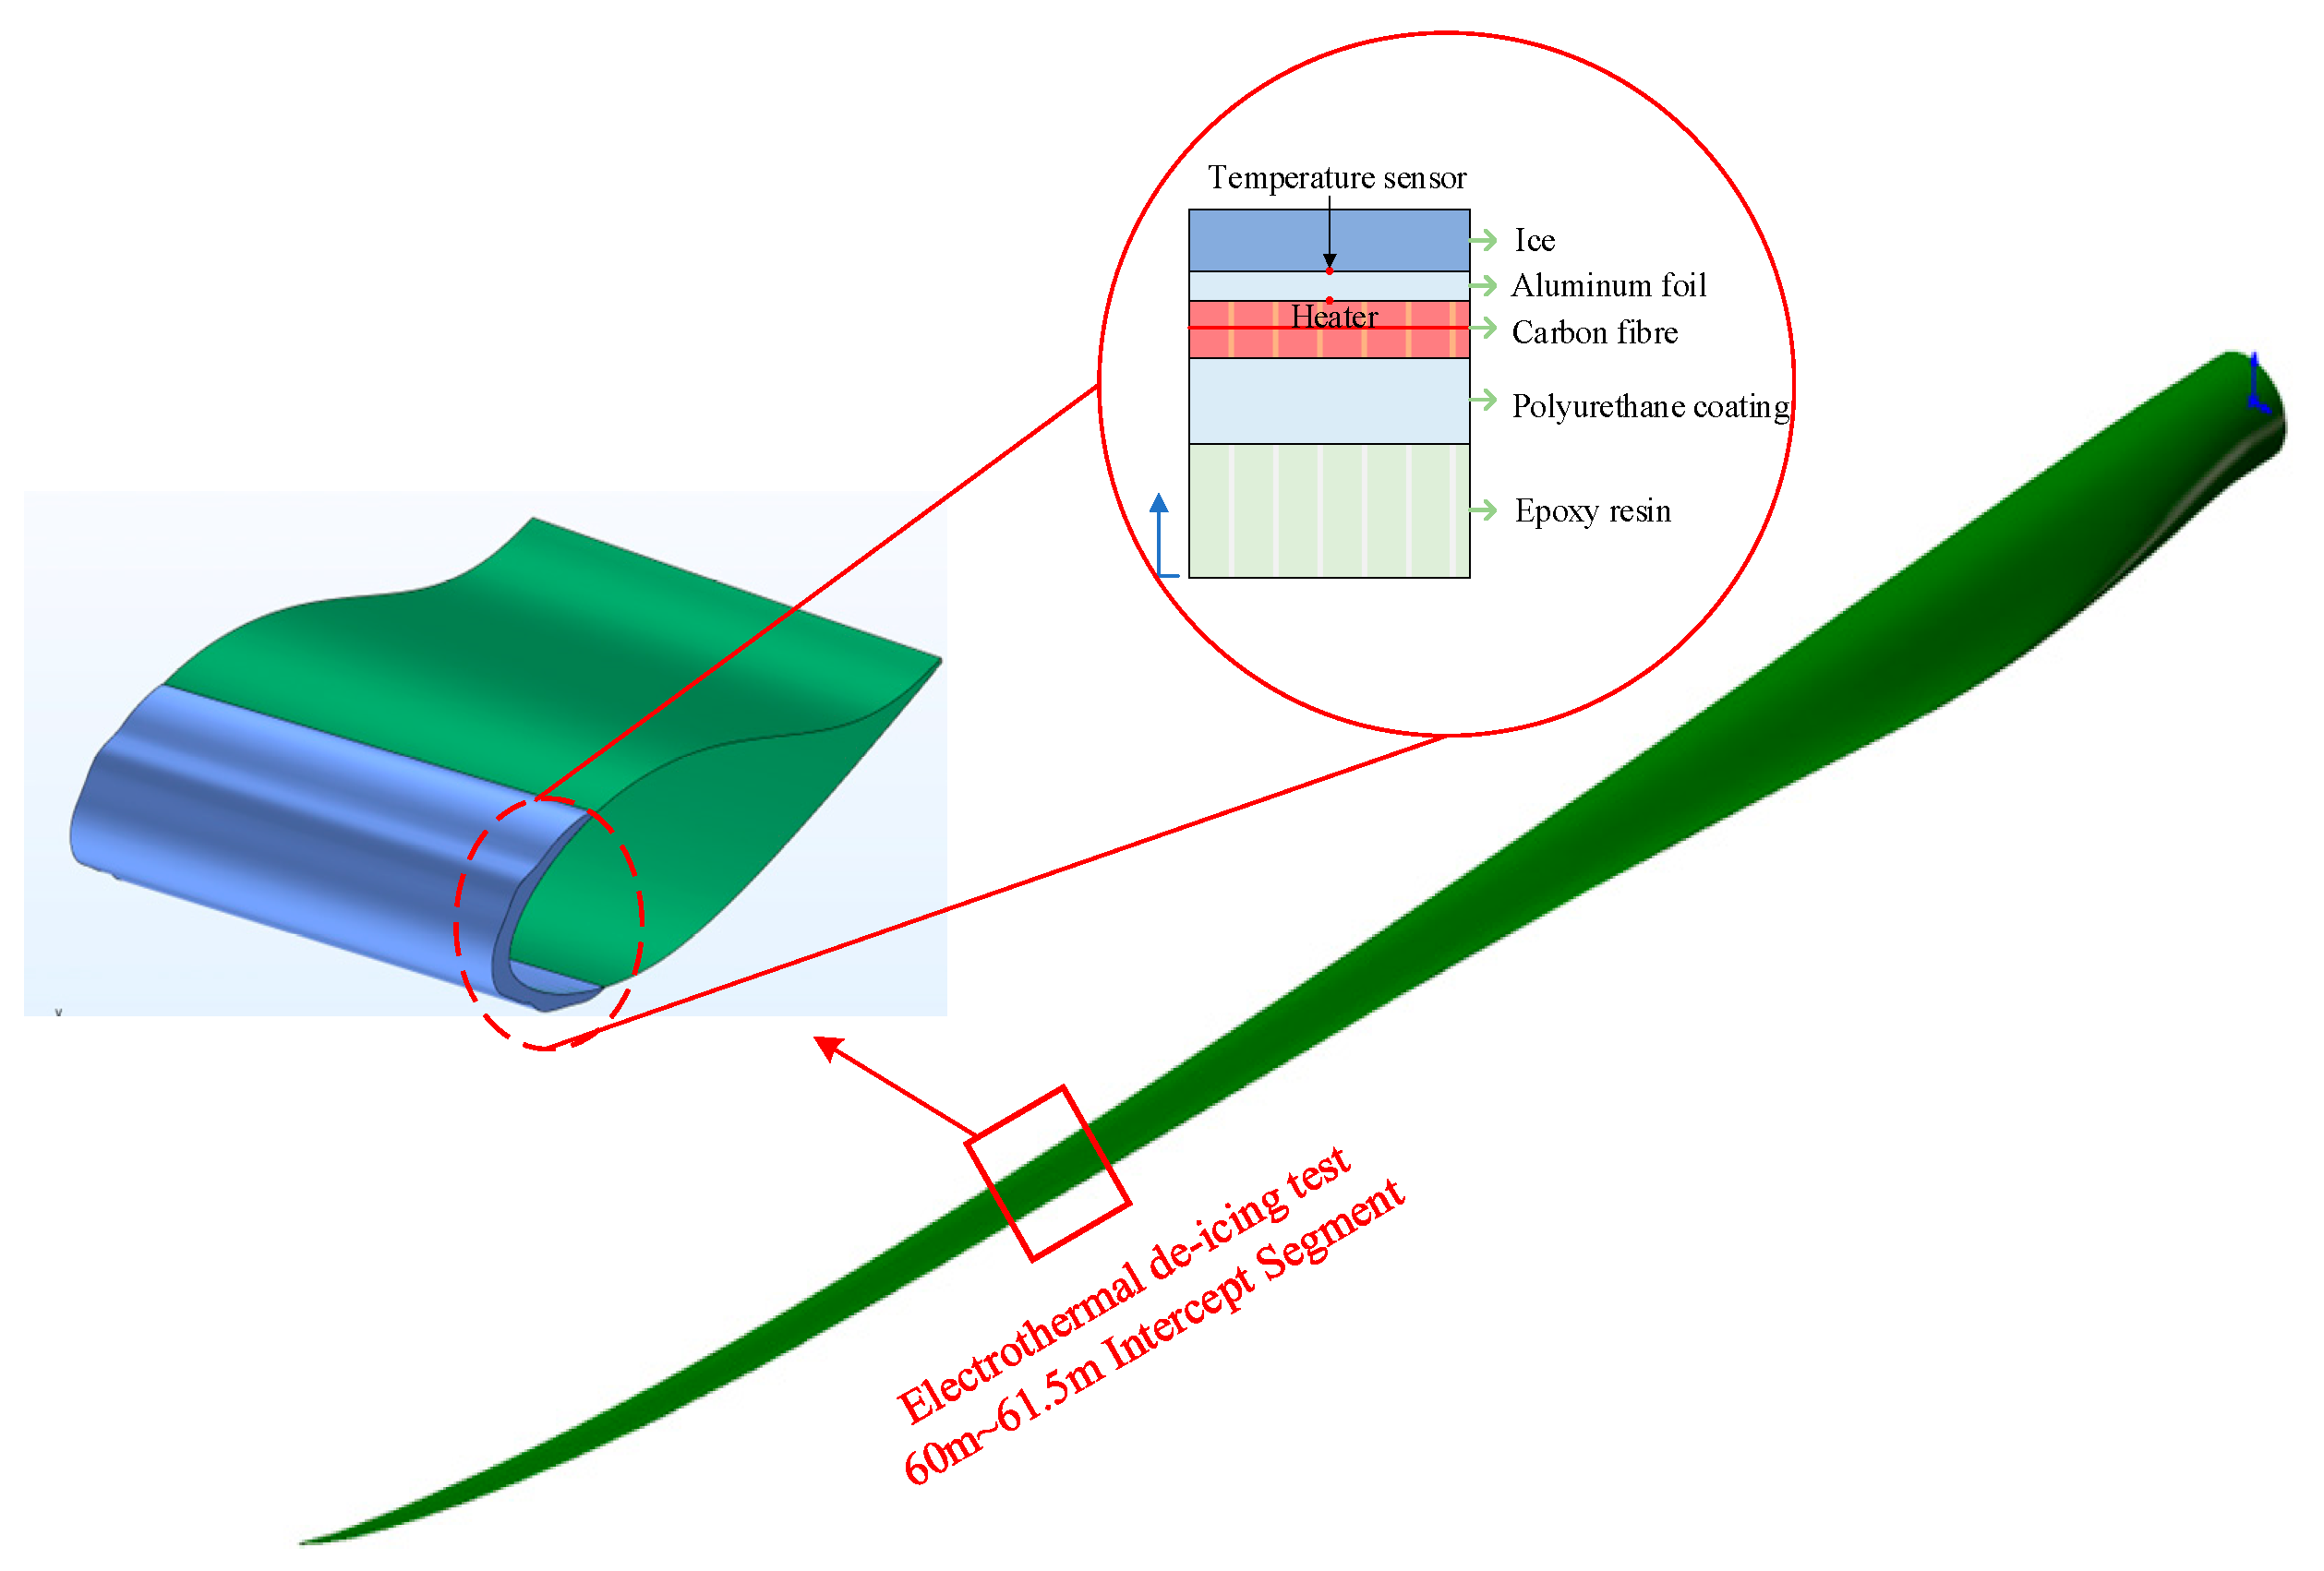
3.1. Geometric Model

Taking the tip section of a Sinoma87.5 as the research object, a geometric model of an electric heating deicing system with a multi-layer structure was constructed according to the actual ice-coating morphology. As shown in Figure 6, the model consists of leaf material, heat insulation layer, heating layer, thermal conductivity layer, and ice layer from inside to outside. The heating layer is laid by carbon fiber cloth, and by applying voltage to both ends, heat is generated to achieve the function of deicing. Based on the aforementioned numerical theory, this study uses Comsol Multiphysics as the simulation platform, with the Heat Transfer module and CFD module, to perform numerical simulations of the electric heating deicing process.

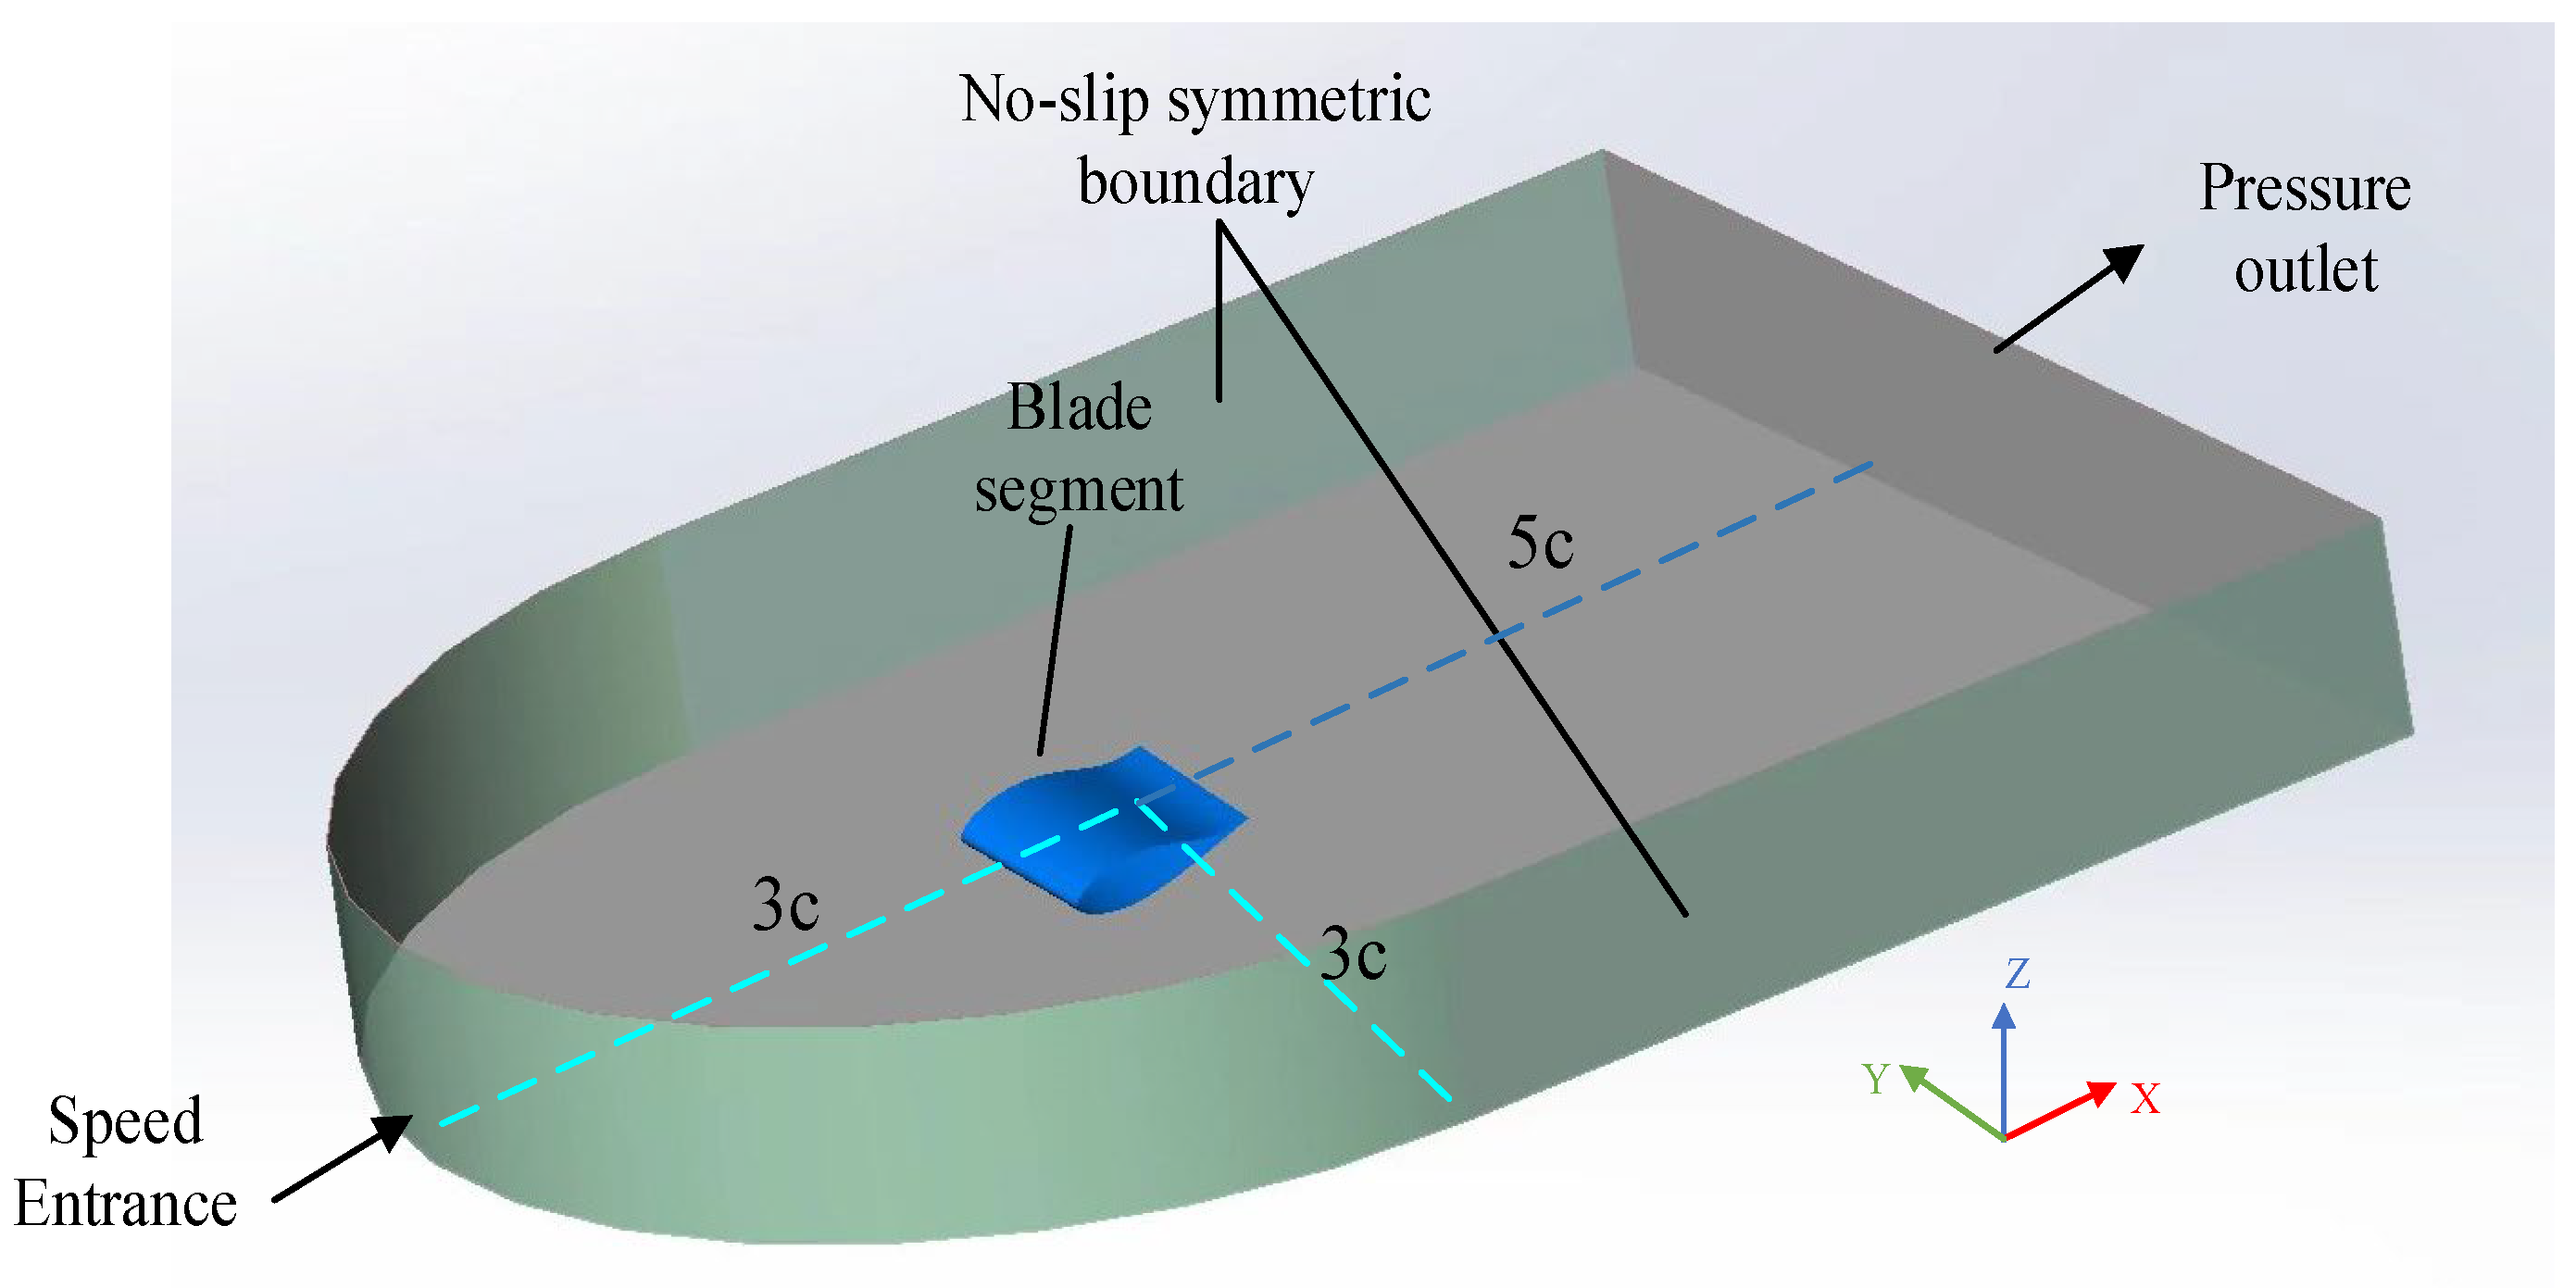
3.2. Computational Domain Selection and Boundary Conditions

In order to ensure that the numerical results are not disturbed by the boundary, it is necessary to set the calculation range reasonably. In this paper, a three-dimensional computing domain combining cuboid and semi-cylinder is adopted, as shown in Figure 7. Taking the leading edge stationary point of the blade as the coordinate origin, the chord length is defined as c, the dimensions of the blade segment from the entrance and exit in the X direction are 3c and 5c, the dimensions from the symmetric wall surfaces on both sides in the Y direction are 3c, and the height direction of Z is 5c, ensuring that all the characteristics of the flow field and temperature field around the blade are covered.
In the calculation domain, the inlet is shear wind speed inlet, and the wind speed value is set according to different working conditions. The outlet is the pressure outlet, usually set to 1 standard atmospheric pressure (101,325 Pa); the four sides are set as symmetric adiabatic boundaries. The surface of the blade heating layer is set as a constant heat flow boundary, and the heat flow depends on the applied power density. A no-slip coupled heat transfer is set between the blade and the outer surface of the ice sheet.
The electric heating deicing system typically operates in two heating modes: continuous heating and cyclic heating. In the continuous heating mode, a constant heating power is continuously applied and evenly distributed across each heating region to achieve deicing. In the cyclic heating mode, the provided heat is intermittently concentrated and distributed to one or more heating regions to achieve deicing. It is assumed that the ice-covered area of the blade is divided into N sub-regions, as shown in Figure 8 for both heating modes.

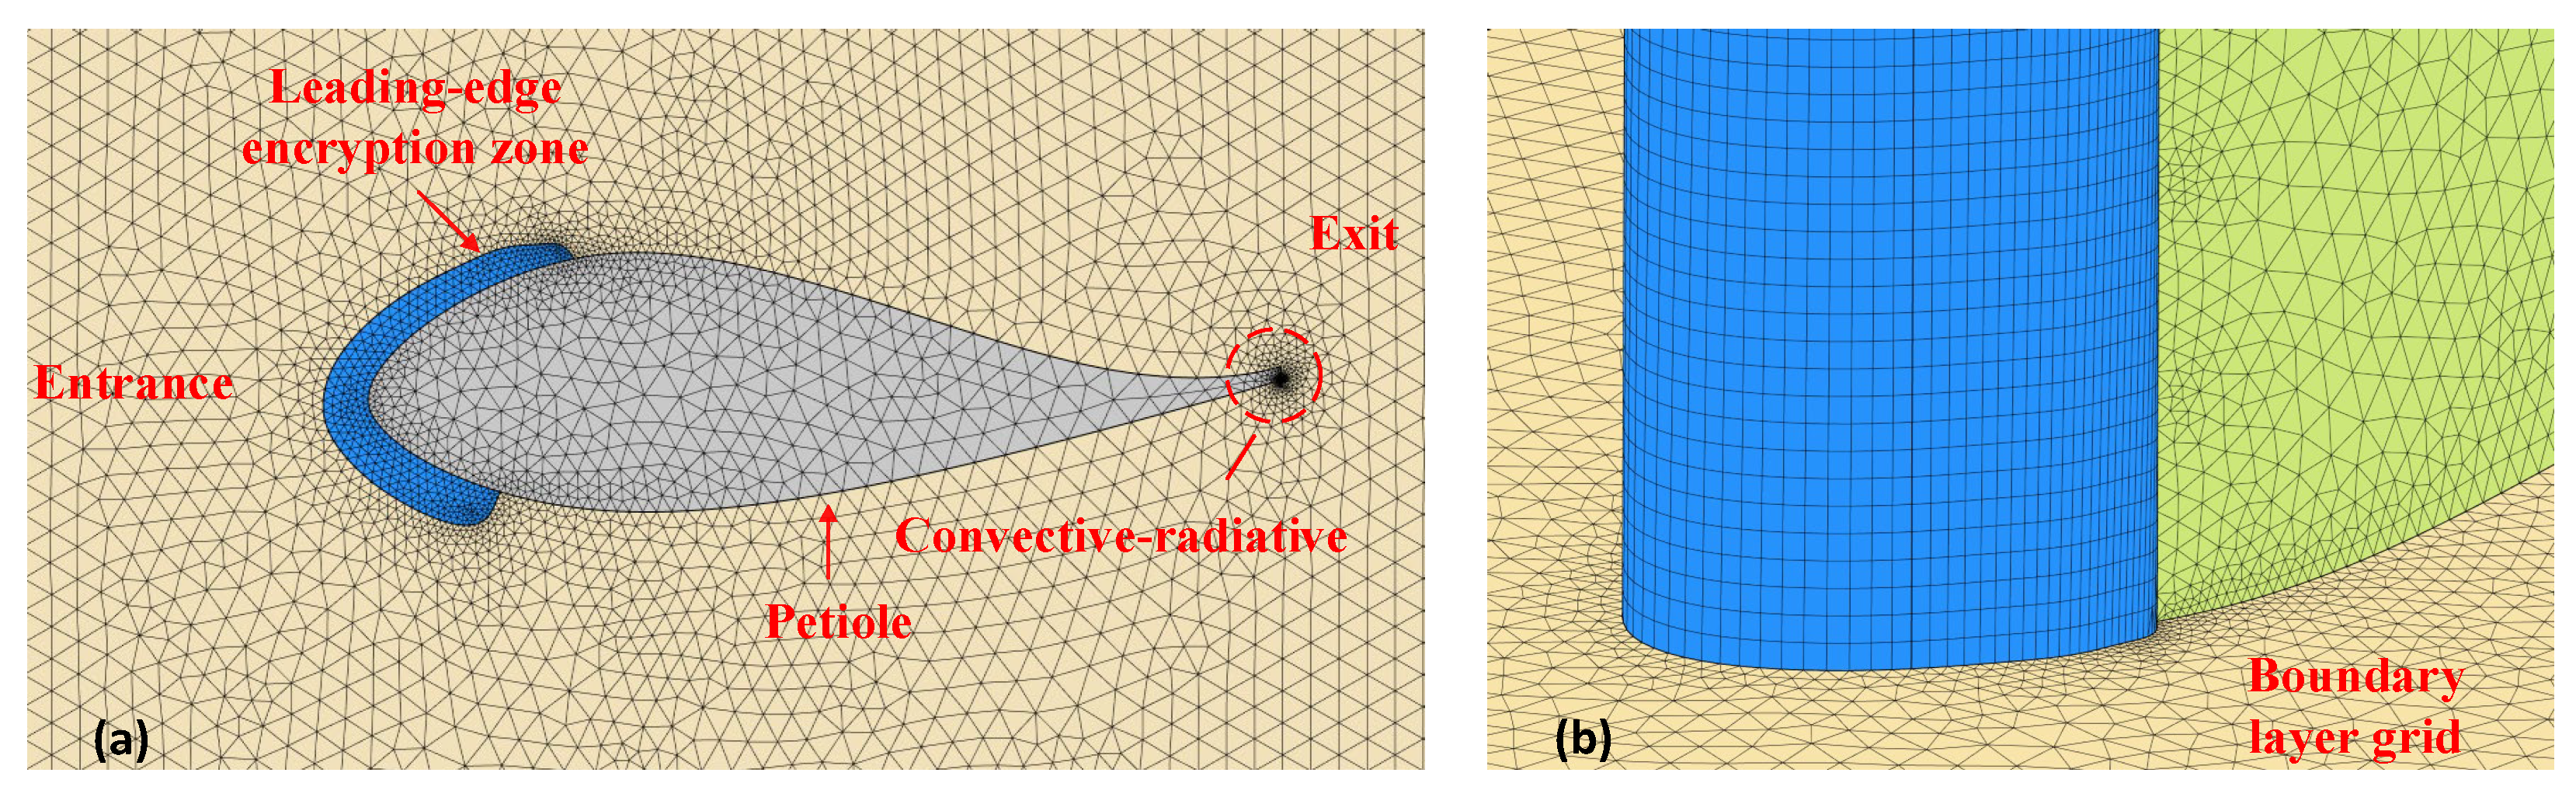
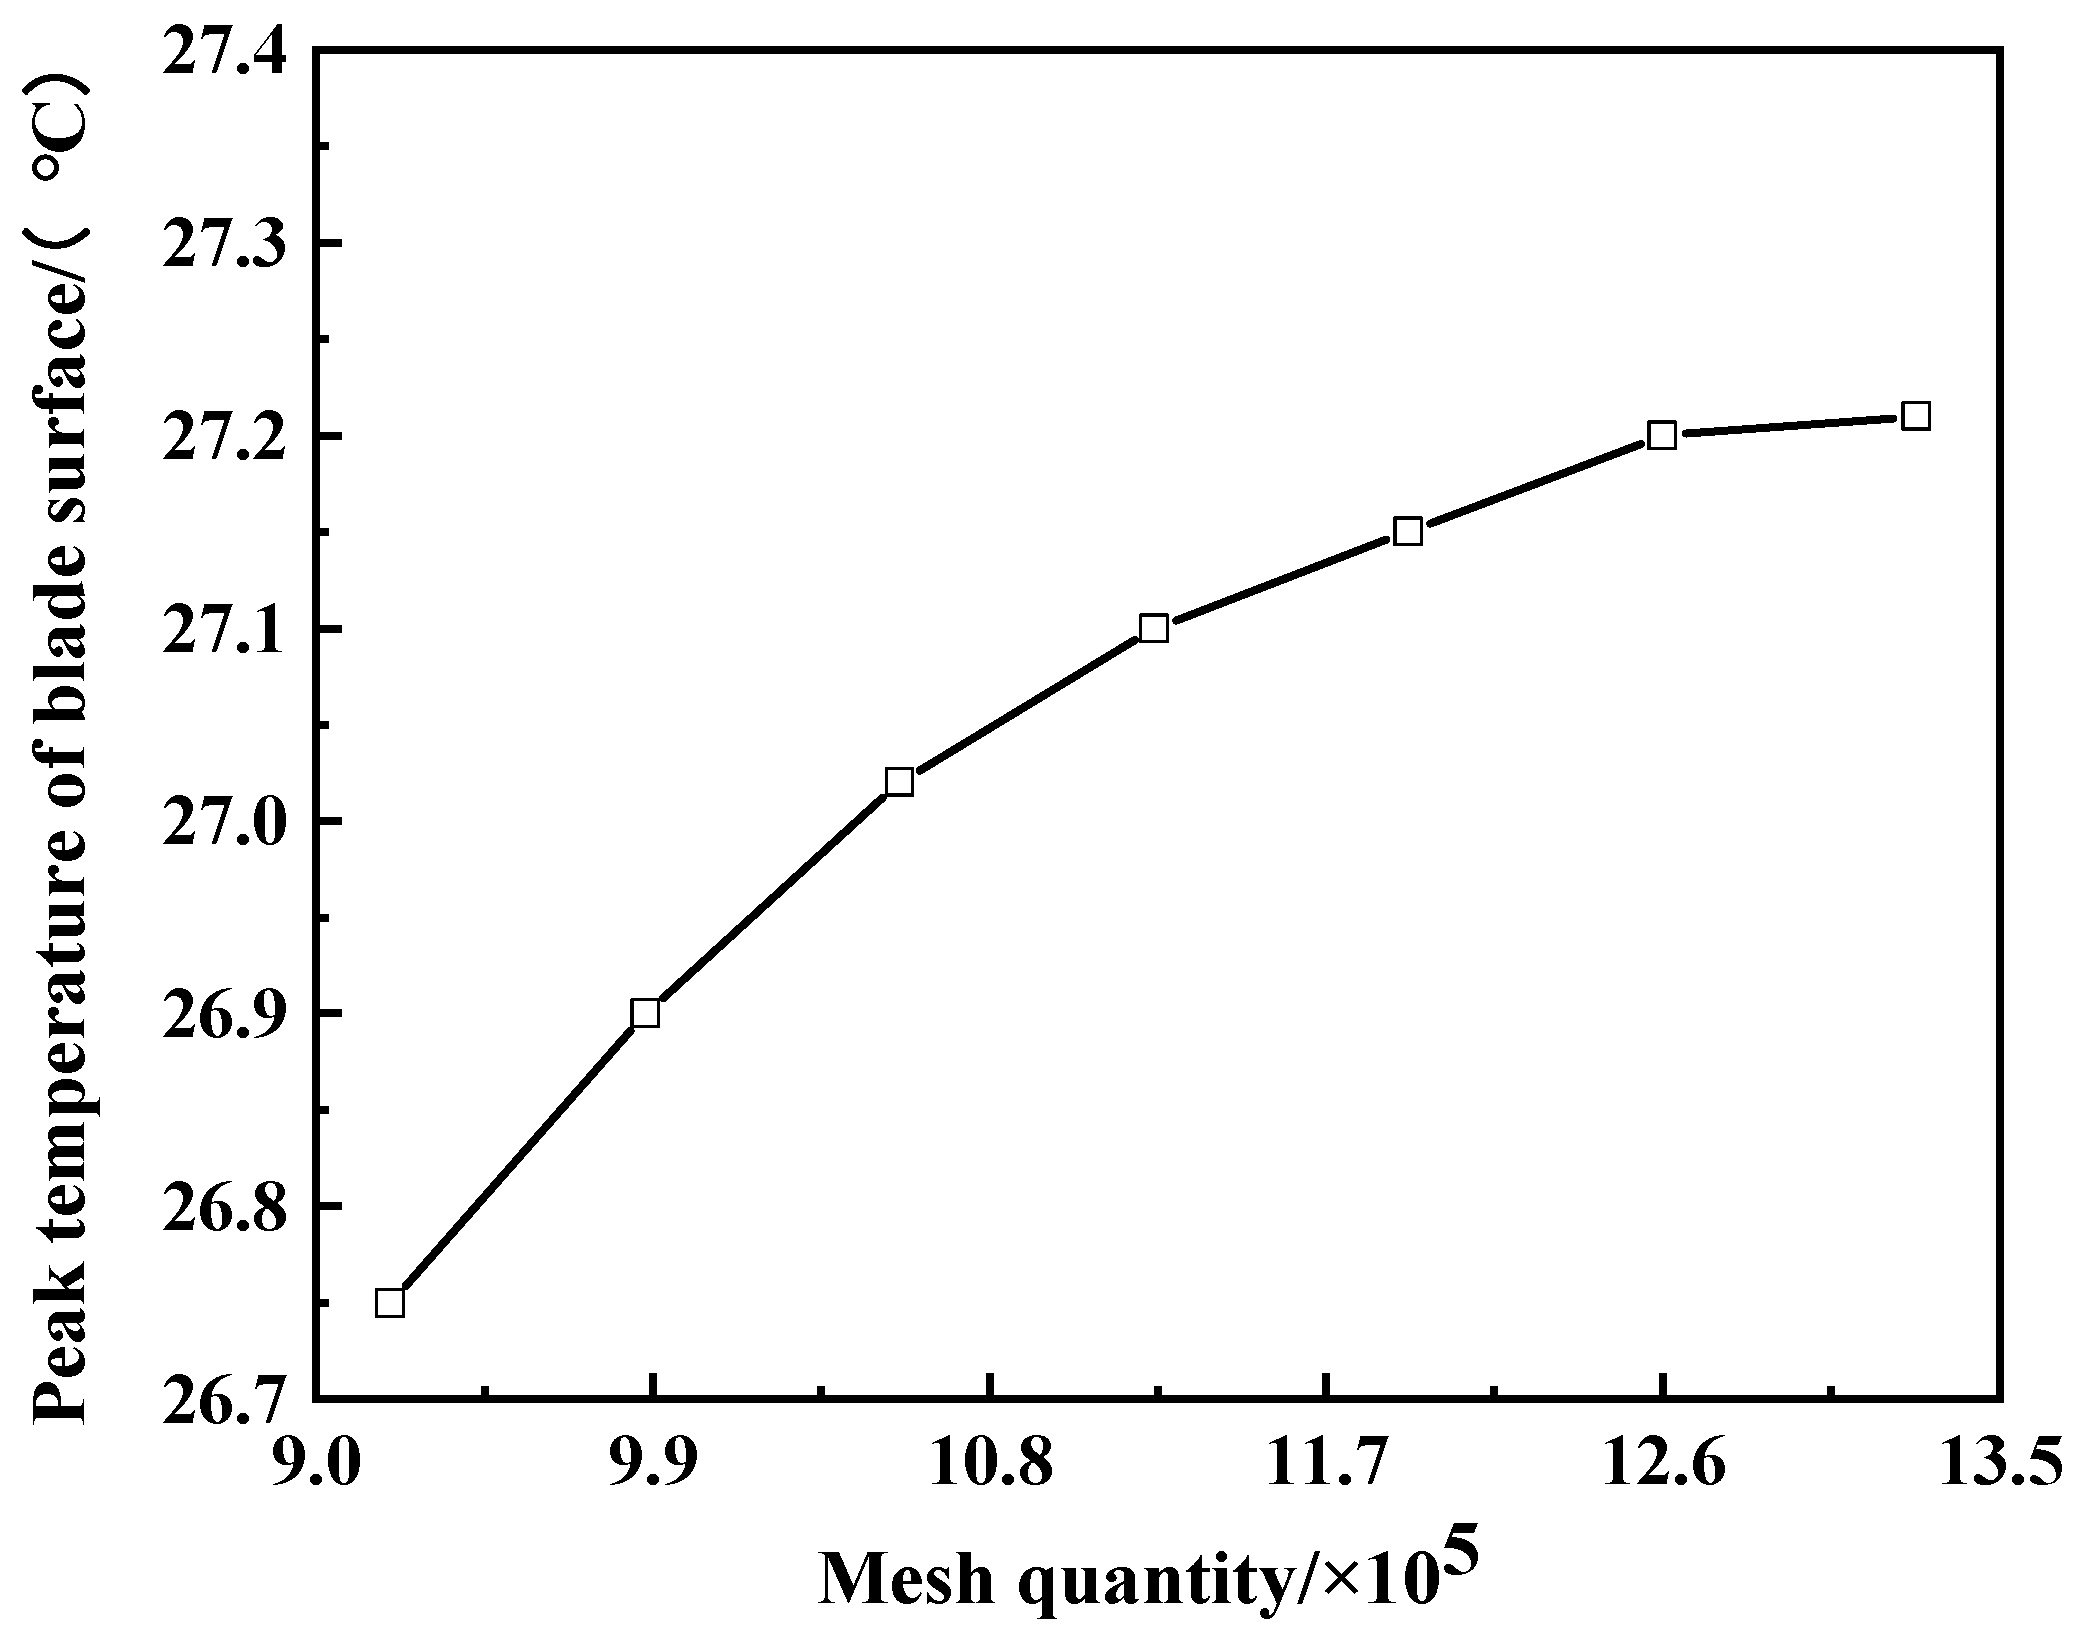
3.3. Mesh Generation and Independence Verification

Considering the geometric complexity of the model and the characteristics of fluid-thermal coupling, unstructured free tetrahedral elements combined with local adaptive encryption mesh partitioning strategy are used to balance the calculation accuracy and efficiency. The grid region is divided into solid domain and fluid domain. Free tetrahedral cell grid is used in all domains, and hierarchical encryption strategy is implemented in key areas:
  • Grid encryption is implemented in the ice-water phase transition area and ice-covering interface;
  • Layered mesh is used and encrypted near the wall of the fluid domain, and the height of the first layer mesh meets y+ < 1, so as to meet the wall resolution requirements of a k ω SST turbulence model.
The grid distribution of the calculation domain is shown in Figure 9. This method not only ensures the model resolution but also takes into account the computational efficiency and numerical convergence, effectively reducing the interference caused by geometric near-wall errors.
In order to balance the convergence of the numerical model and the efficient use of computational resources, a mesh independence study was conducted for the computational domain. As shown in Figure 10, when the mesh quantity reaches 1.26 million, the variation in the peak surface temperature of the blade stabilizes. Therefore, 1.26 million mesh points will be adopted as the mesh division scheme for the subsequent numerical studies.

4. Results and Discussion

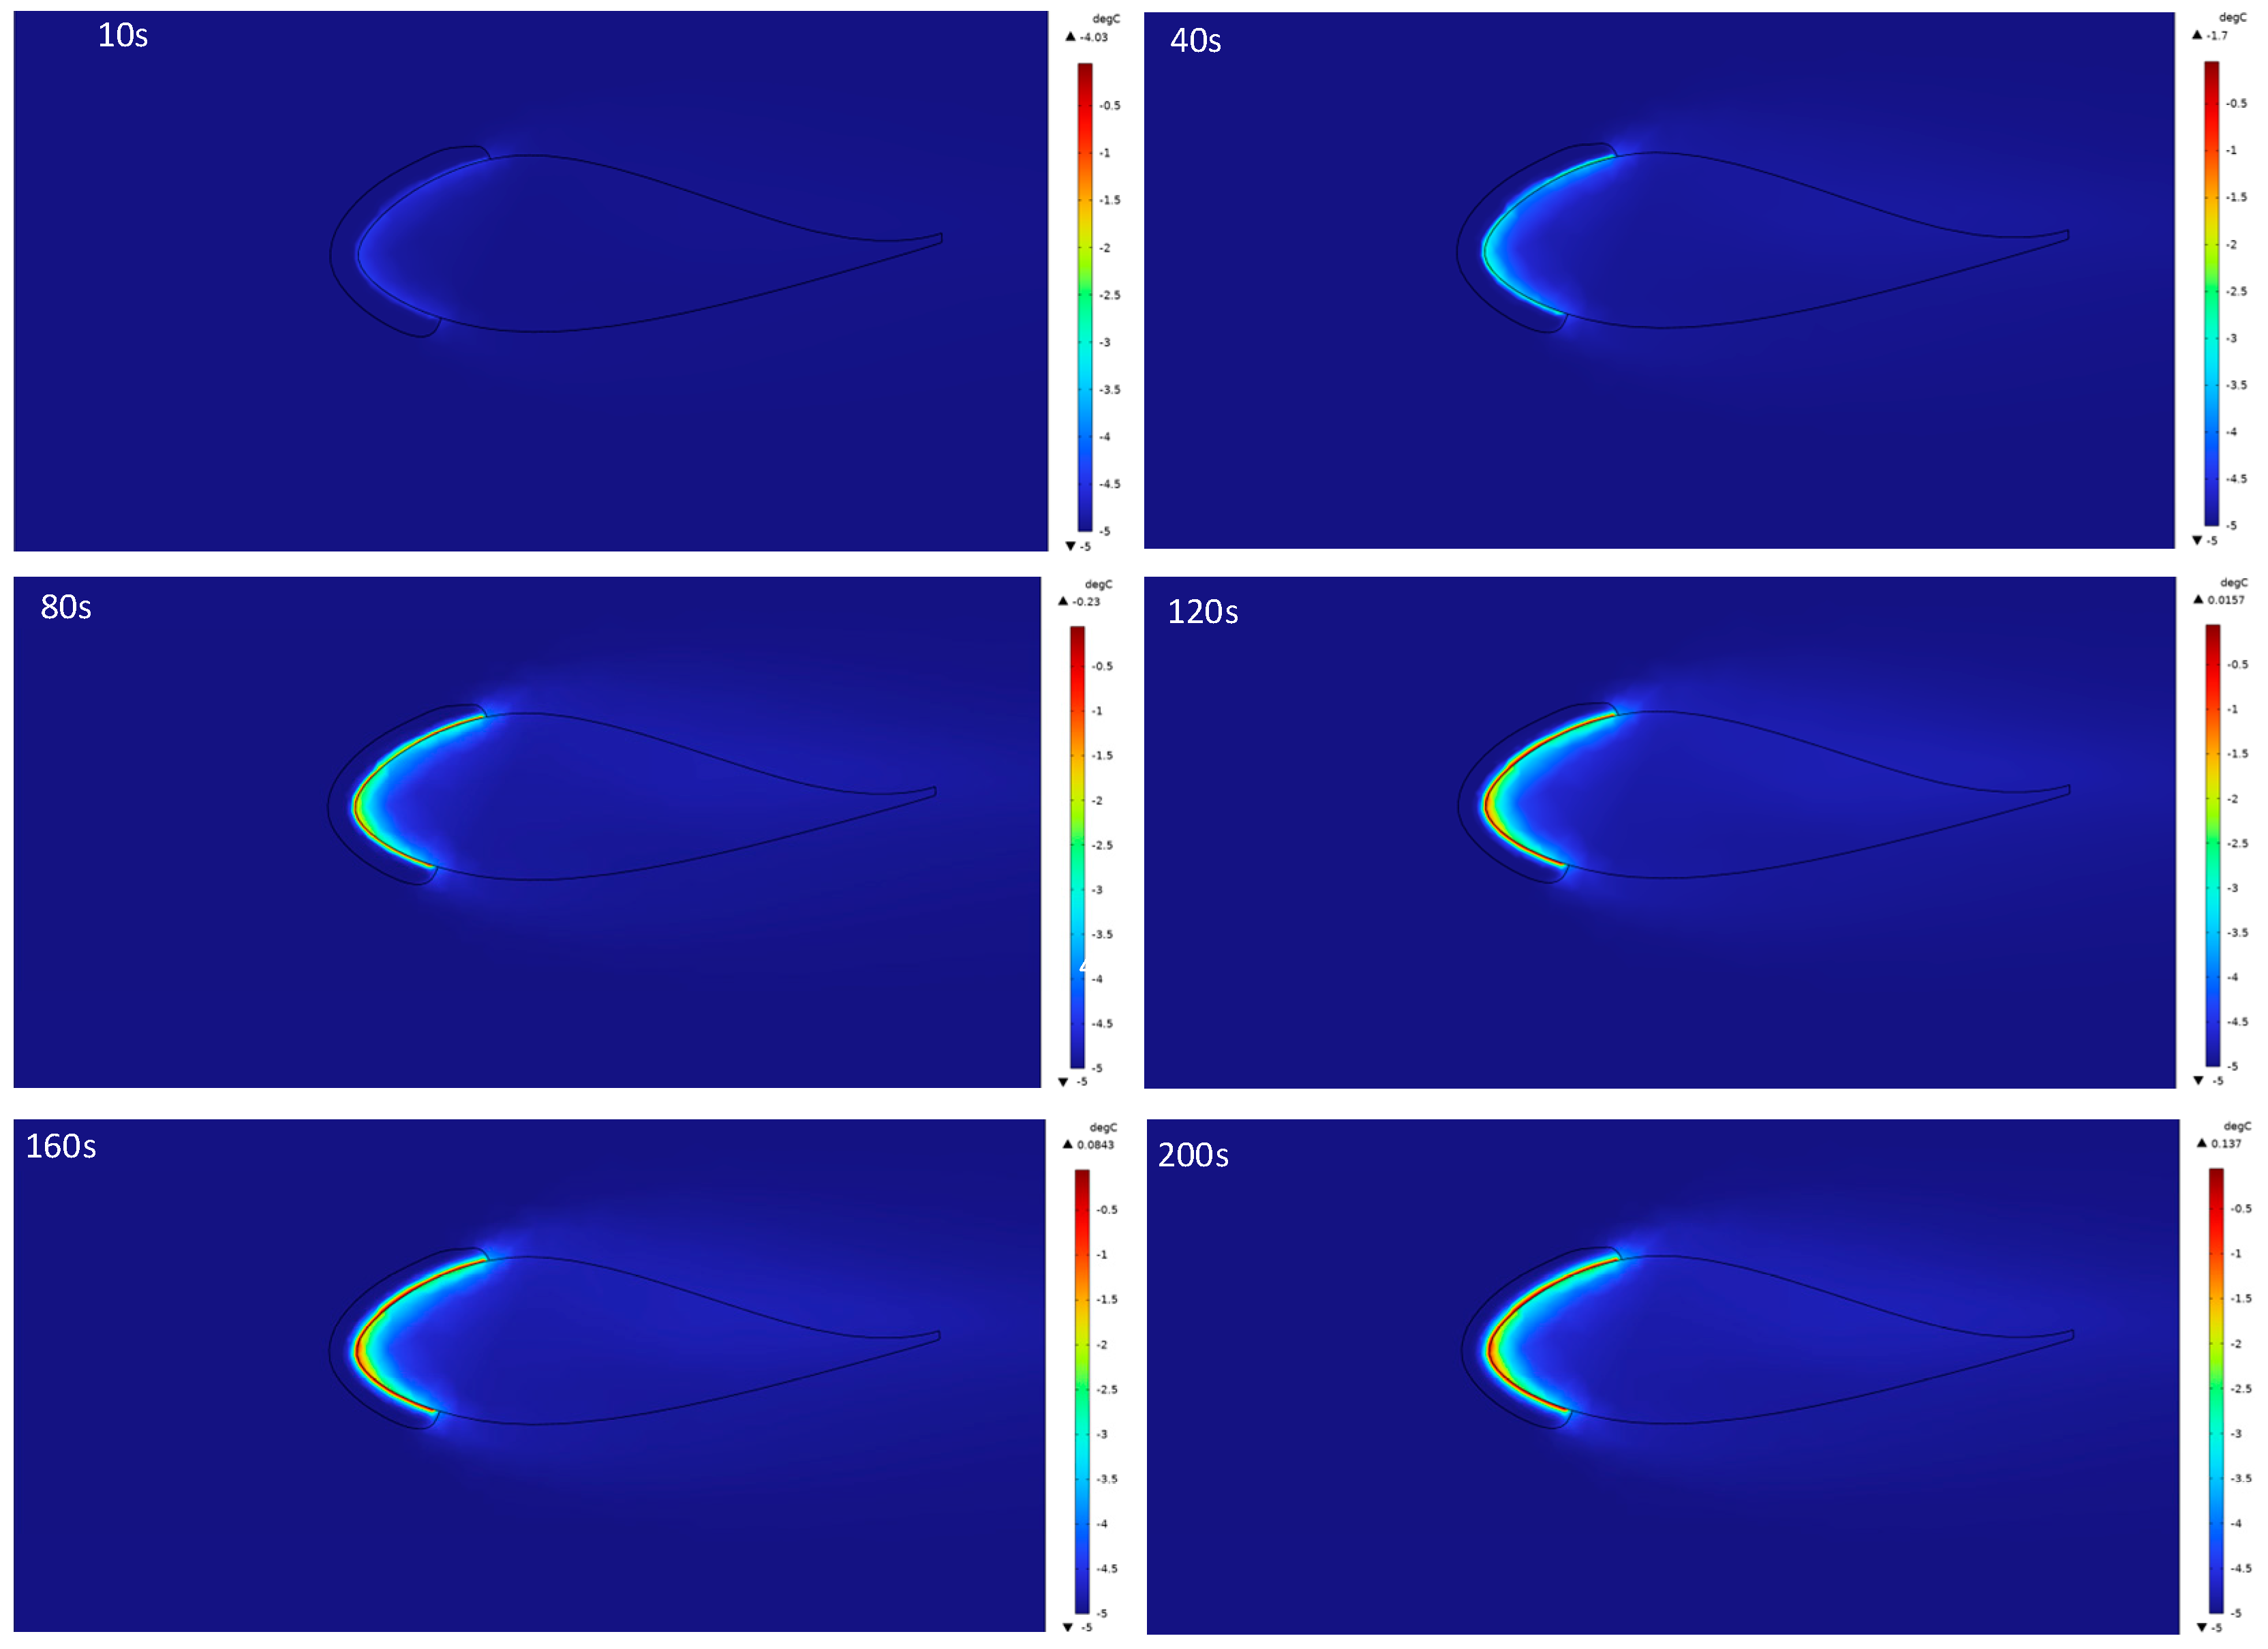
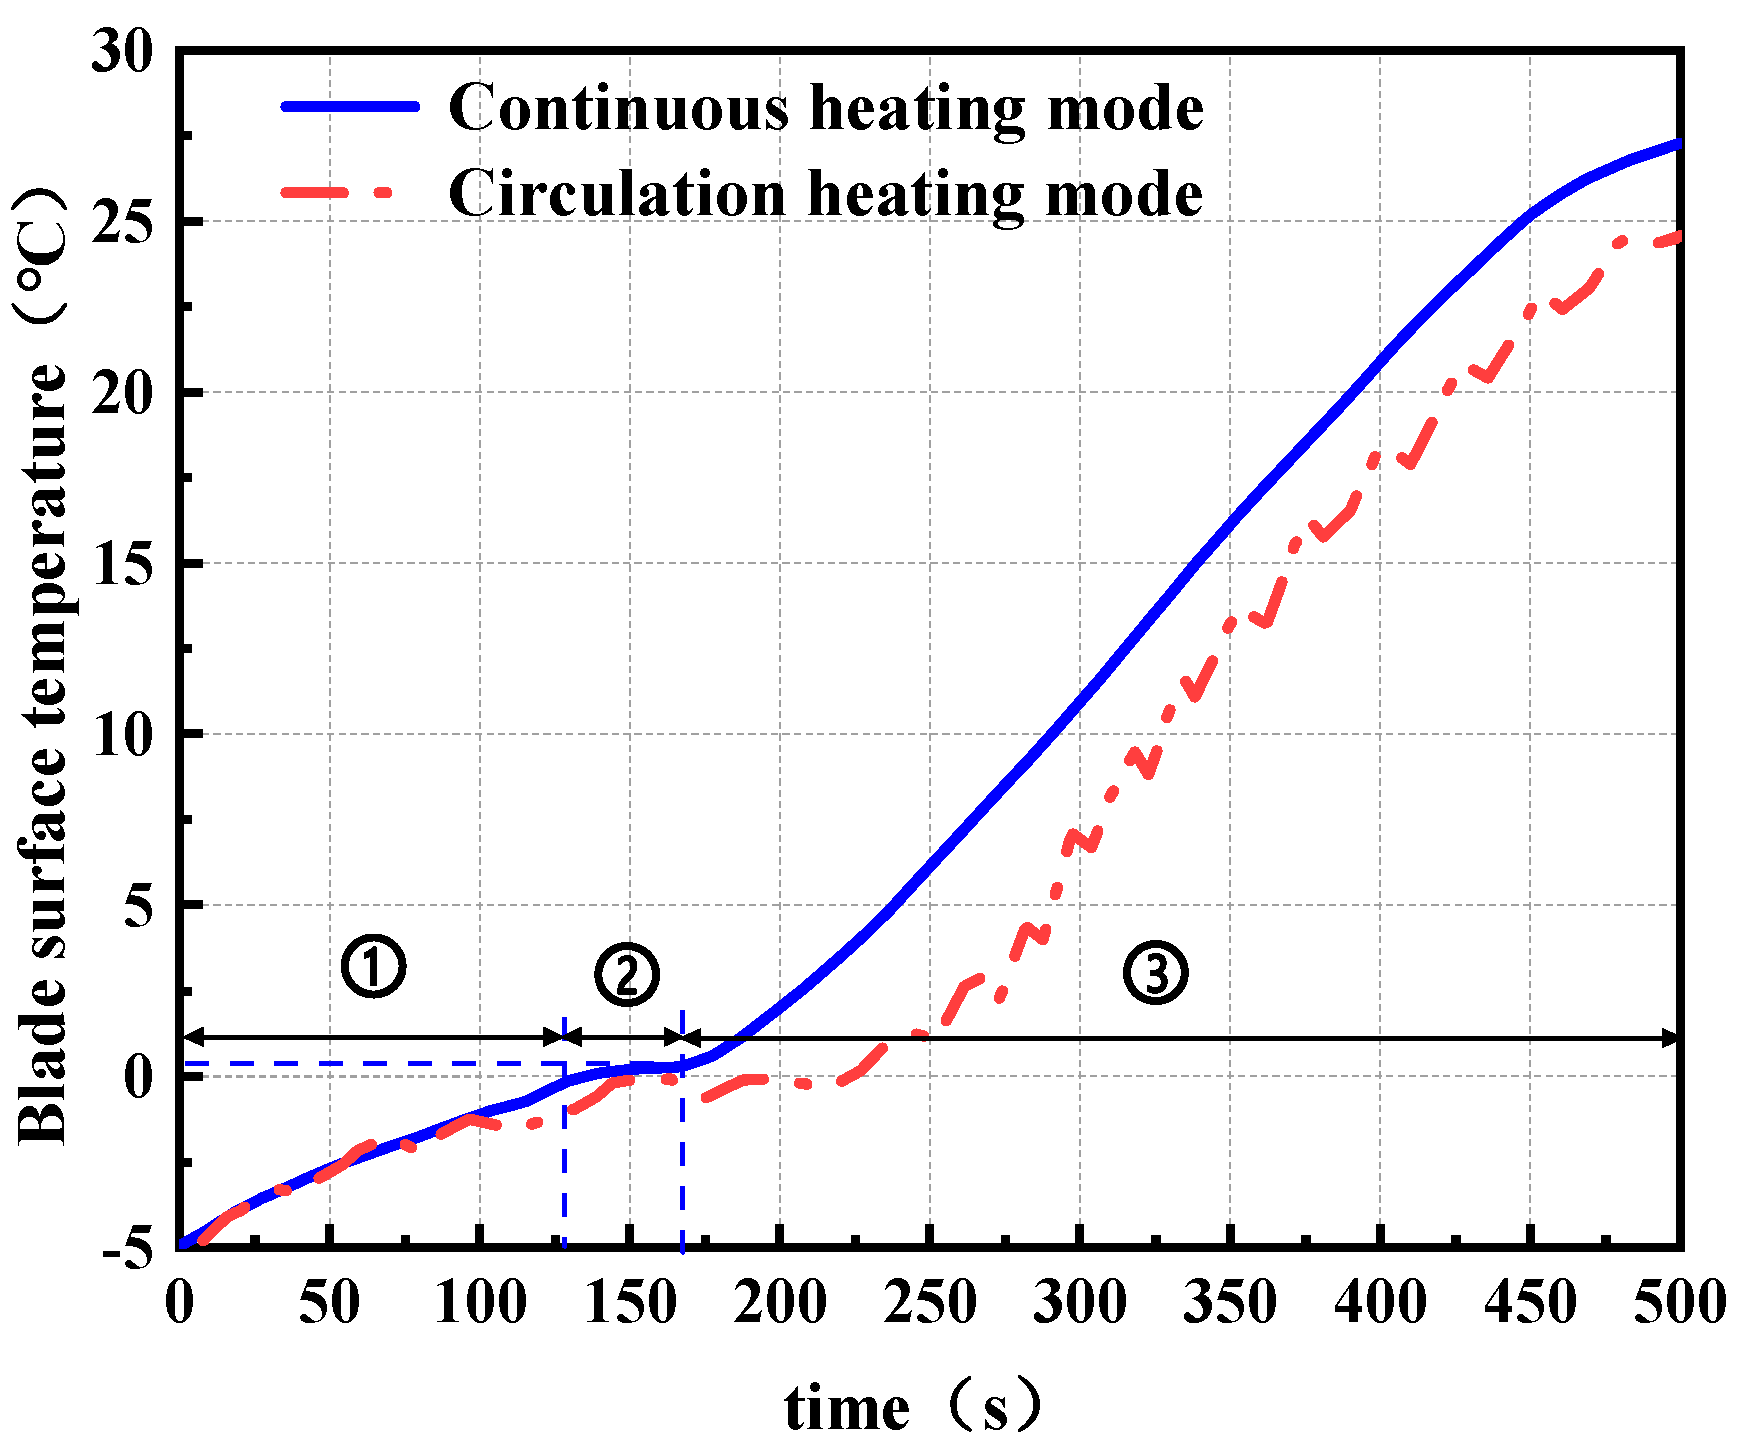
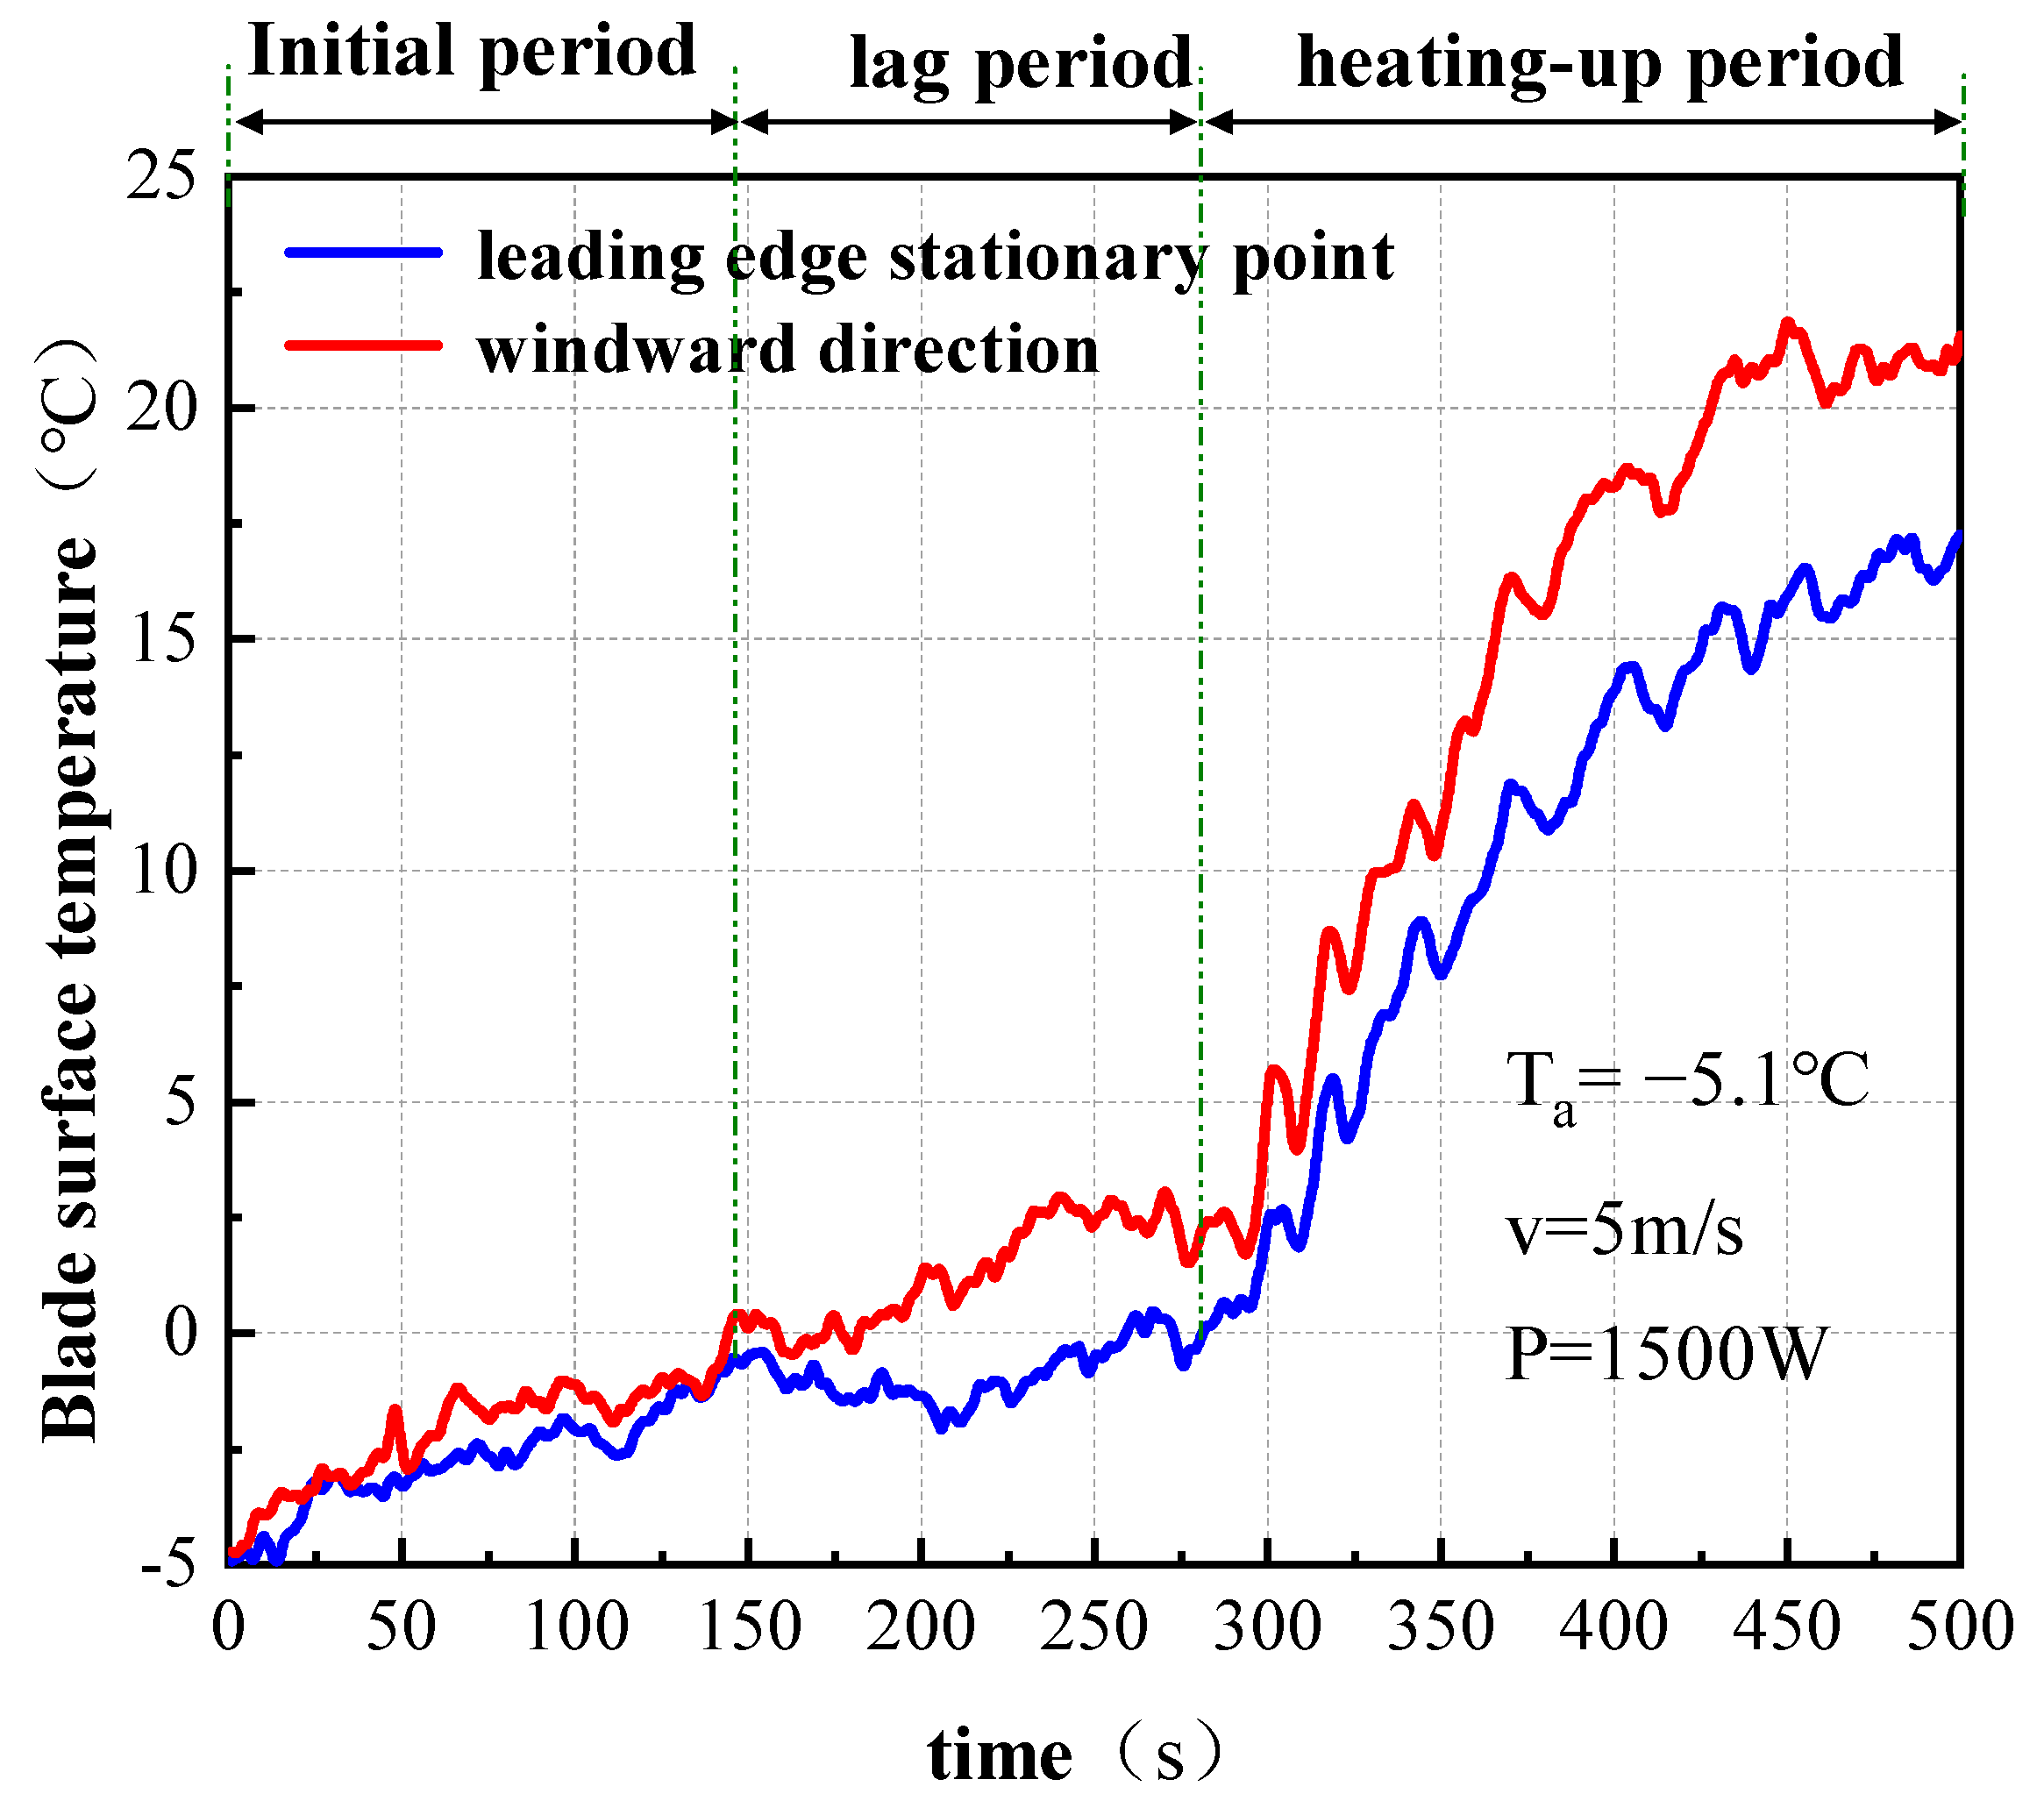
4.1. Temperature Field Development

The temperature field evolution of blade surface, ice sheet, and surrounding environment is the key to reveal the coupling mechanism of flow and heat transfer in the process of blade electric heating deicing. Taking continuous heating mode as an example, the simulation of its temperature field distribution over time is shown in Figure 11. In order to clearly show the details of temperature change, the spanwise cross-section of the blade sample was selected for analysis, and the temperature distribution legend of the same level was uniformly used for comparison.
The deicing process can be divided into three stages: The initial heating stage (10 s), where heat is transferred to the inner surface of the ice through thermal conduction, and the temperature rises slowly without significant melting signs; during the ice melting stage (40 s and 80 s), the interface temperature of the ice sheet reached the phase transition point, the liquid phase began to form, the temperature rise in the front area accelerated, and some heat was lost to the external environment; in the stable stage (120 s and later), the air gap gradually expands, the convective heat transfer is enhanced, the temperature field changes slowly, and the local temperature on the blade surface continues to rise, which may lead to the formation of local high-temperature regions.
Figure 12 shows the variation of blade surface temperature over time under different heating modes. ① to ③ represent the three stages of the heating de-icing process, including the initial heating period, lag period, and heating-up period. After the system is activated, the surface temperature of the blade gradually increases in both heating modes. However, the continuous heating mode exhibits a faster rate of temperature rise, while the cyclic heating mode displays a periodic fluctuation pattern—temperature increases during the heating phase and decreases slightly during the non-heating phase. When the heating time reaches approximately 128 s and 163 s for the continuous and cyclic modes, respectively, both modes experience a short plateau phase. This stagnation is caused by the absorption of a large amount of latent heat during the ice phase transition, with the plateau lasting longer in the cyclic heating mode. Subsequently, due to the formation of air gaps at the blade–ice interface, local convective heat transfer is enhanced, resulting in a more rapid temperature increase. The blade surface temperature eventually stabilizes at around 27 °C and 23 °C for the continuous and cyclic heating modes, respectively. This saturation phenomenon indicates that the system has reached a state of dynamic thermal equilibrium.

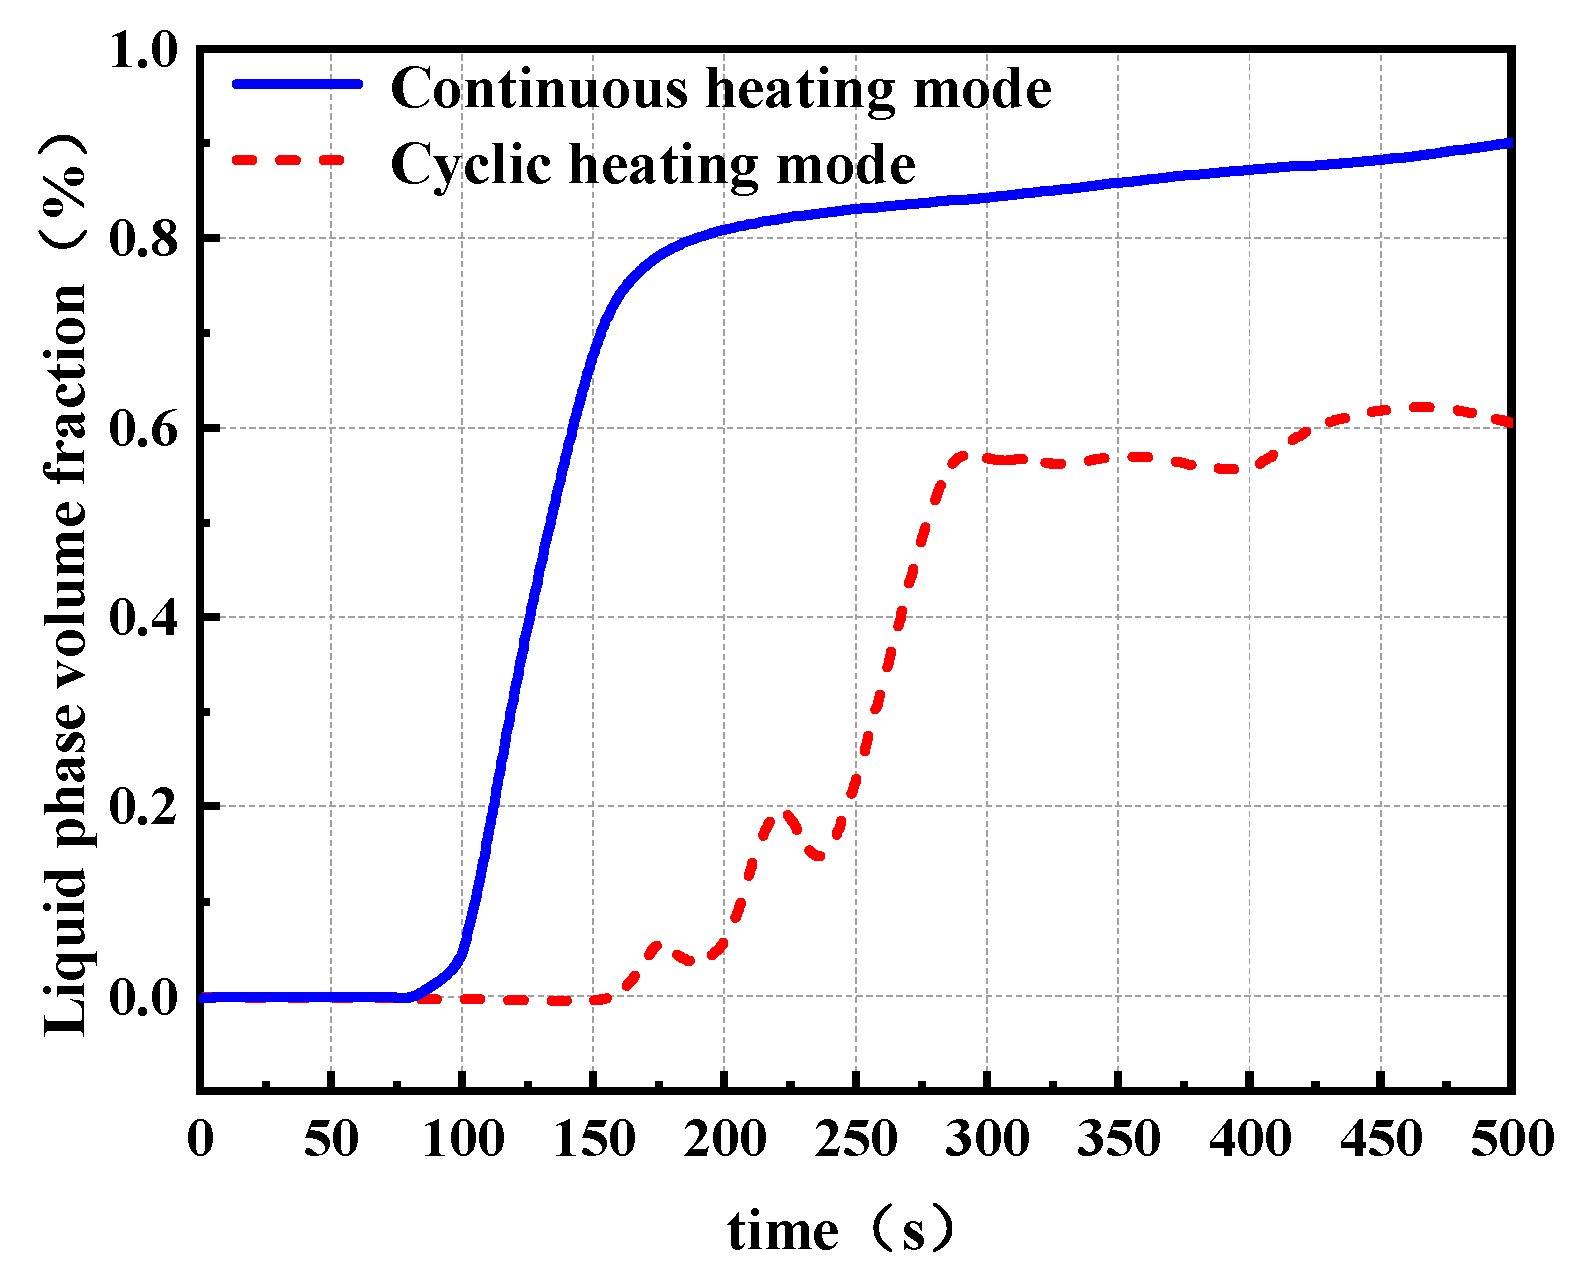
4.2. Phase Change Field Development

The phase transition behavior of the ice sheet was simulated by using the enthalpy-porosity method, and the evolution characteristics of the liquid phase fraction in the melting region over time were tracked and analyzed. The phase transition process of the inner surface of the ice sheet was obtained, as shown in Figure 13. When the heating time continued until 60 s, the local area of the inner surface of the ice sheet first reached 0 °C and began to undergo a solid–liquid phase change, forming a small amount of liquid water and gradually expanding to the surrounding area. With the advance of heating time, most areas of the ice layer have reached the phase transition point, the phase transition process is significantly intensified, and the liquid volume fraction increases rapidly. Finally, the phase transition process tends to the saturation state, which may be caused by the change of the heat transfer mechanism on the blade surface due to the increase in space clearance, which reduces the heat transfer efficiency. This phenomenon is precisely explained by the continuous increase in blade surface temperature.
Figure 14 further compares the liquid water volume fraction under the two heating modes. The continuous heating mode achieves ice melting more rapidly, with the liquid phase volume fraction increasing sharply to approximately 80% during the 100–150 s interval and gradually approaching saturation thereafter. In contrast, under the cyclic heating mode, the liquid water fraction begins to increase significantly around 165 s. Due to intermittent heating, a noticeable decrease of about 10% is observed during the non-heating phases, which may be attributed to secondary freezing of the meltwater during the cooling periods. However, as latent heat is progressively absorbed during the phase transition, the melting process becomes more uniform and the magnitude of this back-freezing effect gradually diminishes.

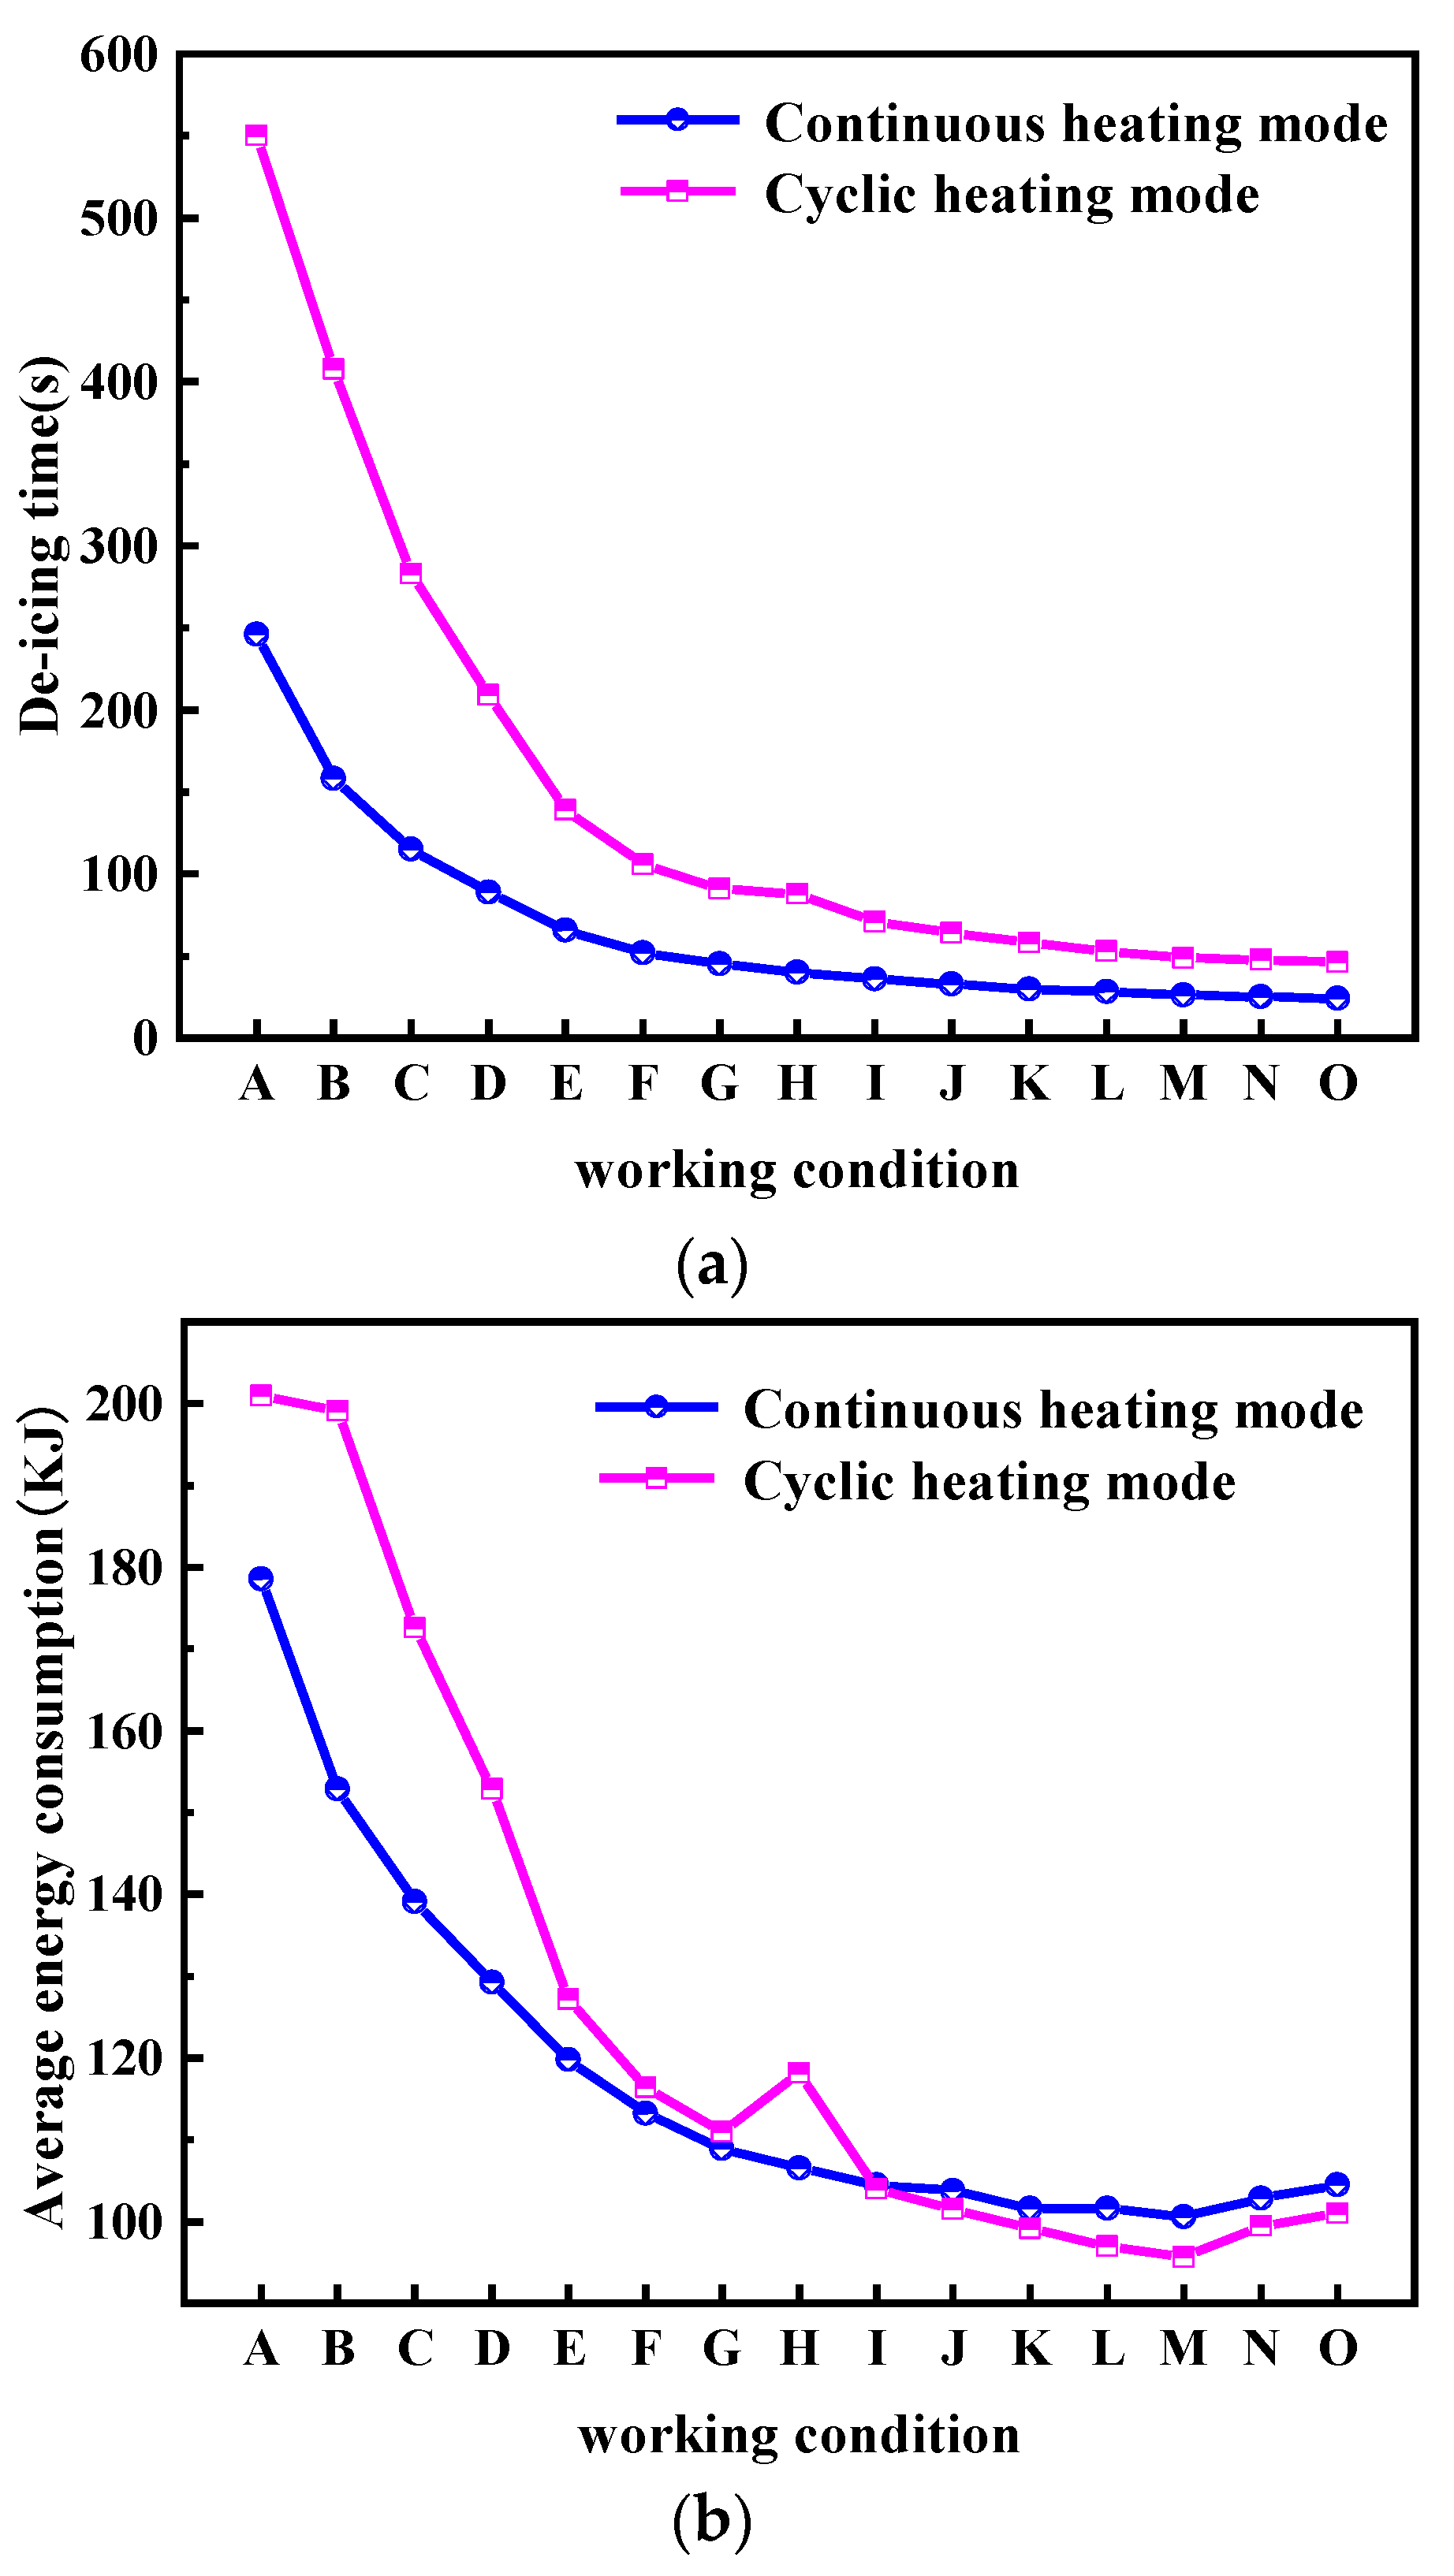
4.3. Evaluation of Deicing Efficiency

In order to quantitatively evaluate the deicing performance of the continuous heating mode and cyclic heating mode, this study uses deicing time and average energy consumption as evaluation indicators. A comparative analysis of these performance indicators under different heating power conditions for both heating modes was conducted through simulations. Based on the actual ice accretion conditions and deicing requirements of wind farms, this study selected a power range from 600 W to 3600 W, divided into conditions A to O with 200 W intervals. The simulations were conducted to obtain the relationship between heating power, deicing time, and average energy consumption, as shown in Figure 15.
As shown in Figure 15a, the deicing time decreases with increasing heating power, and the continuous heating mode shows shorter deicing time and higher heat transfer efficiency in the low-power range (A~E). The deicing time in the high-power range (F-O) tends to decline gently, and the difference between the two heating modes decreases, indicating that the deicing process gradually approaches the heat transfer limit.
As shown in Figure 15b, the average energy consumption of the two heating deicing modes decreases with the increase in heating power. In fact, the energy consumption of the cyclic heating mode is generally higher than that of the continuous heating mode, especially in the low-power condition. At medium and high power, the energy utilization of circulating heating shows an optimization trend, the difference of energy consumption decreases, and the working condition M is the best advantage. Under ultra-high-power conditions (N, O), the energy consumption rises slightly, which may be due to the increase in temperature difference leading to the increase in convection and radiant heat loss.
In summary, the continuous heating mode is suitable for scenarios that require rapid deicing, such as rapid recovery in extreme climates. The cycle heating mode has more advantages in energy consumption control and is suitable for an energy consumption sensitive or long cycle operation.

5. Experimental Research

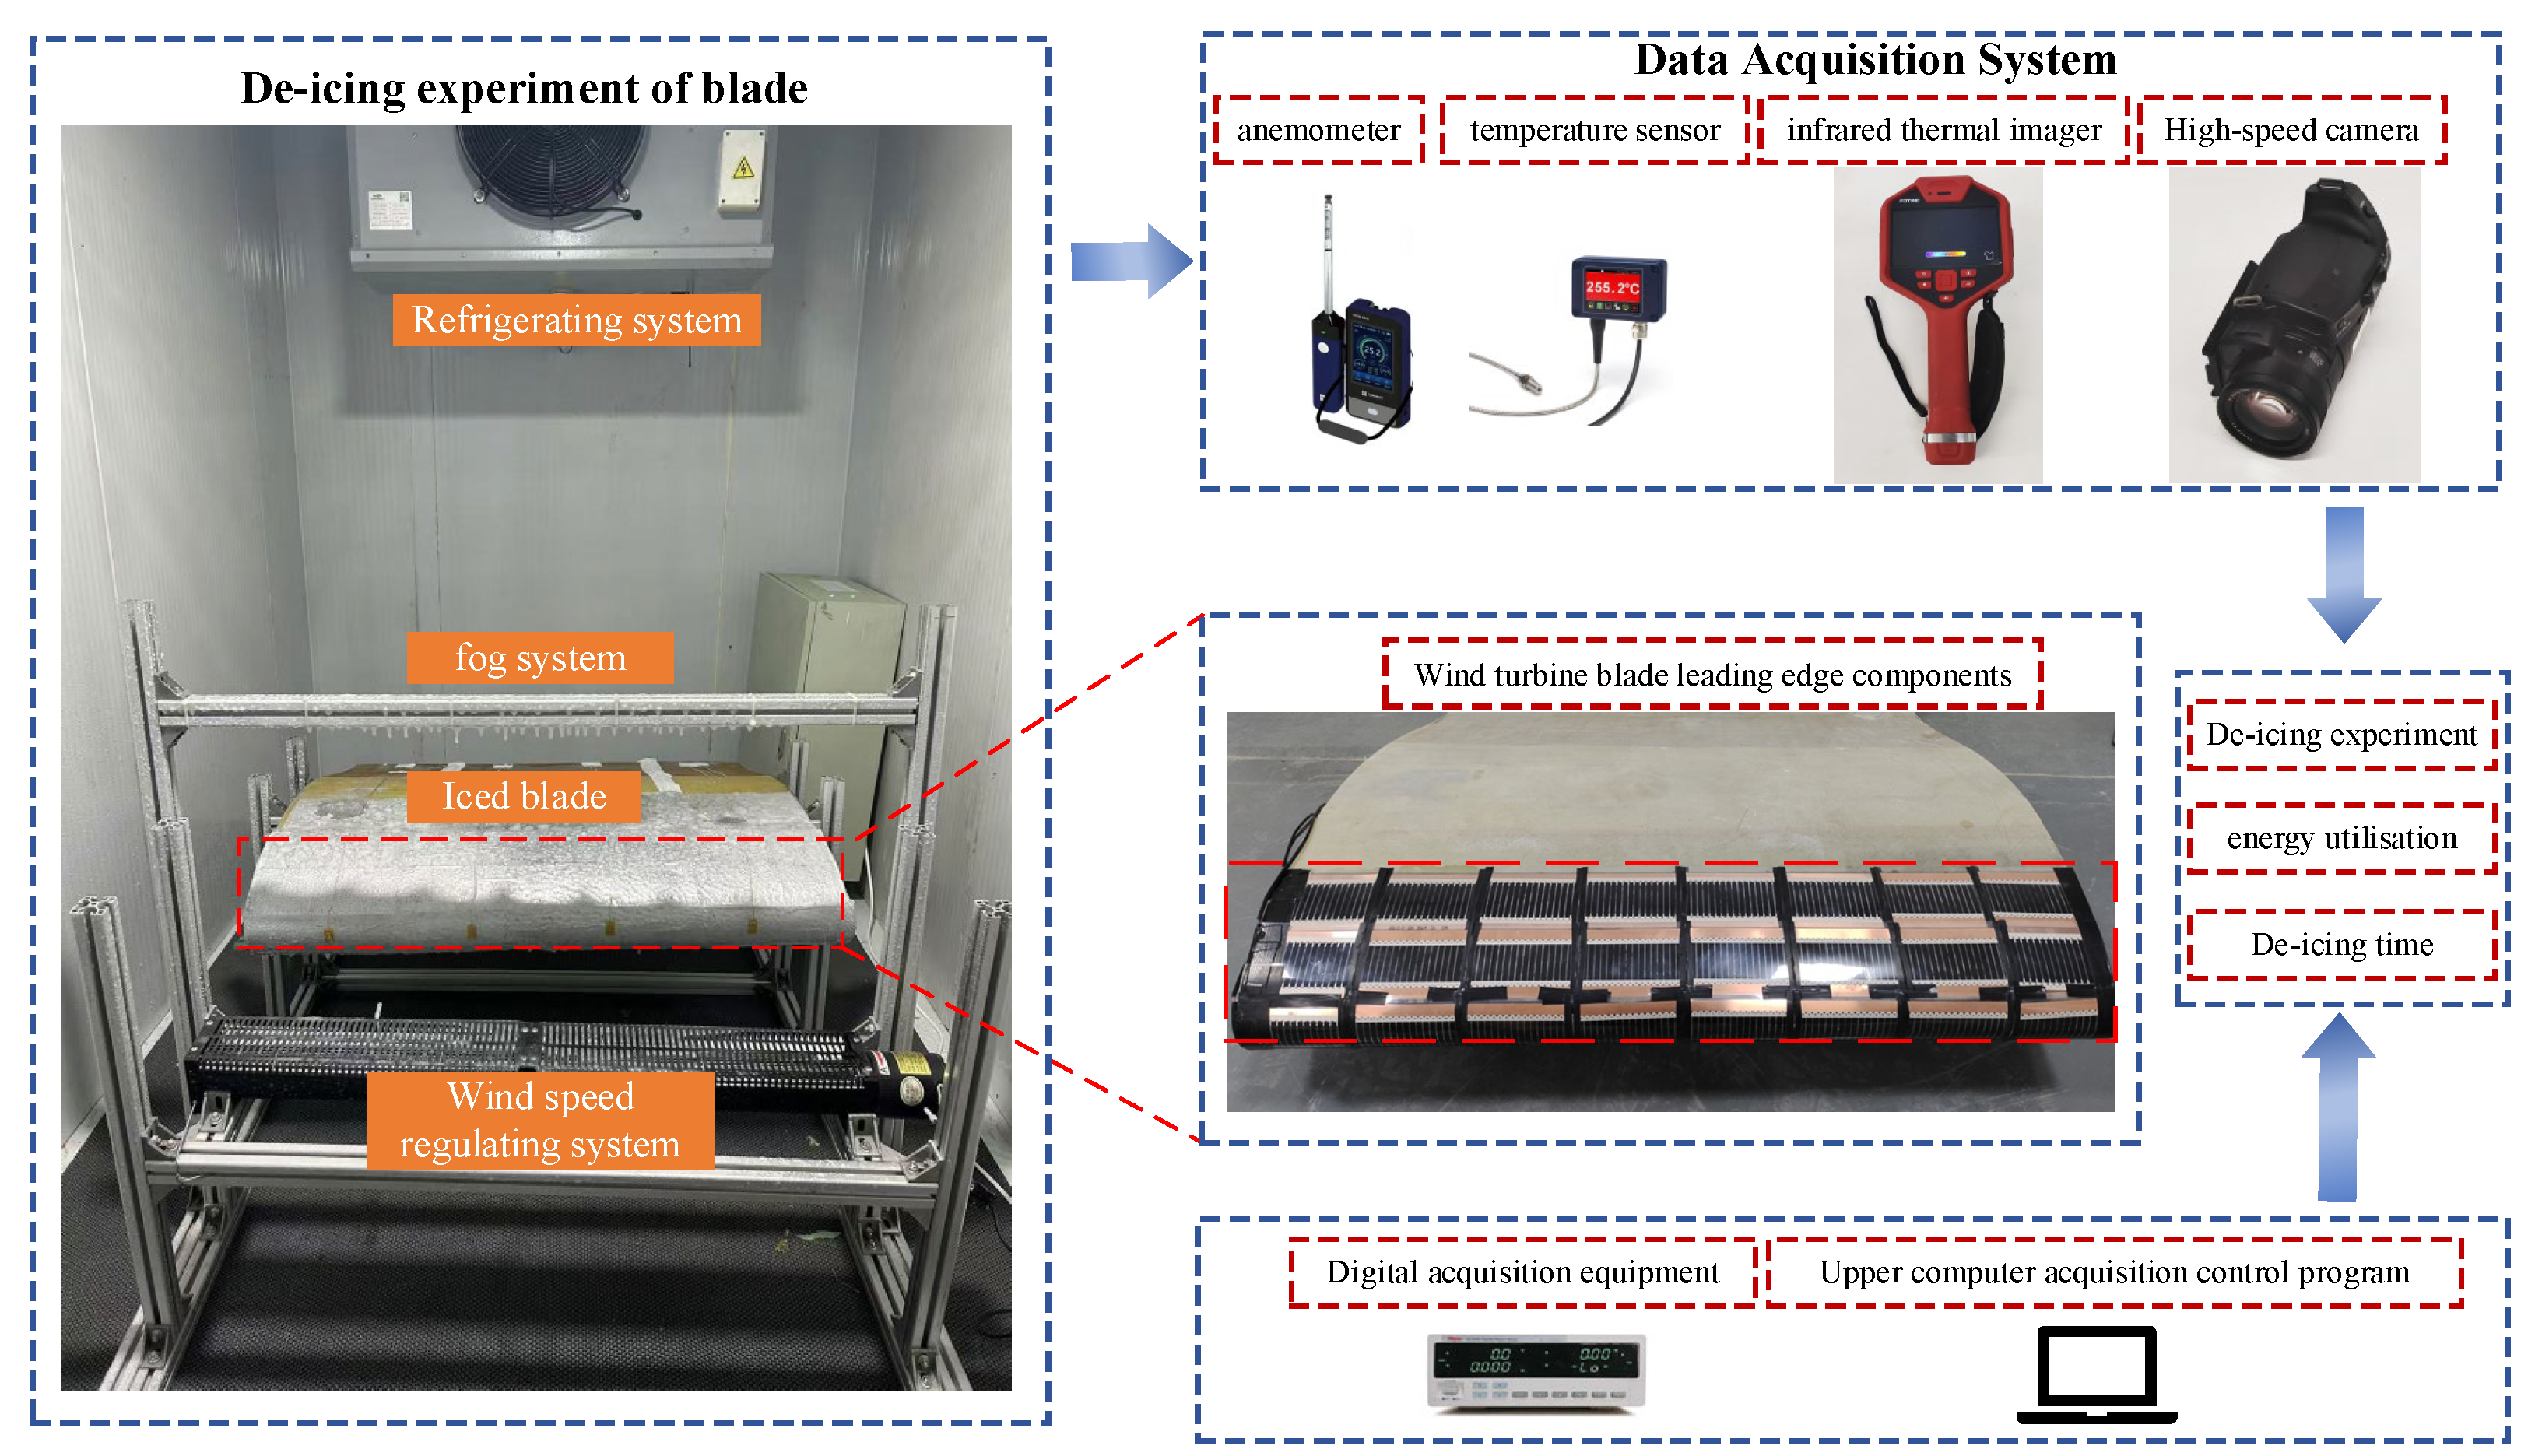
5.1. Experimental Platform Construction and Experimental Method

In order to be as close as possible to the actual operating conditions of wind turbine blades in the freezing environment, the electric deicing experiment was carried out in the self-built artificial low-temperature ice-covering laboratory. The laboratory, 6 m long, 3 m wide, and 3.2 m high, is suitable for ice-coating experiments of small components of wind power blades, as shown in Figure 16. The 1.5 m tip section of a Sinoma87.5 blade was selected as the experimental object. The experimental system mainly consisted of a refrigeration system, spray system, wind speed regulation system, and icing blade, which could provide a stable and controllable experimental environment for icing and deicing. The electric heating element uses flexible carbon crystal heating films, which are laid on each sub-heating region of the blade sample’s leading edge. The heating mode is controlled by switching the relays on and off to regulate the heating and cooling times.

5.2. Experimental Result

In this study, the physical mechanism of the deicing process was further verified by an electric heating deicing experiment. Experimental results show that ice accumulation is mainly concentrated in the area covered by 20% chord length of the leading edge of the blade, and the phenomenon shown in the experiment is basically consistent with the typical stage of the physical process described in Chapter 2, as shown in Figure 17.
In stage (a), although the surface temperature of the blade will rise rapidly, the overall temperature is still lower than the phase transition temperature of the ice sheet and there is no obvious sign of ice melting. In stage (b), infrared thermal imaging shows that most of the surface temperatures have exceeded 0 °C, and the ice edge has an obvious contraction, accompanied by slight internal crack expansion, forming an initial air gap at the interface between the blade and the ice sheet. In stage (c), most areas of the ice sheet contract, collapse or even fall off more obviously, and the air gap is connected to form an effective convection channel. The experiment verifies the existence of the air gap by interspersing a white strip at the interface between the ice sheet and the blade. The infrared thermal imaging results showed that there was a local high-temperature area on the surface of the blade exposed to the air, and the highest temperature reached 23.7 °C. The melted overflow water flows downstream along the blade, forming ice ridges in the unheated areas of the SS surface. Finally, the residual thin ice shell naturally falls off under the action of gravity and aerodynamic force.
This experiment analyzed the dynamic development process of blade surface temperature under different heating modes by monitoring the temperature sensor attached to the blade surface. Figure 18 and Figure 19, respectively, show blade surface temperature changes at different chord lengths (including leading edge stagnation point and windward side) under two heating modes.
During the initial heating phase, compared to the continuous heating mode, the cyclic heating mode has a slower initial heating rate and takes a longer time. In the stagnation phase, the temperature change is relatively stable. The time periods experienced during this phase are 110~145 s for continuous heating and 155~228 s for cyclic heating. After entering the rapid heating phase, the temperature increases rapidly. The peak temperature at the leading edge for the continuous heating mode reaches 24.2 °C, while for the cyclic heating mode, the peak temperature is only 19.1 °C. Additionally, due to the influence of wind speed, the temperature change at the leading edge lags behind that at the windward side. By comparing the experimental results with the numerical simulation results, it is found that the temperature change trends are generally consistent, thereby verifying the reliability of the numerical model. It should be noted that during the experiment, the ambient temperature Ta was always maintained at about 5 °C and the ambient wind velocity Va was maintained at 5 m/s.
The experimental results show that the leaf surface temperature presents three phases of “slow warming–phase transition stagnation–rapid warming”. As shown in Table 1, the continuous heating mode exhibits higher heating efficiency and significant deicing performance, with the final temperature stabilizing at approximately 24.3 °C, which closely matches the simulation result of 27.2 °C. In contrast, in the cyclic heating mode, the temperature fluctuates significantly, with the initial heating phase extended, and the final peak temperature notably reduced (stabilizing around 21.1 °C), leading to a weaker deicing performance. Regarding deicing time, the experimental and simulation values for both heating modes show good agreement, with a maximum deviation of about 14.7%. The experimental trends align closely with the simulated predictions, thus verifying the reliability of the numerical calculation method.
Figure 20 shows the real-time temperature errors between the simulation and experiment of the blade surface under different heating modes. During the deicing process, the experimental results closely align with the numerical simulation curve, indicating that the numerical model can accurately reflect the temperature variations in the actual deicing process. However, during the ice phase transition stage, the temperature error exhibits significant fluctuations due to factors such as latent heat absorption. Nevertheless, the maximum temperature error remains within 2 °C, which is within an acceptable range, further validating the reliability of the established numerical model.

6. Conclusions

In order to solve the problem that the deicing performance of wind turbine blades under high freezing conditions is affected by a complex flow field, a multi-physical numerical calculation model based on the coupling of flow–heat transfer phase transition was established in this study. Combined with an artificial low-temperature ice-coating experiment, the evolution law of blade surface temperature and the phase transition characteristics of ice sheets under different heating modes were systematically studied. The main conclusions are as follows:
(1)
The numerical model of deicing by electric heating under a complex flow field can effectively simulate the evolution of the leaf surface temperature field and ice layer phase transition. The results show that the deicing process can be divided into three typical stages: initial warming period, phase transition stagnation period, and rapid warming period, which has strong physical consistency and engineering guiding significance.
(2)
The enthalpy-pore method was used to effectively capture the evolution law of liquid phase water volume fraction inside the ice sheet. The results show that with the advance of the heating process, the solid–liquid phase change occurs first in a local area and an air gap is formed, and the formation and expansion of the air gap will significantly change the heat transfer path, which is the key factor for the intensification of the phase transition process and the continuous rise of blade surface temperature.
(3)
The deicing efficiency evaluation shows that there are significant differences between the two heating modes in terms of thermal response characteristics and energy efficiency. Among them, continuous heating mode has more advantages in heating rate and deicing efficiency, which is suitable for rapid deicing in extreme climates. The circulating heating mode has a good energy consumption control potential in the middle and high power range, and is suitable for the operation condition sensitive to energy consumption.
(4)
The deicing experiment by electric heating was carried out under artificial ice-covering laboratory conditions. The experimental results were in good agreement with the predicted trend, and the maximum temperature difference of the blade surface was within a reasonable range, which further verified the reliability of the numerical calculation method.

Author Contributions

J.L. contributed to conceptualization, methodology, software, validation, writing—original draft preparation, writing—review and editing, and visualization; P.Y. contributed to conceptualization, methodology, supervision, and writing—review and editing; X.H. contributed to conceptualization, methodology, software, validation, writing—review and editing, visualization, supervision; L.Z. contributed to resources and writing—review and editing; J.W. contributed to resources, formal analysis, and supervision. All authors have read and agreed to the published version of the manuscript.

Funding

This research was supported by the National Natural Science Foundation of China (Grant Number: 52304177), the Natural Science Foundation of Shandong Province (Grant No. ZR2024ME250 and ZR2024ME003) and 2023 Shandong Province Science and Technology Small and Medium-Sized Enterprise Innovation Capability Enhancement Project (2023TSGC1002).

Data Availability Statement

The numerical simulation models, raw experimental measurements, and processed datasets generated during the current study are not publicly available due to institutional policy but are available from the corresponding author on reasonable request.

Acknowledgments

The authors gratefully acknowledge the financial support from the National Natural Science Foundation of China (Grant No. 52304177) and the Natural Science Foundation of Shandong Province (Grant No. ZR2024ME250 and ZR2024ME003). We also wish to express our sincere thanks to Dongfang Electric Wind Power Co., Ltd., for their invaluable support in this research. Furthermore, we are deeply appreciative of the anonymous reviewers for their insightful and constructive feedback, which greatly enhanced the quality of this manuscript.

Conflicts of Interest

The authors declare no competing financial or commercial interests that could have influenced the research outcomes. Although this work was partially supported by the Company, the funding body had no role in study design, data collection and analysis, decision to publish, or preparation of the manuscript.

References

  1. Global Wind Energy Council. GWEC’s Global Wind Report 2024. Available online: https://www.gwec.net/reports/globalwindreport/2024 (accessed on 18 May 2025).
  2. Martinez, A.; Iglesias, G. Global wind energy resources decline under climate change. Energy 2024, 288, 129765. [Google Scholar] [CrossRef]
  3. Battisti, L. Wind Turbines in Cold Climates; Springer: Cham, Switzerland, 2015. [Google Scholar]
  4. Rasmussen, F.; Hansen, M.H.; Thomsen, K.; Larsen, T.J.; Bertagnolio, F.; Johansen, J.; Madsen, H.A.; Bak, C.; Hansen, A.M. Present status of aeroelasticity of wind turbines. Wind. Energy 2003, 6, 213–228. [Google Scholar] [CrossRef]
  5. Seifert, H.; Westerhellweg, A. Risk analysis of ice throw from wind turbines. Boreas 2003, 6, 2006. [Google Scholar]
  6. Homola, C.M.; Nicklasson, J.P.; Sundsbø, A.P. Ice sensors for wind turbines. Cold Reg. Sci. Technol. 2006, 46, 125–131. [Google Scholar] [CrossRef]
  7. Hochart, C.; Fortin, G.; Perron, J.; Ilinca, A. Icing simulation of wind turbine blades. In Proceedings of the 45th AIAA Aerospace Sciences Meeting and Exhibit, Reno, Nevada, USA, 8–11 January 2007; Volume 1373. [Google Scholar]
  8. Lamraoui, F.; Fortin, G.; Benoit, R.; Perron, J.; Masson, C. Atmospheric icing impact on wind turbine production. Cold Reg. Sci. Technol. 2014, 117, 10036–10049. [Google Scholar] [CrossRef]
  9. Pourbagian, M.; Habashi, W.G. Aero-thermal optimization of in-flight electro-thermal ice protection systems in transient de-icing mode. Int. J. Heat FluidFlow 2015, 54, 167–182. [Google Scholar] [CrossRef]
  10. Sabatier, J.; Lanusse, P.; Feytout, B.; Gracia, S. CRONE control based anti-icing/deicing system for wind turbine blades. Control. Eng. Pract. 2016, 56, 200–209. [Google Scholar] [CrossRef]
  11. Fakorede, O.; Feger, Z.; Ibrahim, H.; Ilinca, A.; Perron, J.; Masson, C. Ice protection systems for wind turbines in cold climate: Characteristics, comparisons and analysis. Renew. Sustain. Energy Rev. 2016, 65, 662–675. [Google Scholar] [CrossRef]
  12. Hu, L.; Zhu, X.; Hu, C.; Chen, J.; Du, Z. Wind turbines ice distribution and load response under icing conditions. Renew. Energy 2017, 113, 608–619. [Google Scholar] [CrossRef]
  13. Wang, Y.; Xu, Y.; Lei, Y. An effect assessment and prediction method of ultrasonic de-icing for composite wind turbine blades. Renew. Energy 2018, 118, 1015–1023. [Google Scholar] [CrossRef]
  14. Wang, Y.; Jiang, X. Design Research and Experimental Verification of the Electro-Impulse De-Icing System for Wind Turbine Blades in the Xuefeng Mountain Natural Icing Station. IEEE Access 2020, 8, 28915–28924. [Google Scholar] [CrossRef]
  15. Makkonen, L.; Laakso, T.; Marjaniemi, M.; Finstad, K.J. Modeling and prevention of ice accretion on wind turbines. Wind. Eng. 2001, 25, 3–21. [Google Scholar] [CrossRef]
  16. Battisti, L.; Fedrizzi, R. 2D numerical simulation of a wind turbine de-icing system, using cycled heating. Wind. Eng. 2007, 31, 33–42. [Google Scholar] [CrossRef]
  17. Villalpando, F.; Reggio, M.; Ilinca, A. Prediction of ice accretion and anti-icing heating power on wind turbine blades using standard commercial software. Energy 2016, 114, 1041–1052. [Google Scholar] [CrossRef]
  18. Hochart, C.; Fortin, G.; Perron, J.; Ilinca, A. Wind turbine performance under icing conditions. Wind. Energy 2008, 11, 319–333. [Google Scholar] [CrossRef]
  19. Yiqiang, H.; Jose, P. Surface Roughness and Heat Transfer Improved Predictions for Aircraft Ice-Accretion Modeling. AIAA J. 2017, 55, 1318–1331. [Google Scholar]
  20. Barber, S. The Impact of Ice Formation on Wind Turbine Performance and Aerodynamics. J. Sol. Energy Eng. 2011, 133, 174. [Google Scholar] [CrossRef]
  21. Bose, N. Icing on a small horizontal-axis wind turbine-Part 1: Glaze ice profiles. J. Wind. Eng. Ind. Aerodyn. 1992, 45, 75–85. [Google Scholar] [CrossRef]
  22. Mayer, C.; Ilinca, A.; Fortin, G.; Perron, J. Wind tunnel study of electro-thermal de-icing of wind turbine blades. Int. J. Offshore Polar Eng. 2007, 17, 174. [Google Scholar]
  23. Shu, L.; Qiu, G.; Hu, Q.; Jiang, X.; Wang, P.; Xia, H. Numerical Model and Field Experimental Investigation of Threshold Heat Flux of Wind Turbine De-icing. Proc. CSEE 2018, 38, 3997–4003+4041. [Google Scholar]
  24. Shu, L.; Qiu, G.; Hu, Q.; Jiang, X.; McClure, G.; Liu, Y. Numerical and experimental investigation of threshold de-icing heat flux of wind turbine. J. Wind. Eng. Ind. Aerodyn. 2018, 174, 296–302. [Google Scholar] [CrossRef]
  25. Shu, L.; Liang, J.; Hu, Q.; Jiang, X.; Ren, X.; Qiu, G. Sudy on SmallWind Turbine lcing and Its Performance. Cold Reg. Sci. Technol. 2017, 134, 11–19. [Google Scholar] [CrossRef]
  26. Guo, W.; Zhang, Y.; Li, Y.; Tagawa, K.; Zhao, B. A wind tunnel experimental study on the icing characteristics of a cylinder rotating around a vertical axis. Appl. Sci. 2021, 11, 10383. [Google Scholar] [CrossRef]
  27. Li, X.; Chi, H.; Li, Y.; Xu, Z.; Guo, W.; Feng, F. An experimental study on blade surface de-Icing characteristics for wind turbines in rime ice condition by electro-thermal heating. Coatings 2024, 14, 94. [Google Scholar] [CrossRef]
  28. Xu, P.; Zhang, D.; Gao, W.; Li, A. Development of de-icing method with combined excitation of ultrasonic guided waves and different types of low-frequency vibrations. Appl. Acoust. 2024, 221, 110034. [Google Scholar] [CrossRef]
  29. Li, P.; Kang, Y.; Song, Y.; He, X. Transient simulation and analysis of wing electrothermal ice protection system. J. Eng. 2018, 13, 438–445. [Google Scholar]
Figure 1. Actual situation of wind turbine blade icing.
Machines 13 00483 g001
Figure 2. Thermal resistance arrangement.
Machines 13 00483 g002
Figure 3. The physical process of ice melting on a blade-spreading airfoil.
Machines 13 00483 g003
Figure 4. The heat flow term and heat transfer process in the process of electro-thermal deicing of blades.
Machines 13 00483 g004
Figure 5. Solution ideas of flow–heat transfer coupling method.
Machines 13 00483 g005
Figure 6. Geometric model of electro-thermal deicing for wind turbine blades.
Machines 13 00483 g006
Figure 7. Calculation domain size and boundary condition settings.
Machines 13 00483 g007
Figure 8. Comparison of two heating modes: (a) continuous heating mode and (b) cyclic heating mode. Where, t h is the heating time of a single cycle; t w t h is the cooling time, which refers to the time when the power supply to a specific region is turned off; ① to ④ represent the heating zones.
Machines 13 00483 g008
Figure 9. Model mesh is divided into near-field views. (a) Computational domain tangential interface mesh and (b) ice-covered blade surface grid.
Machines 13 00483 g009
Figure 10. Mesh independence verification results.
Machines 13 00483 g010
Figure 11. The temperature field distribution of the blade deicing process under continuous heating mode.
Machines 13 00483 g011
Figure 12. The blade surface temperature rise curves under the two heating modes.
Machines 13 00483 g012
Figure 13. The volume fraction of the liquid phase at the ice–skin interface during the melt phase transition.
Machines 13 00483 g013
Figure 14. The liquid phase volume fraction on the inner surface of the ice layer.
Machines 13 00483 g014
Figure 15. The analysis of deicing time and average energy consumption under the two heating modes. (a) Comparison of deicing time between two heating modes and (b) comparison of average energy consumption between the two heating modes.
Machines 13 00483 g015
Figure 16. The laboratory of artificial icing and the experimental platform of electro-thermal deicing were built.
Machines 13 00483 g016
Figure 17. Photography of blade electric deicing process under artificial icing laboratory conditions.
Machines 13 00483 g017
Figure 18. Temperature curves of the blade surface at different positions under continuous heating.
Machines 13 00483 g018
Figure 19. Experimental temperature curves of blade surface at different positions under cyclic heating control.
Machines 13 00483 g019
Figure 20. Temperature error curves of numerical simulation and experiment under two heating modes.
Machines 13 00483 g020
Table 1. Comparison between experimental data and numerical simulations.
Heating ModeVa (m/s)Ta (°C)Peak Temperature (°C)Deicing Time (s)
SimulationExperimentalSimulationExperimental
continuous heating5.0−4.927.224.3115132
cyclic heating 5.0−5.124.521.1283302
Disclaimer/Publisher’s Note: The statements, opinions and data contained in all publications are solely those of the individual author(s) and contributor(s) and not of MDPI and/or the editor(s). MDPI and/or the editor(s) disclaim responsibility for any injury to people or property resulting from any ideas, methods, instructions or products referred to in the content.

