Article

Efficient and Explainable Bearing Condition Monitoring with Decision Tree-Based Feature Learning

1
ITD Lab, School of Mechanical Engineering, Hanoi University of Science and Technology, Hanoi 100000, Vietnam
2
Faculty of Mechanical Engineering, Thuyloi University, Hanoi 100000, Vietnam
3
Department of Mechanical Engineering, Ming Chi University of Technology, New Taipei City 24301, Taiwan
*
Author to whom correspondence should be addressed.
Machines 2025, 13(6), 467; https://doi.org/10.3390/machines13060467
Submission received: 28 April 2025 / Revised: 18 May 2025 / Accepted: 26 May 2025 / Published: 28 May 2025

Abstract

Bearings are critical components in rotating machinery, where early fault detection is essential to prevent unexpected failures and reduce maintenance costs. This study presents an efficient and interpretable framework for bearing condition monitoring by combining the Wavelet Packet Transform (WPT)-based feature extraction with a Decision Tree (DT) classifier. The WPT technique decomposes vibration signals into multiple frequency bands to extract energy-based features that capture key fault characteristics. Leveraging these features, the DT classifier provides transparent diagnostic rules, enabling a clear understanding of the decision-making process. The proposed method offers a superior balance between diagnostic accuracy, computational efficiency, and explainability compared to conventional black-box models. It is well suited for real-time and resource-constrained industrial applications. Furthermore, feature importance analysis reveals the most influential frequency components associated with different fault types, offering valuable insights for predictive maintenance strategies. The proposed WPT-DT framework represents a practical and scalable solution for intelligent fault diagnosis in the context of Industry 4.0 and smart maintenance systems.

1. Introduction

Rotating machinery such as gearboxes, wind turbines, compressors, and railway axles plays an indispensable role in industrial systems. Bearings, as critical components, support rotational motion and load transfer. However, they are susceptible to localized damage due to continuous mechanical stress. Even minor defects, such as spalls on races or rolling elements, can lead to significant performance degradation or catastrophic failure if undetected. Consequently, early and accurate bearing fault detection has become a major research focus, especially with the shift toward predictive maintenance and intelligent manufacturing. While traditional methods have relied heavily on expert knowledge and threshold-based signal analysis, modern approaches increasingly adopt data-driven techniques to identify weak and compound faults under varying operational conditions. This transition is driven by the rising demand for real-time monitoring, fault prediction, and cost-effective maintenance strategies, particularly for high-value, safety-critical assets.
The emergence of artificial intelligence (AI) has profoundly reshaped mechanical fault diagnosis, transitioning from traditional signal demodulation and statistical techniques to machine learning (ML) and deep learning (DL) methods. These data-driven approaches enable automatic feature extraction, robust performance under diverse conditions, and the effective classification of both known and unseen fault patterns. A comprehensive review of 50 recent studies focusing on vibration-based condition monitoring reveals notable trends. Among the 31 studies with clearly articulated methodologies, approximately 62% employed AI-based approaches to enhance monitoring precision and predictive maintenance, whereas 38% continued to utilize traditional analytical techniques, such as time–frequency analysis, empirical mode decomposition, and statistical modeling (Figure 1).
The increasing dominance of AI reflects its advantages in handling noisy, non-stationary data and performing complex fault classification. Studies such as [1,2,3] explored adversarial learning for domain adaptation, while [4,5,6] applied CNN-based spatial–temporal fusion of vibration and acoustic signals. Others [7,8,9] emphasized the shift from manual feature engineering to deep feature learning through convolutional and attention mechanisms. Despite their strengths, AI methods face critical limitations. Deep learning models often require extensive labeled datasets and significant computational resources, and typically lack interpretability. Studies [10,11,12] highlighted deployment challenges, particularly in embedded systems. Although lightweight alternatives using shallow networks have been proposed [13,14,15], many still operate as black boxes, impeding transparency and trustworthiness. Meanwhile, the performance of Support Vector Machines (SVMs) heavily depends on the chosen kernel function and its parameters, such as the RBF kernel’s γ value [16].
These challenges have renewed interest in interpretable models such as Decision Trees, which offer transparency, efficiency, and generalizability, making them suitable for industrial applications. Furthermore, successful diagnostic research must align methodological choices with the specific dynamic behaviors and fault signatures of components like bearings, gears, rotors, planetary gearboxes, and wind turbines. Among the 38 reviewed studies, 35 explicitly stated their diagnostic targets. Bearings dominated with 16 studies, followed by gears (8 studies), planetary gearboxes (5 studies), and wind turbines (3 studies) (Figure 2). This emphasis reflects both the critical role of bearings in industrial systems and the wide availability of benchmark datasets such as CWRU, Paderborn, and Southwest Jiaotong University.
Bearings are particularly significant due to their ubiquity, criticality, and the subtlety of early failure signatures, which make early detection challenging but essential. Researchers have explored a wide range of AI and non-AI methods for bearing fault diagnosis. For instance, studies [7,9,17] integrated sound and vibration fusion, while [6,18,19] leveraged multi-scale CNNs for multi-dataset fault classification. Studies [1,2,11] addressed domain adaptation, while [14,20,21] focused on adaptive signal processing. Conversely, studies on gears (e.g., [22,23,24,25]), planetary gearboxes (e.g., [26,27,28]), and wind turbines (e.g., [10,29,30]) addressed unique challenges such as compound meshing faults, complex modulations, and variable-speed conditions. Although less common, studies on gas turbines [31], sensors [32], and rotors [33] further demonstrated the diversity of mechanical applications.
While deep learning-based diagnostics have driven significant progress, persistent issues remain. Deep models require vast labeled datasets [6,8,25], have high computational costs, and suffer from a lack of interpretability [10,11,12]. Despite attempts at model simplification through lightweight CNNs [13], shallow–deep hybrids [14], and adaptive parameter reduction [15], a fundamental trade-off between explainability, robustness, and deployment feasibility remains unresolved. Traditional diagnostic methods, including envelope analysis [20,22,34], EMD and EEMD decomposition [21,33,35], and statistical feature-based classification [12], offer better interpretability and lower computational requirements. However, they often struggle with non-stationary signals, noise sensitivity, and poor adaptability under variable conditions [27,29,33]. In response to these challenges, this study proposes a bearing fault classification framework based on the Decision Tree (DT) algorithm, aiming to bridge the gap between explainability, efficiency, and diagnostic performance. Unlike black-box models, DTs provide hierarchical if–then rules, offering clear interpretability and fast inference, which are crucial for real-time, resource-constrained industrial environments. Previous research in fields such as biomedical signal classification [26] and structural health monitoring [36] has demonstrated the promise of DTs for interpretable and lightweight diagnostic tasks.
Although ensemble-based tree methods like Random Forests [37] and Gradient Boosting [24] have been explored, standalone Decision Trees have received limited attention for bearing diagnostics. This study addresses this gap by demonstrating that a simple DT classifier, trained on WPT-derived energy features extracted from vibration signals, can achieve highly effective bearing fault classification while maintaining complete transparency and a low computational overhead. Bearings account for approximately 30–40% of machine failures, making their reliable condition monitoring critical. An analysis of 44 recent studies (Figure 2) shows that bearing-related research constitutes the largest share (46%) among rotating machinery components. Bearing failures not only result in costly repairs and downtime but also pose significant safety risks, such as catastrophic failures in wind turbines and helicopter transmissions. These challenges underscore the necessity of developing practical, efficient, and interpretable diagnostic methods.
To address the aforementioned limitations of both traditional and deep learning-based diagnostic methods, this study proposes an efficient and explainable approach for bearing condition monitoring. By combining Wavelet Packet Transform (WPT)-based energy feature extraction with a Decision Tree (DT) classifier, the proposed framework aims to achieve a balanced solution that ensures diagnostic accuracy, computational efficiency, and model interpretability. This approach not only reduces reliance on large labeled datasets and intensive computational resources but also provides transparent decision-making processes, making it particularly suitable for real-time, resource-constrained industrial applications. To the best of the authors’ knowledge, this is the first application of the wavelet-packet transform combined with a decision-tree algorithm for bearing fault diagnosis, yielding promising results.
The major contributions of this study are summarized as follows: Firstly, a lightweight and fully interpretable framework for bearing condition monitoring is developed by integrating Wavelet Packet Transform (WPT)-based energy feature extraction with a Decision Tree (DT) classifier, offering an efficient and explainable alternative to complex black-box models. Secondly, utilizing energy distributions across multiple frequency bands, the proposed method enhances the discrimination of different fault types, enabling fast and reliable classification under diverse operational conditions. Thirdly, the approach emphasizes model transparency through feature importance analysis, offering valuable insights into the diagnostic process and supporting practical deployment in real-time, resource-constrained industrial environments. Finally, validation using publicly available bearing datasets confirms the effectiveness and scalability of the proposed WPT-DT framework for intelligent predictive maintenance applications.
The remainder of this paper is organized as follows: Section 2 presents the proposed methodology, including the Wavelet Packet Transform for feature extraction and the Decision Tree classification approach. Section 3 describes the experimental setup, data preparation, model training procedures and experimental results, including performance evaluation and feature importance analysis. Finally, Section 4 concludes the paper and outlines potential directions for future research.

2. Methodology

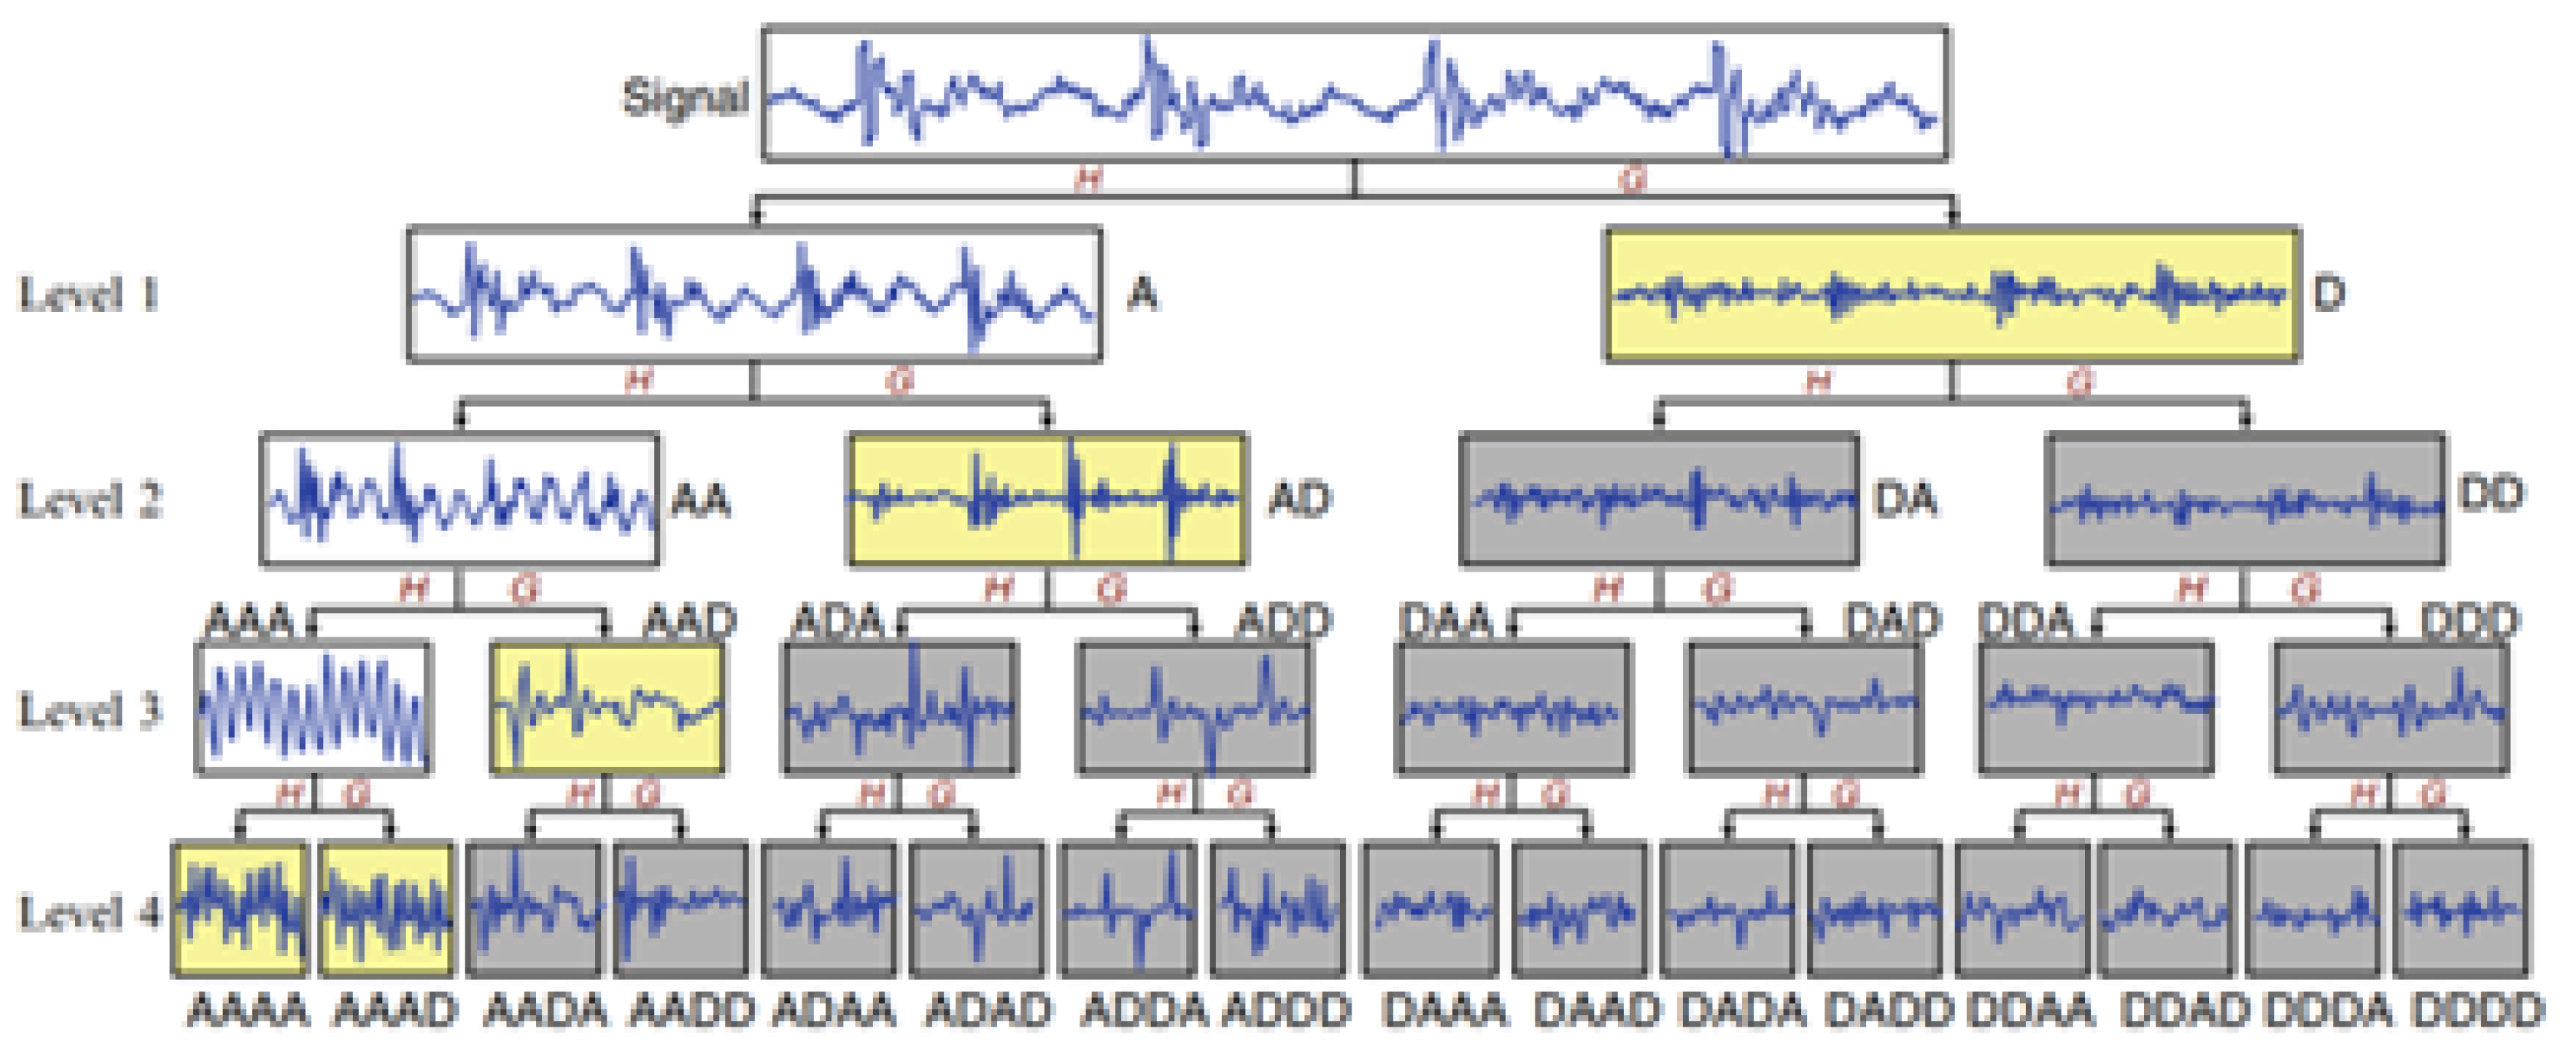
2.1. Wavelet Packet Transfrom
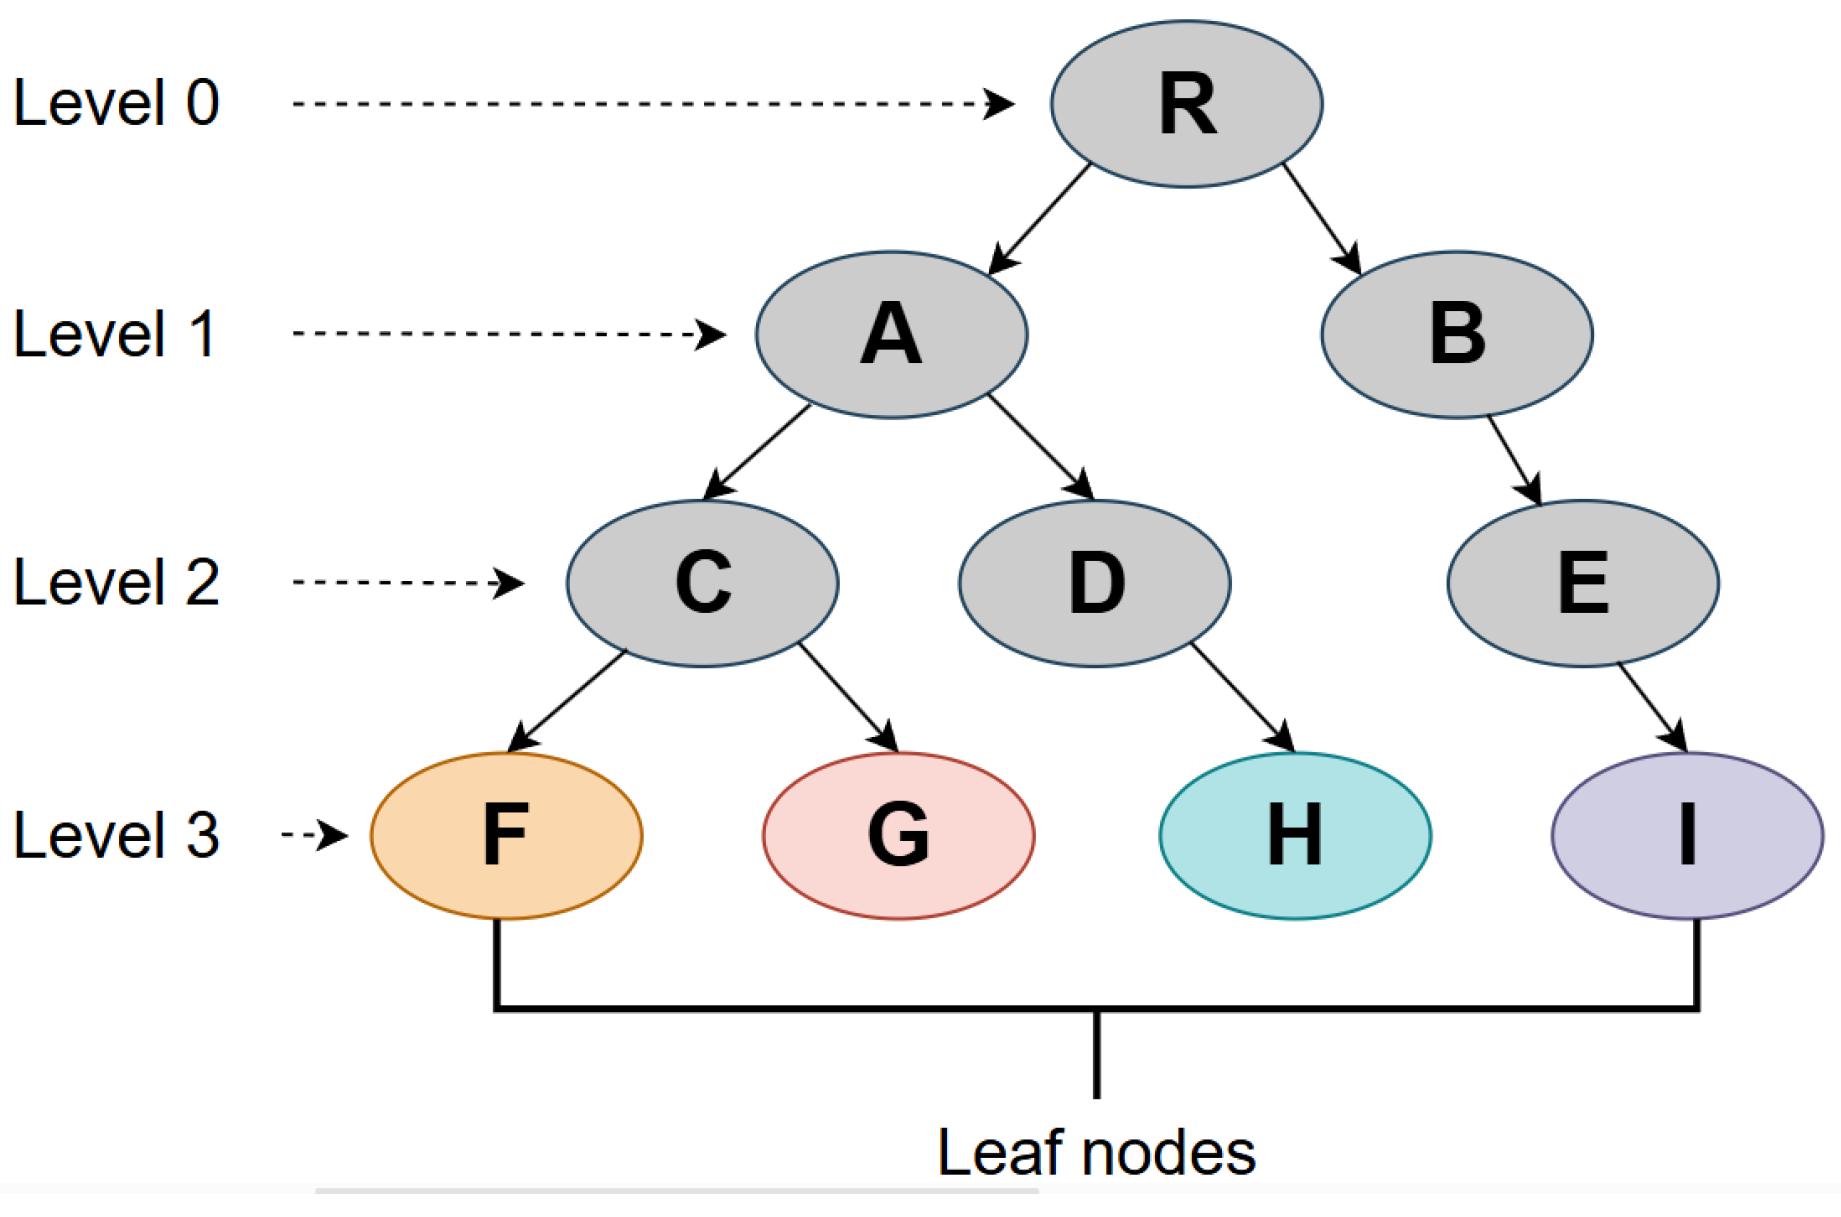
The Wavelet Packet Transform builds upon the traditional Wavelet Transform, offering a sophisticated approach to signal processing. In contrast to the Discrete Wavelet Transform (DWT), which limits its decomposition to only the approximation coefficients at each stage, WPT processes both the approximation and detail coefficients further. This creates a complete binary tree structure of subbands, referred to as the wavelet packet tree as shown in Figure 3. Through this layered decomposition, WPT achieves a more detailed breakdown of frequency bands than DWT, leading to improved clarity in both the time and frequency domains. Its ability to repeatedly divide both coefficient types makes WPT especially adept at handling transient and non-stationary signals, such as those found in fault diagnosis scenarios. The mathematical basis of the wavelet packet transform for a signal x(t) is outlined in Equation (1), highlighting its role in multi-resolution analysis. This capability to explore a broader range of signal features makes WPT a versatile tool for complex signal characterization.
x p n , j = 2 j / 2 + x ( t ) μ n 2 j t p ¯ d t
The function μ n ( t ) represents the wavelet packet, where j indicates the decomposition level, also known as the scale parameter; p denotes the position parameter; and n refers to the number of packets resulting from the decomposition process. For a given signal x ( t ) , decomposed using WPT, the decomposition is expressed as
W 2 n j + 1 ( t ) = 2 l = + h [ l ] W n j ( t 2 j l )
W 2 n + 1 j + 1 ( t ) = 2 l = + g [ l ] W n j ( t 2 j l )
Quadrature Mirror Filters (QMFs) are operators g and h where their Z-transform, G and H, respectively, need to meet the following orthogonality requirements:
H G * = G H * H H * = G G * = I
Compared to using the decomposition coefficients directly, the energy calculation method of each packet from the decomposition WPT is a more reliable signal representation. The following provides the energy related to the wavelet packet decomposition:
E i = + x j i ( t ) d t
The total energy of the signal is expressed as
E tot = i = 1 2 j E i
E i is a description of each subband’s energy. The energy of each packed wavelet is represented by the normalized energy value, which is provided by
P l = E i E tot
where P l denotes the probability distribution of energy in each subband.

2.2. Decision Tree

Classification and Regression Trees (CARTs) is a supervised machine learning algorithm used for classification and regression tasks by constructing a binary Decision Tree structured as shown in Figure 3. CART systematically partitions data into subsets based on feature values, with each node representing a decision rule. The core objective is to minimize the impurity in the nodes, which is mainly measured by the Gini impurity index for classification problems.
Figure 4 is an example hierarchy with three levels. The Gini impurity index quantifies the likelihood of misclassification when randomly assigning a class based on class distributions within a dataset. It is calculated for dataset D as follows:
Gini ( D ) = 1 i = 1 c p i 2
where we have the following:
-
p i is the proportion of samples belonging to class i in the dataset D.
-
c is the total number of classes (four classes in this study: normal, outer race fault, inner race fault, and ball fault).
A Gini impurity of 0 indicates perfect classification (all samples belong to one class), while a value close to 1 indicates high impurity and poor classification.
In CART, the selection of optimal splits at each node directly relies on the Gini impurity index. The algorithm evaluates all possible splits across features, selecting the split that maximally reduces the Gini impurity, thereby improving the clarity and predictive accuracy of the tree. The impurity reduction ( Δ Gini ) for a binary split is computed as
Δ Gini = Gini ( D ) D L | D | Gini D L + D R | D | Gini D R
where we have the following:
-
D is the original dataset at the node.
-
D L and D R are the left and right child nodes after the split, respectively.
-
| D | , D L , and D R represent the number of samples in each respective dataset.
Lower Gini values lead to a clearer separation between classes, resulting in more accurate predictions and simpler decision rules. Conversely, higher Gini values indicate ambiguity and complexity within nodes, often requiring deeper trees for adequate classification.
This splitting continues recursively until meeting one of the following stopping criteria:
-
All samples within a node belong to the same class.
-
The number of samples in a node falls below a minimum threshold (typically set to 2 by default in scikit-learn).
-
The maximum allowable tree depth is reached.
Each leaf node ultimately represents a specific predicted class, facilitating clear diagnostic interpretation.

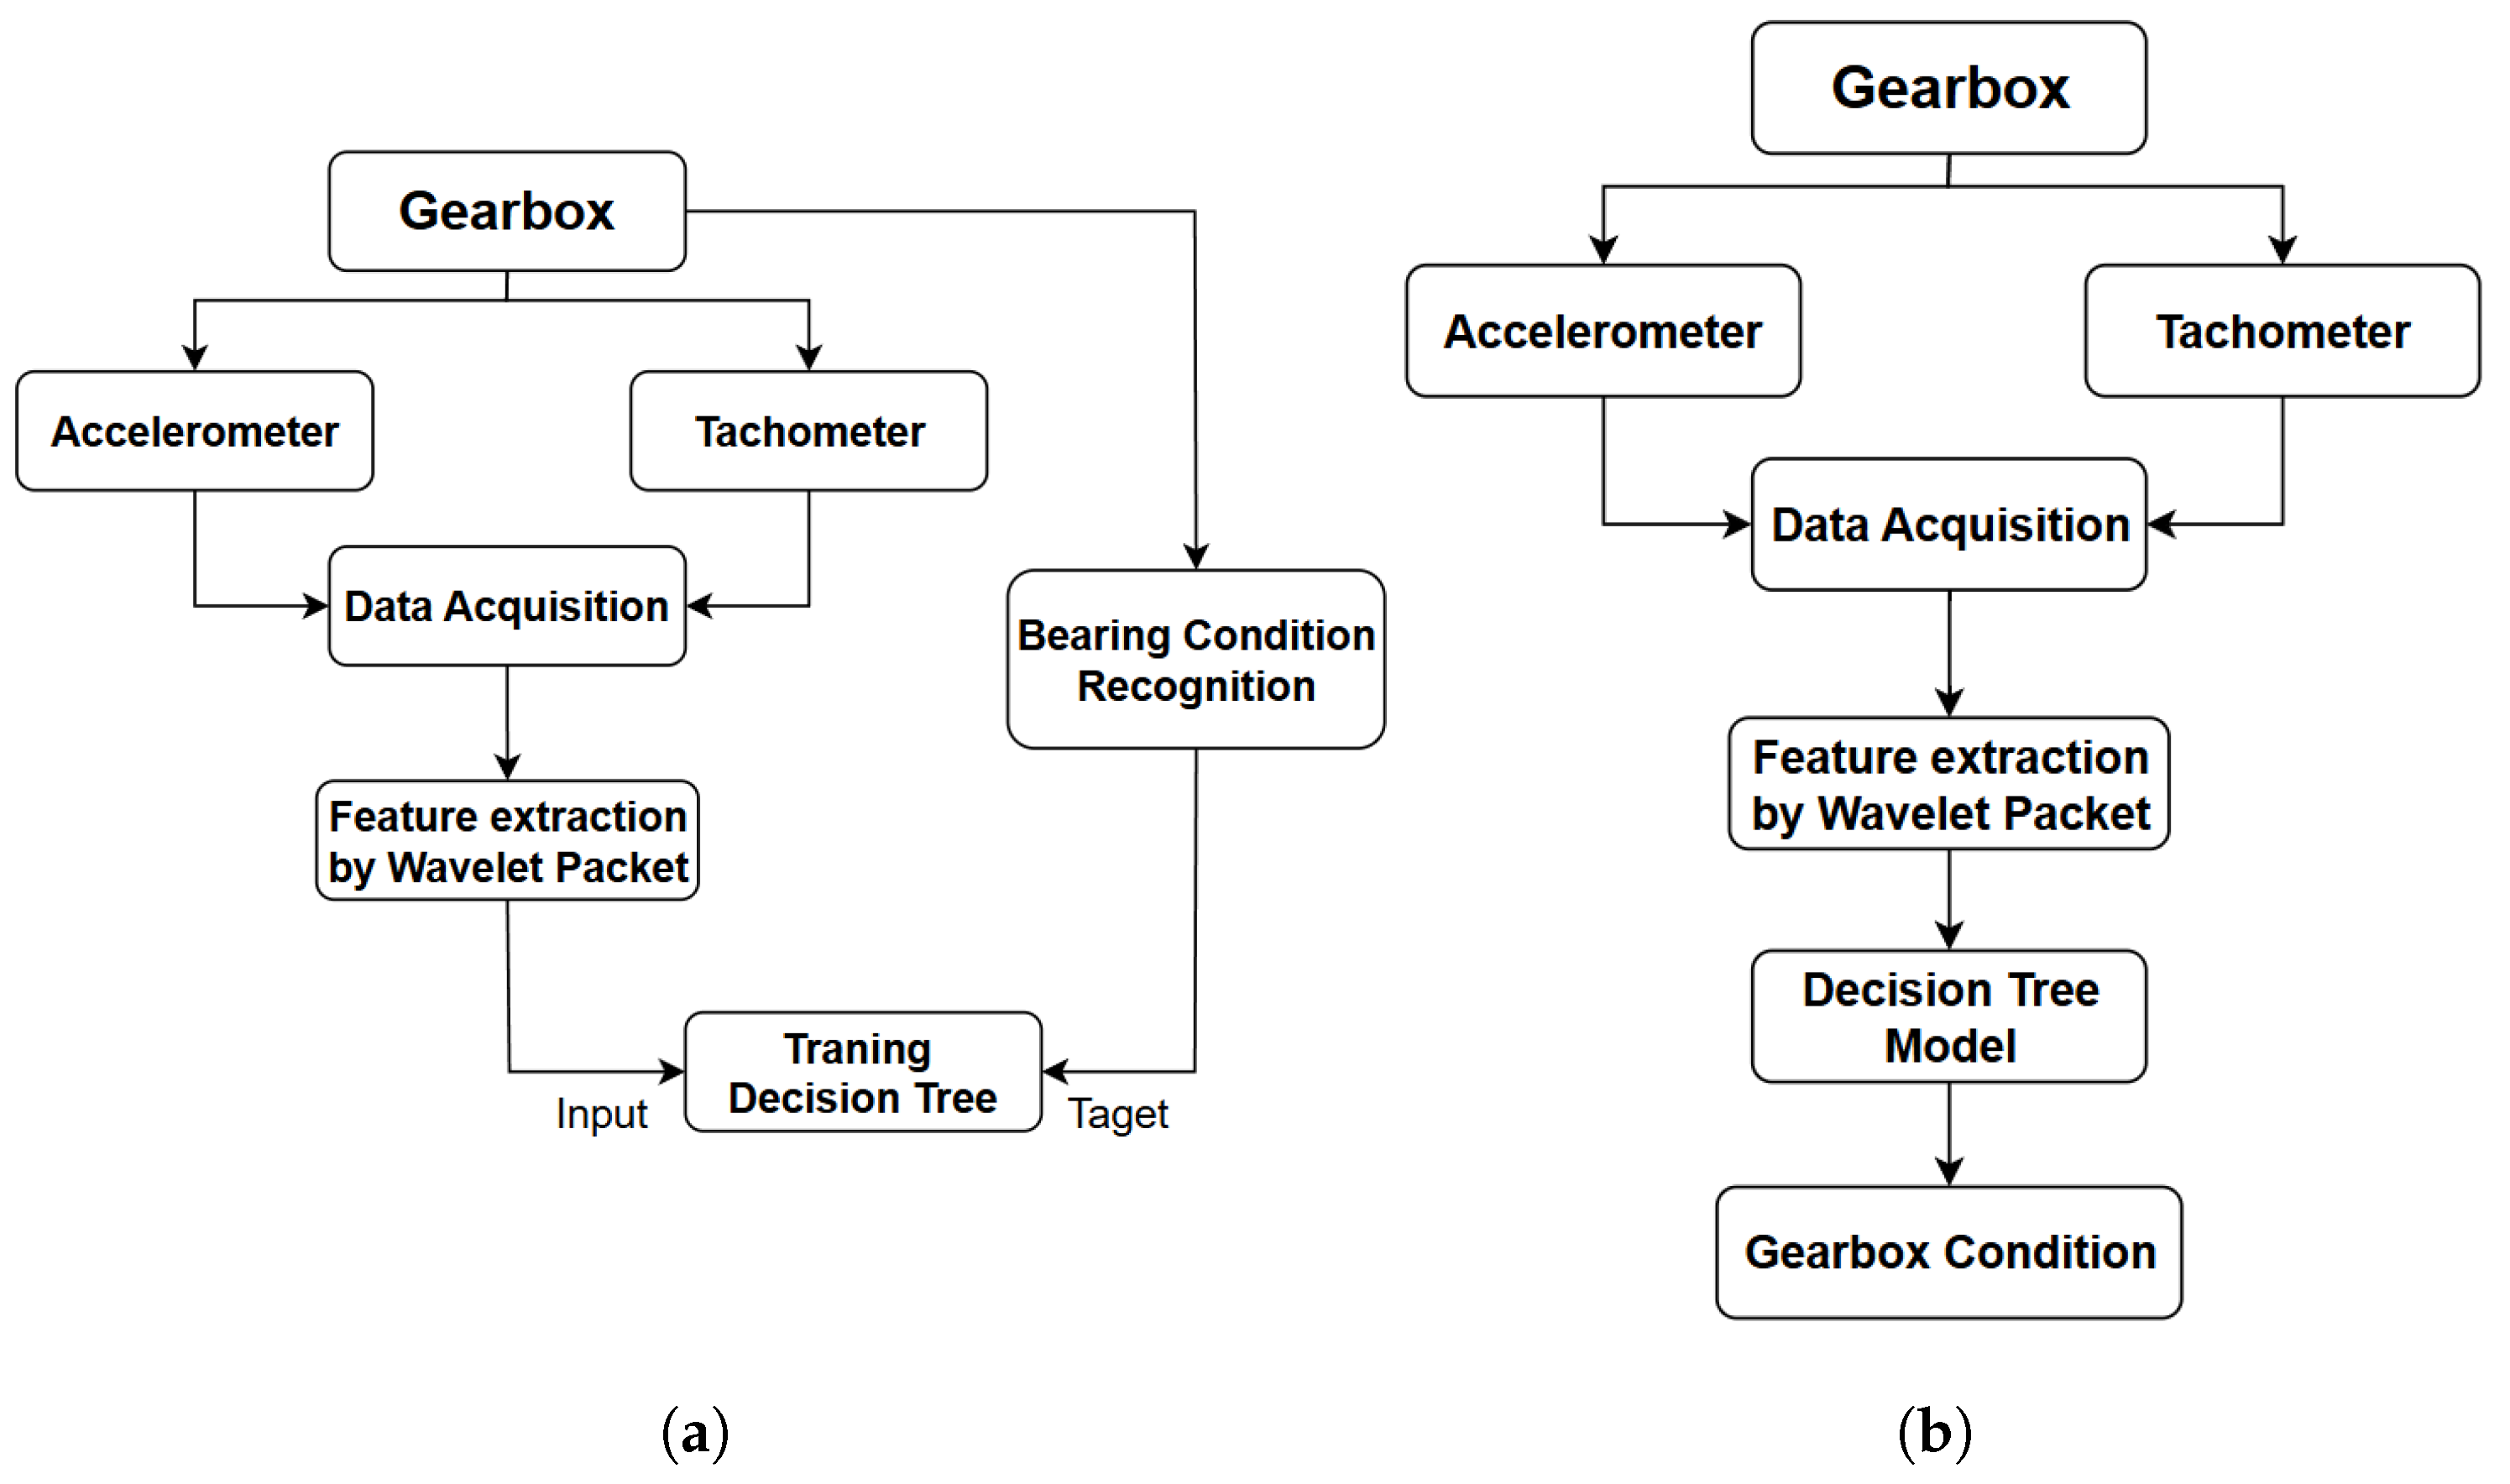
2.3. Implementation Process Diagram

The block diagram of the proposed WPT-DT-based bearing fault diagnosis framework is shown in Figure 5. The method involves three key steps: First, vibration signals and rotation speeds are acquired from the gearbox. Second, these signals are processed using the WPT algorithm to extract relevant features. Finally, a decision tree model is trained and tested using these features for real-time bearing fault classification.

3. Experimental Test

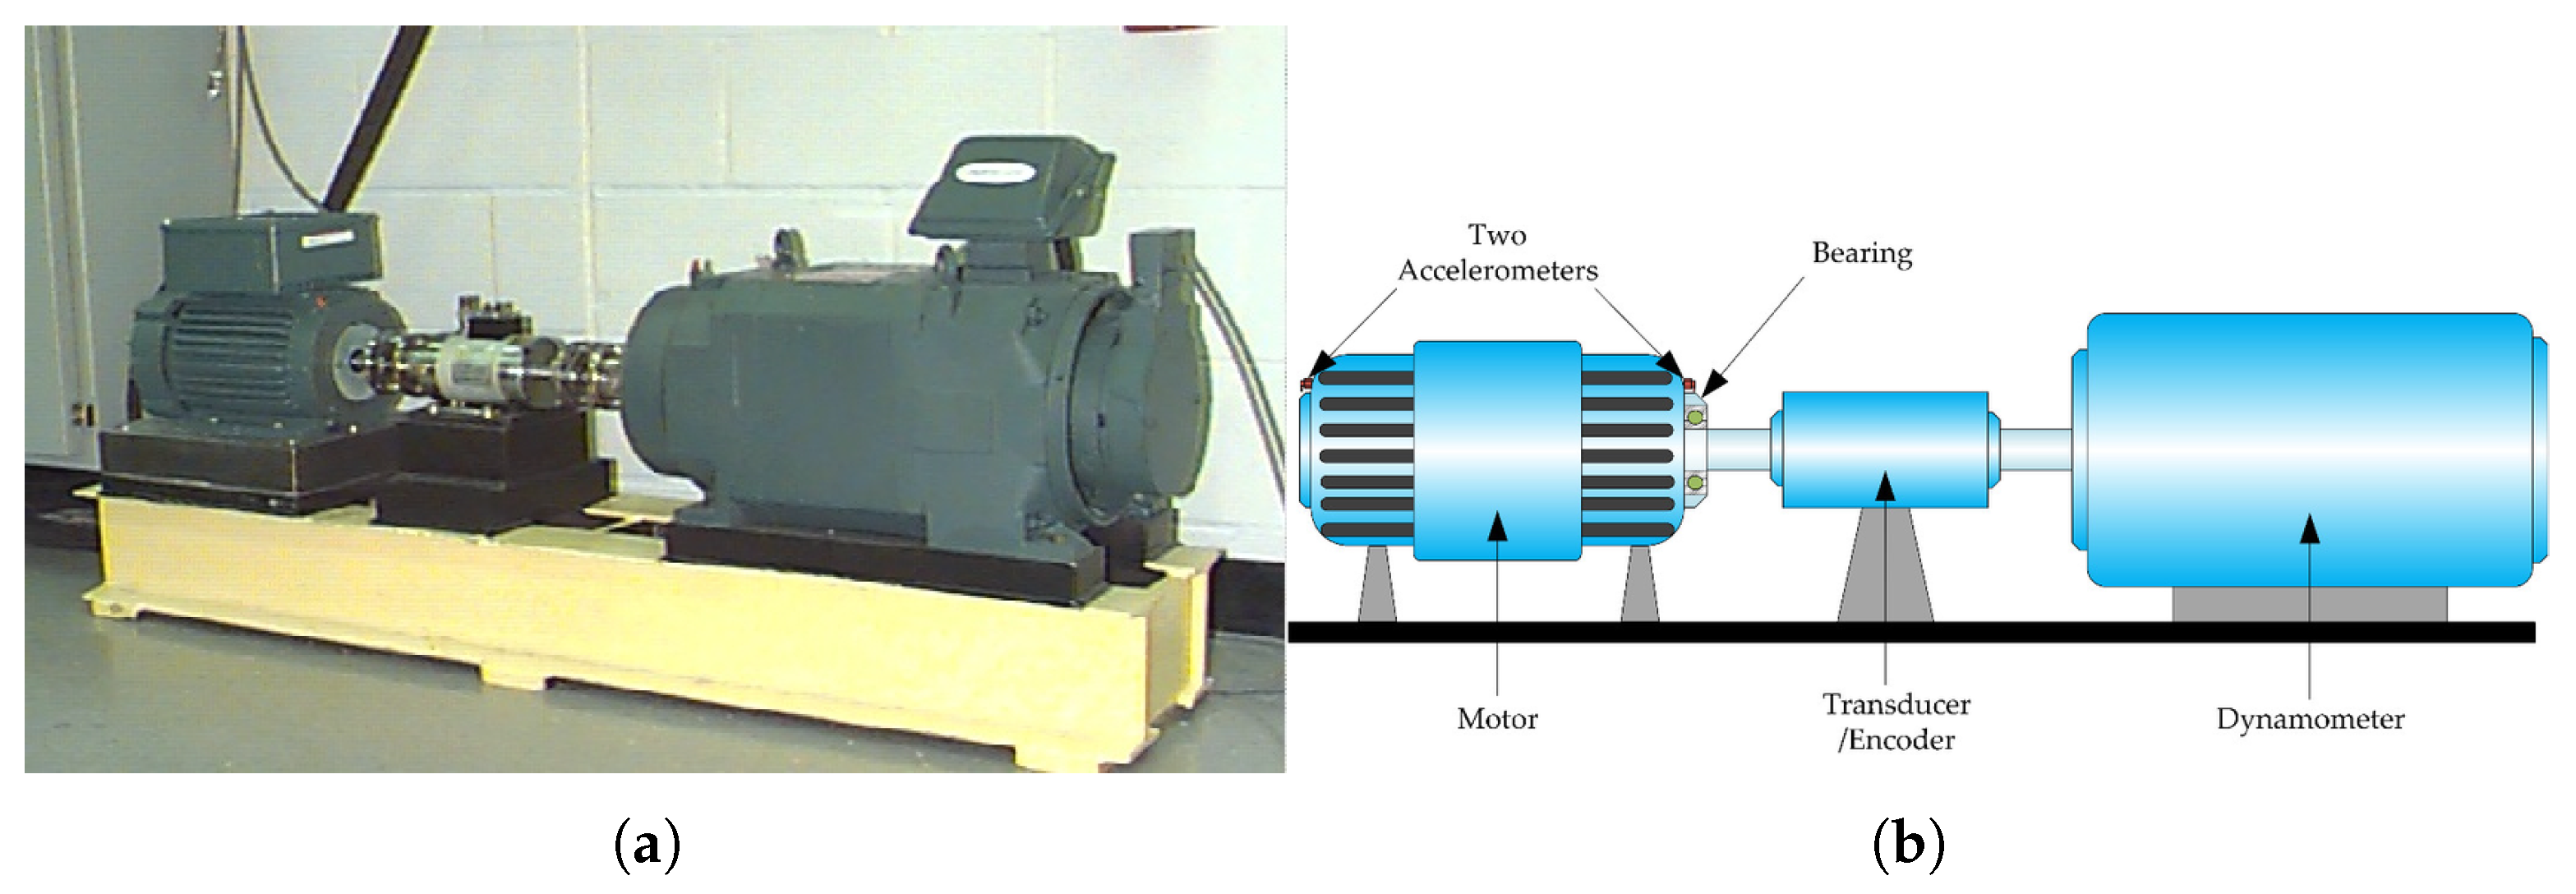
3.1. Experimental Setup and Dataset

The data used in this study are taken from the Case Western Reserve University Bearing Dataset [39]. The experimental setup is shown in Figure 6, and includes a 2 HP motor (left), a torque transducer/encoder (center), and a dynamometer (right), with the motor shaft supported by an SKF 6205-2RSJEM ball bearing. Vibration data are collected using accelerometers placed at the housing of the drive end and fan end of the motor, operating at rotational speeds of 1797, 1772, 1750, and 1730 rpm. To simulate a range of industrial operating conditions, the test rig is subjected to four distinct loading conditions—0, 1, 2, and 3 horsepower (HP)—applied via the dynamometer, which controls the mechanical load on the motor shaft. These loads correspond to no-load, low-load, medium-load, and high-load scenarios, respectively, reflecting typical operational states in industrial machinery such as gearboxes or compressors. The variation in loading conditions ensures that the proposed WPT-DT framework is evaluated across diverse mechanical stresses, enhancing its applicability to real-world scenarios where bearings operate under fluctuating loads.
The test rig is housed in an acoustically insulated and vibration-damped chamber to mitigate ambient noise and external vibrations, which could obscure fault-related signatures. Electromagnetic interference is minimized through shielding and grounding of the data acquisition system, including accelerometers and the transducer/encoder. The motor and dynamometer are calibrated before each experiment to maintain consistent operating conditions, and a sampling frequency of 48 kHz is employed with a high-pass filter to eliminate low-frequency mechanical noise, ensuring that the collected signals accurately reflected bearing conditions. These measures enhance the reliability and reproducibility of the dataset across all tested loads and speeds, making it suitable for robust fault diagnosis.

3.2. Training Process

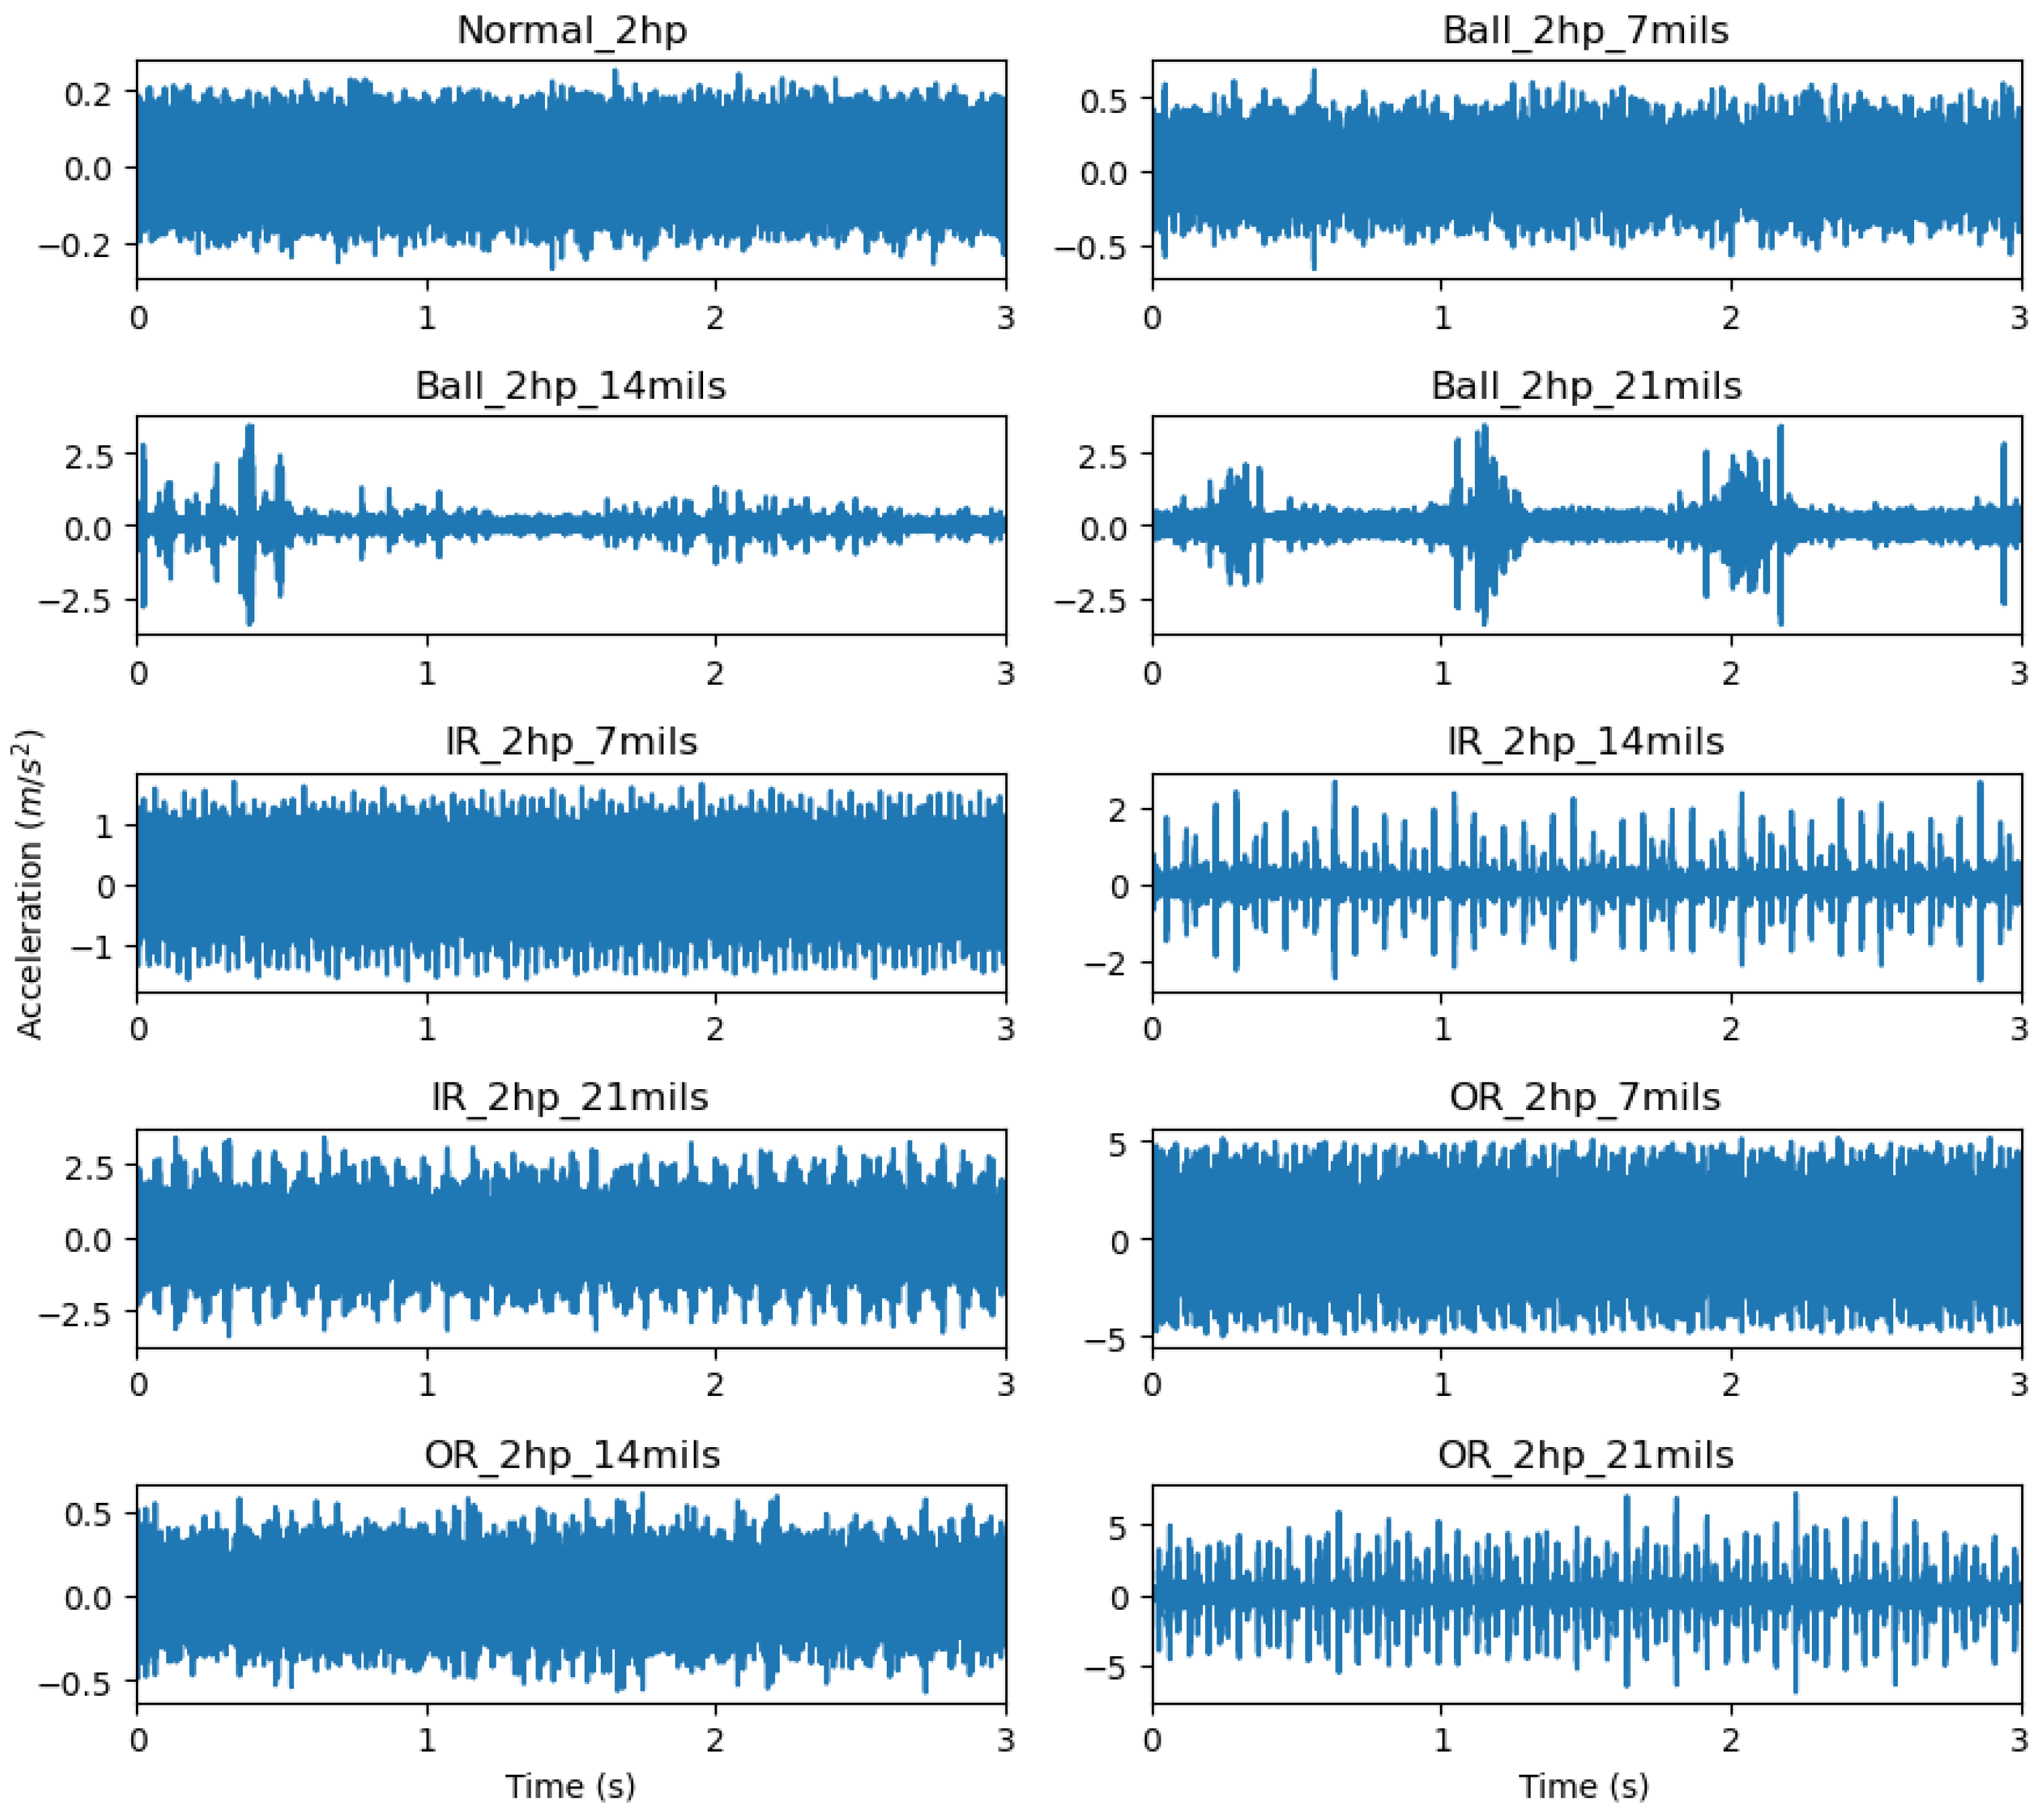
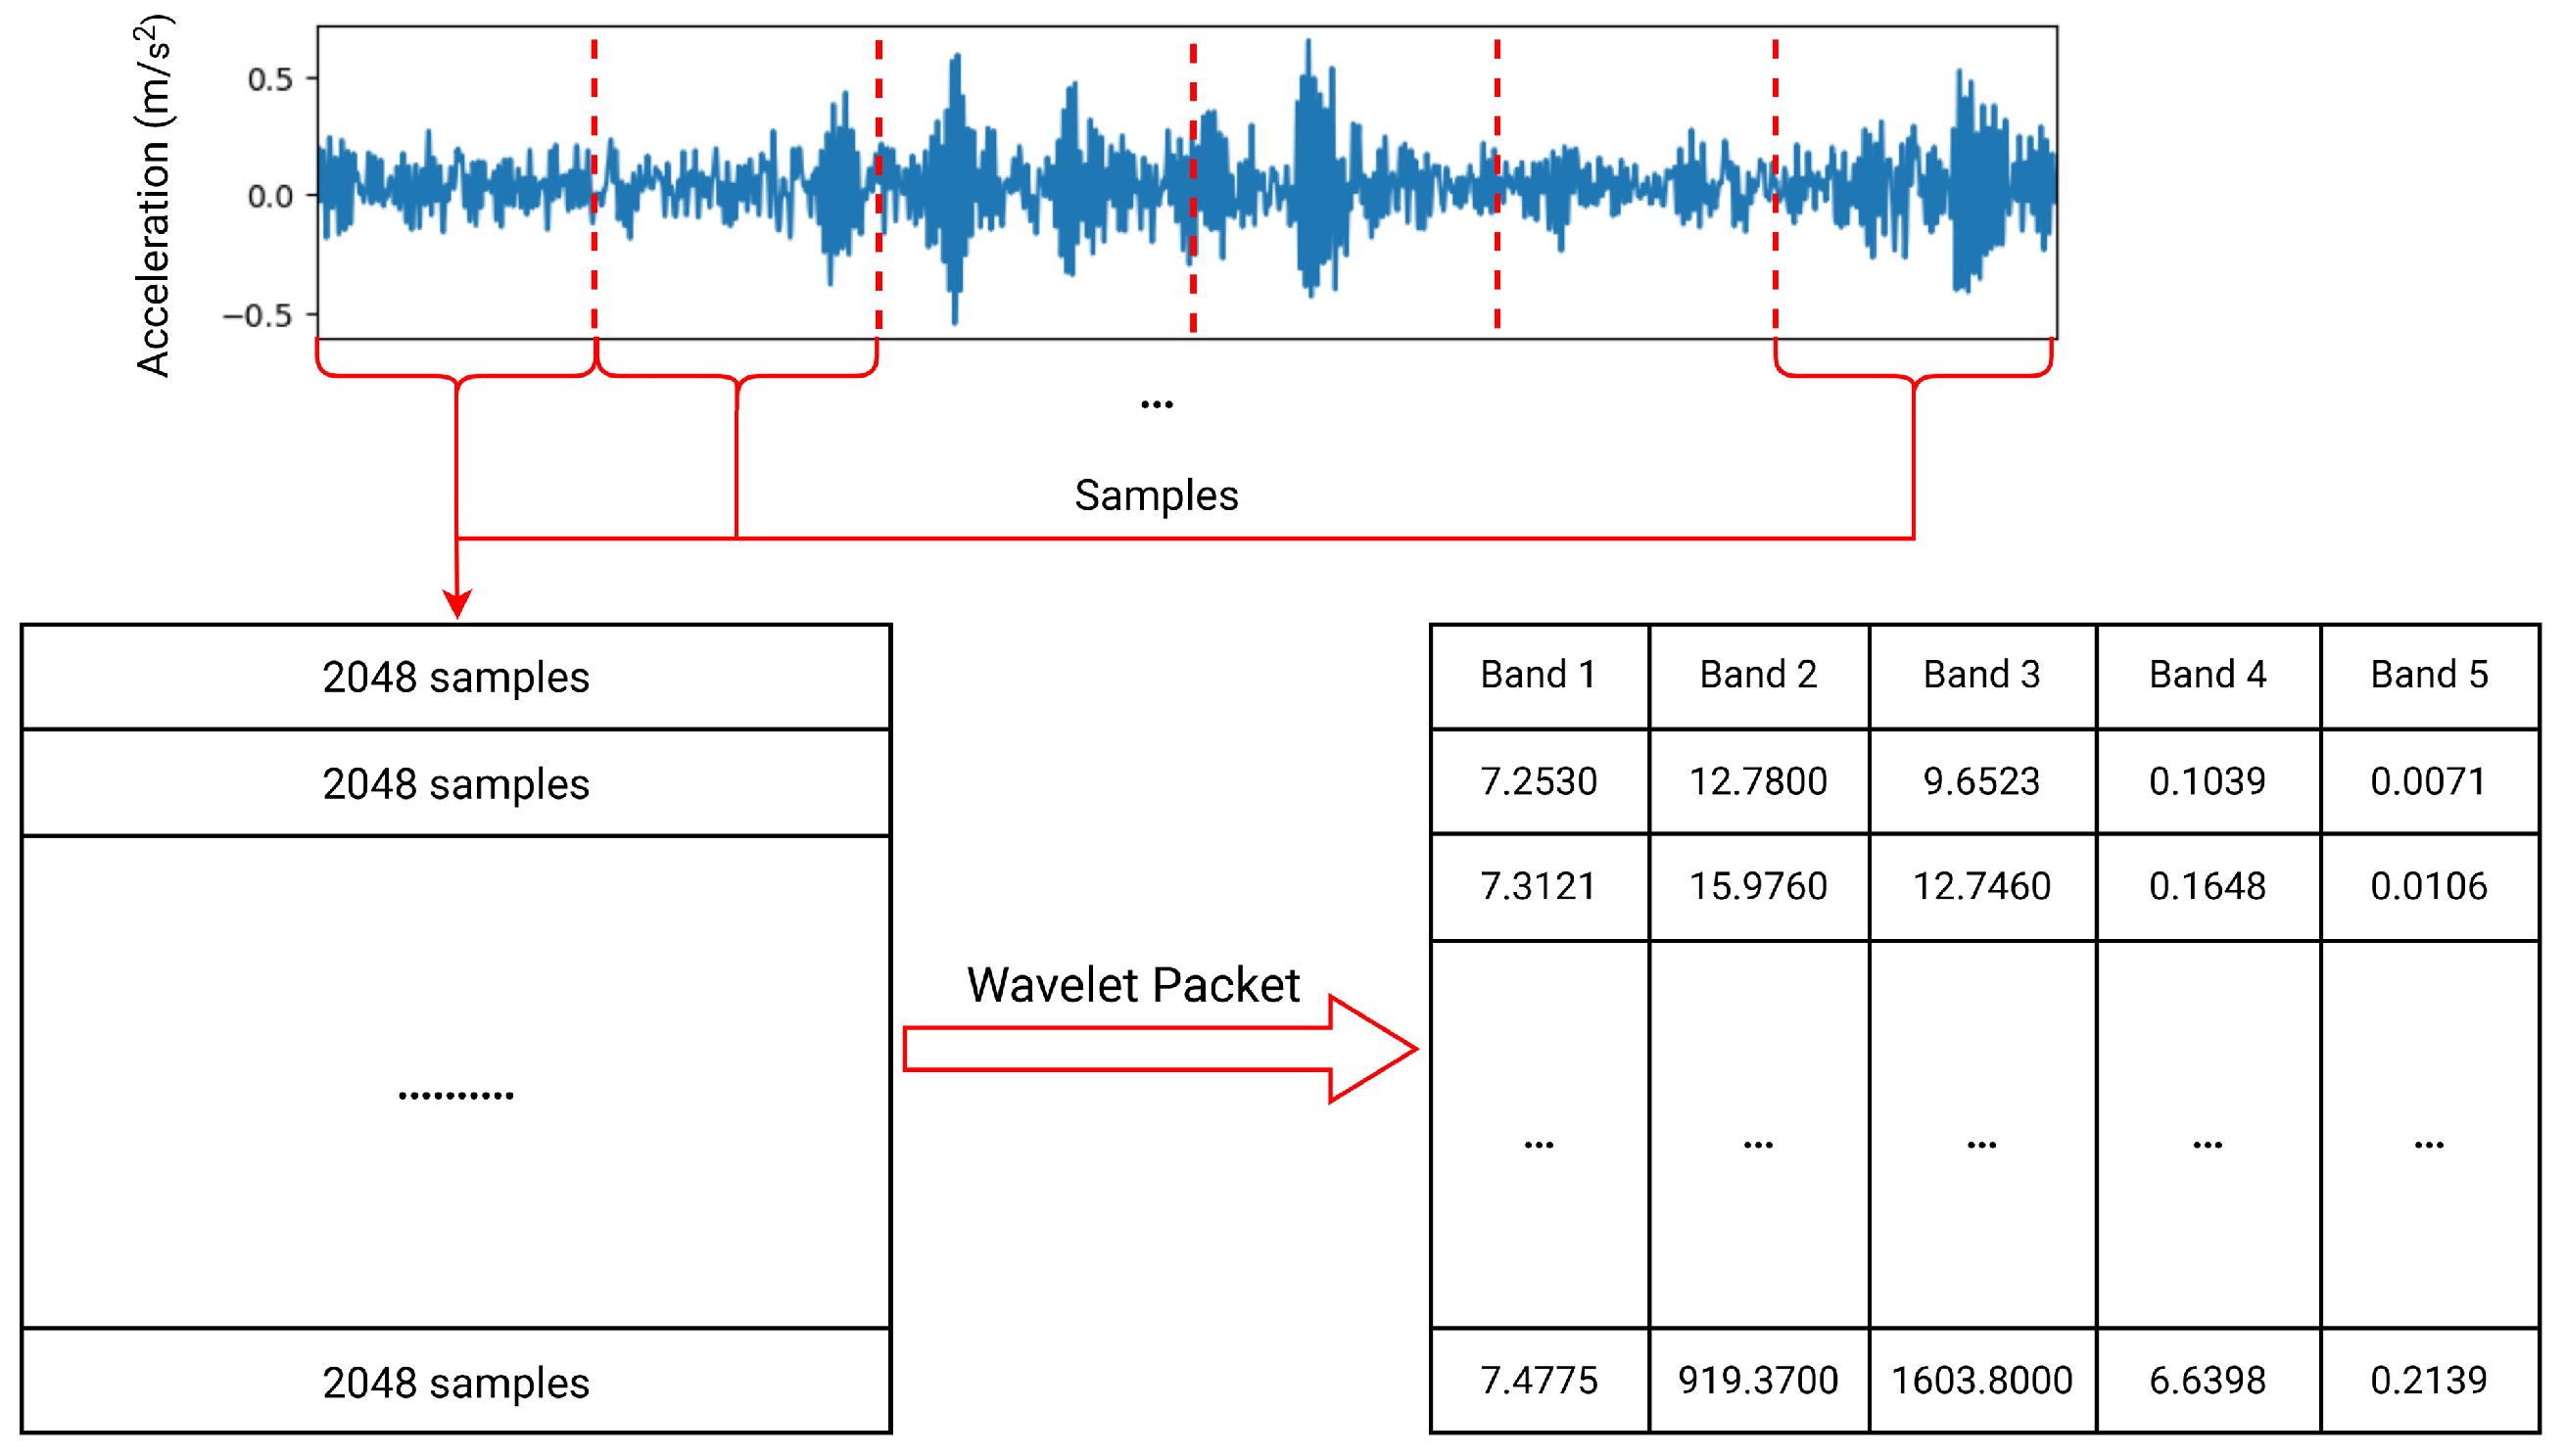
3.2.1. Signal Preprocessing

The bearing faults are introduced using electro-discharge machining, creating round pits of 11 mils depth and 7, 14, or 21 mils diameter on the inner race, outer race, or rolling element. The dataset encompasses four bearing conditions: normal (N), ball fault (BA), inner race fault (IR), and outer race fault (OR), as detailed in Table 1, with each condition tested under all combinations of loads and speeds to ensure comprehensive coverage of operational states. Figure 7 illustrates the vibration signals from the CWRU dataset for these bearing conditions at different loads, which are used for feature extraction and Decision Tree (DT) training.
Vibration signals from the CWRU dataset, sampled at 48 k Hz , are processed using Wavelet Packet Transform (WPT) to extract fault-relevant features for the Decision Tree (DT) model. WPT decomposes the signals into subbands across six decomposition levels, yielding seven refined frequency bands: 0–375 Hz, 375–750 Hz, 750–1500 Hz, 1500–3000 Hz, 3000–6000 Hz, 6000–12,000 Hz, and 12,000–24,000 Hz. Energies are computed along the diagonal path of the WPT tree, reducing the feature set to 7 while preserving comprehensive signal information for classification. The signal processing workflow using WPT on the CWRU dataset is depicted in Figure 8, highlighting the decomposition process across the specified frequency bands.
The selection of decomposition level 6 and the frequency bands is motivated by the enhanced frequency resolution, improved classification accuracy, and computational efficiency. With a Nyquist frequency of 24 k Hz , level 6 decomposition generates 2 6 = 64 subbands, each with a bandwidth of (24,000 Hz/64 = 375 Hz). This finer resolution enables the precise capture of fault characteristic frequencies (FCFs) of the SKF 6205-2RSJEM bearing, such as the Ball Pass Frequency Outer race (BPFO, 103.5 Hz ) and Inner race (BPFI, 157.5 Hz ) at rotational speeds of 1730–1797 rpm, within the 0– 375 Hz and 375–750 Hz bands [30]. The 750–1500 Hz band targets FCF harmonics, while the 1500–3000 Hz and 3000–6000 Hz bands capture early-stage fault signatures and defect-induced modulations critical for Inner Race Faults (IRs) and Ball Faults (BAs) [21,40]. The 6000–12,000 Hz band addresses high-frequency resonances from severe defects (14–21 mils), and the 12,000–24,000 Hz band evaluates noise, contributing minimally (importance = 0.02) [41].
Level 6 decomposition is selected to optimize performance as supported by empirical analysis (Figure 9), achieving approximately 95.83% accuracy with a computation time of around 288.92   s , outperforming level 5 (95.16% accuracy, 102.13   s ) and level 7 (96.54% accuracy, 627.53   s ). The 375 Hz resolution enhances the detection of subtle fault signatures, particularly in the 375–1500 Hz range for Outer Race Faults (ORs), reducing misclassification [42]. Despite generating 64 subbands, extracting energies along the diagonal path reduces the feature set to seven, mitigating overfitting risks in the DT model while maintaining a low inference time of 0.5022   s (Table 2). This approach ensures that comprehensive signal information is retained across all frequency bands, aligning with WPT-based diagnostic studies [38]. This choice ensures robust fault detection with computational efficiency suitable for real-time industrial applications.

3.2.2. Splitting Data

Following the preprocessing stage, the preprocessed signal data are divided into three distinct subsets: a training set, a test set, and a validation set. This division aims to build a decision tree model with good generalization capabilities and to evaluate the model’s performance objectively.
  • Training set: Contains the majority of the data and is used to train the decision tree model. The model learns patterns and relationships from these data to make predictions.
  • Validation set: This set is used to adjust the hyperparameters of the model during the training process. Using a validation set helps prevent overfitting, which is when the model learns the training data too well and cannot generalize well to new data.
  • Test set: This set is a separate dataset that the model has never seen during training. It is used to evaluate the final performance of the model after it has been trained and optimized.
The data splitting is performed randomly and at appropriate ratios to ensure the representativeness of the subsets. The detailed data splitting is described in Table 3. The use of these three datasets helps ensure that the decision tree model not only performs well on the training data but also has good generalization capabilities on new data, thereby enhancing the model’s reliability in bearing fault detection.

3.3. Result and Discussion

This section presents the details of the Decision Tree model training process and the evaluation results of the model’s performance on the bearing vibration signal data. We also compare the model’s performance with other methods.

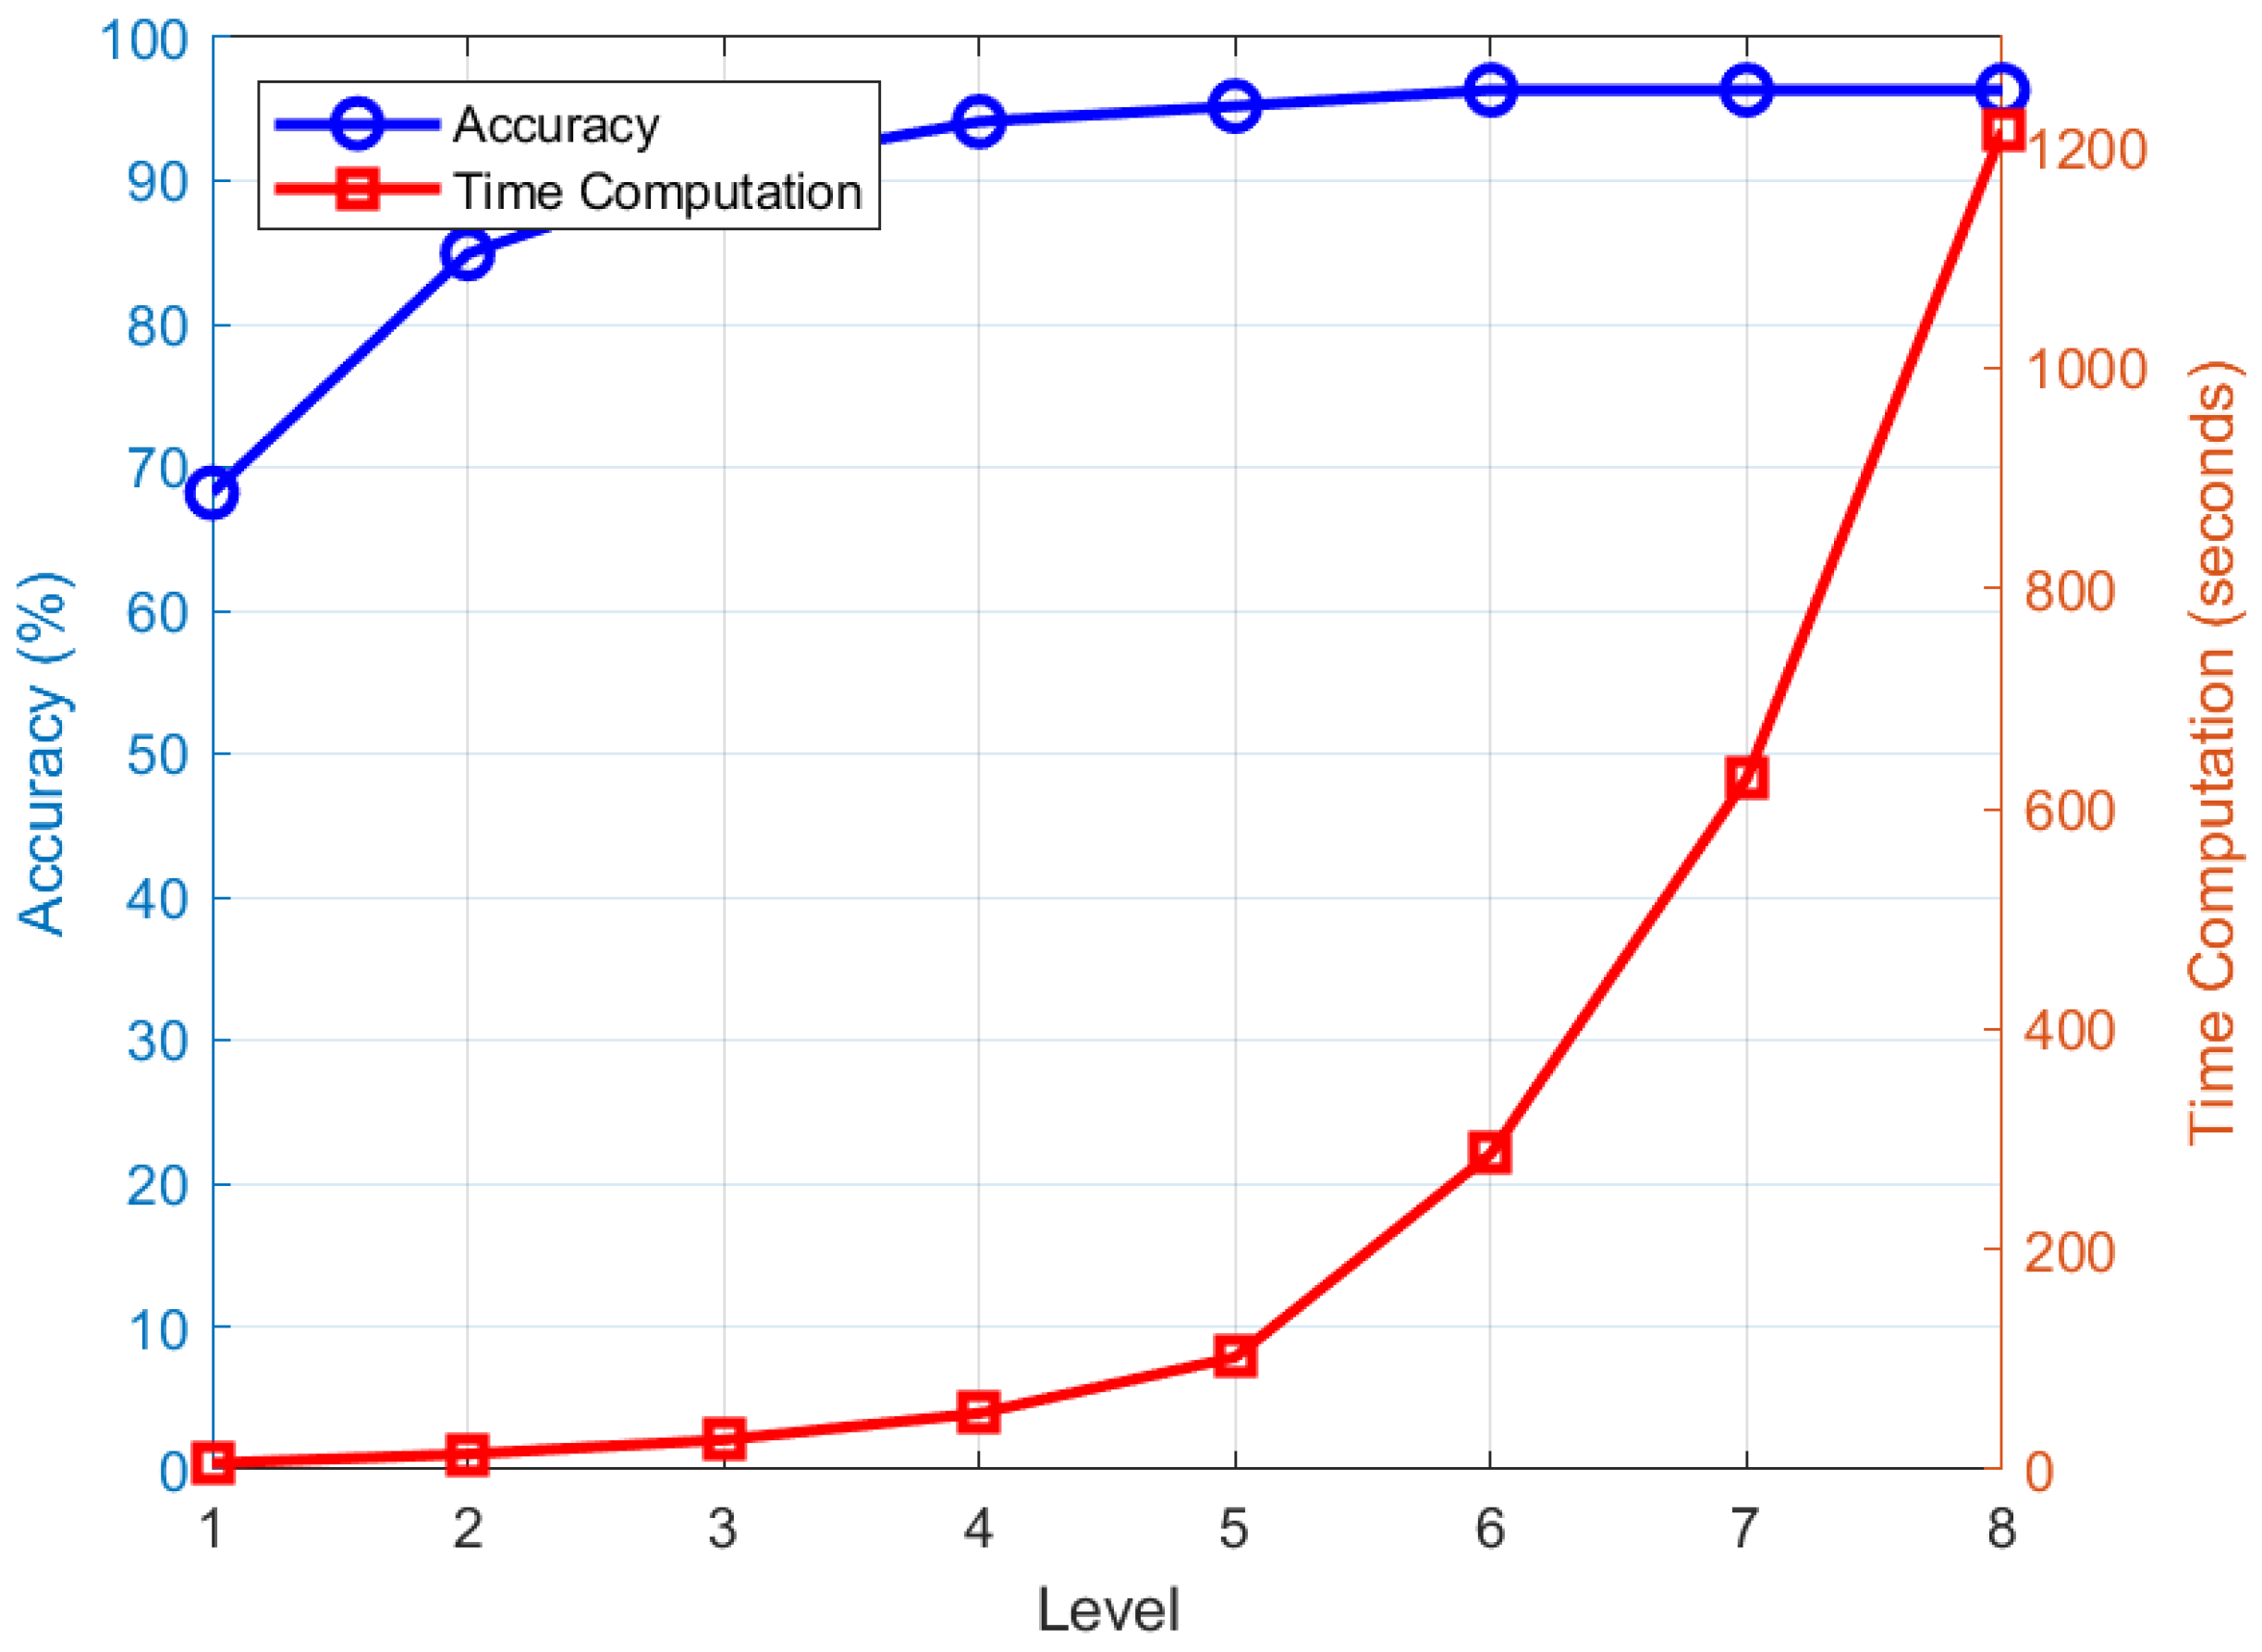
3.3.1. Model Training

During the training of the Decision Tree model on bearing vibration signal data, we focus on fine-tuning crucial hyperparameters based on the dataset’s characteristics, the five WPT-derived features to achieve optimal classification performance. The c c p _ a l p h a parameter, which controls the tree’s complexity through cost-complexity pruning, receives particular attention. A larger c c p _ a l p h a parameter value leads to more aggressive pruning, resulting in a simpler model that reduces the risk of overfitting but may decrease accuracy on the training set. Conversely, a smaller c c p _ a l p h a parameter value allows the tree to retain more branches, increasing complexity and potentially leading to overfitting if not carefully managed. Other hyperparameters used during training include m a x _ d e p t h , which limits the maximum depth of the tree to prevent overfitting; m i n _ s a m p l e s _ l e a f , the minimum number of samples required in a leaf node; and m i n _ s a m p l e s _ s p l i t , the minimum number of samples required to split an internal node.
The hyperparameters are chosen based on the CWRU dataset as outlined in Table 3, alongside the requirement to classify four distinct fault types—normal, ball fault, inner race fault, and outer race fault as detailed in Table 1. The dataset’s characteristics and the need to differentiate these four classes justifies using an unrestricted maximum depth with no limit, a minimum of one sample per leaf node, and a minimum of two samples to split a node, along with testing c c p _ a l p h a parameter across a range from 0 to 0.7, to maximize accuracy, achieving 96.33% as shown in Table 2, while ensuring balanced generalization as validated by Figure 10.
Figure 11 presents the overall structure of the trained Decision Tree, illustrating the data-splitting process and the formation of nodes based on the features extracted from the bearing vibration signal data.
The Decision Tree model training process involves selecting appropriate features and building the tree structure through recursive data partitioning. At each node, the CART algorithm searches for the best feature and threshold value to split the data into two child nodes, aiming to optimize the Gini impurity of the child nodes. This process continues until the stopping criteria are met, such as the maximum depth of the tree (max_depth) or the minimum number of samples in a leaf node (min_samples_leaf).
The nodes in the tree contain information about the data-splitting conditions, Gini impurity, the number of data samples, and class distribution. The root node contains the entire training data and is split based on the most important feature. Intermediate nodes continue the data-splitting process, while leaf nodes contain data samples belonging to the same class.

3.3.2. Result Analysis

The classification performance of the DT model is visualized through the confusion matrices in Figure 12. The results demonstrate a high degree of accuracy across all fault categories (normal, ball fault, inner race fault, and outer race fault), with minimal misclassification. A slight confusion between IR and OR faults is noted, aligning with the challenge of distinguishing these faults due to overlapping vibration patterns. This issue is evident with about 2.8% of IR samples (approximately 20 out of 702) misclassified as OR, and a similar rate for OR samples (about 20 out of 728) as supported by the dataset distribution in Table 3. Key contributing factors include (1) combining faults of varying severities (7, 14, and 21 mils, per Table 1) into one class, which obscures distinct vibration features; (2) the 375 Hz bandwidth of WPT level 6 being insufficient to resolve subtle frequency differences, especially for minor faults; and (3) weaker fault signals under low-load conditions. Nevertheless, the overall model performance achieves an accuracy of 95.83%, confirming the effectiveness of the proposed WPT-DT framework.
Further insights into the model’s decision-making process are provided by the feature importance analysis presented in Figure 12. The energy content in the 3–6 kHz frequency band (Band 5) is identified as the most influential feature, accounting for approximately 35% of the decision-making contribution. This frequency range typically corresponds to localized defect-induced modulations, particularly from the inner race or rolling elements. The 1.5–3 kHz band (Band 4), which shows the second-highest importance (25%), is closely associated with early-stage fault energy signatures, especially for outer race defects. The 0–1.5 kHz band (Band 3), the 6–12 kHz band (Band 1), and the 12–24 kHz band (Band 2) also contribute meaningfully, reflecting high-frequency resonances generated by severe defects. The minor contribution from the 24–48 kHz band (Band 6) and the 48–96 kHz band (Band 7) suggests that very high-frequency components are less discriminative for the fault types in this study.
The transparency provided by the DT structure and feature importance analysis not only enhances model explainability but also enables maintenance engineers to prioritize monitoring specific frequency bands, optimizing sensor deployment and data acquisition strategies. The confusion matrix in Figure 12 illustrates the classification performance of the proposed Decision Tree (DT) model across four bearing conditions: normal, ball fault, inner race fault, and outer race fault. The model achieves high classification accuracy, with minimal misclassification observed between fault classes, particularly among the inner and outer race faults. Most predictions align well with the true labels, indicating the model’s strong ability to distinguish between the subtle vibration patterns associated with different fault types. This high fidelity is further supported by the model’s overall accuracy of 95.83%, as well as the precision, recall, and F1-scores all exceeding 95% (Table 2). The balanced performance across all metrics demonstrates that the DT model effectively generalizes across various fault conditions and operating states. These results confirm that the interpretable and lightweight DT-based framework can serve as a reliable alternative to more complex models for real-time fault classification.
Figure 13 presents the feature importances derived from the trained Decision Tree model, highlighting which input features most significantly influence the classification decision. Unlike black-box models, the Decision Tree provides a transparent hierarchy of features, allowing practitioners to trace how specific energy components from wavelet packet decomposition contribute to fault classification. This interpretability is a key advantage of Decision Trees as an explainable AI (XAI) method, enabling engineers to understand, validate, and trust the model’s decisions, particularly in safety-critical applications. For instance, the ability to identify dominant frequency bands linked to specific fault types supports informed maintenance planning and root cause analysis. Moreover, feature importance analysis can guide sensor placement and data acquisition strategies by focusing on the most informative signal components.
An examination of the decision tree structure (Figure 11) reveals that at the root node, the energy in the 1.5–3 kHz frequency range (Band 4) is used to effectively distinguish between normal and faulty samples. Specifically, samples with Band 4 energy values less than or equal to 0.01 are classified as normal (513 samples), while those with higher energy values are identified as faulty (4580 samples). This initial split underscores the critical role of the 1.5–3 kHz frequency range in early fault detection.
The feature importance analysis (Figure 13) further reveals that the signal energy in the 3–6 kHz frequency range (Band 5) exhibits the highest importance in bearing fault classification, with an importance value of 0.35. This indicates that the energy in this frequency band provides the most significant discrimination between different fault types.
The 1500–3000 Hz frequency range (Band 4), with an importance value of 0.25, holds the second-highest importance. As highlighted by the decision tree structure, energy values in this range effectively distinguish normal signal samples from faulty ones, confirming that this frequency band contains crucial diagnostic information for bearing condition assessment.
The 750–1000 Hz range (Band 3), the 0–375 Hz range (Band 1), and the 750–1500 Hz range (Band 2) also contribute meaningfully, with importance values of 0.12, 0.11, and 0.11, respectively, reflecting their roles in capturing fault-related signatures. Meanwhile, the 6000–12,000 Hz range (Band 6) and the 12,000–24,000 Hz range (Band 7) have lower importance (importance = 0.04 and 0.02), suggesting a limited contribution to fault classification.
These findings demonstrate the efficacy of energy analysis based on Wavelet Packet Transform (WPT) combined with the Decision Tree (DT) methodology. The approach not only enables accurate fault classification but also provides critical insights into the characteristic frequency bands associated with different bearing conditions. By identifying distinctive energy distributions across frequency ranges, the method supports advanced condition monitoring strategies for predictive maintenance in industrial machinery systems.

3.3.3. Comparative Evaluation

Table 2 summarizes the comparative performance of the proposed Decision Tree (DT) model against the Support Vector Machine (SVM) and Feedforward Neural Network (FFW) classifiers. The DT model achieved the highest classification accuracy (95.83%), surpassing SVM (95.01%) and significantly outperforming FFW (86.72%). In addition to accuracy, the DT also demonstrates superior precision, recall, and F1-score, all exceeding 95%.
Moreover, the DT model exhibits exceptional computational efficiency, with a training time of only 0.502 seconds, compared to 2.5478 seconds for SVM and 62.2951 seconds for FFW. This outstanding balance between high diagnostic performance and low computational cost highlights the practicality of the DT model for real-time condition monitoring in industrial environments.
The superior results of the DT model can be attributed to its effective utilization of WPT-extracted features, which capture critical fault-related signal characteristics, and to its simple, hierarchical decision-making structure. Unlike SVM, which requires kernel transformations, or FFW, which demands extensive parameter tuning and training epochs, the DT leverages a straightforward architecture to achieve both high performance and full interpretability. This makes it highly attractive for intelligent predictive maintenance applications under resource-constrained scenarios.

3.4. Validation on an Independent Dataset

To evaluate the generalization capability and real-world efficacy of the proposed method, an independent experiment was conducted on a dataset distinct from CWRU. This aimed to validate the model’s applicability and reliability under disparate data conditions.
The second dataset used originates from the Human Lab, Center for Noise and Vibration Control Plus, Department of Mechanical Engineering, Korea Advanced Institute of Science and Technology (KAIST) [43], and includes vibration and current signals of rolling element bearings under normal conditions, as well as with inner race (IR), outer race (OR), and ball (BA) faults. This dataset includes vibration and current signals from rolling element bearings under normal conditions (N) and with three fault types: ball fault (BA), inner race fault (IR), and outer race fault (OR). The data were collected under no-load conditions at a stable rotational speed of 3010 rpm, with vibration signals sampled at 25.6 kHz and segmented into 2048 samples per segment, consistent with the preprocessing approach used for the Case Western Reserve University (CWRU) dataset.

3.4.1. Experimental Setup and Data Processing

The KAIST dataset, as detailed in Table 4, includes four bearing conditions (N, BA, IR, OR) under a single operating condition (0 HP, 3010 rpm). The vibration signals were processed using the same WPT-based feature extraction methodology applied to the CWRU dataset. Specifically, the signals were decomposed into six levels using WPT, yielding seven frequency bands: 0–200 Hz, 200–400 Hz, 400–800 Hz, 800–1600 Hz, 1600–3200 Hz, 3200–6400 Hz, and 6400–12,800 Hz (adjusted for the 25.6 kHz sampling rate, with a Nyquist frequency of 12.8 kHz). Energies were computed along the diagonal path of the WPT tree to extract seven energy-based features, ensuring consistency with the CWRU preprocessing pipeline.

3.4.2. Results and Analysis

The effectiveness of the WPT-DT framework on the KAIST dataset is demonstrated through the analysis of the confusion matrix and feature importance plot, which validate its perfect classification performance and highlight its interpretability. The confusion matrix (Figure 14) shows flawless classification, with 100% accuracy across all fault categories (N, BA, IR, and OR) as evidenced by zero misclassifications. This perfect separation contrasts with the CWRU results, where minor overlaps between IR and OR faults (approximately 2.8% misclassification) were observed due to similar vibration patterns. The KAIST dataset’s clear fault signatures, likely amplified by the high rotational speed (3010 rpm) and no-load condition, enabled the pretrained DT model to accurately distinguish all bearing conditions. The high-resolution WPT decomposition (200 Hz bandwidth at level 6, adjusted for 25.6 kHz sampling) effectively captured subtle fault characteristics, contributing to this exceptional performance. To further illustrate the decision-making process, Figure 15 presents the structure of the Decision Tree trained on the KAIST dataset. It highlights how the model splits nodes based on WPT-derived energy values, effectively separating normal and faulty bearing conditions using the most discriminative frequency bands, such as the 1600-3200 Hz range (Band 5), which aligns with the feature importance analysis.
The feature importance plot (Figure 16) provides critical insights into the model’s decision-making process, emphasizing its interpretability. The 1600–3200 Hz band (Band 5) is the most influential feature, contributing 67% to the classification decisions, followed by the 3200–6400 Hz band (Band 6) at 33%. Notably, the remaining frequency bands—0–200 Hz (Band 1), 200–400 Hz (Band 2), 400–800 Hz (Band 3), 800–1600 Hz (Band 4), and 6400–12,800 Hz (Band 7)—contribute 0% to the decision-making process, indicating that fault-related signatures in the KAIST dataset are exclusively concentrated in the mid-to-high frequency ranges of 1600–6400 Hz. This distribution aligns with the physical characteristics of bearing faults, where localized defects in high-speed operations (3010 rpm) generate significant energy in these frequency bands, particularly for inner race and ball faults. The dominance of Bands 5 and 6 underscores the effectiveness of WPT in extracting discriminative features, enabling the DT model to focus on the most relevant signal components for accurate fault classification.

4. Conclusions and Future Work

This study proposes an efficient and interpretable framework for bearing fault diagnosis, integrating Wavelet Packet Transform (WPT) for feature extraction with a Decision Tree (DT) classifier, herein referred to as the WPT-DT framework. Experimental results on the benchmark Case Western Reserve University (CWRU) dataset demonstrate that the framework achieves a classification accuracy of 95.83%, surpassing traditional machine learning methods such as Support Vector Machines (SVMs, 95.01%) and Feedforward Neural Networks (FFWs, 86.72%). Additionally, the framework exhibits exceptional computational efficiency, with a training time of 0.5022 seconds, significantly lower than 2.8126 seconds for SVM and 69.3481 seconds for FFW. Validation on an independent KAIST dataset further reinforces the framework’s robustness, achieving a perfect classification accuracy of 100% under no-load conditions at 3010 rpm, highlighting its generalizability across diverse datasets and operating conditions.
The WPT-DT framework offers several key contributions. First, the transparency of the DT model, facilitated by its “if–then” decision rules, enables engineers to trace the diagnostic process and prioritize critical frequency bands (e.g., the 3–6 kHz band, contributing 35% to feature importance with CWRU dataset). This contrasts with complex deep learning models, which often lack interpretability and require substantial computational resources. Second, the integration of WPT and DT represents an innovative approach, leveraging the superior frequency resolution of WPT to capture subtle fault characteristics and the simplicity of DT to ensure computational efficiency. Third, feature importance analysis provides valuable insights into the frequency components associated with different bearing fault types, supporting predictive maintenance strategies in smart manufacturing systems.
In the context of recent research, advanced deep learning approaches, such as those employing relational mechanisms or domain adaptation techniques, have made significant strides in diagnosing faults in rotating machinery, particularly for handling imbalanced data or diverse operating conditions [44,45,46]. However, these methods typically demand large datasets, high computational resources, and lack transparency, limiting their deployment in embedded systems or real-time applications. In contrast, the WPT-DT framework offers a lightweight, efficient, and interpretable solution, making it ideal for industrial applications where transparency and performance are paramount.
For practical implementation, several challenges must be addressed. Optimal sensor placement near critical components, such as bearing housings, is essential to acquire high-quality vibration data in noisy industrial settings. Advanced data acquisition strategies, such as bandpass filtering or wavelet-based denoising techniques, can enhance diagnostic accuracy. Moreover, integrating the framework with existing maintenance systems, such as CMMS or SCADA, via standard protocols like OPC UA or MQTT, will enable real-time fault alerts and automated maintenance workflows.
Future research will focus on enhancing the framework’s generalizability through domain adaptation techniques to address diverse operating conditions and machinery types. Exploring ensemble methods, such as Random Forests or Gradient Boosting, may improve accuracy while maintaining acceptable interpretability. Additionally, validating the framework on real-world industrial datasets with multi-sensor inputs and deploying it within industrial IoT platforms will strengthen its robustness and practical applicability. These advancements will solidify the WPT-DT framework as a comprehensive solution for intelligent fault diagnosis, balancing performance, transparency, and practicality in industrial systems.

Author Contributions

T.-D.N.: Writing—original draft, Writing—review and editing, Formal Analysis, Investigation, Methodology, Software, Funding acquisition. T.-H.N.: Conceptualization, Formal Analysis, Investigation, Methodology, Software, Writing—original draft, Writing—review and editing, Supervision, Validation. D.-T.-B.D.: Conceptualization, Investigation, Software, Visualization, Writing—original draft, Data curation. T.-H.P.: Writing—review and editing, Visualization, Data curation. J.-W.L.: Data curation, Methodology, Resources, Validation, Writing—review and editing. P.-D.N.: Writing—review and editing, Visualization, Data curation, Project administration, Supervision. All authors have read and agreed to the published version of the manuscript.

Funding

This research is funded by Hanoi University of Science and Technology (HUST) under project number T2024-PC-018.

Data Availability Statement

All data and results are contained within the article.

Conflicts of Interest

The authors declare no conflict of interest.

References

  1. Wu, F.; Xiang, Z.; Xiao, D.; Hao, Y.; Qin, Y.; Pu, H.; Luo, J. Adversarial-Causal Representation Learning Networks for Machine fault diagnosis under unseen conditions based on vibration and acoustic signals. Eng. Appl. Artif. Intell. 2025, 139, 109550. [Google Scholar] [CrossRef]
  2. Pang, B.; Liu, Q.; Xu, Z.; Sun, Z.; Hao, Z.; Song, Z. Fault vibration model driven fault-aware domain generalization framework for bearing fault diagnosis. Adv. Eng. Inform. 2024, 62, 102620. [Google Scholar] [CrossRef]
  3. Feng, K.; Xiao, Y.; Li, Z.; Jiang, Z.; Gu, F. Gas turbine blade fracturing fault diagnosis based on broadband casing vibration. Measurement 2023, 214, 112718. [Google Scholar] [CrossRef]
  4. Jiang, F.; Lin, W.; Wu, Z.; Zhang, S.; Chen, Z.; Li, W. Fault diagnosis of gearbox driven by vibration response mechanism and enhanced unsupervised domain adaptation. Adv. Eng. Inform. 2024, 61, 102460. [Google Scholar] [CrossRef]
  5. Zhang, L.; He, X.; Chen, J.; Liu, J. Fault diagnoses of a nonlinear cracked rotor-bearing system based on vibration energy space and incremental learning approach. J. Sound Vib. 2025, 600, 118785. [Google Scholar] [CrossRef]
  6. Hu, W.; Xin, G.; Wu, J.; An, G.; Li, Y.; Feng, K.; Antoni, J. Vibration-based bearing fault diagnosis of high-speed trains: A literature review. High-Speed Railw. 2023, 1, 219–223. [Google Scholar] [CrossRef]
  7. Zheng, Z.; Song, D.; Zhang, W.; Jia, C. A fault diagnosis method for bogie axle box bearing based on sound-vibration multiple signal fusion. Appl. Acoust. 2025, 228, 110336. [Google Scholar] [CrossRef]
  8. Du, N.T.; Trung, P.T.; Cuong, N.H.; Dien, N.P. Automatic Rolling Bearings Fault Classification: A Case Study at Varying Speed Conditions. Front. Mech. Eng. 2024, 10, 1341466. [Google Scholar] [CrossRef]
  9. Kecik, K.; Smagala, A.; Ciecieląg, K. Diagnosis of angular contact ball bearing defects based on recurrence diagrams and quantification analysis of vibration signals. Measurement 2023, 216, 112963. [Google Scholar] [CrossRef]
  10. Hong, D.; Kim, B. 1D convolutional neural network-based adaptive algorithm structure with system fault diagnosis and signal feature extraction for noise and vibration enhancement in mechanical systems. Mech. Syst. Signal Process. 2023, 197, 110395. [Google Scholar] [CrossRef]
  11. Cao, W.; Han, Z.; Yang, Z.Z.; Wang, N.; Qu, J.X.; Wang, D. Deterioration state diagnosis and wear evolution evaluation of planetary gearbox using vibration and wear debris analysis. Measurement 2022, 193, 110978. [Google Scholar] [CrossRef]
  12. Liu, J.; Hao, R.; Zhang, T.; Wang, X. Vibration fault diagnosis based on stochastic configuration neural networks. Neurocomputing 2021, 434, 98–125. [Google Scholar] [CrossRef]
  13. Wang, S.; Wang, Q.; Xiao, Y.; Liu, W.; Shang, M. Research on rotor system fault diagnosis method based on vibration signal feature vector transfer learning. Eng. Fail. Anal. 2022, 139, 106424. [Google Scholar] [CrossRef]
  14. Jha, R.K.; Swami, P.D. Fault diagnosis and severity analysis of rolling bearings using vibration image texture enhancement and multiclass support vector machines. Appl. Acoust. 2021, 182, 108243. [Google Scholar] [CrossRef]
  15. Ye, Z.; Yu, J. Deep morphological convolutional network for feature learning of vibration signals and its applications to gearbox fault diagnosis. Mech. Syst. Signal Process. 2021, 161, 107984. [Google Scholar] [CrossRef]
  16. Liu, S.; Fang, L.; Wang, X.Z.S.; Hu, C.; Gu, F.; Ball, A. State-of-health estimation of lithium-ion batteries using a kernel support vector machine tuned by a new nonlinear gray wolf algorithm. J. Energy Storage 2024, 102, 114052. [Google Scholar] [CrossRef]
  17. Jiang, M.; Luo, M.; Zhang, C.; Shu, M.; Sun, G. Rolling bearing fault diagnosis based on acoustic-vibration data fusion and mode decomposition combined with the crested porcupine optimization algorithm. Heliyon 2024, 10, e40351. [Google Scholar] [CrossRef] [PubMed]
  18. Thuan, N.D.; Hong, H.S. HUST bearing: A practical dataset for ball bearing fault diagnosis. BMC Res. Notes 2023, 16, 138. [Google Scholar] [CrossRef]
  19. Yu, X.; Feng, Z.; Liang, M. Analytical vibration signal model and signature analysis in resonance region for planetary gearbox fault diagnosis. J. Sound Vib. 2021, 498, 115962. [Google Scholar] [CrossRef]
  20. Jiang, G.; Jia, C.; Nie, S.; Wu, X.; He, Q.; Xie, P. Multiview enhanced fault diagnosis for wind turbine gearbox bearings with fusion of vibration and current signals. Measurement 2022, 196, 111159. [Google Scholar] [CrossRef]
  21. He, M.; He, D. A new hybrid deep signal processing approach for bearing fault diagnosis using vibration signals. Neurocomputing 2020, 396, 542–555. [Google Scholar] [CrossRef]
  22. Wang, R.; Gu, Z.; Wang, C.; Yu, M.; Han, W.; Yu, L. Vibration shock disturbance modeling in the rotating machinery fault diagnosis: A generalized mixture Gaussian model. Mech. Syst. Signal Process. 2024, 220, 111594. [Google Scholar] [CrossRef]
  23. Sethi, M.R.; Subba, A.B.; Faisal, M.; Sahoo, S.; Raju, D.K. Fault diagnosis of wind turbine blades with continuous wavelet transform based deep learning model using vibration signal. Eng. Appl. Artif. Intell. 2024, 138, 109372. [Google Scholar] [CrossRef]
  24. Chen, T.; Guo, L.; Feng, T.; Gao, H.; Yu, Y. IESMGCFFOgram: A new method for multicomponent vibration signal demodulation and rolling bearing fault diagnosis. Mech. Syst. Signal Process. 2023, 204, 110800. [Google Scholar] [CrossRef]
  25. Rauber, T.W.; da Silva Loca, A.L.; de Assis Boldt, F.; Rodrigues, A.L.; Varejão, F.M. An experimental methodology to evaluate machine learning methods for fault diagnosis based on vibration signals. Expert Syst. Appl. 2021, 167, 114022. [Google Scholar] [CrossRef]
  26. Morshedizadeh, M.; Rodgers, M.; Doucette, A.; Schlanbusch, P. A case study of wind turbine rotor over-speed fault diagnosis using combination of SCADA data, vibration analyses and field inspection. Eng. Fail. Anal. 2023, 146, 107056. [Google Scholar] [CrossRef]
  27. Mongia, C.; Goyal, D.; Sehgal, S. Vibration response-based condition monitoring and fault diagnosis of rotary machinery. Mater. Today Proc. 2022, 50, 679–683. [Google Scholar] [CrossRef]
  28. Nie, Y.; Li, F.; Wang, L.; Li, J.; Wang, M.; Sun, M.; Li, G.; Li, Y. Phenomenological vibration models of planetary gearboxes for gear local fault diagnosis. Mech. Mach. Theory 2022, 170, 104698. [Google Scholar] [CrossRef]
  29. Gunasegaran, V.; Muralidharan, V. Fault diagnosis of spur gear system through decision tree algorithm using vibration signal. Mater. Today Proc. 2020, 22, 3232–3239. [Google Scholar] [CrossRef]
  30. Wang, T.; Han, Q.; Chu, F.; Feng, Z. Vibration based condition monitoring and fault diagnosis of wind turbine planetary gearbox: A review. Mech. Syst. Signal Process. 2019, 126, 662–685. [Google Scholar] [CrossRef]
  31. Wang, Z.; Shi, D.; Xu, Y.; Zhen, D.; Gu, F.; Ball, A.D. Early rolling bearing fault diagnosis in induction motors based on on-rotor sensing vibrations. Measurement 2023, 222, 113614. [Google Scholar] [CrossRef]
  32. Xueyi, L.; Jialin, L.; Yongzhi, Q.; David, H. Semi-supervised gear fault diagnosis using raw vibration signal based on deep learning. Chin. J. Aeronaut. 2020, 33, 418–426. [Google Scholar]
  33. Miao, M.; Sun, Y.; Yu, J. Deep sparse representation network for feature learning of vibration signals and its application in gearbox fault diagnosis. Knowl.-Based Syst. 2022, 240, 108116. [Google Scholar] [CrossRef]
  34. Tahmasbi, D.; Shirali, H.; Souq, S.S.M.N.; Eslampanah, M. Diagnosis and root cause analysis of bearing failure using vibration analysis techniques. Eng. Fail. Anal. 2024, 158, 107954. [Google Scholar] [CrossRef]
  35. Zhou, P.; Chen, S.; He, Q.; Wang, D.; Peng, Z. Rotating machinery fault-induced vibration signal modulation effects: A review with mechanisms, extraction methods and applications for diagnosis. Mech. Syst. Signal Process. 2023, 200, 110489. [Google Scholar] [CrossRef]
  36. Wang, H.; Liu, Z.; Peng, D.; Cheng, Z. Attention-guided joint learning CNN with noise robustness for bearing fault diagnosis and vibration signal denoising. ISA Trans. 2022, 128, 470–484. [Google Scholar] [CrossRef]
  37. Lydakis, E.; Koss, H.; Brincker, R.; Amador, S.D. Data-driven sensor fault diagnosis for vibration-based structural health monitoring under ambient excitation. Measurement 2024, 237, 115232. [Google Scholar] [CrossRef]
  38. Trong-Du, N.; Phong-Dien, N. Improvements in the Wavelet Transform and Its Variations: Concepts and Applications in Diagnosing Gearbox in Non-Stationary Conditions. Appl. Sci. 2024, 14, 4642. [Google Scholar]
  39. Case Western Reserve University Bearing Data Center. Bearing Data Center: Apparatus and Procedures. Available online: https://engineering.case.edu/bearingdatacenter/apparatus-and-procedures (accessed on 27 March 2025).
  40. Randall, R.B.; Antoni, J. Rolling element bearing diagnostics—A tutorial. Mech. Syst. Signal Process. 2011, 25, 485–520. [Google Scholar] [CrossRef]
  41. Liu, H.; Wang, X.; Lu, C. Rolling bearing fault diagnosis under variable conditions using Hilbert-Huang transform and singular value decomposition. Mech. Syst. Signal Process. 2019, 125, 485–520. [Google Scholar] [CrossRef]
  42. Smith, W.A.; Randall, R.B. Rolling element bearing diagnostics using the Case Western Reserve University data: A benchmark study. Mech. Syst. Signal Process. 2015, 64–65, 100–131. [Google Scholar] [CrossRef]
  43. Junga, W.; Kima, S.H.; Journal, S.H. Vibration, acoustic, temperature, and varying operating conditions for fault diagnosis. Data Brief 2023, 48, 109049. [Google Scholar] [CrossRef] [PubMed]
  44. Chen, Z.; Huang, H.-Z.; Deng, Z.; Wu, J. Shrinkage mamba relation network with out-of-distribution data augmentation for rotating machinery fault detection and localization under zero-faulty data. Mech. Syst. Signal Process. 2025, 224, 112145. [Google Scholar] [CrossRef]
  45. Chen, Z.; Wu, J.; Deng, C.; Wang, C.; Wang, Y. Residual deep subdomain adaptation network: A new method for intelligent fault diagnosis of bearings across multiple domains. Mech. Mach. Theory 2022, 169, 104635–104640. [Google Scholar] [CrossRef]
  46. Chen, Z.; Li, Z.; Wu, J.; Deng, C.; Dai, W. Deep residual shrinkage relation network for anomaly detection of rotating machines. J. Manuf. Syst. 2022, 65, 579–590. [Google Scholar] [CrossRef]
Figure 1. Distribution of AI vs. non-AI methods in recent fault diagnosis studies.
Machines 13 00467 g001
Figure 2. Percentage of papers by component type investigated.
Machines 13 00467 g002
Figure 3. Procedure for signal decomposition using wavelet packet transform [38]. Note: A is approximate information, D is detailed information, H is low-pass filter, and G is high-pass filter.
Machines 13 00467 g003
Figure 4. An example hierarchy with three levels.
Machines 13 00467 g004
Figure 5. WPT-DT framework for bearing fault diagnosis: (a) Data acquisition using an accelerometer and tachometer to collect gearbox vibration and speed data. (b) Fault diagnosis workflow: data acquisition, WPT feature extraction, DT model training, and gearbox condition prediction.
Machines 13 00467 g005
Figure 6. Experimental setup for bearing fault diagnosis: (a) The test rig from the Case Western Reserve University Bearing Dataset. (b) Schematic diagram showing the arrangement of the motor, transducer, and dynamometer for bearing vibration data collection.
Machines 13 00467 g006
Figure 7. Vibration signals from the CWRU dataset for bearing conditions at different loads, used for feature extraction and DT training.
Machines 13 00467 g007
Figure 8. Signal processing using Wavelet Packet Transform (WPT) on the CWRU dataset.
Machines 13 00467 g008
Figure 9. WPT time computation and accuracy of Decision Tree model across decomposition levels.
Machines 13 00467 g009
Figure 10. Effect of the c c p _ a l p h a hyperparameter on Decision Tree accuracy.
Machines 13 00467 g010
Figure 11. Decision Tree structure. The diagram shows the root node-splitting process based on the energy values.
Machines 13 00467 g011
Figure 12. Confusion matrices of the Decision Tree model. The matrices display the classification performance on the training (left) and test (right) sets for normal (N), ball fault (BA), inner race fault (IR), and outer race fault (OR) conditions.
Machines 13 00467 g012
Figure 13. Feature importance of the Decision Tree model. The bar chart highlights the significance of energy features in different frequency bands (Band 1 to Band 7) for bearing fault classification.
Machines 13 00467 g013
Figure 14. Confusion matrices of the Decision Tree model on the KAIST dataset.
Machines 13 00467 g014
Figure 15. Decision Tree structure for the KAIST dataset, illustrating the node splitting process based on WPT-derived energy values.
Machines 13 00467 g015
Figure 16. Feature importance of the Decision Tree model for the KAIST dataset.
Machines 13 00467 g016
Table 1. Description of the rolling element bearing dataset.
Load (HP)     Speeds (rpm)        Fault TypeFault Diameters (mils)Class Label
0 & 1 & 2 & 3     1797 & 1772 & 1750 & 1730        Normal0N
0 & 1 & 2 & 3     1797 & 1772 & 1750 & 1730        Ball Fault7 & 14 &21BA
0 & 1 & 2 & 3     1797 & 1772 & 1750 & 1730        Inner Race7 & 14 &21IR
0 & 1 & 2 & 3     1797 & 1772 & 1750 & 1730        Outer Race7 & 14 &21OR
Table 2. Classification performance and computational time comparison.
Model VariationAccuracyPrecisionRecallF1-ScoreTime Computation (s)
Decision Tree 95.83%95.84%95.83%95.83%0.5022
SVM95.01%95.22%94.90%94.98%2.8126
FFW86.72%87.01%86.50%86.72%69.3481
Table 3. The details of data splitting.
Fault TypeClass LabelTraining (Sample)Validation (Sample)Test (Sample)
NormalN51373242
Ball FaultBA1545221728
Inner RaceIR1491213702
Outer RaceOR1546221728
Table 4. The details of KAIST data.
Load (HP)Speed (rpm)Fault TypeClass Label
03010NormalN
03010Ball FaultBA
03010Inner RaceIR
03010Outer RaceOR
Disclaimer/Publisher’s Note: The statements, opinions and data contained in all publications are solely those of the individual author(s) and contributor(s) and not of MDPI and/or the editor(s). MDPI and/or the editor(s) disclaim responsibility for any injury to people or property resulting from any ideas, methods, instructions or products referred to in the content.

