Article

Digital Twin-Driven Condition Monitoring System for Traditional Complex Machinery in Service

1
School of Mechanical and Electronic Engineering, Wuhan University of Technology, Luoshi Road 122, Wuhan 430070, China
2
Hubei Key Laboratory of Digital Manufacturing, Wuhan University of Technology, Luoshi Road 122, Wuhan 430070, China
3
Institute of Advanced Material Manufacturing Equipment and Technology, Wuhan University of Technology, Luoshi Road 122, Wuhan 430070, China
4
CHN Energy Changyuan Wuhan Qingshan Co-Gengeration Co., Ltd., Qingshan District, Wuhan 430080, China
*
Author to whom correspondence should be addressed.
Machines 2025, 13(6), 464; https://doi.org/10.3390/machines13060464
Submission received: 4 April 2025 / Revised: 25 May 2025 / Accepted: 26 May 2025 / Published: 27 May 2025
(This article belongs to the Section Machines Testing and Maintenance)

Abstract

Improvement in the intelligence and reliability of traditional complex machinery in service (TCMIS) is a prerequisite to guarantee the safety and stable production of these manufacturing enterprises. Existing studies on condition monitoring of TCMIS typically suffer from an insufficient volume of data, incomplete consideration of issues, low monitoring accuracy, and lack of long-term validity. This paper proposes to utilize Digital Twin (DT) technology to construct a new generation of intelligent condition monitoring systems and take the coal mill of a coal-fired power plant as an example for practical illustration. The results of the study show that the method used in this paper is 96% for fault diagnosis, which is higher than the level in existing studies, and the practical application effect in coal-fired power plants also proves the effectiveness of this study. This study can provide program references for the development of intelligent transformation of TCMIS, and also provide technical support for the application and promotion of DT technology in this field.

1. Introduction

With the accelerating integration of information technology and the manufacturing industry, the intelligence of mechanical equipment is constantly improving [1]. Automobile manufacturing, as a representative of a group of manufacturing enterprises, is gradually moving toward semi-automated or automated production, and various types of intelligent equipment are emerging. In contrast, traditional complex machinery in service (TCMIS, e.g., cement rotary kilns, coal mills, steam turbines) is lagging in this tide of intelligence. The primary reason is that such equipment is manufactured early and is not fully considered for future technological development at the design stage, which makes the feasibility of substantial upgrading of the equipment quite low. Additionally, because the equipment is expensive and can remain in service, it is hardly acceptable for enterprises to purchase intelligent equipment for replacement.
On this background, adopting advanced sensing, data analysis, equipment modeling, and machine learning technologies to provide condition monitoring services, including remote monitoring, state evaluation, fault diagnosis, and trend prediction, is a proven method to enhance the intelligence and reliability of equipment nowadays [2,3,4]. For example, Pourbabaee et al. [5] proposed a gas turbine sensor fault detection method based on a multi-model approach. Salahshoor et al. [6] developed an industrial turbine condition monitoring model based on a support vector machine and an adaptive neuro-fuzzy inference system. Cai et al. [7,8] applied the deep learning method to the health monitoring process of bearings and obtained satisfactory results. Liu et al. [9] and Kouadri et al. [10] analyzed and investigated the condition monitoring and fault diagnosis of cement rotary kiln. Li et al. [11] and Zhu et al. [12] proposed a fault diagnosis and health monitoring algorithm for coal mills based on the knowledge of the mechanism and the historical operation data, and verified the accuracy of the algorithm using the actual data. Zhao et al. [13] and Liu et al. [14] reviewed the research on machine learning and artificial intelligence in the field of mechanical equipment. However, the above studies were usually conducted in the laboratory, and most of them have simplified the operating conditions, coupled with the structure of the equipment being relatively complex, the information contained in the historical database is insufficient, which leads to high accuracy in the established condition monitoring model or algorithm being difficult to achieve in the actual operation of the equipment all the time.
The Digital Twin (DT) has attracted much attention from academia and industry in recent years [15]. This technique proposes to construct a virtual model in digital space that can accurately map the operating state of the physical entity, and through real-time interactions between the model and the entity, the model always keeps consistent with the entity, and compared to concepts such as digital model and digital shadow, the DT has more emphasis on the two-way connection between the virtual model and the physical entity [16,17,18]. Based on the virtual model and virtual-physics fusion data, it enables the simulation, monitoring, diagnosis, prediction, and control of the working process of the physical entity [19]. Condition monitoring and fault diagnosis are the most discussed and studied applications of DT technology. Some researchers have applied DT in health management studies of different devices and achieved favorable results [20,21,22,23,24,25,26], which proves the enormous potential of this technique in the field of condition monitoring of devices.
This study proposes to apply DT technology to construct the condition monitoring system of TCMIS in response to the problems of insufficient historical information, inadequate modeling accuracy, lack of dynamic adaptive ability, and poor practicality in condition monitoring. The paper takes the practical demand of manufacturing enterprises as a guide, adopting the latest achievements of the DT theory, and dividing the condition monitoring system of TCMIS into physical layer, data layer, model layer, and application layer, based on which the implementation steps of the application are further proposed. This paper utilizes the coal mill of a coal-fired power plant as an example to put the proposed theory and method into practice. This research can provide a solution reference for the development of intelligent transformation of TCMIS and improve the operational reliability of the equipment. And it also provides technical support for the landing application of DT technology in manufacturing enterprises and expands the practical application value of DT technology.
The organizational structure of this paper is shown in Figure 1. The remaining parts of this paper are organized as follows. Section 2 provides a brief introduction to the theory of DT and its application in the field of equipment condition monitoring. Section 3 presents the condition monitoring system of TCMIS based on DT technology. Section 4 provides the practical validation of the proposed theory and methodology with the example of a coal mill. Section 5 elaborates the conclusions.

2. Research Advances in the DT

2.1. Brief Introduction to the Development of the DT

The concept of the DT was first proposed by Prof. Grieves in 2003 [27], but due to technological and cognitive constraints at that time, the concept did not receive much attention and was not named “Digital Twin”. In 2010, NASA formally introduced the “Digital Twin” in a published report [28], where it defined the DT as “an aircraft or system oriented, making full use of the best physical models, sensors, and operating historical data, integrating multi-disciplinary and multi-scale probabilistic simulation processes, and mapping the state of its corresponding physical aircraft.” Since then, the research and discussion on the DT have gradually increased [29].
The DT refers to using digital technology to reconstruct and simulate the dimensional structure, action behavior, and current state of physical entities in virtual space, so as to realize the simulation, evaluation, prediction, optimization, and control of physical entities [16,17,18]. The technology is expected to achieve a high-fidelity digital description of a product’s entire life cycle, from conceptual design, manufacturing, operation and maintenance, and end of life, and to develop applications such as design optimization, process improvement, fault diagnosis, and life prediction with the help of high-precision modeling and big data analysis.
Some researchers have reviewed and analyzed the development and application of DT technology in the manufacturing field [30,31,32,33]. Wei et al. [34,35] applied DT technology to the maintenance of the Computer Numerical Control Machine Tool (CNCMT), and Tao et al. [36] elaborated on the idea of constructing a DT workshop in their published research. In addition, several large multinational enterprises are also actively applying and promoting DT technology.
Although different scholars and enterprises have different comprehensions of the DT, they all agree that the core of this technology is to create a virtual model that can accurately map the physical entity. The ideal virtual model should be an integrated multi-physics, multi-scale, ultra-realistic simulation model, which is always consistent with the physical entity through real-time interaction with the physical space and online iterative updating during the service process.

2.2. DT-Based Equipment Condition Monitoring

The DT model proposed by Prof. Grieves consists of three parts: the physical entity in the physical space, the virtual model in the virtual space, and the connection between the virtual space and the physical space [37].
To further promote the application of the DT in more scenarios, Tao et al. [38] proposed the DT five-dimensional model. This model includes the physical entity, virtual entity, DT data, connection, and service. As a generalized guiding framework, this model makes a more detailed analysis of the connotations and characteristics of the DT.
The emergence of DT technology provides new ideas for the research of equipment condition monitoring. For example, several researchers have explored the health monitoring of rotating machinery based on the DT [20,39,40]. Xue et al. [24] proposed a method for fault diagnosis of CNC machine tools with DT technology. Yu et al. [41] investigated a health monitoring method for a DT-driven optoelectronic system and obtained favorable results. Khalid et al. [42] investigated the potential of DT technology in aircraft health management and demonstrated the superiority of the method through a real case study.
Compared with traditional equipment condition monitoring research, the DT emphasizes more the accuracy of the established model and requires the interactive fusion and symbiotic evolution between the physical entity and the virtual model. Hence, the condition monitoring based on the DT technology also has the capacity of online dynamic self-optimization, and the condition analysis method is converted from relying on the monitoring data of the physical entity only to relying on the fusion data of the physical entity and the virtual model. These significant advantages enable the DT to be the future development trend of equipment health monitoring.

3. DT-Driven TCMIS Condition Monitoring System

3.1. The Characterization of TCMIS

This paper is concerned with the health state management of traditional complex mechanical equipment that is in service in the manufacturing enterprise. These devices undertake heavy production tasks, and the status of their operation is related to the production capacity of the enterprise. To enhance the reliability of the production process, manufacturing companies commonly adopt the machine maintenance plan that combines on-site shift patrol and regular maintenance, but this method requires high labor costs and overly relies on the operating experience of the workers, and the level of informatization and intelligence is relatively weak. So, improving the automated condition monitoring capability of such equipment and raising the level of intelligence is now a challenge for these companies.
Since the TCMIS has been designed and manufactured earlier and is currently in its service lifecycle, it is commonly characterized by several of the following issues.
(1) The monitoring devices installed on the equipment are insufficient and do not provide accurate measurements of some important parameters.
(2) The complex structure of the equipment makes it hard to conduct substantial upgrading and modernization.
(3) The equipment is expensive, and the cost of replacement is very high.
(4) The working process of the equipment is complex and involves multiple parameters, thus rendering comprehensive and accurate modeling of the equipment difficult.
(5) There are many types of equipment faults, and the information contained in the historical database is generally incomplete.
Traditional monitoring approaches normally select partial parameters and typical operating conditions of the equipment for analysis, and the input data are only obtained from the historical database. These studies lack a comprehensive description of the equipment, and the algorithms or models are rarely adapted to the realistic operation process, so the outcomes achieved in the laboratory cannot be effectively applied in practice.
The vigorous development of the DT has brought new vitality to the condition monitoring research of TCMIS. The features of high-precision models, virtual-reality fusion analysis, and online iterative optimization elaborated in the DT theory will compensate for the shortcomings of the existing condition monitoring methods.

3.2. The Condition Monitoring System of TCMIS

Based on the theory of DT and the characteristics of TCMIS, this paper proposes the condition monitoring system shown in Figure 2, which consists of the physical layer (PL), data layer (DL), model layer (ML), and application layer (AL).
Table 1 explains the core elements and primary function of each layer and also expresses the correlation between the layers.
The physical layer contains the physical entity of the equipment, monitoring devices, data transmission devices, etc., and is the basis of the condition monitoring system. This layer requires that the monitoring of the physical entity is as comprehensive as possible, and the measurement accuracy, range, and environmental adaptability of the monitoring devices meet the requirements. In practice, this can be realized by adding and replacing the devices.
The data layer receives and processes the data of this system. The hardware of this layer includes the server, industrial computer, data communication equipment, etc., and the software includes the cloud service, databases, communication software services, and data processing algorithms. This layer is the support of the system, and the massive data generated during the operation of the system are the origin of the virtual model, monitoring algorithms, and monitoring software. In practical applications, the data layer must store and transmit the data accurately, quickly, efficiently, and safely.
The model layer deploys the virtual model of the equipment, which is the core of the system. The ideal virtual model of mechanical equipment should cover multiple dimensions and domains and provide a complete and accurate description of the mechanical, electrical, and hydraulic characteristics of the device. To ensure that the virtual model remains consistent with the physical entity throughout the life cycle of the device, the model needs to be able to interact with the physical entity in real time and self-optimize in response to changes in the entity.
The application layer includes the condition monitoring algorithms and the visualization monitoring platform, which is the ultimate purpose of this system. This layer is based on fusion data and mechanism knowledge, and it usually requires the methods of big data analysis, statistical theory, and machine learning to realize the condition assessment, fault diagnosis, trend prediction, and fault forewarning of TCMIS. The results of condition monitoring are integrated into the monitoring platform and presented around the dynamic 3D model of the equipment, which allows the user to intuitively and conveniently grasp the operating status of the equipment.
During the actual operation of the equipment, the physical layer transmits the monitoring data to the data layer for processing and storage in real-time. At the same time, the model layer will request the data from the data layer for simulation and analysis, and the model layer will also transmit various data generated in the virtual space to the data layer for processing and storage; if necessary, the virtual model must optimize its structure or parameters to adapt to the changes of the mechanical equipment. The algorithms deployed in the application layer utilize the acquired real-time and historical data of the equipment, as well as the real-time and operational data of the virtual model, and compute the operational status information of the equipment, and this information will be transmitted back to the data layer and sent to the visualization monitoring platform in the meantime.
Based on the above research and analysis, this study proposes the implementation steps of the DT-based TCMIS condition monitoring study, as shown in Figure 3. Step 1 denotes a comprehensive perception of the operating state of the physical entity, and this step belongs to the PL. Step 2 represents building the data service system to process and store various data information, and this step belongs to the DL. Step 3 represents the establishment of a high-precision virtual model of the physical entity, and step 4 denotes the realization of self-assessment and self-optimization of the model during operation. Steps 3 and 4 belong to the ML. Step 5 and step 6 denote state assessment and fault diagnosis of the equipment, respectively. Step 7 represents that the condition monitoring of the equipment will be realized through the visualization monitoring platform, and steps 5, 6, and 7 belong to the AL.

4. Application Case

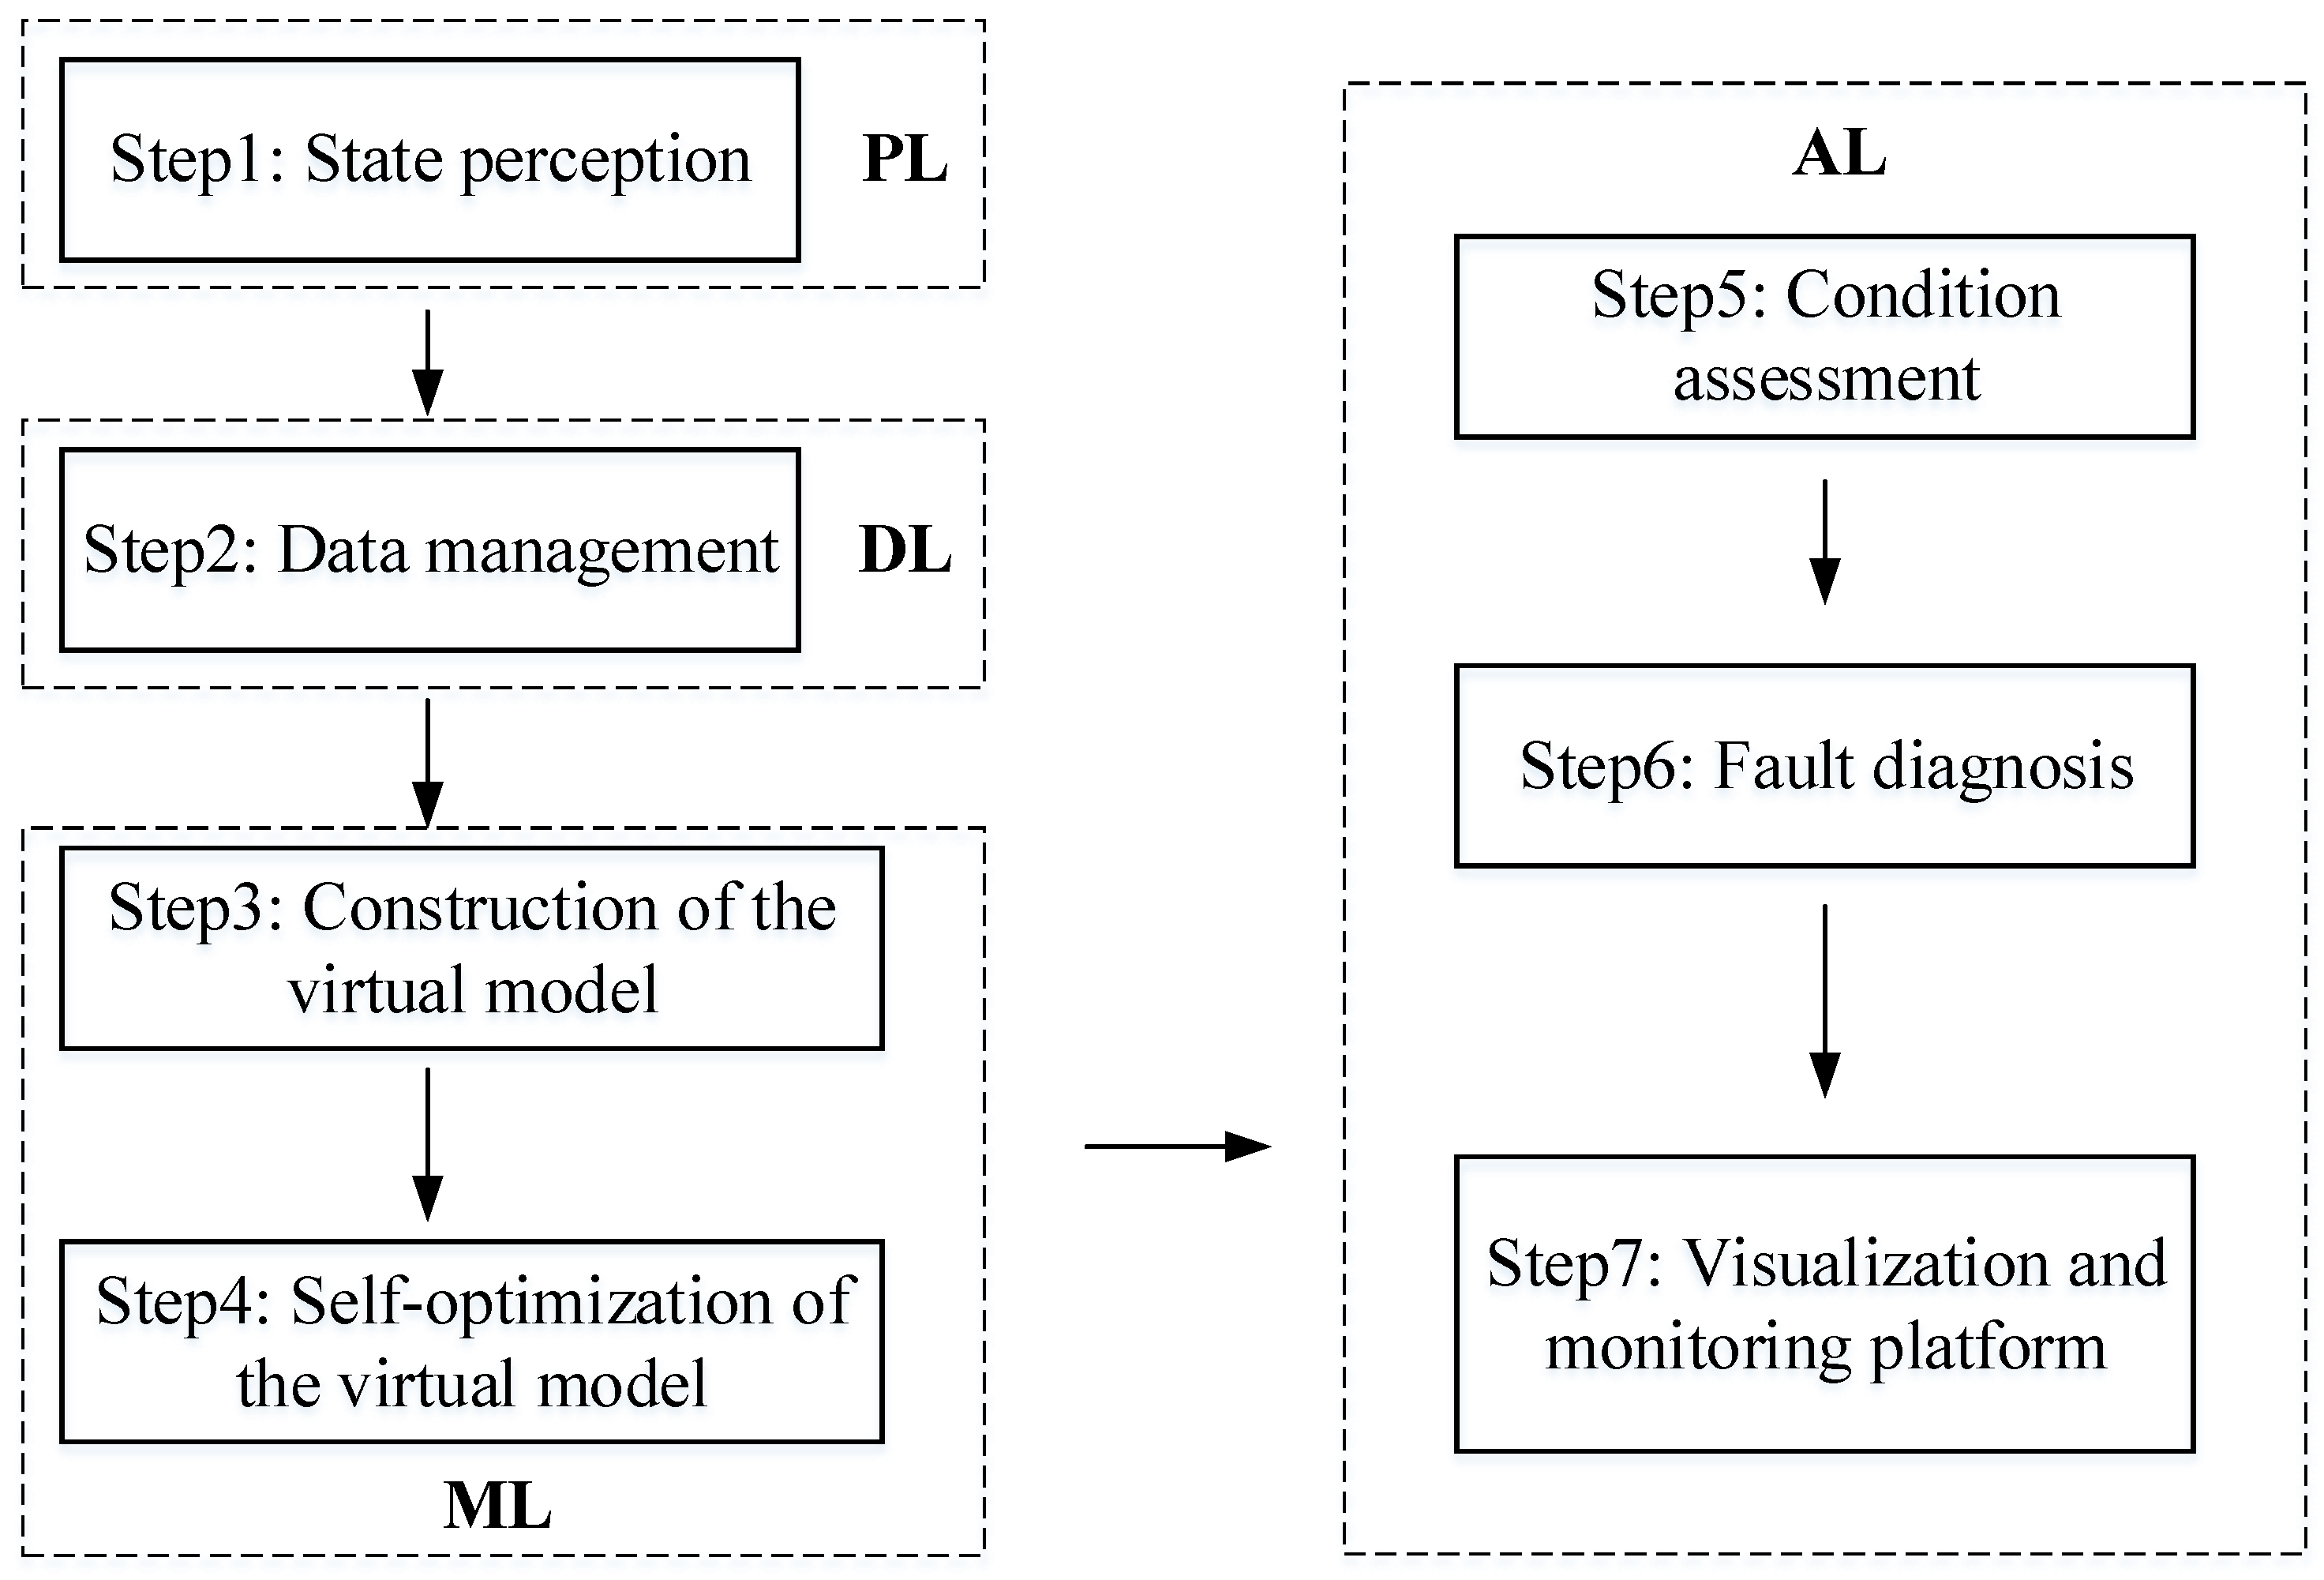
This Section provides a practical validation of the theories and methods mentioned above using the coal mill of a coal-fired power plant as an example.

4.1. The Background of the Application Case

Coal mills are important auxiliary equipment in coal-fired power plants, and their function is to grind raw coal into pulverized coal with qualified fineness and convey the powder to the furnace of the boiler for combustion. This paper takes the MPS170HP-II medium-speed coal mill of the 350 MW coal-generating electricity set of CHN Energy Changyuan Wuhan Qingshan Co-Generation Co., Ltd. at Wuhan, China, as the research object. Figure 4 shows the schematic structure of this coal mill. The technique of this coal mill is sourced from the Babcock Company (London, UK) and manufactured by a Chinese corporation. It has been in service for more than ten years and belongs to the typical TCMIS.
Owing to the complex structure, heavy workload, and harsh working environment, abnormalities or faults are inevitable for coal mills in the operation process. To improve the reliability of the equipment, some scholars have already conducted relevant research on coal mill fault diagnosis, wear assessment, internal condition volume monitoring, and the methods used include Bayesian estimation [43], support vector machines [44], deep learning [45], hybrid methods [46], and so on. Although these methods can work in certain operating conditions, they have not taken into account the dynamic variations in the service process of the equipment, and still face several problems as described in Section 3.1.
The research of DT technology in coal-fired power plants is still in the beginning phase, and several researchers have discussed and analyzed the application and development of DT theory in power systems [47,48], but the studies are still dominated by analysis and exposition. This paper explores the intelligent monitoring technology for coal mills based on digital twins and investigates the practical application of the theories presented in Section 3.2 of this paper.

4.2. The Strategy for State Perception

Figure 5 shows the process of state perception and operation control of the coal mill. This type of coal mill has some sensors pre-installed before service, and the data types collected include temperature, pressure, flow rate, etc. According to the field statistics, there are about 50 monitoring points on a single coal mill in this unit. To ensure the safety and stability of the production process, all monitoring data of the coal-fired power plant (including sensor monitoring data and non-sensor monitoring data such as power generation load and operating power) are managed by the distributed control system (DCS).
Although the current sensing ability of the generating unit can guarantee the normal operation of the coal mill, it still lacks the real-time accurate measurement of some important state information of the equipment. For example, the lack of measurement of coal mill vibration data has resulted in the need to subjectively determine the magnitude of the current vibration by visual observation. Therefore, in order to improve the sensing ability of the coal mill, this paper proposed to install new sensors for the important parts that lack monitoring devices and to unify the monitoring data collected by the new sensors with the original monitoring data.
After an on-site investigation and comprehensive consideration of the necessity and feasibility of installing sensors at various locations, this paper has developed a new sensor scheme as shown in Table 2. Figure 6 displays some of the added sensors installed in the field.
The data captured by the existing monitoring devices in this coal-fired power plant are all transmitted to the DCS by wired transmission. The data acquisition method of the new vibration sensor and temperature sensor is the same as that of the original similar sensors, and the monitoring data are transmitted to the DCS through the data acquisition card. The data from the strain sensor are first read and converted by the data acquisition software deployed in the field industrial computer, and then transmitted to the DCS by Modbus protocol. The DCS can send all the collected data to other authenticated systems through the isolation facilities.

4.3. The Methodology for Data Management

Coal-fired power companies have strict data management regulations that do not allow other systems to send operational commands to the control system in the segregated area of production, and all interactions with the information systems in the office area must also be strictly regulated.
Based on this, this paper proposed to build a data service system connecting the production isolation area and the office area in the internal network environment of the enterprise, to realize the safe and efficient management of all the data in the intelligent monitoring system of the coal mill based on DT. 
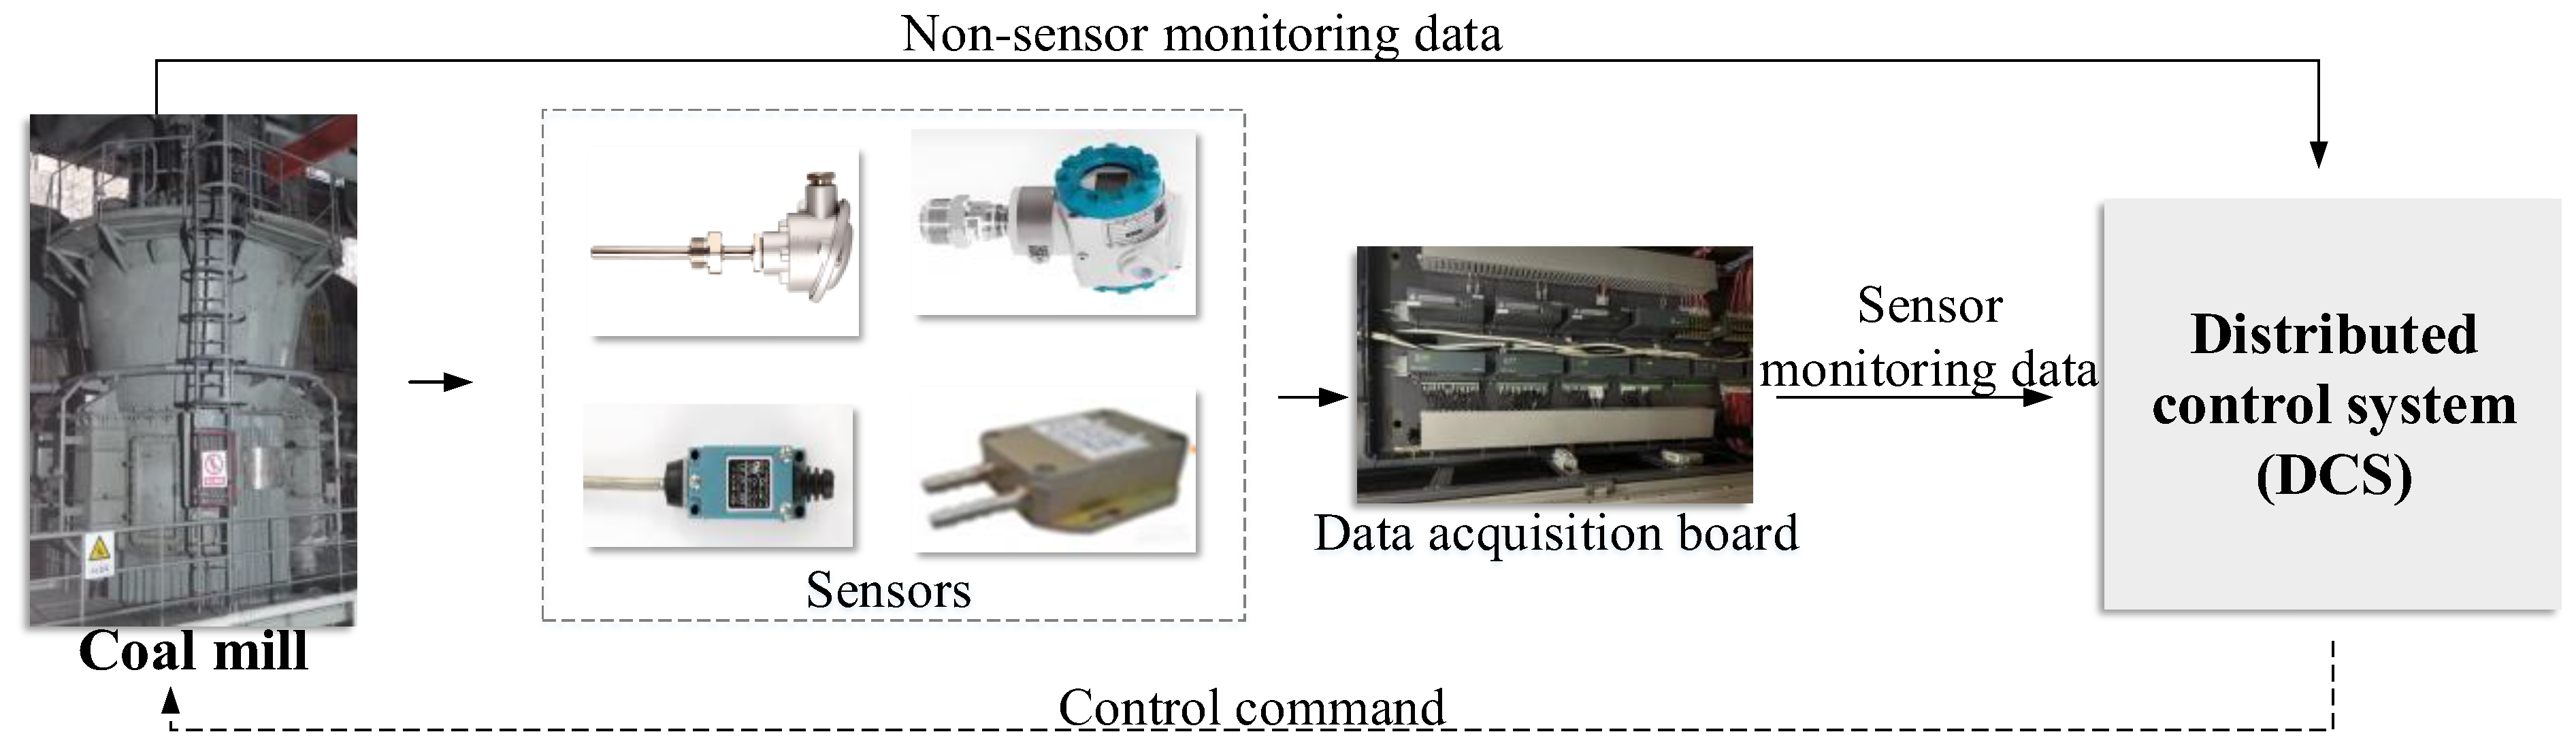
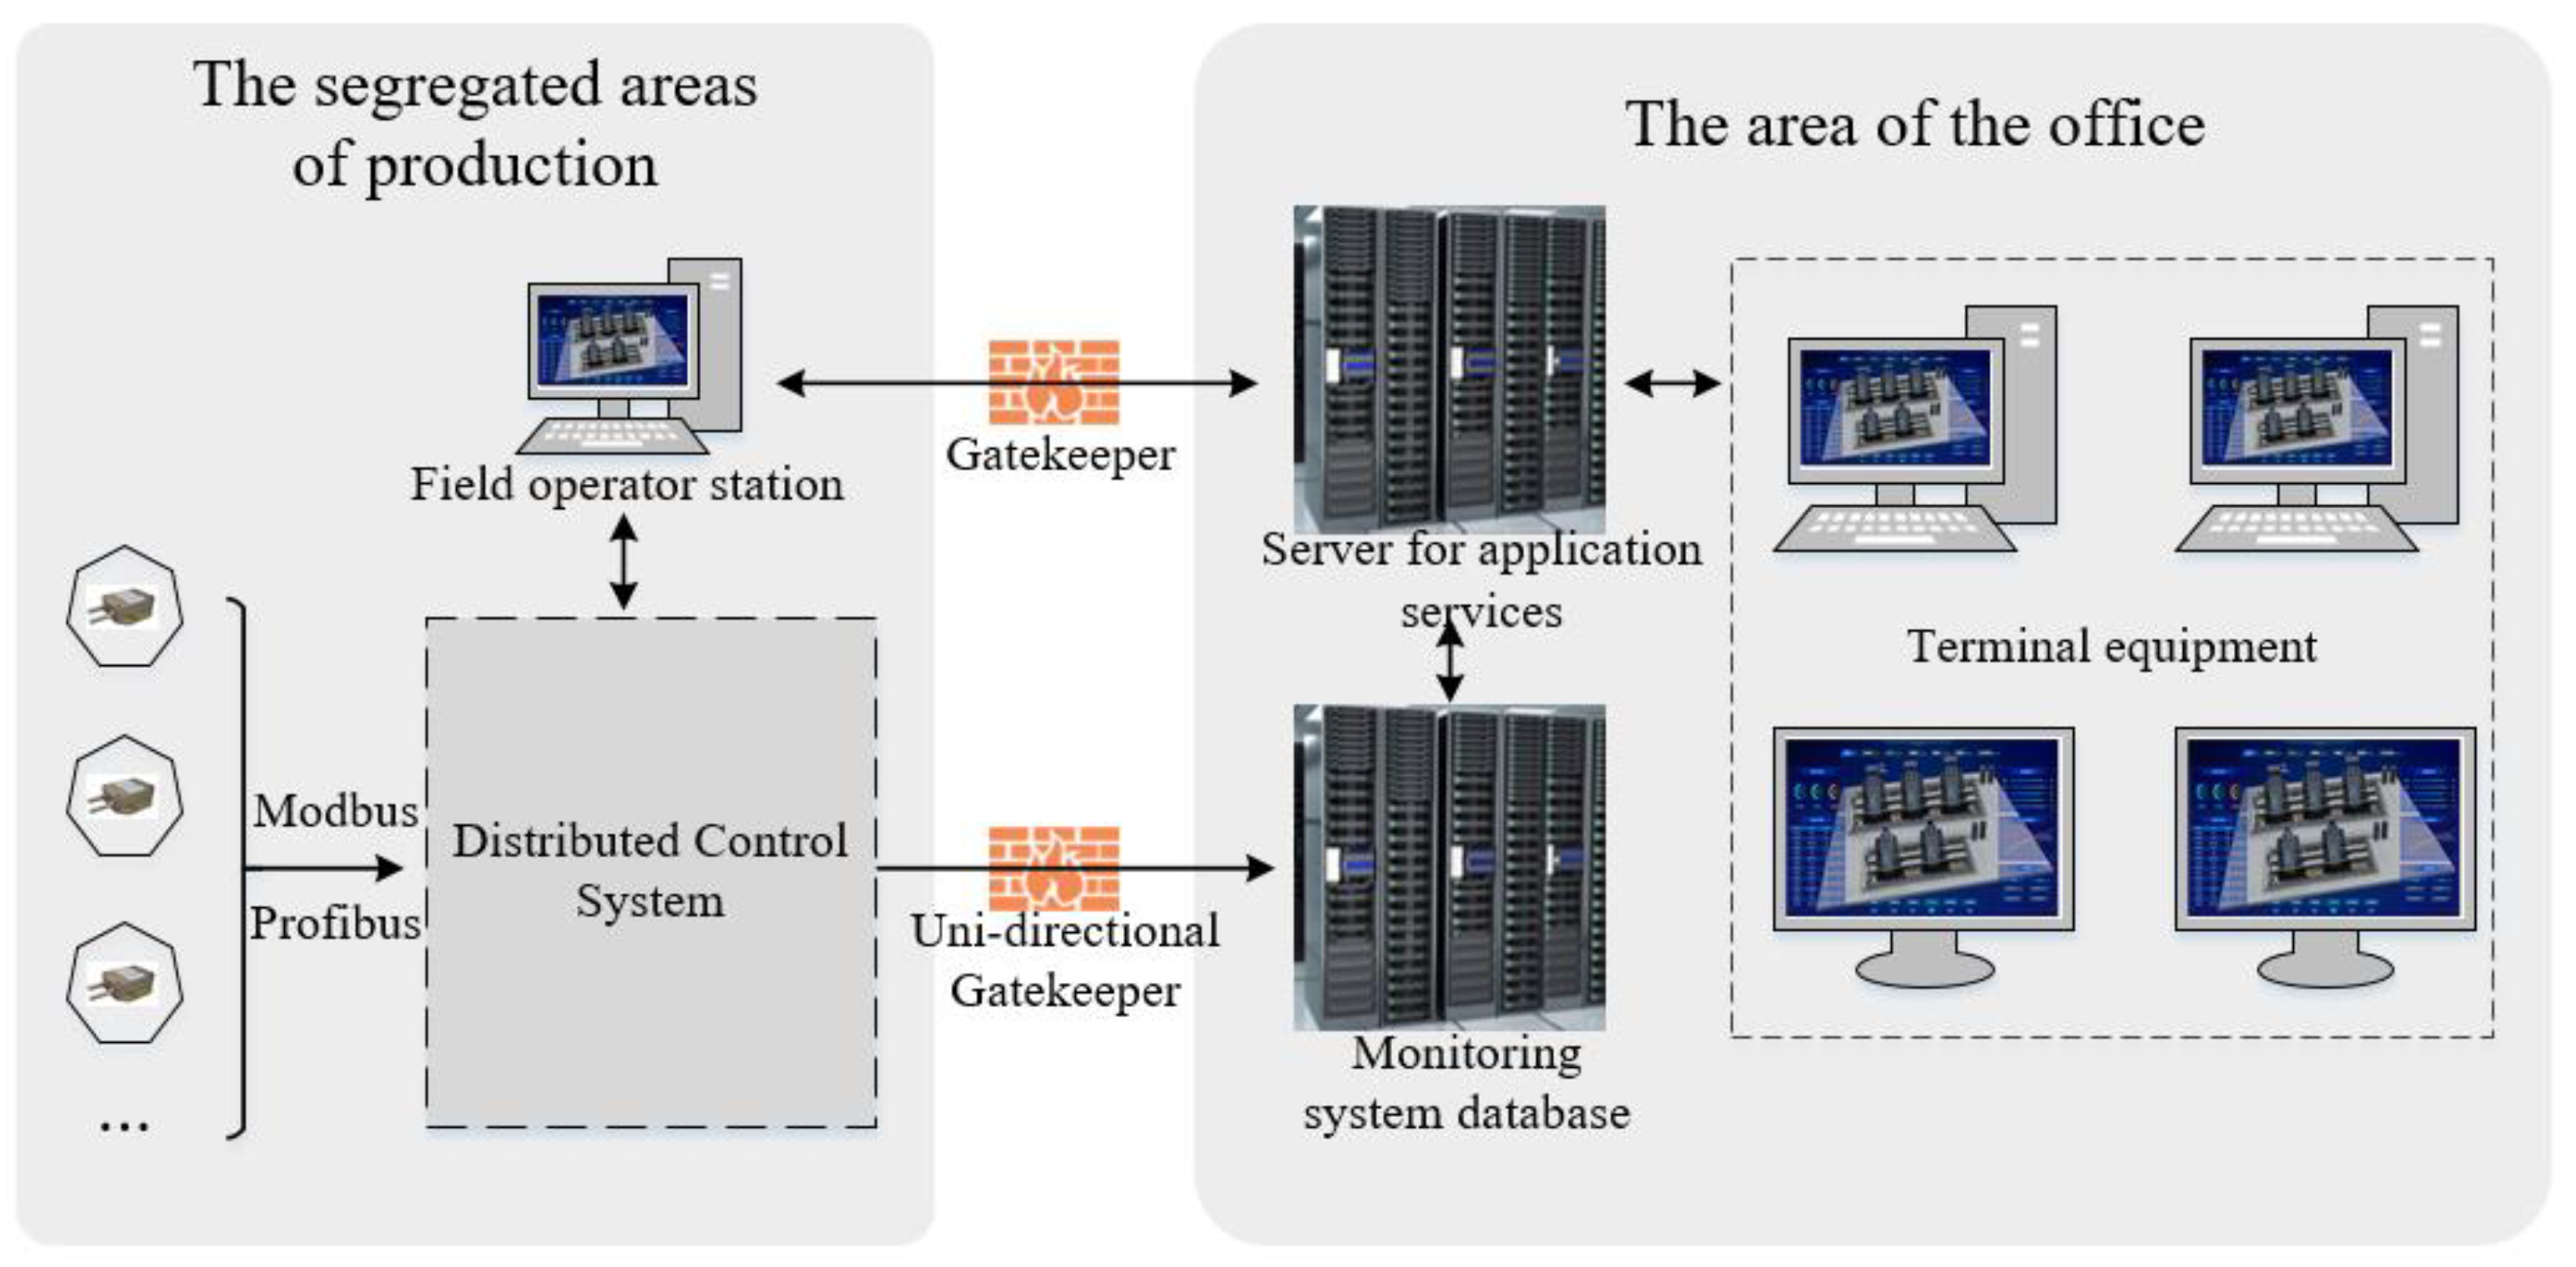
Figure 7 shows the schematic diagram of the data transmission process of the data service system built in this paper. The DCS in the segregated area of production transmits the real-time operation data of the equipment, environmental parameters, personnel situation, and other information to the data server in the office area through the communication protocol. The programs deployed in the application server will request the required data from the data server, and upload the important process data and calculation results of the programs to the data server for processing and storage. The condition monitoring platform deployed in the application servers will be made available to the office and segregated production areas through the local area network, and users will be able to realize real-time access to and operation of the monitoring platform using terminals within the network.
The data used in this article come from various sources and data types, and the read-and-write requirements of the applications deployed on the application server vary greatly. Therefore, to improve the comprehensive performance of the database, reduce data redundancy, and improve the flexibility of processing, this paper divides all the data involved into three categories and chooses relational database, document database, and Key-Value database for storage, respectively.
The first type of data includes the basic attributes of the coal mill, the parameter information of the virtual model, the basic data of the monitoring platform, etc. These kinds of data are an important basis for supporting the digital twin system. Although the amount of data is not large, there is a strong correlation between the data, so this paper uses the MySQL database to store them.
The second type of data is the monitoring data of the physical entity and the simulation analysis data of the virtual model, which contains the state information of equipment and is the basis for carrying out the research of equipment condition monitoring. These kinds of data are large in scale and diverse in type and require high real-time performance. Therefore, the MongoDB database is used to store these kinds of data in this paper.
The third kind of data is mainly the temporary data in the system, such as the process data of user session calculation, cache data, etc. These data types are diverse, and the speed of reading and writing is fast, which is an important link to ensure the normal operation of the system. In this paper, the Redis database is used to store these kinds of data.
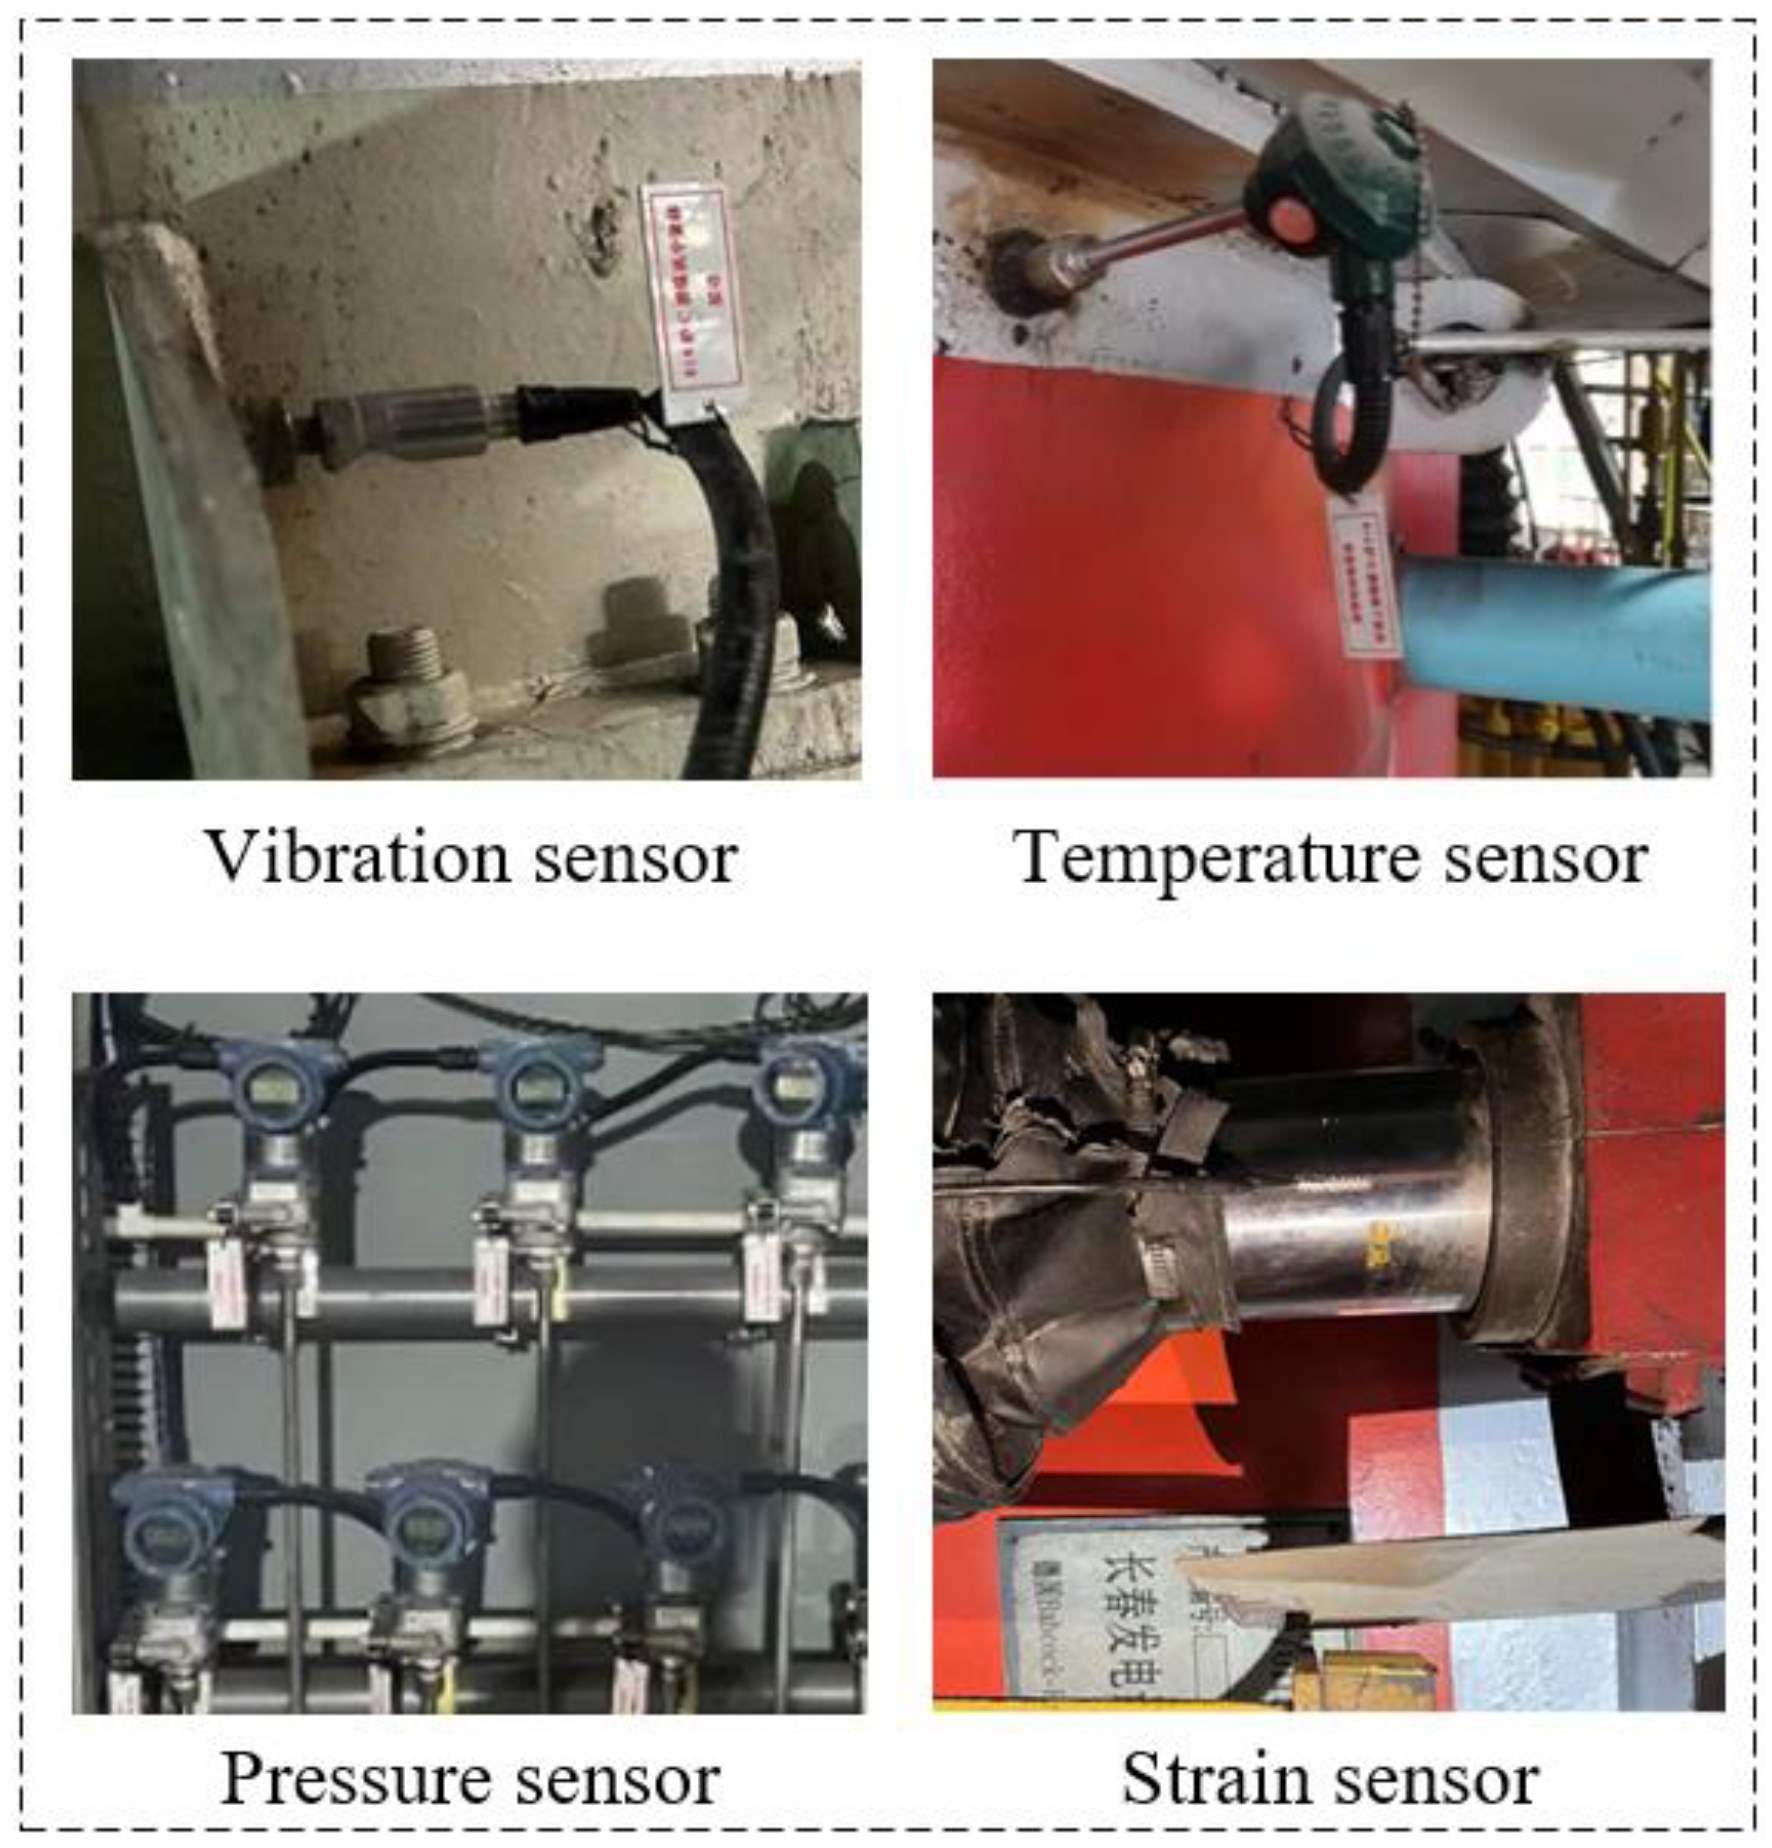
Data preprocessing is also required for the input data collected by the sensors because of the presence of information such as missing values, noise values, and redundancy values in the raw collected operating data. In this paper, data preprocessing steps such as missing value supplementation, trend term elimination, and noise signal rejection are carried out according to the differences in data types at the time of implementation.

4.4. The Construction of the Virtual Model

The virtual model is the core component to realize various functions such as simulation, fault diagnosis, etc. The virtual model can turn the application functions from theory to reality under the data drive, and the virtual model is the “heart” of the digital twin application. Therefore, the establishment of a digital twin virtual model that can accurately map and simulate the operating state of the coal mill is the basis and guarantee for subsequent research.
The research on coal mill modeling emerged in the 1970s and 1980s, with the rapid development of technology, some scholars have established models that can simulate the pulverizing process based on the rich historical data of the equipment in recent years [49]. Our research group has constructed an improved coal mill model in previous studies and tried to apply the model to condition assessment, fault diagnosis, and trend prediction of the equipment [50,51]. However, these models failed to fully consider the substances and variables involved in the pulverizing process, and more importantly, they lacked the dynamic self-optimization mechanism, which made it difficult to adapt to the fluctuations of the equipment during the service process.
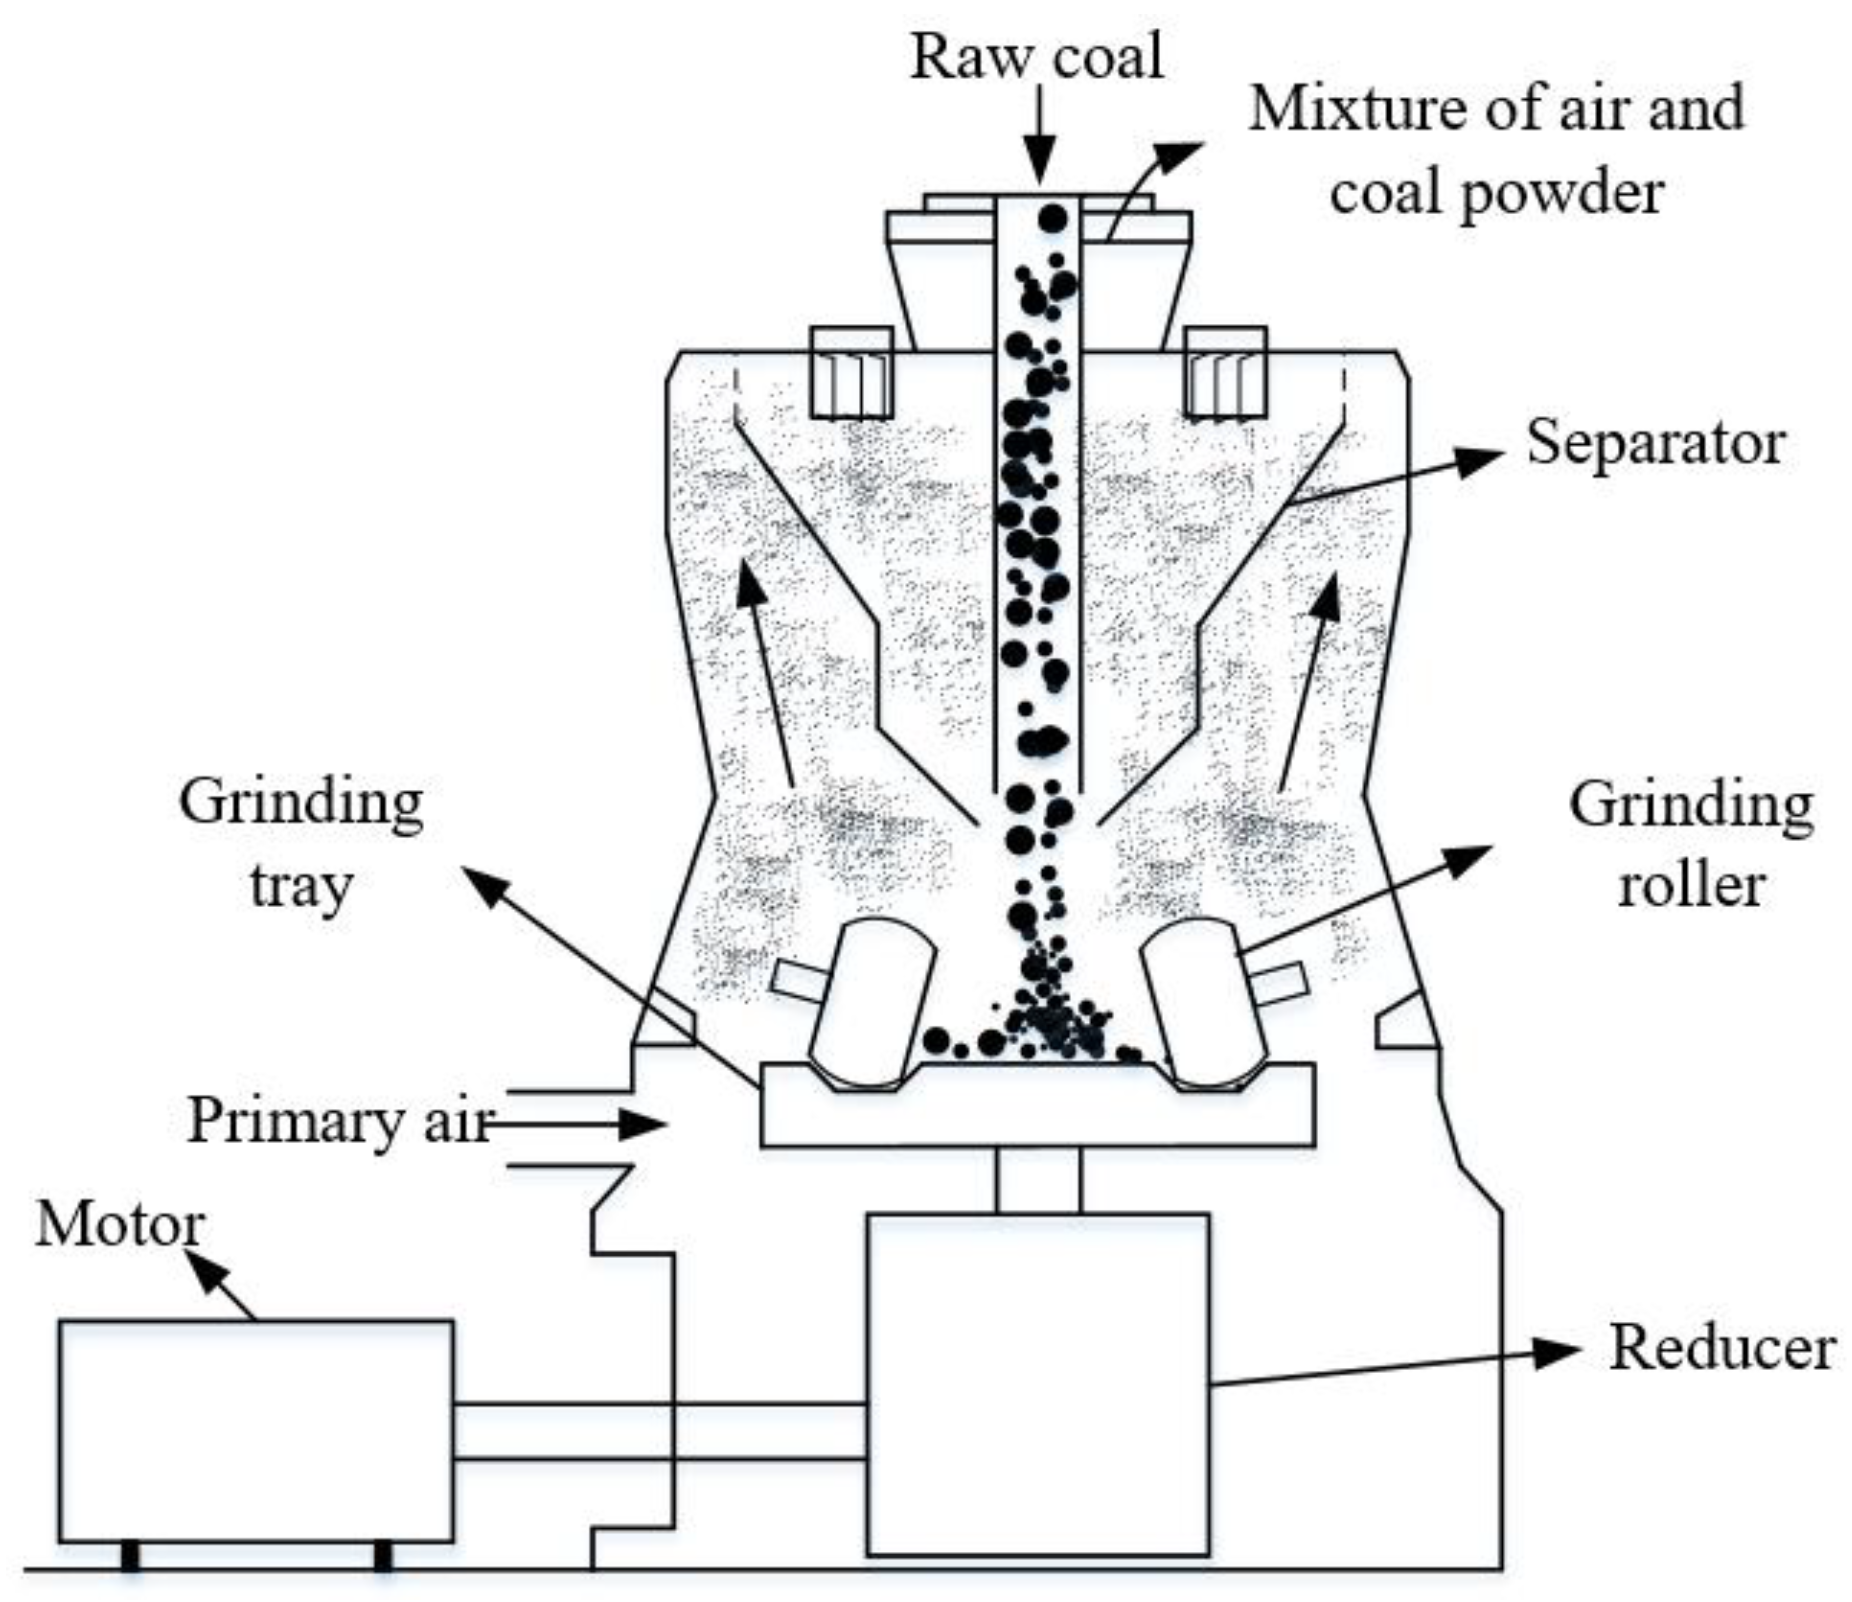
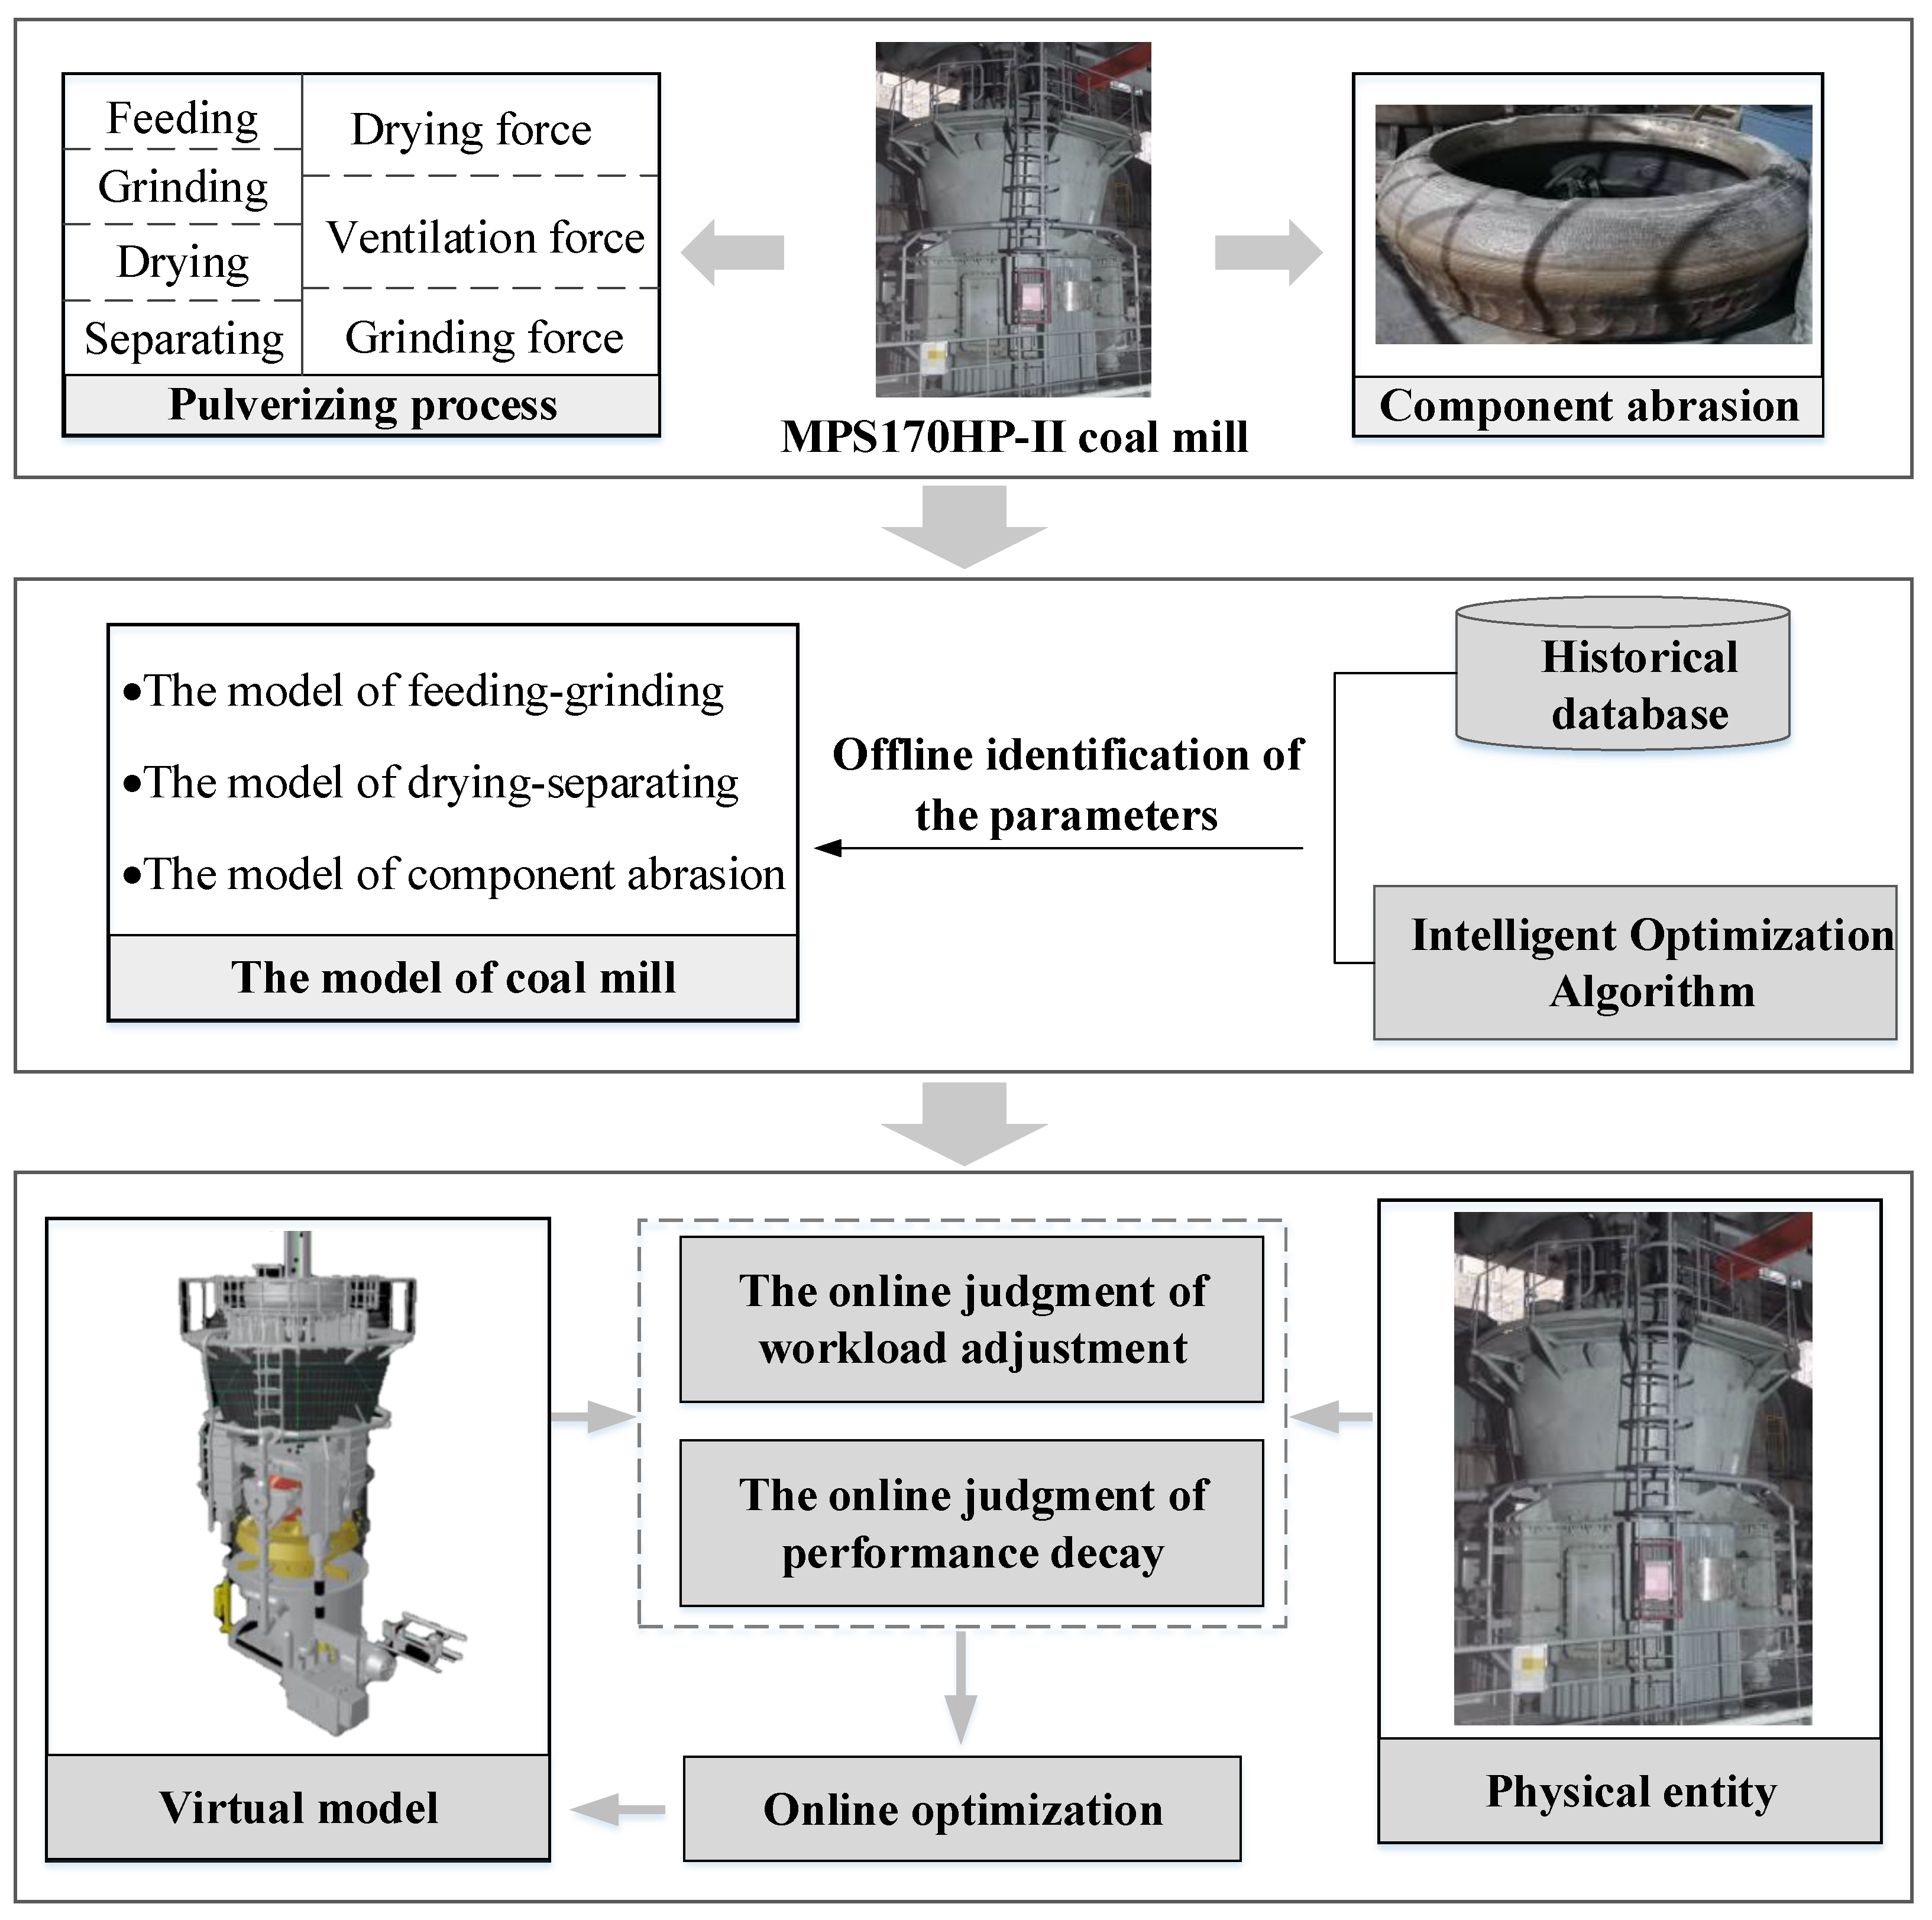
Through systematic analysis of material flow, energy delivery, and force characteristics of the pulverizing process, this research proposed to divide the virtual model of the coal mill into three processes, including feeding–grinding, drying–separating, and component abrasion. The feeding–grinding process includes raw coal dropping into the tray and grinding raw coal into powder, the drying–separating process includes evaporating the water in the coal and exporting qualified pulverized coal, and the component abrasion process considers the influence of abrasion on the output of the device. Then the model of each process is established according to the material flow situation, energy balance relationship, and parameter interactions, and is coupled based on the correlation relationship of inputs and outputs between the models of different processes. The model developed is expressed by Equations (1)–(21), and the meaning of the symbols in the model is given in the Nomenclature.
M c o n v = ( K 1 W g p + K 2 ) × ( 1 A b )
M ˙ c = W c M c o n v M c
W g p = O g r i n d O r e a c
M ˙ p f 1 = M c o n v M c D c o n v M p f 1
I = K 3 M c + K 4 M p f 1 + K 5 W g p + K 6
D c o n v = K 7 ( K 8 T i n θ c m )
M ˙ p f 2 = D c o n v M p f 1 W p f
W p f = K 9 Δ P M p f 2
Δ P = ( K 10 + K 11 ( M c + M p f 1 + M p f 2 ) ) ( W a i r 10 ) 2
C m i x ( M c + M p f 1 + M p f 2 + M m e t a l ) T ˙ o u t = Q i n Q o u t
Q i n = Q a i r + Q r c + Q s e a l + Q m a c
Q o u t = Q a i r & s e a l + Q Δ M + Q p f + Q l o s s
Q a i r = C i n T i n W a i r
Q r c = C r c W c T r c
Q s e a l = C L T L K s e a l W a i r
Q m a c = K m a c I
Q a i r & s e a l = C o u t T o u t ( 1 + K s e a l ) W a i r
Q Δ θ = Δ θ W c ( 2500 + C H 2 O T o u t C H 2 O T r c )
Q p f = 100 θ c m 100 W c C p f ( T o u t T r c )
Q l o s s = K l o s s Q i n
A b = 0.05 × ( 1 10 10 + ( K 12 ) × Δ t )
The adjustable parameters are the key to determining the performance of the model. Compared with the parameter identification method in the previous studies, this research presents a combination of offline identification and online self-optimization of the parameters. In the offline identification phase, it is required to manually select the representative data as the training set, and identify the values of all adjustable parameters through iterative optimization by the genetic algorithm [49,50]; after this phase, the model is able to accurately map the current state of the coal mill.
During the service of the equipment, this research designed an online optimization mechanism based on workload adjustment and performance decay. A significant adjustment of the workload will modify the quantity of feed coal, which will trigger the automatic control logic of the equipment to adjust other inputs and affect the balance between the parameters inside the machine, so the optimization of the parameters of the model is necessary. Performance decay is unavoidable in the life cycle of the equipment, such as fatigue or wear of the components, at which time the virtual model must be optimized adaptively to keep pace with the entity. Figure 8 illustrates the process of constructing the virtual model of the coal mill.
It is to be noted that the model should be validated for accuracy after the optimization, both in the offline and online phases. This study evaluates the model based on the deviation between the computed output of the model and the actual values. If the accuracy fails to meet the requirements, then the model needs to be optimized again.
Table 3 displays the performance comparison between the model in this study and the model in the previous study, where I denotes the current of the coal mill, ΔPpa denotes the differential pressure of primary air, and Tout denotes the outlet temperature. The MSE denotes the mean square error between the actual value and the output calculated by the model, while the RE denotes the relative error. The results show that the model constructed in this study is closer to the actual coal mill when the equipment is in healthy operation.

4.5. The Development of Condition Monitoring Applications

To address the condition monitoring demands of coal mills, this research designs algorithms for parameter monitoring, condition assessment, and fault diagnosis based on the foregoing, and they are practically deployed in coal-fired power plants.
In terms of operation parameter monitoring, this study filters and presents the data of all monitoring points of the coal mill. Several points have been set with alarm thresholds or shutdown thresholds during the design stage, so these parameters are required to set different grades of alarm conditions in strict accordance with the design criteria. For critical monitoring points without alarm thresholds, different priority alarms are designed by integrating expert operational experience and statistical analysis of historical data.
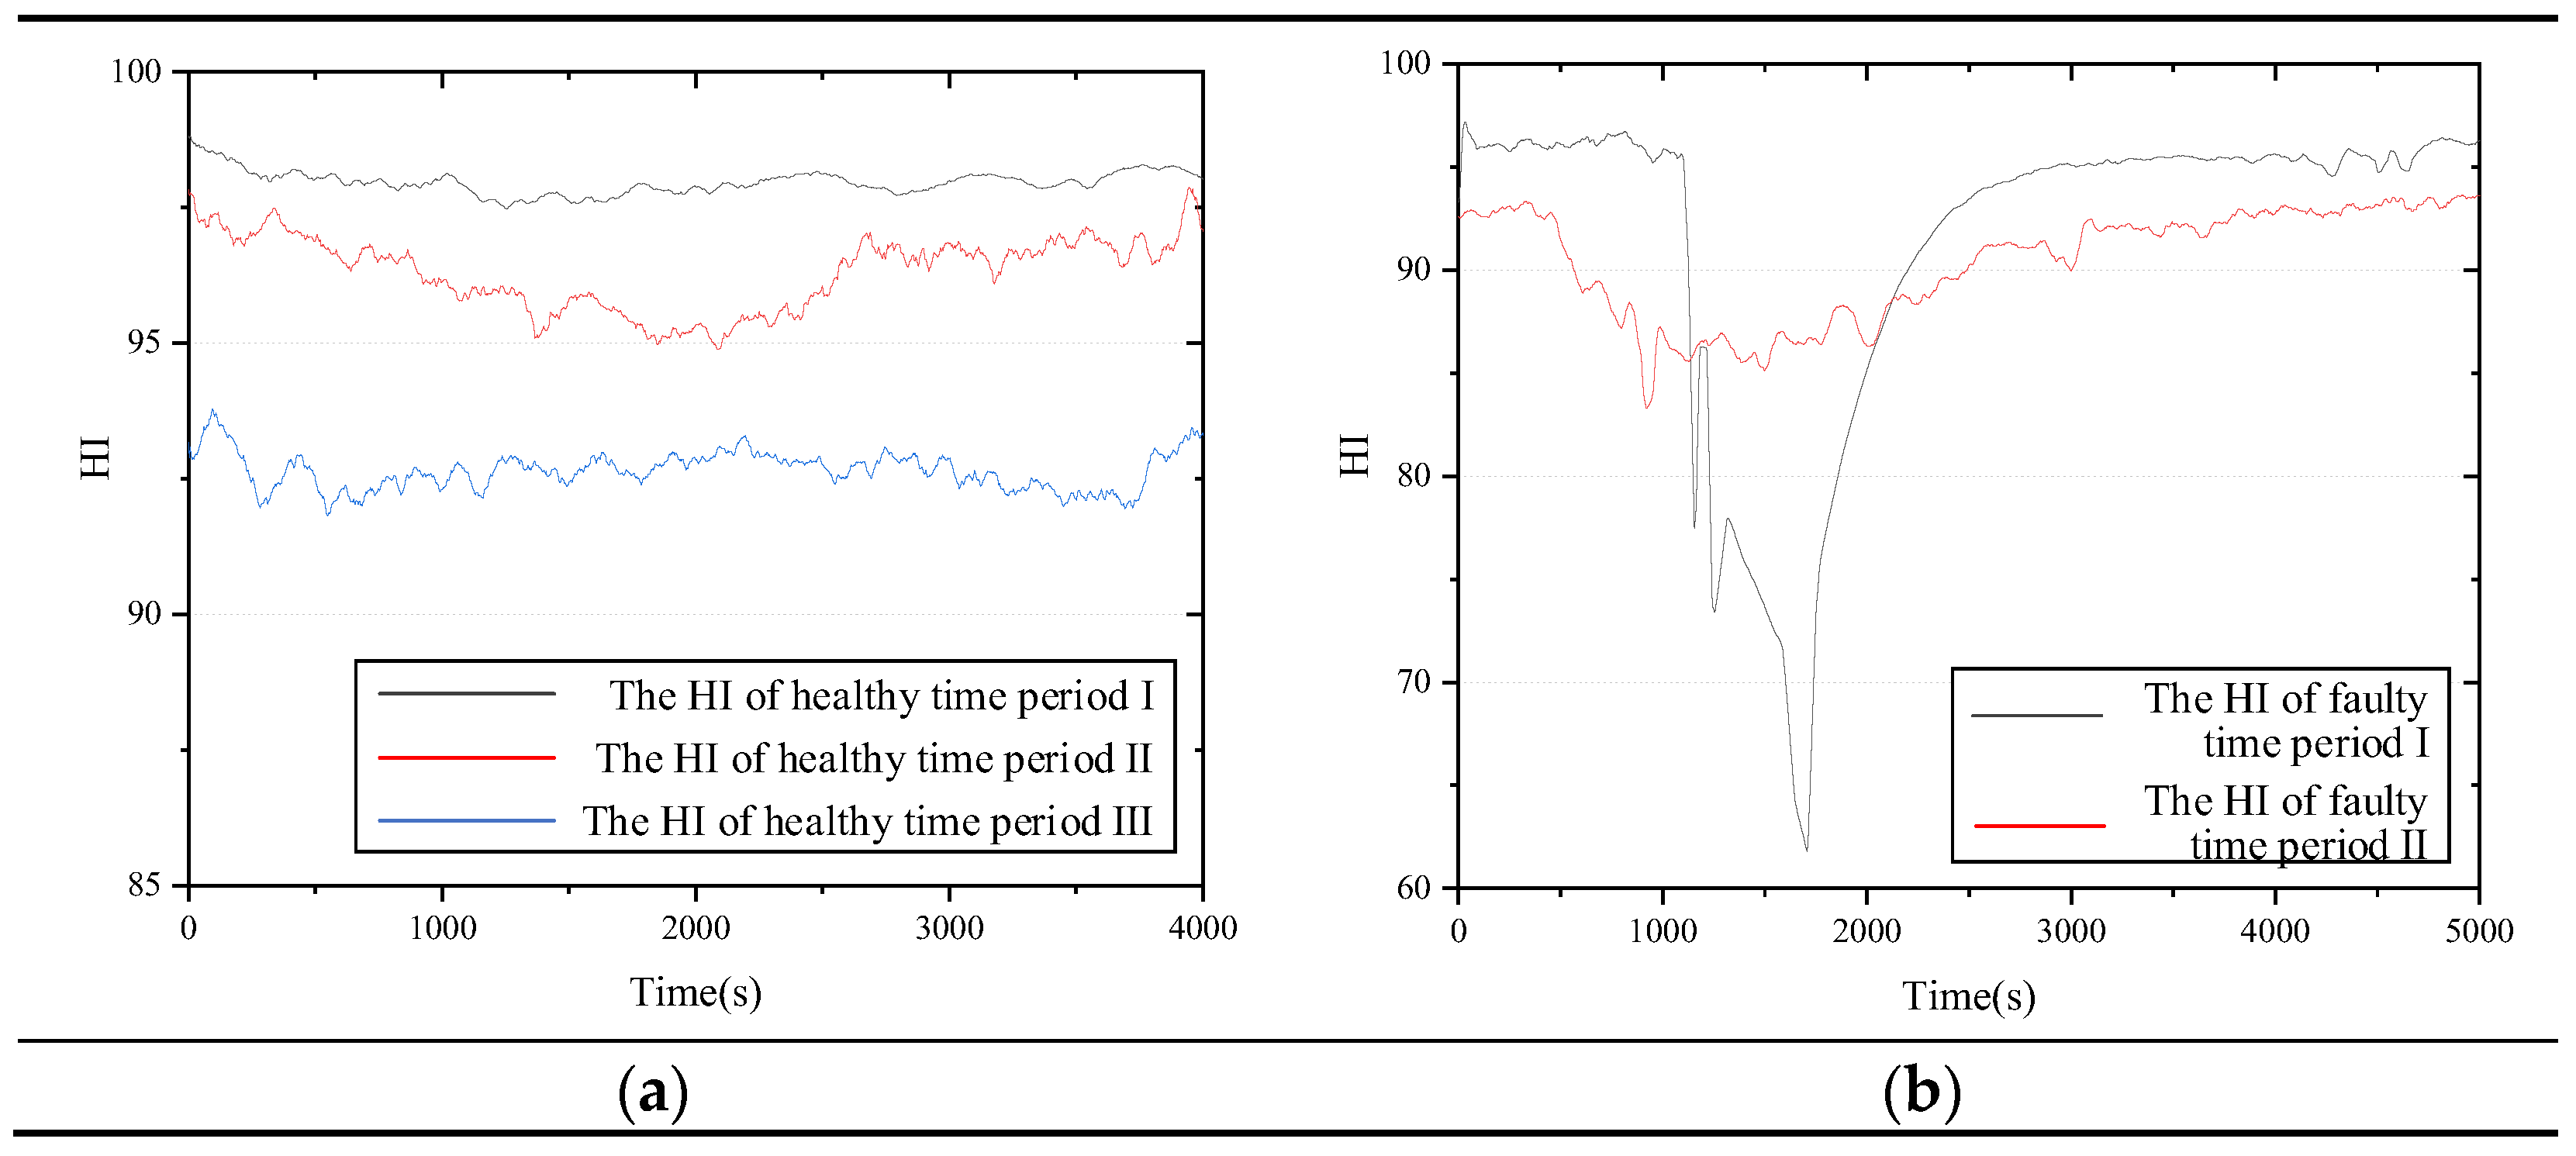
For condition assessment, this study constructed the health indicator (HI) for coal mills to characterize the current health state of the equipment. We introduced a method for constructing the HI in a published article [50], and although the model developed in that study is significantly different from the model constructed in this paper, the method for constructing the HI is consistent, so we followed this technique.
First, the deviation between the computed value of the virtual model and the actual value of the physical entity is calculated; this study designs a deviation measure formula based on the Euclidean distance and verifies the accuracy with the equipment operation data in different states. Then, a typical fault characterization factor is designed for the special situation in which the input parameters of the model are affected by the fault. Lastly, the HI is obtained by performing a joint calculation of the deviation and the fault characterization factor. HI is a positive number less than 100, and the larger its value indicates the healthier state of the equipment. Figure 9 shows the computed HIs of the coal mill in different states.
For fault diagnosis, this research established a coal mill fault diagnosis model based on fusion data and the deep belief network (DBN). DBN is a kind of deep learning network proposed by Professor Hinton in 2006, which is characterized by using a layer-by-layer greedy learning algorithm to optimize the connection weights in the network [51].
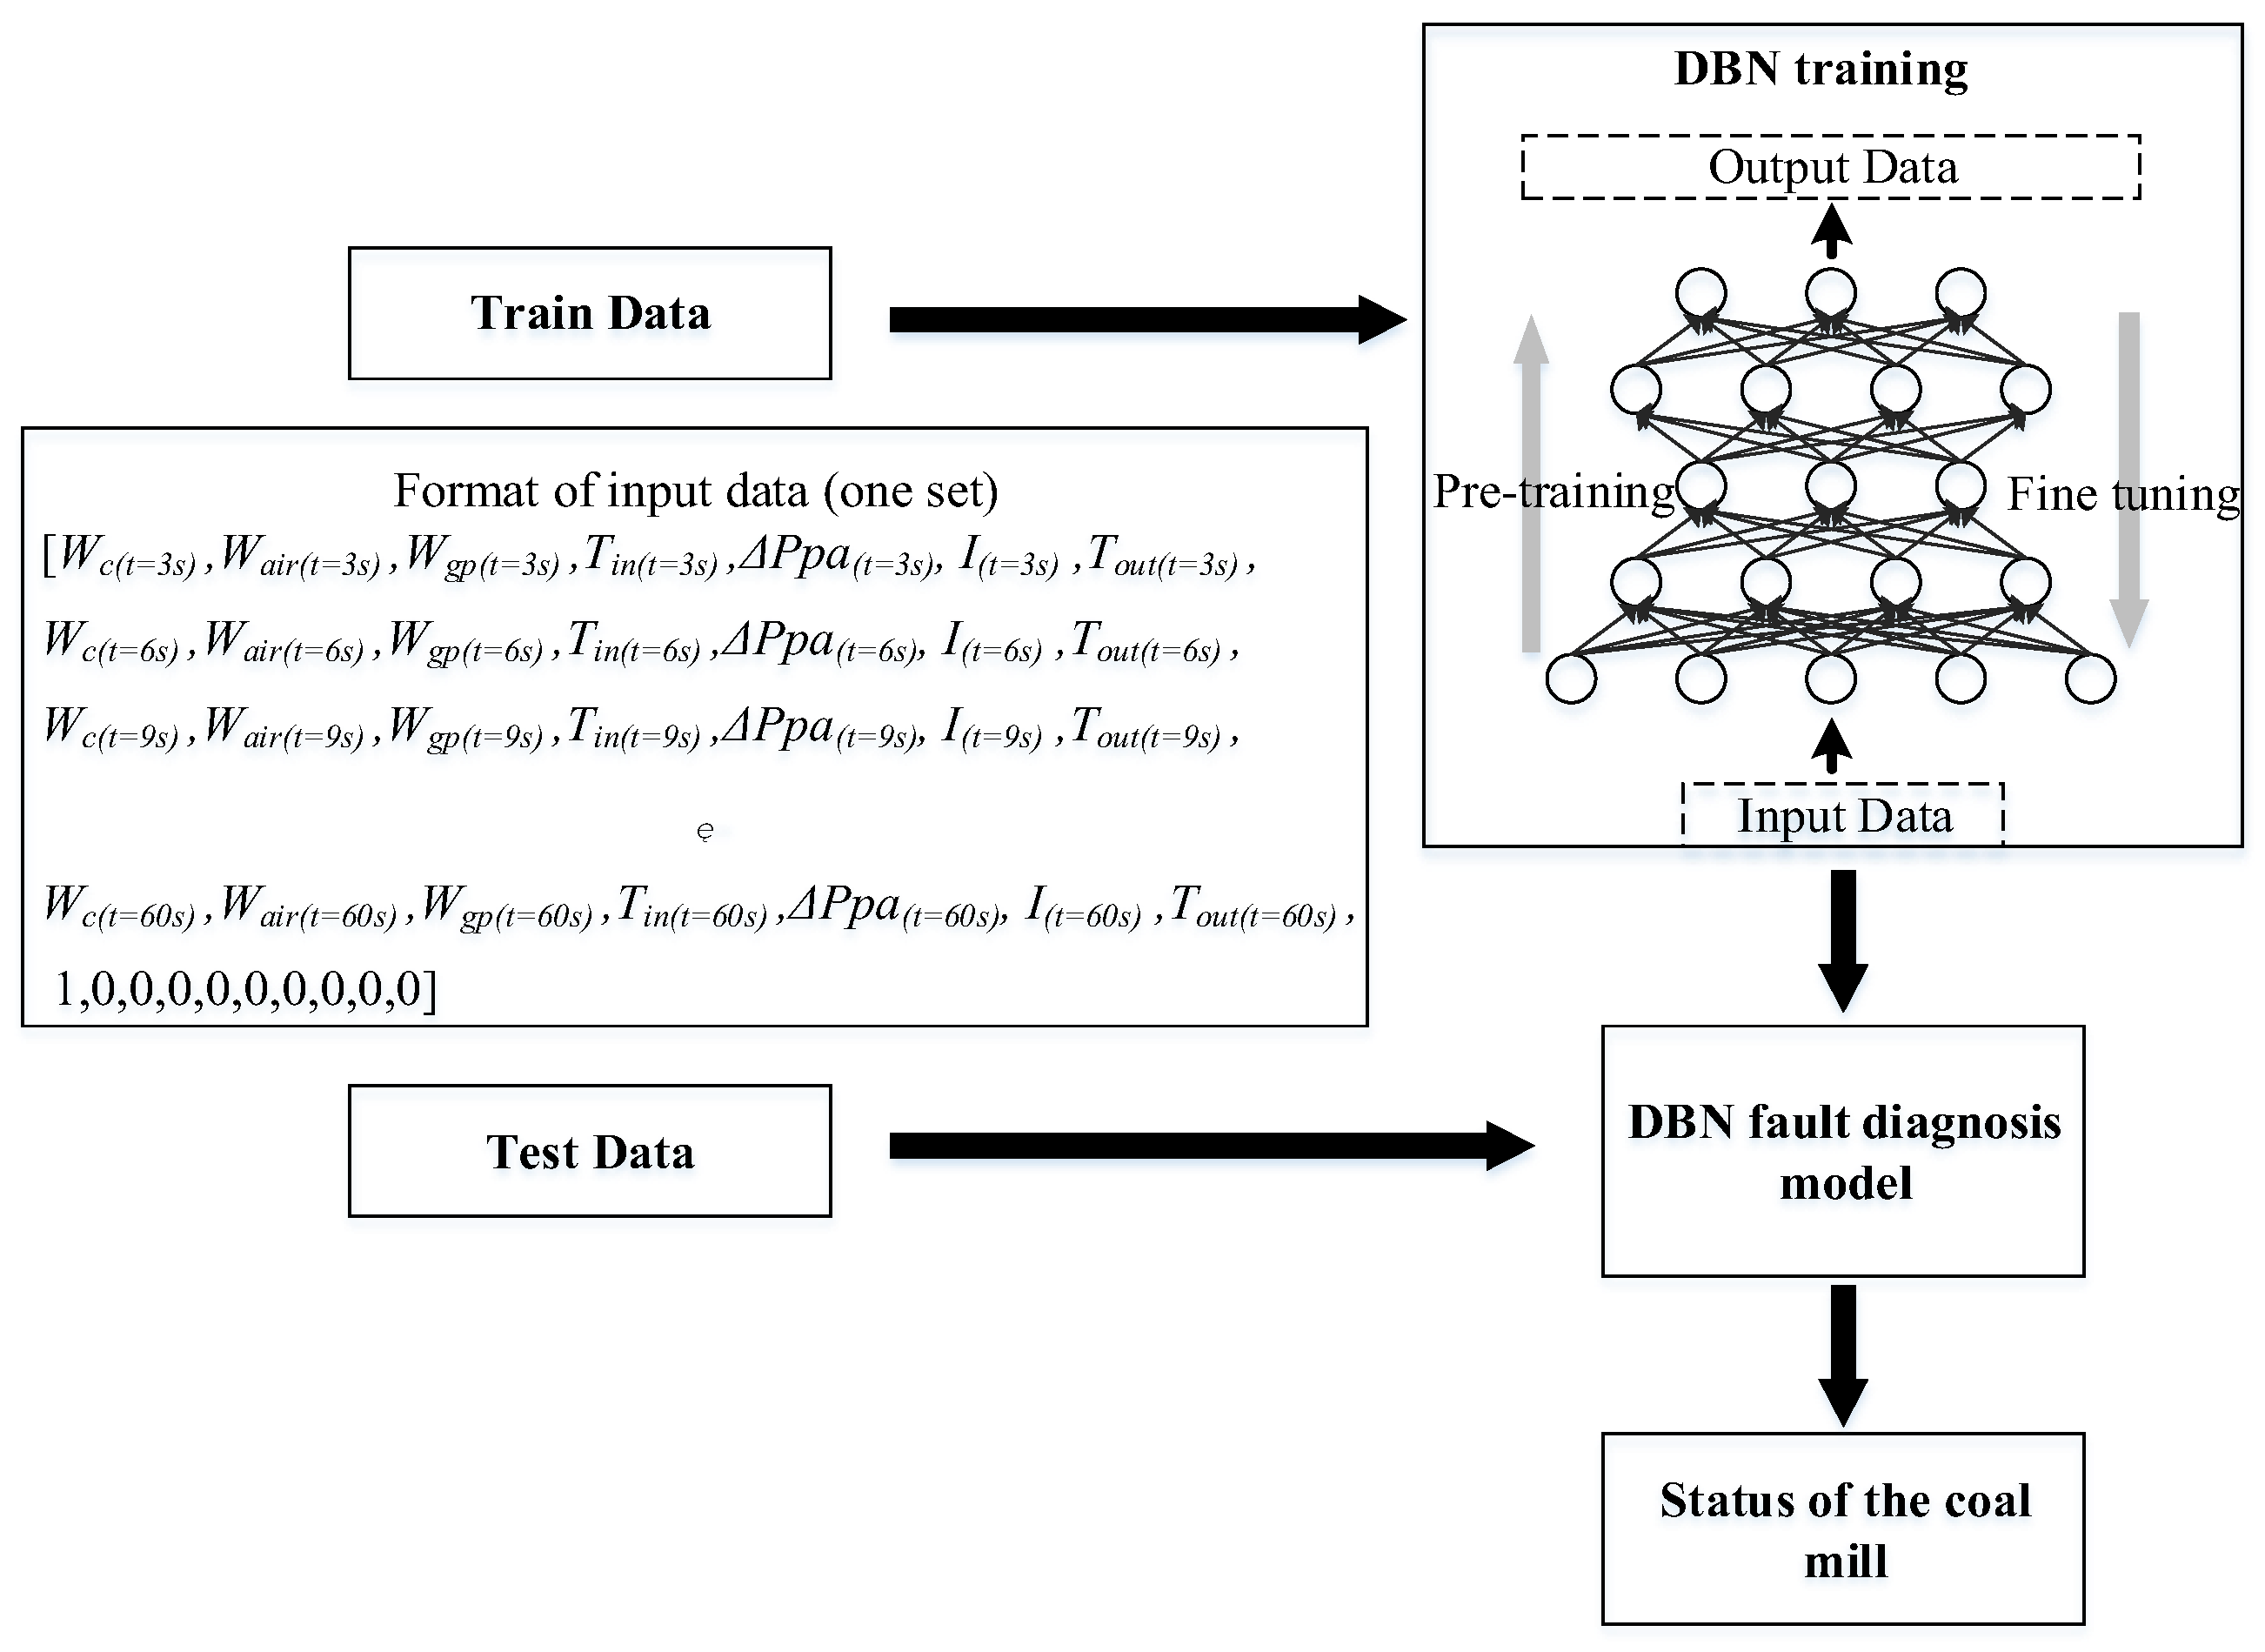
Firstly, the different operating states of the equipment are simulated using the model, and massive simulated data are obtained. The simulated data are mixed with the practical operating data to generate the original dataset.
This paper has analyzed the fault record table of the coal mill of this unit in the past two years, and according to the frequency and influence degree of each fault, the four faults of coal breakage, coal blockage, low oil pressure of grinding, and low primary air volume were selected to carry out the research. The four faults were simulated separately by changing the parameters or structure of the model, as well as the case where two faults could occur simultaneously. Table 4 lists the amount of data obtained from the simulations for each fault condition.
Then, this paper designed the DBN-based coal mill fault diagnosis process as shown in Figure 10. The data utilized are from the actual operation data of the unit and the simulation data of the simulation model. In this study, 80% of the data is used as the training set, and the remaining 20% is used as the test set, and all the data need to be processed by normalization. Table 5 shows the status labels corresponding to the various statuses.
To address the issue of the values of parameters in the DBN model, an orthogonal experiment with six factors and three levels is designed for further analysis. Table 6 shows the setting of factors and levels in the orthogonal experiment.
Table 7 shows the results of the orthogonal experiment, where I, II, and III indicate the average accuracy of the factors at each level. Based on the actual performance of the factors, the parameter combination chosen in this paper is 2-1-2-1-2-3.
For the accuracy verification test of the diagnostic results, its diagnostic accuracy is 98.8% for the training set and 97.4% for the test set. Figure 11 shows the analysis of the diagnostic results of the test set.
In order to further verify the effectiveness of the above method for coal mill fault identification, this paper selects 100 sets of actual operation data of the coal mill of this unit as the realistic dataset, including 41 sets of data when no fault occurs and 59 sets of data when a fault occurs. The diagnostic validation using this method yields a final diagnostic accuracy of 96%, which further proves the effectiveness of the proposed fault diagnosis method.
In addition, this paper also utilizes support vector machine (SVM), convolutional neural networks (CNN), and stacked autoencoder (SAE), which have been used in existing coal mill fault diagnosis studies, to train and compare the accuracy of the results. The diagnostic accuracy of each algorithm is calculated as shown in Table 8.
As shown in the table, the diagnostic accuracy of the method used in this paper is better than the other three methods for both the test set and the actual test set, which further proves the effectiveness and superiority of the method.
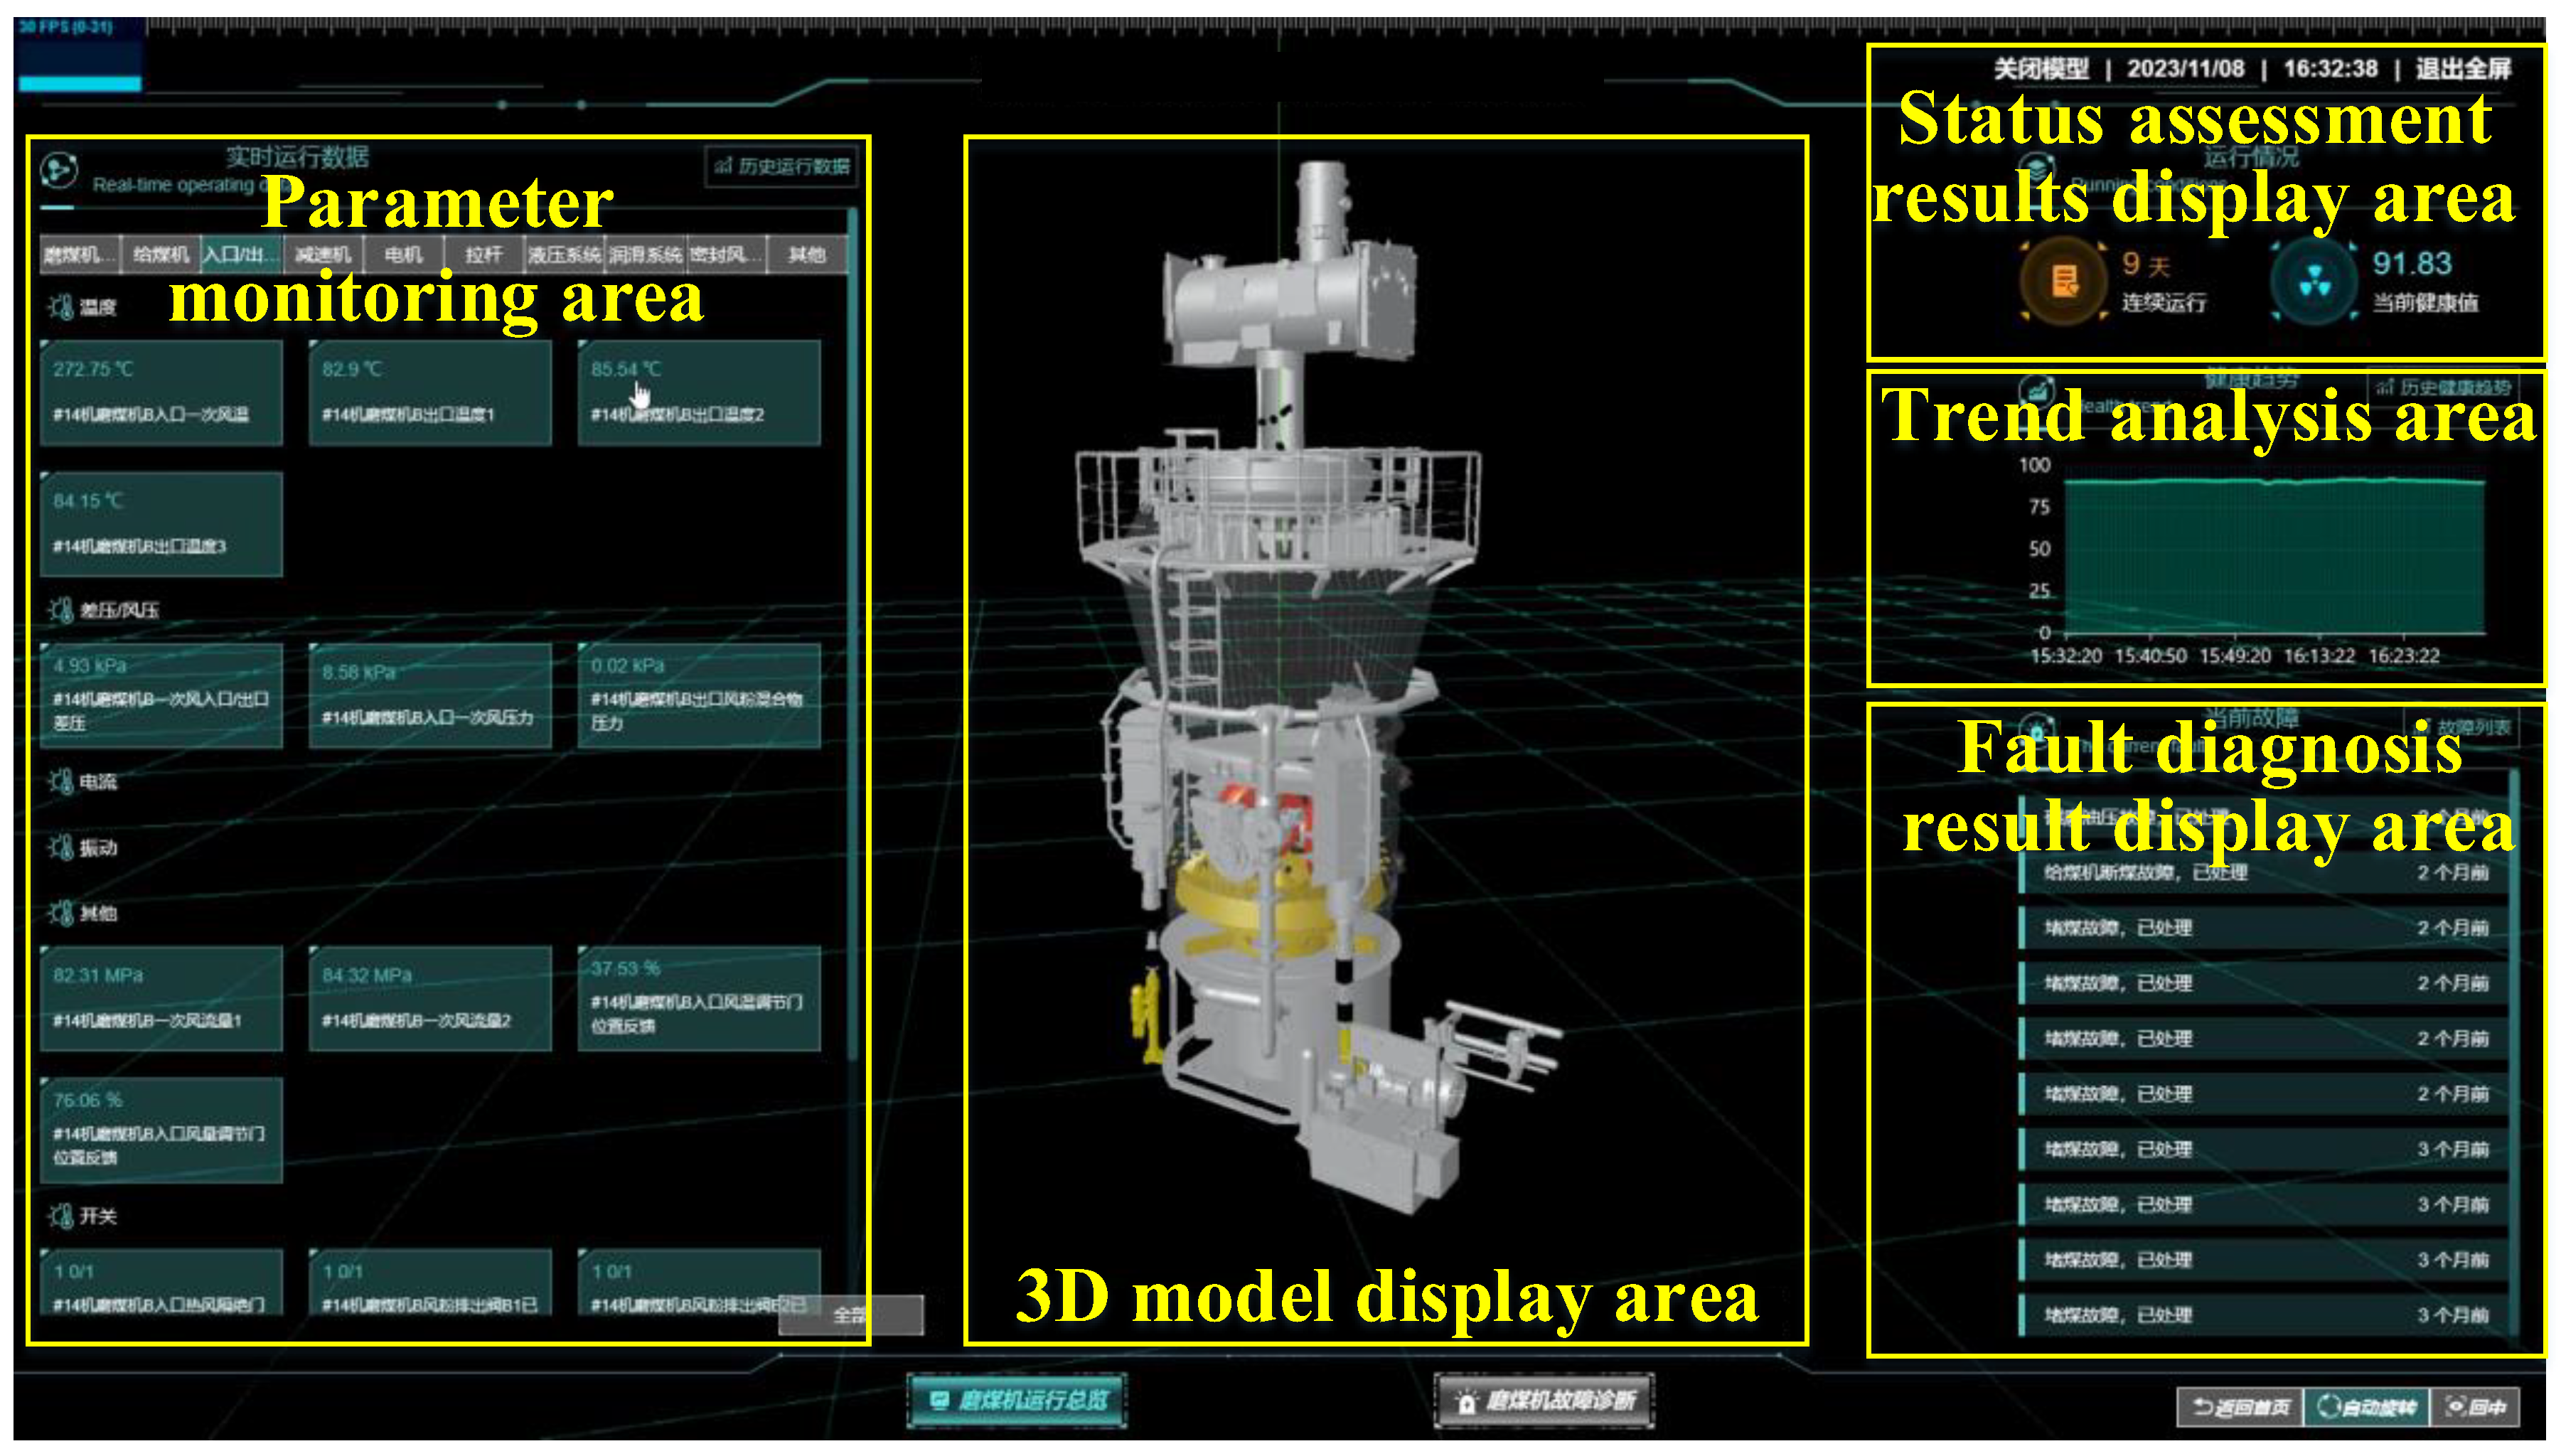
The monitoring platform is an implement tool for monitoring the operation status of the equipment, by accessing the platform, the users can quickly and intuitively obtain real-time operation data, condition assessment results, fault alarm information, and so on, and can also rapidly query and analyze the past status, which provides technical support for the maintenance plan of the equipment. In this study, a visualization platform is developed, and the main interface of the developed platform is shown in Figure 12, which has five main display areas, respectively, the 3D model display area, the parameter monitoring area, the status assessment result display area, the fault diagnosis result display area, and the trend analysis area.
In the 3D model display area, the model depicts the MPS170HP-II coal mill, and it can be manually zoomed in and out and automatically locate the damaged parts. When the equipment is in operating condition, the motion parts in the model will also operate. When the status of the equipment changes, the model will indicate the current switching status by changing the overall color and displaying text.
In the parameter monitoring area, the monitoring points are divided into 10 groups according to the location of each sensor, and in each group, the points are arranged by type. This area displays the real-time data of each monitoring point on the device, and when the value of the point reaches the preset threshold, this area will provide a timely alarm.
In the status assessment result display area, the left side of this area displays the continuous operating time of the device, while the right side shows the computed values of the HI for the current moment.
The fault diagnosis result display area shows the moments and types of faults that occurred recently, and it can jump to the fault details screen by clicking on each fault.
The trend analysis area shows the trend of the HI values of the device in the last hour, and when a potential fault is detected, this area will send out a timely warning message.
Besides the above functions, the platform is also equipped with historical data query, statistical analysis of fault records, analysis of the equipment state, and many other functions. This platform has been running in the coal-fired power plant for approximately half a year, and the employees in the enterprise can promptly and quickly grasp the operation status of the equipment through the platform.

5. Conclusions

This paper addresses the deficiencies in the current research on the condition monitoring of TCMIS and proposes to construct a new generation of intelligent condition monitoring systems by utilizing DT technology. After analyzing the theory of DT and the characteristics of TCMIS, the condition monitoring system of TCMIS is divided into the physical layer, data layer, model layer, and application layer, and eight implementation steps for applying the approach are proposed. This paper takes the coal mill as an application case for practical verification, and the research results have been practically applied in coal-fired power plants and achieved excellent results.
This study provides in-depth research on the specific application methods of DT technology in the manufacturing industry, which will help to promote the further application and development of DT technology in the traditional manufacturing industry and provide program references for the condition monitoring and intelligentization process of TCMIS. In the future, this study will actively explore a more advanced DT technology system containing simulation analysis, virtual reality, condition monitoring, and intelligent control functions to promote the comprehensive intelligent and intelligent development of equipment.

Author Contributions

Conceptualization, W.Y. and G.D.; methodology, Y.H.; software, W.Y.; validation, Y.H., G.D. and X.C.; formal analysis, G.D.; investigation, W.Y.; resources, X.C.; data curation, W.Y. and G.D.; writing—original draft preparation, W.Y. and Y.H.; writing—review and editing, W.Y., Y.H. and G.D.; visualization, Y.H.; supervision, X.C.; project administration, Y.H.; funding acquisition, G.D. All authors have read and agreed to the published version of the manuscript.

Funding

This research received no external funding.

Data Availability Statement

The data used in this study are internal to this coal-fired power producer and are not publicly available. The corresponding author of this paper can be contacted on request, and depending on the type of request, some of the important data will be provided appropriately.

Conflicts of Interest

The authors declare no conflict of interest. Author Xuefei Chen was employed by the company CHN Energy Changyuan Wuhan Qingshan Co-Gengeration Co., Ltd. The remaining authors declare that the research was conducted in the absence of any commercial or financial relationships that could be construed as a potential conflict of interest.

Nomenclature

Wccoal feed quantity of coal mill, kg/s
Wairinlet primary air volume of coal mill, kg/s
Wgpgrinding pressure difference, MPa
Tininlet primary air temperature of coal mill, °C
Ogrindgrinding oil pressure, MPa
Oreacreaction force oil pressure, MPa
θcmcoal moisture, %
Mcmass of raw coal in coal mill, kg
Mpf1mass of wet pulverized coal in coal mill, kg
Mpf2mass of dry pulverized coal in coal mill, kg
Ababrasion coefficient
Mconvgrinding coefficient
Dconvdrying coefficient
Icurrent of coal mill, A
Wpfoutlet pulverized coal flow of coal mill, kg/s
ΔPpadifferential pressure of primary air, kPa
Toutoutlet temperature of coal mill, °C
Qintotal heat input into the coal mill, kJ/s
Qouttotal heat output from the coal mill, kJ/s
Qairphysical heat input into the coal mill by the primary air, kJ/s
Qrcphysical heat input into the coal mill by the raw coal, kJ/s
Qsealphysical heat input into the coal mill by the sealing air, kJ/s
Qmacheat produced by the grinding process, kJ/s
Qair&sealphysical heat output from the coal mill by primary air and sealing air, kJ/s
QΔMheat consumed for evaporating raw coal moisture, kJ/s
Qpfheat consumed by heating fuel, kJ/s
Qlossheat loss through the equipment, kJ/s
Cmixaverage specific heat capacity, kJ/(kg·°C)
Cinspecific heat capacity of primary air, kJ/(kg·°C)
Crcspecific heat capacity of raw coal, kJ/(kg·°C)
CLspecific heat capacity of cold air, kJ/(kg·°C)
Coutspecific heat capacity of wet air, kJ/(kg·°C)
CH2Ospecific heat capacity of water, kJ/(kg·°C)
C H 2 O average specific heat capacity of vapor at a constant pressure, kJ/(kg·°C)
Trctemperature of raw coal, °C
TLtemperature of cold air, °C
Δtcumulative operating time of coal mill, s
Δθamount of moisture evaporated in the coal mill, %
Mmetalamount of metal involved in the heat exchange, kg
Kmaccoefficient of heat generation in the milling process
Ksealleakage coefficient of sealed air for medium speed coal mill
Klosscoefficient of heat loss through equipment
Kiparameters of the model to be identified; i = 1, 2, …, 12

References

  1. Li, B.-H.; Hou, B.-C.; Yu, W.-T.; Lu, X.-B.; Yang, C.-W. Applications of artificial intelligence in intelligent manufacturing: A review. Front. Inf. Technol. Electron. Eng. 2017, 18, 86–96. [Google Scholar] [CrossRef]
  2. Ren, X.; Qin, Y.; Wang, B.; Cheng, X.; Jia, L. A Complementary Continual Learning Framework Using Incremental Samples for Remaining Useful Life Prediction of Machinery. IEEE Trans. Ind. Inform. 2024, 20, 14330–14340. [Google Scholar] [CrossRef]
  3. Ding, A.; Qin, Y.; Wang, B.; Cheng, X.; Jia, L. An elastic expandable fault diagnosis method of three-phase motors using continual learning for class-added sample accumulations. IEEE Trans. Ind. Electron. 2023, 71, 7896–7905. [Google Scholar] [CrossRef]
  4. Ding, A.; Yi, X.; Qin, Y.; Wang, B. Self-driven continual learning for class-added motor fault diagnosis based on unseen fault detector and propensity distillation. Eng. Appl. Artif. Intell. 2024, 127, 107382. [Google Scholar] [CrossRef]
  5. Pourbabaee, B.; Meskin, N.; Khorasani, K. Sensor Fault Detection, Isolation, and Identification Using Multiple-Model-Based Hybrid Kalman Filter for Gas Turbine Engines. IEEE Trans. Control Syst. Technol. 2015, 24, 1184–1200. [Google Scholar] [CrossRef]
  6. Salahshoor, K.; Kordestani, M.; Khoshro, M.S. Fault detection and diagnosis of an industrial steam turbine using fusion of SVM (support vector machine) and ANFIS (adaptive neuro-fuzzy inference system) classifiers. Energy 2010, 35, 5472–5482. [Google Scholar] [CrossRef]
  7. Cai, W.; Zhao, D.; Wang, T. Multi-scale dynamic graph mutual information network for planet bearing health monitoring under imbalanced data. Adv. Eng. Inform. 2025, 64, 103096. [Google Scholar] [CrossRef]
  8. Zhao, D.; Cai, W.; Cui, L. Multi-Perception Graph Convolutional Tree-embedded Network for Aero-engine Bearing Health Monitoring with Unbalanced Data. Reliab. Eng. Syst. Saf. 2025, 257, 110888. [Google Scholar] [CrossRef]
  9. Liu, X.; Jin, J.; Wu, W.; Herz, F. A novel support vector machine ensemble model for estimation of free lime content in cement clinkers. ISA Trans. 2020, 99, 479–487. [Google Scholar] [CrossRef]
  10. Kouadri, A.; Bensmail, A.; Kheldoun, A.; Refoufi, L. An adaptive threshold estimation scheme for abrupt changes detection algorithm in a cement rotary kiln. J. Comput. Appl. Math. 2014, 259, 835–842. [Google Scholar] [CrossRef]
  11. Li, Y.; Hong, F.; Tian, L.; Liu, J.; Chen, J. Early warning of critical blockage in coal mills based on stacked denoising autoencoders. IEEE Access 2020, 8, 176101–176111. [Google Scholar] [CrossRef]
  12. Zhu, P.; Qian, H.; Chai, T. Research on early fault warning system of coal mills based on the combination of thermodynamics and data mining. Trans. Inst. Meas. Control 2020, 42, 55–68. [Google Scholar] [CrossRef]
  13. Zhao, R.; Yan, R.; Chen, Z.; Mao, K.; Wang, P.; Gao, R.X. Deep learning and its applications to machine health monitoring. Mech. Syst. Signal Process. 2019, 115, 213–237. [Google Scholar] [CrossRef]
  14. Liu, R.; Yang, B.; Zio, E.; Chen, X. Artificial intelligence for fault diagnosis of rotating machinery: A review. Mech. Syst. Signal Process. 2018, 108, 33–47. [Google Scholar] [CrossRef]
  15. Mihai, S.; Yaqoob, M.; Hung, D.V.; Davis, W.; Towakel, P.; Raza, M.; Karamanoglu, M.; Barn, B.; Shetve, D.; Prasad, R.V.; et al. Digital Twins: A Survey on Enabling Technologies, Challenges, Trends and Future Prospects. IEEE Commun. Surv. Tutor. 2022, 24, 2255–2291. [Google Scholar] [CrossRef]
  16. Ghosh, A.K.; Ullah, A.S.; Teti, R.; Kubo, A. Developing sensor signal-based digital twins for intelligent machine tools. J. Ind. Inf. Integr. 2021, 24, 100242. [Google Scholar] [CrossRef]
  17. Aheleroff, S.; Xu, X.; Zhong, R.Y.; Lu, Y. Digital Twin as a service (DTaaS) in industry 4.0: An architecture reference model. Adv. Eng. Inform. 2021, 47, 101225. [Google Scholar] [CrossRef]
  18. Ruppert, T.; Abonyi, J. Integration of real-time locating systems into digital twins. J. Ind. Inf. Integr. 2020, 20, 100174. [Google Scholar] [CrossRef]
  19. Wu, J.; Yang, Y.; Cheng, X.; Zuo, H.; Cheng, Z. The Development of Digital Twin Technology Review. In Proceedings of the 2020 Chinese Automation Congress (CAC), Shanghai, China, 6–8 November 2020; pp. 4901–4906. [Google Scholar]
  20. Wang, J.; Ye, L.; Gao, R.X.; Li, C.; Zhang, L. Digital Twin for rotating machinery fault diagnosis in smart manufacturing. Int. J. Prod. Res. 2019, 57, 3920–3934. [Google Scholar] [CrossRef]
  21. Yang, C.; Cai, B.; Zhang, R.; Zou, Z.; Kong, X.; Shao, X.; Liu, Y.; Shao, H.; Khan, J.A. Cross-validation enhanced digital twin driven fault diagnosis methodology for minor faults of subsea production control system. Mech. Syst. Signal Process. 2023, 204, 110813. [Google Scholar] [CrossRef]
  22. Wang, J.; Zhang, Z.; Liu, Z.; Han, B.; Bao, H.; Ji, S. Digital twin aided adversarial transfer learning method for domain adaptation fault diagnosis. Reliab. Eng. Syst. Saf. 2023, 234, 109152. [Google Scholar] [CrossRef]
  23. Dong, Y.; Jiang, H.; Wu, Z.; Yang, Q.; Liu, Y. Digital twin-assisted multiscale residual-self-attention feature fusion network for hypersonic flight vehicle fault diagnosis. Reliab. Eng. Syst. Saf. 2023, 235, 109253. [Google Scholar] [CrossRef]
  24. Xue, R.; Zhang, P.; Huang, Z.; Wang, J. Digital twin-driven fault diagnosis for CNC machine tool. Int. J. Adv. Manuf. Technol. 2022, 131, 5457–5470. [Google Scholar] [CrossRef]
  25. Wang, H.; Zheng, J.; Xiang, J. Online bearing fault diagnosis using numerical simulation models and machine learning classifications. Reliab. Eng. Syst. Saf. 2023, 234, 109142. [Google Scholar] [CrossRef]
  26. Xia, J.; Huang, R.; Chen, Z.; He, G.; Li, W. A novel digital twin-driven approach based on physical-virtual data fusion for gearbox fault diagnosis. Reliab. Eng. Syst. Saf. 2023, 240, 109542. [Google Scholar] [CrossRef]
  27. Grieves, M.; Vickers, J. Digital twin: Mitigating unpredictable, undesirable emergent behavior in complex systems. In Transdisciplinary Perspectives on Complex Systems: New Findings and Approaches; Springer: Cham, Switzerland, 2017; pp. 85–113. [Google Scholar]
  28. Glaessgen, E.; Stargel, D. The digital twin paradigm for future NASA and US Air Force vehicles. In Proceedings of the 53rd AIAA/ASME/ASCE/AHS/ASC Structures, Structural Dynamics and Materials Conference, Honolulu, HI, USA; 2012. 1818. [Google Scholar] [CrossRef]
  29. Semeraro, C.; Lezoche, M.; Panetto, H.; Dassisti, M. Digital twin paradigm: A systematic literature review. Comput. Ind. 2021, 130, 103469. [Google Scholar] [CrossRef]
  30. Atalay, M.; Murat, U.; Oksuz, B.; Parlaktuna, A.M.; Pisirir, E.; Testik, M.C. Digital twins in manufacturing: Systematic literature review for physical–digital layer categorization and future research directions. Int. J. Comput. Integr. Manuf. 2022, 35, 679–705. [Google Scholar] [CrossRef]
  31. Ball, P.; Badakhshan, E. Sustainable Manufacturing Digital Twins: A Review of Development and Application. In Sustainable Design and Manufacturing; Smart Innovation, Systems and Technologies; Springer: Singapore, 2022; Volume 262 SIST. [Google Scholar] [CrossRef]
  32. Cimino, C.; Negri, E.; Fumagalli, L. Review of digital twin applications in manufacturing. Comput. Ind. 2019, 113, 103130. [Google Scholar] [CrossRef]
  33. Kritzinger, W.; Karner, M.; Traar, G.; Henjes, J.; Sihn, W. Digital Twin in manufacturing: A categorical literature review and classification. IFAC-PapersOnLine 2018, 51, 1016–1022. [Google Scholar] [CrossRef]
  34. Luo, W.; Hu, T.; Ye, Y.; Zhang, C.; Wei, Y. A hybrid predictive maintenance approach for CNC machine tool driven by Digital Twin. Robot. Comput. Manuf. 2020, 65, 101974. [Google Scholar] [CrossRef]
  35. Wei, Y.; Hu, T.; Zhou, T.; Ye, Y.; Luo, W. Consistency retention method for CNC machine tool digital twin model. J. Manuf. Syst. 2021, 58, 313–322. [Google Scholar] [CrossRef]
  36. Tao, F.; Zhang, M. Digital Twin Shop-Floor: A New Shop-Floor Paradigm Towards Smart Manufacturing. IEEE Access 2017, 5, 20418–20427. [Google Scholar] [CrossRef]
  37. Grieves, M. Digital Twin: Manufacturing Excellence through Virtual Factory Replication. White Pap. 2014, 1, 1–7. [Google Scholar]
  38. Tao, F.; Zhang, H.; Liu, A.; Nee, A.Y.C. Digital Twin in Industry: State-of-the-Art. IEEE Trans. Ind. Inform. 2018, 15, 2405–2415. [Google Scholar] [CrossRef]
  39. Xia, J.; Chen, Z.; Chen, J.; He, G.; Huang, R.; Li, W. A digital twin-driven approach for partial domain fault diagnosis of rotating machinery. Eng. Appl. Artif. Intell. 2024, 131, 107848. [Google Scholar] [CrossRef]
  40. Hu, W.; Wang, T.; Chu, F. A Wasserstein generative digital twin model in health monitoring of rotating machines. Comput. Ind. 2023, 145, 103807. [Google Scholar] [CrossRef]
  41. Yu, J.; Song, Y.; Tang, D.; Dai, J. A Digital Twin approach based on nonparametric Bayesian network for complex system health monitoring. J. Manuf. Syst. 2021, 58, 293–304. [Google Scholar] [CrossRef]
  42. Khalid, S.; Song, J.; Azad, M.M.; Elahi, M.U.; Lee, J.; Jo, S.-H.; Kim, H.S. A Comprehensive Review of Emerging Trends in Aircraft Structural Prognostics and Health Management. Mathematics 2023, 11, 3837. [Google Scholar] [CrossRef]
  43. Fan, W.; Ren, S.; Zhu, Q.; Jia, Z.; Bai, D.; Si, F. A Novel Multi-Mode Bayesian Method for the Process Monitoring and Fault Diagnosis of Coal Mills. IEEE Access 2021, 9, 22914–22926. [Google Scholar] [CrossRef]
  44. Tang, J.; Zhao, L.; Yue, H.; Chai, T.; Yu, W. On-line soft sensor based on RPCA and LSSVR for mill load parameters. In Proceedings of the 2010 International Conference on Progress in Informatics and Computing (PIC), Shanghai, China, 10–12 December 2010; pp. 598–602. [Google Scholar]
  45. Hu, Y.; Ping, B.; Zeng, D.; Niu, Y.; Gao, Y.; Zhang, D. Research on fault diagnosis of coal mill system based on the simulated typical fault samples. Measurement 2021, 161, 22914–22926. [Google Scholar] [CrossRef]
  46. Pradeebha, P.; Pappa, N. Modeling and outlet temperature control of coal mill using Model Predictive Controller. In Proceedings of the 2013 IEEE International Conference on Control Applications (CCA), Hyderabad, India, 28–30 August 2013; pp. 1069–1074. [Google Scholar] [CrossRef]
  47. Jafari, M.; Kavousi-Fard, A.; Chen, T.; Karimi, M. A Review on Digital Twin Technology in Smart Grid, Transportation System and Smart City: Challenges and Future. IEEE Access 2023, 11, 17471–17484. [Google Scholar] [CrossRef]
  48. Botín-Sanabria, D.M.; Mihaita, A.-S.; Peimbert-García, R.E.; Ramírez-Moreno, M.A.; Ramírez-Mendoza, R.A.; Lozoya-Santos, J.d.J. Digital Twin Technology Challenges and Applications: A Comprehensive Review. Remote. Sens. 2022, 14, 1335. [Google Scholar] [CrossRef]
  49. Gao, Y.; Zeng, D.; Liu, J. Modeling of a medium speed coal mill. Powder Technol. 2017, 318, 214–223. [Google Scholar] [CrossRef]
  50. Yin, W.; Hu, Y.; Ding, G.; Xu, W.; Feng, L.; Chen, X.; Cao, X. Health indicator construction and application of coal mill based on the dynamic model. Struct. Health Monit. 2023, 23, 686–700. [Google Scholar] [CrossRef]
  51. Yin, W.; Hu, Y.; Ding, G.; Yang, K.; Chen, X.; Cao, X. Fault diagnosis of coal mills based on a dynamic model and deep belief network. Meas. Sci. Technol. 2023, 34, 125052. [Google Scholar] [CrossRef]
Figure 1. The technology roadmap of this study.
Machines 13 00464 g001
Figure 2. DT-driven TCMIS condition monitoring system.
Machines 13 00464 g002
Figure 3. Implementation steps of the condition monitoring study.
Machines 13 00464 g003
Figure 4. The structure diagram of MPS170HP-II coal mill.
Machines 13 00464 g004
Figure 5. The process of state perception and operation control of the coal mill.
Machines 13 00464 g005
Figure 6. Some of the added sensors installed in the field.
Machines 13 00464 g006
Figure 7. The data service architecture.
Machines 13 00464 g007
Figure 8. The process of constructing the virtual model of the coal mill.
Machines 13 00464 g008
Figure 9. The computed results of the coal mill: (a) HI values in healthy status. (b) HI values in fault status.
Machines 13 00464 g009
Figure 10. Flow chart of DBN-based coal mill fault diagnosis.
Machines 13 00464 g010
Figure 11. The accuracy of the fault diagnostic model.
Machines 13 00464 g011
Figure 12. The main interface of the visualization monitoring platform.
Machines 13 00464 g012
Table 1. The core element and primary function of each layer.
LayerCore ElementPrimary Function
PLPhysical entity of the equipmentObtain real-time status information about the equipment and upload it to the DL.
DLThe server and the databaseEfficient management of data generated by PL, ML, and AL.
MLVirtual model of the equipmentOnline calculations and simulations with real-time access to data from the DL.
ALCondition monitoring algorithms and the visualization platformObtaining information from DL and ML for computation and analysis, and providing services for condition monitoring.
Table 2. The list of added sensors.
No.TypeQuantity of the Device Purpose of the Device
1Vibration1Shell vibration monitoring
2Vibration1Reduction gear vibration monitoring
3Vibration2Motor drive shaft vibration monitoring
4Pressure4Wind pressure monitoring of the seal air ducts
5Temperature2Temperature monitoring in the vicinity of equipment
6Strain3Strain monitoring of tie rods
Table 3. The performance comparison of the models.
ItemsThe Model with Self-Optimizing CapabilityThe Model Without Self-Optimizing Capability
IΔPpaToutIΔPpaTout
MSE3.170.023.014.870.213.02
RE4.35%3.71%1.56%5.62%11.93%1.58%
Table 4. The simulation results of failures.
NoStatus DescriptionQuantity
1coal breakage6000
2coal blockage6000
3low oil pressure of grinding6000
4low primary air volume6000
5coal breakage and low oil pressure of grinding3000
6coal breakage and low primary air volume3000
7coal blockage and low oil pressure of grinding3000
8coal blockage and low primary air volume3000
9low oil pressure of grinding and low primary air volume3000
Table 5. The status labels corresponding to the various states.
Status NumberStatus DescriptionStatus Labels
0healthy status[1,0,0,0,0,0,0,0,0,0]
1coal breakage[0,1,0,0,0,0,0,0,0,0]
2coal blockage[0,0,1,0,0,0,0,0,0,0]
3low oil pressure of grinding[0,0,0,1,0,0,0,0,0,0]
4low primary air volume[0,0,0,0,1,0,0,0,0,0]
5coal breakage and low oil pressure of grinding[0,0,0,0,0,1,0,0,0,0]
6coal breakage and low primary air volume[0,0,0,0,0,0,1,0,0,0]
7coal blockage and low oil pressure of grinding[0,0,0,0,0,0,0,1,0,0]
8coal blockage and low primary air volume[0,0,0,0,0,0,0,0,1,0]
9low oil pressure of grinding and low primary air volume[0,0,0,0,0,0,0,0,0,1]
Table 6. Parameter settings of the orthogonal experiment.
LevelFactor
Pre-Training Learning RateFine-Tuning Learning RateNumber of Hidden LayersBatch SizeDropoutMomentum
10.0010.00131000.010.1
20.010.0143000.050.2
30.10.155000.10.4
Table 7. Results of the orthogonal experiment.
No.FactorAccuracy
Pre-Training Learning RateFine-Tuning Learning RateNumber of Hidden LayersBatch SizeDropoutMomentum
11111110.822
21122330.803
31213320.766
41231230.798
51323210.812
61332120.605
72113230.886
82131320.842
92222220.823
102233110.724
112312310.686
122321130.905
133123120.795
143132210.815
153212130.654
163221310.858
173311220.738
183333330.692
I0.7680.8270.7590.8270.7510.786
II0.8110.7710.8330.7310.8120.762
III0.7590.7400.7460.7790.7750.790
Range0.0520.0880.0870.0960.0610.028
Table 8. Comparison of diagnostic accuracy.
No.NameDiagnostic Accuracy of the Test SetDiagnostic Accuracy of the Realistic Dataset
1DBN97.4%96.0%
2SVM82.5%81.0%
3CNN88.6%89.0%
4SAE90.6%87.0%
Disclaimer/Publisher’s Note: The statements, opinions and data contained in all publications are solely those of the individual author(s) and contributor(s) and not of MDPI and/or the editor(s). MDPI and/or the editor(s) disclaim responsibility for any injury to people or property resulting from any ideas, methods, instructions or products referred to in the content.

