1. Introduction
Squirrel-cage fans are widely used in ventilation, fire protection, and smoke exhaust fields due to their high flow rate and low noise [
1,
2]. These fans are the core power of range hoods, mainly used to remove the fumes generated during cooking. They are also an important source of noise in home environments and will impact human health [
3,
4]. During the actual operation of the range hood, the inlet conditions and structure will be dynamically adjusted according to the working status of the stoves on both sides below to improve the capture efficiency, forming different intake conditions, which can bring about non-uniform inflow, thereby affecting the aerodynamic performance, internal unsteady flow, and noise of the fan [
5,
6,
7]. On the other hand, under the influence of the motor’s structure and space size limitations, the flow separation inside the double-suction squirrel-cage fan is further increased [
8,
9,
10,
11].
Currently, research methods for analyzing the internal pressure pulsation characteristics of fans include numerical simulations, experimental studies, and theoretical approaches. Kirchhofer et al. [
12] conducted a comparative study using different turbulence models (S-A, k-ε, and SST k-ω) to simulate the flow field within a fan and compared these results with particle image velocimetry measurements. Their findings showed that the SST k-ω model provided the most accurate predictions for the characteristic curves and internal velocity fields. Similarly, Yang et al. [
13] demonstrated that the SST model offers the lowest error in performance predictions when simulating a range hood equipped with a squirrel-cage fan.
The known literature indicates that the pressure and its fluctuations are highly consistent with the noise characteristics of the fan. It is feasible to study the pressure pulsation characteristics inside the fan to reflect the noise characteristics of the fan. Ballesteros-Tajadura et al. [
14], Li et al. [
15], and Xu et al. [
16] all used numerical simulation methods to obtain the pressure pulsation inside the fan impeller, and the numerical calculation results matched well with experimental values. Zhang et al. [
17] calculated the three-dimensional unsteady flow and acoustic field of the fan via direct computational aeroacoustics based on the lattice Boltzmann method. Experimental data from the performance test bench and the semi-anechoic chamber were used to validate the accuracy of the numerical simulation results. Min et al. [
18] used URANS and FFT to analyze the interaction between the rotors of a centrifugal fan and its impact on acoustic performance. Zhang et al. [
19] proposed an experimentally based vibration noise optimization control method for a particular centrifugal fan, leading to a 6.23 dB reduction. Xiao et al. [
20] introduced a new empirical noise model to more accurately predict fan noise. Velarde-Su’arez et al. [
21,
22] found a significant circumferential asymmetry in the magnitude and direction of the velocity of a squirrel-cage fan. Oro et al. [
23,
24,
25] presented a numerical methodology to evaluate the flow unsteadiness and impeller-tongue interaction. Kato [
26] captured the large eddies in the flow and found that the large eddies were the primary noise source. Liu et al. [
27], using large eddy simulation and acoustic analogy theory, analyzed the flow noise at a natural gas transmission and distribution station. A small hole muffler was designed to effectively reduce low-frequency noise by up to 37.4 dB, with an average noise reduction of approximately 20.9 dB. Deng et al. [
28,
29,
30] mentioned more efficient and advanced CFD tools that could improve the LES results.
In the study of internal flow characteristics and optimization improvements for double-suction squirrel-cage fans, the primary areas of focus include flow deflectors, blade profiles, and volute designs. Gholamian et al. [
31] studied the impact of four inlet nozzle sizes on fan performance and found that the inlet nozzle size and the impeller inner diameter are crucial for fan efficiency. Huang et al. [
32] found that range hood noise predominantly consists of discrete low-frequency components, with most of the noise being transmitted through the inlet. Lv et al. [
33] demonstrated that biomimetic volutes can significantly enhance aerodynamic performance under rated conditions. Lei et al. [
34] showed that installing flow straighteners can notably reduce vortex intensity. Liu et al. [
35] introduced a non-axisymmetric D-type inlet nozzle to mitigate severe backflow development at the volute tongue. Jiang et al. [
36] explored a random modulation method to reduce tonal noise and reshape the noise spectrum. Xiao et al. [
37] optimized the blade shape of the squirrel-cage fan within a range hood using a surrogate model, resulting in a 2.9% increase in maximum volume flow rate in the optimal design. In recent years, several scholars [
38,
39,
40,
41,
42] have developed optimization design methods to enhance the aerodynamic performance and reduce the noise of centrifugal fans, achieving positive results in engineering applications.
In conclusion, the noise sources within squirrel-cage fans are intricate, primarily stemming from complex, unsteady flows. However, existing research predominantly addresses uniform air intake, fan placement within equipment, and steady-state simulations. These approaches fall short in examining the internal flow dynamics and noise distribution characteristics of asymmetric double-suction squirrel-cage fans under non-uniform air intake conditions. There is a significant gap in understanding noise quality. The present study employs large eddy simulation (LES) numerical methods to analyze the internal flow of asymmetric double-suction centrifugal fans integrated within complete equipment. It investigates the impact of varying air intake conditions on impeller outlet pressure pulsation, internal complex flow patterns, and noise characteristics at the operator position. This research aims to offer valuable insights and a solid theoretical foundation for optimizing the design of dual-suction centrifugal fans.
This study introduces a non-equal flow inlet scheme, derived from unsteady simulation analysis and noise testing, that enhances the aerodynamic performance and reduces noise in asymmetric double-suction centrifugal fans. While this approach offers significant engineering guidance, further research is necessary. Future work should include integrating kitchen space considerations, performing multi-phase flow coupling analysis, accounting for human behavior and smoke exhaust conditions, accumulating measurement data, and developing a reduced-order analysis model for inlet parameters, aerodynamic noise, and air pollution concentration. Additionally, establishing a multi-objective optimization model for air quality and kitchen noise levels, dynamically optimizing inlet conditions, and ensuring superior performance of squirrel-cage fans across various operating scenarios will be essential.
3. Analysis of Internal Flow Characteristics
3.1. Numerical Method
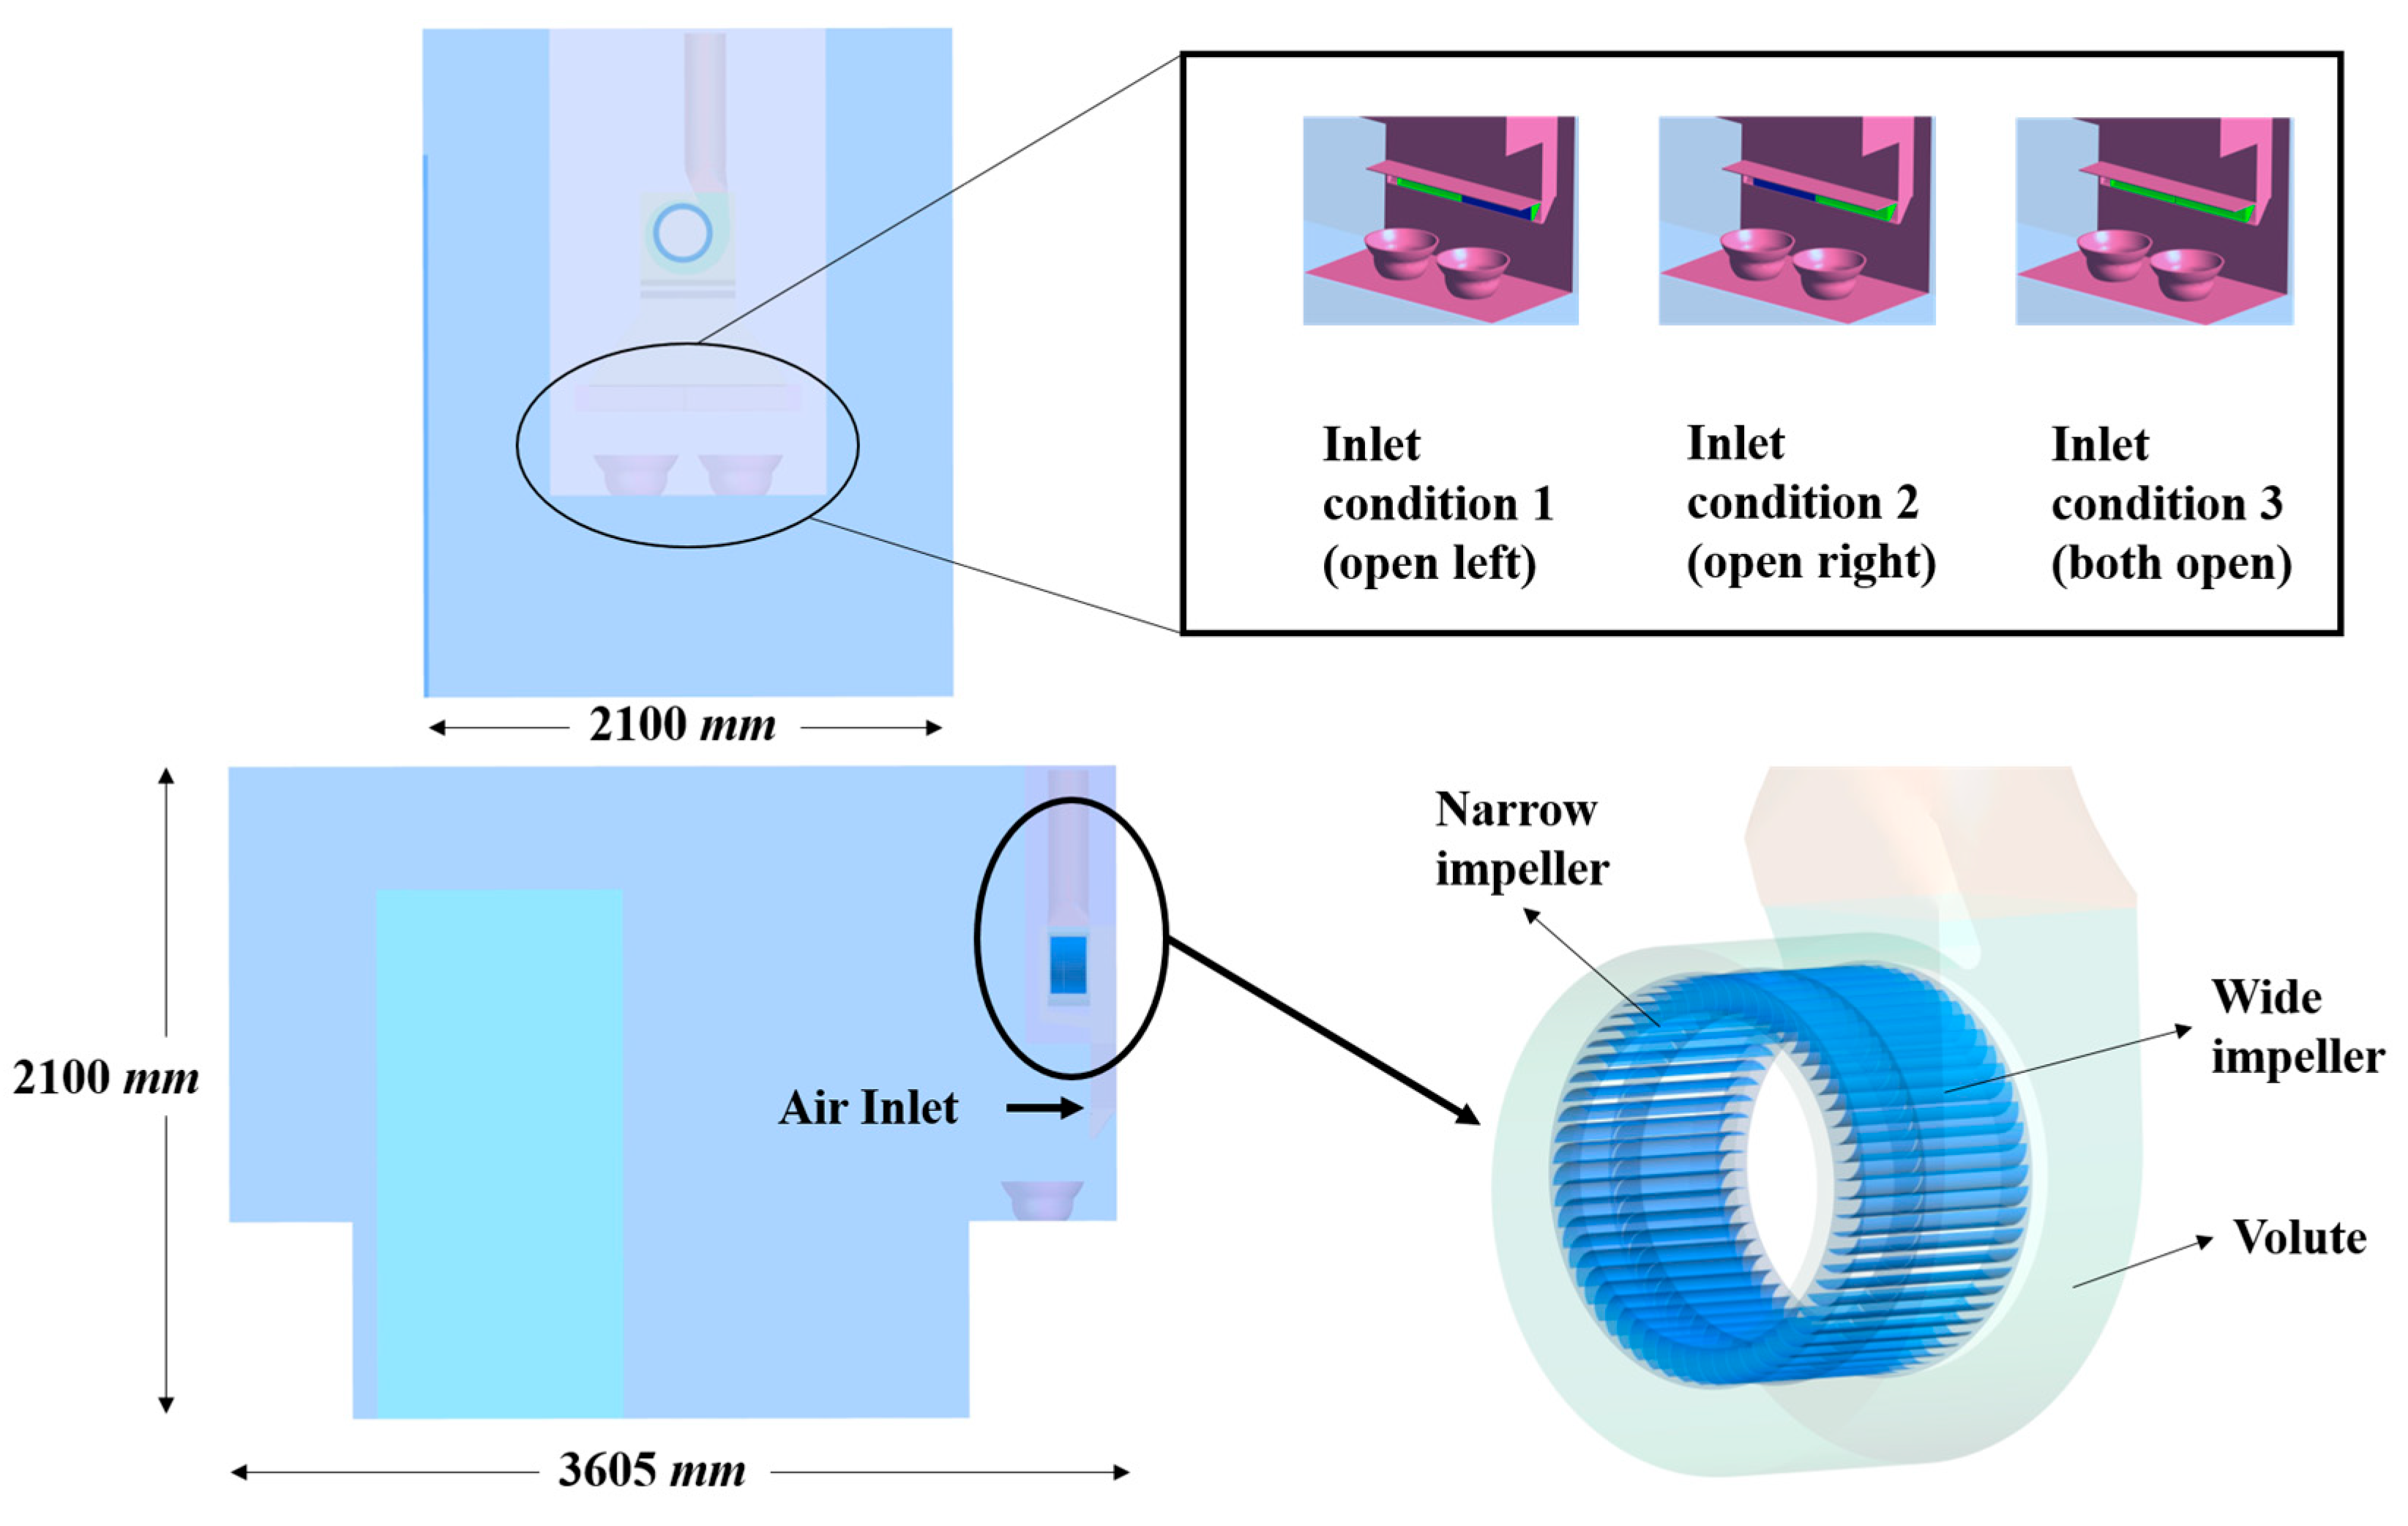
The kitchen model in this paper represents a typical household kitchen layout, as shown in
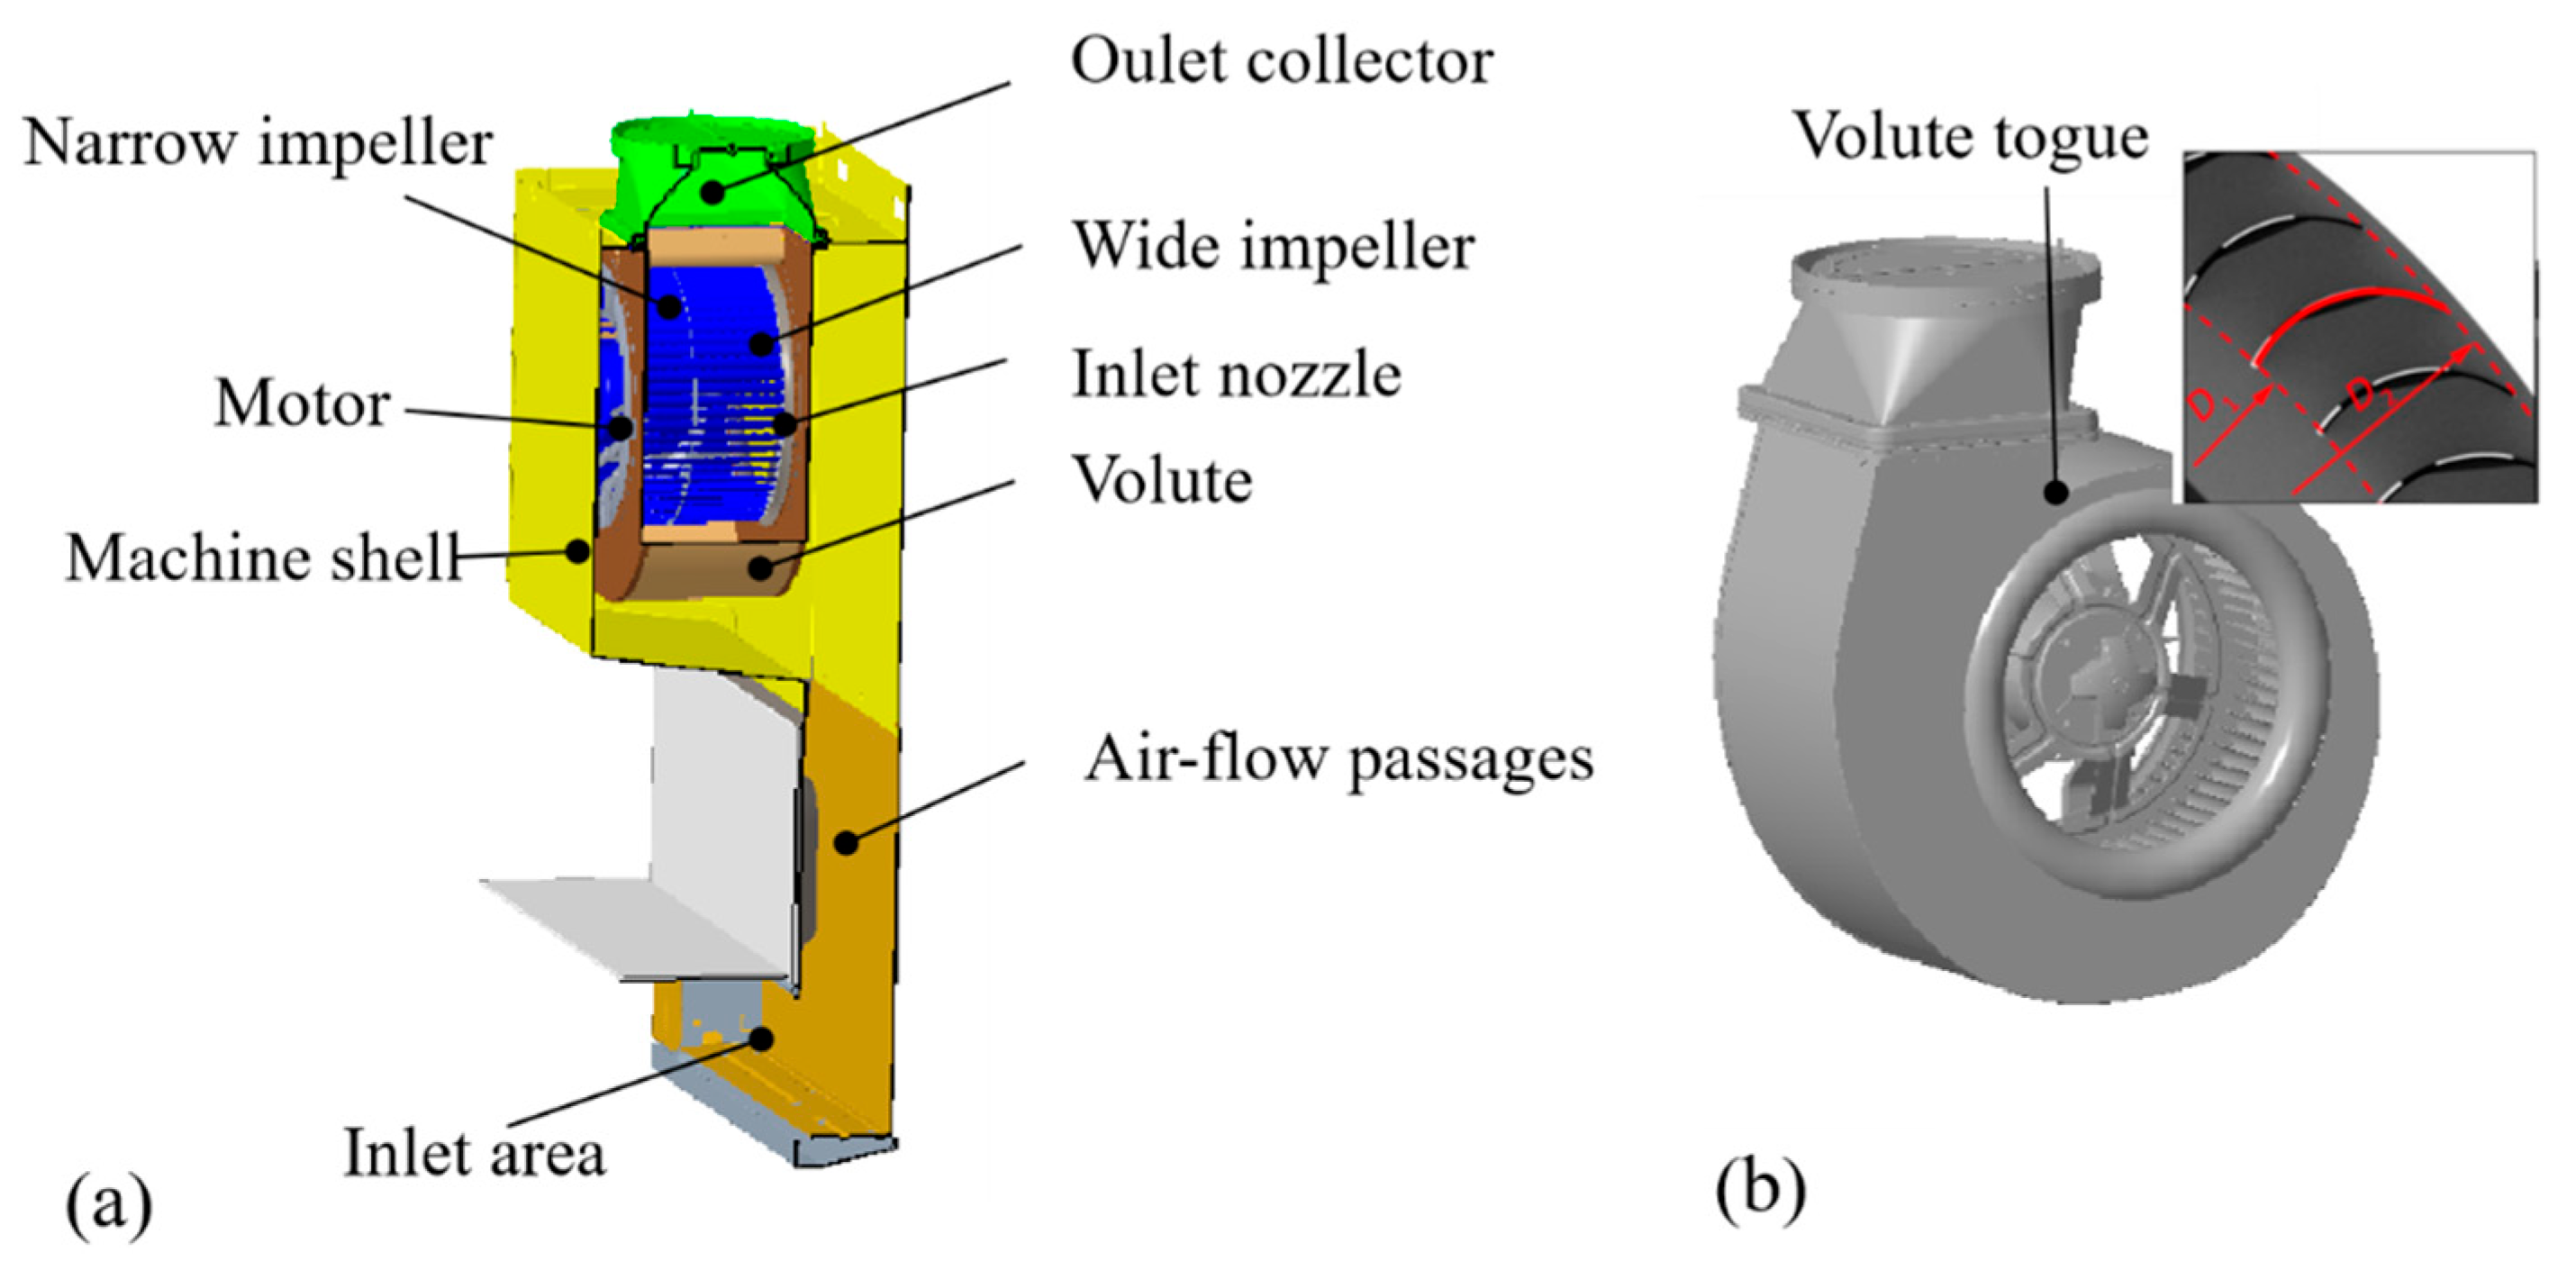
Figure 6, with overall kitchen dimensions of 3.6 m × 2.1 m × 2.1 m. There are 60 blades in the impeller, consisting of a wide and narrow impeller, forming a double-suction structure. Moreover, a 1200 rpm speed resulted in a blade-passing frequency of 1200 Hz and a shaft frequency of 20 Hz. Other parameters are listed in
Table 1. The entire computational domain is meshed using ANSYS ICEM 2022R1, with hexahedral mesh division for the impeller and refinement of the impeller blade wall mesh shown in
Figure 7, ensuring a rotational domain with y
+ ≤ 1. The remaining areas are meshed using tetrahedral elements.
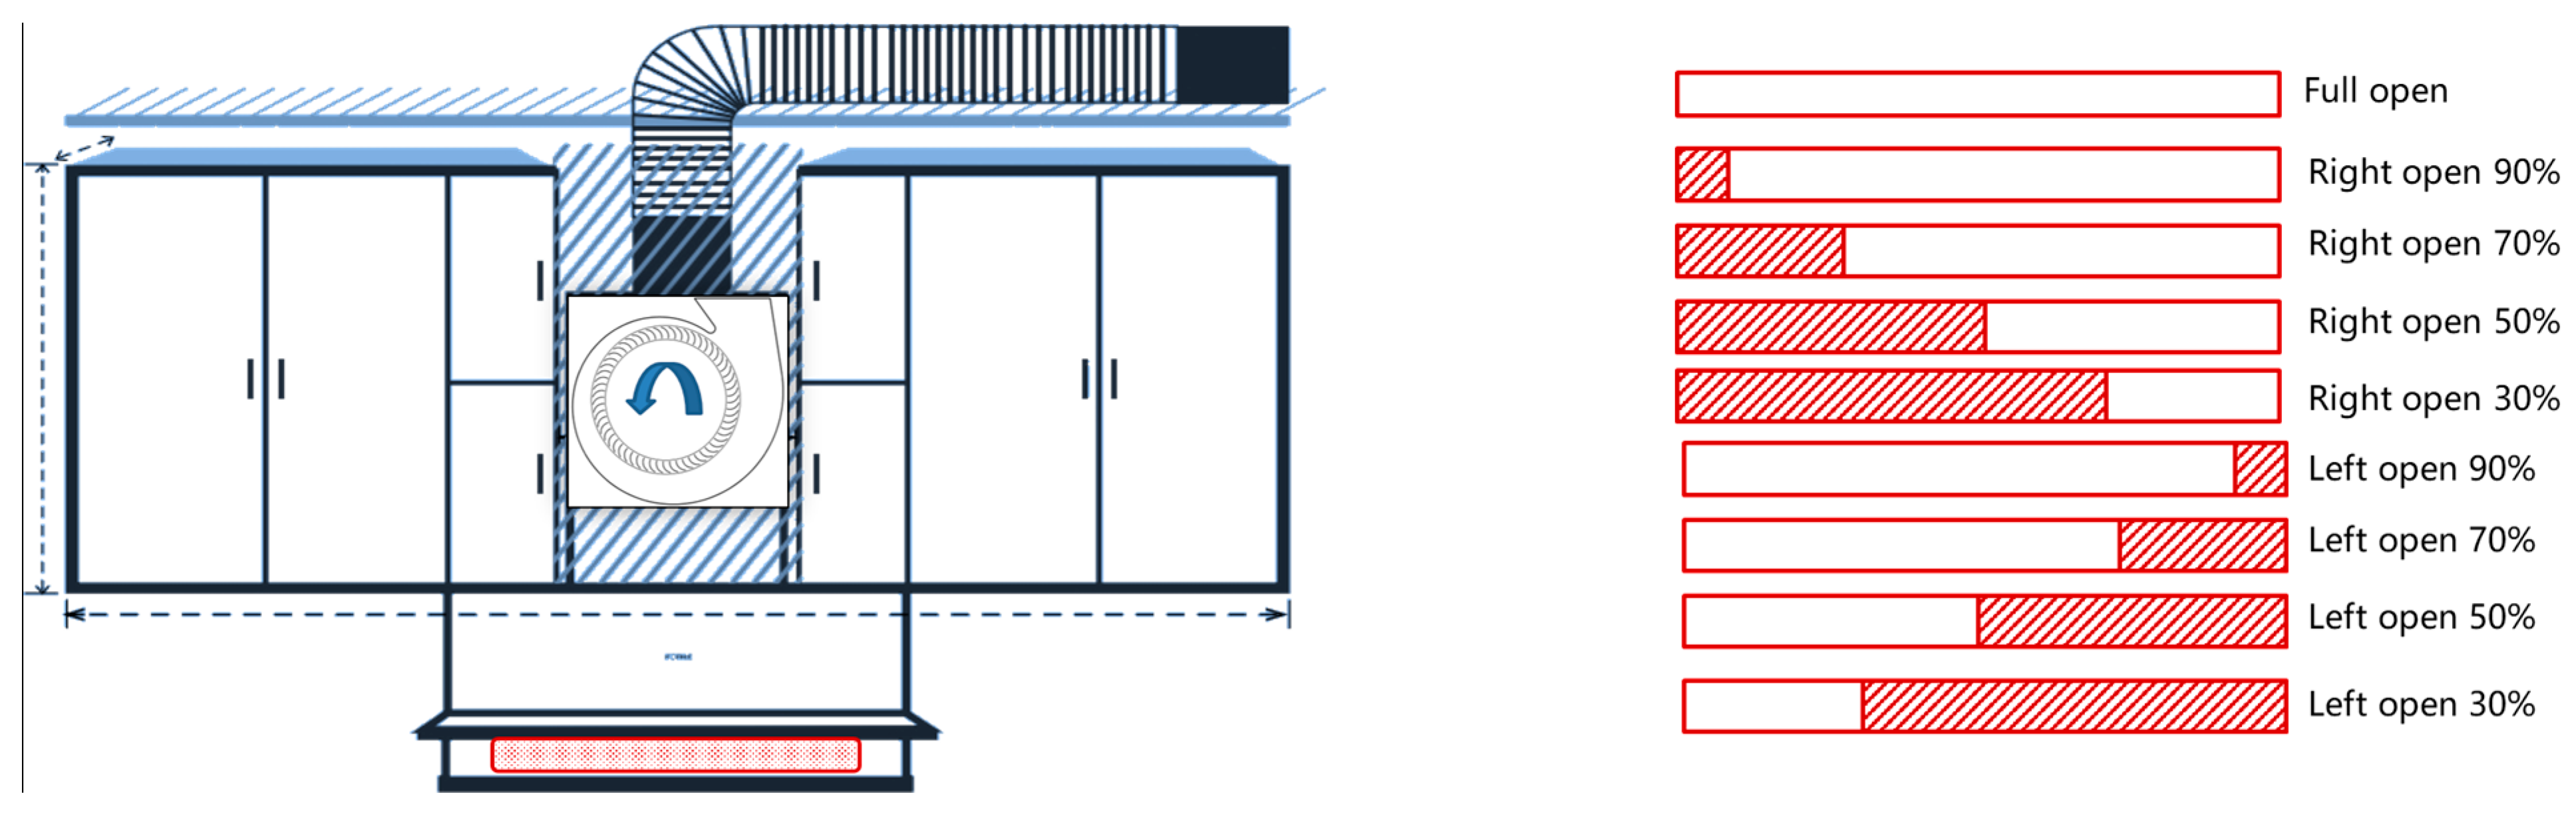
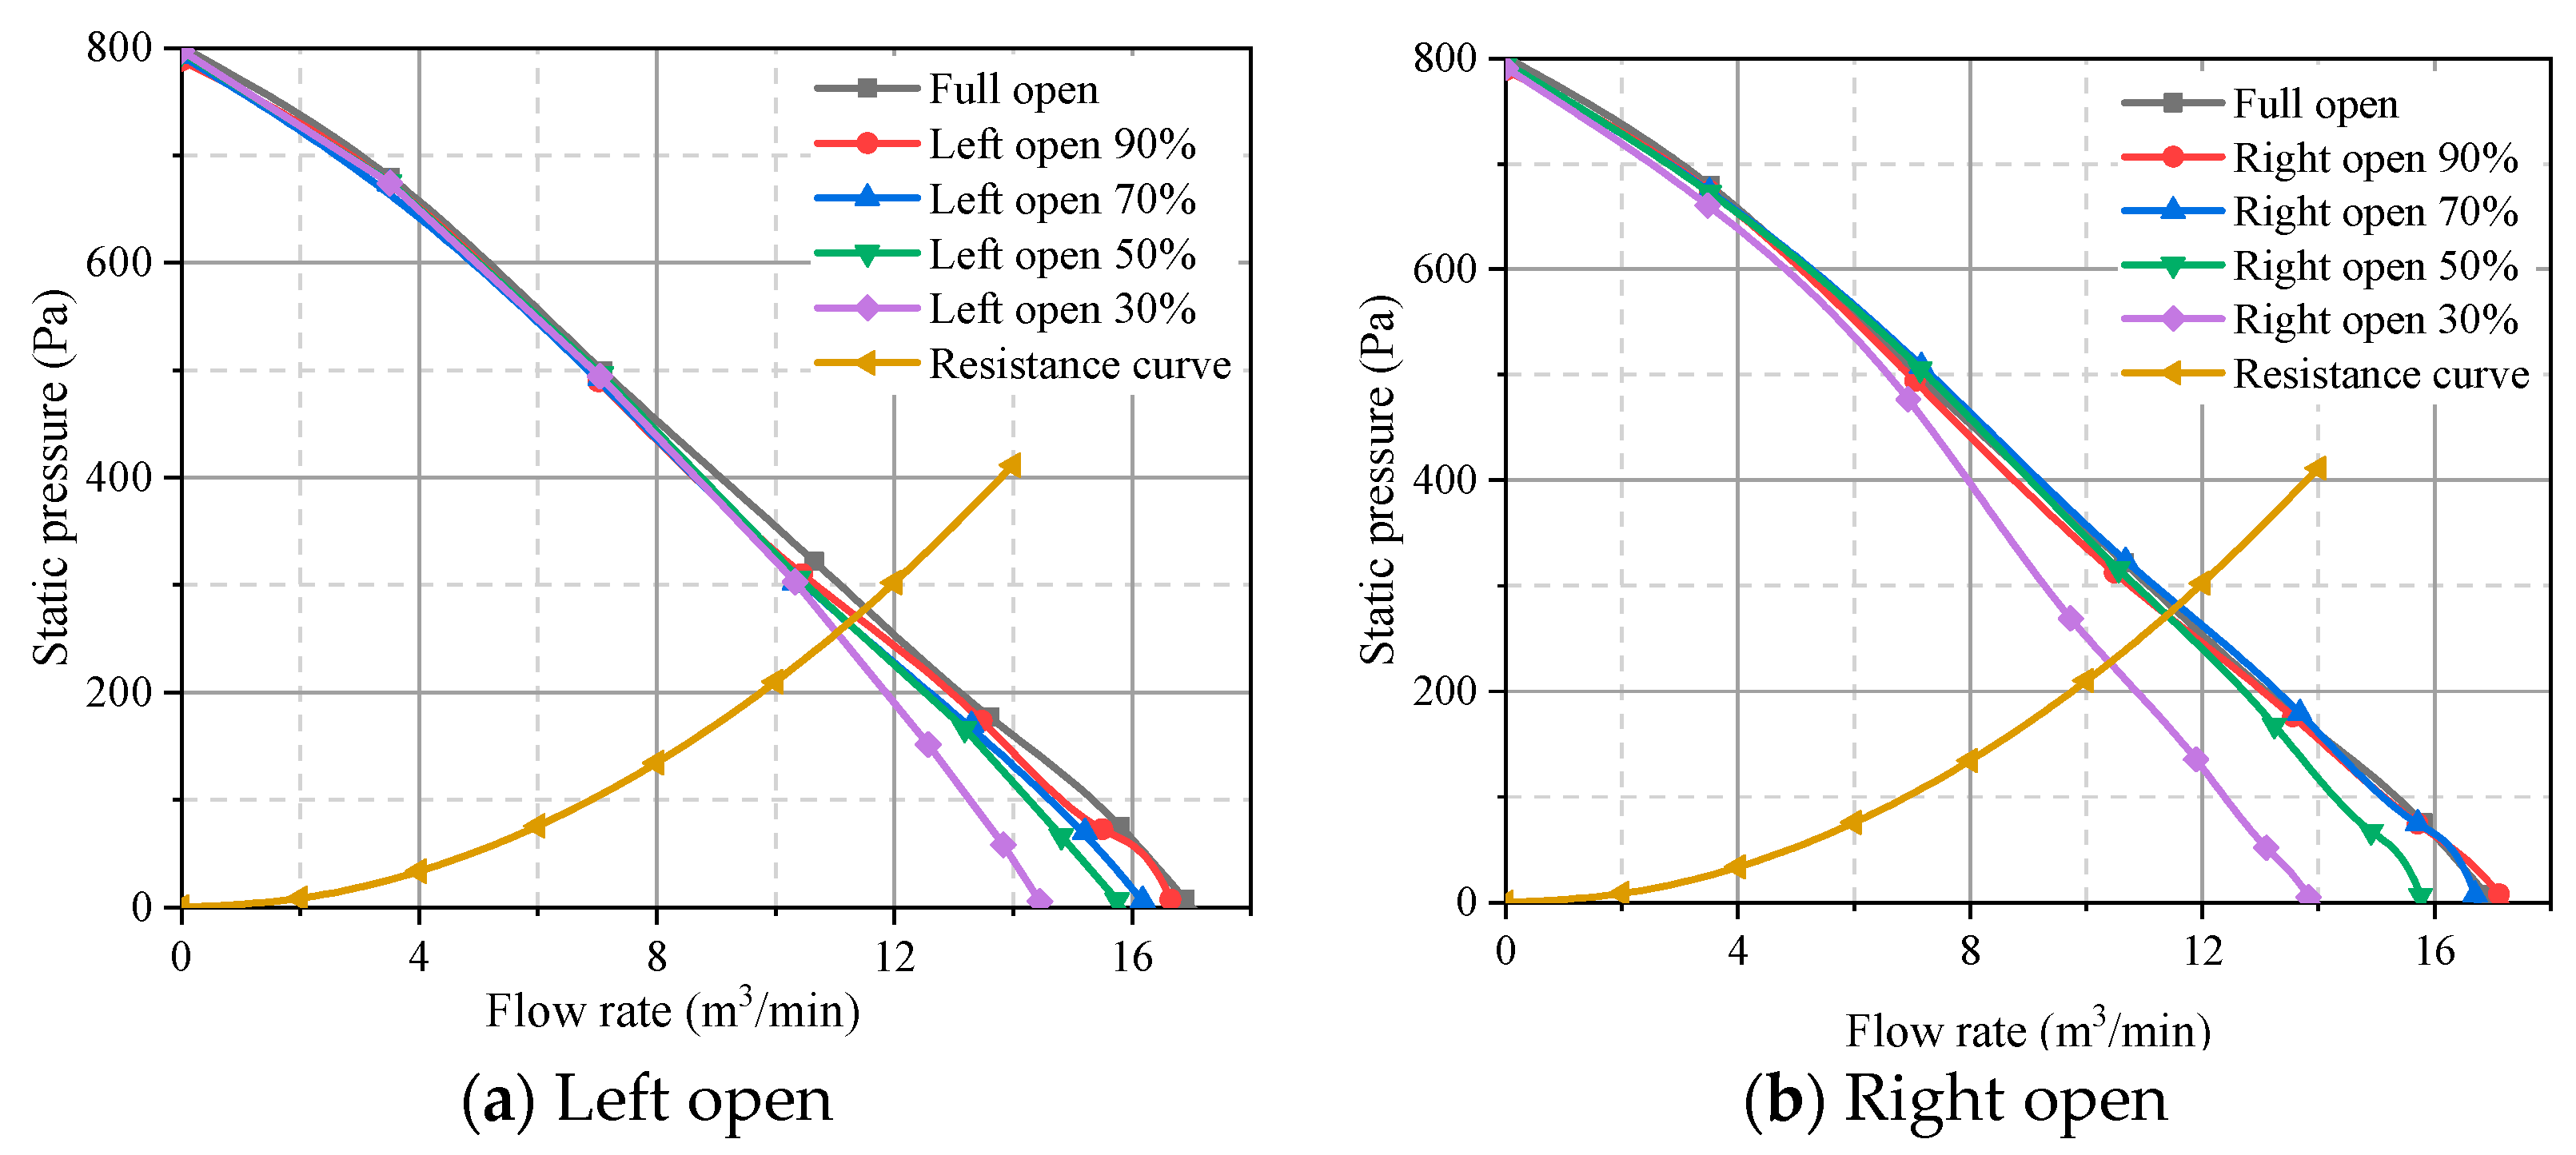
Based on the aerodynamic performance analysis in the previous text, an internal flow study was conducted on the inlet conditions of 50% left opening, 50% right opening, and full opening. These conditions were named inlet condition 1, inlet condition 2, and inlet condition 3, respectively, to further analyze the internal mechanism for the performance differences.
At the rated operating conditions, the LES was employed to numerically simulate seven different mesh partitioning schemes. This turbulence model can derive the LES governing equations by adding a filtering function to the Navier–Stokes equations.
is the subgrid-scale stress, abbreviated as SGS stress, expressed as:
The most commonly used subgrid-scale model is the Smagorinsky–Lilly model.
is the strain tensor,
is the subgrid-scale turbulent viscosity.
is the filter width, is the Smagorinsky–Lilly constant, take .
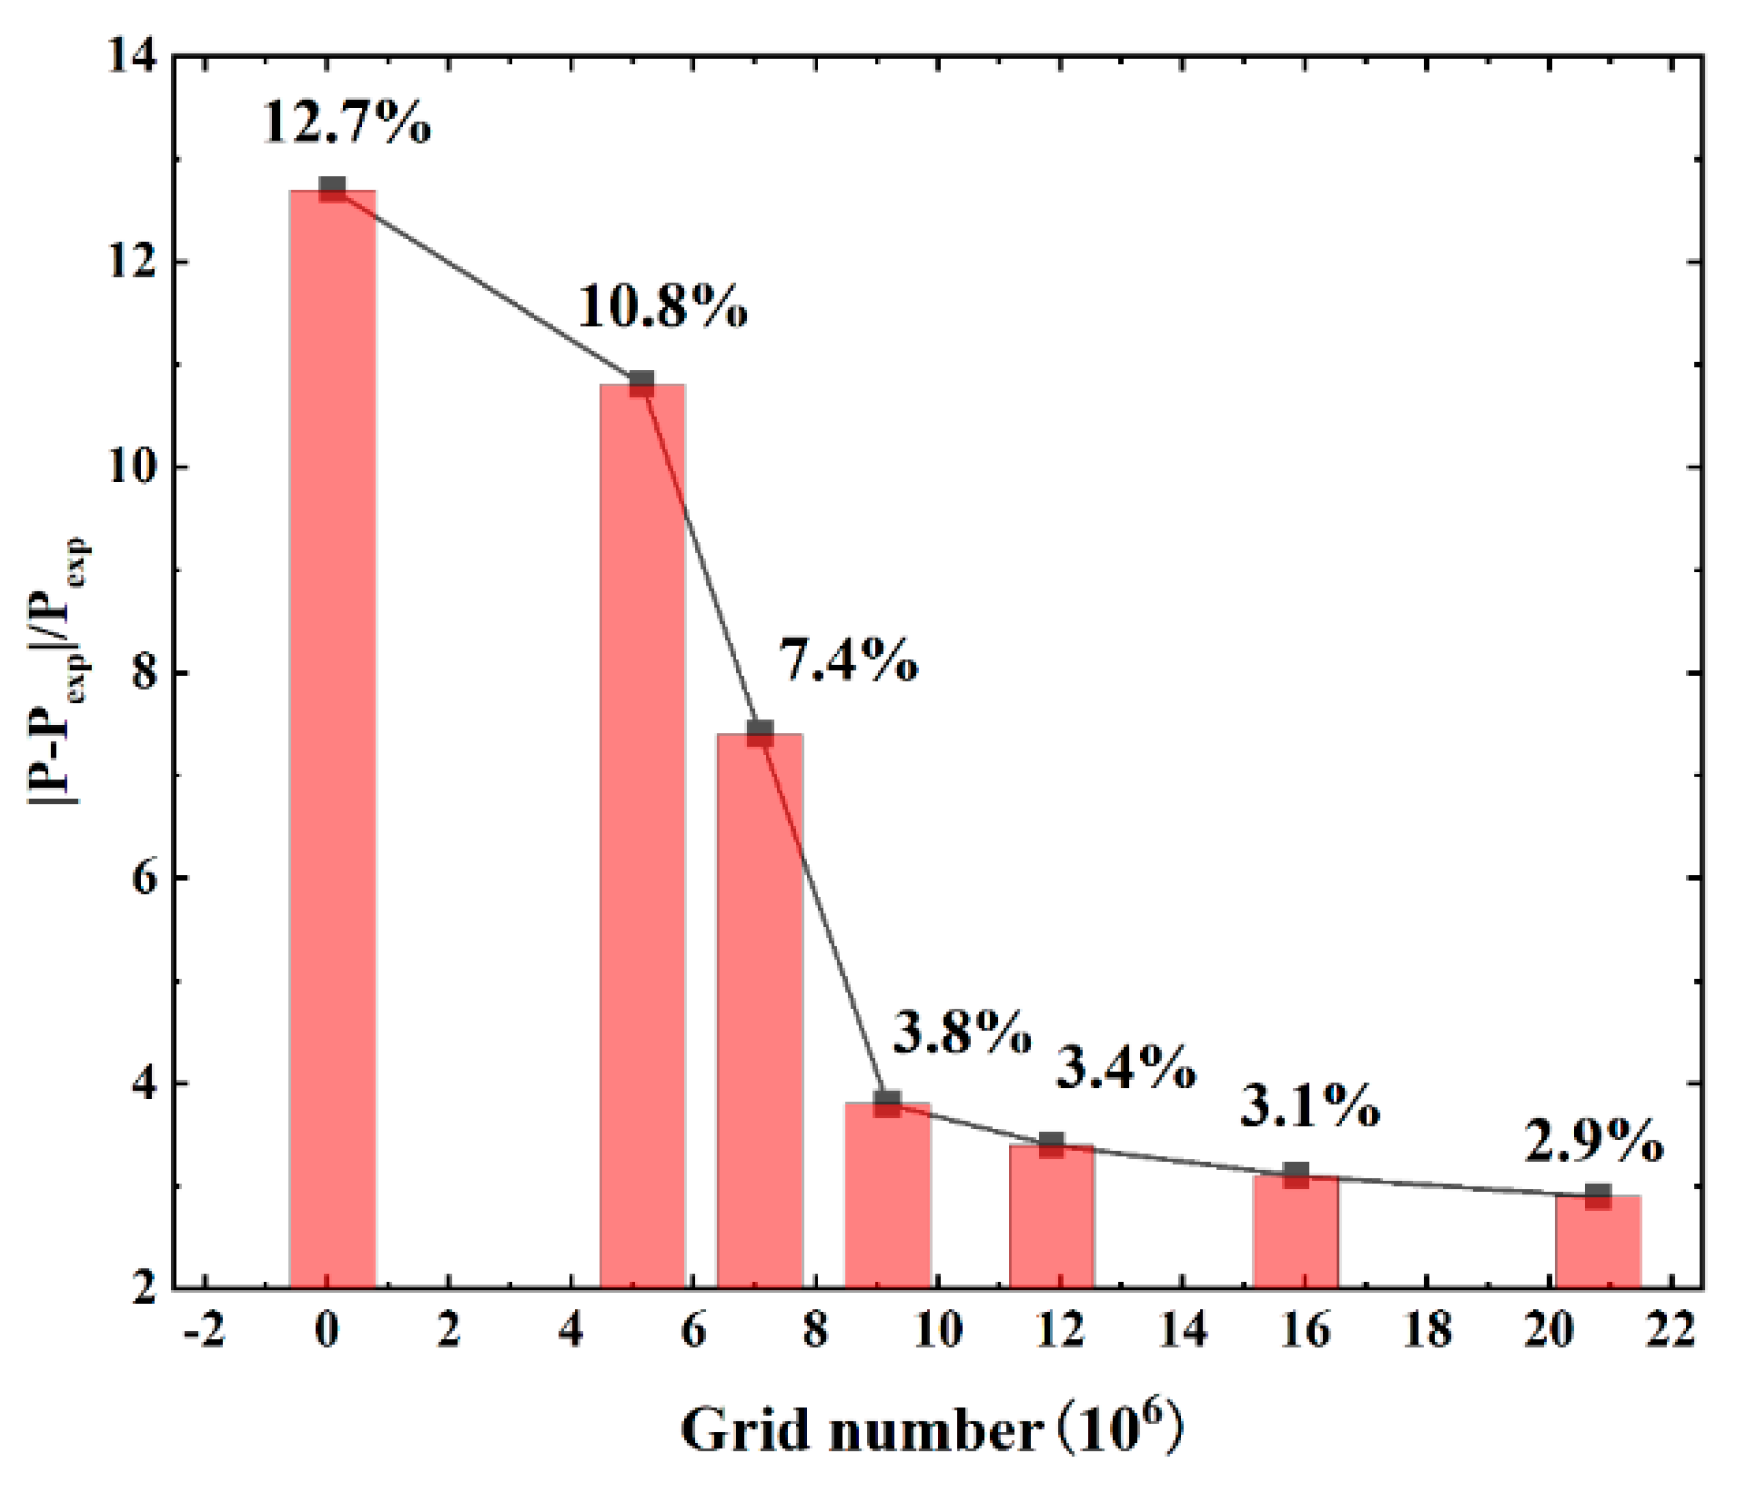
The computational domain was evaluated based on whether the total fan pressure stabilized as the grid number increased to verify mesh independence. When the grid number exceeded 9.18 × 10
6 under consistent computational conditions, changes in the total fan pressure became negligible. A grid total of 9.18 × 10
6 was selected for the numerical simulation to balance computational efficiency and accuracy. The mesh configuration is illustrated in
Figure 8.
Steady-state simulations were conducted using the SST k-ω turbulence model, chosen for its comprehensive accuracy as the optimal eddy-viscosity model. The entire computational process was carried out in ANSYS Fluent. The inlet boundary condition was defined as a pressure inlet, while the outlet was set as a mass flow outlet with a flow rate of 12 m3/min. Interfaces were applied at the boundaries between different regions to enable efficient data transfer.
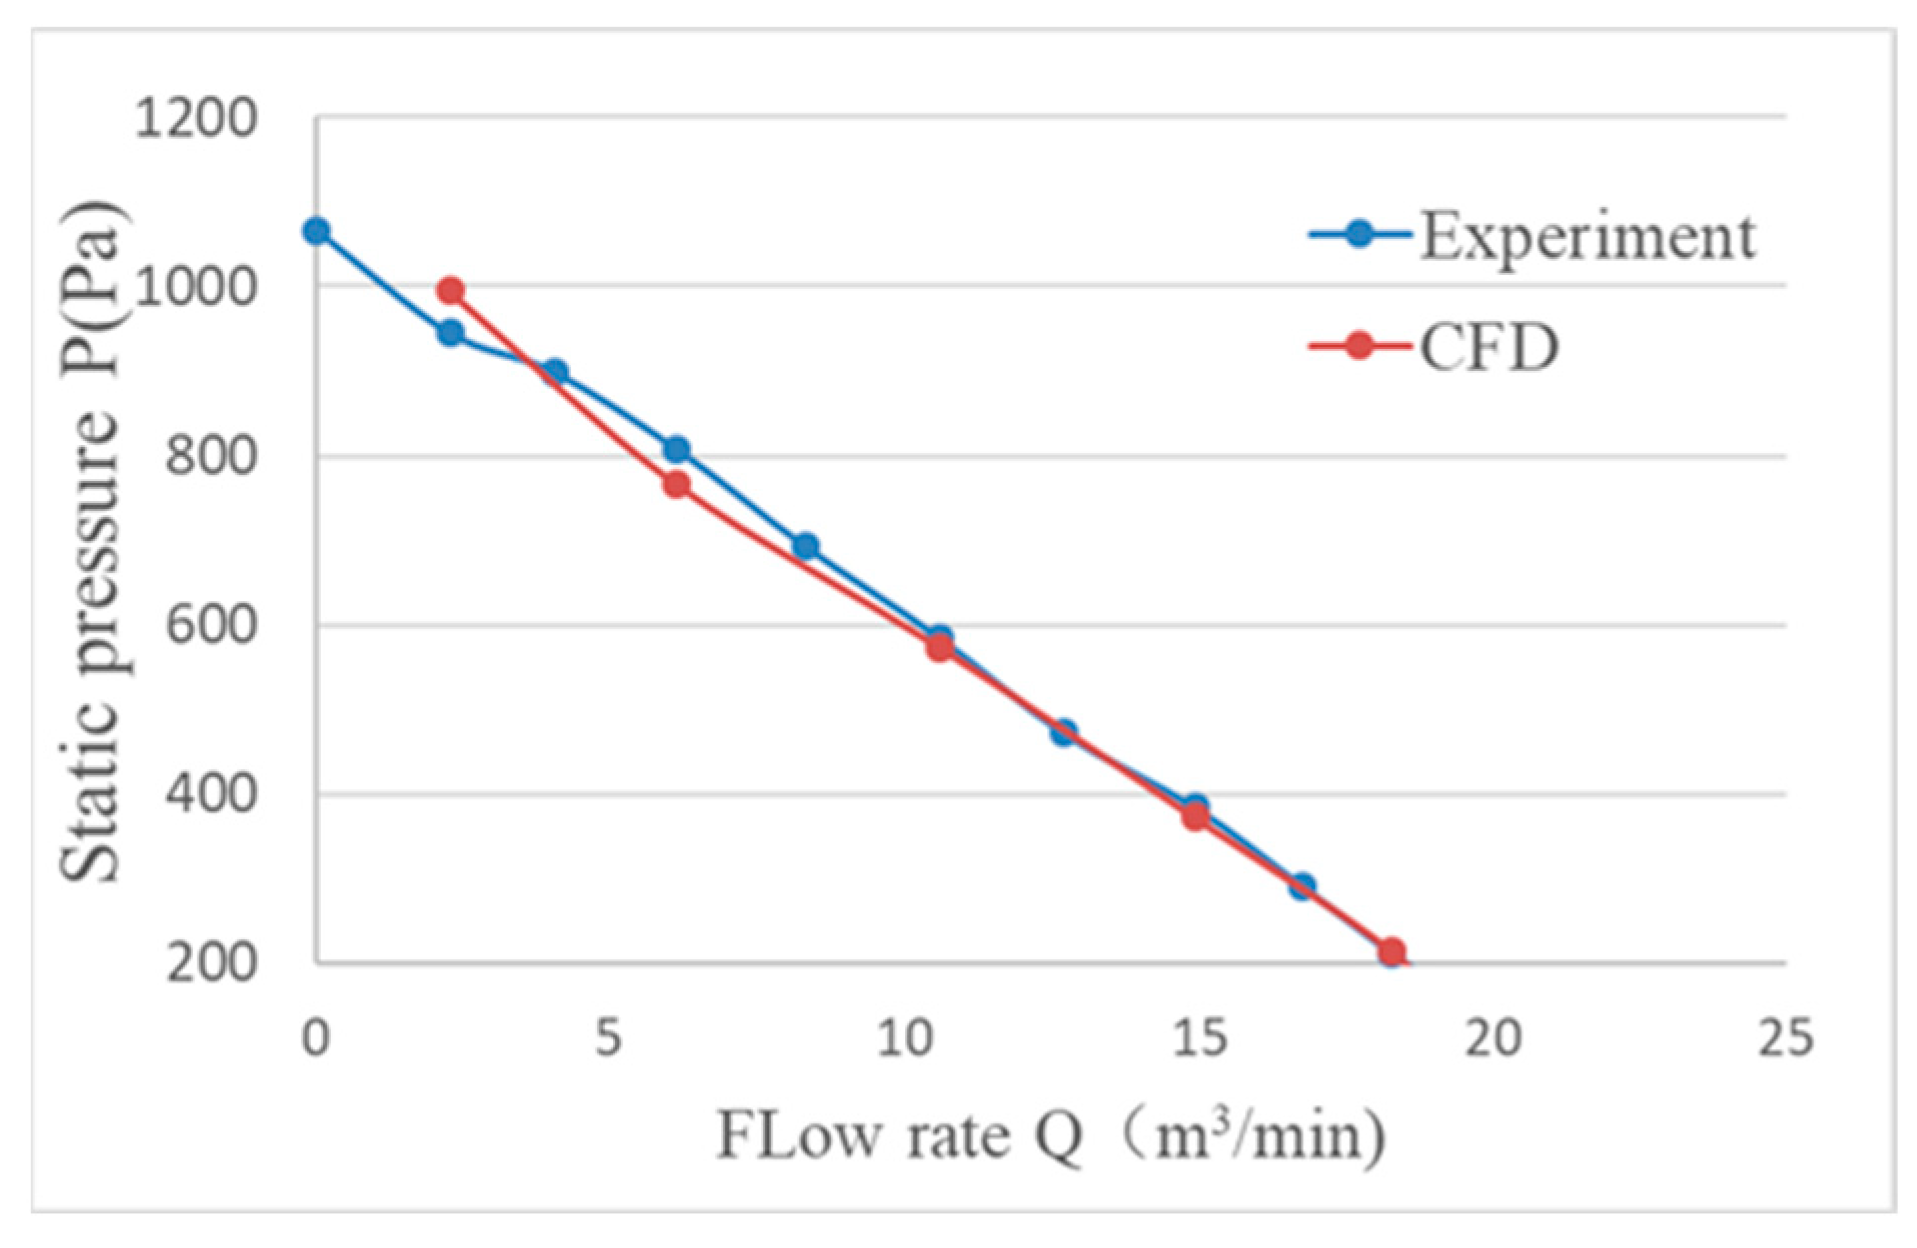
The steady-state results are used as initial values for unsteady simulations. The sliding mesh model facilitates data transfer at the dynamic–static interface. The numerical calculations are set to rotate the impeller by 0.5 degrees per step, with a corresponding time step of 6.9444 × 10
−5 s. Moreover, a comparison of the pressure curves obtained from the experiment and CFD calculation is shown in
Figure 9. The results from both the simulation and experiments show a strong correspondence in the high flow rate region. In the low flow rate area, the trends of both results are generally consistent, with the maximum error kept within 3%.
3.2. Flow Field Analysis
In the overall streamlined analysis (
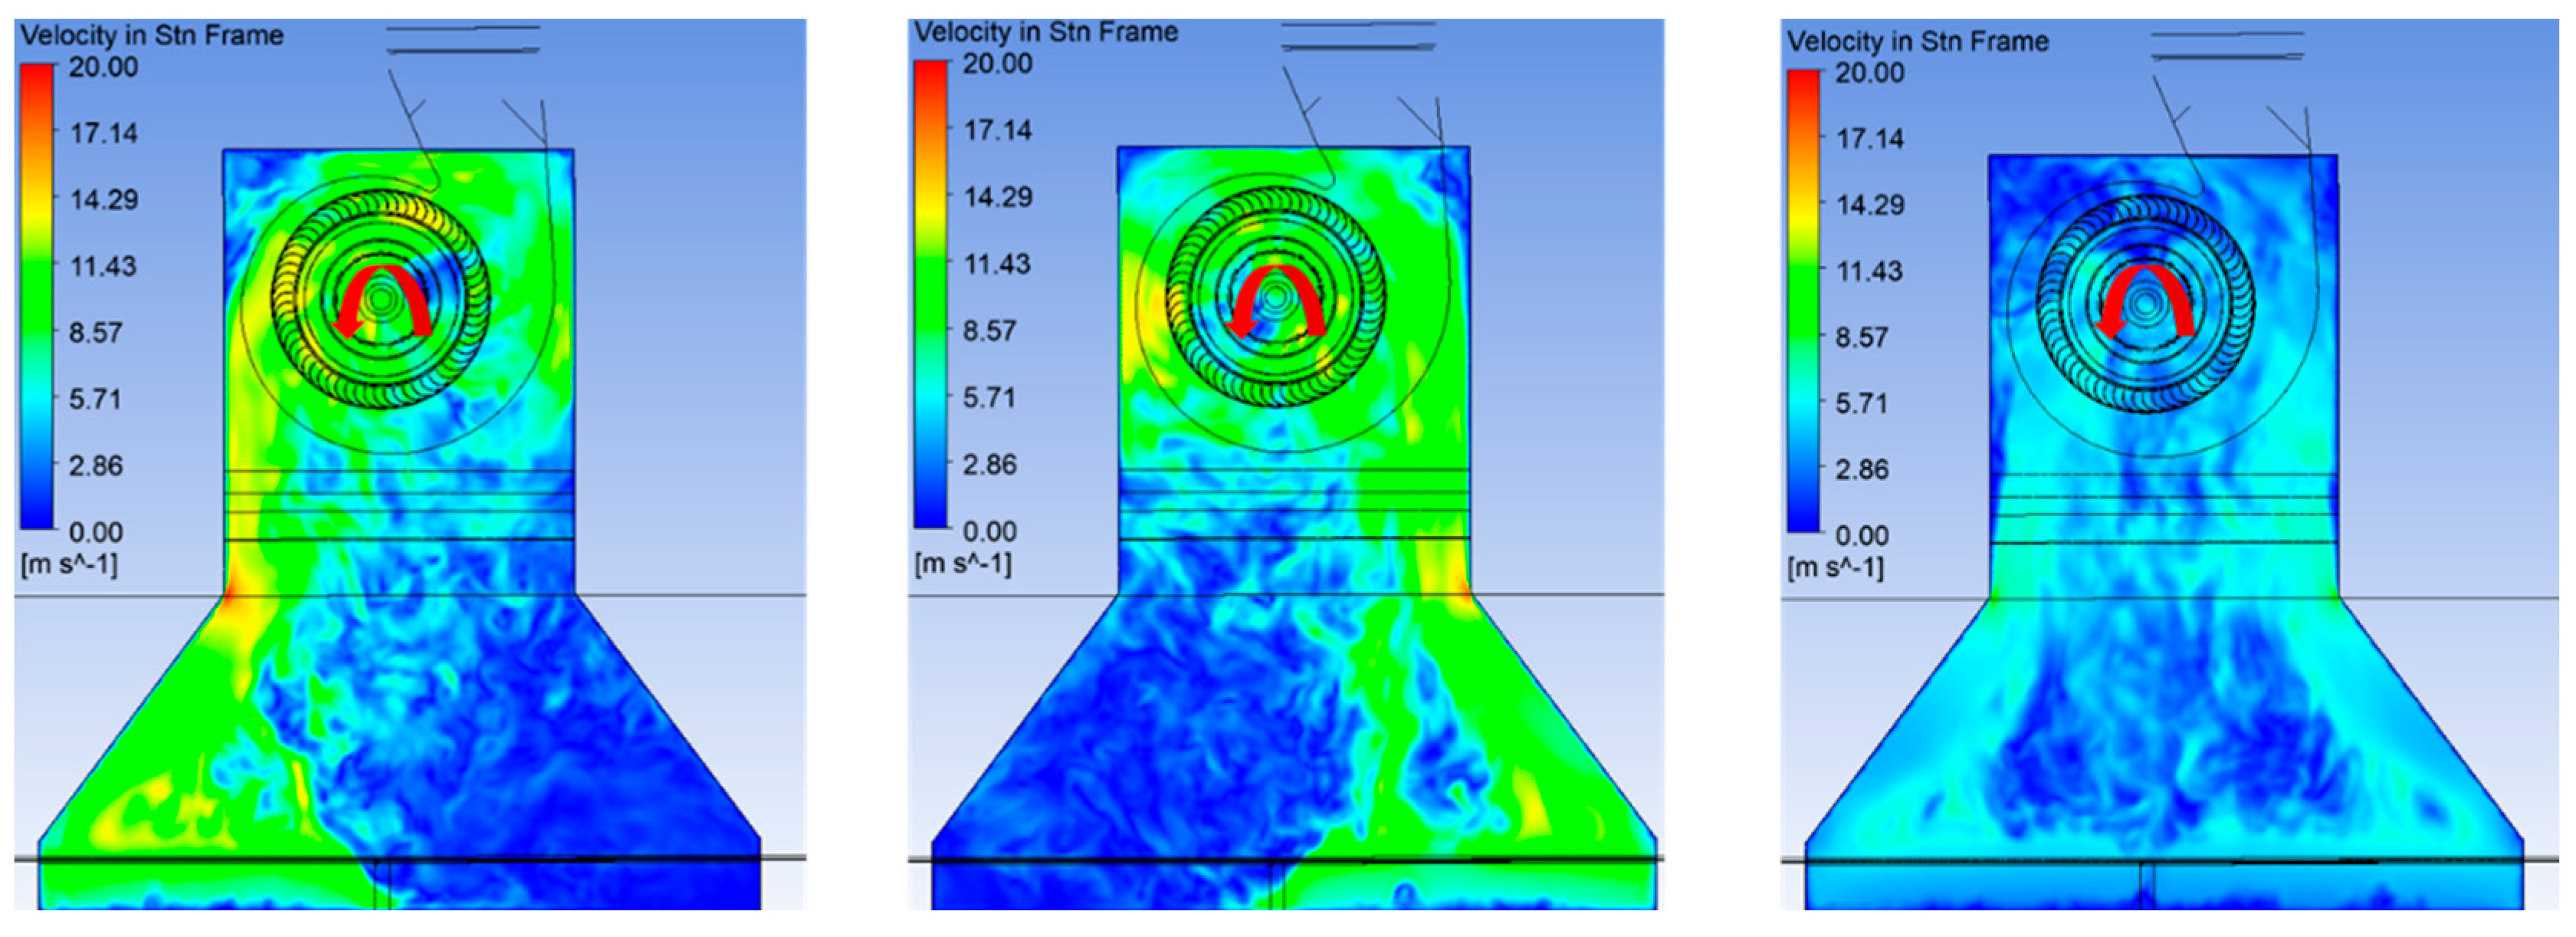
Figure 10), inlet condition 3 demonstrates lower velocities and more uniform streamlines at the fan inlet compared to inlet conditions 1 and 2. The figure reveals that fluid entering the fan inlet does not do so uniformly, which is a critical factor to consider in numerical simulations when modeling the kitchen environment. To examine the flow state near the impeller, two planes (Planes 1 and 2) were created.
Figure 11 shows that while the flow under inlet condition 3 is relatively uniform, there is a distinct low-speed zone in the middle area. Under inlet conditions 1 and 2, the velocity distribution within the intake chamber is uneven, with large low-speed zones in non-intake regions and increased vortex separation. Given the impeller rotation direction, airflow under inlet condition 1 enters from the left side, affecting the impeller’s rotation direction.
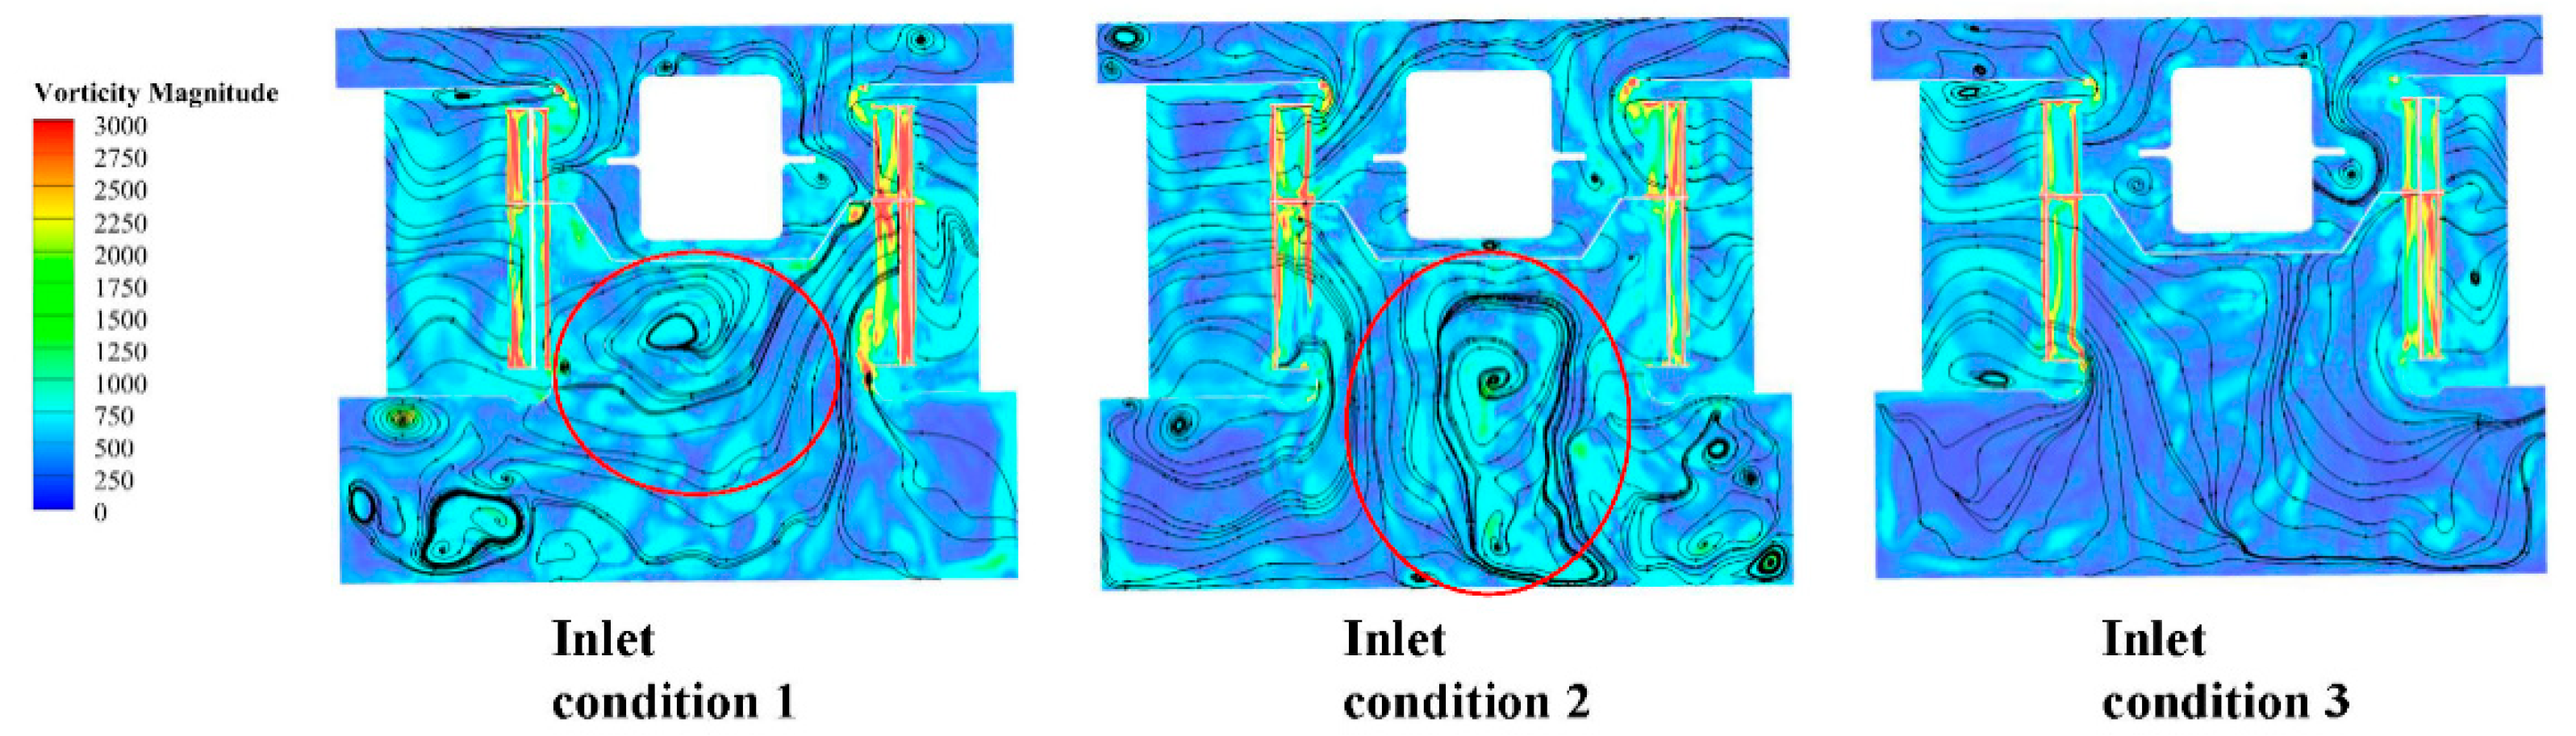
Figure 12 further illustrates that asymmetric inlet conditions generate large-scale circulation in another dimension, directly caused by the impeller’s uneven air intake. From the perspective of plane 1, where the impeller rotates counterclockwise, inlet condition 1 shows that flow entering from the left side opposes the impeller’s rotation, resulting in higher impact forces on the fluid and more complex flow characteristics. In contrast, inlet condition 2, where flow enters from the right side, aligns with the impeller’s rotation direction, leading to a more stable internal flow state compared to condition 1.
3.3. Influence of Inlet Conditions on the Pressure Fluctuation of Impeller Outlet
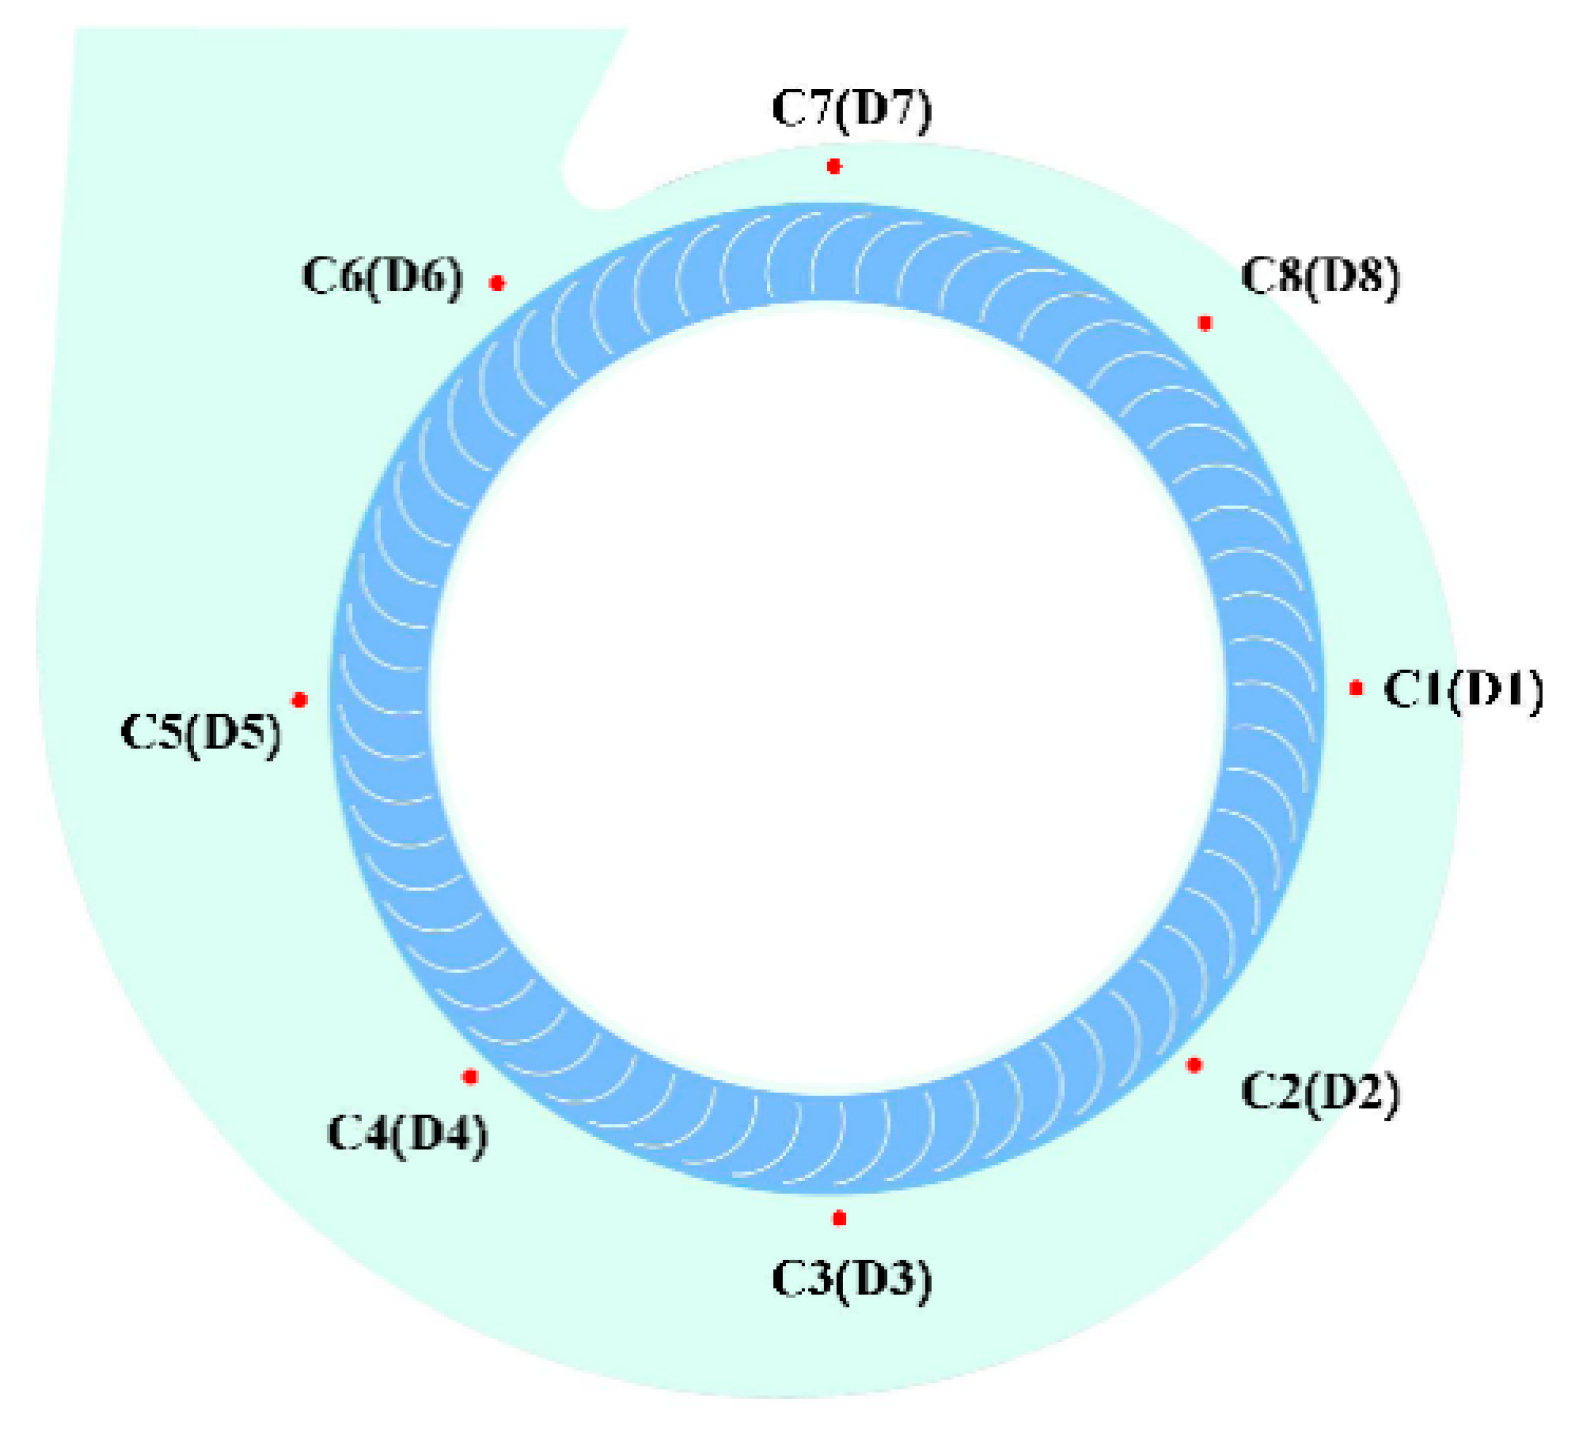
The arrangement of all pressure fluctuation measurement points in this study is shown in
Figure 13. Eight monitoring points (C1~C8, D1~D8) are uniformly arranged around the outlet of the wide and narrow impellers. Pressure fluctuations data within a certain period are dimensionless processed, defining the pressure coefficient
Cp and the root mean square of pressure fluctuation coefficient
Cp-RMS:
where
p is the instantaneous pressure value.
is the mean value of pressure data in a specific time period.
u2 is the circumferential velocity of the impeller outlet.
n is the number of selected pressure coefficient samples.
The computational results indicate that the impact of different inlet conditions on the time domain is generally similar. Time-domain analysis offers a detailed description of the instantaneous characteristics of pressure signals, while frequency-domain analysis provides a deeper understanding of the frequency components and their sources. By combining both approaches, we gain a more comprehensive understanding of the fan’s flow field characteristics and their relationship with noise and vibration. As shown in
Figure 14, inlet condition 3 provides more stable time-domain characteristics, with a higher mean pressure coefficient (
Cp), suggesting that the fluid gains more energy under this condition.
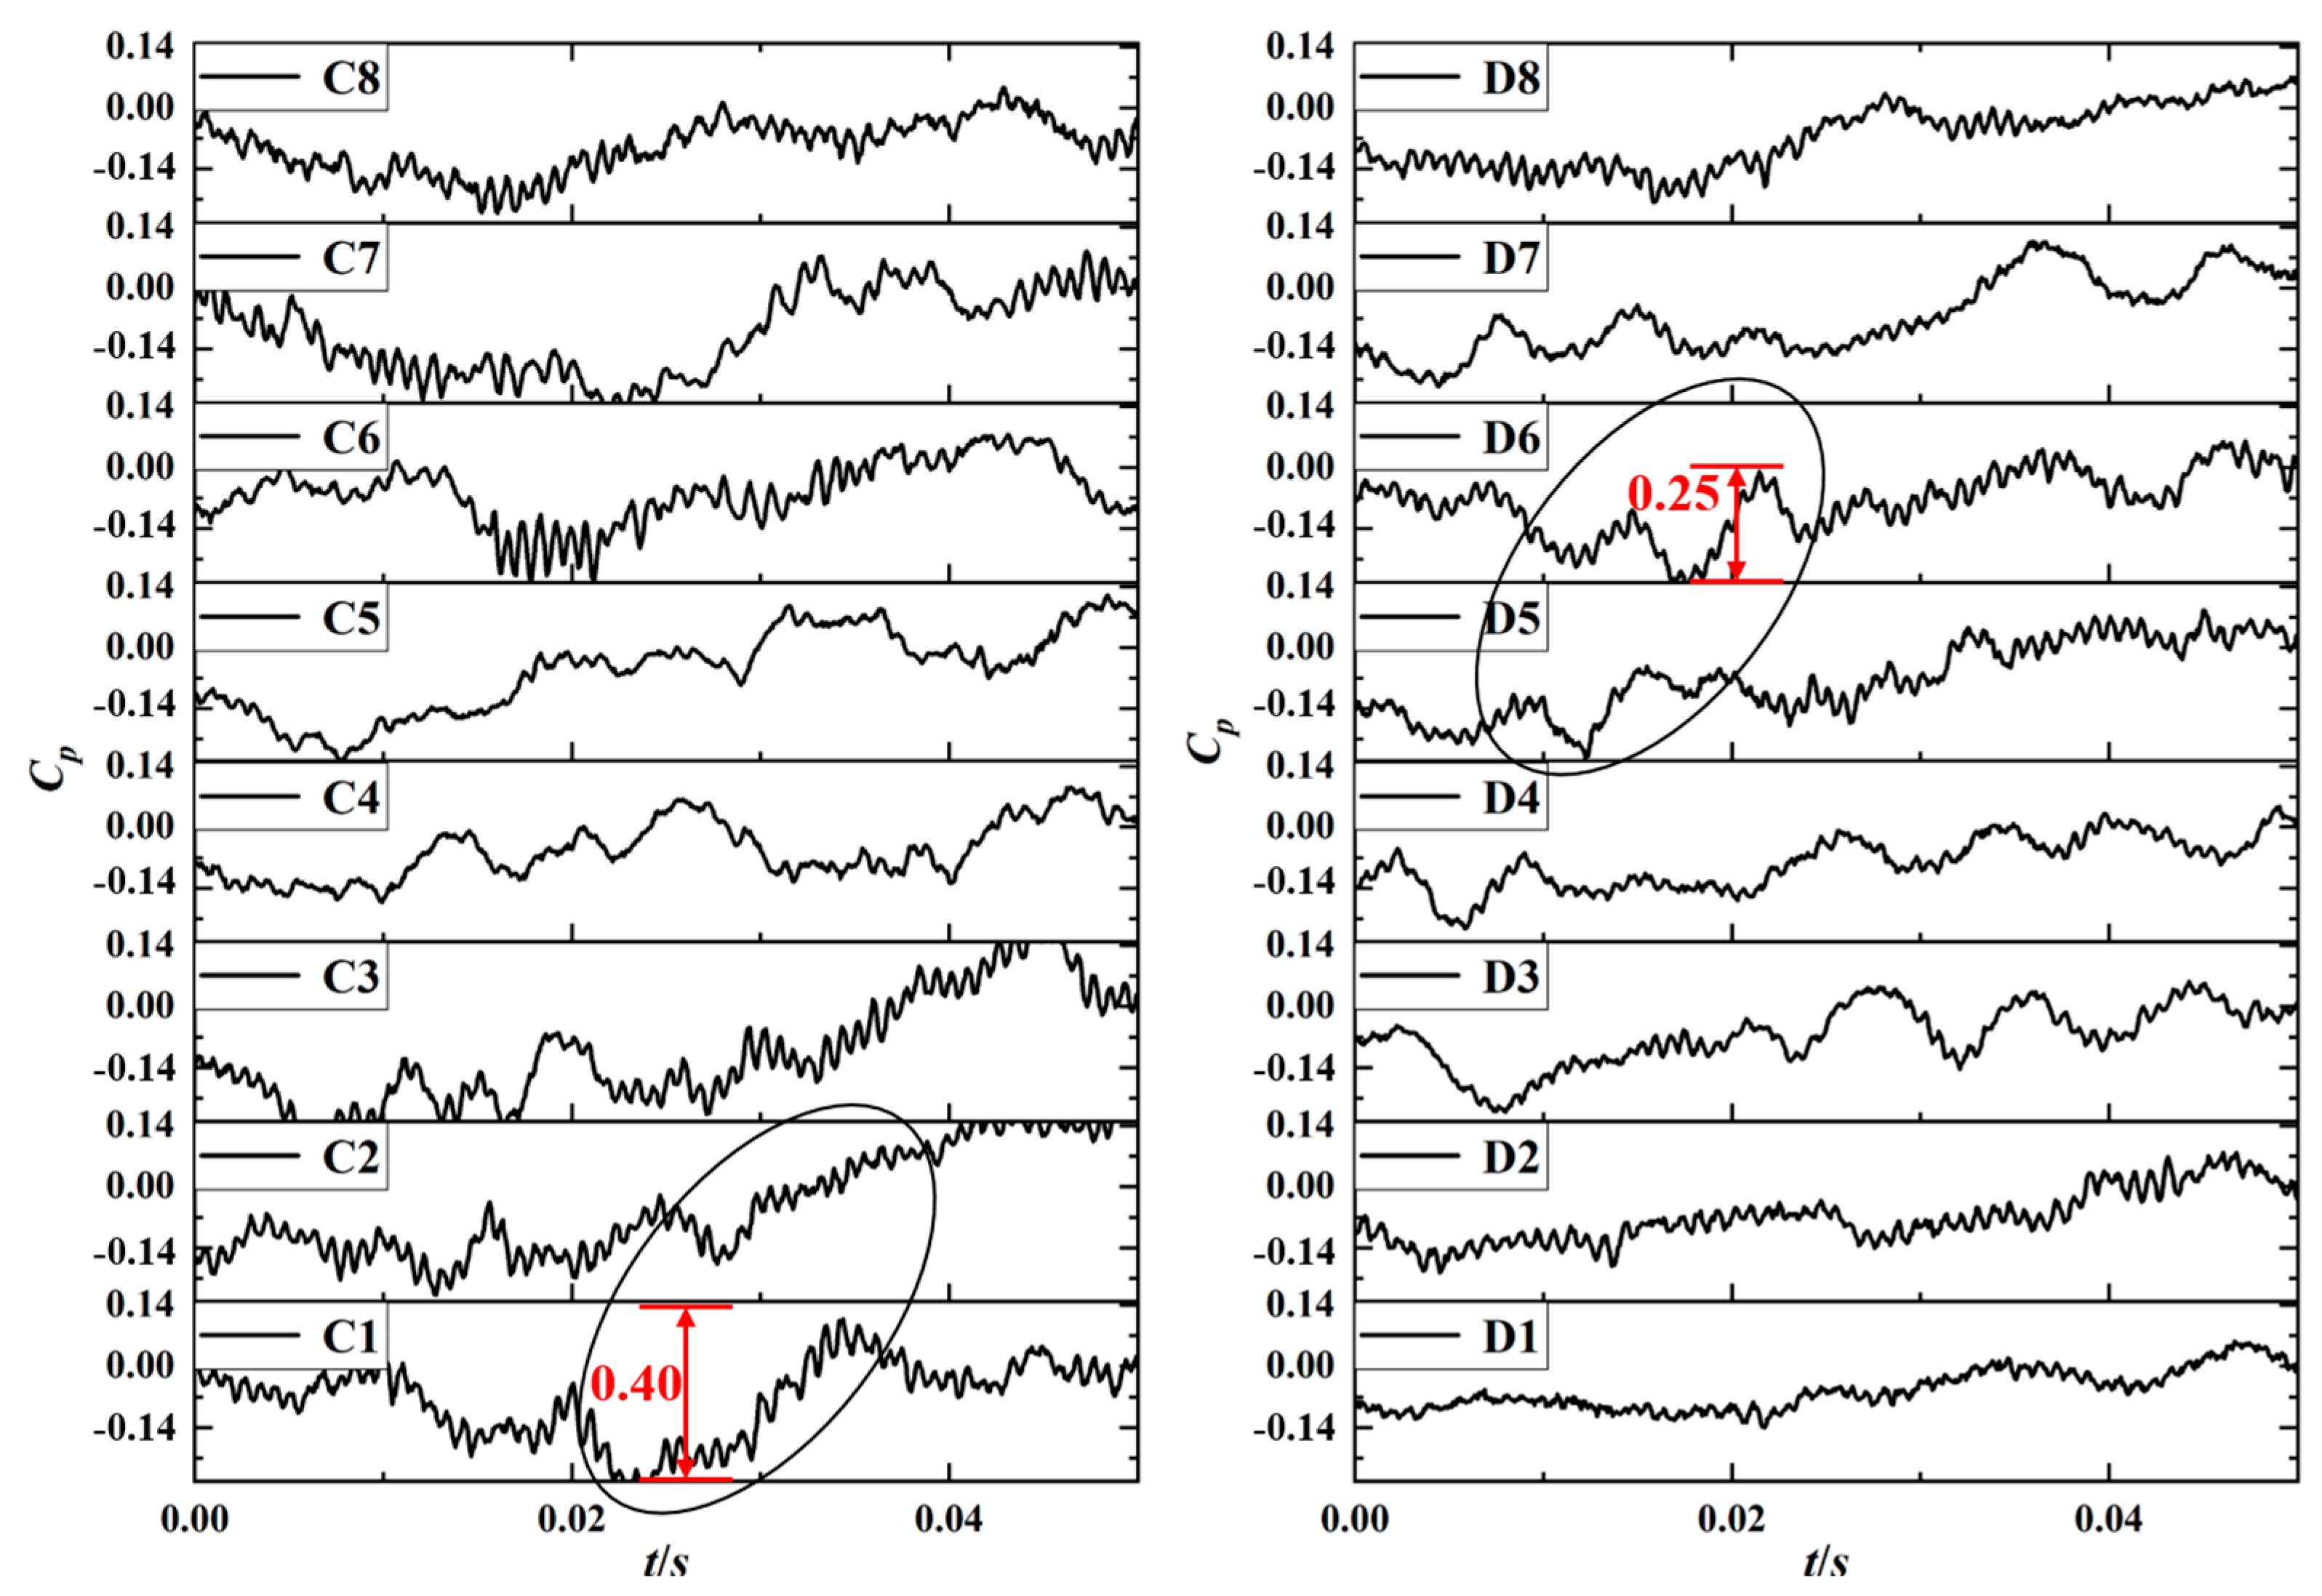
Figure 15 illustrates that under inlet condition 1, the pressure signals at various monitoring points exhibit a distinct peak–valley pattern over time. This pattern is due to the periodic impact of the blades on the surrounding air as the impeller rotates, with each cycle producing 60 distinct peaks corresponding to the number of blades. Notably, under inlet condition 1, there are significant fluctuations in the
Cp near the C1 measurement point for the wide impeller and near the D5 measurement point for the narrow impeller. The time-domain characteristics for the wide impeller are comparatively more stable, with a maximum
Cp pulsation amplitude of 0.25, while the narrow impeller experiences a higher amplitude of 0.4. Subsequent analysis will focus on the flow characteristics near the C1 measurement point for the wide impeller and the D5 measurement point for the narrow impeller under inlet condition 1.
The rotor–stator interaction at the impeller outlet serves as the main source of internal unsteady pulsations in the fan. To capture the pulsation characteristics in this region and assess the impact of different inlet conditions on the rotor–stator interaction, eight monitoring points (C1~C8 and D1~D8) are evenly distributed at the outlet of each impeller. The time-domain signals from these points are processed using Fast Fourier Transform (FFT) with a Hanning window to analyze the frequency-domain signals under various inlet conditions.
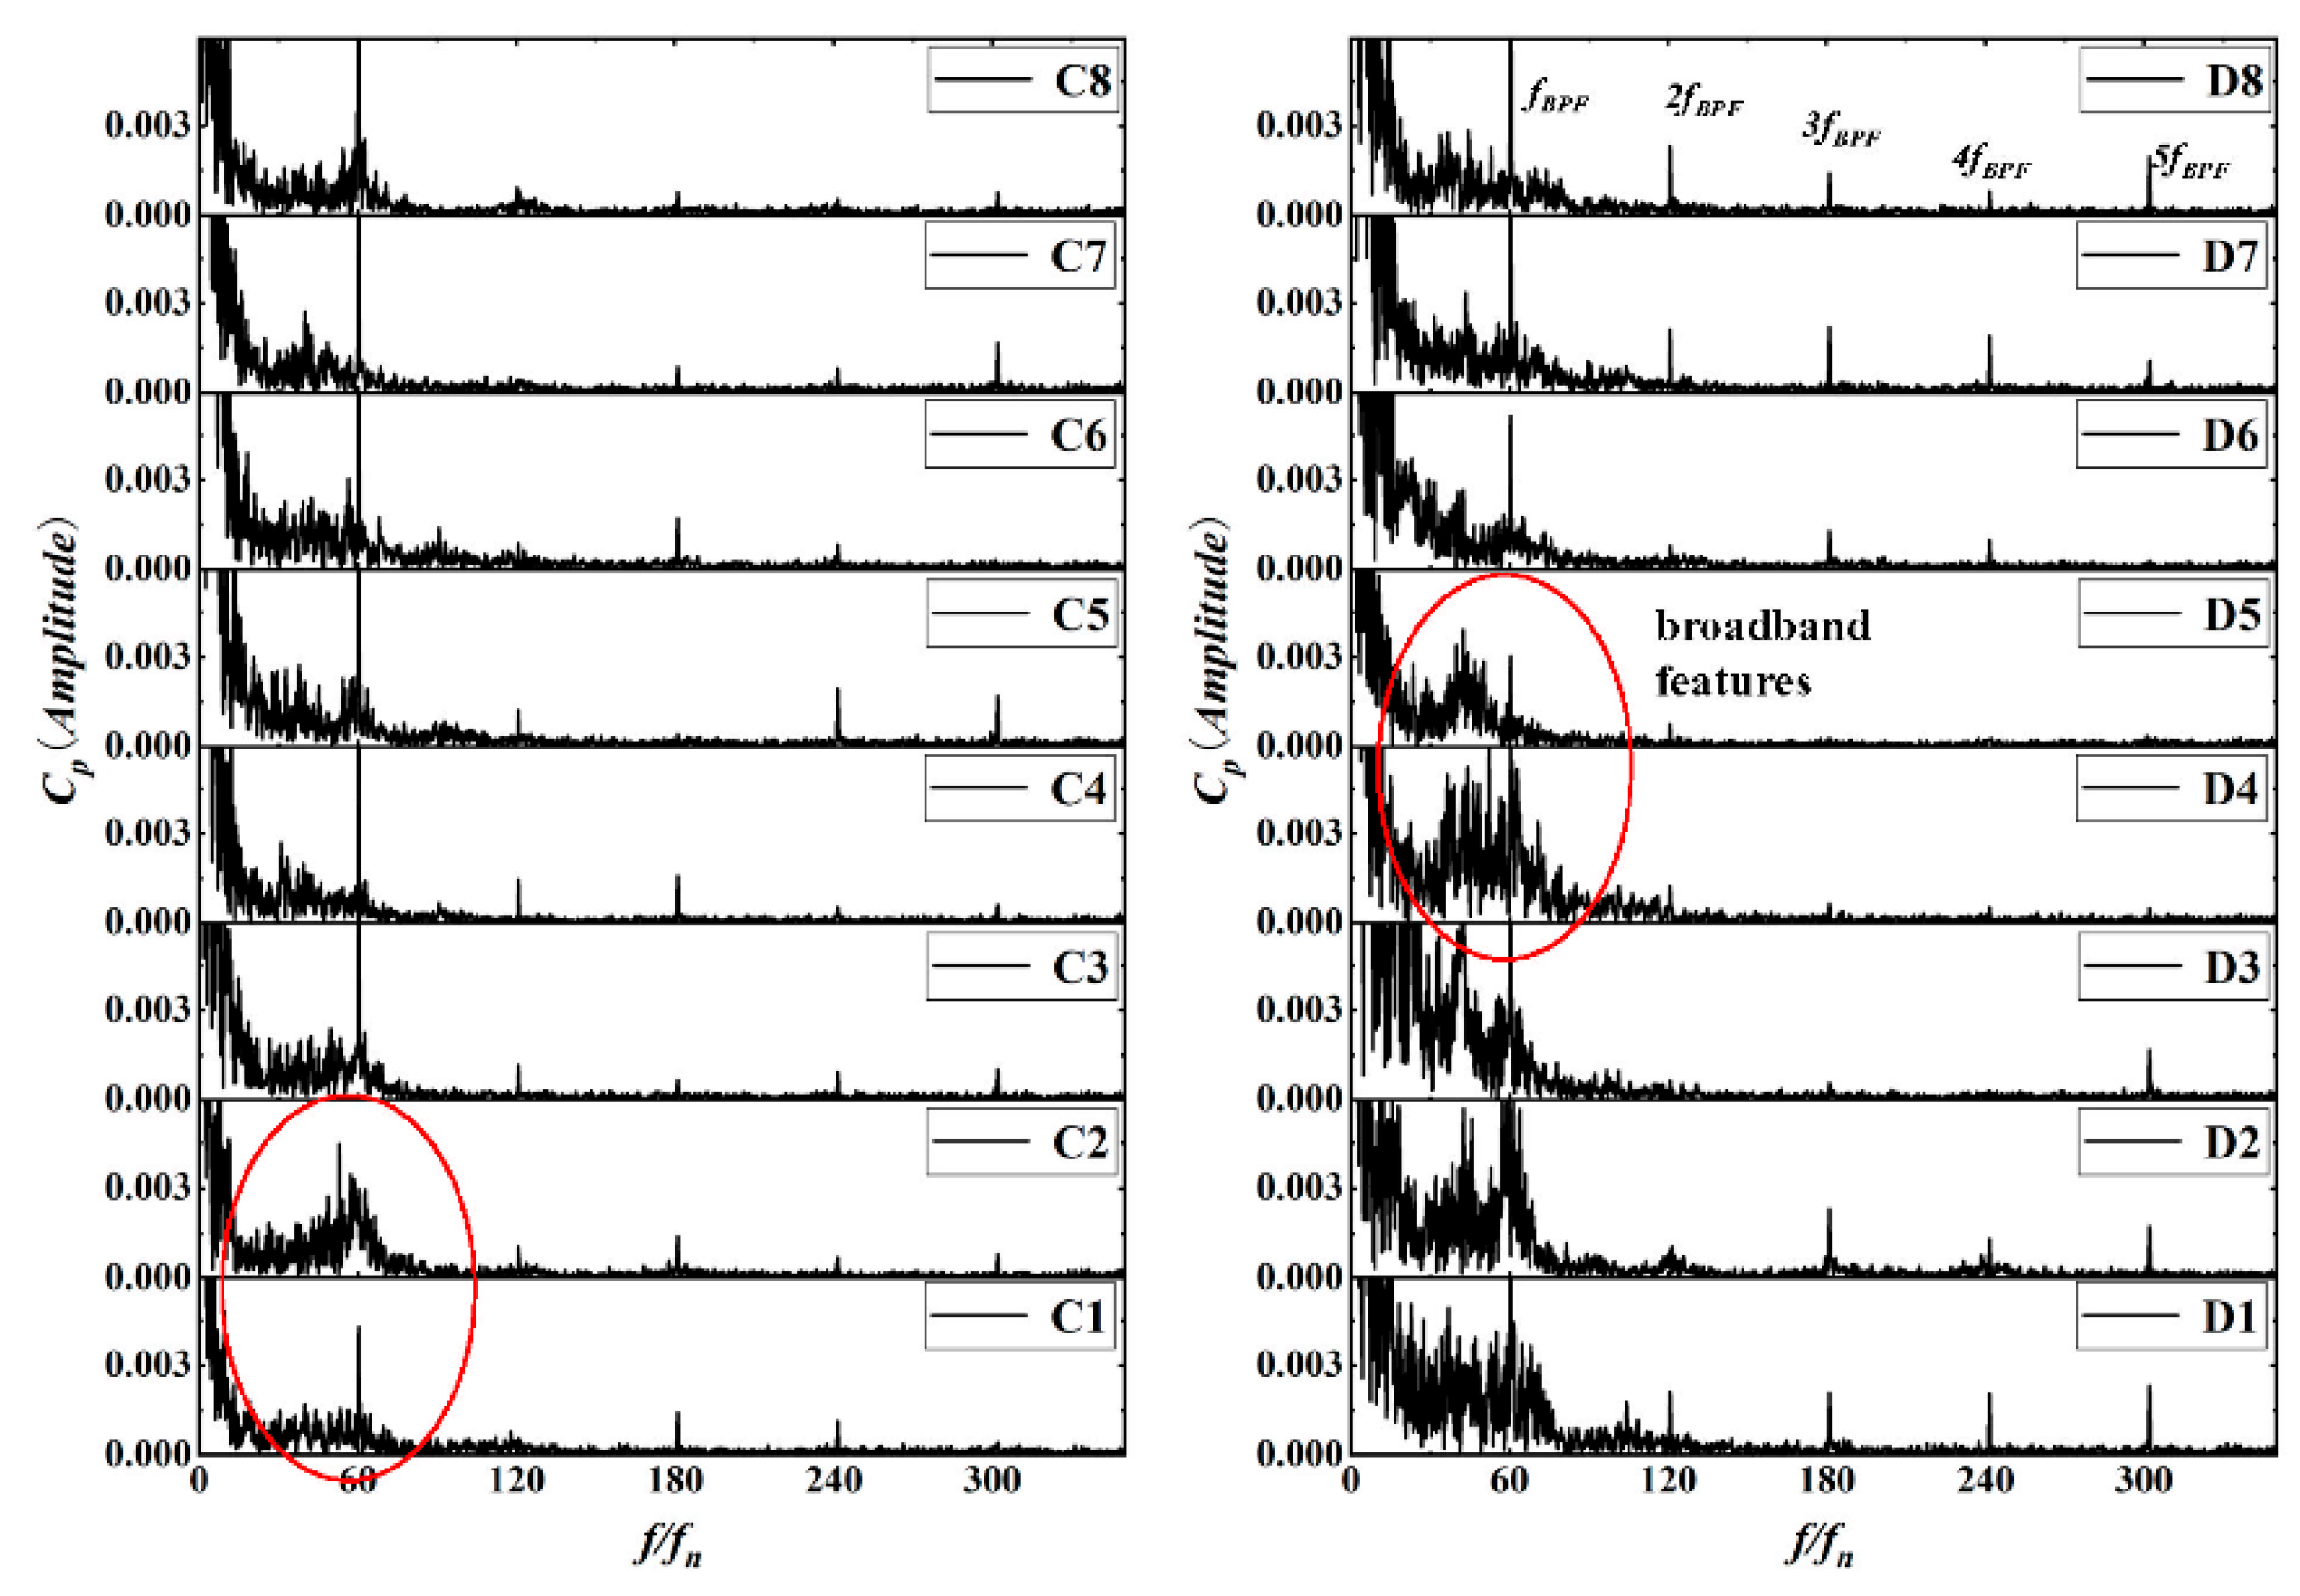
Figure 16 illustrates the pressure pulsation frequency spectrum at the outlet under inlet condition 1. The central peak values of pressure pulsations at different monitoring points are all observed at the blade-passing frequency (f
BPF), though the amplitude varies significantly. Under inlet condition 1, a broad-frequency signal is evident in the low-frequency range and near the blade-passing frequency. The rotor–stator interaction is characterized by peak pressure pulsation energy at the blade-passing frequency and its harmonics. The spectrum reveals that the blade-passing frequency dominates the pressure pulsation spectrum at the impeller outlet, contributing the most energy and exhibiting a higher amplitude compared to its harmonics. The development of complex flow structures appears to suppress the rotor–stator interaction, as indicated by the broad-frequency characteristics and reduced amplitude of the blade-passing frequency in the frequency-domain plot.
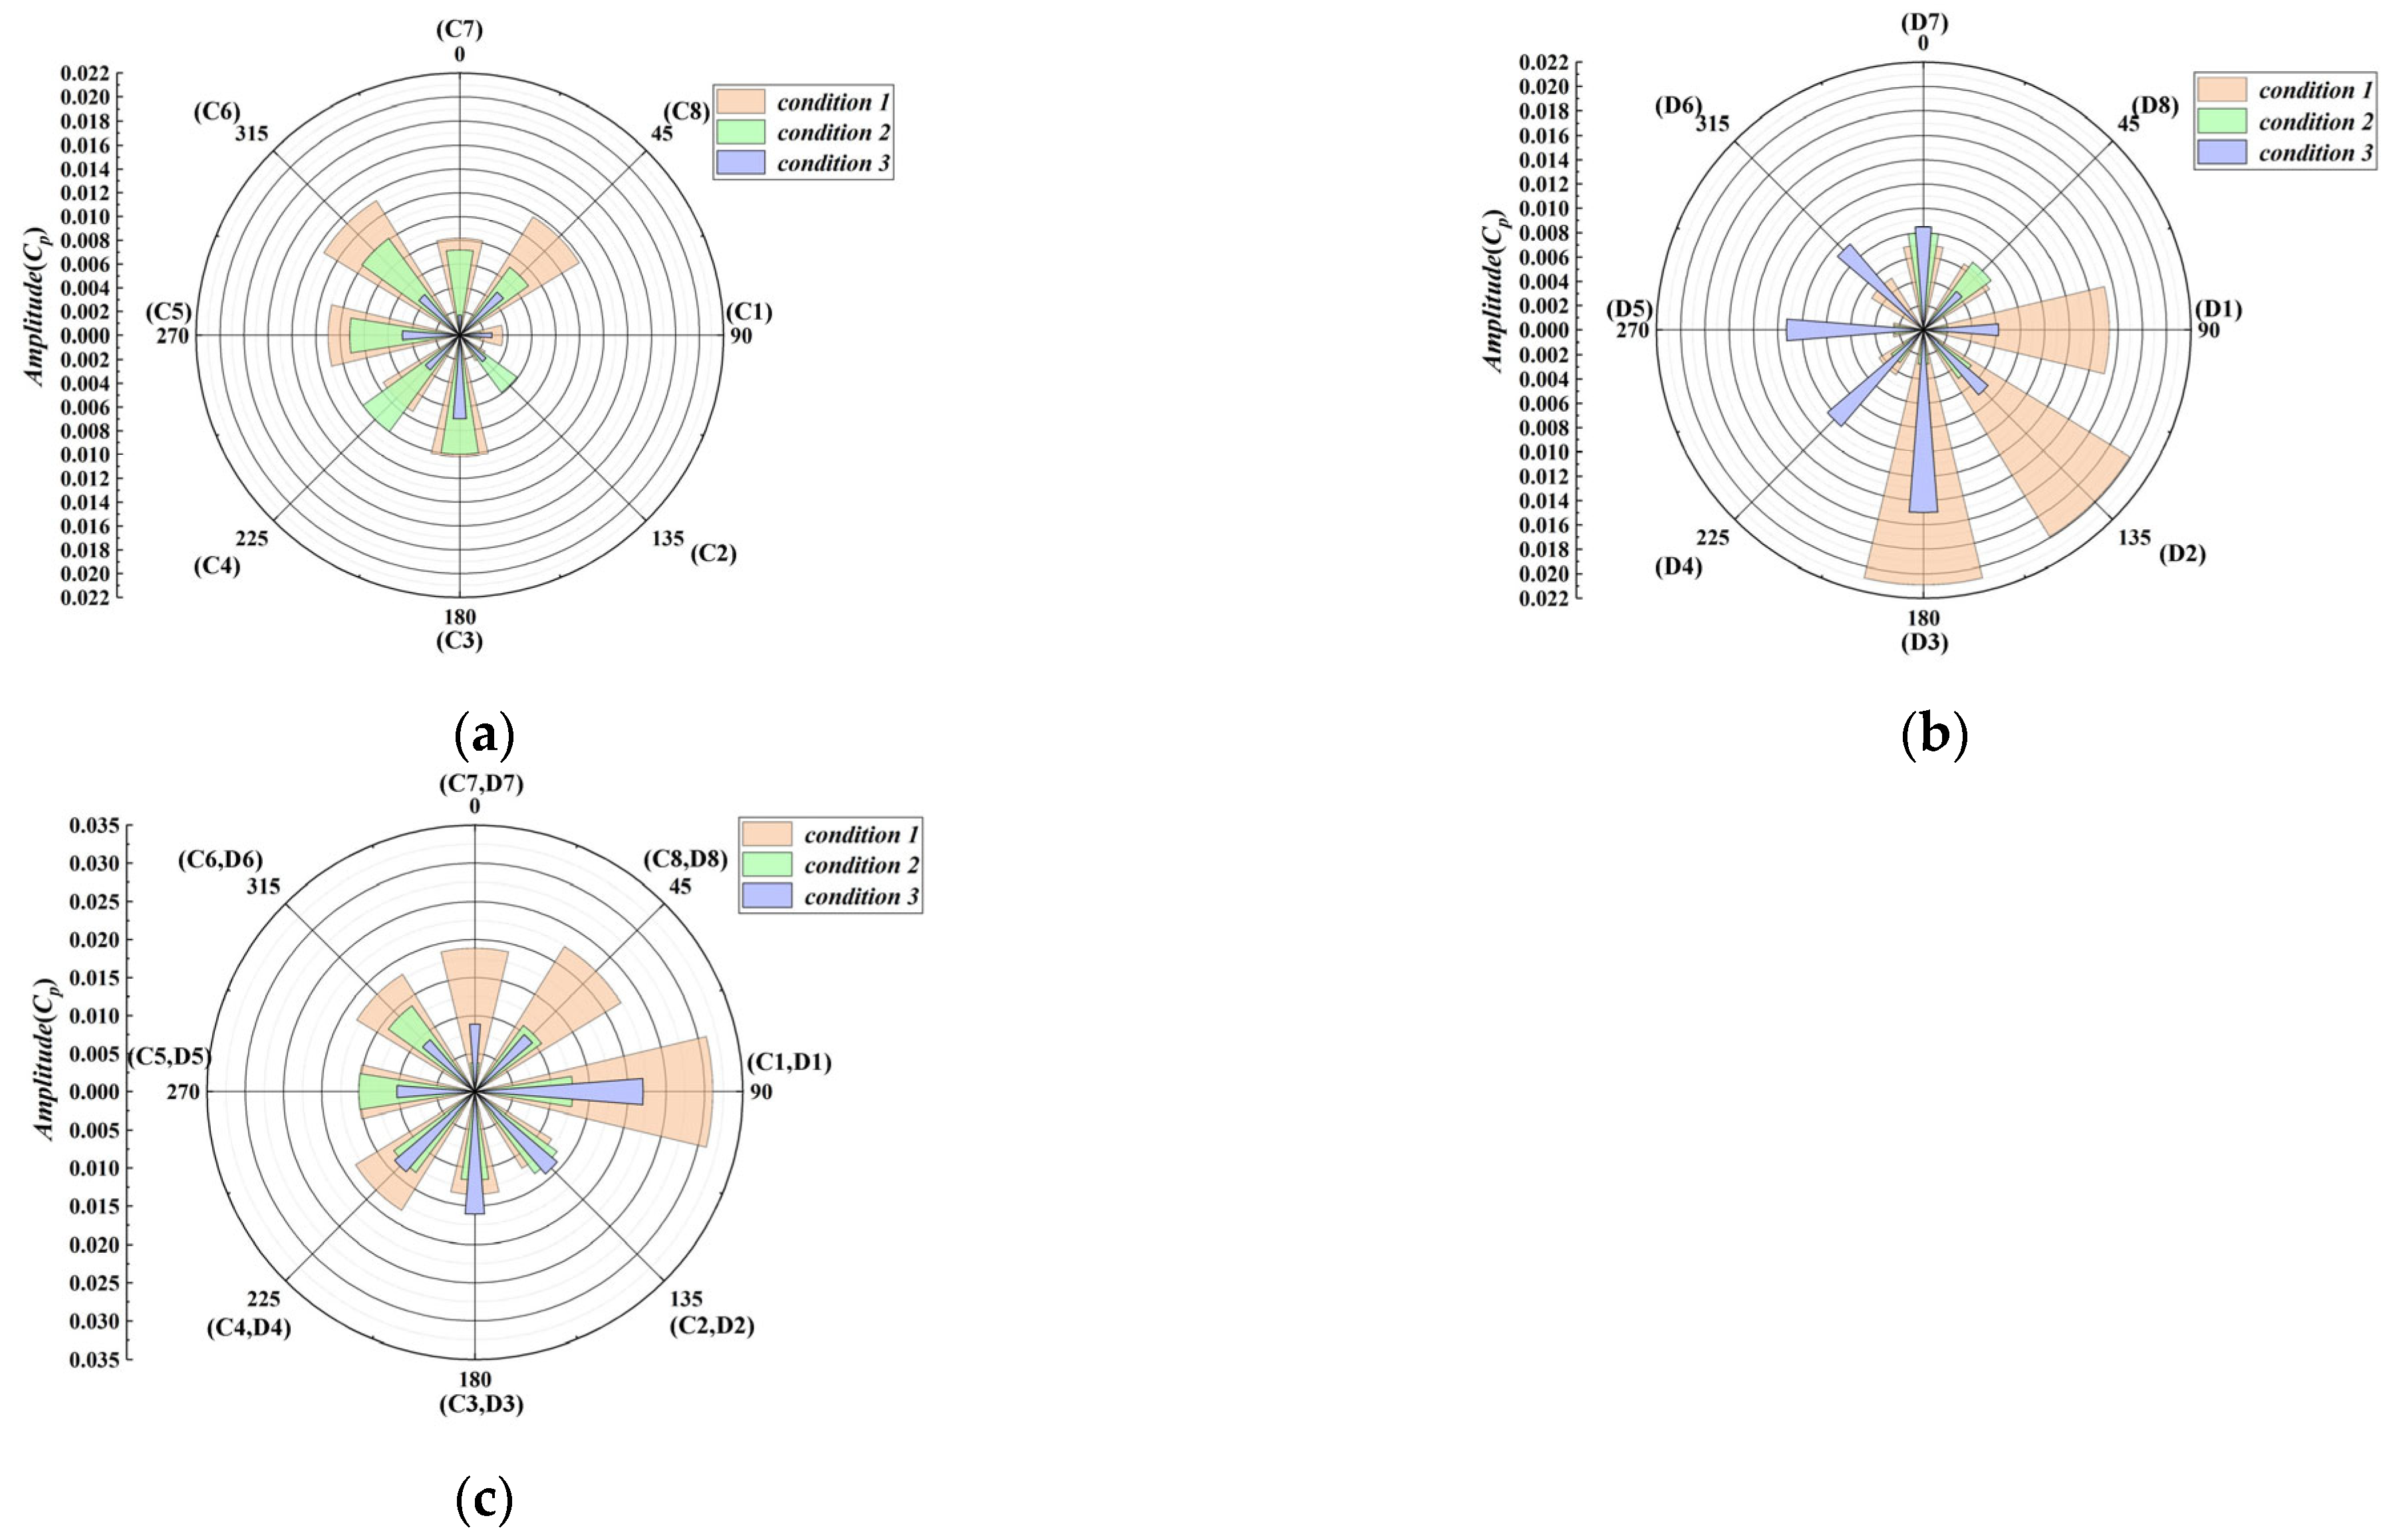
Figure 17a,b illustrate the distribution of blade-passing frequency amplitude for pressure pulsations at various circumferential monitoring points at the impeller outlet. The superimposed amplitudes of the wide and narrow impellers at corresponding section monitoring points are shown in
Figure 17c. Under inlet condition 1, the minimum superimposed BPF amplitude is 0.0018, while under inlet condition 2, it is 0.0038. For inlet condition 3, the minimum superimposed BPF amplitude reaches 0.009.
Under inlet condition 1, the internal flow within the impeller is notably complex, leading to the highest amplitude of low-frequency broadband pulsations. This complex flow significantly reduces the BPF amplitude. Specifically, under this condition, the minimum BPF amplitude for the wide impeller is observed at monitoring point C2 (the fourth section), while for the narrow impeller, it is at monitoring point D5 (the seventh section). Under inlet condition 2, the minimum BPF amplitude for the wide impeller is at monitoring point C1 (the third section), and for the narrow impeller, it is at monitoring point D1 (the third section). For inlet condition 3, the minimum BPF amplitude for the wide impeller is recorded at monitoring point C7 (the first section), whereas for the narrow impeller, it is at monitoring point D8 (the second section).
3.4. Correlation Between Flow Structures and Pressure Pulsation
To investigate the relationship between pressure pulsation signals and unsteady flow structures within the fan, vortex structures in the impeller are identified using the Q-criterion. Developed by Hunt et al., the Q-criterion highlights areas of the flow field where the second invariant of the velocity gradient tensor reveals vortex structures. This criterion is expressed as follows:
where A and B represent the symmetric and anti-symmetric matrices, respectively. || ||
F denotes the Frobenius norm of the matrix.
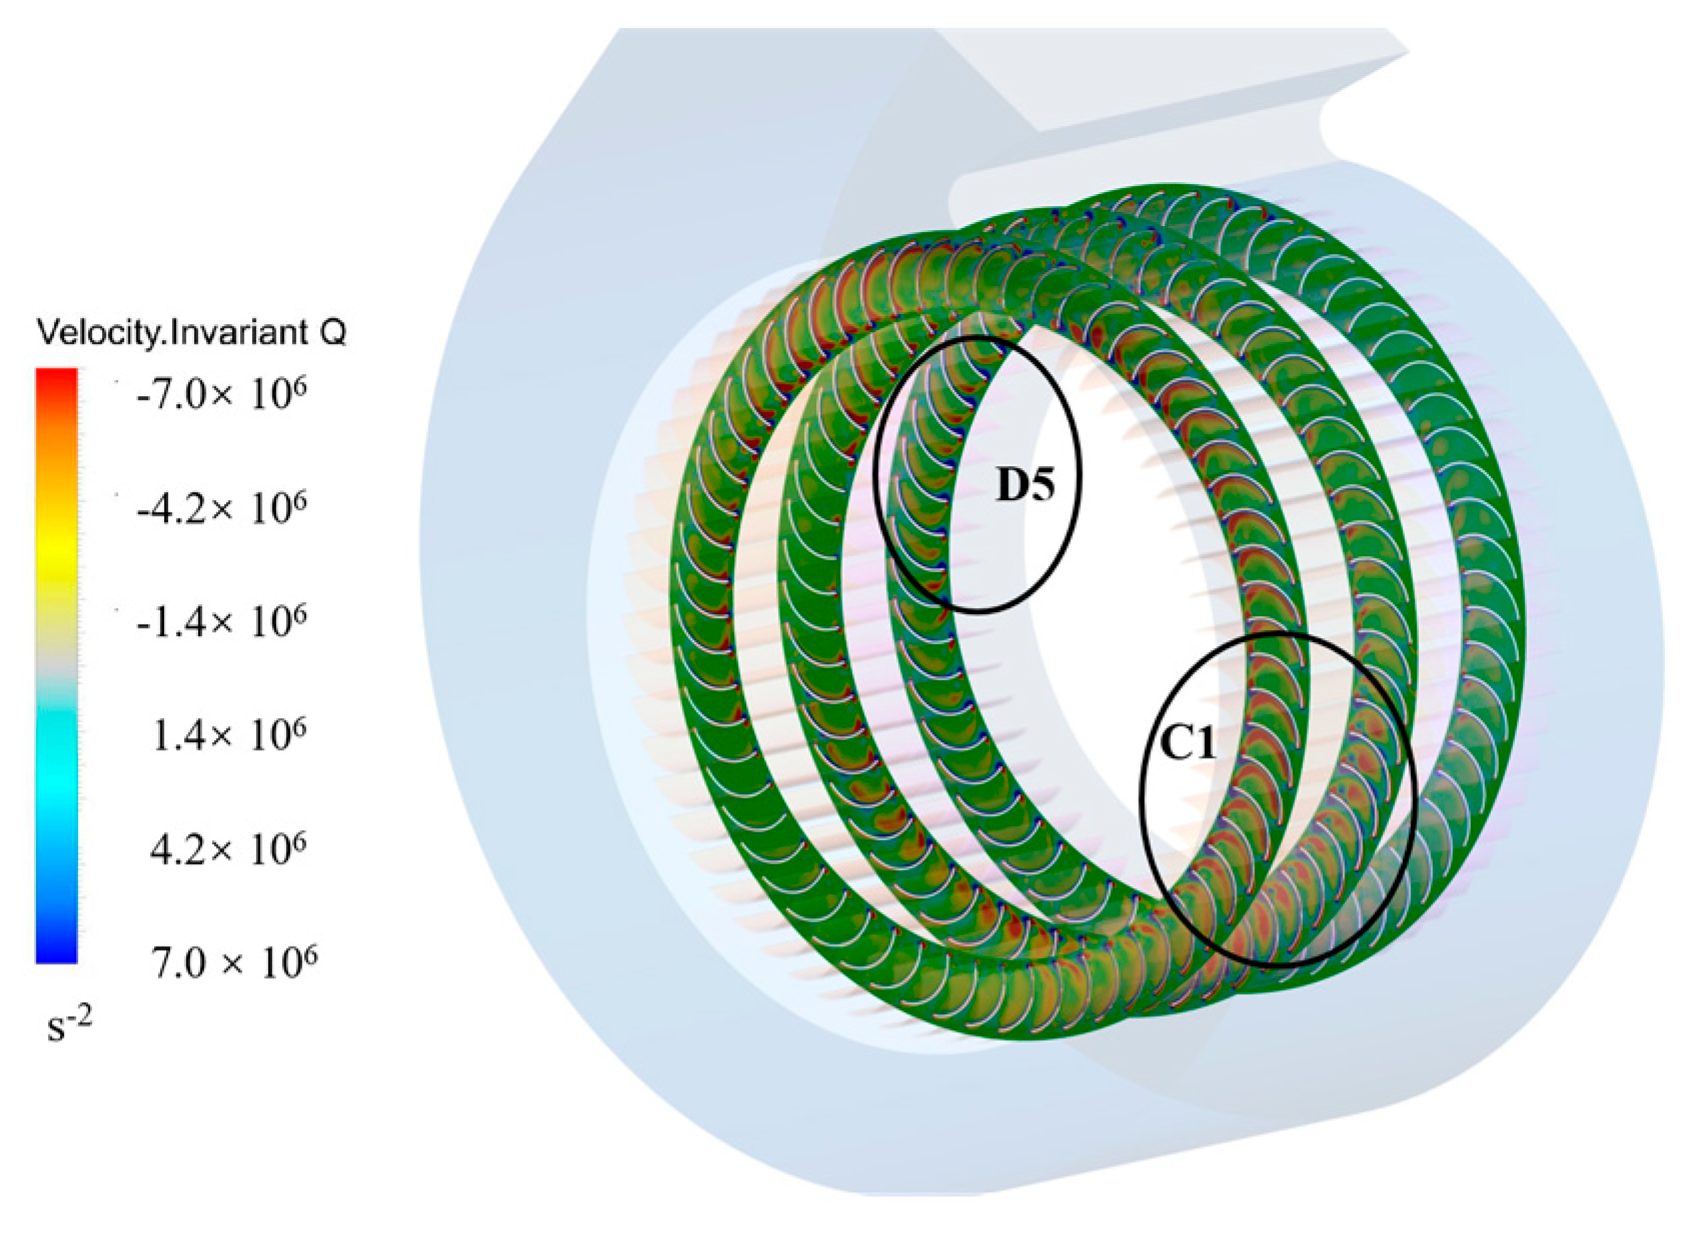
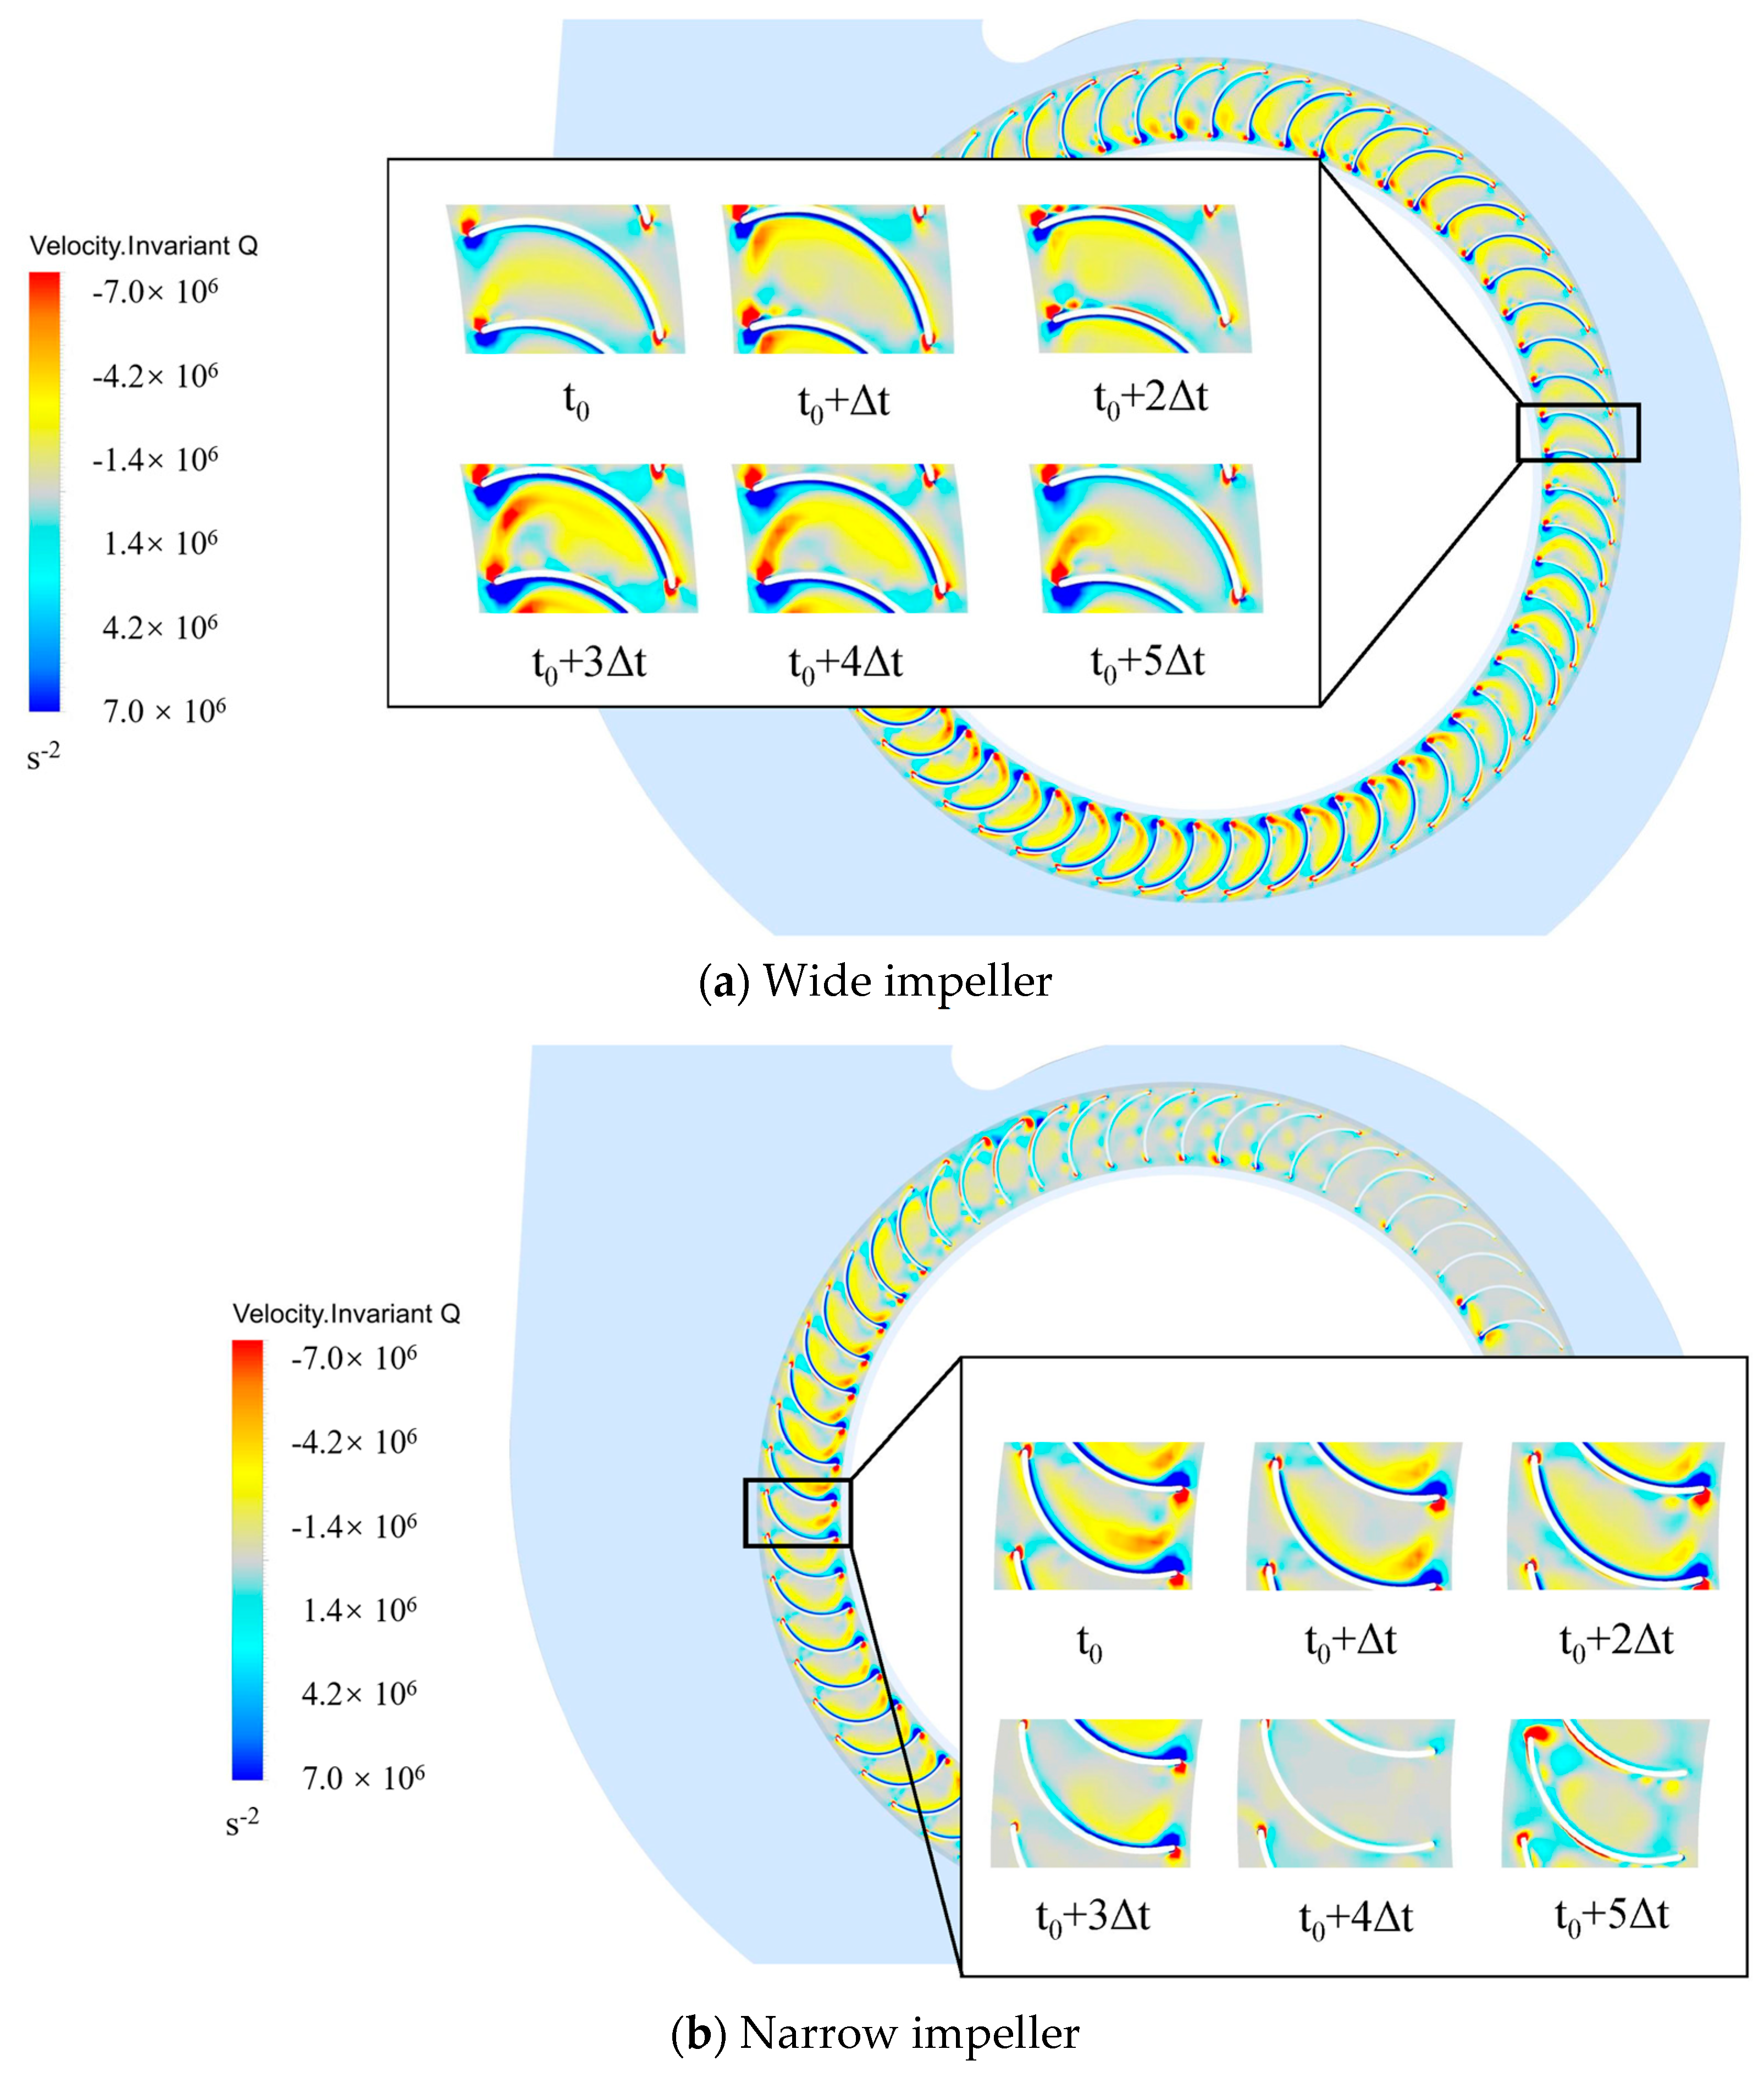
Figure 18 shows that complex transient structures with high vortices appear near monitoring point C1 for the wide impeller section and near monitoring point D5 for the narrow impeller section. These two points correspond to the locations with the minimum amplitude of pressure pulsations at the blade-passing frequency (BPF). The reason for this is the inhibitory effect of the evolution of complex vortices on aerodynamic interference. The time interval Δt in the subsequent analysis is set to 0.0083 s (60°) to analyze the evolution process of internal impeller vortex structures within one rotation cycle.
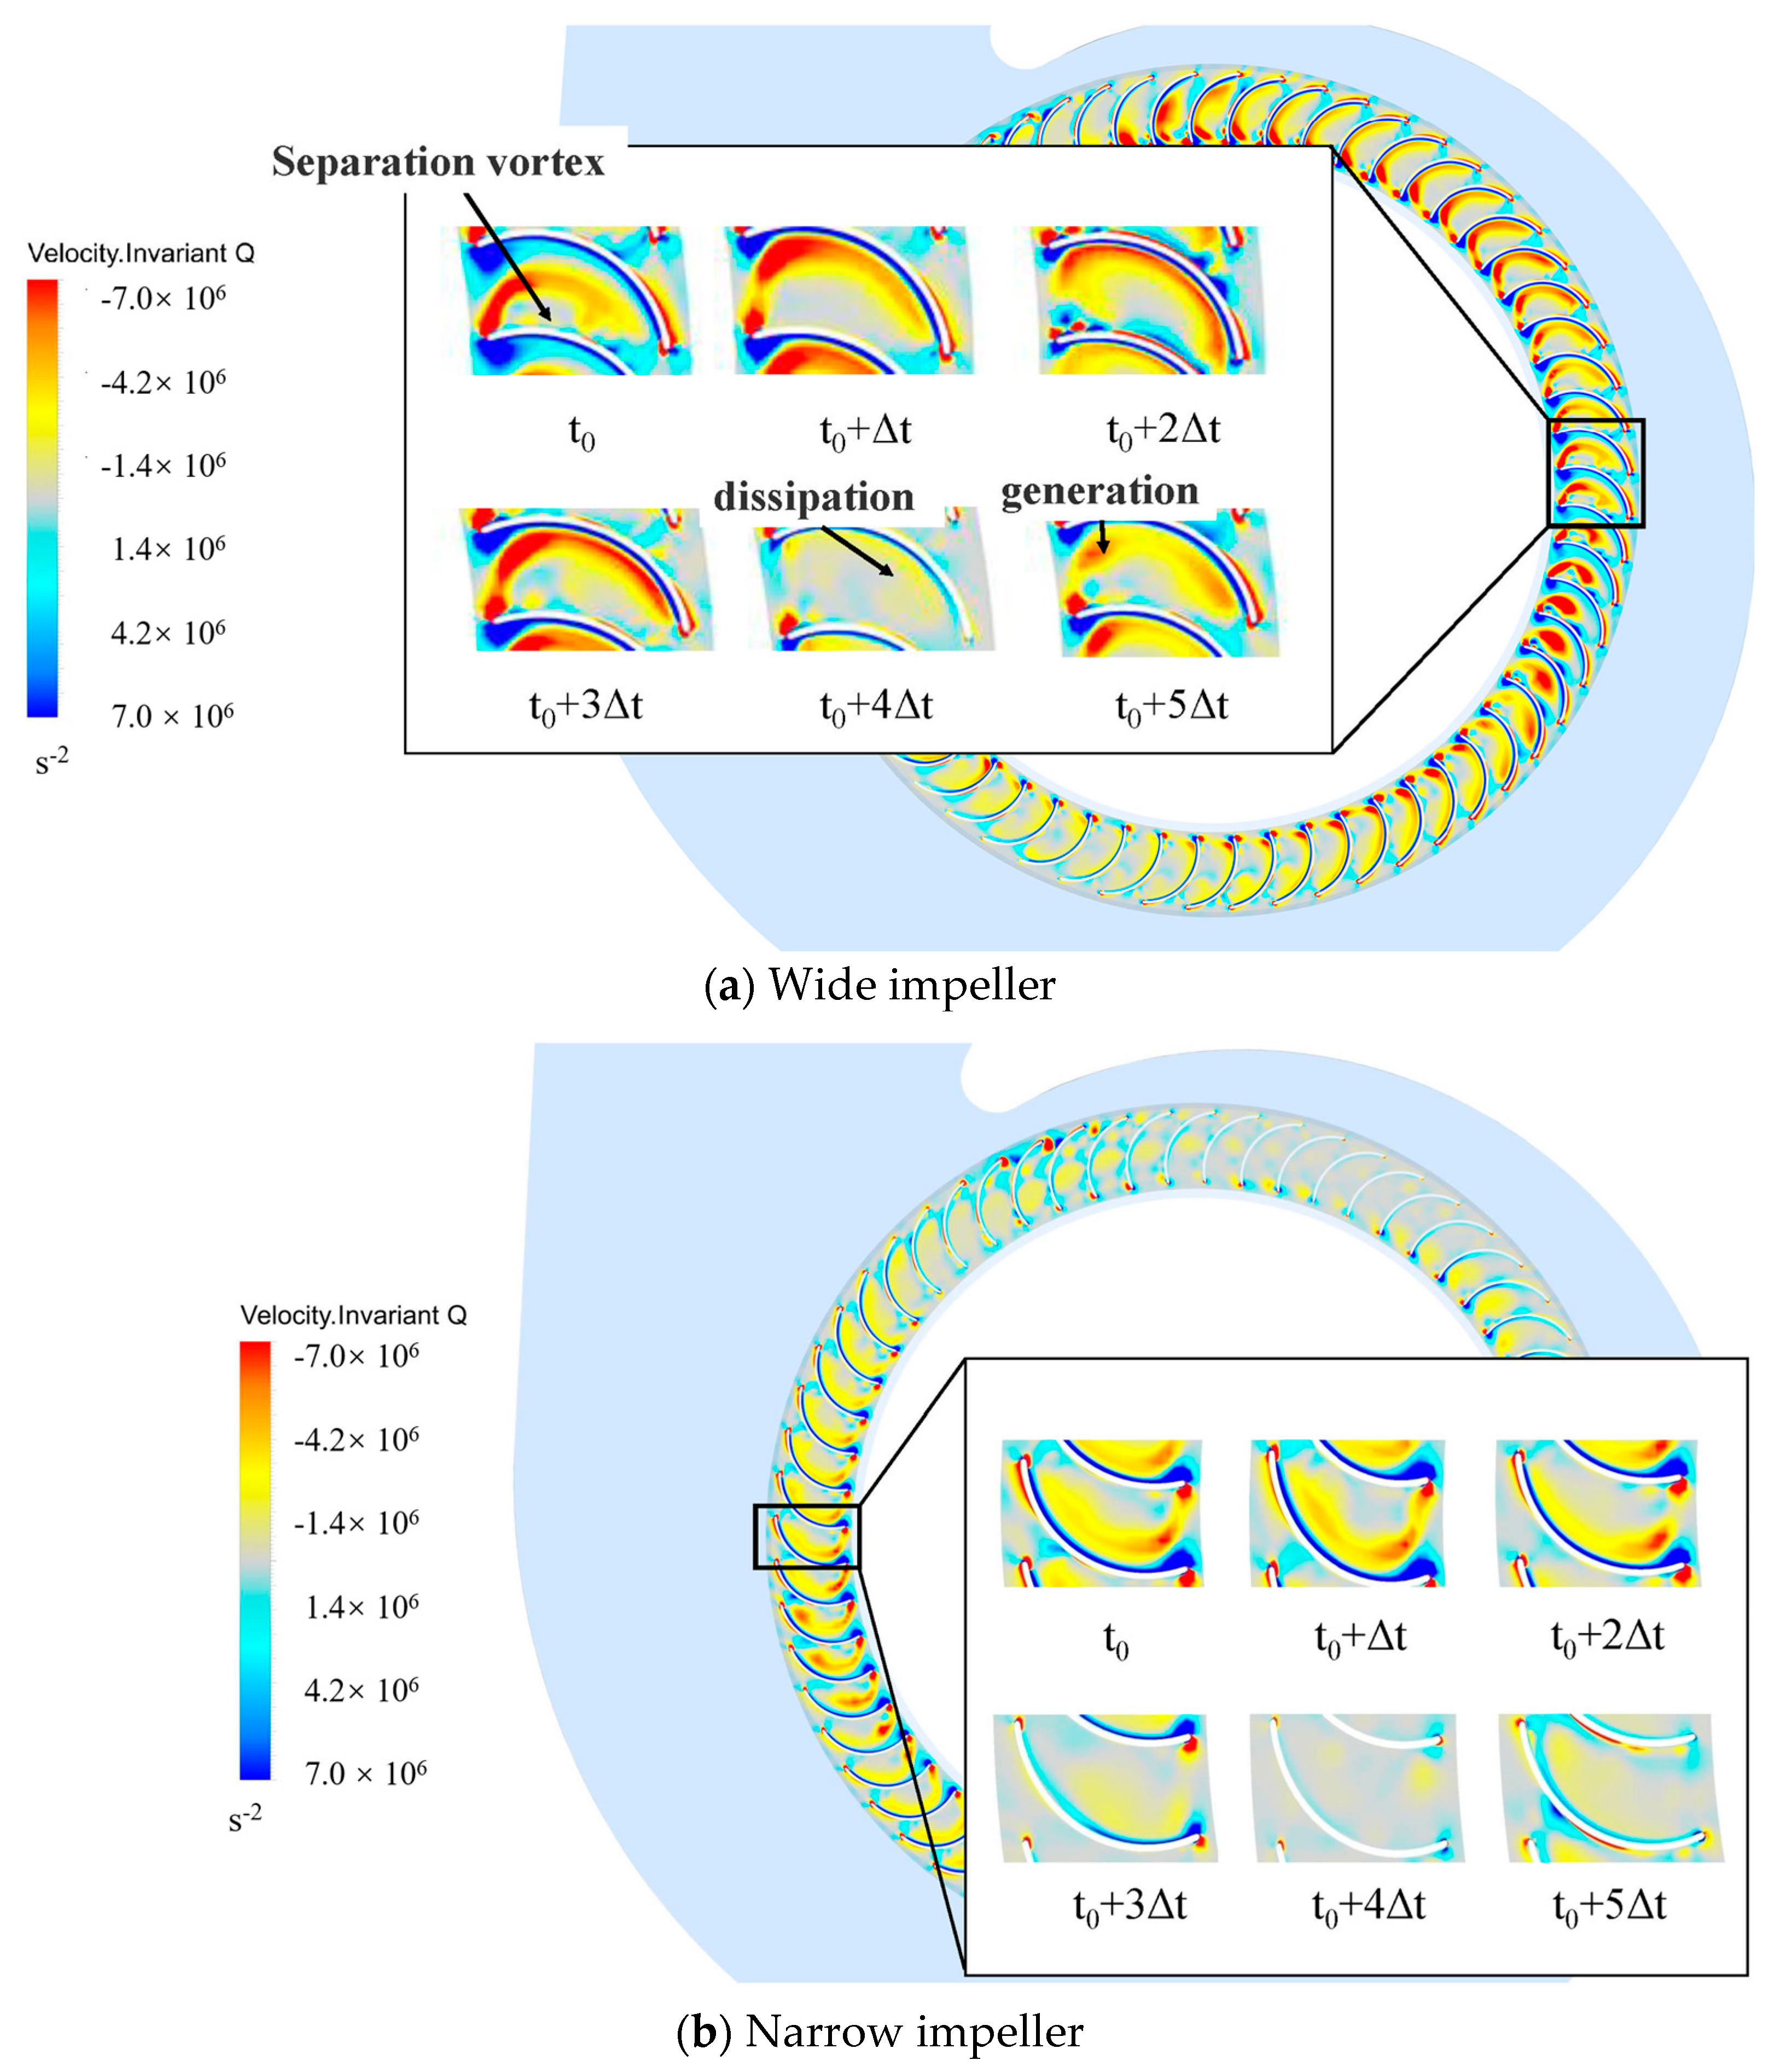
Figure 19 illustrates that the high-vortex region near monitoring point C1 on the wide impeller originates from the blade’s leading edge. The forward blade design positions negative vortices near the pressure side, while positive vortices emerge from the leading edge and merge with negative vortices near the pressure side of the adjacent blade. This interaction results in the shedding of large-scale vortices on the pressure side, while smaller-scale separation vortices predominantly shed on the suction side. At time t
0, the large-scale vortices peak in intensity, nearly filling the entire impeller passage. By time t0 + Δt, these vortices impact the pressure side, breaking up and dissipating within the passage. At time t0 + 5Δt, regeneration of the large-scale vortices begins. Throughout this cycle, the intensity of the smaller separation vortices remains largely unaffected, which primarily influences the amplitude of the blade-passing frequency (BPF) due to the large-scale vortices. In contrast, near monitoring point D5 on the narrow impeller, the transient vortex structure lacks smaller separation vortices. Only a pair of large-scale vortices is observed, with weaker vortex energy and a reduced impact on the BPF signal.
In
Figure 20, under inlet condition 2, the overall vortex strength is significantly reduced compared to inlet condition 1. The vortex structure within the wide blade passage shifts from a striped pattern to a predominantly clustered formation. Throughout a single rotation cycle, the vortex originates from the leading edge at time t
0 and gradually fragments as it progresses towards the trailing edge, eventually forming an isolated positive vortex cluster that persists within the passage. By time t0 + 4Δt, the strength of this vortex cluster reaches its minimum before regenerating from the leading edge in the next time step. In contrast, the transient vortex structure within the narrow blade passage maintains its striped pattern, as the high-energy vortex clusters generated at the leading edge do not undergo fragmentation.
Figure 21 demonstrates that under inlet condition 3, vortex shedding within both the wide and narrow blade passages exhibits a striped pattern. The vortex structures maintain consistent strength and distribution throughout the passages, both spatially and temporally. This inlet condition achieves an optimal internal flow state for the impeller, characterized by a pronounced dynamic–static interference effect. Furthermore, there are no significant broad-frequency signals detected near the blade-passing frequency.
Under non-uniform inlet conditions, the flow at the impeller inlet is complex, featuring significant variations in both velocity and direction. These fluctuations result in unbalanced aerodynamic forces acting on the blades during rotation, leading to pressure fluctuations at the impeller outlet. For instance, when the left inlet serves as the primary air source, the left blades experience greater impact forces during rotation, which causes more pronounced pressure fluctuations on the left side of the impeller outlet. This observation aligns with the higher amplitude of low-frequency and broadband fluctuations noted near the monitoring points on the left side, as illustrated in
Figure 19,
Figure 20 and
Figure 21. The asymmetric vortex structures also influence the pressure distribution. As demonstrated in
Figure 21, the vortex structures within both the wide and narrow impellers display a striped distribution. The consistent strength and arrangement of these vortices contribute to relatively stable pressure fluctuations at the impeller outlet, characterized by a smaller amplitude of the pressure coefficient.
4. Sound Quality
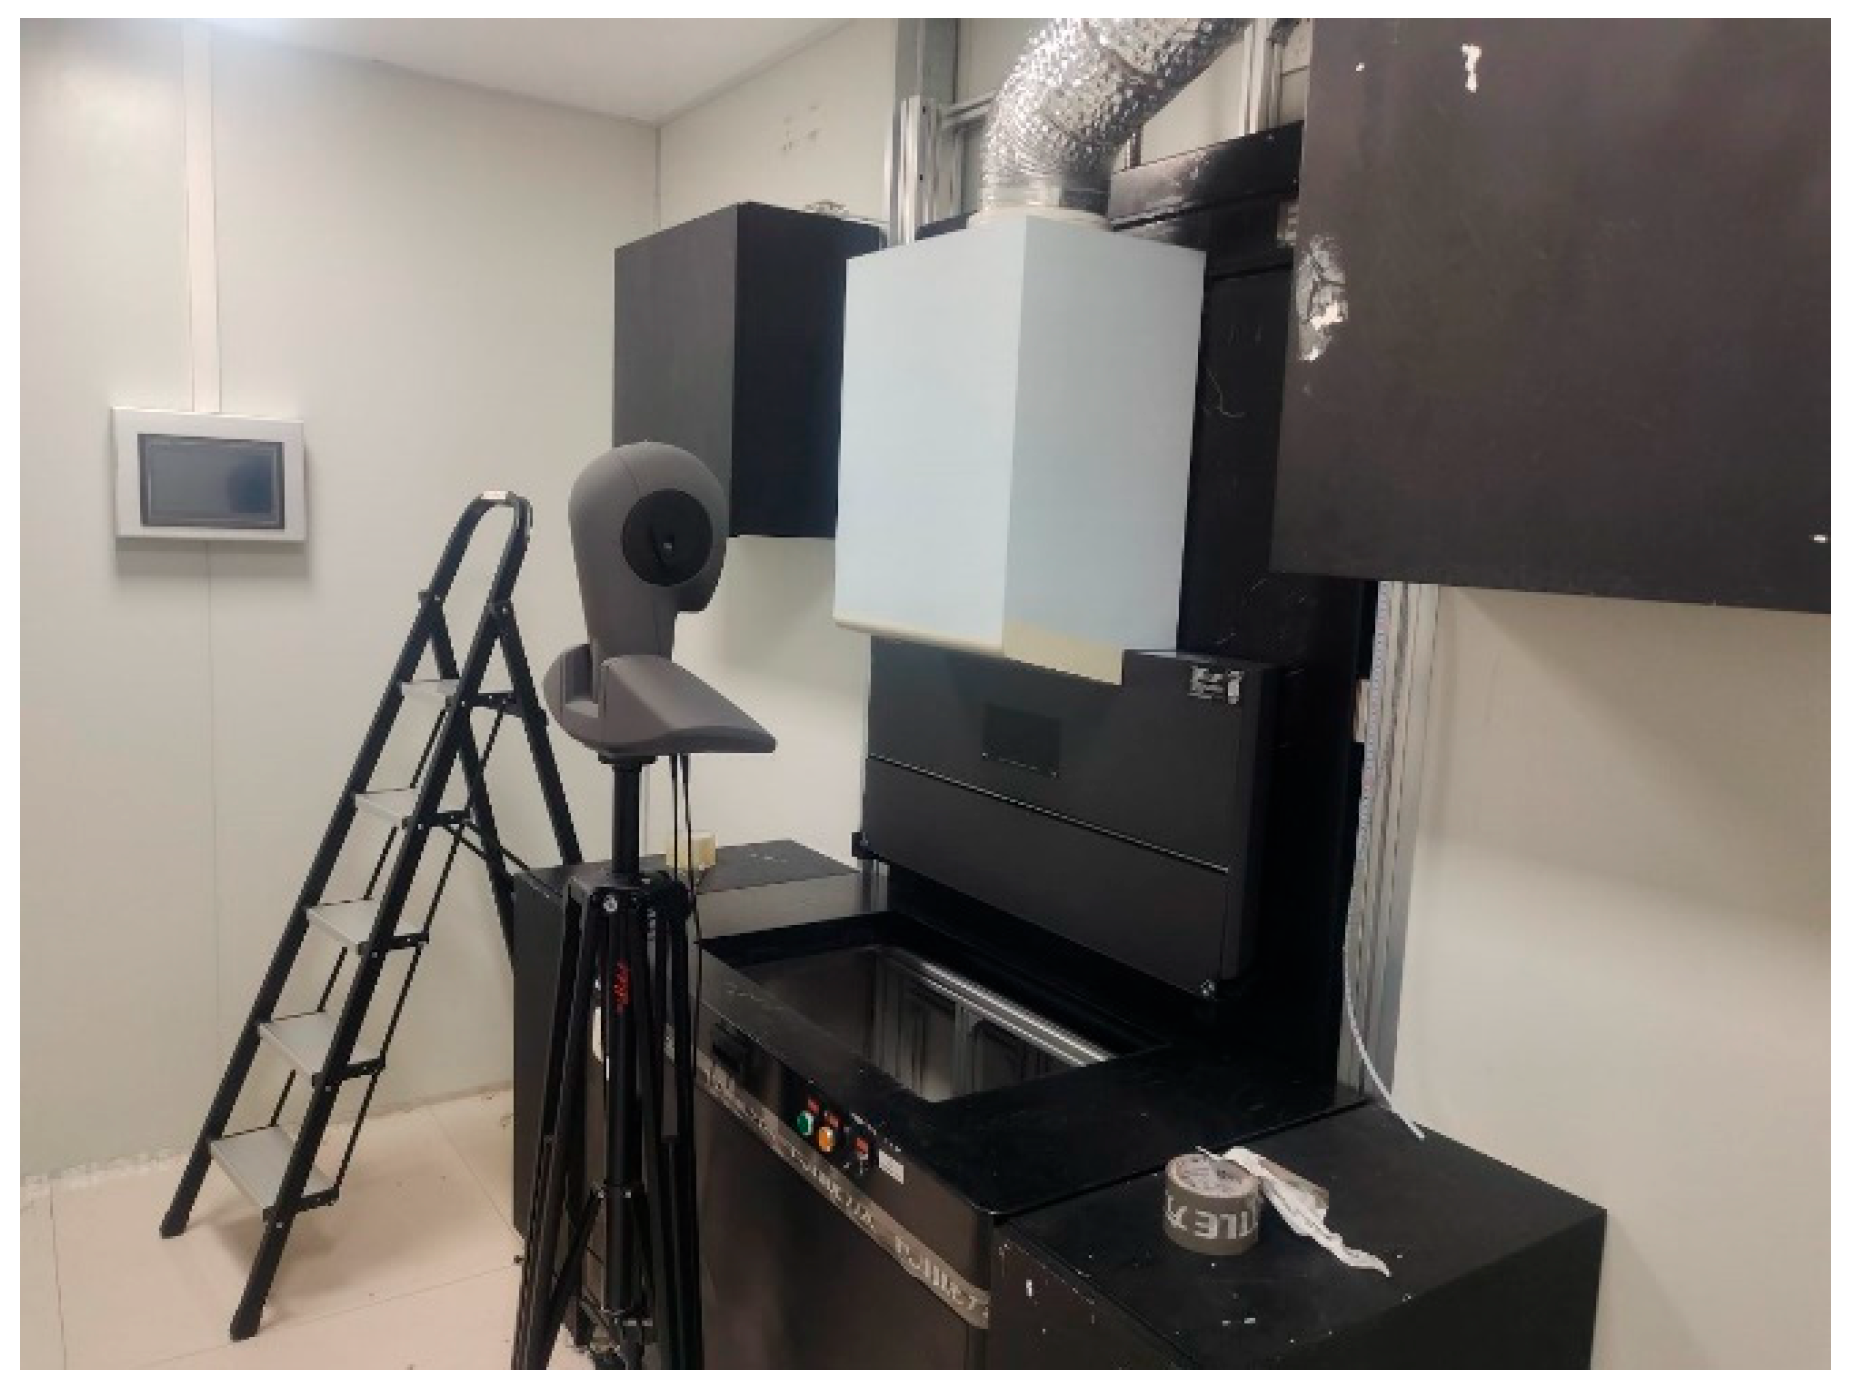
The acoustic field test was carried out in a simulated kitchen laboratory, with the experimental platform arranged as shown in
Figure 22. The kitchen floor, walls, and ceiling were constructed from smooth, reflective materials such as concrete, metal, or ceramic tiles. To reduce interference with the sound source during testing, only one operator was allowed in the lab, and they were required to avoid wearing clothing with significant sound-absorbing properties that could impact the results. To evaluate human perception of noise, dummy heads (depicted in
Figure 23) were placed at measurement points to capture data on how personnel in front of the stove perceive fan noise through the left and right ears of the artificial head.
The process of collecting sound signals and developing models involves several key steps: gathering sound samples from range hoods, objectively evaluating the samples’ parameters, subjectively assessing the samples, performing statistical analysis, and creating models. Initially, the loudness (L), sharpness (S), roughness (R), and articulation index (AI) of the range hood sound samples are measured. The method for calculating these four parameters refers primarily to the standard TCAS 341-2019 [
44], which outlines the test methods for noise and sound quality of range hoods. A selected group of participants then listens to these samples under controlled conditions to ensure accurate representation, providing subjective comfort ratings for the sound quality. A regression model is then established to correlate the objective parameters with the subjective comfort ratings, leading to a final calculation formula for sound quality comfort Q.
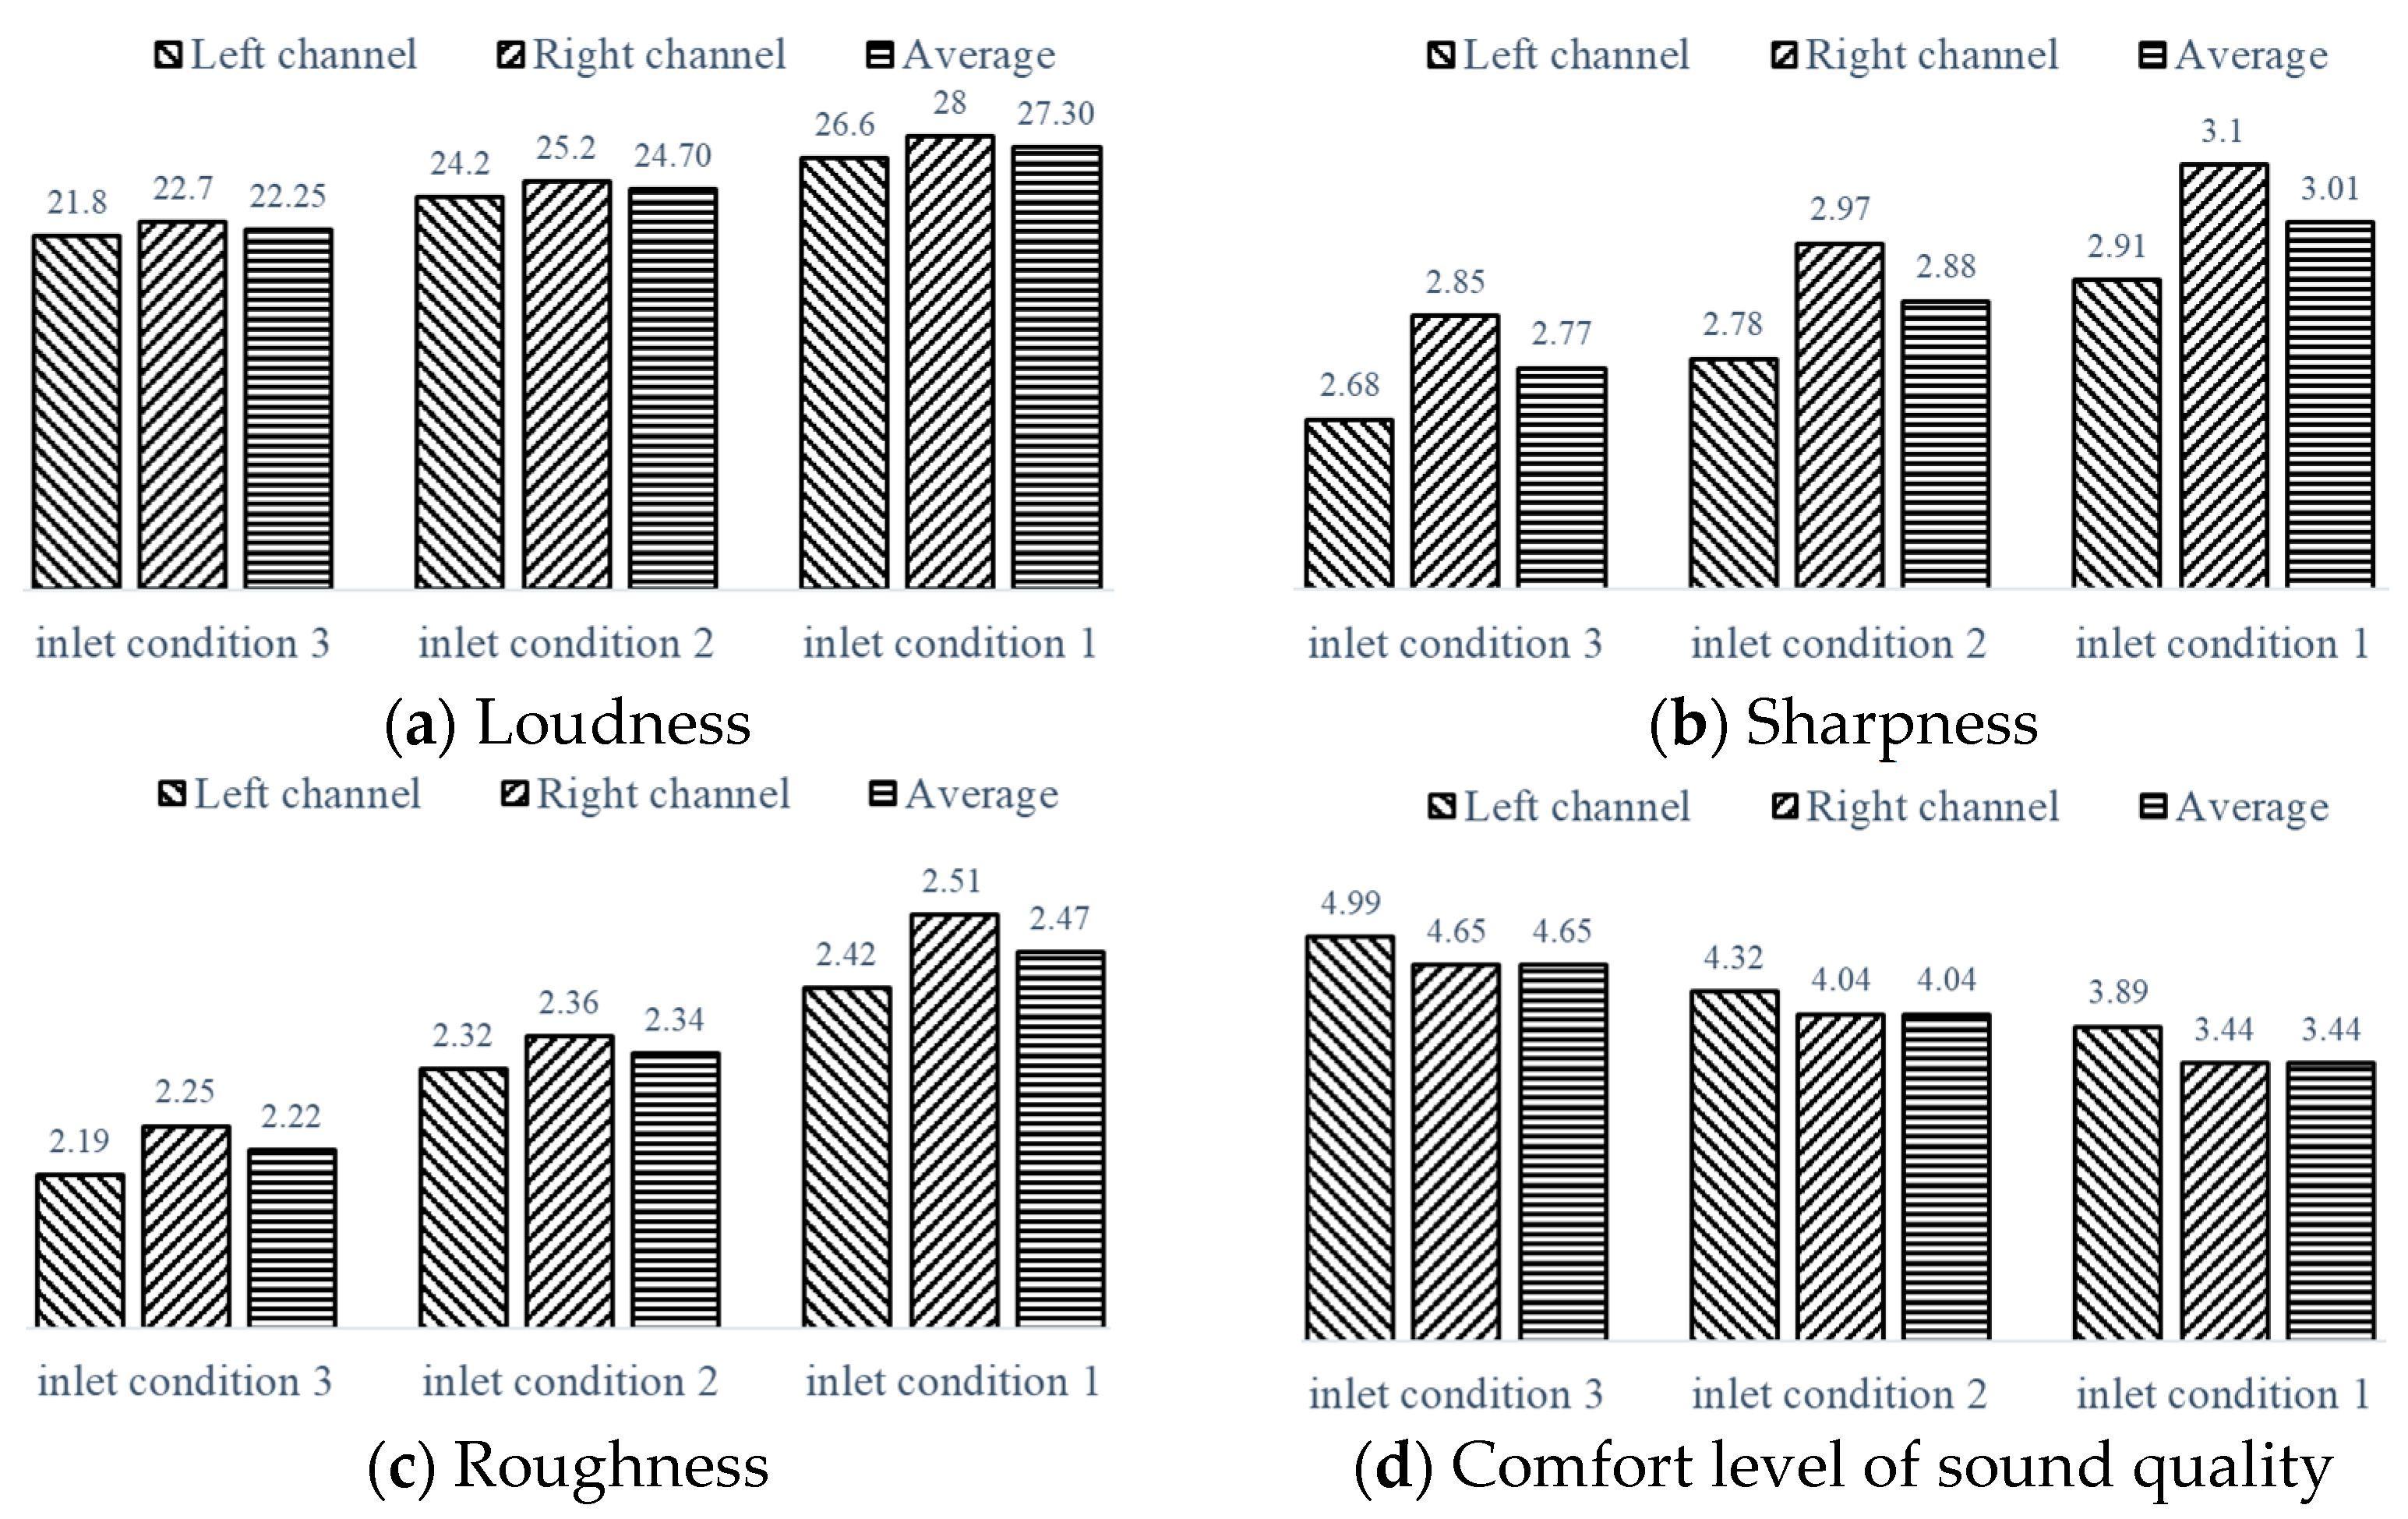
Loudness quantifies how the human ear perceives the overall volume of sound, measured in sones. For reference, the loudness of a pure 1 kHz tone at a sound pressure level of 40 dB is defined as 1 sone. The second row of
Figure 19 displays the variations in loudness over time, recorded from the left and right ears of an artificial head. The data reveal from
Figure 24 that under inlet condition 1, the left ear perceives a loudness of 26.6 sones, while the right ear perceives 28 sones. Under inlet condition 2, the average loudness decreases to 24.2 sones in the left ear and 25.2 sones in the right ear. Inlet condition 3 further reduces loudness to 21.8 sones in the left ear and 22.7 sones in the right. The highest loudness, observed under inlet condition 1, indicates that the fan’s internal noise is most intense under this condition.
Sharpness is a psychoacoustic measure that evaluates the presence of high-frequency components in sound, expressed in acum. The third row of figures shows that sharpness is highest under inlet condition 1, with values of 2.91 acum in the left ear and 3.1 acum in the right ear. This suggests a higher concentration of high-frequency signals in the sound, corresponding to the broadband pulsation signal near the mid-frequency of the pressure pulsation, and is associated with the periodic evolution of large-scale vortices in the impeller flow passage.
Sharpness of sound is a psychological measure used to assess the amount of high-frequency signal components in sound, and it is measured in acum. The data can be seen in the third row of the figures. Under inlet condition 1, the sharpness in the left and right ears is the highest, at 2.91 acum and 3.1 acum, respectively. Thus, it can be seen that under this inlet condition, the high-frequency signal in the sound is relatively high, corresponding to the wideband pulsation signal near the mid-frequency of the pressure pulsation, manifested as the periodic evolution of a pair of large-scale vortices in the impeller flow passage.
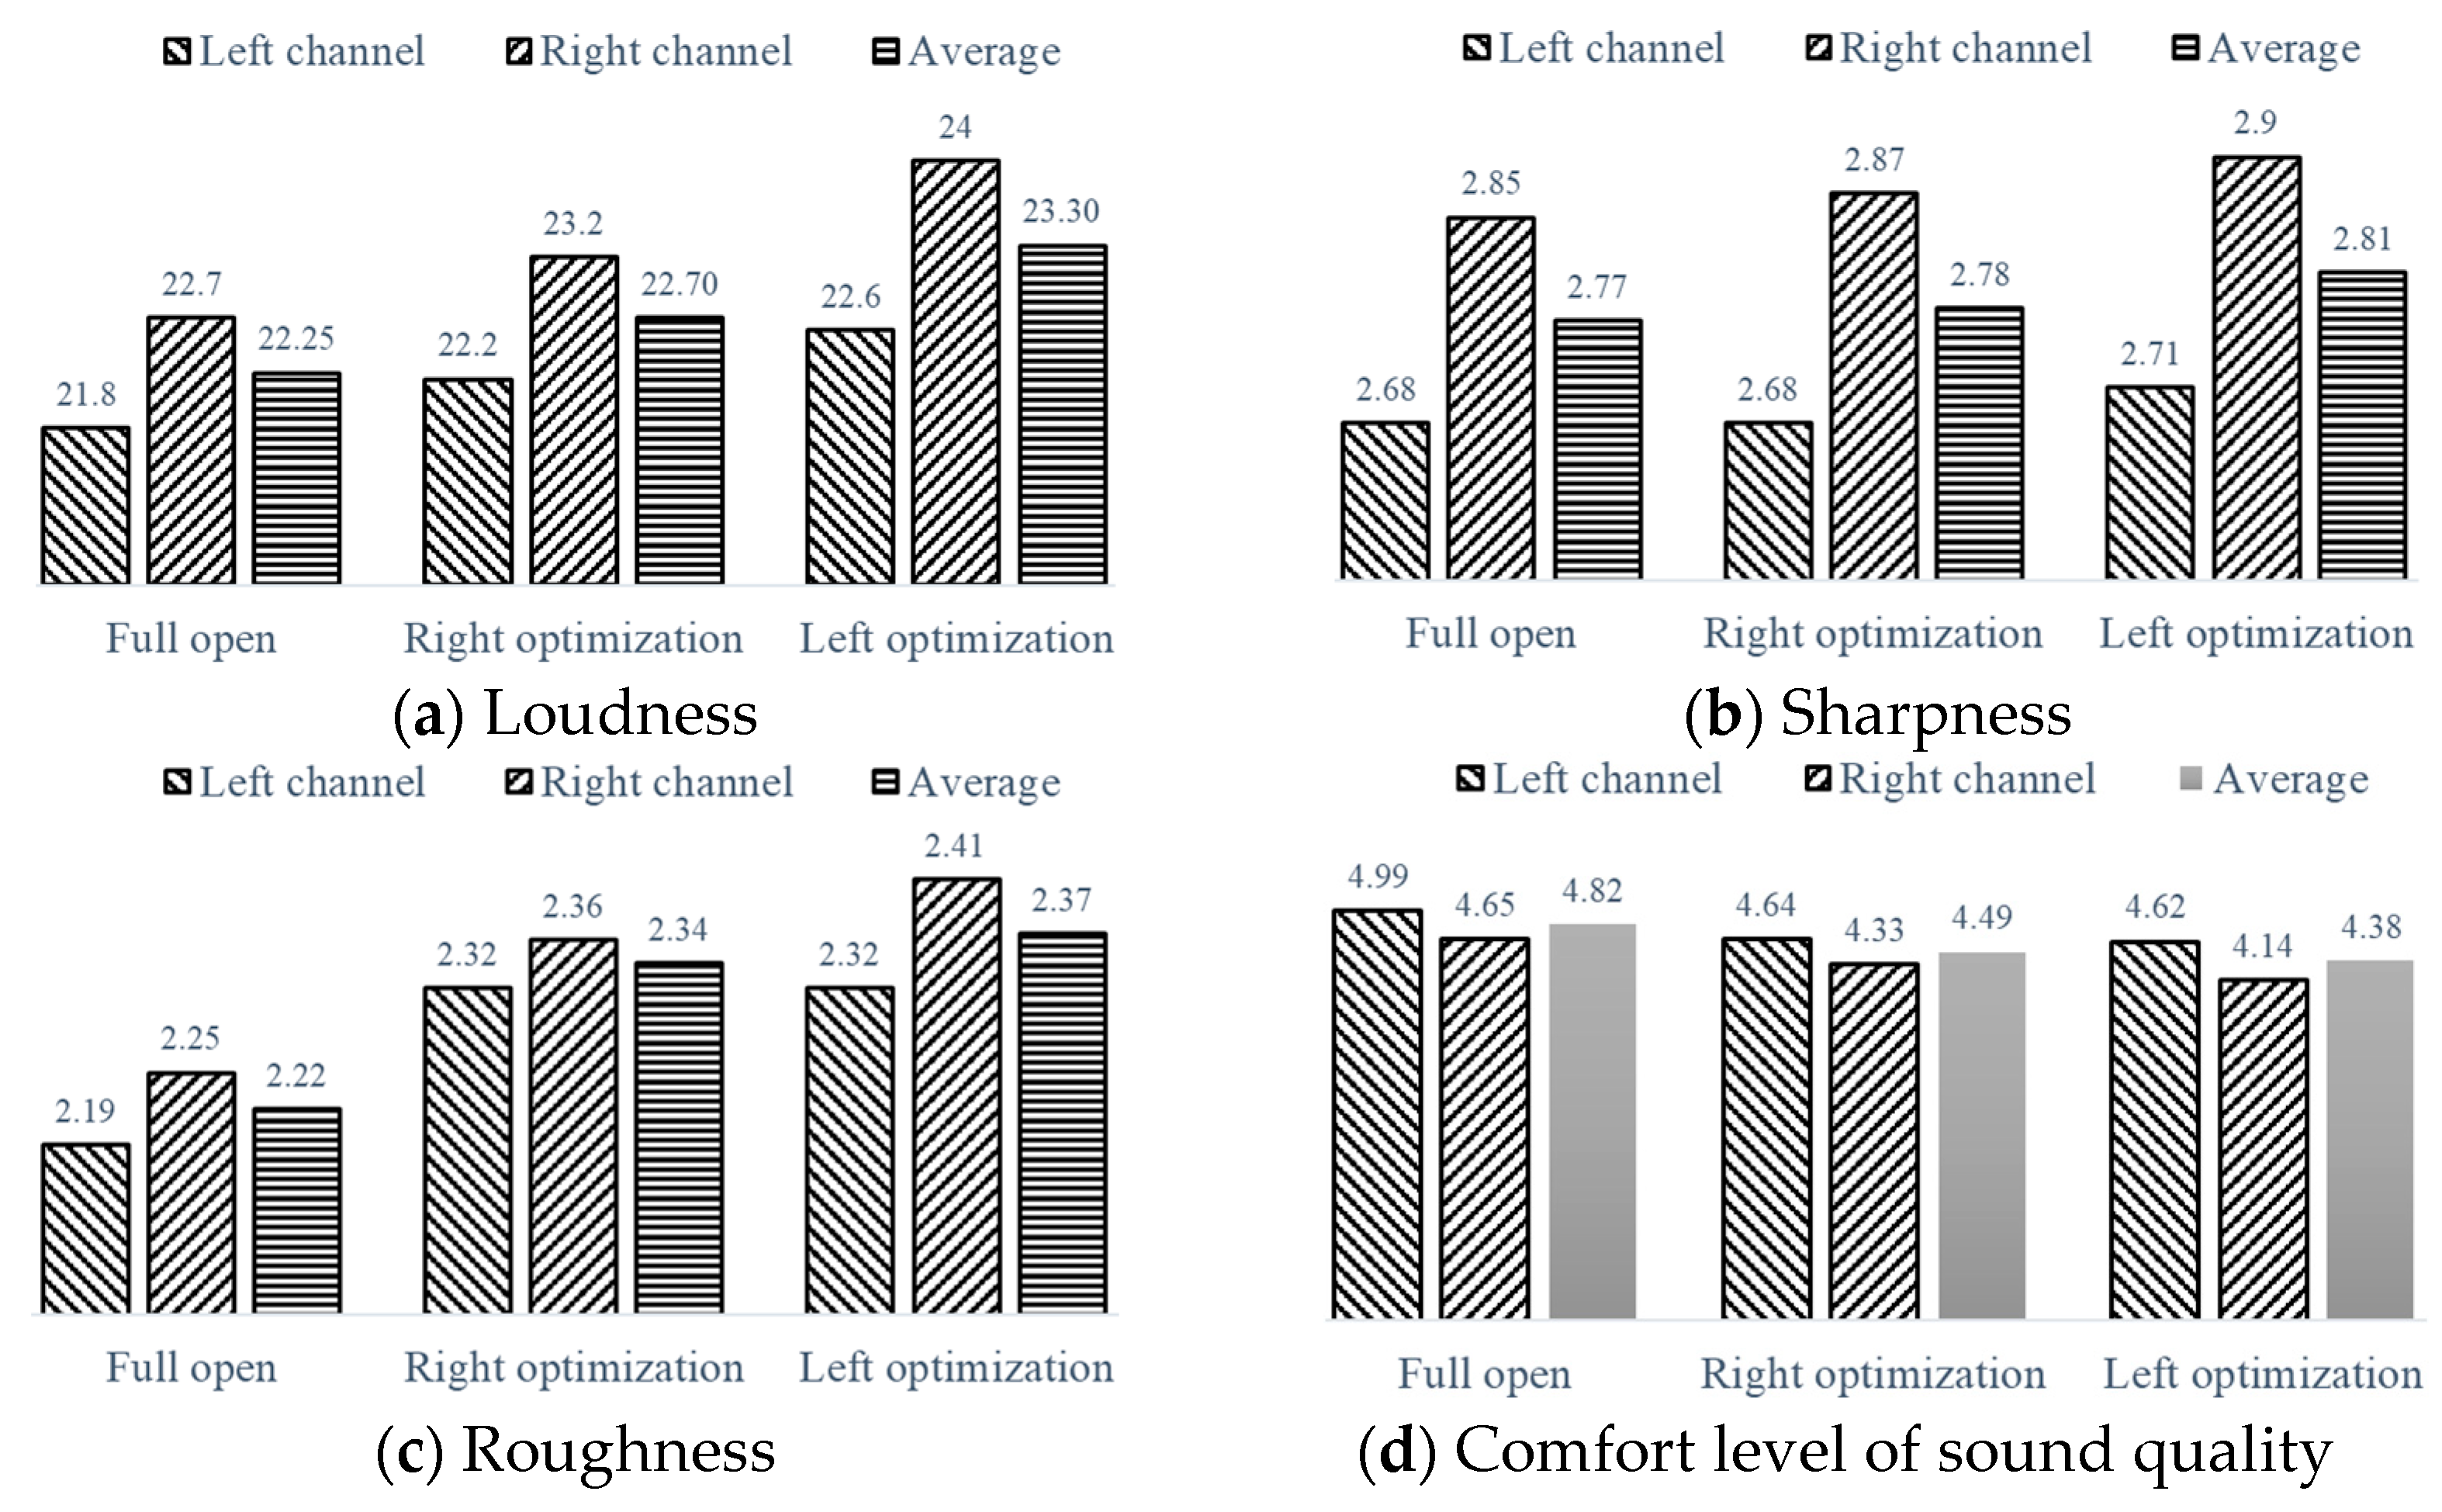
Based on inlet condition 1, a new inlet scheme with a non-uniform air volume distribution has been proposed to enhance aerodynamic performance and noise quality while preventing uneven oil fume escape. This scheme involves adjusting the angle of the guide plate at the intake structure, where the left side is fully opened and the right side is partially opened, resulting in an airflow ratio of 7:3. Alternatively, when the right side is fully opened and the left side is partially opened, the airflow ratio becomes 3:7. This approach aims to ensure that airflow is distributed evenly across the entire intake surface. Details of this optimization can be found in
Figure 25.
Figure 26 illustrates that, following the implementation of this optimization scheme, the aerodynamic performance parameters, including the maximum total pressure efficiency under the three intake conditions, remain consistent, with the maximum deviation in total pressure efficiency not exceeding 1.96%.
Figure 26 demonstrates that the optimization scheme effectively reduces the differences in loudness, sharpness, and roughness between the left and right ears. Specifically, the left-side optimization reduces the average loudness by four sones. Both optimization schemes achieve a deviation from the average loudness under fully open conditions of no more than 0.3 sones, sharpness by no more than 0.3 acum, and roughness by no more than 0.15 asper. These results suggest that the distribution characteristics of the internal vortex are consistent across the optimized conditions.
5. Conclusions
This study utilizes numerical simulations to explore how various inlet conditions influence the internal flow field and pressure pulsation of a dual-inlet centrifugal fan. The key findings are as follows:
(1) Time-domain analysis indicates that inlet condition 1 is the most unstable. This instability is characterized by significant fluctuations in the pressure coefficient and the presence of broadband signals in the frequency domain. These broadband features are particularly pronounced at measurement point C1, located on the wide impeller, and measurement point D5, located on the narrow impeller.
(2) Analysis of transient vortex structures reveals that the observed broadband characteristics and the absence of the blade-passing frequency at these measurement points are associated with the periodic evolution of large-scale vortices within the flow passage. Under inlet condition 1, the intensity of the vortex peaks is due to the alignment between the inlet direction and the impeller’s rotation direction, which has a substantial impact on flow within the passage.
(3) Sound quality analysis shows that under inlet condition 1, the sound sharpness is greater than under the other conditions. This observation suggests a higher presence of high-frequency signals in the pressure pulsation near the blade-passing frequency, further linking the flow structures to the characteristics in the frequency domain.
(4) A non-uniform air volume distribution scheme is proposed. This scheme enhances aerodynamic performance and reduces noise discrepancies between the left and right sides, leading to an overall reduction in average loudness by four sones.


