Article

A Comprehensive Performance Evaluation Method Based on Dynamic Weight Analytic Hierarchy Process for In-Loop Automatic Emergency Braking System in Intelligent Connected Vehicles

1
Automotive Engineering College, Shandong Jiaotong University, Jinan 250357, China
2
Intelligent Testing and High-End Equipment of Automotive Power Systems, Shandong Province Engineering Research Center, Jinan 250000, China
3
Shandong Xinlingzhi Testing Technology Co., Ltd., Jinan 250014, China
*
Author to whom correspondence should be addressed.
Machines 2025, 13(6), 458; https://doi.org/10.3390/machines13060458
Submission received: 2 May 2025 / Revised: 20 May 2025 / Accepted: 23 May 2025 / Published: 26 May 2025

Abstract

:
In the field of active safety technology for intelligent connected vehicles (ICVs), the reliability and safety of the Automatic Emergency Braking (AEB) system is recognized as critical to driving safety. However, existing evaluation methods have been constrained by the inadequacy of static weight assessments in adapting to diverse driving conditions, as well as by the disconnect between conventional evaluation frameworks and experimental validation. To address these limitations, a comprehensive Vehicle-in-the-Loop (VIL) evaluation system based on the dynamic weight analytic hierarchy process (DWAHP) was proposed in this study. A two-tier dynamic weighting architecture was established. At the criterion level, a bivariate variable–weight function, incorporating the vehicle speed and road surface adhesion coefficient, was developed to enable the dynamic coupling modeling of road environment parameters. At the scheme level, a five-dimensional indicator system—integrating braking distance, collision speed, and other key metrics—was constructed to support an adaptive evaluation model under multi-condition scenarios. By establishing a dynamic mapping between weight functions and driving condition parameters, the DWAHP methodology effectively overcame the limitations associated with fixed-weight mechanisms in varying operating conditions. Based on this framework, a dedicated AEB system performance test platform was designed and developed. Validation was conducted using both VIL simulations and real-world road tests, with a Volvo S90L as the test vehicle. The experimental results demonstrated high consistency between VIL and real-world road evaluations across three dimensions: safety (deviation: 0.1833/9.5%), reliability (deviation: 0.2478/13.1%), and riding comfort (deviation: 0.05/2.7%), with an overall comprehensive score deviation of 0.0707 (relative deviation: 0.51%). This study not only verified the technical advantages of the dynamic weight model in adapting to complex driving environments and analyzing multi-parameter coupling effects but also established a systematic methodological framework for evaluating AEB system performance via VIL. The findings provide a robust foundation for the testing and assessment of AEB system, offer a structured approach to advancing the performance evaluation of advanced driver assistance systems (ADASs), facilitate the safe and reliable validation of ICVs’ commercial applications, and ultimately contribute to enhancing road traffic safety.

1. Introduction

According to the “Global Road Safety Report 2023” by the World Health Organization (WHO), 1.19 million fatalities were caused by road traffic accidents worldwide, with 92% of these deaths occurring in low- and middle-income countries. Among them, pedestrians, cyclists, and motorcyclists accounted for more than 50% of the fatalities [1]. In China, data released by the National Bureau of Statistics indicated that casualties resulting from motor vehicle accidents constituted 82.81% of all traffic-related casualties, leading to substantial injuries and significant economic losses [2]. In response to these critical challenges, ICV technologies are rapidly developed. Among various active safety innovations, the AEB system is regarded as a core technology, with its performance exerting a direct impact on road traffic safety. For example, a 27% reduction in accident incidence was observed for vehicles equipped with an AEB system, as demonstrated by a study conducted by the Insurance Institute for Highway Safety (IIHS) in the United States (U.S.) [3]. Furthermore, it was reported to reduce the risk of fatal pedestrian collisions by 84–87% and the risk of severe injury (MAIS 3+) by 83–87% [4]. In addition, the AEB system was proven to be highly effective in preventing approximately 83% of rear-end collisions [5].
The AEB system is an active safety technology designed to prevent collision risks or mitigate the severity of collisions through active alerts and braking interventions. It primarily consists of three components: environmental perception, control decision-making, and execution mechanisms. To ensure the stability and reliability of AEB systems’ performance, major global automotive markets and international organizations have promoted the implementation and the verification of the effectiveness of the technology through a multi-dimensional policy framework encompassing regulatory mandates, standard certifications, and testing evaluations. In 2016, 20 major automotive manufacturers committed to installing more than 95% of new vehicles with an AEB system as standard. By 2025, an AEB system was expected to be installed in 90% of newly sold vehicles in the U.S. As part of regulatory initiatives, UN R152 was adopted as the entry standard of the European Union (EU), mandating that the AEB system in M1- and N1-category vehicles should automatically detect collision risks within a speed range of 10–60 km/h [6]. The system was required to issue both visual and auditory warnings and to activate emergency braking (with a deceleration of no less than 4 m/s2) to avoid or mitigate collisions, as regulated. It was initially enforced for vehicle-to-vehicle functions starting in July 2022 and was extended to pedestrian detection in July 2024 [7]. In addition, in May 2024, the Ministry of Transport of China mandated that passenger buses, cargo vehicles, towing vehicles, and hazardous goods transport vehicles be outfitted with an AEB system, in compliance with the “Performance Requirements and Test Methods for AEB Systems in Operating Vehicles” (JT/T 1242-2019) [8], where the evaluation of braking response time and deceleration performance under high-speed conditions were emphasized. The technical implementation and performance evaluation of the AEB system were promoted in various countries by means of a trinity policy framework integrating “regulatory enforcement, standard certification, and testing evaluation”.
However, the reliability of the AEB system varied across different driving environments and conditions, such as pedestrians crossing at urban intersections or strong light interference on highways. Especially, the performance of the AEB system was observed to deteriorate under harsh weather conditions, at higher speeds, and in situations where visibility was obstructed, posing significant challenges to the scientific validity of current evaluation methodologies. In order to enhance the system’s reliability and improve driving safety, researchers endeavored to enrich AEB system testing scenarios and evaluation parameters. Kidd [9], by examining 6.73 million police-reported rear-end collisions and 4285 fatal accidents, quantified the key factors affecting AEB system performance, providing empirical support for organizations like the IIHS and European New Car Assessment Programme (E-NCAP) to revise their testing protocols. Zhou et al. [10], utilizing data from the National Automotive Accident In-Deep Investigation System, investigated the expected functional safety of the perception system in hazardous interactions between automobiles and two-wheeled vehicles (e.g., motorcycles and bicycles). Similarly, Lian et al. [11] extracted typical traffic accident characteristics from international traffic accident databases and analyzed the scenarios for triggering the AEB system, which added data for the construction of a systematic test scenario database. Rao et al. [12] conducted research focusing on the quantitative evaluation of the AEB system in non-standard driving situations. Through naturalistic, driving data-driven scene generation, the development of simulation models, and boundary collision assessment, critical causes of substantial AEB system performance degradation in curve scenarios were uncovered, being attributed to sensor perception deficiencies and limitations in traditional algorithms. In addition, Kawaguchi et al. [13] analyzed large-scale fleet operational data and demonstrated that the AEB system effectively reduced collision rates among non-fatigued drivers. They further recommended integrating active intervention technologies, such as fatigue monitoring systems, to optimize the safety performance of commercial vehicles. Karpenko et al. [14,15] investigated the influence of tire performance on braking effectiveness through a tire stress–deformation model. It was found that a 0.5 bar reduction in inflation pressure could increase tire deformation by 15%, leading to an approximately 8% extension of braking distance. This indicated that the performance evaluation of the AEB system should not solely rely on data from standard working conditions but also take into account the actual impact of tire status (such as tire pressure and load) on braking response. Ji [16] and Tian [17] focused on the investigation of performance evaluation indicators for the AEB system, thereby laying a theoretical foundation for a reliable system assessment. Cicchino et al. [18], employing both Poisson regression modeling and a quasi-induced exposure methodology, assessed the effectiveness of the pedestrian detection AEB system on real-world police-reported pedestrian collision incidents. Their findings indicated that vehicles equipped with the pedestrian detection AEB system achieved a 25–27% reduction in the risk of pedestrian collisions and a 29–30% decrease in the risk of pedestrian injuries. Moreover, Li [19], Zhou [20], Wang [21], and Leng [22] explored optimization strategies for AEB system control algorithms. In particular, Wang [21] proposed an “Estimation–Prediction–Control” hierarchical architecture, which integrated the estimation of road surface adhesion coefficients, the prediction of pedestrian trajectories, and braking system control. This framework highlighted the critical role of road surface adhesion in AEB systems’ functionality and introduced a novel paradigm for active safety control under complex operational conditions.
The aforementioned research on AEB systems’ performance mainly focused on enriching test scenarios, expanding evaluation metrics, identifying key influencing factors, and optimizing control strategies, but there were rarely studies conducting a systematic evaluation of the overall performance of the AEB system. Yang et al. [23] introduced a data-driven pedestrian-oriented key test scenario generation method, wherein speed difference (Δv), relative lateral distance (Dy), and relative longitudinal distance (Dx) were defined as core variables to construct a scene risk assessment model. This approach provided a reusable technical pathway for building large-scale scenario libraries and facilitated the transition of the industry from “vehicle-oriented” to “vulnerable road user (VRU)-oriented” testing paradigms. Kovaceva et al. [24] incorporated Bayesian inference into the safety benefit assessment of the AEB system, systematically integrating counterfactual simulations with real-world test data to address the limitations associated with a reliance on a single source in traditional methods. Zhao et al. [25] developed a multi-modal sequence model for predicting the motion intentions (such as lane changes, acceleration, deceleration, etc.) of surrounding vehicles, by incorporating lateral trajectory planning into the emergency braking process, and thus overcame the limitations of traditional AEB systems that were restricted to longitudinal braking. Schachner et al. [26] established a scenario directory generation and safety assessment method based on an open-source toolchain, systematically analyzed the effects of AEB systems on collision outcomes in vehicle–pedestrian conflict scenarios and introduced collision configuration quantification analyses, including impact speed attenuation rate and collision point offset, to support the development of injury prediction models for AEB systems. Jang et al. [27] applied ADAS testing system equipment and differential global positioning systems to evaluate AEB systems’ performance, conducting assessments based on established evaluation protocols. Xu et al. [28] proposed an integrated Software-in-the-Loop (SIL) (Matlab/Simulink) and Hardware-in-the-Loop (HIL) (IPG simulation platform, dSPACE controller, and pneumatic braking bench) verification system for two-axle passenger vehicles to improve the validation efficiency of AEB system control algorithms. The test results showed a high degree of consistency between SIL and HIL outcomes in terms of vehicle speed and relative distance measurements. Duan et al. [29] advanced a novel safety testing method that combined digital twin technology with fault tree analysis, thereby enhancing the richness of autonomous driving test scenarios and improving the credibility of evaluation results. Moreover, Wang [30], Gao [31], Fang [32], and Wang [33] employed VIL approaches to AEB system performance validation. Among them, Wang [33] constructed a digital twin-based VIL testing system for intelligent vehicles, which was employed in the development and validation of AEB systems. Real-world road experimental results confirmed the effectiveness and advantages of the proposed method, demonstrating that it not only preserved the realism of traditional real-world road testing but also effectively mitigated the safety risks associated with direct on-road experiments.
Yet, the existing performance evaluation frameworks for AEB systems exhibited two major limitations: First, mainstream evaluation methods, such as E-NCAP and China-NCAP (C-NCAP), adopted static weight allocation mechanisms, making it difficult to accurately capture the dynamic response characteristics of the system under multi-condition coupling. Second, traditional evaluation frameworks generally demonstrated a disconnect between theoretical modeling and experimental validation, resulting in discrepancies between assessment outcomes and actual road performance. With the increasing deployment of L2+ and L3-level autonomous driving technologies, the AEB system has been required to address increasingly complex scenarios, including pedestrian crossings and multi-vehicle interactions. These two critical shortcomings have significantly constrained the accuracy and engineering applicability of current AEB system performance evaluations.
To overcome these challenges, a comprehensive VIL performance evaluation system with the DWAHP for AEB systems was proposed in this study. In particular, a two-level dynamic weighting architecture was established: at the criteria level, a bivariate dynamic weight function incorporating the vehicle speed and road surface adhesion coefficient was introduced to enable the dynamic coupling modeling of road environment parameters; at the scheme level, a five-dimensional indicator system—encompassing braking distance, collision speed, and other key metrics—was constructed, and a multi-condition adaptive evaluation model was developed through a nonlinear weight allocation algorithm. Compared to the traditional AHP, the DWAHP approach effectively addressed the limitations of fixed-weight mechanisms by establishing a dynamic mapping relationship between weight functions and operating condition parameters. Additionally, based on the primary influencing factors of the AEB system (vehicle speed and road surface adhesion coefficient) and the DWAHP method, a dedicated AEB system performance testing platform was developed for VIL testing, forming a complete technical chain covering parameter acquisition, weight allocation, and comprehensive evaluation. Compared to a real-world road test, the VIL-based evaluation outcomes exhibited a high degree consistency for safety, reliability, and riding comfort. This achievement not only established a new methodological framework for the comprehensive evaluation of AEB systems but also provided critical contributions to advancing the performance evaluation of ADASs. The developed testing platform and evaluation model are expected to play a significant role in enhancing the intelligent driving safety evaluation system and contribute substantially to its future improvements.

2. Development of the Evaluation Model Based on the DWAHP

A variable-weight evaluation model was constructed by leveraging the AHP and co-simulation data. Vehicle speed and road surface adhesion coefficient were selected as the key variables. The DWAHP model was adopted to enable the evaluation system to more precisely capture the dynamic variations in real-world operating conditions. In addition, a theoretical methodology was provided for the design and development of a VIL testing platform for the performance evaluation of AEB systems.

2.1. Co-Simulation

CarSim 2019.1 and MATLAB/Simulink 2020a were employed as co-simulation platforms to develop the vehicle dynamics model, test scenarios, and AEB system control strategy model. The performance of the AEB system was assessed under varying conditions of vehicle speed and road surface adhesion coefficient. The simulation outcomes laid a theoretical foundation for the establishment of the AEB system evaluation model relying on the DWAHP.

2.1.1. Simulation Scheme Design

The influence of vehicle speed and road surface adhesion coefficient on AEB system performance were fully taken into account. The Car-to-Car Rear Stationary (CCRS) and Car-to-Car Rear Moving (CCRM) conditions, as defined in the E-NCAP protocol, were selected as the principal experimental scenarios. The corresponding test conditions are detailed in Table 1.
In Table 1, the test scenarios are summarized, covering a range of traffic environments, including urban roads, suburban areas, and highways. Different road surface adhesion coefficients were configured to account for the effects of actual driving conditions and environmental weather on vehicle speed. Aside from the scenario settings, all other simulation conditions—such as vehicle dynamic parameters, AEB system control models, and associated configuration parameters—were kept consistent across all experiments. Each scenario was simulated three times to verify the reliability and reproducibility of the test results.

2.1.2. Model Development

The construction of the model was divided into two parts: (1) the configuration of the test vehicle dynamics, target scenarios, sensor settings, and input/output interfaces in CarSim; and (2) the development of the AEB system control model in MATLAB/Simulink, followed by co-simulation with CarSim. A four-wheel-drive E-Class sedan, equipped with a 250 kW gasoline engine and a 7-speed automatic transmission, was selected as the test vehicle within the CarSim environment. The detailed vehicle model parameters are illustrated in Figure 1.
The specific parameter settings for the simulation scenarios were varied according to the influencing factors under investigation and primarily encompassed vehicle speed, braking control, gear control, steering control, road surface parameters, and simulation process management. Since braking control was implemented through a closed-loop system established by the Simulink-developed algorithm and CarSim, the corresponding built-in braking control module in CarSim was disabled. The detailed configurations for the target vehicle and sensors are presented in Figure 2.
The imported variables in CarSim were defined as IMP_PCON_BK (brake master cylinder pressure (MPa)) and IMP_THROTTLE_ENGINE (throttle opening (-)), while the exported variables were sequentially set as DisS1_1 (relative distance between the two vehicles (m)), Vx (velocity of the test vehicle (m/s)), and V_object_1 (velocity of the target vehicle (m/s)).
The AEB system control model was developed in MATLAB/Simulink in accordance with Equation (1), as shown in Figure 3.
d br = 1 2 v b 2 a b v b v rel 2 a f + v b t j + v rel t b + d z ,
where vb is the velocity of the test vehicle (m/s); vrel is the relative velocity between the test vehicle and the target vehicle (m/s); ab, af are the maximum deceleration of the test vehicle and the target vehicle (m/s2); tb is brake system delay time (s); tj is driver reaction time to braking (s); and dz is minimum stopping distance between the test vehicle and the target vehicle (m).
After the input and output parameters were determined, co-simulation with CarSim was carried out. CarSim provided real-time data, including the test vehicle speed, the relative speed of the target vehicle, and the relative distance, to the AEB algorithm model. The model outputs, namely brake_out and throttle_out, were subsequently fed back into the vehicle dynamics model in CarSim, thereby forming a closed-loop control system. This process was iteratively executed to achieve SIL control. The detailed simulation flow is shown in Figure 4.

2.1.3. Simulation Results Analysis

Following the above configurations, simulation results were generated to analyze five categories of evaluation indicators: braking distance, braking deceleration, collision speed, AEB system braking intervention time, and rate of change in acceleration (Jerk). The results are depicted in Figure 5, Figure 6, Figure 7 and Figure 8.
As illustrated in Figure 5, Figure 6, Figure 7 and Figure 8, the reliability (braking intervention time, braking distance), safety (mean fully developed deceleration (MFDD), braking distance, collision speed), and ride comfort (Jerk) of the AEB system were influenced by variations in the initial speed of the test vehicle and the road surface adhesion coefficient under identical test scenarios. Specifically, when the initial speed of the test vehicle ranged from 30 km/h to 80 km/h, the low-adhesion road surface (Figure 6, μ = 0.5) revealed the inherent physical limitations of the system: constrained by the maximum attainable deceleration, the collision speed increased by 17–51% compared to high-adhesion conditions (μ = 0.85) at equivalent speeds, while the braking intervention time was prolonged by 0.103–0.231 s. Conversely, when the adhesion coefficient was elevated to 0.85 (Figure 5), the braking distance was reduced by an average of 1.625 m, and successful collision avoidance was achieved at speeds of ≤50 km/h, thereby reinforcing the decisive role of road surface conditions in defining the safety margins of the system. Under high-speed conditions (Figure 7), a greater deceleration prior to stabilization was detected as the initial speed increased; however, the final collision speed consistently remained higher (e.g., the initial speed was 80, and the final collision speed was still higher than 30), signifying a deterioration in the safety performance of the AEB system. These findings substantiated the critical influence of vehicle speed on AEB systems’ effectiveness. Furthermore, an enhancement in road surface adhesion (Figure 8) significantly mitigated collision speeds and braking distances, accelerated braking response times, and enhanced braking efficiency. Nonetheless, while safety performance was improved, ride comfort was substantially compromised, with Jerk values exceeding 5 m/s3.
In summary, a marked negative correlation was identified between improvements in safety (increased MFDD and reduced collision speed) and deteriorations in comfort (elevated Jerk values), elucidating the intrinsic trade-off between safety and comfort metrics. These simulation results provided a robust data foundation for constructing a dynamic weight-based comprehensive performance evaluation model for the AEB system utilizing the AHP.

2.2. Development of the DWHAP Model

Considering the AEB system’s safety, reliability, and ride comfort, as well as the effects of varying vehicle speeds and road surface adhesion coefficients, a comprehensive evaluation framework, referred to as the DWAHP model, was developed based on the results of the co-simulation tests (Table 2). A standardized methodology for assessing the overall performance of AEB systems under VIL testing conditions was provided.
The comprehensive performance of the AEB system served as the criterion layer, while the five categories of evaluation metrics constituted the scheme layer. By analyzing the performance priorities under different test scenarios (Table 3), a relative importance matrix of the criterion layer with respect to the target layer was established for the comprehensive performance evaluation of the AEB system.
The effects of vehicle speed and road surface adhesion coefficient on the safety and reliability of the AEB system, as well as on ride comfort, were taken into consideration. Accordingly, a weight function Sij (where i, j = 1, 2, 3) describing the relative importance of the criterion layer with respect to the target layer was constructed. This function aimed to enable a reliable evaluation of the comprehensive performance of the AEB system under different operating conditions and to enhance the accuracy of the assessment. The specific formulation is presented in Equation (2).
S i j v , μ = a i v + b i μ + c i 0 ,
where ai is the influence coefficient of vehicle speed on the criterion layer weight Sij (-); bi is the influence coefficient of the road surface adhesion coefficient on the criterion layer weight Sij (-); and ci is the reference constant (-).
When vehicles operated on low-adhesion surfaces at high speed, ensuring that the AEB system successfully avoided collisions or significantly reduced the collision speed after activation was identified as the primary objective, owing to factors such as compromised vehicle stability and intensified collision impacts. Under adverse weather conditions, the sensing capabilities of the environmental perception system were subject to considerable limitations, while in complex urban traffic environments, the field of vision of the vehicle was often obstructed. Consequently, it was critical for the AEB system to detect potential hazards and initiate braking interventions within predefined control thresholds (such as time-to-collision (TTC) or relative distance). In urban traffic scenarios, the diversity of traffic participants, combined with frequent traffic signals, resulted in repeated following and braking maneuvers, thereby diminishing ride comfort. On dry asphalt roads, elevated braking deceleration contributed to stronger braking forces, further degrading ride comfort. Drawing upon the above analysis and comprehensively considering the priority scenarios under varying vehicle speeds and surface adhesion conditions, the weight functions S12, S13, and S23 were formulated, as shown in Equations (3)–(5).
S 12 v , μ = 3 v + 1 μ + 2 ,
S 13 v , μ = 5 v + 3 1 - μ + 2 ,
S 23 v , μ = v + 3 1 μ + 1 ,
where μ∈[0.1, 0.9] and v = 0–120 km/h; both variables were linearly normalized to the range [0, 1] to prepare for the subsequent research work.
According to Equations (3)–(5) and the co-simulation results, pairwise comparisons were carried out to investigate the relative significance between the criterion layer and the target layer across the three prioritized scenarios, as presented in Table 4.
The judgment matrix A was derived from Table 4, as shown in Equation (6).
A = 1 S 12 S 13 1 / S 12 1 S 23 1 / S 13 1 / S 23 1 ,
Through parameter discretization, key point sampling was performed to verify the validity of the dynamic weight functions. The influencing factors were vehicle speed and road surface adhesion coefficient (m = 2). The speed levels (S) were categorized into low-speed (S1) and high-speed (S2) conditions, while the adhesion coefficient levels (H) considered were low-adhesion surfaces (H1) and high-adhesion surfaces (H2). Accordingly, the number of factor levels was determined to be two (n = 2). Based on these considerations, the experimental design scheme was formulated, as detailed in Table 5.
The aforementioned experimental schemes and corresponding data were substituted into matrix A. The four test schemes were respectively denoted as matrices A1, A2, A3, and A4 (Equations (7)–(10)). Consistency verification was subsequently conducted for each matrix.
A 1 = 1 3.55 5.4 1 / 3.55 1 3.65 1 / 5.4 1 / 3.65 1 ,
A 2 = 1 2.95 3.6 1 / 2.95 1 1.85 1 / 3.6 1 / 1.85 1 ,
A 3 = 1 5.8 9.4 1 / 5.8 1 4.4 1 / 9.4 1 / 4.4 1 ,
A 4 = 1 5.2 7.6 1 / 5.2 1 2.6 1 / 7.6 1 / 2.6 1 ,
The weight vectors of each matrix were calculated and subsequently normalized (as shown in Equations (11)–(14)). Consistency verification of the constructed matrices was conducted by calculating the maximum eigenvalue λmax (Equation (15)) and applying the consistency test criterion (Equation (16)).
w A 1 = 0.652 0.254 0.094 ,
w A 2 = 0.611 0.240 0.149 ,
w A 3 = 0.747 0.192 0.061 ,
w A 4 = 0.741 0.177 0.082 ,
λ max = 1 3 i = 1 3 A w i w i ,
C R = λ max - n R I n - 1 ,
Since the judgment matrices were of order three, the random consistency index (RI) was set to 0.58 according to the corresponding reference table. Consequently, the consistency test results for each matrix are summarized in Table 6.
As shown in Table 6, all CR values were less than 0.1, indicating that the consistency tests were successfully passed.
Based on the simulation data, pairwise comparisons were conducted to analyze the relative importance of evaluation criteria in the target layer with respect to the criterion layer. Corresponding judgment matrices were constructed and weight vectors were derived. The importance relationships are presented in Table 7, Table 8 and Table 9, and the judgment matrices B1, B2, and B3 are given in Equations (17)–(19).
B 1 = 1 1 / 2 1 / 3 1 / 5 5 2 1 1 / 2 1 / 4 4 3 2 1 1 / 2 4 5 4 2 1 6 1 / 5 1 / 4 1 / 4 1 / 6 1 ,
B 2 = 1 2 1 / 2 1 / 5 3 1 / 2 1 1 / 3 1 / 6 2 2 3 1 1 / 3 4 5 6 3 1 7 1 / 3 1 / 2 1 / 4 1 / 7 1 ,
B 3 = 1 1 / 3 1 / 2 1 / 4 1 / 5 3 1 2 1 / 2 1 / 3 2 1 / 2 1 1 / 3 1 / 4 4 2 3 1 1 / 2 5 3 4 2 1 ,
The weight vectors of each matrix were calculated (Equations (20)–(22)) and subsequently subjected to consistency verification to assess their validity. The results of the consistency tests are presented in Table 10.
w b 1 = 0.105 0.149 0.245 0.454 0.047 ,
w b 2 = 0 . 128 0 . 071 0 . 215 0 . 538 0 . 048 ,
w b 3 = 0 . 069 0 . 159 0 . 096 0 . 262 0 . 414 ,
As shown in Table 10, all CR values were found to be less than 0.1, indicating that the consistency tests were successfully passed and confirming the validity of the importance relationships between the evaluation criteria in the target layer and the performance criteria in the criterion layer. Let wt = (dbr, abr, vc, tbr_in, j)T; the evaluation model of the target layer with respect to the criterion layer (EMtc) is formulated as shown in Equation (23).
E M t c = w B 1 · w t + w B 2 · w t + w B 3 · w t ,
The range of braking distance was set from 0 m to 100 m, while the braking deceleration was assigned values between 1 m/s2 and 10 m/s2. The collision speed was confined within the range of 0 km/h to 120 km/h, the braking intervention time was defined between 0 s and 5 s, and the mean acceleration rate (Jerk) was selected within 1 10 m/s3 to 10 m/s3. In order to facilitate evaluation and testing, all five categories of evaluation criteria were normalized to [0, 1]. Specifically, the Jerk primarily reflected ride comfort: under comfort-oriented scenarios, values typically ranged from 1 m/s3 to 3 m/s3, whereas under emergency conditions, values generally fell between 5 m/s3 and 10 m/s3. Therefore, a smaller value indicated a higher level of comfort. The values of braking distance, collision speed, and acceleration rate were considered, with smaller values indicating better performance of the AEB system; thus, their normalized values were adjusted according to a 1-normalized score. Conversely, a shorter braking intervention time indicated a greater likelihood of collision avoidance, and therefore its normalized value was retained directly without inversion.
Drawing on the experimental data, the weight vector wt was derived, enabling the formulation of the evaluation model EMtc. This model was subsequently incorporated as coefficients into Equations (3)–(5) to compute the comprehensive performance score of the AEB system under various initial speeds and road adhesion conditions. This approach was designed to provide an integrated assessment of the overall performance of the AEB system.

3. Experimental Setup and VIL Test

The AEB system constitutes an indispensable component of both collision warning and avoidance technologies, as well as autonomous driving systems. At present, performance evaluations of AEB systems are primarily conducted through simulation testing and real-world road testing. Simulation testing, which has become a major focus of recent research, allows for evaluations under various extreme and idealized conditions. However, it remains highly subjective, as it heavily relies on the construction of control models and the setting of critical parameters. Thus, it is not considered a primary reference basis. In contrast, real-world road testing yields highly accurate results consistent with actual driving environments, enabling the comprehensive consideration of factors such as environmental conditions, road surface characteristics, and driver behaviors. Nevertheless, it is limited by significant safety risks, the low repeatability of specific scenarios, and relatively low efficiency.
In view of the above analysis, a performance testing platform for AEB systems was designed and developed, grounded in a comprehensive performance evaluation paradigm based on the DWAHP model and its primary influencing factors (vehicle speed and road surface adhesion coefficient). Subsequently, VIL experiments were carried out on this platform, providing a novel and effective approach for evaluating the performance of AEB systems.

3.1. Development of Experimental Equipment

Experimental equipment was designed and developed based on the detection requirements and the primary influencing factors of AEB system performance (vehicle speed and road adhesion coefficient). The platform was equipped with several key functionalities: an adjustable wheelbase to accommodate different vehicle models, an adjustable center distance between the primary and secondary rollers to simulate various road adhesion conditions, and a dual-inertia coupling system realized through a mechanical flywheel and an alternating current (AC) dynamometer, enabling safe operation and accurate data acquisition across low, medium, and high vehicle speeds. The platform mainly consisted of two subsystems: a mechanical body and a measurement and control system. Relying on the comprehensive performance evaluation model DWAHP of the AEB system, employing the VIL testing method, the performance of the AEB system was systematically assessed.
The mechanical structure of the testing platform primarily consisted of a roller assembly, chain transmission and tensioning system, flywheel assembly, AC dynamometer, lifting device, integrated linkage assembly, and protective components. The overall mechanical layout is illustrated in Figure 9. The specifications and selections of the major testing components are summarized in 
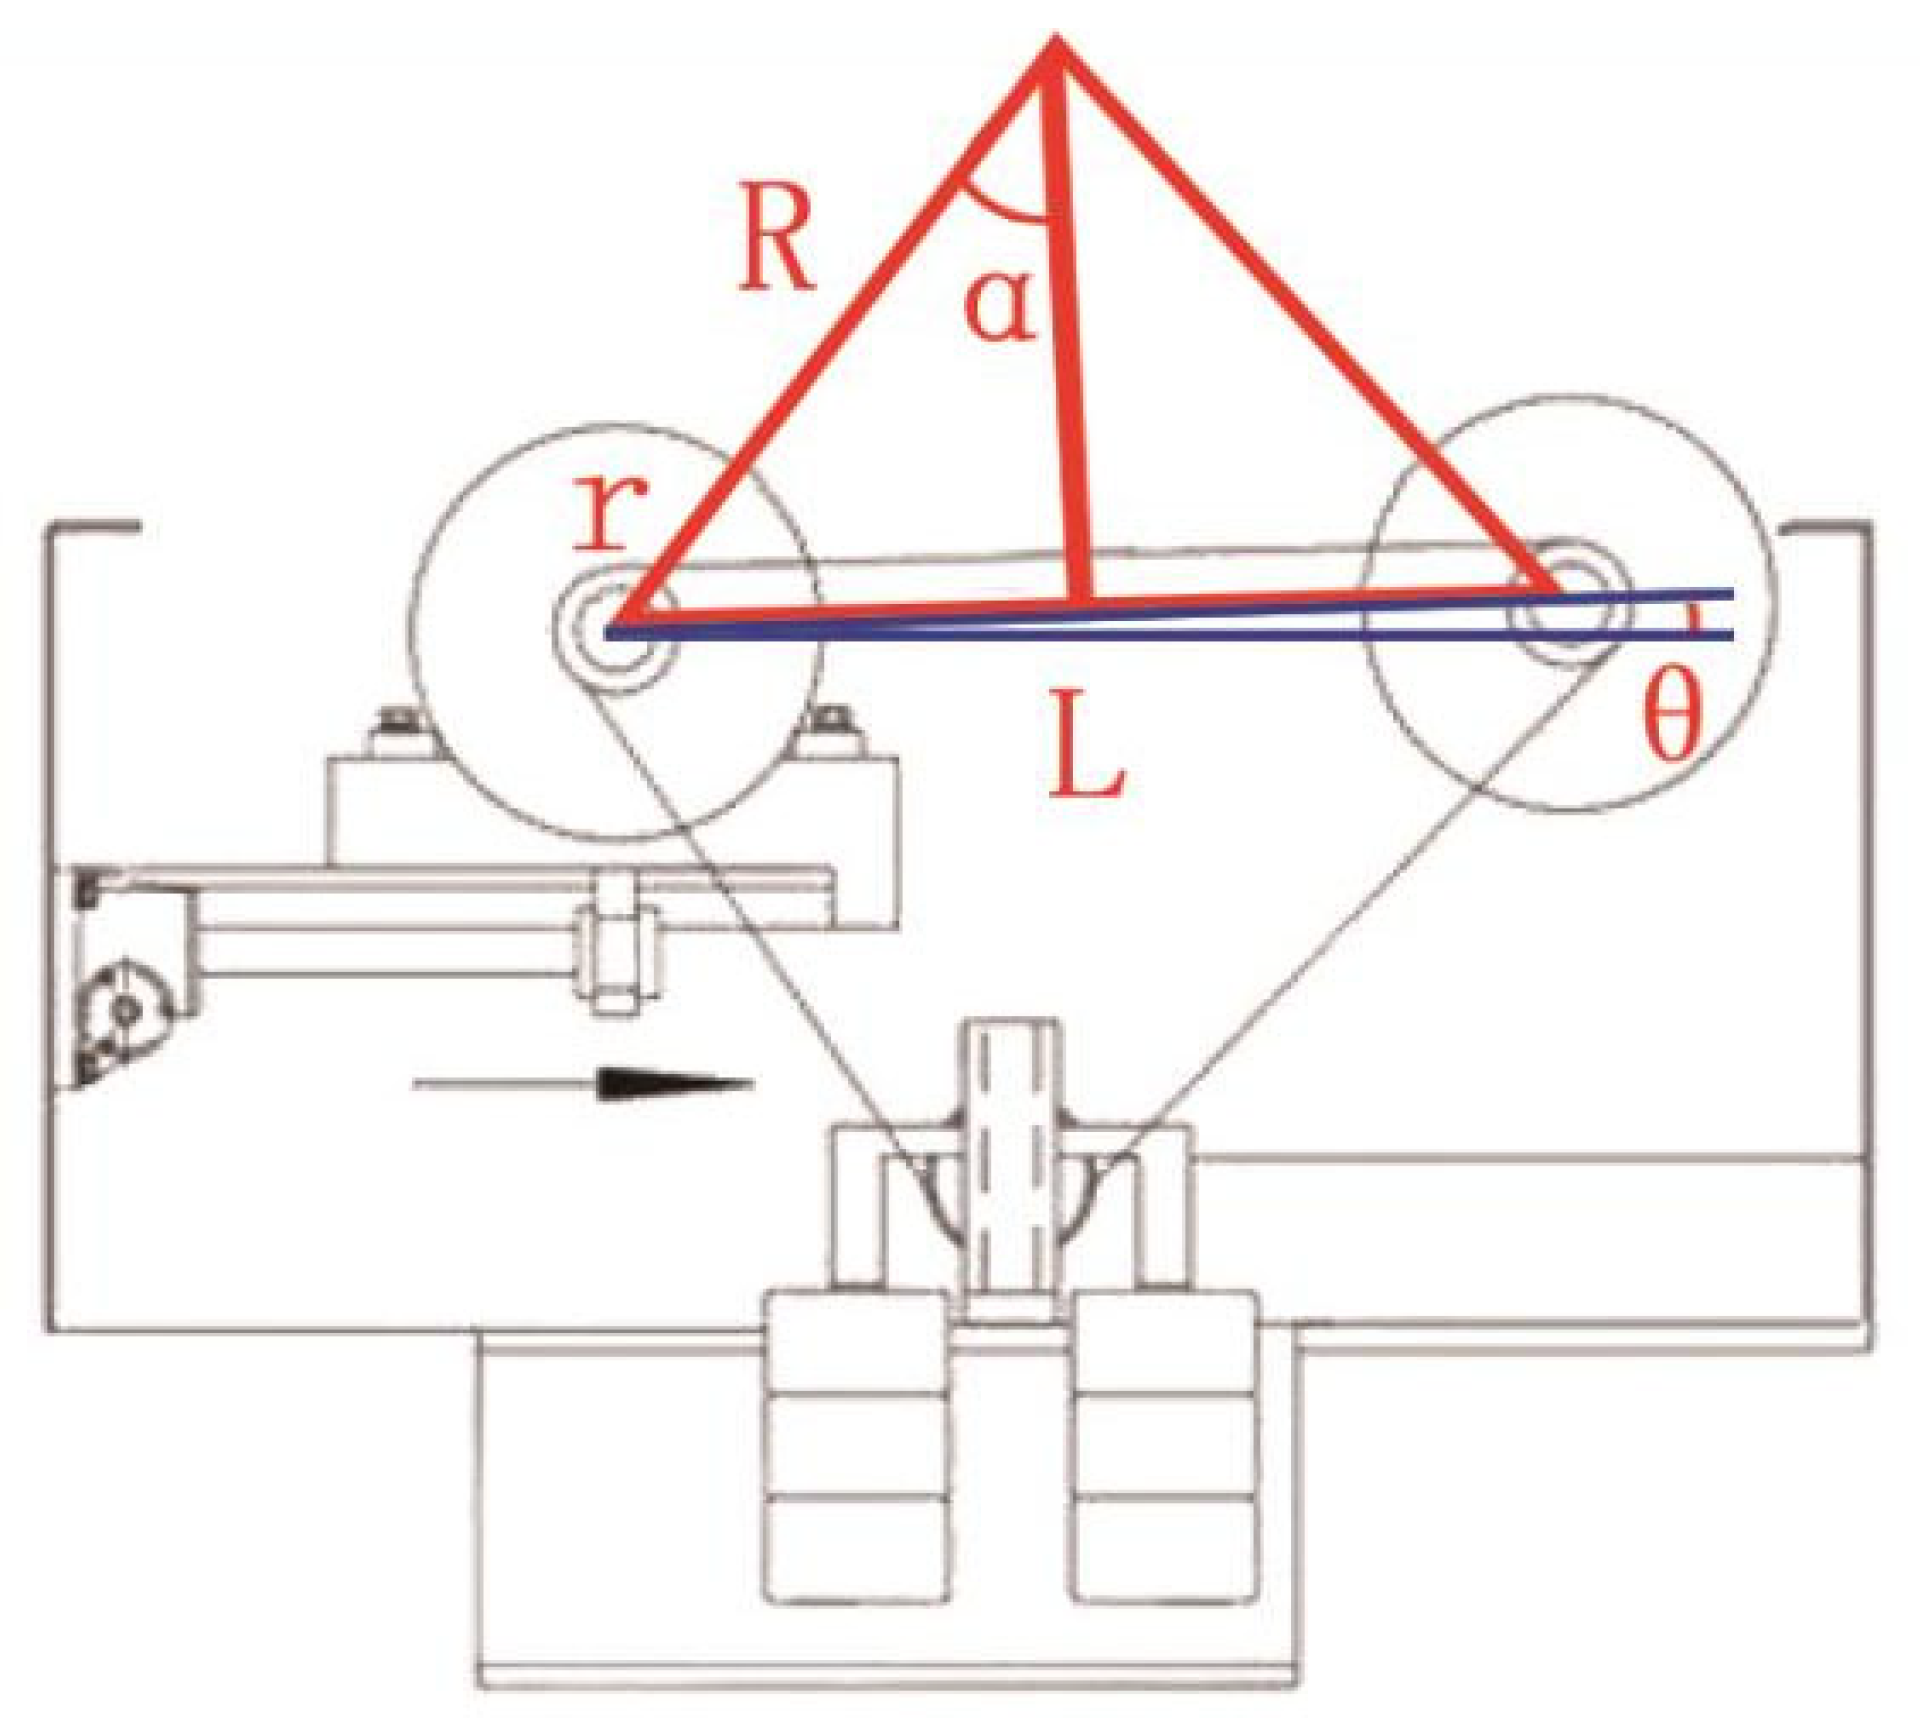
Table 11. The platform adopted a four-axle, eight-roller configuration, with an adjustable wheelbase ranging from 1.8 m to 5.0 m. Synchronous operation across all axles was achieved, with a synchronization error of less than 2 km/h, and the maximum detectable vehicle speed reached 120 km/h. The translational inertia of the vehicle body could be dynamically simulated, with the actual applied torque deviating by no more than 1 N·m from the theoretical value and a time delay of less than 10 ms, thereby significantly enhancing measurement accuracy. The adjustable center distance between the primary and secondary rollers ranged from 380 mm to 680 mm, enabling the simulation of various road surface conditions, such as dry asphalt and icy and wet surfaces, by altering the equivalent adhesion coefficient (as depicted in Figure 10, with the principles described by Equations (24) and (25)) [34]. The developed platform met the performance requirements for chassis dynamometers specified in Section 6.3.2.3 of GB/T 44500-2024, “Safety Performance Inspection Regulations for New Energy Vehicles” [35].
α = arcsin L 2 ( R + r ) ,
μ = ( cos θ + φ sin θ ) ( 1 + φ 2 ) cos α φ ,
where r is radius of the primary and secondary rollers (mm); L is the center distance between the primary and secondary rollers (mm); θ is angular difference in the height of the rotational axes of the primary and secondary rollers (degree); R is the radius of the vehicle wheel (mm); and α is installation angle of the vehicle wheel (degree).
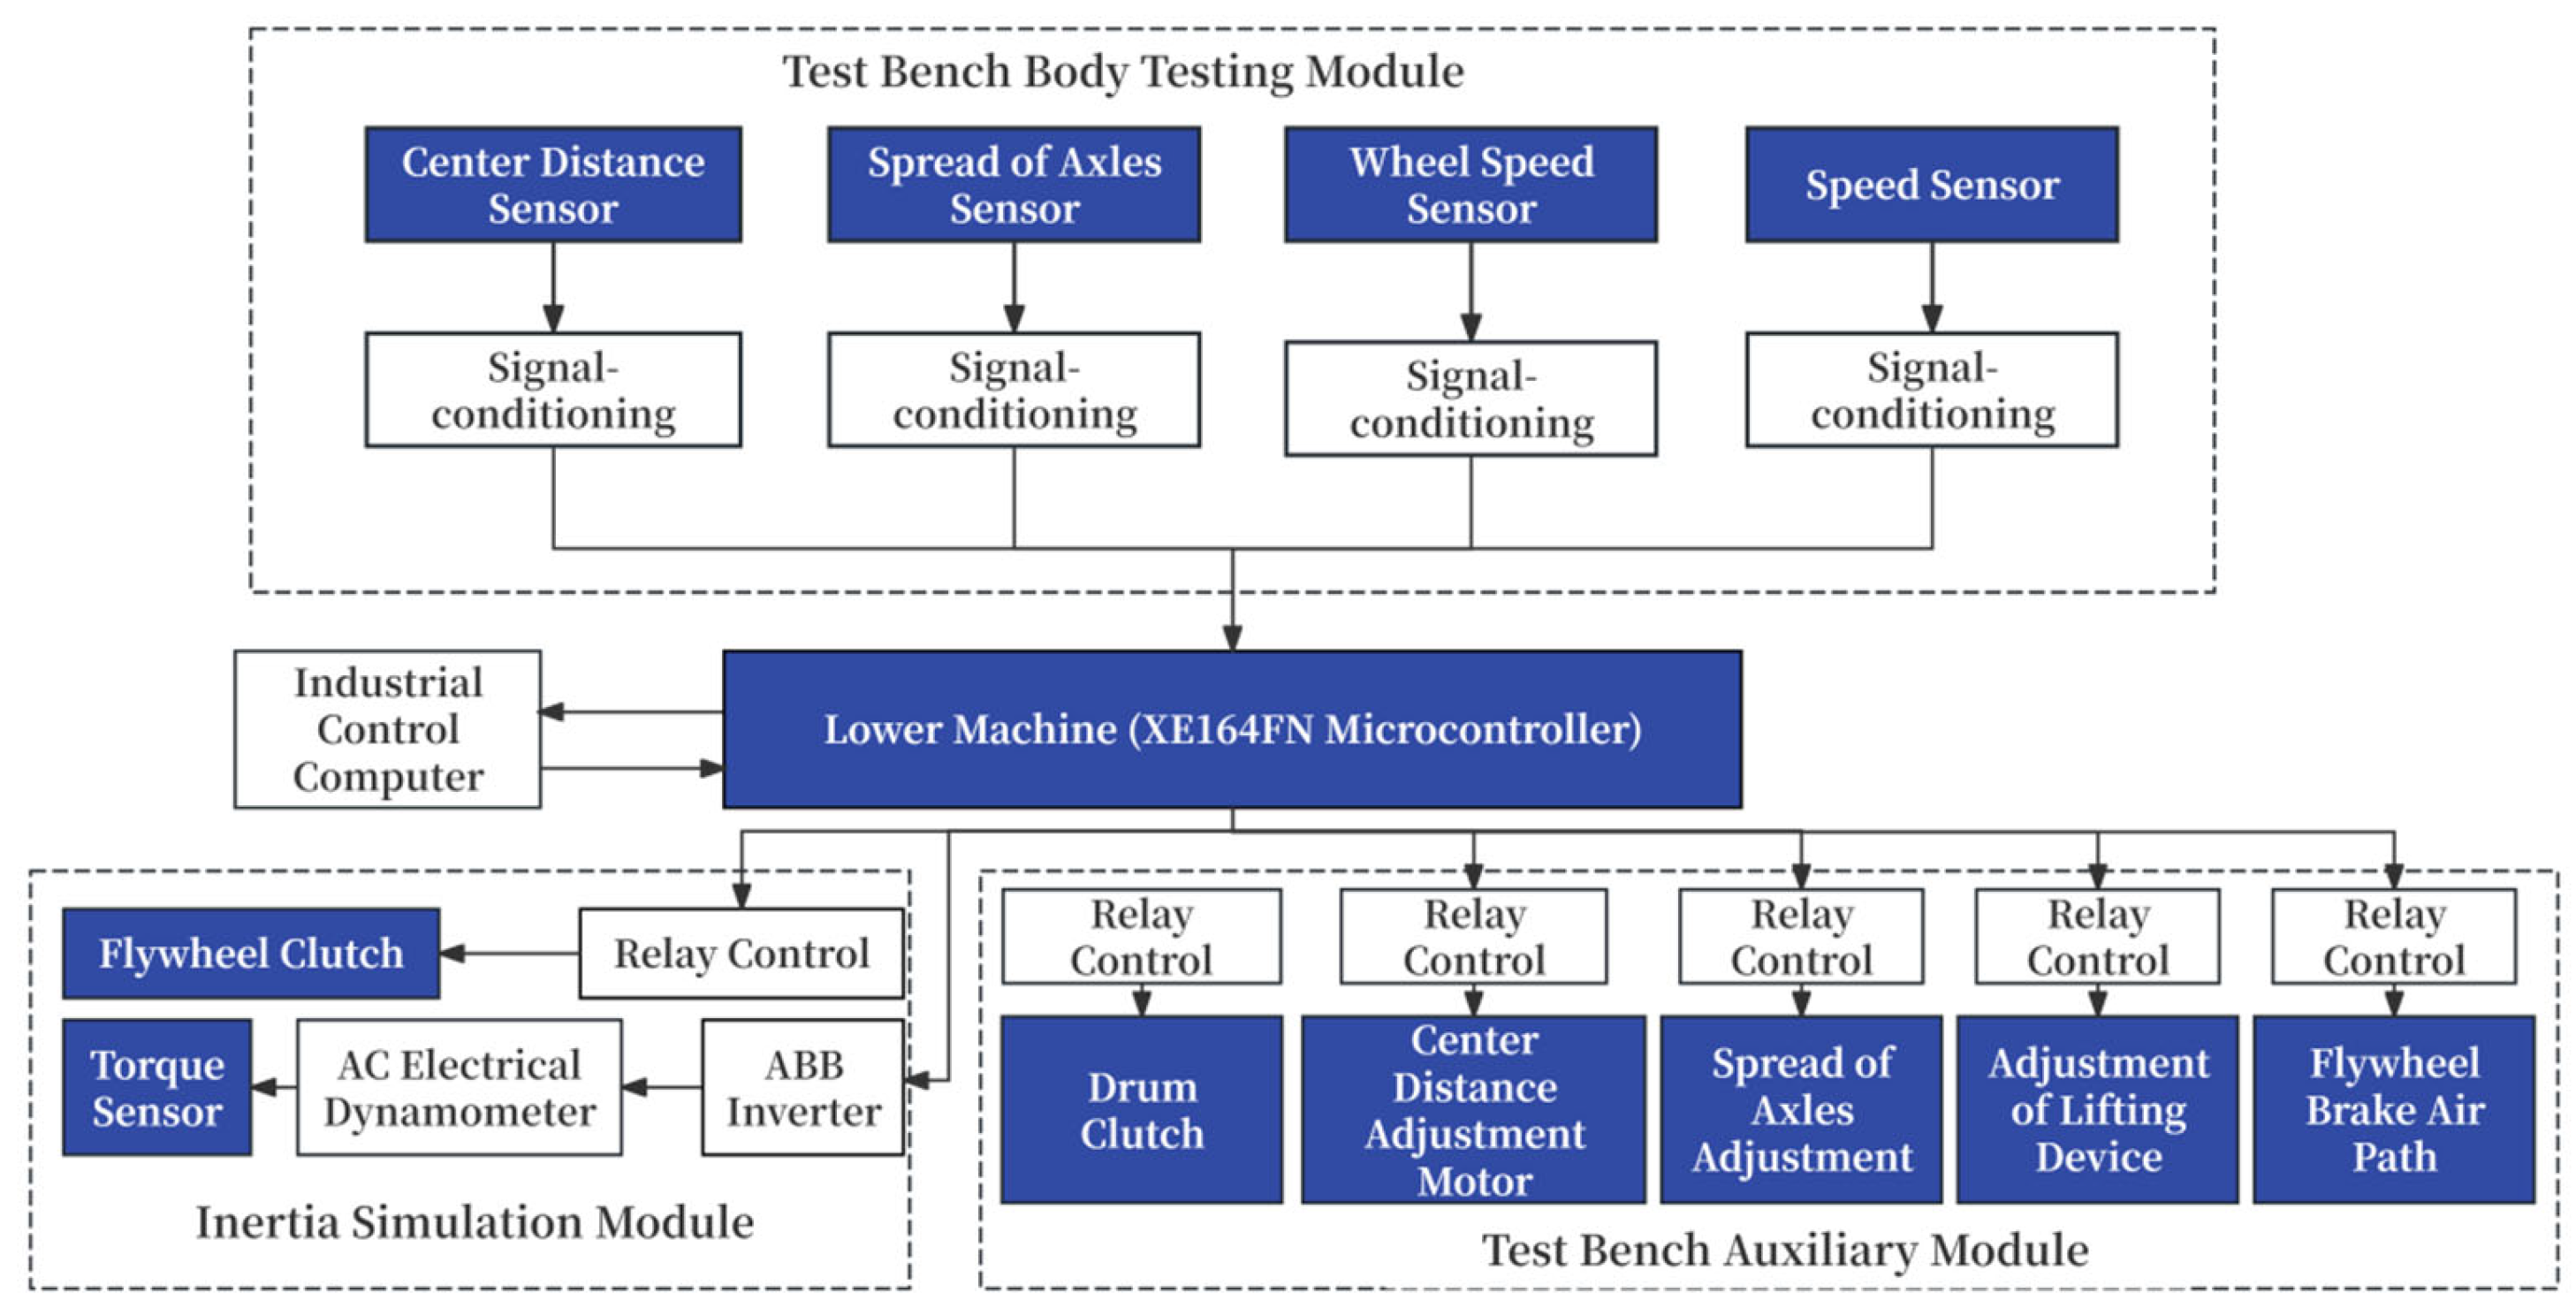
The measurement and control system served as the core component of the AEB system performance testing platform, comprising two main parts: the upper computer system and the lower system. The upper computer system was primarily responsible for vehicle information registration, vehicle detection, control command issuance for the test bench, and the processing and storage of experimental results. The lower computer system mainly consisted of a microcontroller unit, sensors, relay control units, and a detection indication circuit. The main microcontroller chip was selected to be the XE164FN, a 16-bit microcontroller from the XE166 series developed by Infineon Technologies. The overall structure of the measurement and control system is illustrated in Figure 11, and the testing procedure is depicted in Figure 12.

3.2. Test Preparation

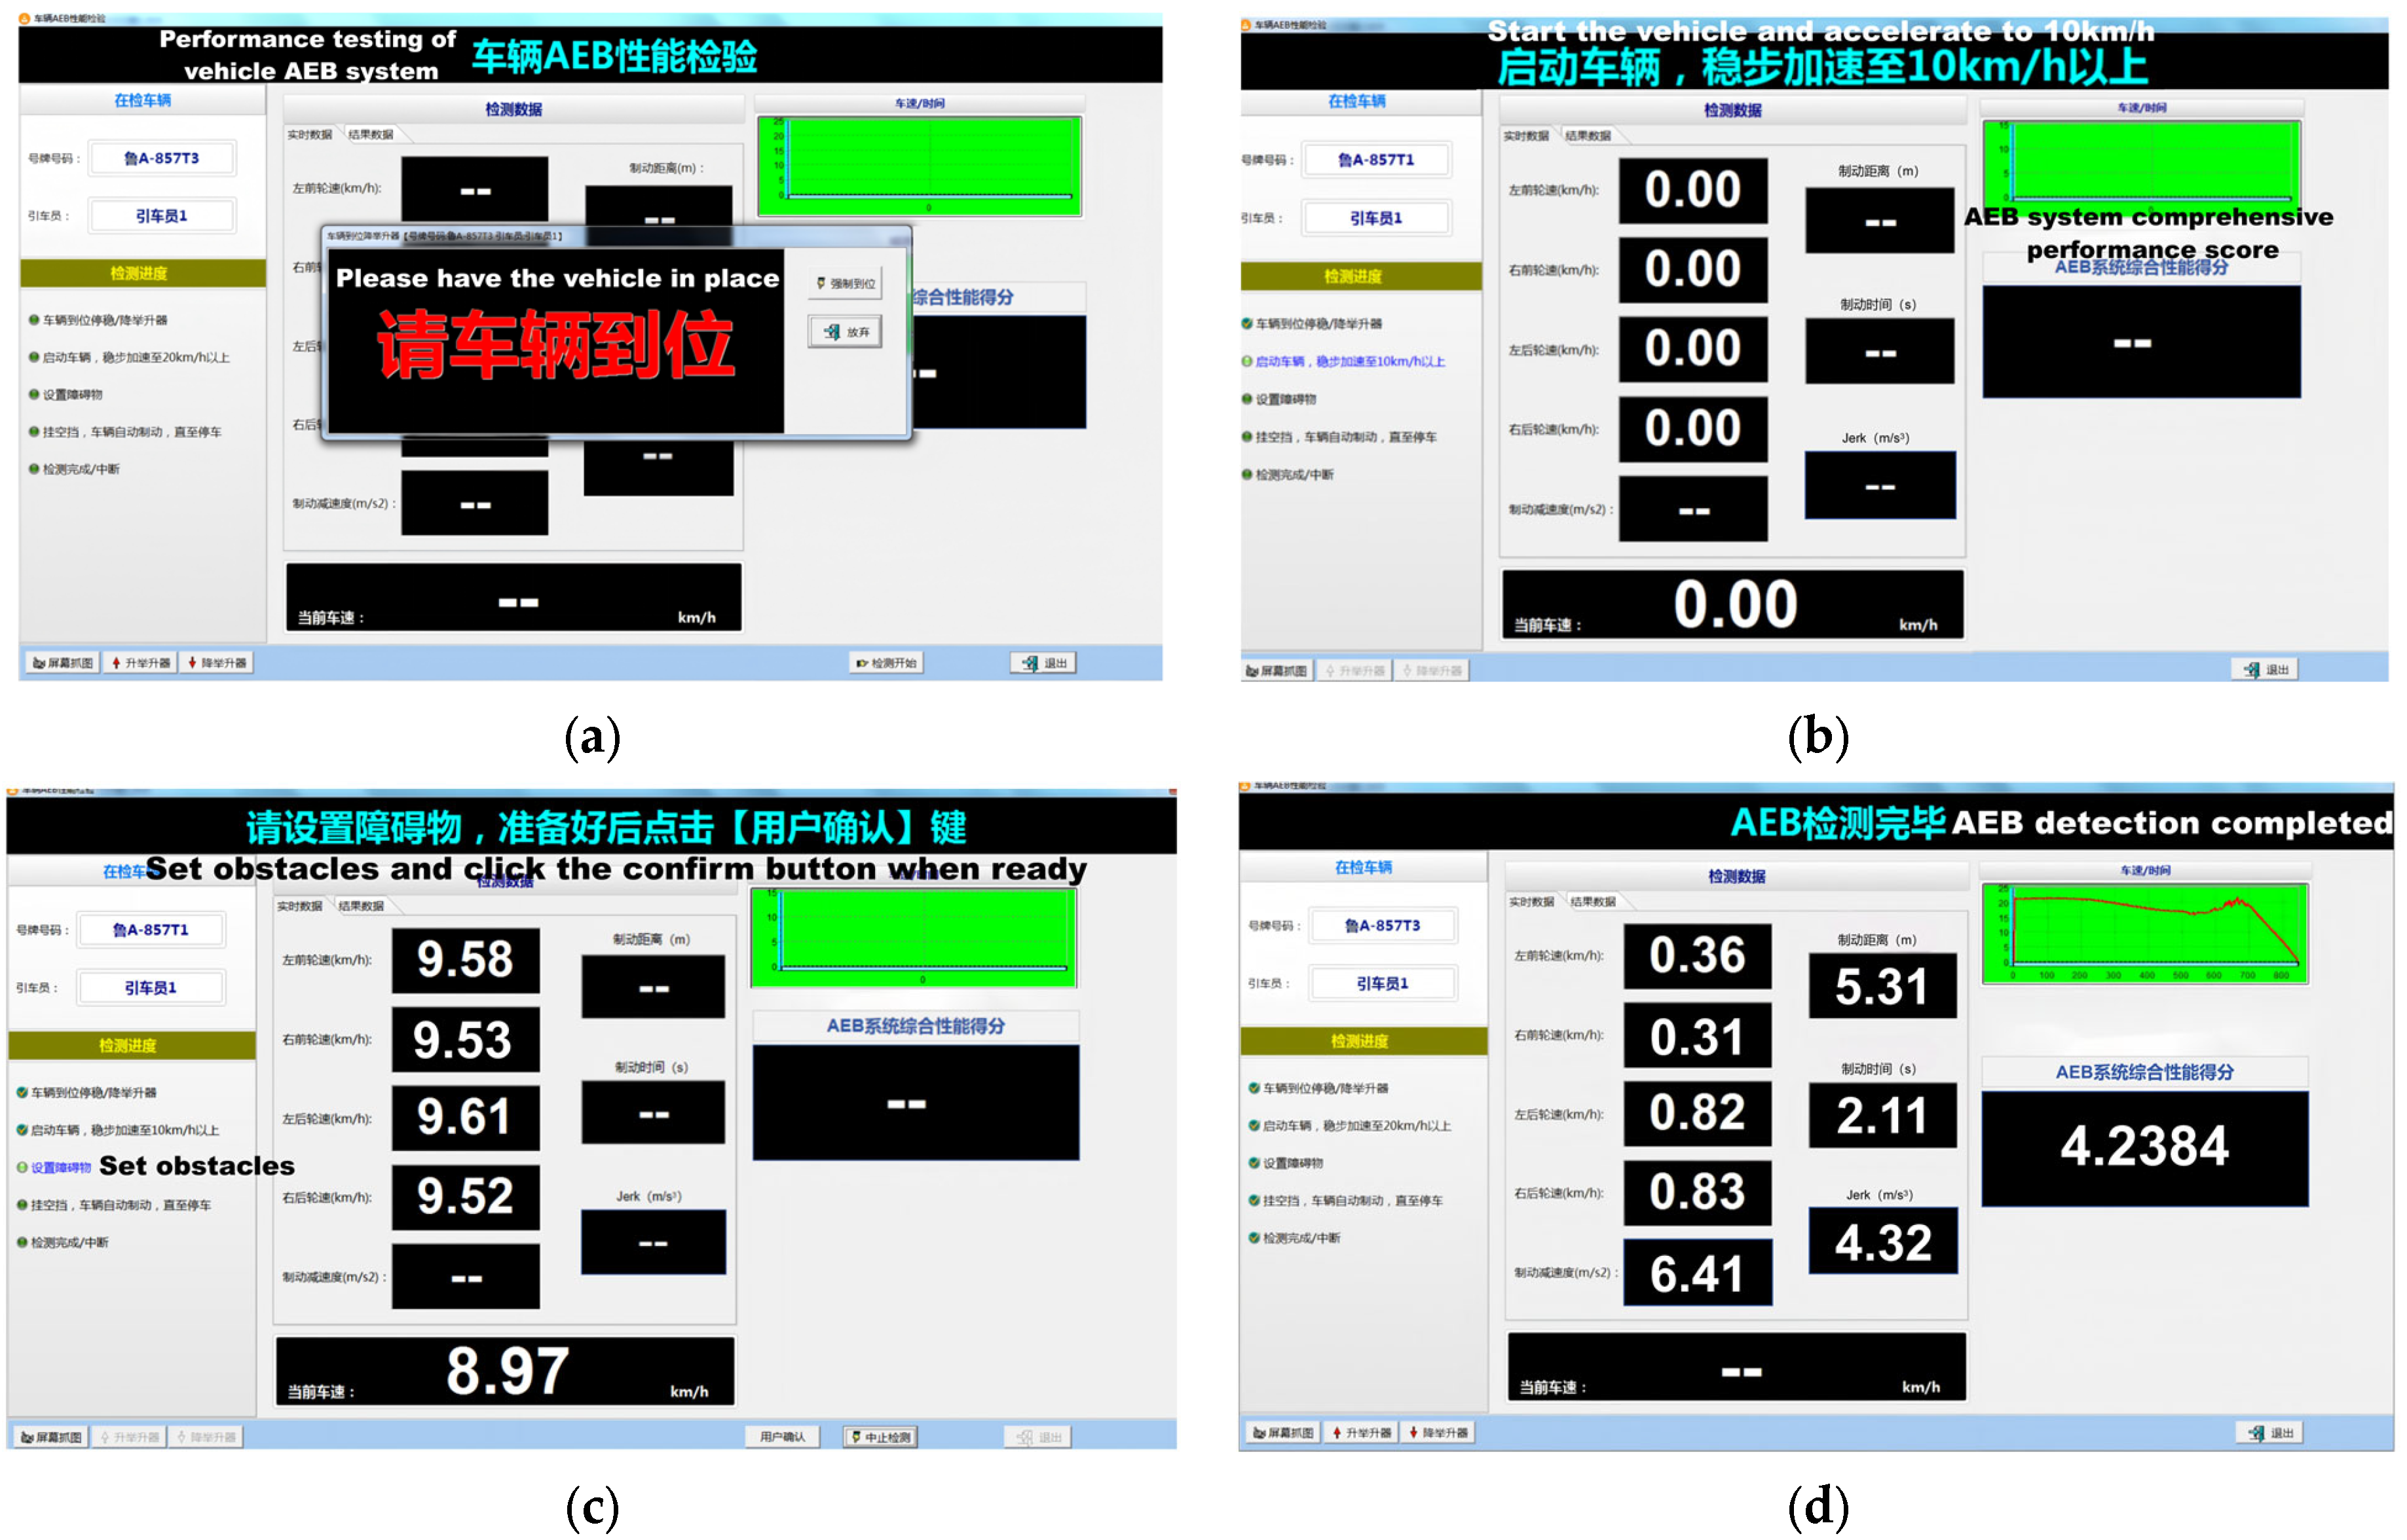
Figure 13 illustrates the real-time display of critical parameters and system statuses on the upper computer interface, which facilitated continuous monitoring and ensured the reliability of the experimental operations.
  • The test vehicle and the target object.
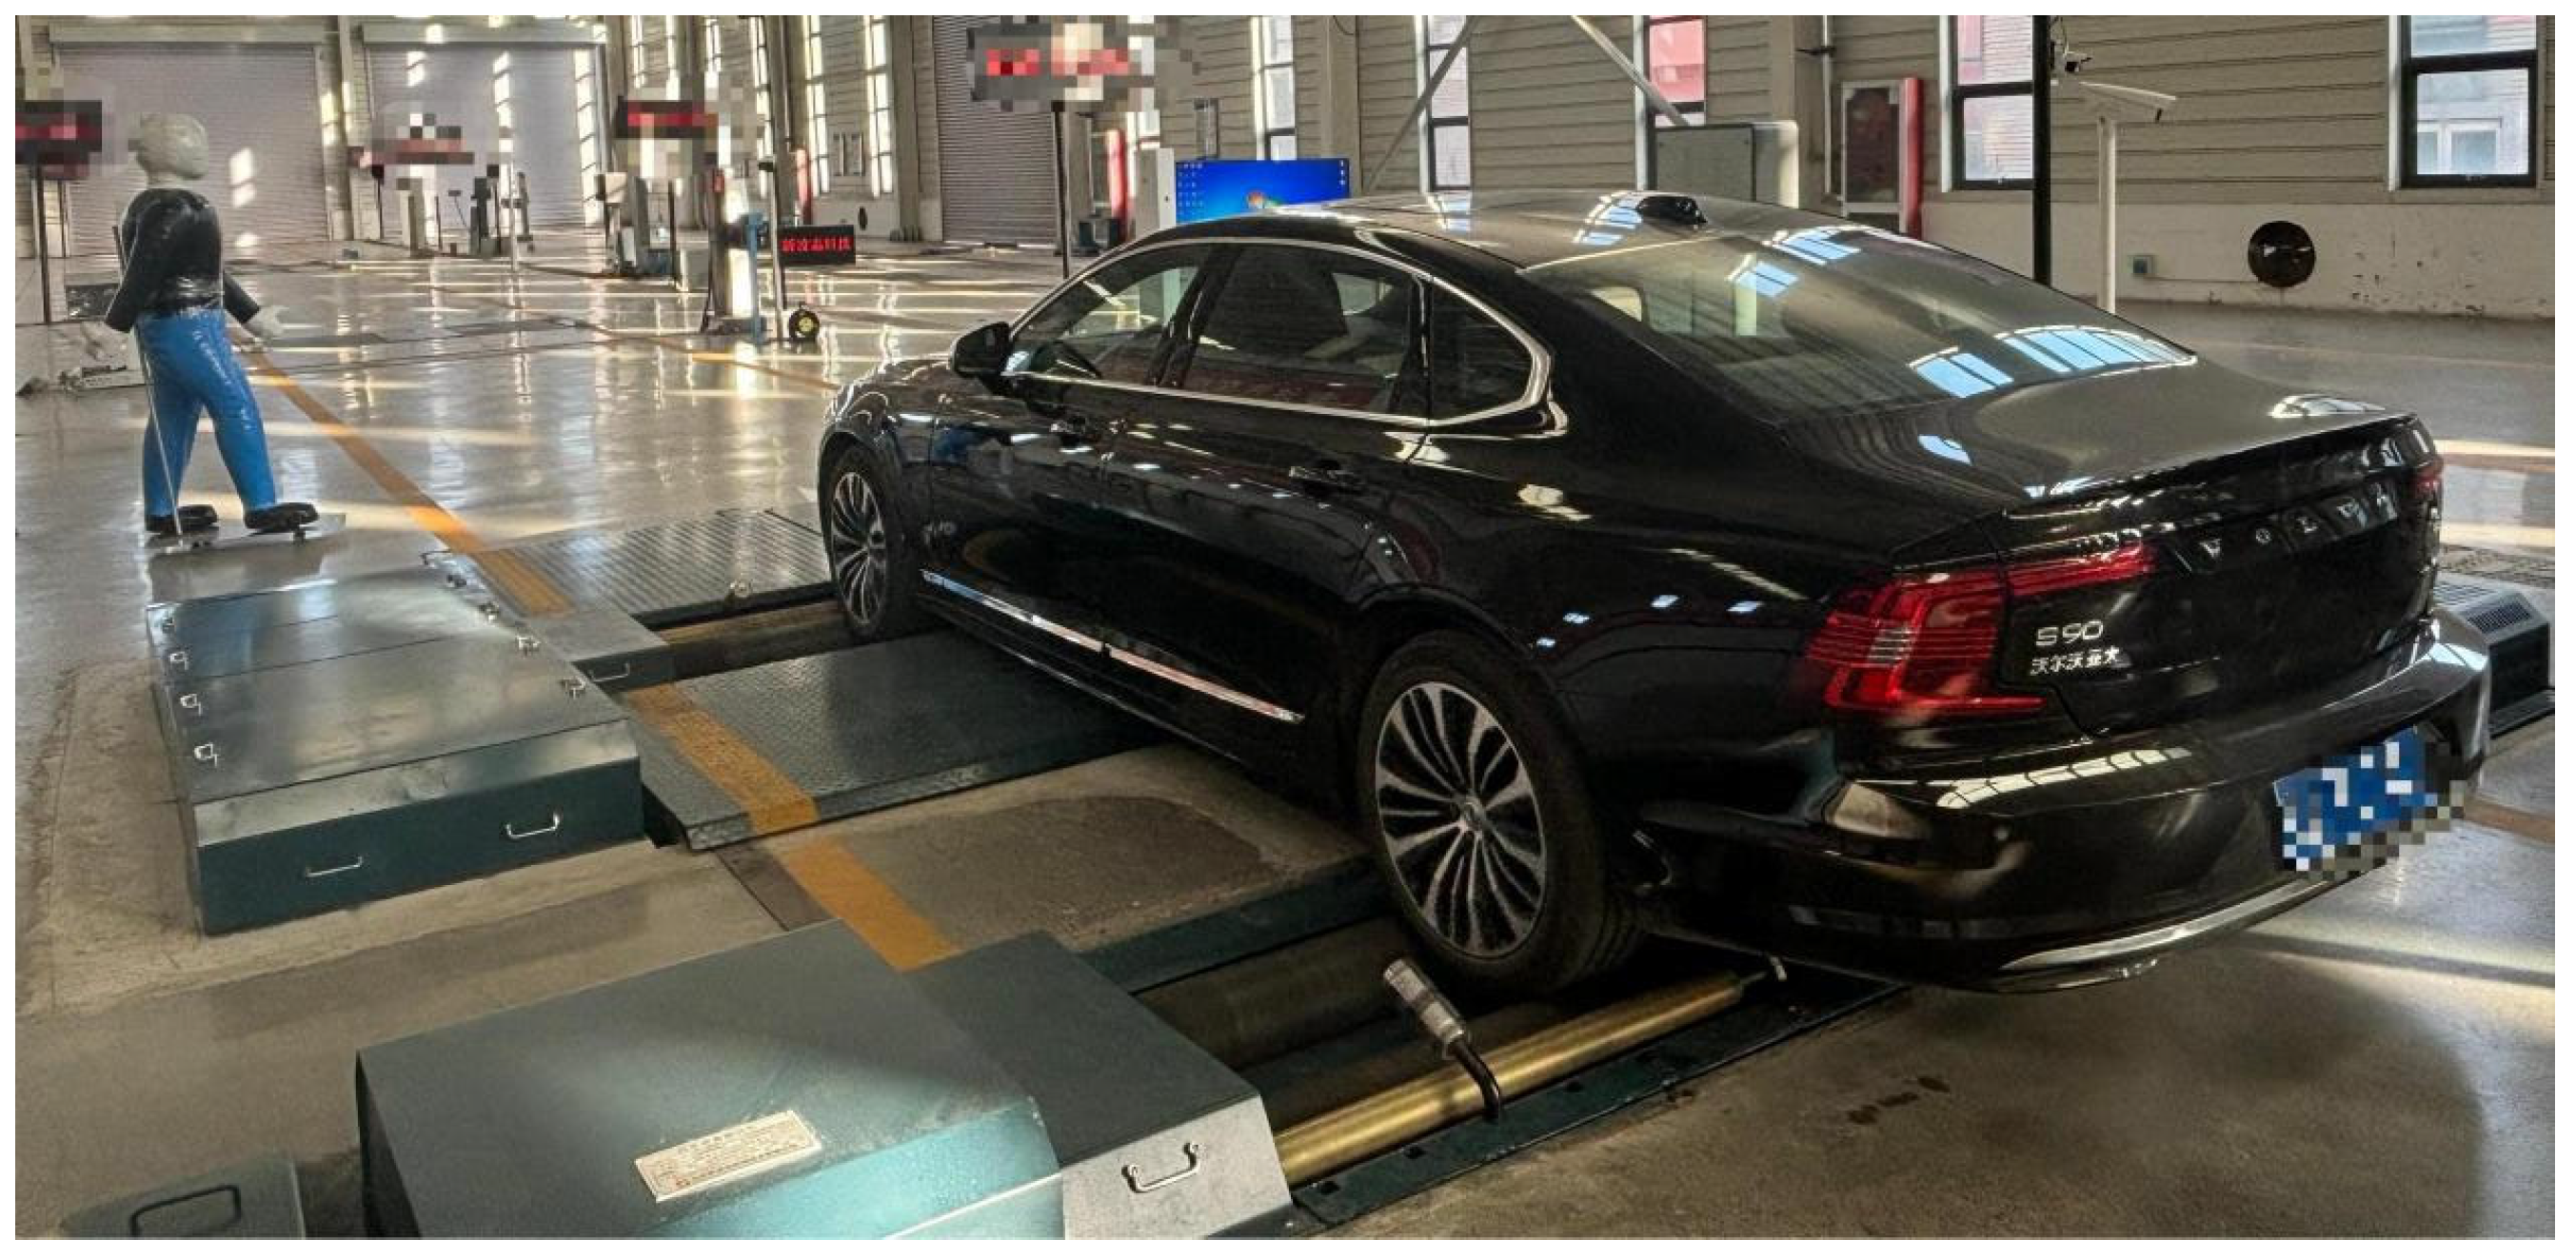
The Volvo S90L model was selected as the tested vehicle. As a brand distinguished by its leading position in automotive safety, Volvo adopted the City Safety system as the AEB control strategy for this model. The key specifications of the vehicle are listed in Table 12.
A movable adult dummy was employed as the target object. The dummy’s external surface was designed to closely replicate the morphological features of an actual pedestrian, with all constituent parts detectable by the sensors of the vehicle. It was capable of realistically emulating pedestrian motion, thereby satisfying the demands of diverse testing scenarios and ensuring the validity of the experimental results.
2.
Development of testing scenarios and operational conditions.
The testing scenario was established under sufficient daylight conditions, where the VRU crossed the roadway at an intersection. The corresponding operational conditions are detailed in Table 13, and the layout of the testing scenario is depicted in Figure 14.
3.
Equivalence of translational mass and mechanical inertia.
During vehicle testing on the test platform, it was necessary to simulate the inertial resistance experienced by the vehicle during actual road driving by means of the rotational inertia of the bench. This process was based on the principle of kinetic energy equivalence, requiring that the translational mass be matched to the mechanical inertia. To guarantee the accuracy and reliability of the experimental results, the curb mass m (comprising the vehicle mass and the driver’s mass) of the vehicle was converted into the equivalent rotational inertia of the rollers and flywheels prior to testing.
Upon weighing, the curb mass m was found to be 1864 kg. The test platform provided a fixed mechanical inertia equivalent to 1021 kg. Three independently controllable mechanical flywheels, each contributing 220 kg of equivalent mass, were available, in addition to an AC dynamometer capable of continuously adjustable torque control to simulate translational inertia within the range of −220 kg to 220 kg. Accordingly, all three flywheels were engaged during the preparation phase (totaling 660 kg of equivalent mass), and the remaining 163 kg was compensated for via electrical inertia adjustment, thereby achieving an accurate match between the translational mass of the vehicle and the mechanical inertia of the test platform.

3.3. Testing

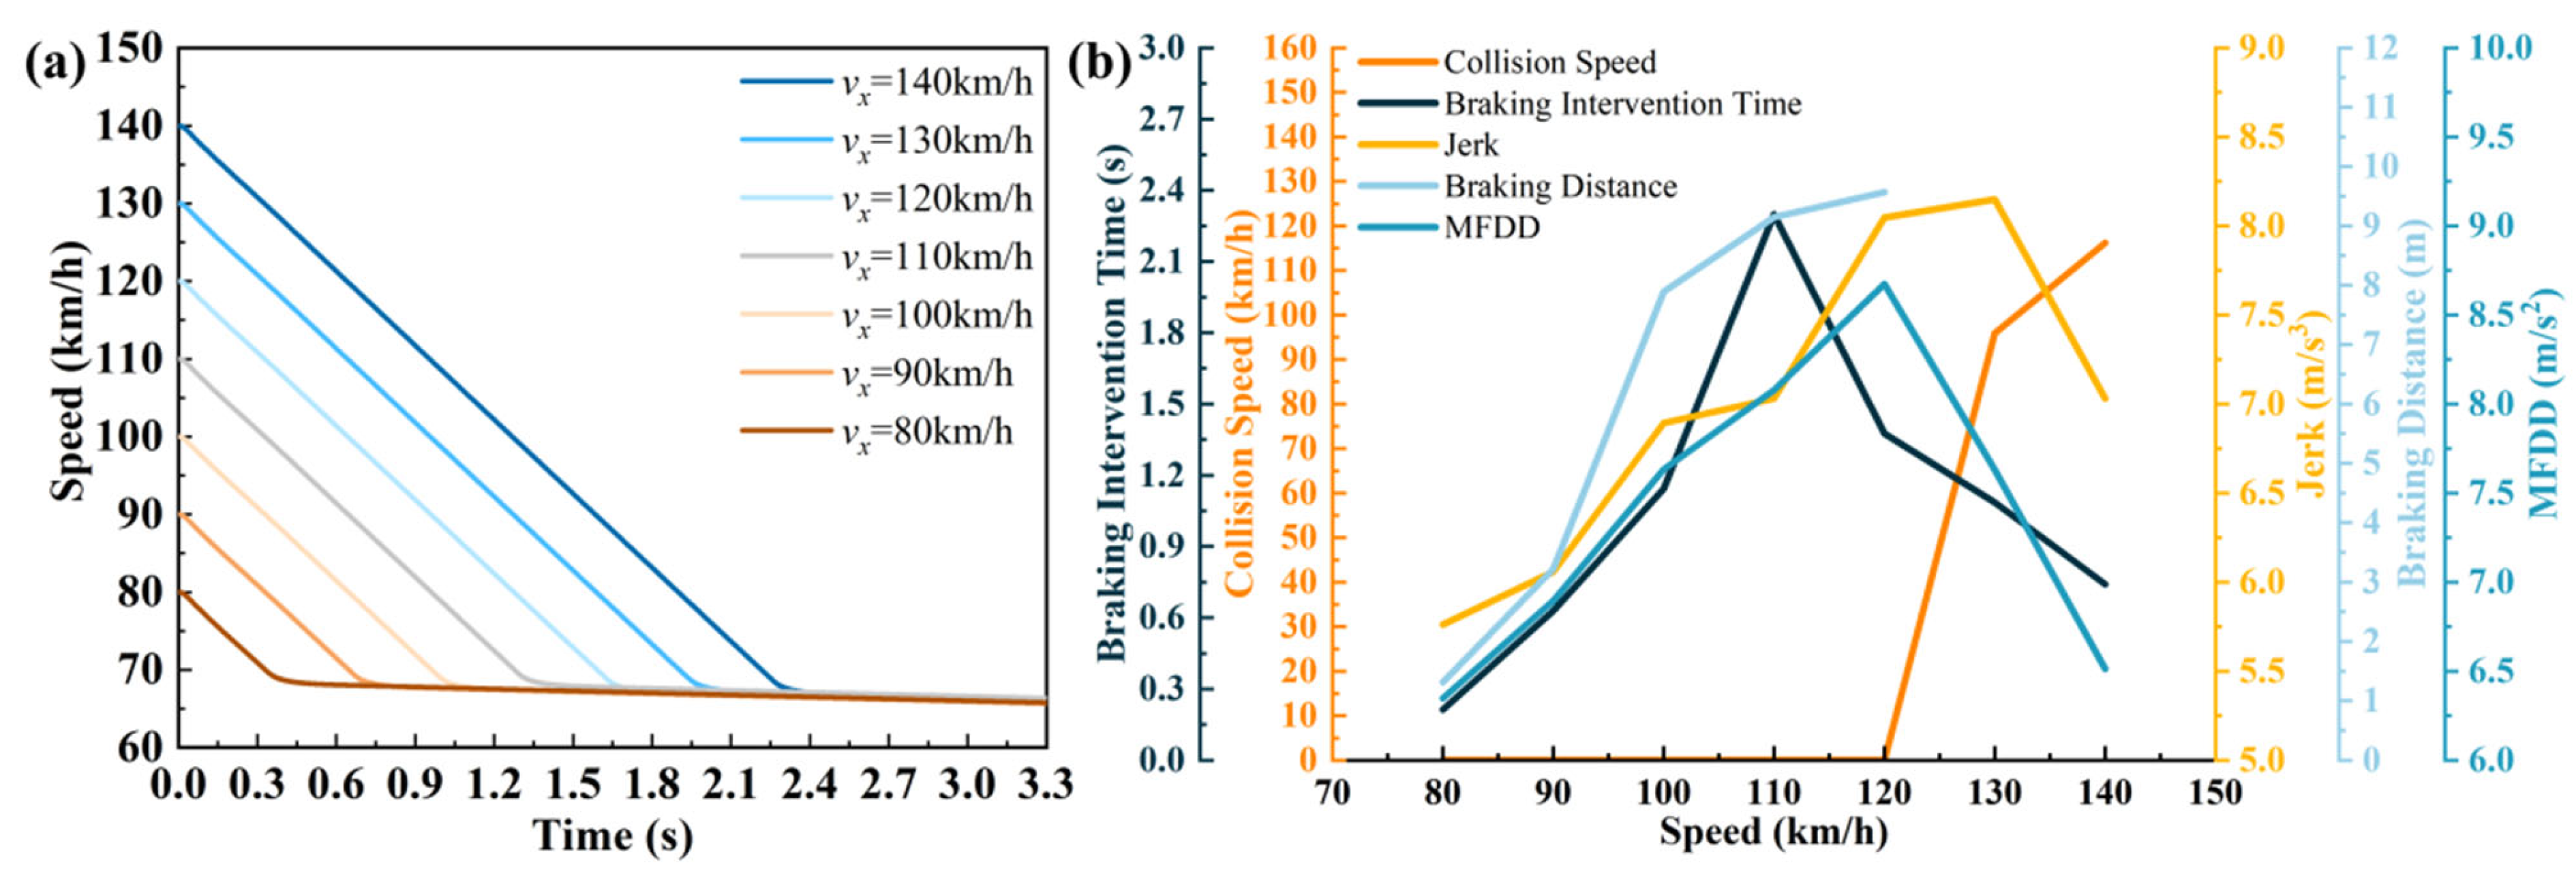
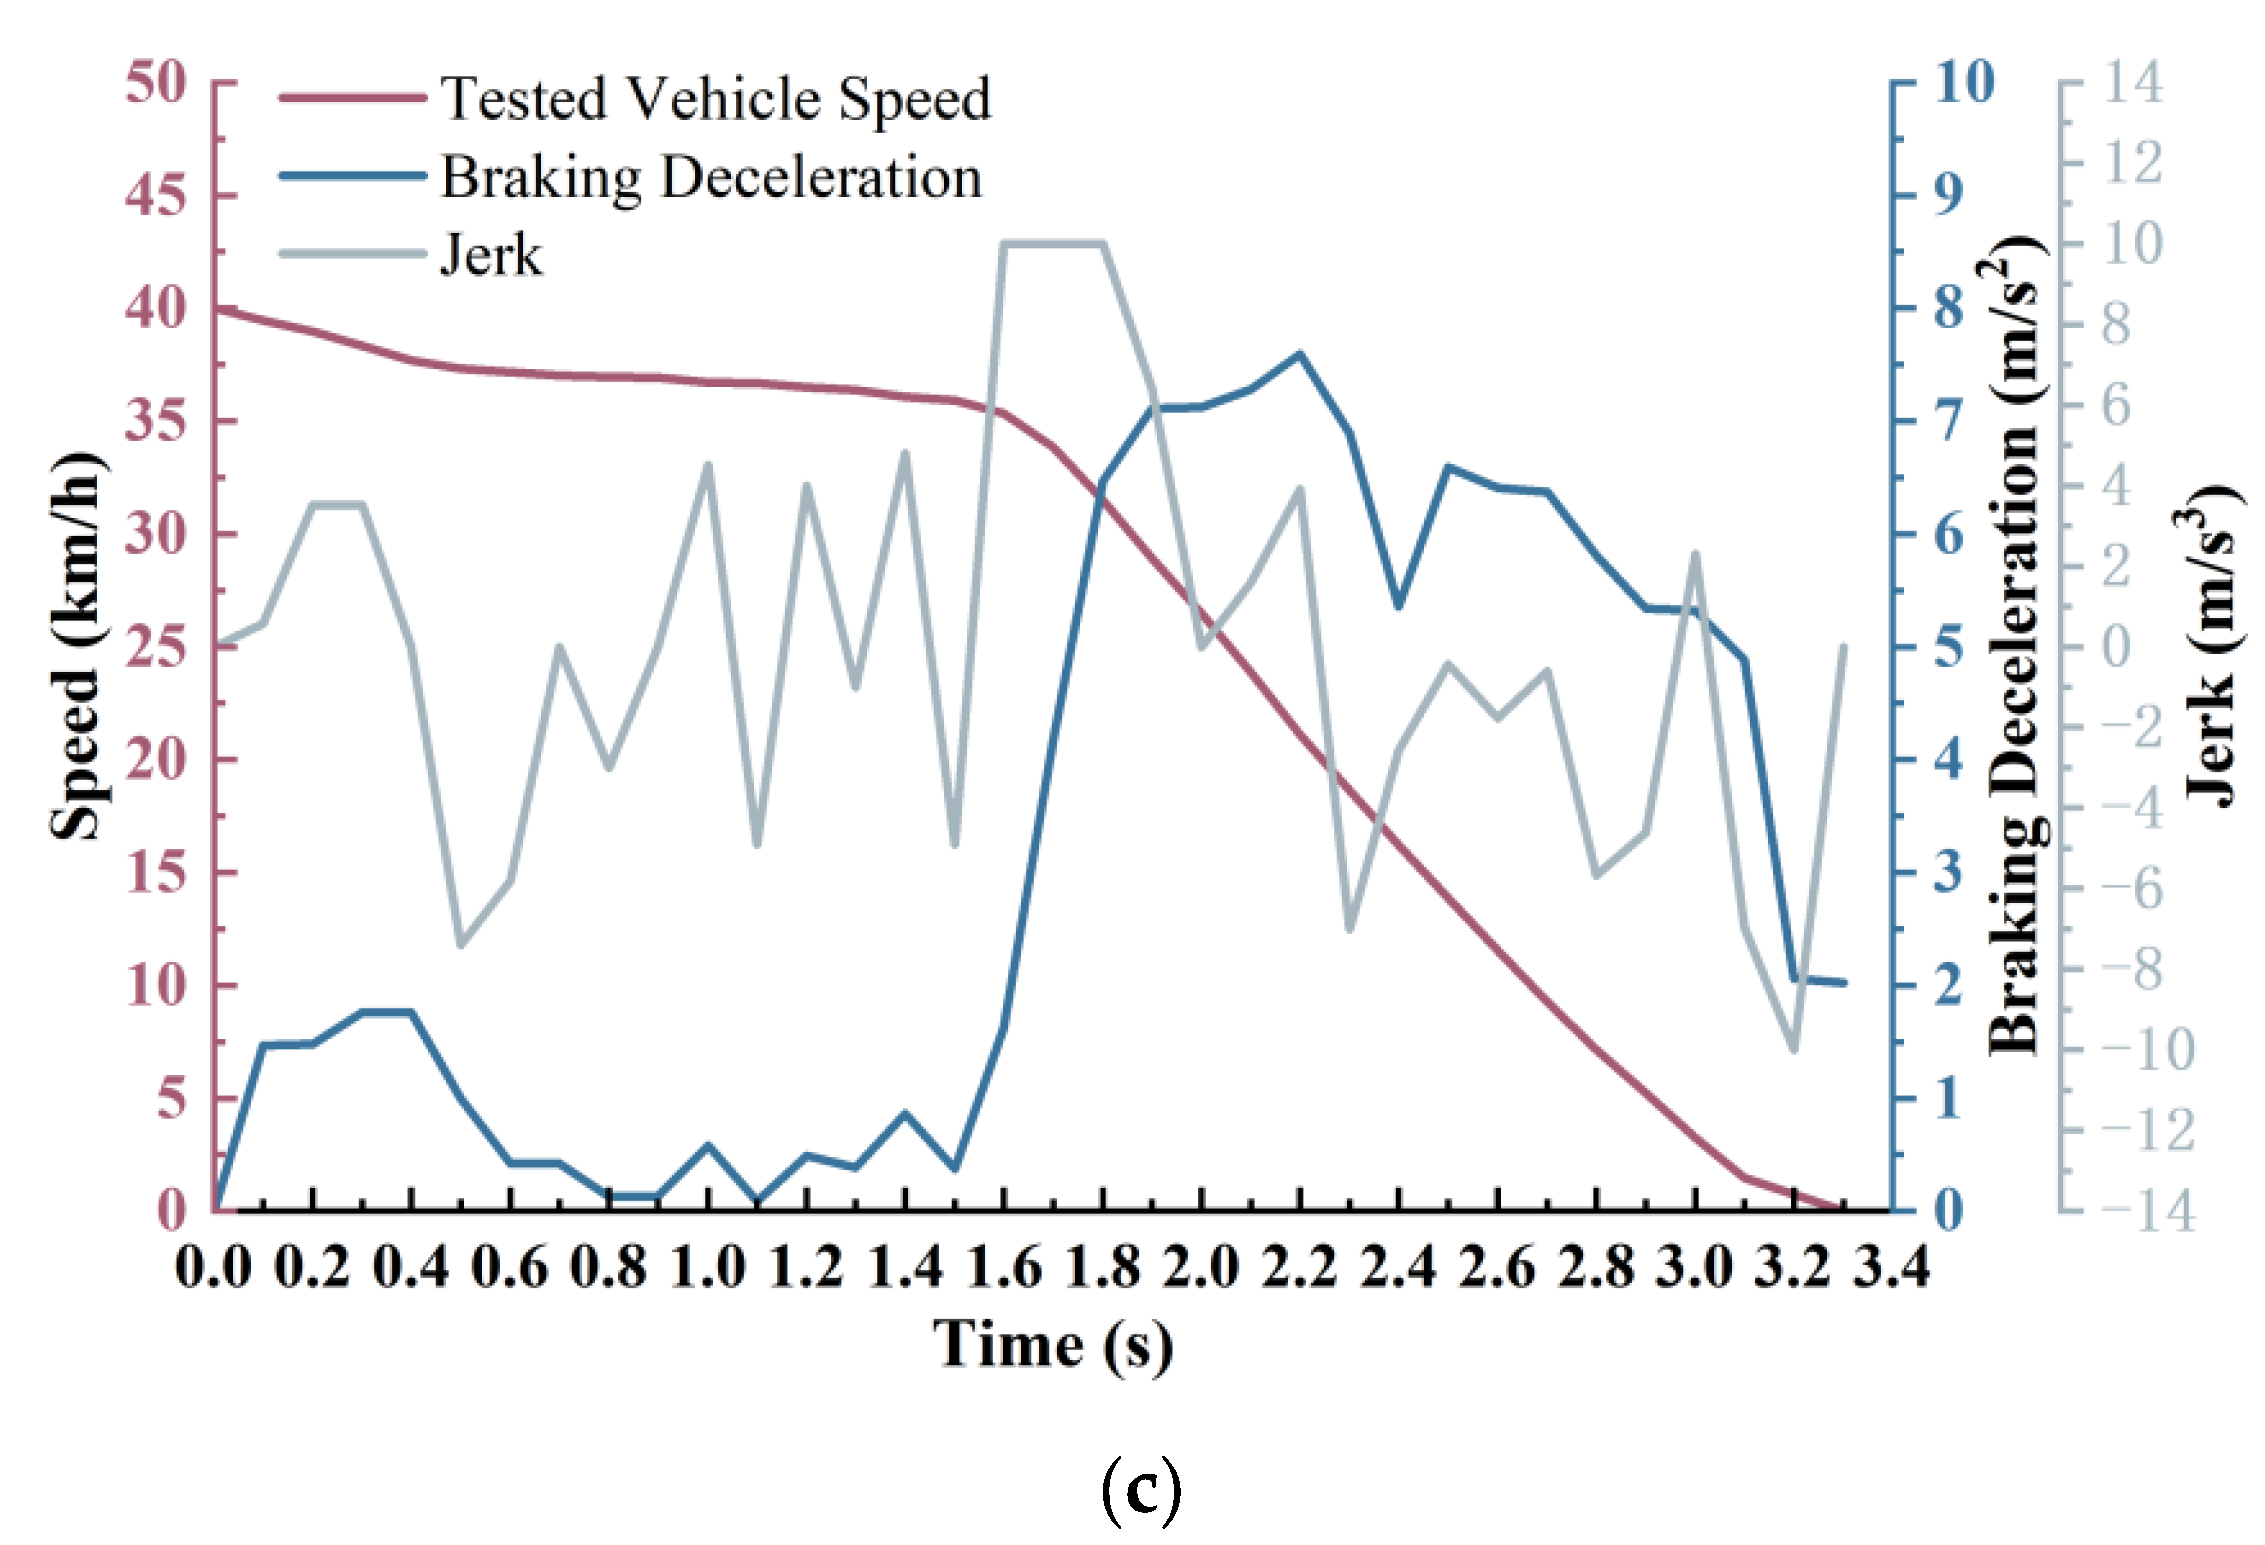
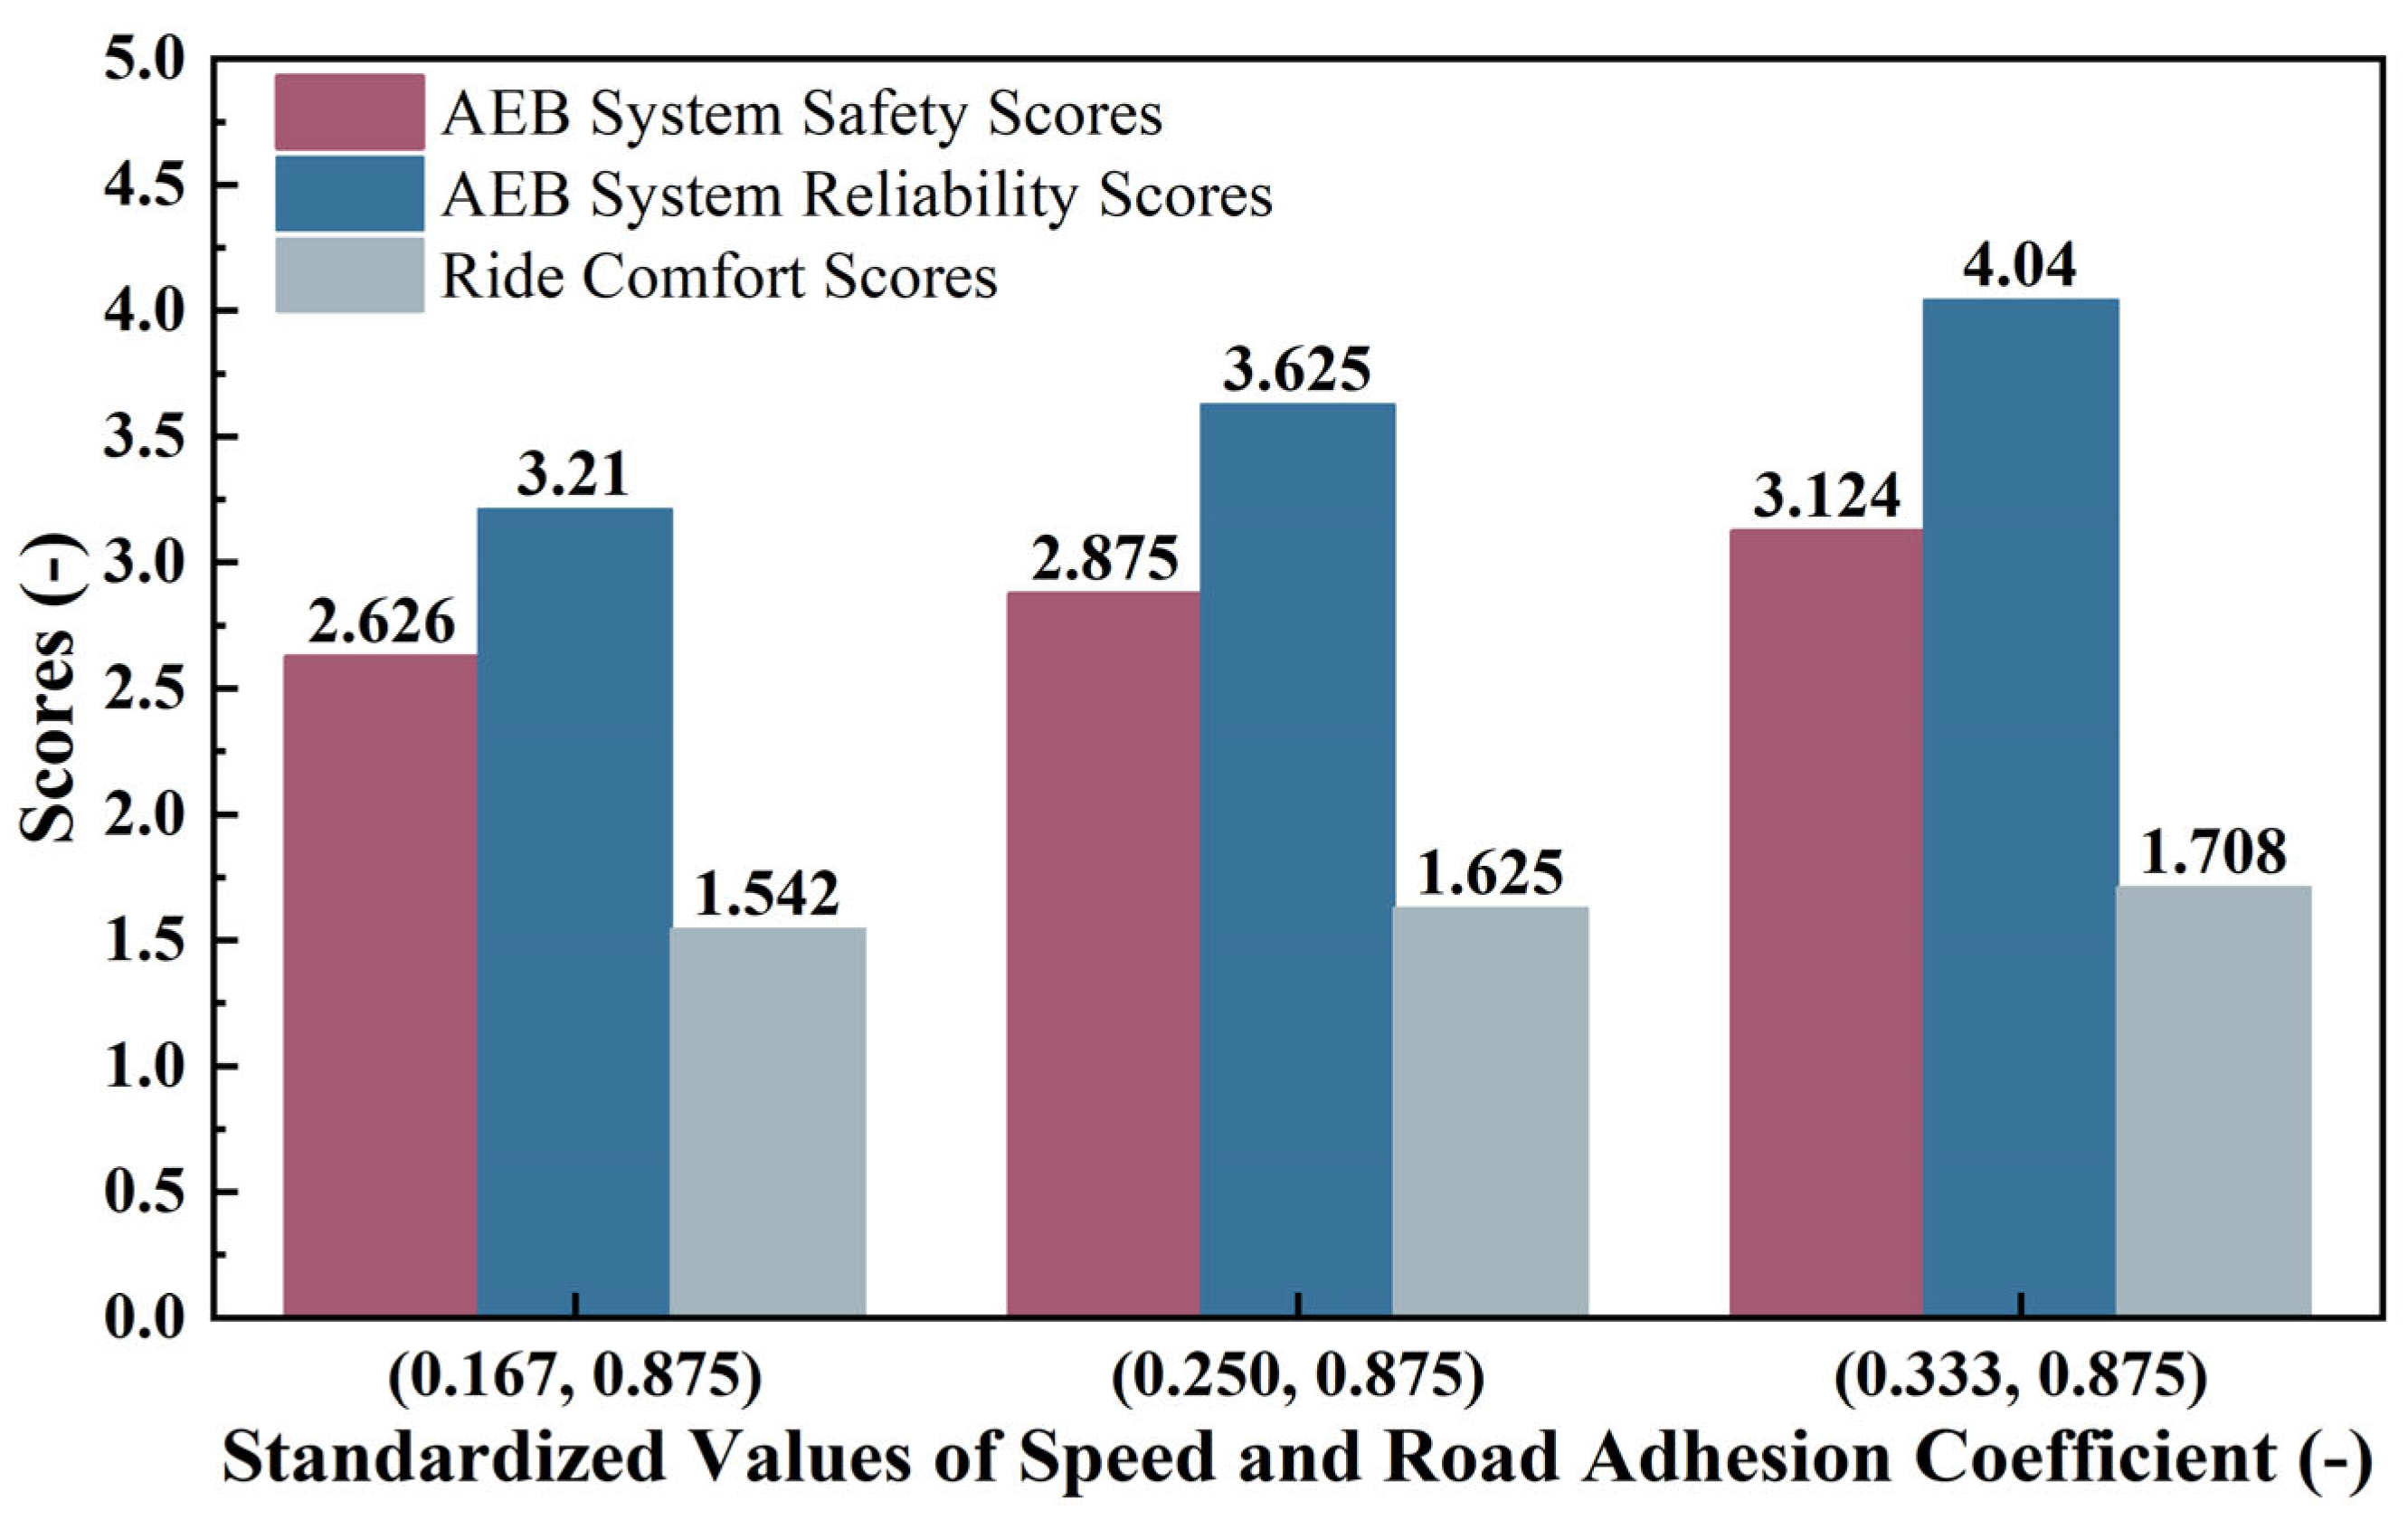
Real-time data, including vehicle speed, wheel speed, braking deceleration, braking time, and braking distance, were recorded by the test platform. These data served as the scoring basis for braking distance, braking deceleration, collision speed, AEB system braking intervention time, and acceleration variation rate within the DWAHP model scheme layer. To characterize both the average level and the stability of deceleration during braking, braking deceleration was represented in the form of the MFDD, where a larger MFDD indicated a stronger braking performance. The average acceleration variation rate was employed to describe the severity of acceleration fluctuations over time, serving as a core indicator for assessing motion smoothness and ride comfort. A lower Jerk value corresponded to smoother acceleration transitions and a reduced perception of jolting or abrupt surge sensations by occupants. Accordingly, the average acceleration variation rate was output as a key metric. During the test, continuous in-vehicle video recording was performed to monitor the activation of warnings, initiation of braking, and real-time speed changes of the vehicle, thereby ensuring the accuracy of the measured collision speed and AEB system braking intervention time.
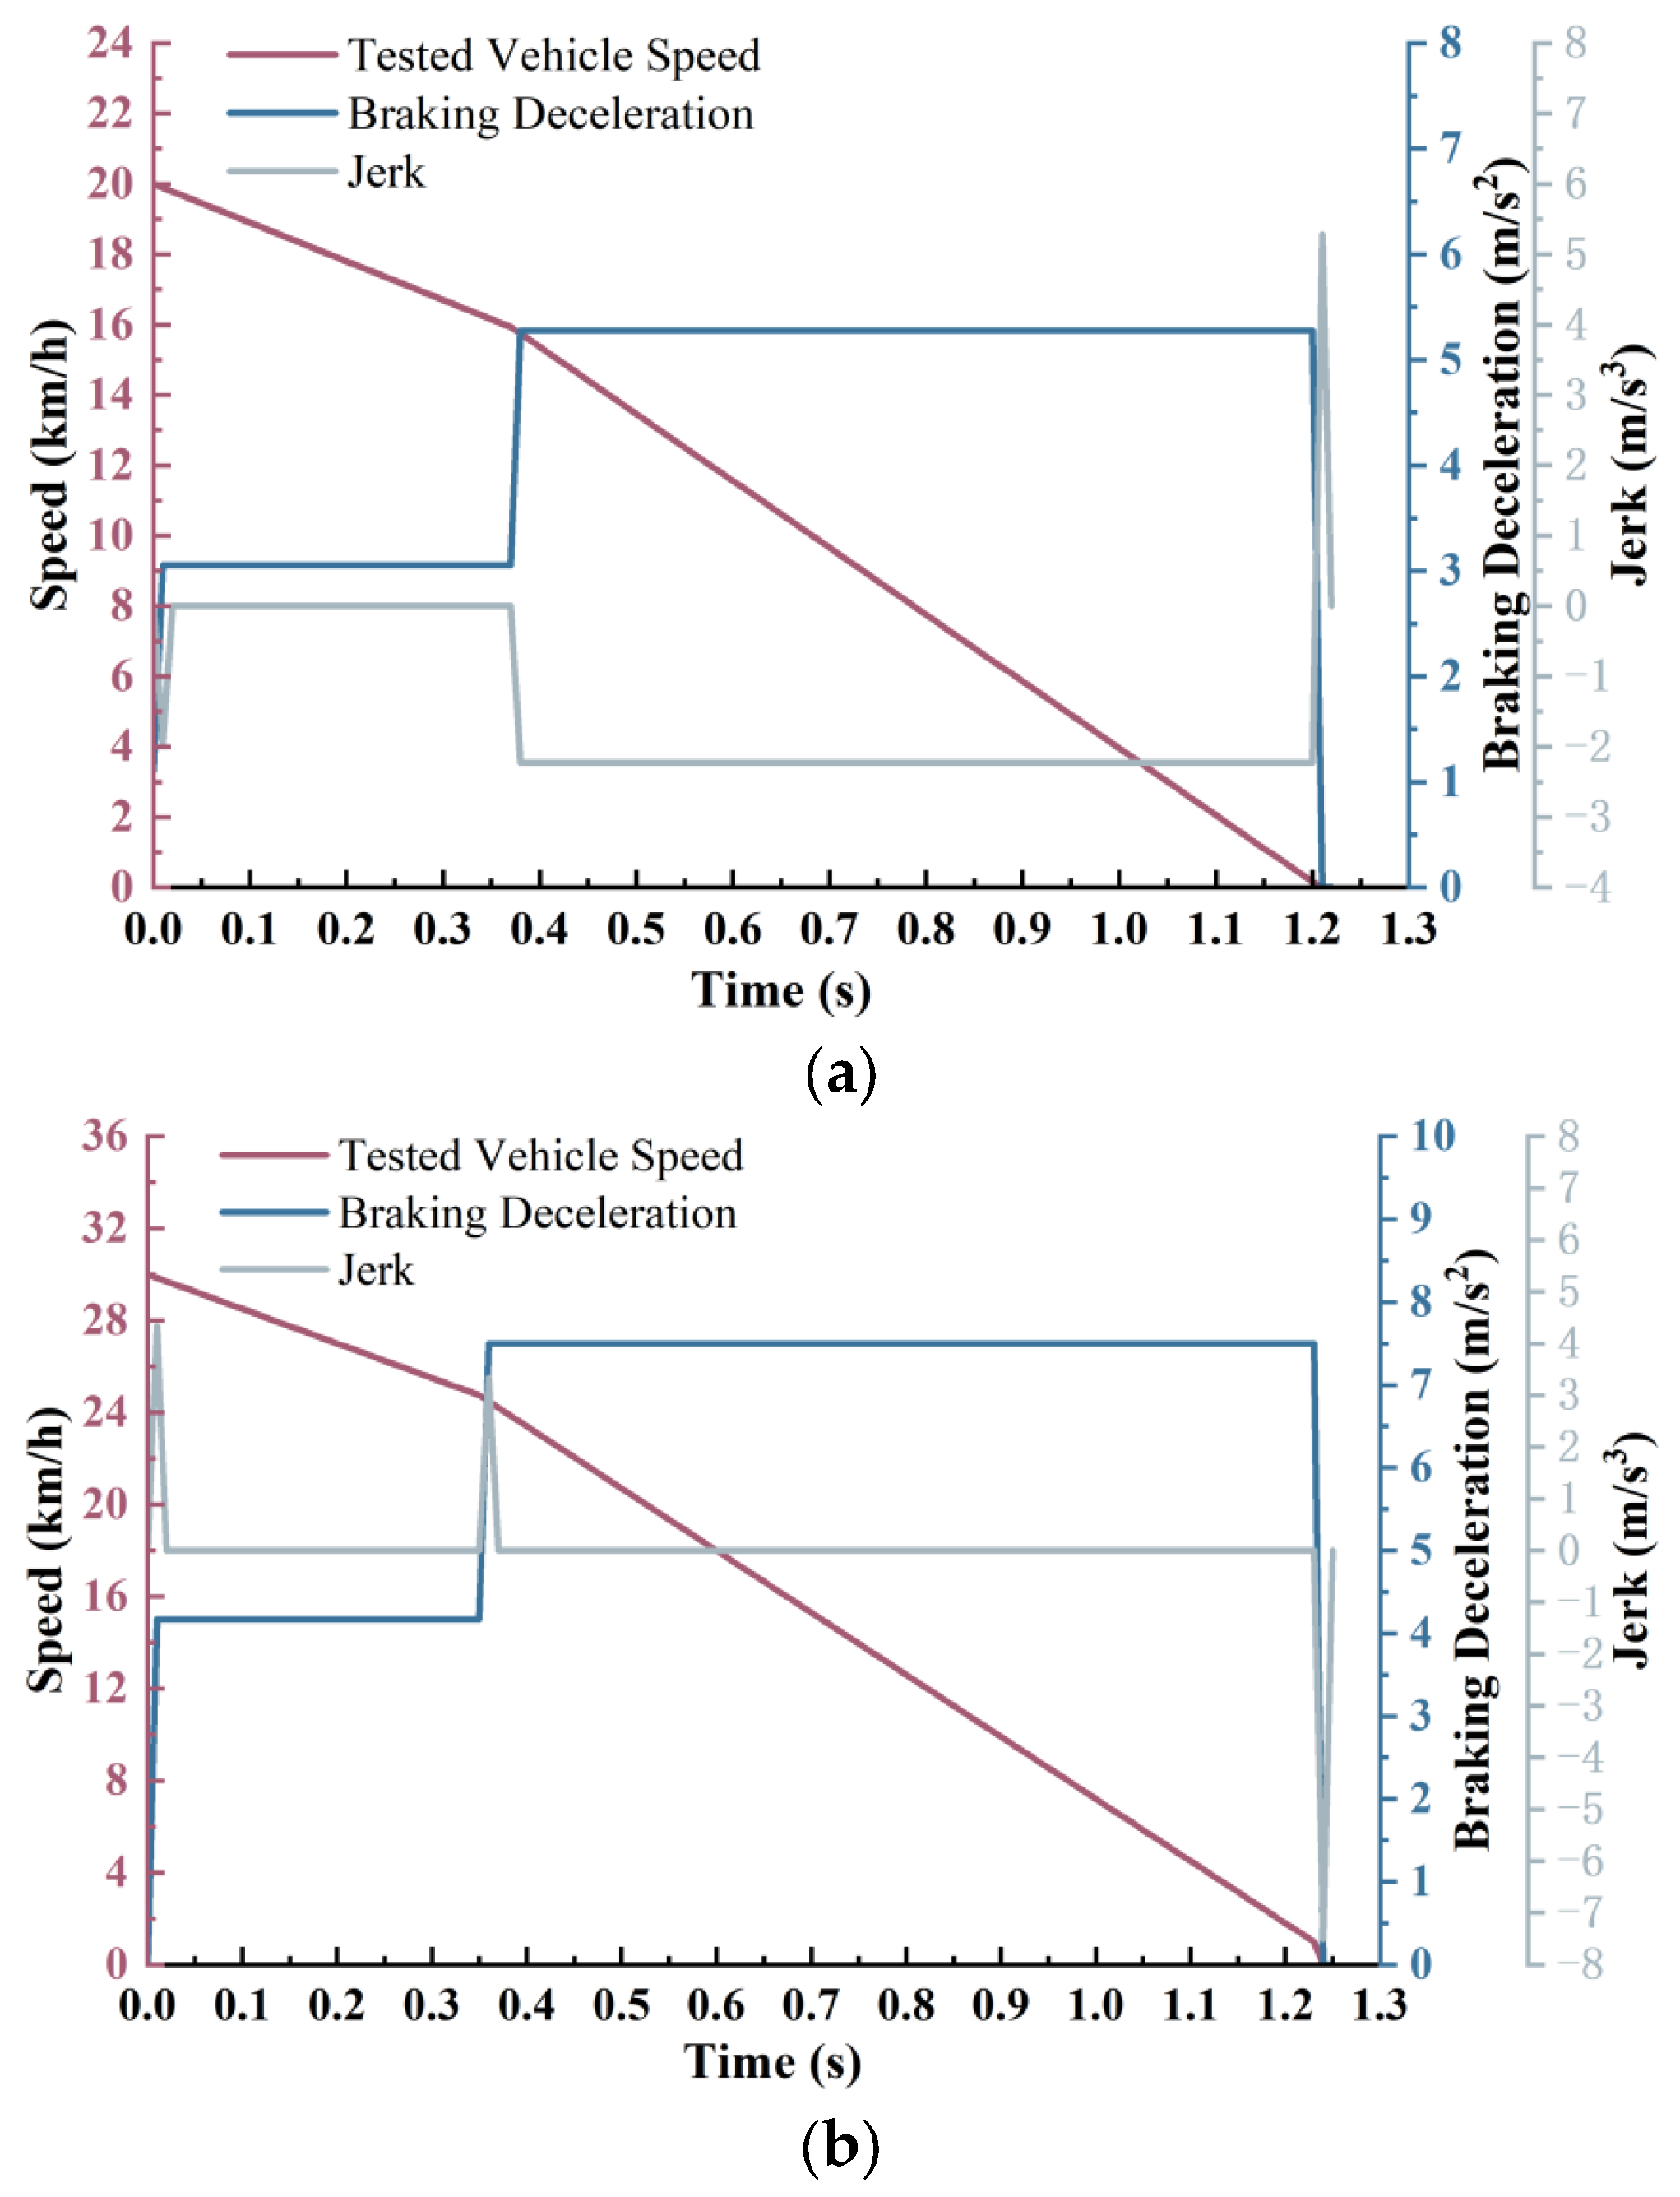
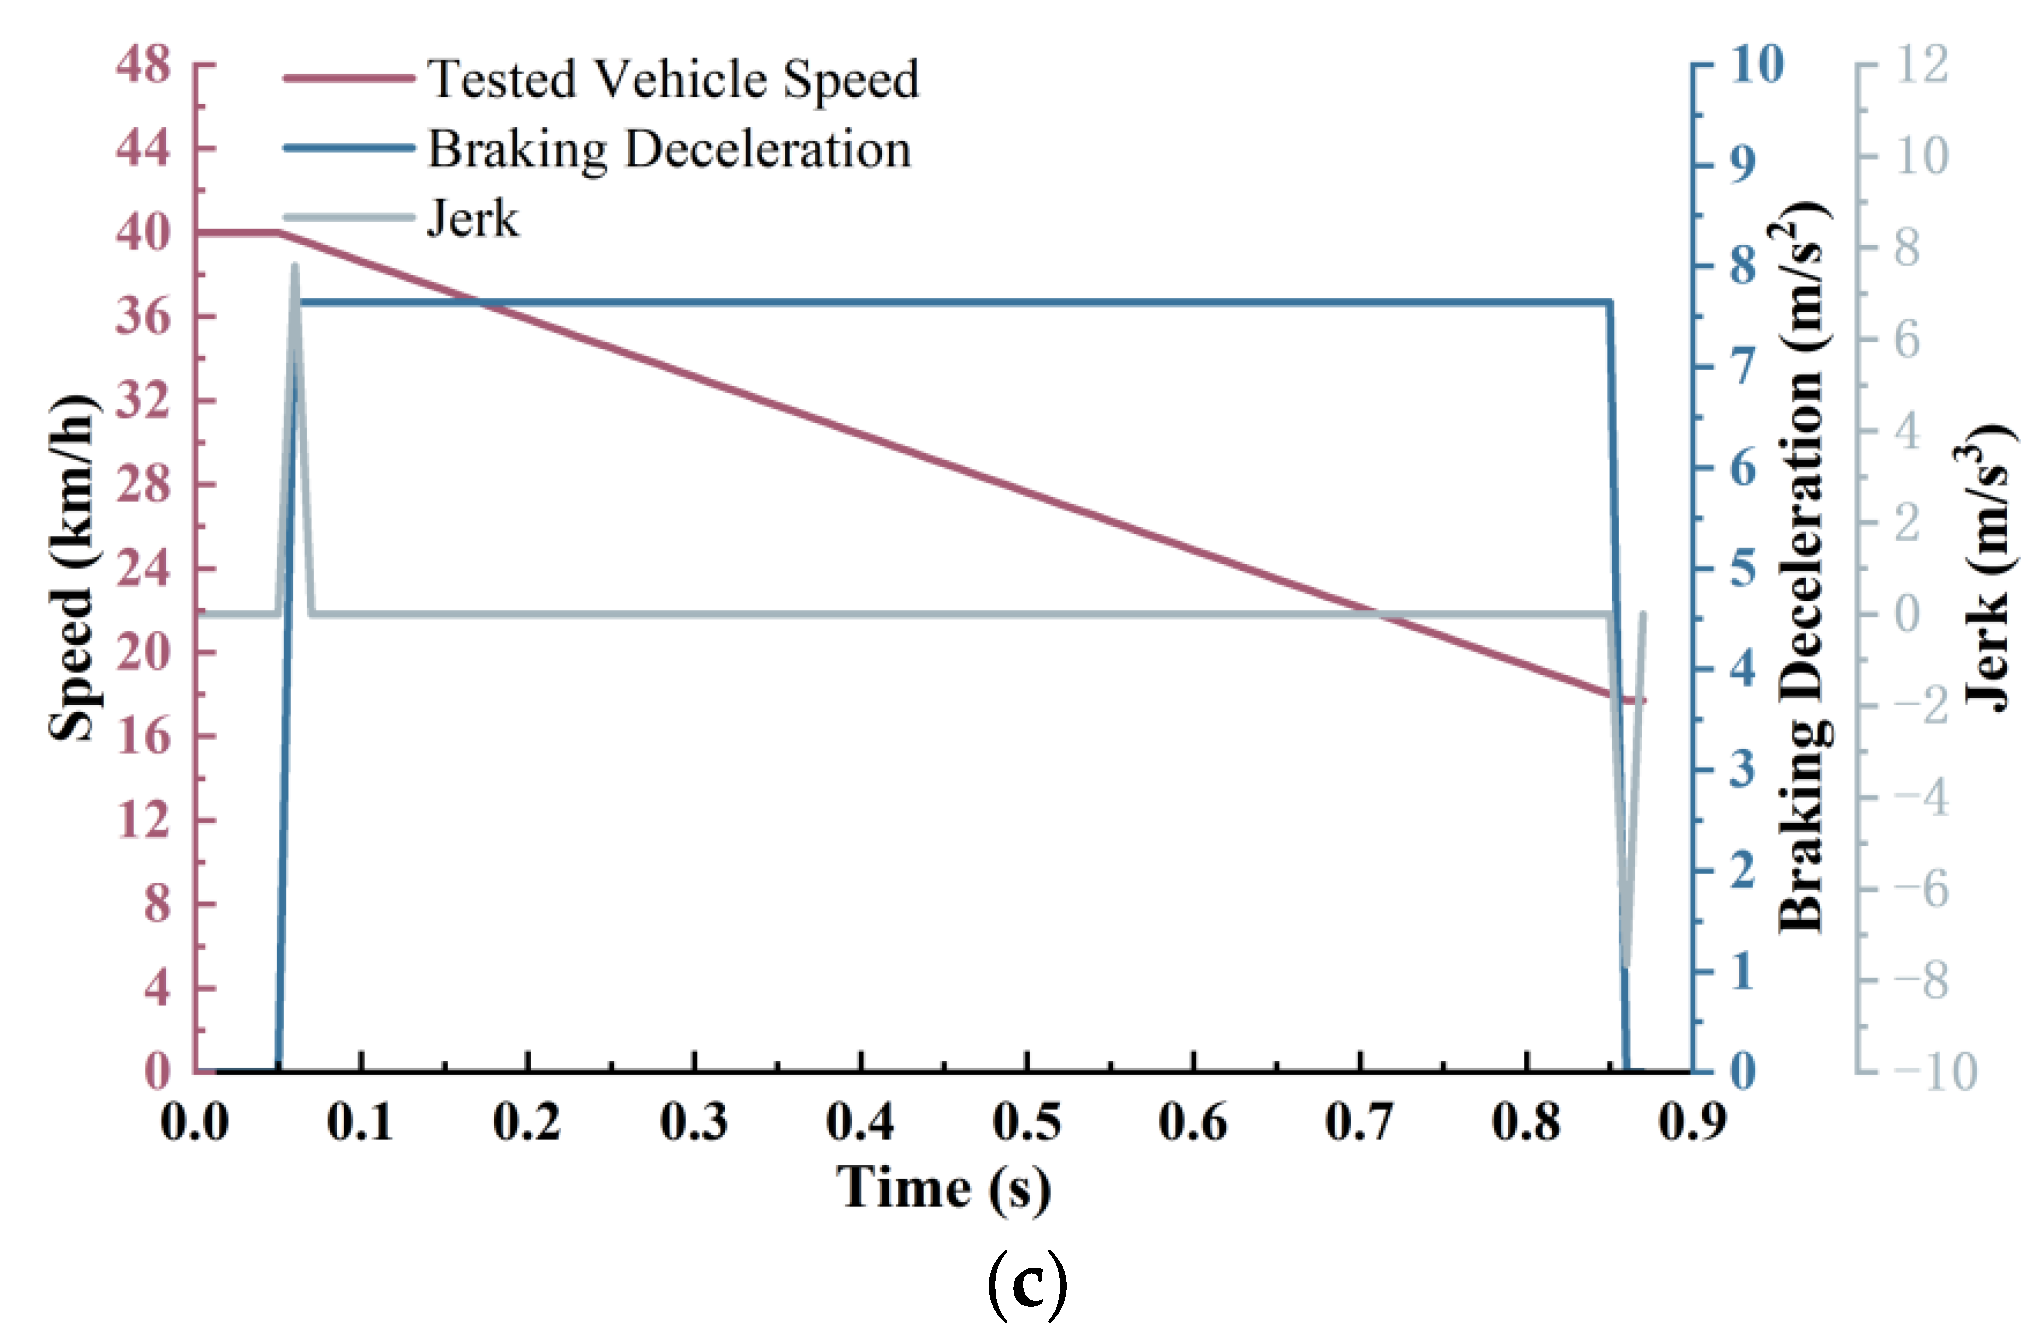
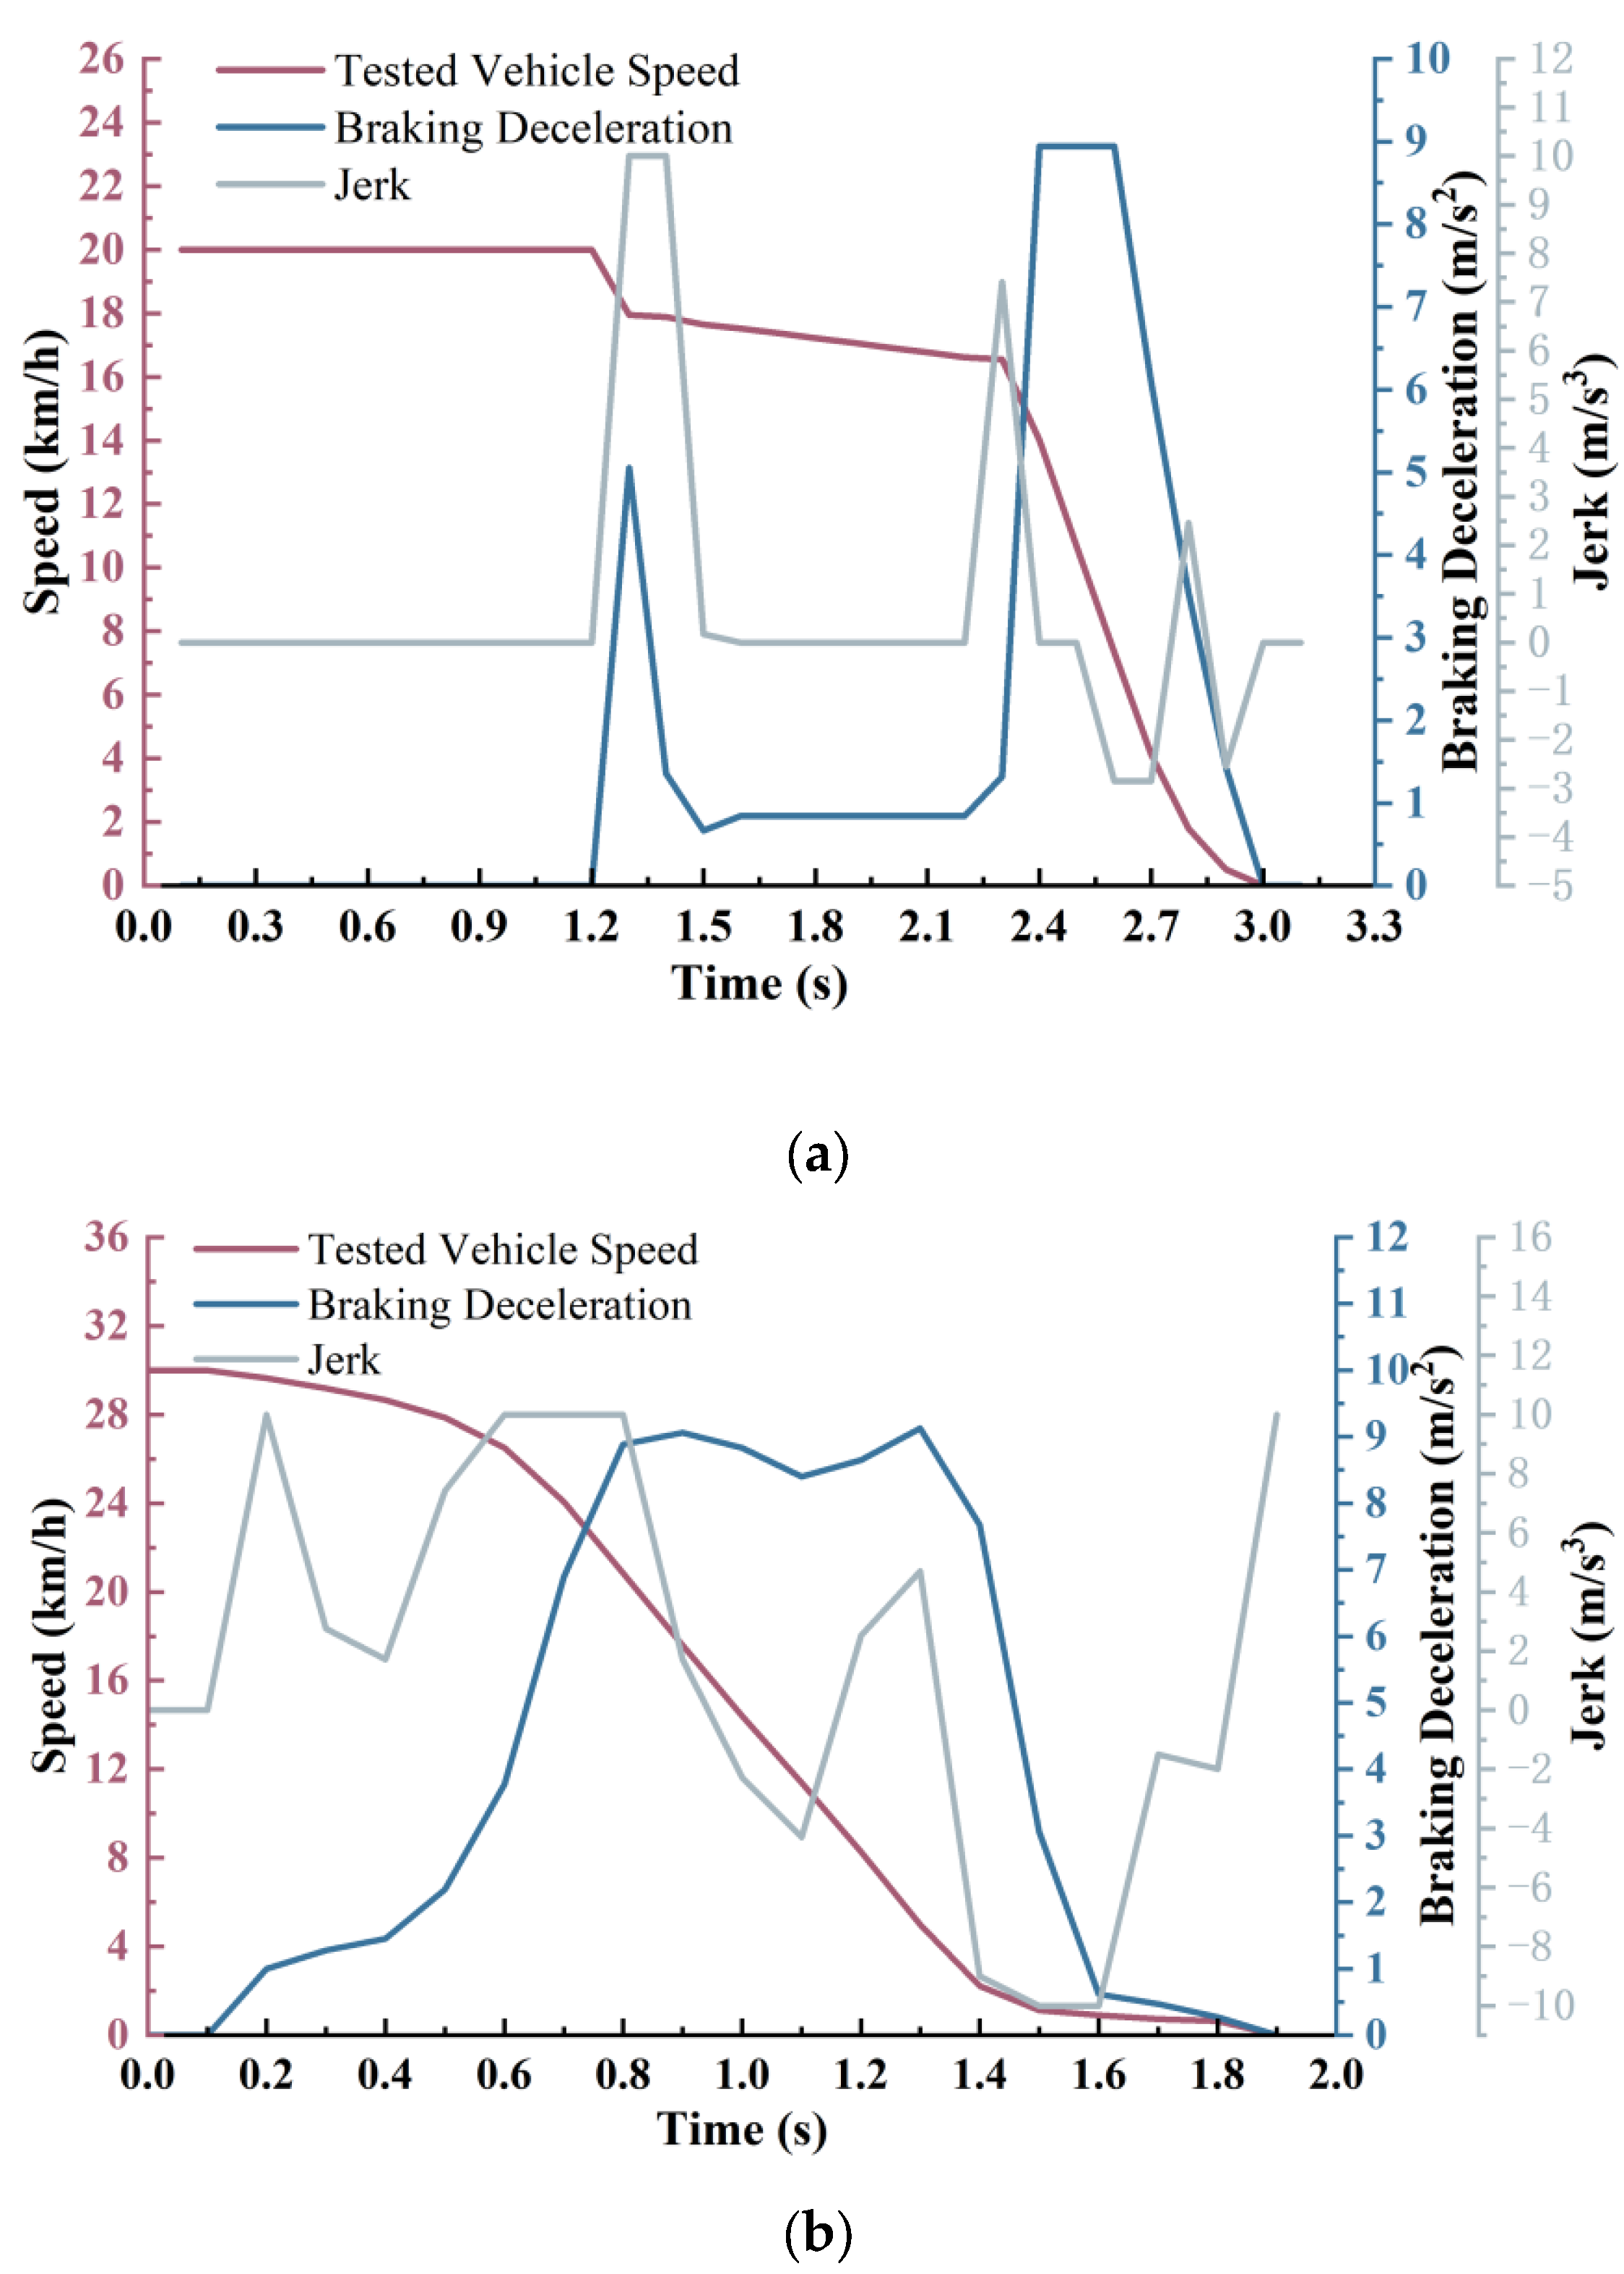
To ensure data reliability, each operational condition within every testing scenario was tested three times. The collected data were subsequently extracted for analysis, and the testing outcomes were assessed accordingly. The results under various conditions are summarized in Table 14 and depicted in Figure 15.
As revealed by the data in Table 14 and Figure 15, both the MFDD and the Jerk increased with a rising vehicle speed, leading to deteriorated braking smoothness and reduced ride comfort. When the vehicle speeds were 20 km/h and 30 km/h, respectively, the intervention timing of the AEB system occurred relatively earlier, accompanied by higher braking intensities, thereby enabling effective collision avoidance. However, under emergency scenarios involving sudden pedestrian crossings, when the vehicle speed was elevated to 40 km/h, the response time was reduced to 0.81 s after detecting the potential collision risk. This response time was insufficient to complete the collision avoidance maneuver, and the final collision speed was 20.7 km/h.

4. Validation Through Road Test

To validate the feasibility of the VIL testing for assessing the performance of the AEB system, real-world road test scenarios and conditions were constructed. Based on the DWAHP model framework, a comprehensive evaluation of the performance of the AEB system was conducted. The same test vehicle and conditions were selected in real-world road tests. Finally, by analyzing and comparing the road test results with the VIL test outcomes, an in-depth assessment of the performance of the AEB system was carried out.

4.1. Pre-Test Preparations for the Real-World Road Test

The objective of the real-world road test was to validate the feasibility of assessing the AEB system’s performance through VIL testing based on the DWAHP model framework by analyzing and comparing the experimental results. Therefore, the target objects, test vehicles, test scenarios, and operating conditions were kept consistent with those used in the VIL experiments. The specific test conditions are presented in Table 15.
The experimental equipment used was the Kistler automotive dynamic performance testing system (Germany), featuring a dual-axis optical velocity sensor. The system offered a compact structure, high measurement accuracy (<0.1%), adaptability to slippery surfaces such as snow and ice, and insensitivity to environmental conditions. It was mounted on the vehicle body at a longitudinal height of 350 mm above the ground, with straightforward installation. After calibration, data were transmitted via a signal processing converter and USB interface to a laptop, where the required parameters were extracted using CeCalWin Pro 1.9.13 software. The system recorded vehicle speed, distance, time, acceleration, lateral velocity, and slip angle. Equipment configuration parameters are listed in Table 16, and the installation and data acquisition setup are shown in Figure 16.
The experimental was conducted in the dedicated ICVs’ real-world testing area at Shandong Jiaotong University (Changqing Campus), which was equipped with a vehicle-to-everything (V2X) communication base station. The test zone encompassed straight sections, curves, intersections, and varying slopes, with asphalt pavement conditions (dry surface friction coefficient μ = 0.8–0.9). The tests were conducted between 9:00 and 16:00 Beijing time. The weather remained dry throughout the experiments, with no occurrences of precipitation or snowfall. Under natural lighting conditions, the illumination across the test area was maintained consistently and uniformly. All experimental conditions were tested with the same group of test operators and drivers to ensure consistency. The specific real-world road test scenarios are illustrated in Figure 17.
Each test scenario and operating condition was tested twice to ensure the accuracy of the collected data. If a significant deviation was observed between the results of the two trials, a third test was conducted to further validate the reliability of the outcomes. Upon completion of all tests, a comprehensive data analysis was performed by integrating the information recorded by the onboard dashcam, ensuring that the final dataset was both complete and accurate.

4.2. Road Test Results Analysis

The road tests were conducted using a Volvo S90L and an automotive dynamic performance testing system, and were completed within 8 h. The tests covered typical pedestrian crossing scenarios at urban road intersections, resulting in the collection of 10 sets of valid data samples. The key performance dimensions of the AEB system, including safety, reliability, and ride comfort, were primarily evaluated. The experimental results are presented in Table 17 and Figure 18.
Based on the foregoing data, it was observed that the collision avoidance rate of the AEB system reached 100% across different vehicle speeds (20 km/h–40 km/h), with the warning function triggered simultaneously. This indicated that the AEB system reliably detected risks and successfully initiated braking interventions in typical urban road speed limit scenarios (≤40 km/h), thereby meeting the mandatory requirements for low-speed conditions specified in GB/T 39901-2021 “Performance Requirements and Test Methods for Automotive AEB System” [36]. Moreover, the braking intervention time was found to increase with a rising vehicle speed (from 1.79 s at 20 km/h to 3.2 s at 40 km/h), which is consistent with the logical principle that the higher the vehicle speed, the greater the safety needed. The mean Jerk, which is associated with ride comfort and reflects the smoothness of deceleration, showed a significant increase at 30 km/h (5.460 m/s3), representing a 67.9% rise compared to 20 km/h (3.252 m/s3). Such a variation might potentially cause a noticeable “nodding” sensation for passengers. In summary, under the constructed test conditions, the AEB system demonstrated a reliable performance in braking effectiveness and safety, successfully preventing collisions. However, the substantial fluctuations in acceleration, particularly at higher speeds, revealed deficiencies in braking smoothness. Future improvements should focus on optimizing the control algorithms to minimize abrupt deceleration changes, thereby enhancing ride comfort and system stability while maintaining braking efficiency.

4.3. Comparative Validation Between VIL and Road Test Results

Drawing upon the results of the bench tests, road tests, and the dynamic-weighted comprehensive performance evaluation model of the AEB system, the feasibility of using VIL testing for AEB system performance evaluations was verified. To facilitate the comparison of the evaluation results across different testing methods, all performance metrics were normalized. The normalized data for each test scenario and evaluation metric are presented in Table 18.
The antecedent data were substituted into Equations (23) and (3)–(5) to analyze the influence of evaluation metrics within the target layer on various performance aspects of the AEB system under different testing methods. In addition, taking the road test results as the benchmark, the comprehensive performance evaluation outcomes of the AEB system based on VIL test were analyzed. The comparative results are presented in Table 19, Figure 19, and Table 20.
As shown in Table 19 and Table 20 and Figure 19, the comprehensive performance scores of the AEB system obtained from the VIL test and the road test were 13.8341 and 13.9048, respectively. The deviations in the scores for AEB system safety (VIL score: 1.7275; road test score: 1.9108), AEB system reliability (VIL score: 1.6357; road test score: 1.8835), and ride comfort (VIL score: 1.8912; road test score: 1.8412) were 0.1833 (deviation rate: 9.5%), 0.2478 (deviation rate: 13.1%), and 0.05 (deviation rate: 2.7%), respectively. The overall deviation in the comprehensive performance scores was 0.0707, corresponding to a deviation rate of 0.51%. These results demonstrated good consistency between the VIL test and road test outcomes. Furthermore, the findings verified the feasibility of the DWAHP-based comprehensive performance evaluation model for assessing the AEB system through VIL testing.

5. Conclusions

In this study, a comprehensive performance evaluation method for AEB systems in ICVs based on a DWAHP was proposed. The limitations of conventional static weighting methods were overcome by establishing a dynamic mapping relationship among scenario characteristics, indicator weights, and performance scores. A reusable and engineering-oriented testing framework was thereby developed to support the efficient validation of intelligent driving systems. The principal conclusions are summarized as follows:
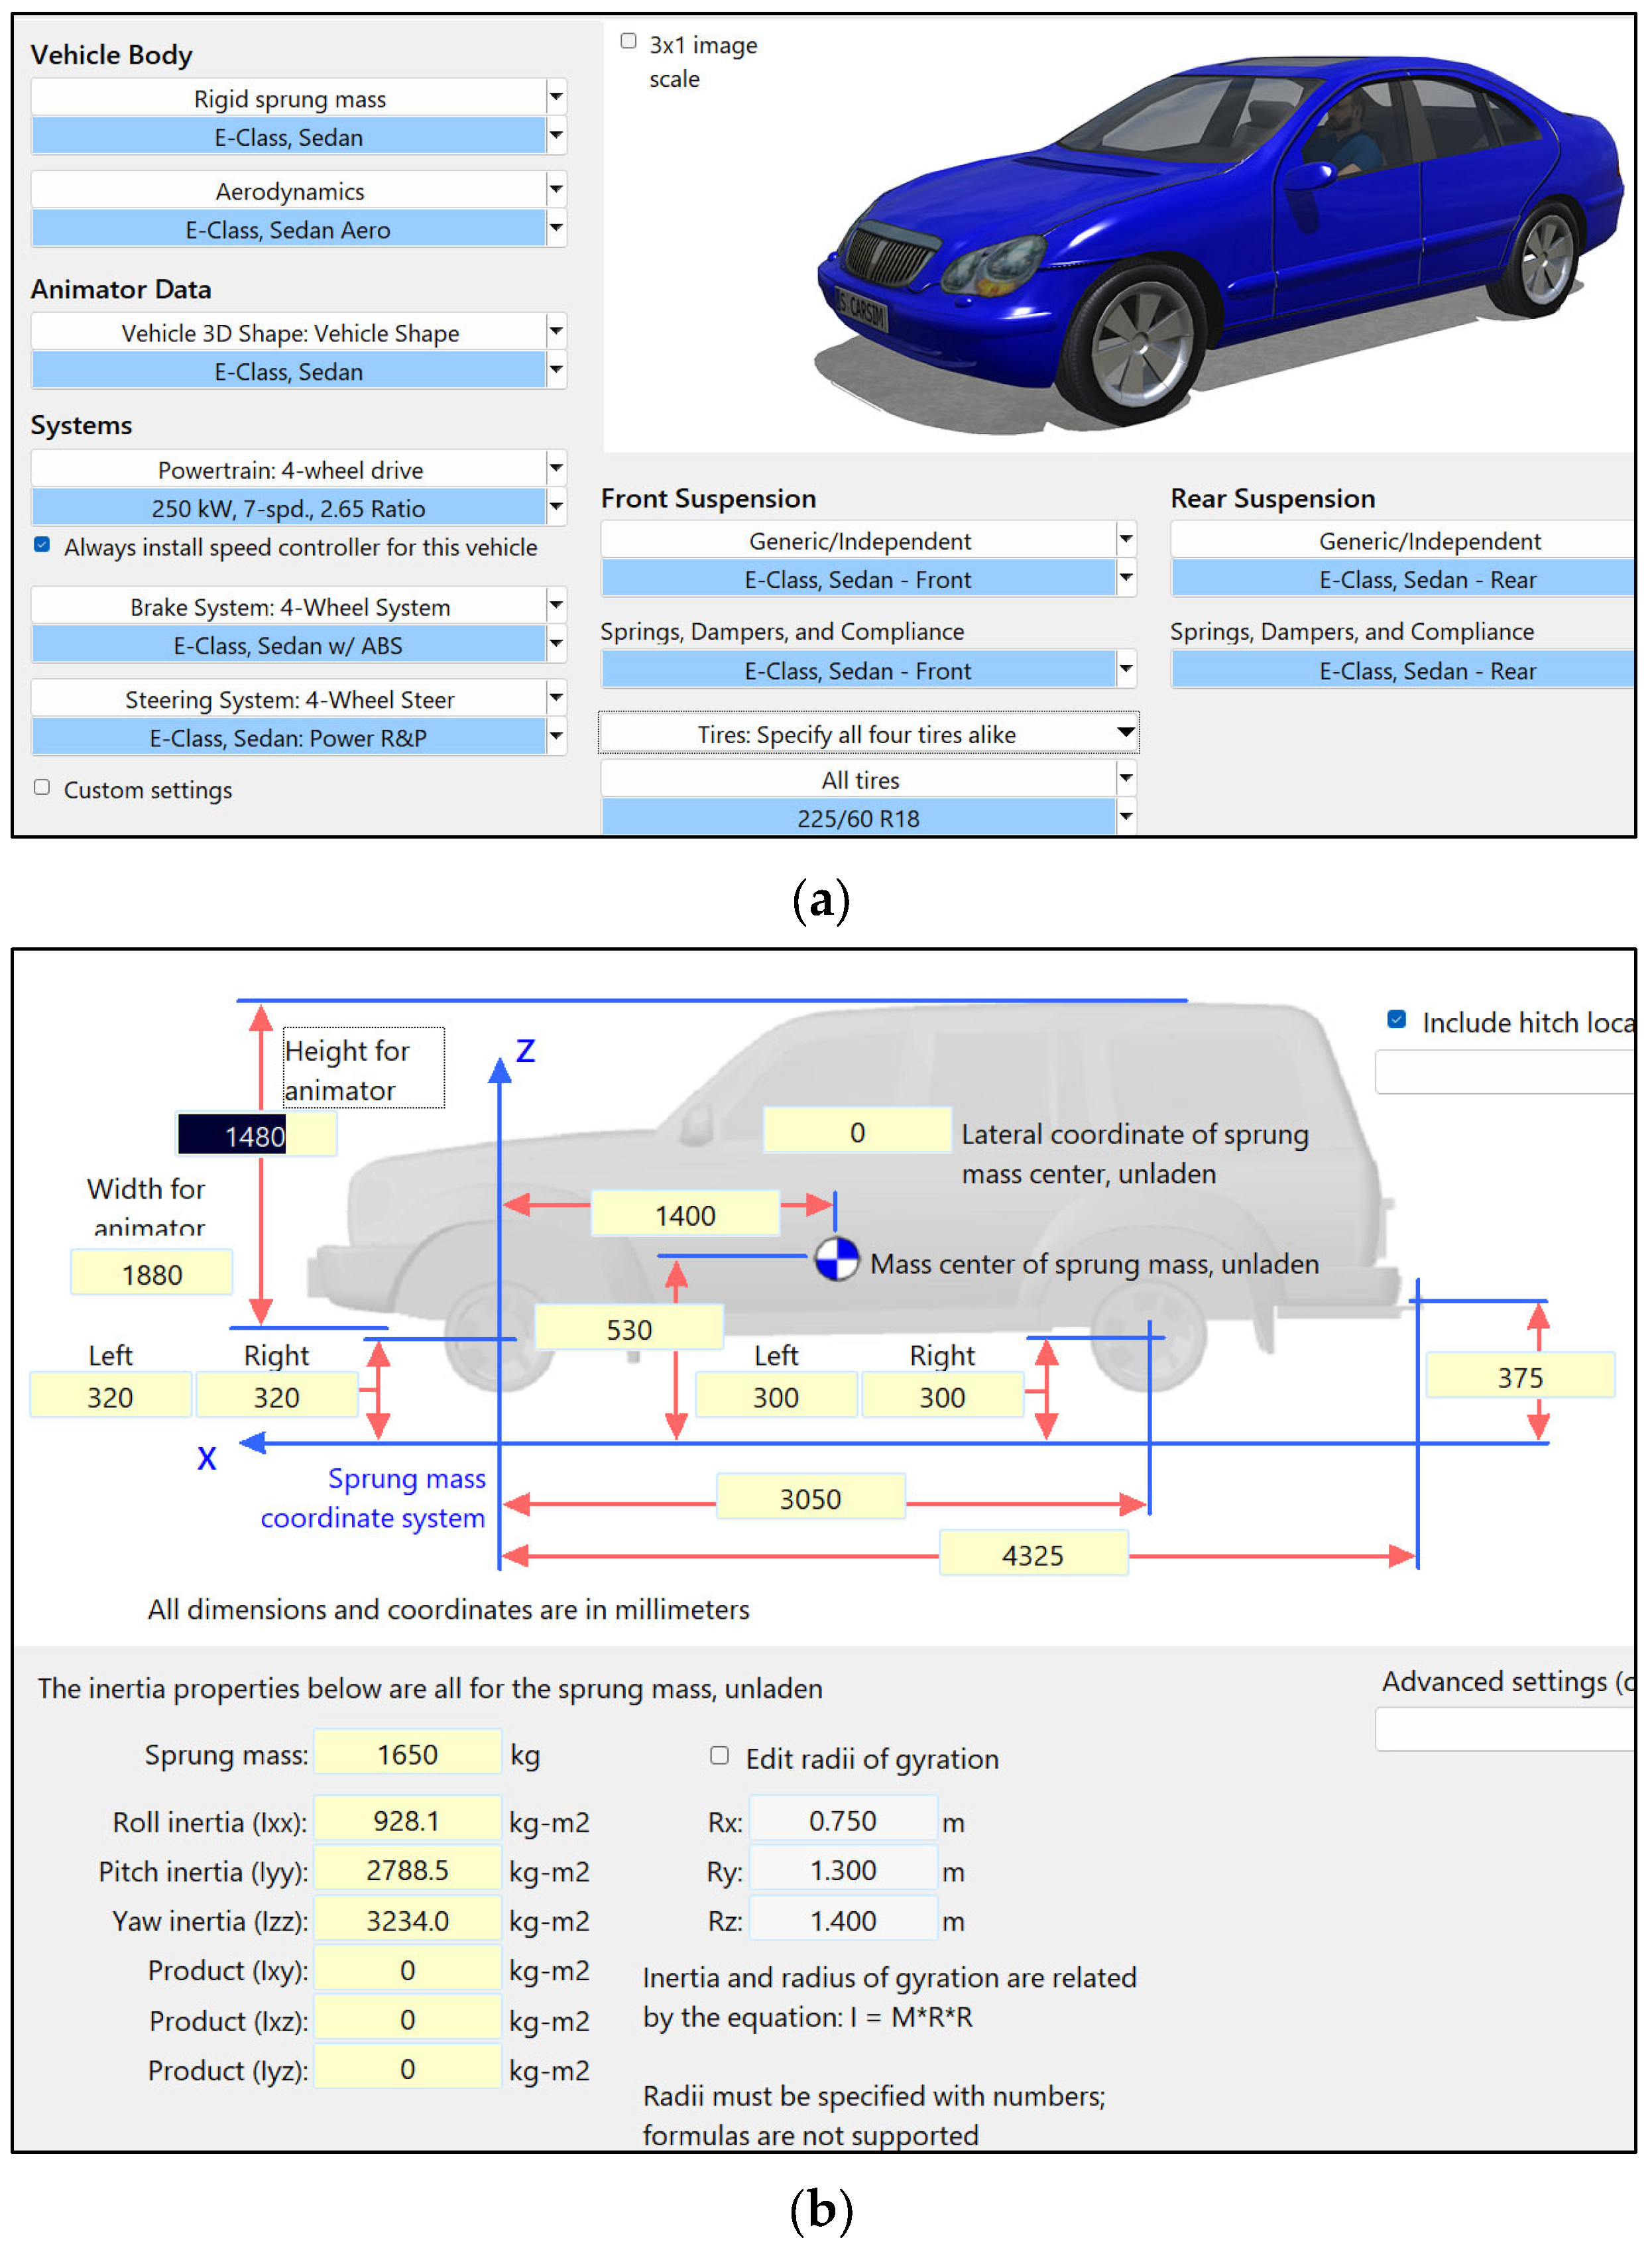
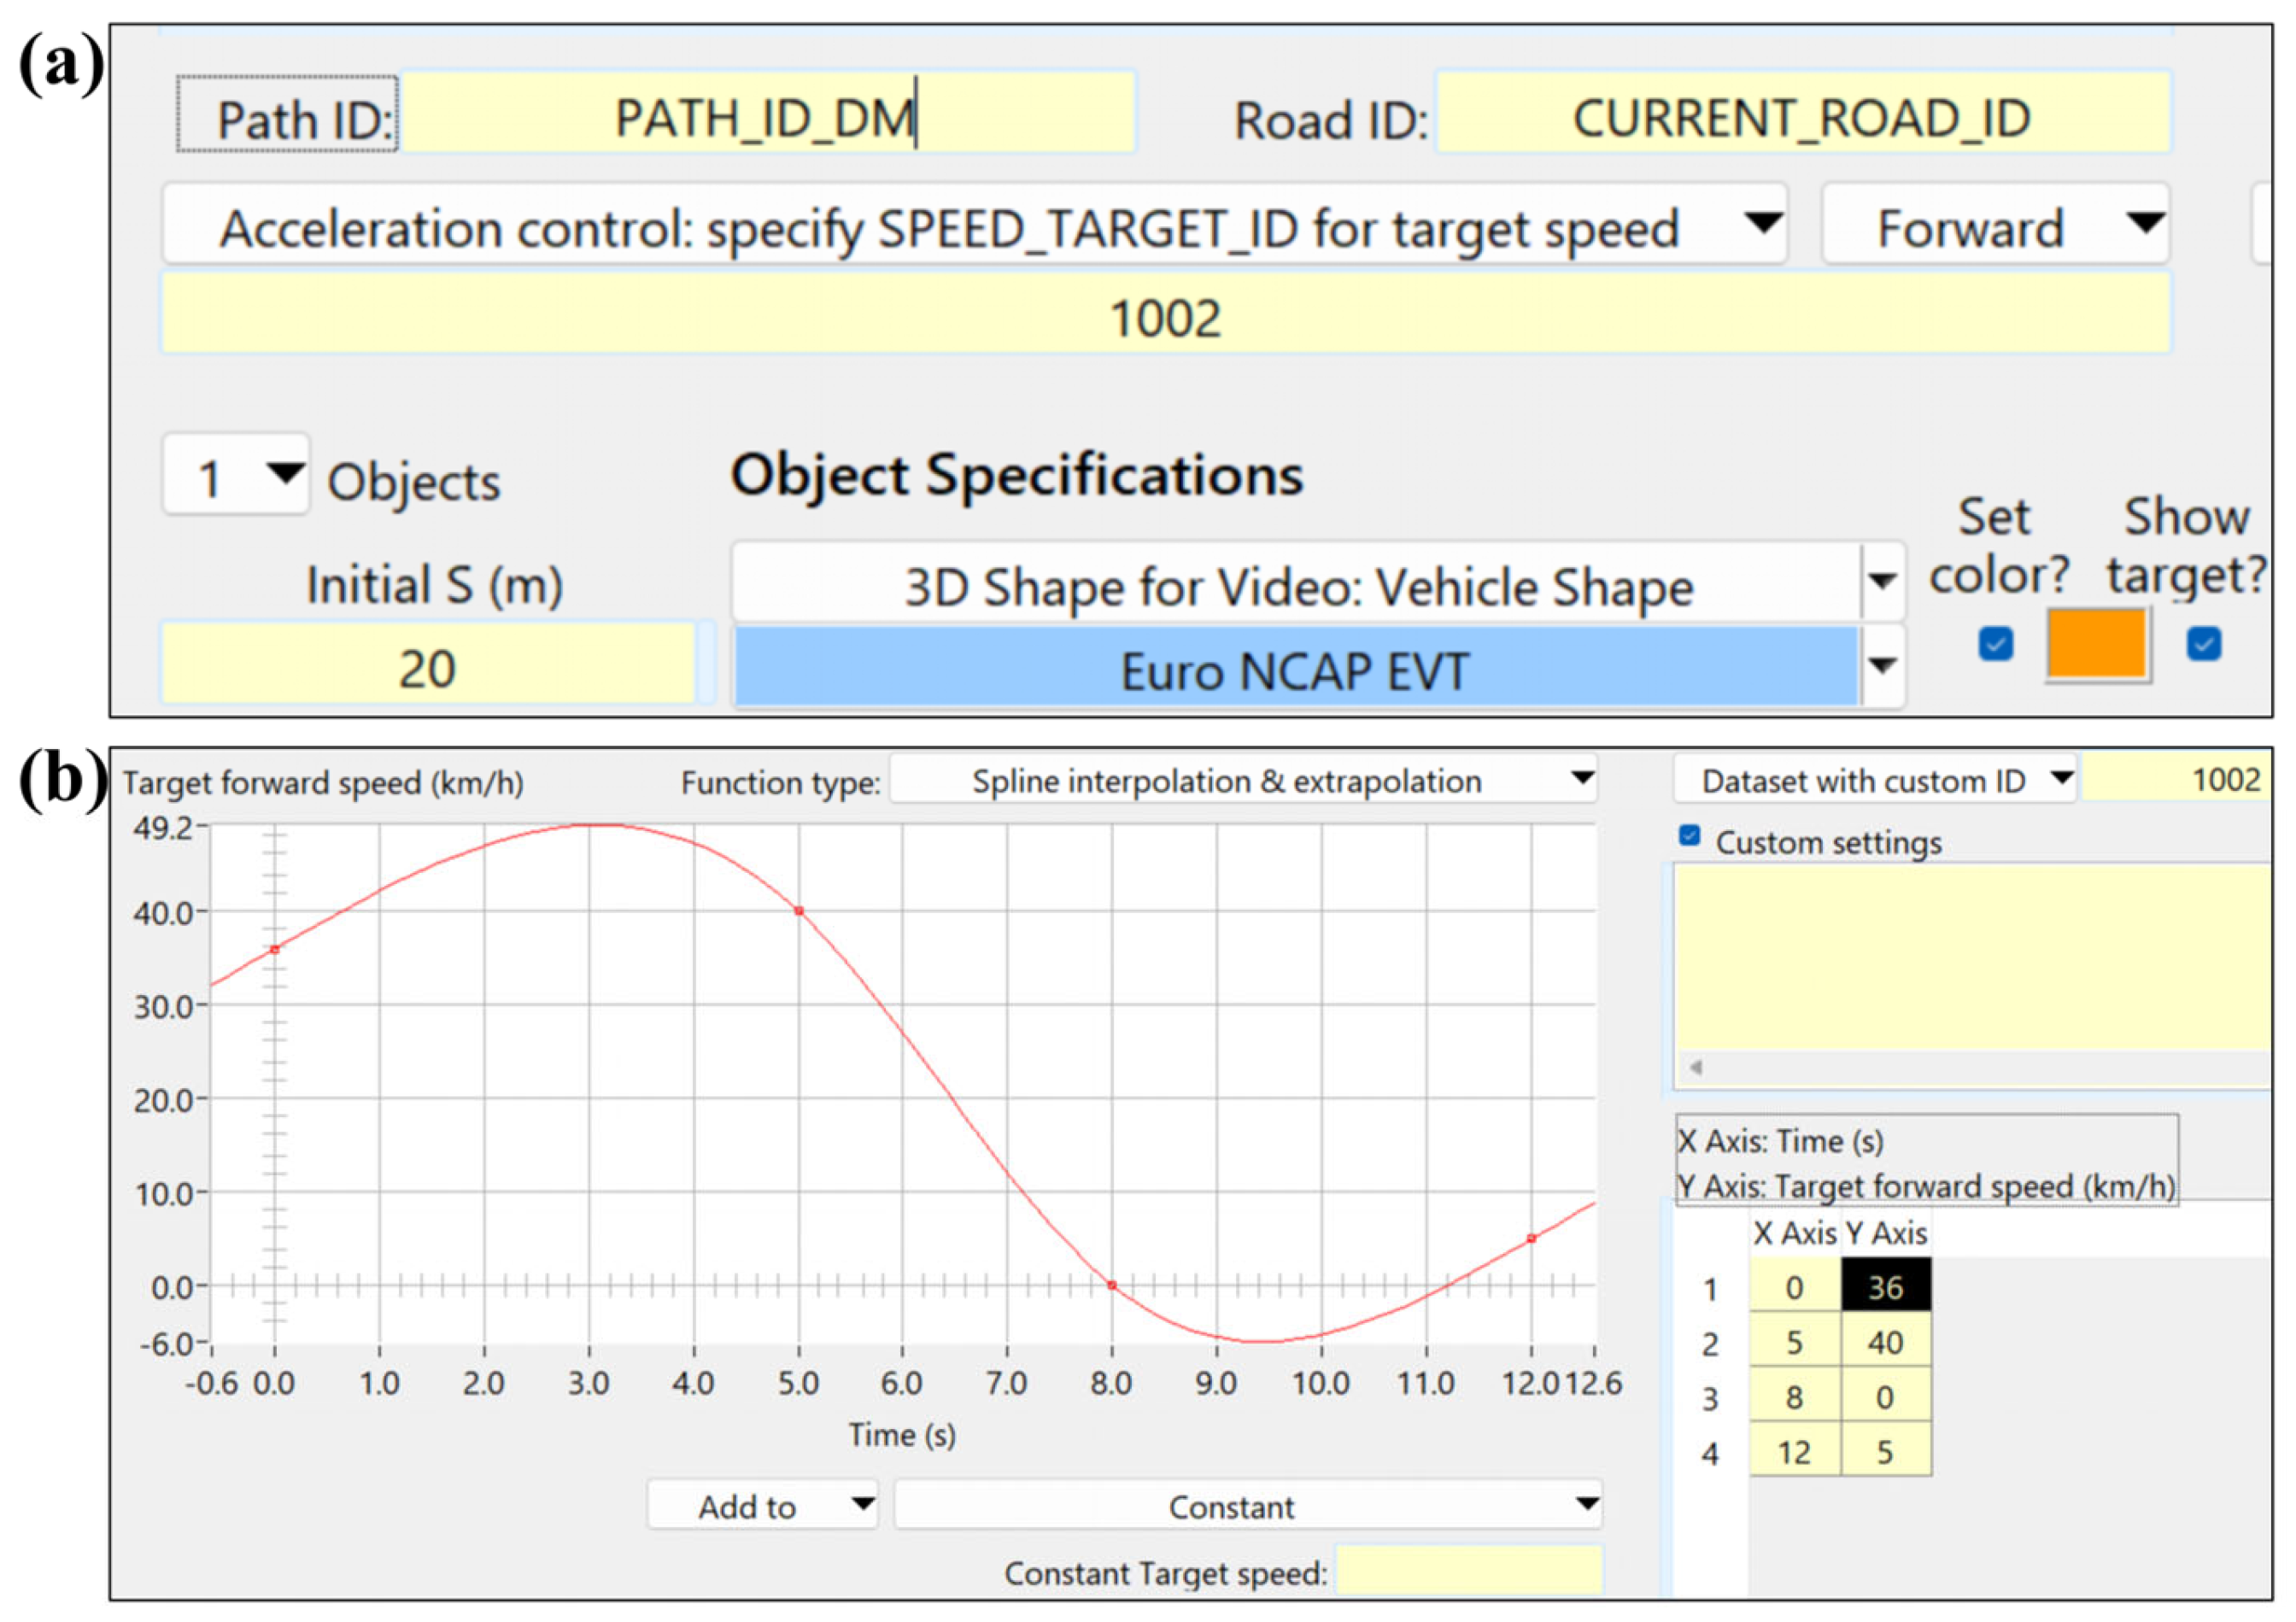
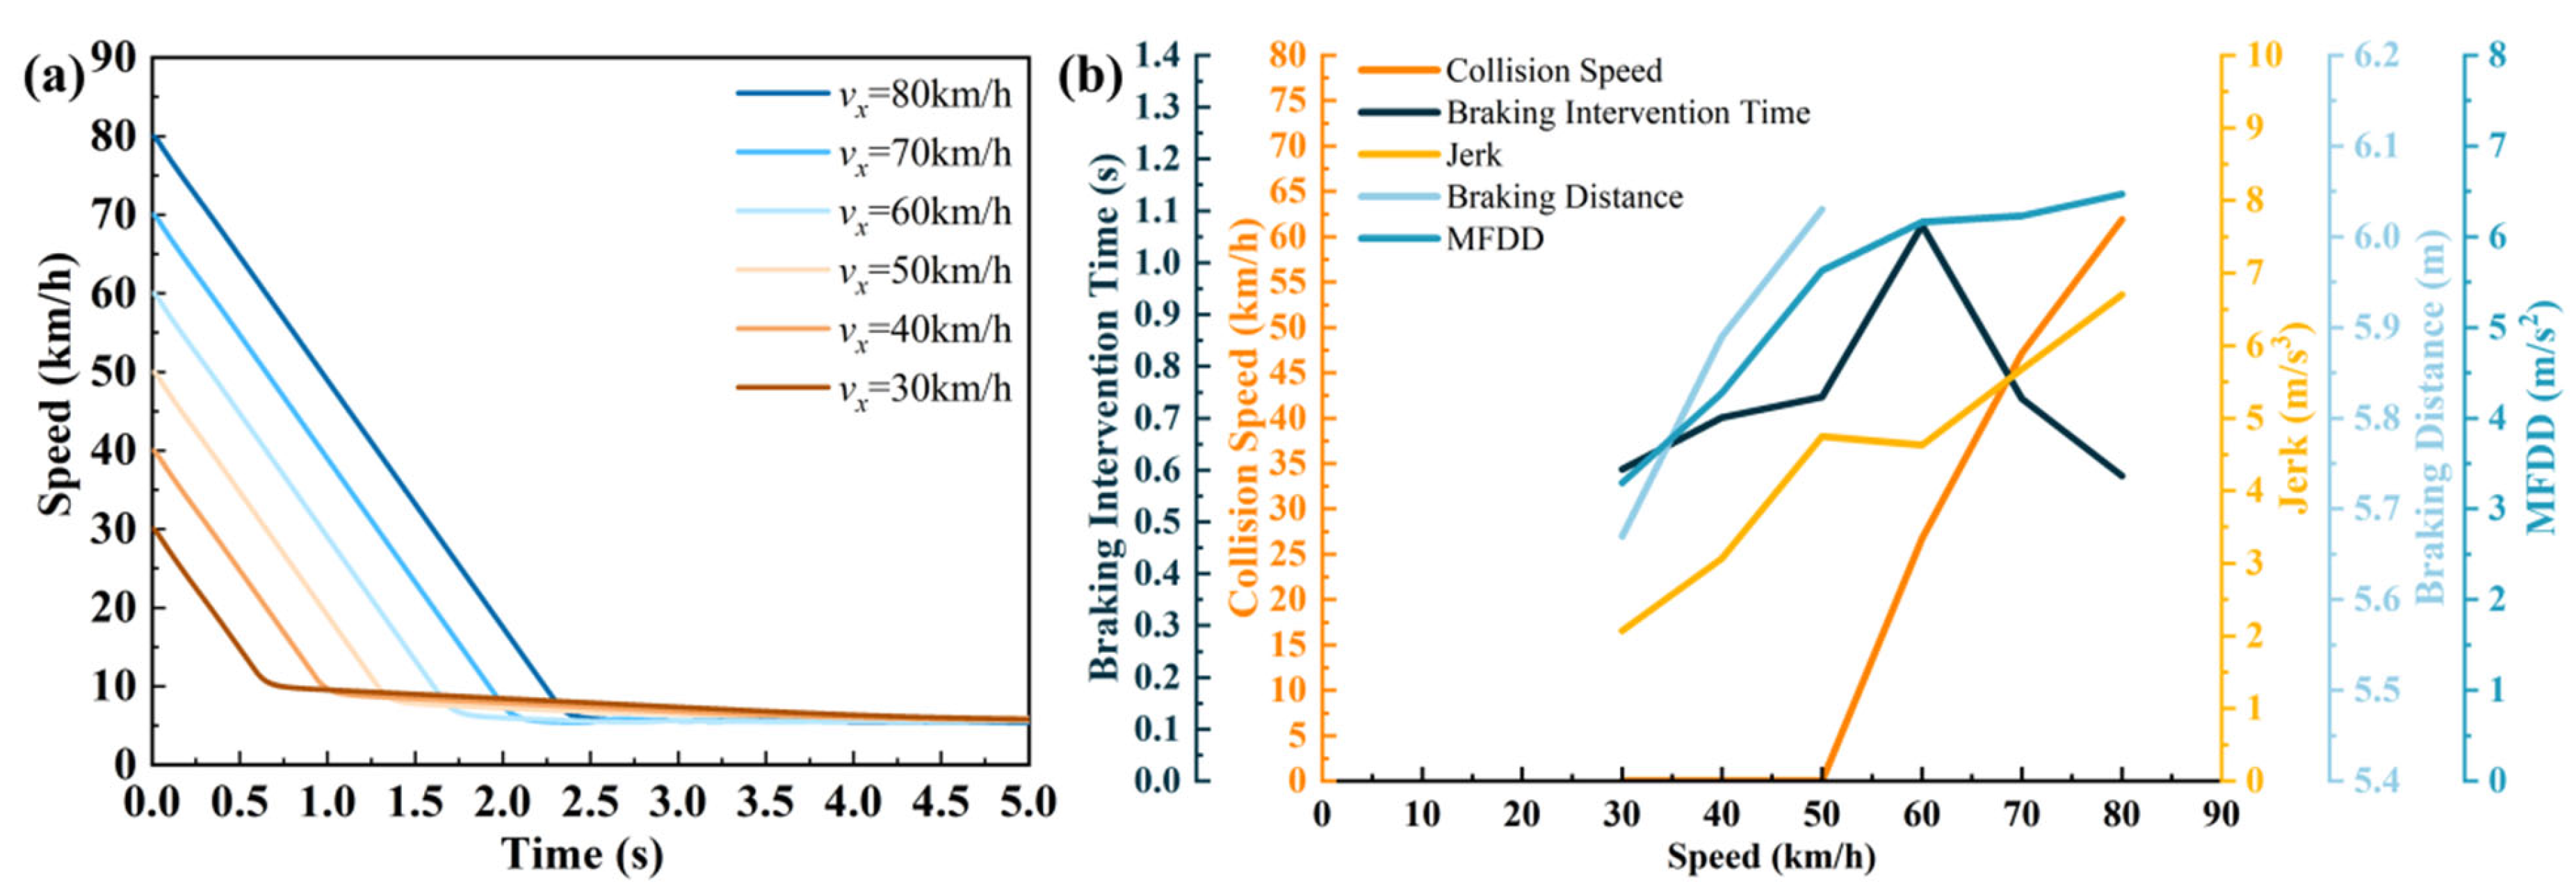
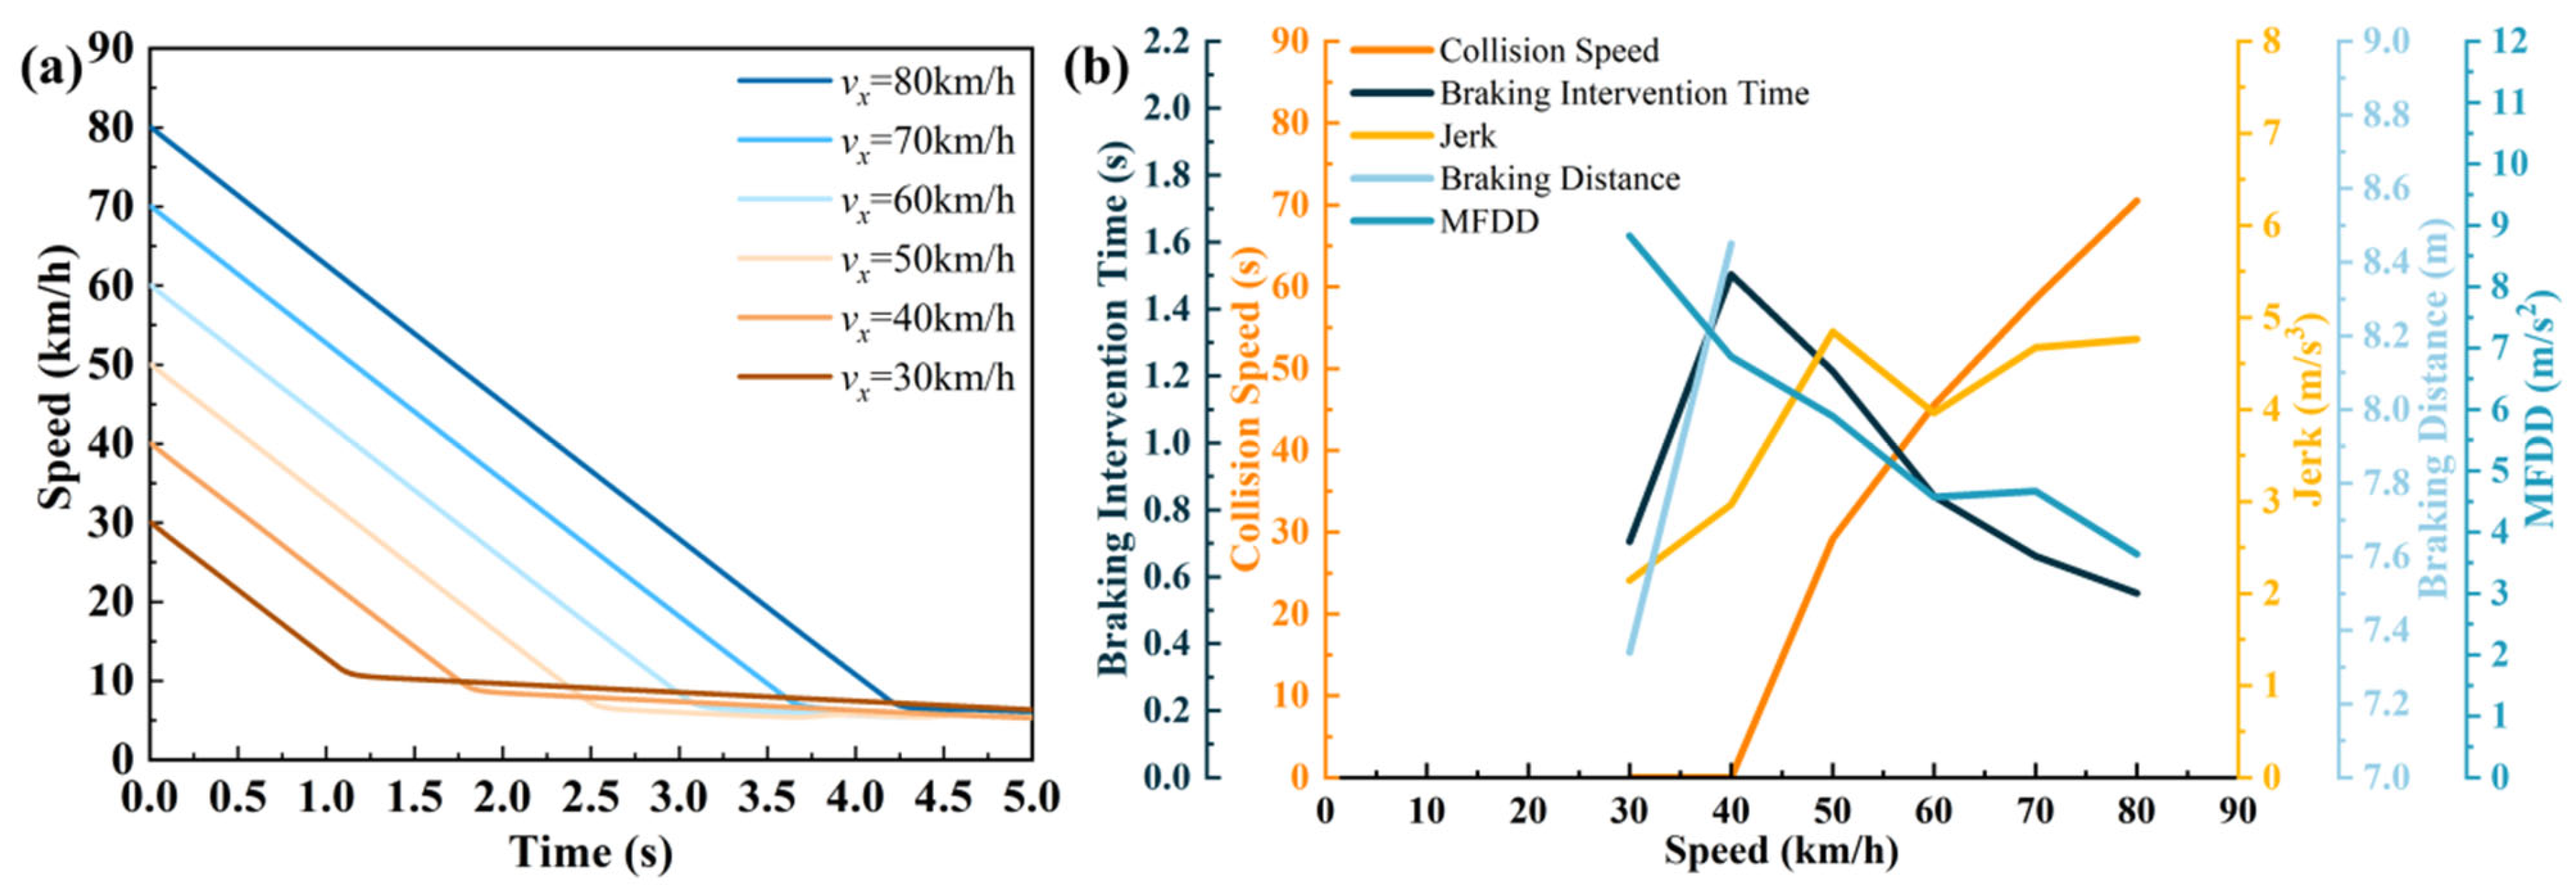
  • The DWAHP-based AEB system comprehensive performance evaluation model was constructed. To meet the demands for efficient and reliable evaluation, a co-simulation platform integrating MATLAB/Simulink 2020a and CarSim 19.1 was established. A closed-loop testing environment, comprising vehicle dynamics models, sensor models, and control algorithms, was constructed. Typical traffic scenarios—including urban roads (vehicle speeds of 30–60 km/h with surface adhesion coefficients of 0.5 and 0.85), suburban roads (vehicle speeds of 30–80 km/h with surface adhesion coefficients of 0.5 and 0.85), and highways (vehicle speeds of 80–120 km/h with a surface adhesion coefficient of 0.85)—were simulated. Moreover, five key performance parameters, namely braking distance, braking deceleration, braking intervention time of the AEB system, and Jerk, were systematically collected under various speed and surface conditions. A multi-dimensional performance evaluation matrix was constructed using the DWAHP model, providing a solid data foundation for the quantitative analysis of the comprehensive performance of the AEB system;
  • A specialized AEB system testing platform was developed. Based on the major influencing factors—vehicle speed and surface adhesion coefficient—and the DWAHP evaluation model, a dedicated AEB testing platform integrating a mechanical system and a measurement and control system was developed. The platform was designed with adjustable wheelbase configurations to accommodate different vehicle types, adjustable primary and secondary drum distances to simulate varying road adhesion levels, and a dual-inertia coupling mechanism combining mechanical flywheels and AC dynamometers. These features ensured accurate and safe data acquisition across low-, medium-, and high-speed conditions. The platform was verified to comply with Section 6.3.2.3 of GB/T 44500-2024, “Inspection Regulations for the Operational Safety Performance of New Energy Vehicles”, regarding the performance requirements for chassis dynamometers;
  • The VIL-based AEB system performance evaluation method was developed and verified. A comprehensive performance evaluation method for the AEB system, utilizing a VIL test and the DWAHP model, was established and comparatively validated through a real-world road test. The results revealed that the comprehensive performance scores obtained from the VIL test and road test were 13.8341 and 13.9048, respectively. The deviations in safety (VIL score: 1.7275; road test score: 1.9108), reliability (VIL score: 1.6357; road test score: 1.8835), and ride comfort (VIL score: 1.8912; road test score: 1.8412) were 0.1833 (9.5%), 0.2478 (13.1%), and 0.05 (2.7%), respectively. The overall deviation in the comprehensive performance score was 0.0707, corresponding to a deviation rate of 0.51%, demonstrating a good consistency between VIL test and real-world road test. These findings validated the effectiveness and feasibility of the proposed DWAHP-based VIL testing framework for assessing the comprehensive performance of the AEB system.
In conclusion, the DWAHP-based VIL evaluation methodology was demonstrated to effectively deal with the limitations of conventional AEB system performance evaluation technologies, particularly addressing issues related to static weighting, limited adaptability to varying operational conditions, and the lack of integration between traditional evaluation frameworks and experimental validation processes. The proposed methodology and associated research outcomes are highly applicable in multiple practical scenarios. Effective implementation can be achieved in vehicle factory-out inspection processes, where the repeatability, safety, reliability, and comprehensive scenario simulation capabilities of test benches can be fully exploited to enhance inspection efficiency and reduce costs. Moreover, these outcomes are also suitable for utilization in vehicle testing stations and scientific research institutions, providing a reliable evaluation tool for both industrial quality control and academic research endeavors.
Nevertheless, a few drawbacks were identified throughout the study. The dynamic weighting model was calibrated using offline simulation data, and its capacity for real-time correction utilizing online road test feedback remained insufficient. To overcome this shortcoming, future research is recommended to investigate the incorporation of reinforcement learning-based adaptive weighting mechanisms, thereby enhancing real-time responsiveness and the model’s robustness. Additionally, further efforts should be directed toward closing the technological gaps between virtual scenarios’ generalization capability, hardware’s testing precision, and evaluation systems’ adaptability, with the aim of advancing the deployment in engineering and practical application of intelligent driving system evaluation technologies.

Author Contributions

Conceptualization, D.L. and W.H.; methodology, D.L.; software, D.L.; validation, D.L., R.C. and X.T.; formal analysis, D.L.; investigation, W.H., Y.F. and W.F.; resources, Z.L. and Y.W.; data curation, D.L. and X.J.; writing—original draft preparation, D.L.; writing—review and editing, D.L., R.C. and H.Z.; visualization, D.L., Y.F., Z.L. and Y.W.; supervision, W.H. and R.C.; funding acquisition, W.H. and R.C. All authors have read and agreed to the published version of the manuscript.

Funding

This research was funded by “SHANDONG PROVINCIAL NATURAL SCIENCE FOUNDATION, grant number ZR2022ME096”, “PROVINCIAL SCIENCE AND TECHNOLOGY INNOVATION PLATFORM SUBSIDY PROJECT, grant number 202333096”, and “KEY R&D PROGRAM OF SHANDONG PROVINCE, CHINA, grant number 2024TSGC0103”.

Institutional Review Board Statement

Not applicable.

Informed Consent Statement

Not applicable.

Data Availability Statement

Data are contained within the article.

Conflicts of Interest

Author Xiangchen Tang was employed by the company Shandong Xinlingzhi Testing Technology. The remaining authors declare that the research was conducted in the absence of any commercial or financial relationships that could be construed as a potential conflict of interest.

Abbreviations

The following abbreviations are used in this manuscript:
ICVsIntelligent Connected Vehicles
AEBAutomatic Emergency Braking
VILVehicle-in-the-Loop
DWAHPDynamic Weight Analytic Hierarchy Process
ADASAdvanced Driver Assistance Systems
WHOWorld Health Organization
IIHSInsurance Institute for Highway Safety
U.S.United States
EUEuropean Union
E-NCAPEuropean New Car Assessment Programme
VRUVulnerable Road User
SILSoftware-in-the-Loop
HILHardware-in-the-Loop
CCRSCar-to-Car Rear Stationary
CCRMCar-to-Car Rear Moving
MFDDMean Fully Developed Deceleration
TTCTime-to-Collision
CIConsistency Index
ACAlternating Current
V2XVehicle-to-Everything

References

  1. World Health Organization. A Road Safety Technical Package; World Health Organization: Geneva, Switzerland, 2023. [Google Scholar]
  2. National Bureau of Statistics of China. Traffic Accident Statistics; China Statistics Press: Beijing, China, 2023. [Google Scholar]
  3. Insurance Institute for Highway Safety. Effectiveness of Automatic Emergency Braking and Forward Collision Warning Systems; IIHS: Ruckersville, VA, USA, 2023. [Google Scholar]
  4. Haus, S.H.; Sherony, R. Estimated Benefit of Automated Emergency Braking Systems for Vehicle-Pedestrian Crashes in the United States. Traffic Inj. Prev. 2019, 20 (Suppl. S1), S171–S176. [Google Scholar] [CrossRef] [PubMed]
  5. Seacrist, T.; Jermakian, J.S. Efficacy of Automatic Emergency Braking among Risky Drivers Using Counterfactual Simulations from the SHRP 2 Naturalistic Driving Study. Saf. Sci. 2020, 128, 104746. [Google Scholar] [CrossRef]
  6. UN R152; Uniform Provisions Concerning the Type—Approval of Advanced Emergency Braking Systems (AEBS) for M1 and N1 Category Motor Vehicles. United Nations Economic Commission for Europe: Geneva, Switzerland, 2020.
  7. United Nations Economic Commission for Europe (UNECE). Regulation No. 152: Uniform Provisions Concerning the Approval of Vehicles with Regard to Their Autonomous Emergency Braking (AEB) Systems; UNECE: Geneva, Switzerland, 2022. [Google Scholar]
  8. JT/T 1242-2019; Performance Requirements and Test Procedures for Automatic Emergency Braking Systems of Commercial Vehicles. Ministry of Transport of the People’s Republic: Beijing, China, 2019.
  9. David, D.K. Improving the Safety Relevance of Automatic Emergency Braking Testing Programs: An Examination of Common Characteristics of Police-Reported Rear-End Crashes in the United States. Traffic Inj. Prev. 2022, 23 (Suppl. S1), S137–S142. [Google Scholar]
  10. Zhou, H.; Zhao, R.; Wang, X. Research on Safety of the Intended Functionality of Automobile AEB Perception System in Typical Dangerous Scenarios of Two-Wheelers. Accid. Anal. Prev. 2022, 173, 106709. [Google Scholar] [CrossRef]
  11. Hou, L.; Duan, J. Drivers’ Braking Behaviors in Different Motion Patterns of Vehicle-Bicycle Conflicts. J. Adv. Transp. 2019, 2019, 4023970. [Google Scholar] [CrossRef]
  12. Rao, R.; Cui, C. Quantitative Testing and Analysis of Non-Standard AEB Scenarios Extracted from Corner Cases. Appl. Sci. 2024, 14, 173. [Google Scholar] [CrossRef]
  13. Kawaguchi, K.; Kumagai, H. Evaluation of Advanced Emergency Braking Systems in Drowsy Driving-Related Real-World Truck Collisions. Sleep 2025, 48, zsae196. [Google Scholar] [CrossRef]
  14. Karpenko, M.; Olegas, P. Research of the Tire Inflation Pressure Influence on Road Traffic Safety. In International Conference on Reliability and Statistics in Transportation and Communication, Riga, Latvia, 25–28 September 2024; Springer Nature Switzerland: Cham, Switzerland, 2024. [Google Scholar]
  15. Karpenko, M.; Olegas, P. Numerical Simulation of Vehicle Tyre under Various Load Conditions and Its Effect on Road Traffic Safety. Promet-Traffic Transp. 2024, 36, 1–11. [Google Scholar] [CrossRef]
  16. Ji, Z.; Zhou, J. Research on the Evaluation Method of AEB System Testing Based on Real Vehicle Testing. Automob. Technol. 2020, 5, 13–20. [Google Scholar]
  17. Tian, S.; He, P. Research on Test and Evaluation Method of Automatic Emergency Collision Avoidance for autonomous vehicle. Pract. Automot. Technol. 2019, 14, 42–46. [Google Scholar]
  18. Cicchino, J.B. Effects of Automatic Emergency Braking Systems on Pedestrian Crash Risk. Accid. Anal. Prev. 2022, 172, 106686. [Google Scholar] [CrossRef] [PubMed]
  19. Li, W.; Qiu, J. An Improved Autonomous Emergency Braking Algorithm for AGVs: Enhancing Operational Smoothness Through Multi-Stage Deceleration. Sensors 2025, 25, 2041. [Google Scholar] [CrossRef] [PubMed]
  20. Zhou, W.; Wang, X. Calibrating and Comparing Autonomous Braking Systems in Motorized-to-Non-Motorized-Vehicle Conflict Scenarios. arXiv Preprint arXiv. 2022, 23, 20636–20651. [Google Scholar] [CrossRef]
  21. Wang, Z.; Zhang, Y. Research on Automatic Emergency Braking Pedestrian System Considering Road Adhesion Coefficient. SAE Int. J. Veh. Dyn. Stab. NVH. 2025, 9, 10-09-03-0022. [Google Scholar] [CrossRef]
  22. Leng, B.; Zhao, H. Estimation of Tire-Road Peak Adhesion Coefficient for Intelligent Electric Vehicles Based on Camera and Tire Dynamics Information Fusion. Mech. Syst. Signal Process. 2020, 150, 107275. [Google Scholar] [CrossRef]
  23. Yang, L.; Chen, M. Generation of Critical Pedestrian Scenarios for Autonomous Vehicle Testing. Accid. Anal. Prev. 2025, 214, 107962. [Google Scholar] [CrossRef]
  24. Kovaceva, J.; Maier, A. Safety Benefit Assessment of Autonomous Emergency Braking and Steering Systems for the Protection of Cyclists and Pedestrians Based on a Combination of Computer Simulation and Real-World Test Results. Accid. Anal. Prev. 2020, 136, 105352. [Google Scholar] [CrossRef]
  25. Zhao, S.; Li, X. Collision-Free Emergency Planning and Control Methods for CAVs Considering Intentions of Surrounding Vehicles. ISA Trans. 2023, 136, 535–547. [Google Scholar] [CrossRef]
  26. Schachner, M.; Müller, J. Development and Evaluation of Potential Accident Scenarios Involving Pedestrians and AEB-Equipped Vehicles to Demonstrate the Efficiency of an Enhanced Open-Source Simulation Framework. Accid. Anal. Prev. 2020, 148, 105831. [Google Scholar] [CrossRef]
  27. Jang, H.; Cho, S. The Safety Evaluation Method of Advanced Emergency Braking System. Trans. Korean Soc. Automot. Eng. 2013, 21, 162–168. [Google Scholar] [CrossRef]
  28. Xu, J.; Li, L. A Rapid Verification System for Automatic Emergency Braking Control Algorithm of Passenger Car. Appl. Sci. 2022, 13, 508. [Google Scholar] [CrossRef]
  29. Duan, J.; Liu, Z. Digital Twin Test Method with LTE-V2X for Autonomous Vehicle Safety Test. IEEE Internet Things J. 2024, 11, 30161–30171. [Google Scholar] [CrossRef]
  30. Wang, R.; Zhao, X. Design of a Vehicle-in-the-Loop Virtual Simulation Test Platform for Autonomous Vehicles. Automob. Technol. 2022, 4, 1–7. [Google Scholar]
  31. Gao, Y.; Zhao, X. An Indoor Vehicle-in-the-Loop Simulation Platform Testing Method for Autonomous Emergency Braking. J. Adv. Transp. 2021, 2021, 8872889. [Google Scholar] [CrossRef]
  32. Fang, G. Development of a Vehicle-in-the-Loop AEB Test System Based on Millimeter-Wave Radar. Master’s Thesis, Beijing Jiaotong University, Beijing, China, 2023. [Google Scholar]
  33. Wang, Z. Research on Real Vehicle-in-the-Loop Test System for Intelligent Connected Vehicles Based on Digital Twin. Master’s Thesis, Hefei University of Technology, Hefei, China, 2023. [Google Scholar]
  34. Huang, W.; Tan, S. Research on the Friction Loss of a Loading Brake Tester with Adjusted Shaft Distance. Machines 2025, 13, 170. [Google Scholar] [CrossRef]
  35. GB/T 44500-2024; Inspection Procedures for Operational Safety Performance of New Energy Vehicles. Standardization Administration of the People’s Republic of China: Beijing, China, 2024.
  36. GB/T 39901-2021; Performance Requirements and Test Methods for Automatic Emergency Braking System (AEBS) of Passenger cars. Standardization Administration of the People’s Republic of China: Beijing, China, 2021.
Figure 1. Vehicle dynamics model configuration: (a) Dynamic model parameters of the E-Class sedan; (b) basic parameters of the vehicle model.
Machines 13 00458 g001
Figure 2. Simulation parameter settings of the target vehicle: (a) Initial operating parameters of the target vehicle; (b) target vehicle speed setting.
Machines 13 00458 g002
Figure 3. Construction of AEB system control model.
Machines 13 00458 g003
Figure 4. Co-simulation of CarSim and Matlab/Simulink.
Machines 13 00458 g004
Figure 5. Simulation results under test scenario 1: (a) Variations in velocity under different initial vehicle speeds; (b) output results of other evaluation metrics under different initial vehicle speeds.
Machines 13 00458 g005
Figure 6. Simulation results under test scenario 2: (a) Variations in velocity under different initial vehicle speeds; (b) output results of other evaluation metrics under different initial vehicle speeds.
Machines 13 00458 g006
Figure 7. Simulation results under test scenario 3: (a) Variations in velocity under different initial vehicle speeds; (b) output results of other evaluation metrics under different initial vehicle speeds.
Machines 13 00458 g007
Figure 8. Simulation results under test scenario 4: (a) Variations in velocity under different initial vehicle speeds; (b) output results of other evaluation metrics under different initial vehicle speeds.
Machines 13 00458 g008
Figure 9. Mechanical structure of the AEB system performance test bench: (1) front drum set frame, (2) drum set, (3) T-type reducer, (4) retractable drive shaft, (5) rear drum set frame, (6) mechanical flywheel, (7) main and assistant drum synchronizing chain, (8) AC dynamometer or eddy-current dynamometer, (9) moving guide, (10) axle weighing instrument, (11) HBM speed and torque transducer, (12) protective devices.
Machines 13 00458 g009
Figure 10. Schematic diagram of the center distance adjustment between the primary and secondary rollers.
Machines 13 00458 g010
Figure 11. Overall structural diagram of the measurement and control system.
Machines 13 00458 g011
Figure 12. Flowchart of the testing procedure.
Machines 13 00458 g012
Figure 13. Upper computer operation interface during AEB system performance testing: (a) Interface for vehicle entry onto test platform; (b) interface for vehicle inspection; (c) interface for vehicle obstacle recognition; (d) interface for completion of AEB system performance testing.
Machines 13 00458 g013
Figure 14. Test platform scenario setup.
Machines 13 00458 g014
Figure 15. Test platform results under different operating conditions: (a) Results at a vehicle speed of 20 km/h; (b) results at a vehicle speed of 30 km/h; (c) results at a vehicle speed of 40 km/h.
Machines 13 00458 g015aMachines 13 00458 g015b
Figure 16. Installation location and data acquisition of the testing equipment: (a) Installation location of the testing equipment; (b) data acquisition of the testing equipment.
Machines 13 00458 g016
Figure 17. Real-world road test scenarios.
Machines 13 00458 g017
Figure 18. Road test results under different operating conditions: (a) Results at a vehicle speed of 20 km/h; (b) results at a vehicle speed of 30 km/h; (c) results at a vehicle speed of 40 km/h.
Machines 13 00458 g018aMachines 13 00458 g018b
Figure 19. Scores of the criterion layer relative to the target layer.
Machines 13 00458 g019
Table 1. Design of simulation conditions.
Simulation Test ConditionsTest Vehicle Speed Vx (km/h)Target Vehicle Speed Vob (km/h)Road Surface Adhesion Coefficient (-)
130–80 (increment: 10)100.85
230–80 (increment: 10)100.5
380–140800.85
460200.1–1.0 (increment: 0.1)
Table 2. Hierarchical structure of the comprehensive performance evaluation model for AEB systems.
Target LayerCriterion LayerScheme Layer
Hierarchical model for comprehensive performance evaluation of AEB systemAEB system safety
AEB system reliability
Ride comfort
Braking distance dbr
Braking deceleration abr
Collision speed vc
Braking intervention time of the AEB system tbr_in
Jerk j
Table 3. Priority ranking of the AEB system under different scenarios.
DimensionPriority Scenarios
AEB system safetyLow-adhesion surface, high speed
AEB system reliabilityAdverse weather, sensor occlusion
Ride comfortUrban congestion, high-adhesion surface
Table 4. Relative importance between the criterion layer and the target layer under priority scenarios.
Criterion LayerAEB System SafetyAEB System ReliabilityRide Comfort
AEB system safety1S12S13
AEB system reliability1/S121S23
Ride comfort1/S131/S231
Table 5. Design of a sampling inspection scheme.
Test NumberVehicle Speed (S)Road Surface Adhesion Coefficient (H)
1S1 1H1 3
2S1H2
3S2 2H1 4
4S2H2
1 S1 = 0.25 (v = 30 km/h), 2 S2 = 1 (v = 120 km/h), 3 H1 = 0.2 (μ = 0.26), and 4 H2 = 0.8 (μ = 0.74).
Table 6. Consistency test results.
MatrixλmaxCICR
A13.0890.04350.0750
A23.0180.00900.0155
A33.1150.05750.0991
A43.0420.02100.0360
Table 7. Importance relationships between the target layer and the safety of the AEB system.
Evaluation IndicatorsBraking DistanceBraking DecelerationCollision SpeedBraking Intervention Time of the AEB SystemJerk
Braking distance11/21/31/55
Braking deceleration211/21/44
Collision speed3211/24
Braking intervention time of the AEB system54216
Jerk1/51/41/41/61
Table 8. Importance relationships between the target layer and the reliability of the AEB system.
Evaluation IndicatorsBraking DistanceBraking DecelerationCollision SpeedBraking Intervention Time of the AEB SystemJerk
Braking distance121/21/53
Braking deceleration1/211/31/62
Collision speed2311/34
Braking intervention time of the AEB system56317
Jerk1/31/21/41/71
Table 9. Importance relationships between the target layer and ride comfort.
Evaluation IndicatorsBraking DistanceBraking DecelerationCollision SpeedBraking Intervention Time of the AEB SystemJerk
Braking distance11/31/21/41/5
Braking deceleration3121/21/3
Collision speed21/211/31/4
Braking intervention time of the AEB system42311/2
Jerk53421
Table 10. Consistency test results of the importance relationship between the target layer and the criterion layer.
MatrixλmaxCICR
B15.27340.06840.0610
B25.10140.02540.0226
B35.08000.02000.0179
Table 11. Selection of testing equipment.
Equipment NameModelMain Specifications
Industrial computerIPC-610LMotherboard model: Windows 10; processor: PCA-6113P4R; power supply: 250 W/220 V/50 Hz ATX; compatible with Keil, Microsoft SQL Server, DAVE, and Delphi software (12.3 Athens).
Vehicle speed sensorE50S8-1000-3-T-24Shaft-type rotary encoder with an outer diameter of Φ50 mm; maximum response frequency: 300 kHz; supply voltage: 12–24 VDC ± 5%; resolution: 1000 pulses per revolution.
Wheel speed sensorE50S8-200-3-T-24Shaft-type rotary encoder with an outer diameter of Φ50 mm; maximum response frequency: 300 kHz; supply voltage: 12–24 VDC ± 5%; resolution: 1000 pulses per revolution.
Displacement sensorKTC-500Nominal stroke: 500 mm; relative linearity accuracy: ±0.05% FS; resolution: infinite (wireless); repeatability accuracy: 0.01 mm.
AC dynamometerYVF2-200L2-2Asynchronous induction motor; rated power: 37 kW; rated speed: 3000 r/min; rated current: 68.3 A; rated torque: 118 N∙m.
Variable frequency control systemACS880-01-087A-03Direct torque control; rated power: 45 kW; RS-485 communication interface.
Speed and torque measurement instrumentHBM T21WN360 pulses per revolution; maximum speed: 20,000 r/min; maximum torque: 200 N∙m; accuracy class: 0.2.
Table 12. Parameter configuration of the Volvo S90L.
ParameterConfiguration
Wheelbase3061 mm
Drive typeFront-wheel drive
Braking systemVentilated disc brakes (front and rear)
Maximum power output184 kW
Safety configurationLevel 2 automated driving assistance
AEB system sensor typeMulti-sensor fusion of vision sensors and radar
Number of sensors16
Sensor detection range360 Degree
Sensor detection distance200 m
Table 13. Configuration of testing conditions.
Test ScenarioTest Vehicle Speed Vx (km/h)Target Vehicle Speed Vob (km/h)Relative Distance (m)Road Surface Adhesion Coefficient (-)
Pedestrian crossing20, 30, 40550.8
Table 14. Analysis of test results across different scenarios and operational conditions.
Speed (km/h)WarningCollision Avoidance StatusBraking Intervention Time (s)Collision Speed (km/h)Braking Distance (m)MFDD (m/s2)Mean Jerk (m/s3)
201.205.236.201.485
301.2405.657.343.056
40×0.8120.78.337.495.625
Table 15. Configuration of road test conditions.
Test ScenarioTest Vehicle Speed Vx (km/h)Target Vehicle Speed Vob (km/h)Lighting ConditionRoad Information
120, 30, 405DaytimeIntersection
Table 16. Parameter configuration of the automotive dynamic performance testing system.
Measured VariablesMeasurement RangeMeasurement Accuracy
Vehicle forward speed0.1 m/s–70 m/s<±0.1%
Longitudinal acceleration±29.4 m/s2±0.1% of full scale
Lateral acceleration
Yaw rate±150 °/s
Table 17. Road test results of the AEB system performance on the Volvo S90L.
Speed (km/h)WarningCollision Avoidance StatusBraking Intervention Time (s)Collision Speed (km/h)Braking Distance (m)MFDD (m/s2)Mean Jerk (m/s3)
201.7903.8614.483.252
301.8807.344.435.460
403.207.896.863.875
Table 18. Normalized results of evaluation metrics across different testing methods.
Testing MethodSpeedBraking DistanceMFDDCollision SpeedBraking Intervention Time of the AEB SystemJerk
VIL test0.1670.94770.57910.2570.946
0.2500.94350.70410.2680.772
0.3330.91670.7210.82750.2190.486
Road test0.1670.96140.38810.3580.749
0.2500.92660.38110.3760.504
0.3330.92110.65110.5400.681
Table 19. Scores of the scheme layer relative to the criterion layer.
Testing MethodSpeedAEB System SafetyAEB System ReliabilityRide Comfort
VIL test0.1670.59190.57110.7124
0.2500.60690.57700.6629
0.3330.52870.48760.5159
Road test0.1670.60140.59410.6279
0.2500.59350.58710.5277
0.3330.71590.70230.6865
Table 20. Comprehensive performance scores of the AEB system under different testing methods.
Testing MethodSpeedComprehensive Performance Score of the AEB SystemTotal Score
VIL test0.1674.454013.8341
0.2504.8774
0.3334.5027
Road test0.1674.455013.9048
0.2504.2568
0.3335.1929
Disclaimer/Publisher’s Note: The statements, opinions and data contained in all publications are solely those of the individual author(s) and contributor(s) and not of MDPI and/or the editor(s). MDPI and/or the editor(s) disclaim responsibility for any injury to people or property resulting from any ideas, methods, instructions or products referred to in the content.

