1. Introduction
Naturally, certain parts of technical systems are subject to wear and tear; thus, they need to be replaced or repaired over time. Due to the ever-increasing expectations regarding efficiency, economy, and reaction time, cost reduction, increasing the availability and efficiency of production equipment, and minimizing inventory are all extremely important factors for the maintenance activity. The modern operations management approach does not support a large inventory of spare parts, and it is not economically acceptable for the capital to waste in the form of inventory on the shelves. The solution to the paradox of immediate reaction and minimal stock is that the company reduces the lead time for the acquisition of the necessary parts as much as possible. Especially in the case of parts that require a long procurement time or are of critical importance, it is important for the operator to be prepared to replace the damaged part. The development of additive manufacturing technologies offers a great opportunity to deal with the problem: the parts can be reproduced and “printed” on site, thus reducing the procurement time to the part’s printing time [
1,
2,
3]. If there are no strict requirements on the accuracy or load-carrying capacity of the part, even relatively inexpensive and affordable 3D printers are suitable for printing, and the cost of the printed part will be acceptable [
4].
The research presented in this paper was inspired by the real industry, in which it is necessary to be prepared for the possible replacement of a polymer gear in equipment. The gear is an element of a low-power gear drive, and is in mesh with another polymer gear. Knowing the data of the existing gear wheel, a CAD model of the part was created, and based on this, samples of the model were printed using various types of 3D printing equipment. In this study, we were looking for the answer to the following question: what geometric deviations do the polymer gears made with 3D printing have compared to the theoretical geometry? From a practical point of view, the final question to be answered is whether the injection-molded polymer gear can be replaced by the 3D-printed gear, so the measurements were also performed on the sample gear and a comparison was made with this data as well.
It should be noted that in addition to the geometric parameters, the load-carrying capacity of the gear must also be taken into account. In order to determine the load capacity, in our case, a tooth fracture test and a fatigue test may be performed. In this study, we do not have the opportunity to present this investigation; we focus exclusively on checking the geometric parameters.
2. Nomenclatures
In this section, nomenclatures are provided.
Table 1 contains the abbreviations used and their descriptions.
3. Application of Additive Manufacturing in Gear Drive Technology—Literature Review
Due to the development of technical polymers, parts made of polymer are becoming more and more widely applicable [
5]. The advantages of using polymers include their relatively low weight, corrosion resistance, wear resistance, vibration absorption, electrical insulation, and relatively low production and material costs. The limitations of their application are primarily their limited load-bearing capacity. In the case of small production quantities, it is advisable to use additive manufacturing processes, also known as 3D printing. Thanks to the development of this technology, it is becoming more accessible and is now widely used in various industries, such as the automotive, aerospace, medical, and architectural industries [
6].
With the spread of 3D printing, several studies were carried out focusing on the properties of printed parts and mapping the application possibilities. Many studies deal with the effect of printing parameters and their optimal determination [
7,
8,
9,
10,
11,
12,
13,
14,
15]. The study in [
16] deals with the geometric accuracy of 3D-printed composite parts and investigates how the Coefficient of Thermal Expansion and Moisture Absorption of the material affect the dimensional accuracy. In the literature [
17], the accuracy of FDM technology and masked stereolithography technology is compared through the production of specimens with a standard complex structure. According to their findings, FDM produces smaller dimensional deviations. In the paper by [
18], the authors compare the mechanical properties of PLA and ABS materials produced using FDM technology. Several studies deal with the tribological properties and wear of printed elements as well [
19,
20,
21,
22].
In the field of polymer gear drives, until recently, the use of injection-molded polymer gears was widespread. Polymer gears are mainly used as elements of low-power drives, where the main task is not so much the transmission of torque, but rather the realization of the desired kinematics [
23]. Such drives can be found in the automotive industry, textile industry, food industry, etc. An extensive review is presented in the study by [
24], which reviews the properties and materials used for polymer gears. The study by [
25] presents a method for the optimal design and parameter determination of polymer gears.
In the field of gears produced by additive manufacturing technologies, some of the studies deal with the strength properties, load-carrying capacity, and wear of printed gears. In [
26], the authors specifically focus on the additive manufacturing of gears and use a machine learning method to determine the optimal printing parameters. In [
27], the authors investigate how different raw materials affect the properties of gears printed from them. In [
28], the authors study the failure of nylon 3D-printed gears and determine the effect of one of the most important printing parameters, the infill percentage. The paper by [
29] deals with the investigation of the mechanical properties of spur gears made with the additive process. In [
30], the authors examine the effect of layer orientation on the single-tooth bending fatigue strength of polymer gears. The study by [
31] experimentally examines the wear and service life of gears made of PLA, ABS and PETG manufactured with FDM technology.
The focus of other studies is mainly on the accuracy of the gear wheels and the effect of individual printing parameters, different technologies or raw materials on geometrical deviations. In [
32], the effect of the infill shape pattern, built plate temperature, and nozzle speed is investigated on the surface finish and geometric dimensions through the production and analysis of gears printed from ABS material. According to their findings, the most influencing factor is the printing speed. In [
33], the accuracy of different additive manufacturing technologies is compared through the printing of different types of geared machine elements. In [
34], the authors analyzed the effect of material deposition direction on the geometrical accuracy of spur gears. They applied FDM technology with PA and ABS materials. The scope of [
35] was to determine the influence of the layer thickness and the gear helix angle on the precision of PLA gears produced by FDM technology. In [
36], the authors compare the geometric accuracy of gears made with FDM technology, using PLA and Nylon-PA6 as raw materials. They perform span measurements as well as diameter, roundness and concentricity measurements of the root circle and tip circle. Although the latter parameters are not very important in the operating performance of the gear, they are suitable for the comparison of various gears.
We have not found any literature which deals with the comparison of injection-molded and 3D-printed samples, especially spur gears.
4. Methodology of the Research
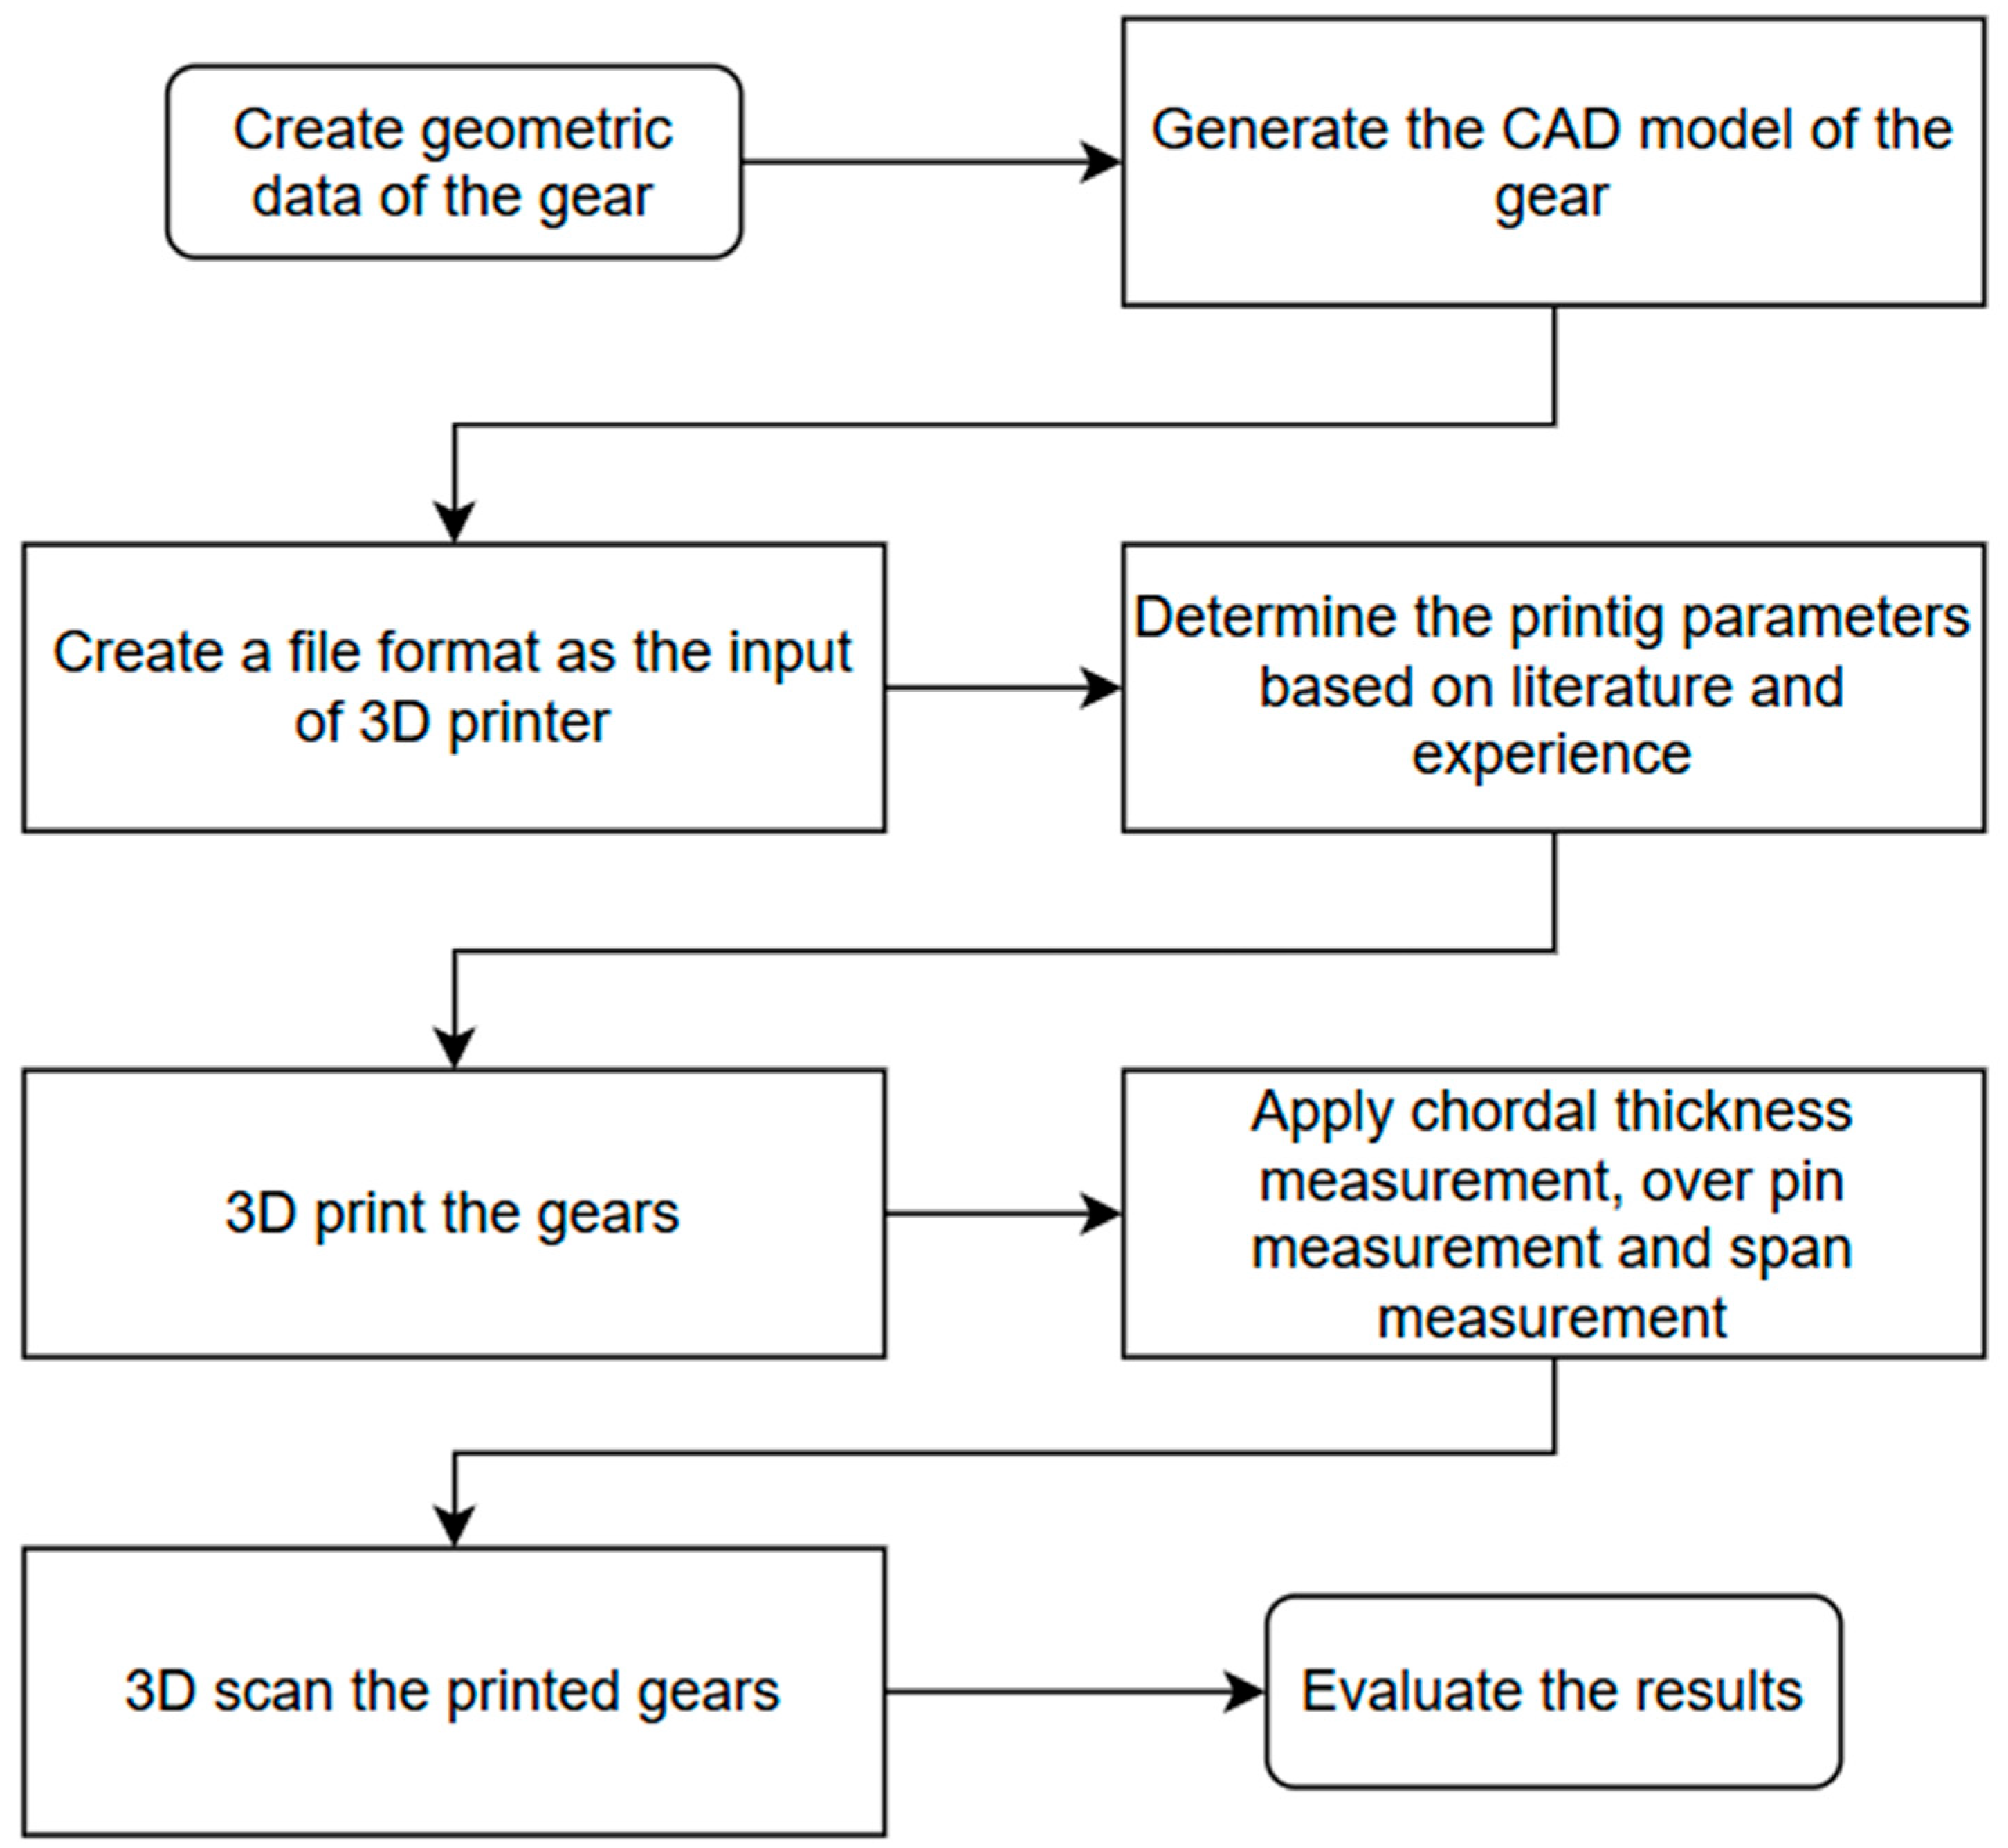
According to the applied methodology, first, the geometric parameters of the gear requiring replacement were determined. Based on the gear reconstruction, the CAD model of the gear was generated, for which we used SolidEdge 2022 design software. To build the 3D model, first, the involute gear profile was calculated, then the contour of the whole gear was generated; finally, the 3D body was built due to the extrusion of the contour. In this software, it was also possible to create a file format that can be used by the 3D printers. Based on the model, 3-3 gears on 2 different 3D printers were produced: 3 gears on Ultimaker 3 and 3 pieces on the Formlabs Form 3 printer. It was necessary and also sufficient to produce 6 pieces altogether in order to observe the size variation of each printer. Since the printing parameters (layer thickness, speed, temperature, etc.) can significantly affect the quality of the final product, the printing parameters were not subject to change in this research. The printing parameters were determined based on literature recommendations and our previous experience in such a way that they resulted in the most accurate dimensions.
The printed gears were then subjected to a geometrical check. During the inspection, the chordal thickness of the gear wheel was measured using a gear tool caliper, instead of pin measurement and span measurement using a special micrometer. A surface roughness measurement was carried out as well. It is important to mention that the measurements were taken in three positions for one gear, in order to obtain the most accurate picture of any deformation of the wheels. Each gear was characterized by the average of the measured values. The mentioned parameters were measured on each sample and on the original injection-molded gear as well, thus enabling a comparison. In addition to the classical measuring methods, we applied 3D scanning and analysis as well, for which we used GOM Inspect Suite 2020 software.
Figure 1 shows the flowchart of the methodology.
5. Materials and Parameters
The injection-molded gear, subject of this study, is an element of a low-power gear drive, and is in mesh with another polymer gear. It is a cylindrical spur gear with elementary teeth, the data of which are summarized in
Table 2. Diameters and other data can be determined by calculation. The basic data of the gear was reconstructed by measurements, then the CAD model and STL format required for 3D printing were generated. The gear is shown in
Figure 2.
6. Data of the 3D-Printed Gears
The generated CAD model was printed on two different 3D printers. One of them is based on FDM technology, also known as Fused Filament Fabrication (FFF). FDM technology builds parts by depositing melted material in a predetermined path. The raw material is thermoplastic polymer that comes in filaments. The Ultimaker 3 Printer machine was used, with the parameters summarized in
Table 3. The printing parameters were determined based on literature recommendations and on our previous experience. Since the parameters significantly influence the quality of the finished product, it is necessary to experiment with different parameter settings. However, this is outside of the focus of this paper. The axis of the gear was perpendicular to the base table.
The other applied machine was the Formlabs Form 3-type 3D printer. This equipment is based on stereolithography (SLA) technology, which is one of the most detailed 3D printing technologies. According to the technology, the synthetic resin base material is polymerized by a UV laser beam in the set layer height. The Form 3 printer is considered to have LFS technology, which provides greater detail than the usual SLA. In this machine, there is a very limited possibility to modify the printing parameters; thus, the default settings were applied. As recommended by the manufacturer, the axis of the gear was tilted in the printer. The tilted orientation of the part is a common practice with this technology: it helps maintain proper support of the part during the printing process and enables easy removal of the finished part. The 3-3 gears printed with the two different technologies are shown in
Figure 3.
Table 4 provides some detailed information about PLA and ABS material properties.
7. Applied Measuring Methods
The application and production of gears has a long history; accordingly, many methods have been developed to reveal various manufacturing defects, measure parameters, and determine quality. In terms of error types, we can distinguish between individual and complex errors. In the case of individual (analytical) errors, the value of the measured characteristic is independent of other parameters; thus, it can be precisely identified. Individual measurements include the measurement of tooth thickness (gear span measurement, pin measurement, chordal thickness measurement), measurement of the radial runout, tooth profile, and pitch. In the case of complex error measurement, we do not examine a single characteristic or property, but rather we can determine the combined effect of the errors with the aim of determining whether the gear is suitable or not. A complex error measurement procedure is, for example, the two-profile rolling error measurement or the contact zone analysis.
One of the most important methods to check the quality of a gear is the measurement of the tooth thickness, so this study was also based on this parameter. As mentioned earlier, the span measurement, pin measurement, and chordal thickness measurement methods were used to check the tooth thickness of the printed gears as well as the original injection-molded gear.
7.1. Span Measurement
Span measurement is one of the most common measurement methods. The schematic view of the measurement is shown in
Figure 3. If the number of included teeth is well defined, the flat plates of the measuring instrument (gear span micrometer) lie close to the pitch circle (points A and B). On the basis of
Figure 3 and knowing the generation of the involute curve, it can be stated that the line AB is perpendicular to the profile; therefore, it touches the base circle at point N. The length of the segment AB measured with the measuring instrument is the actual gear span (W), which must be compared with the value of the calculated gear span for evaluation.
The first step is to determine the number of teeth over which the span can be measured. In the case of a pressure angle of α = 20°, without detailing and substituting, the data of the sample gear is as follows [
37]:
where
z is the number of teeth. The schematic view of the span measurement is shown in
Figure 4.
Based on the calculated value of
k, it is advisable to measure the gear span over three or four teeth. To calculate the theoretical gear span, based on the definition of the involute curve and on
Figure 3, the following equation was used [
37]:
where
W is the gear span, and
pb is the base pitch [
37]:
and
sb is the base tooth thickness [
37]:
In the equations,
m denotes the module,
rb the radius of the base circle,
r the radius of the pitch circle, and
s the tooth thickness. Omitting the further substitutional and simplification steps, the value of the gear span can be calculated with the following equation [
37]:
In our case, the value of the gear span over three teeth W3 = 15.461 mm, and over four teeth W4 = 21.365 mm.
7.2. Pin Measurement
Pin measurement is one of the most accurate gear measurement methods used to check tooth thickness. During the measurement, as shown in
Figure 5, two measuring pins with a diameter of
δM are placed opposite of each other in between the teeth. The value of the pin size
M is measured with a micrometer and then compared with the calculated theoretical value of
M. The calculation for an odd number of teeth can be carried out with the equation [
38]
where
dM is [
38]
The value of
αM can be calculated from the following relation based on
Figure 4 [
38]:
In our case, the measurements were carried out using a pin diameter of δM = 4 mm; thus, the calculated theoretical value of M is M = 56.516 mm.
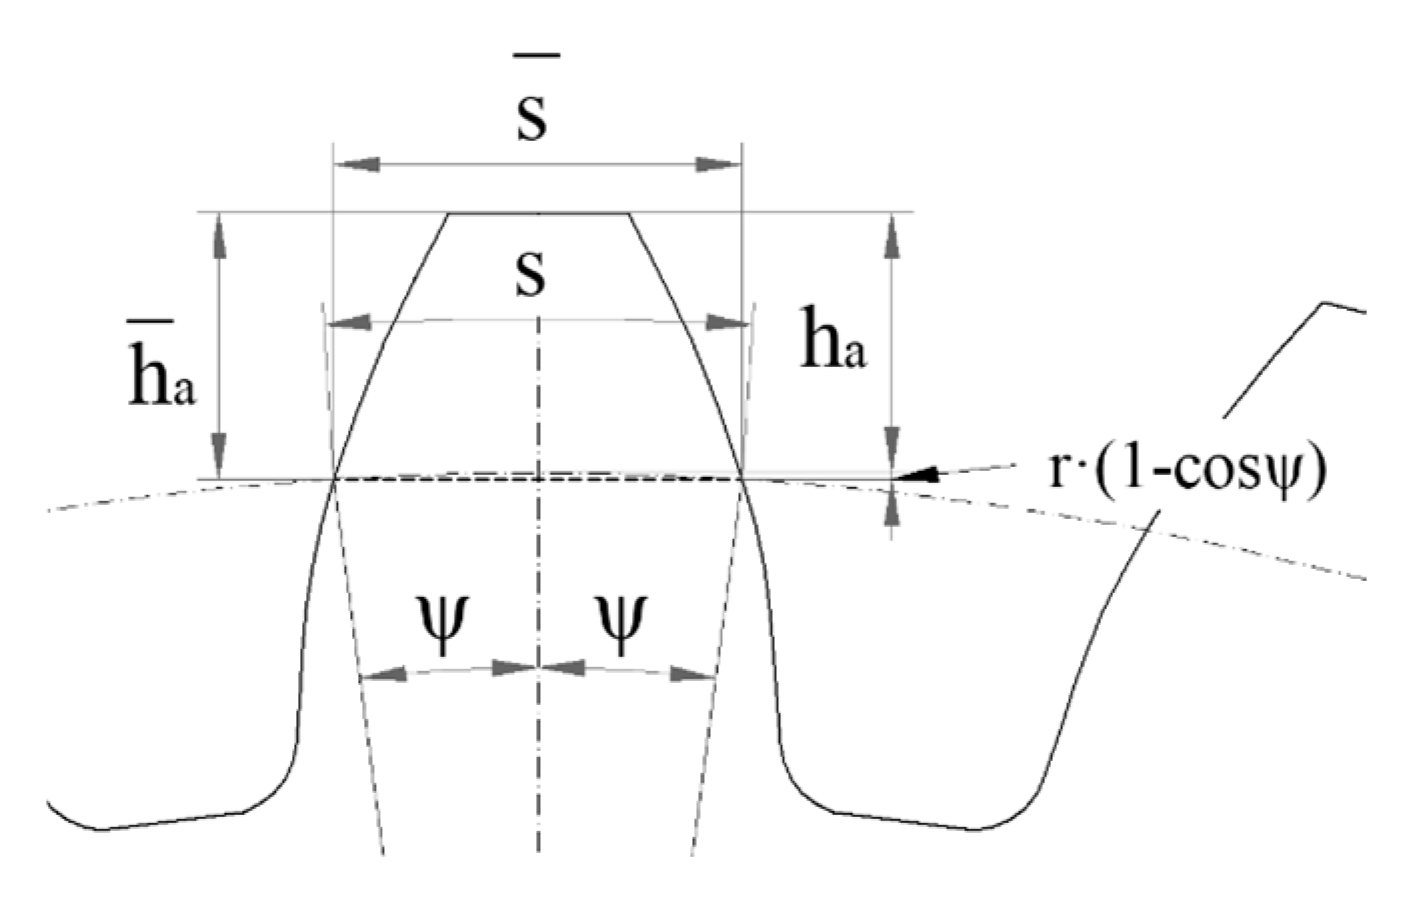
7.3. Chordal Thickness Measurement
The oldest method used to measure the tooth thickness is the chordal thickness measurement. With this measurement method, the chord thickness (
) of the normal tooth thickness on the pitch circle is measured so that the instrument rests on the addendum circle (top surface), as seen in
Figure 6. The instrument is a gear tooth caliper, with the help of which the chordal thickness (
) of a tooth can be measured on the adjusted measuring height (
).
The measuring height is set on the vertical caliper, thus ensuring that the chordal thickness
of the tooth thickness
s will be measured with the horizontal caliper. It should be noted that the accuracy of the measurement can be significantly affected by the fact that the addendum circle is usually made with a relatively rough tolerance. The measured value of the chordal thickness is then compared to the calculated value, which can be determined using the following equation [
39]:
where ψ is the central angle of the tooth thickness and can be calculated by the equation [
39]
The measuring height to adjust can be calculated as follows [
39]:
In our case, omitting the substitution, the following values are calculated:
7.4. Surface Roughness Measurement
For the measurement of the surface roughness, a contact-type surface roughness/profile measuring instrument was used, which detects the real profile by dragging a measuring pin along the surface to be measured. Based on the detected profile, the machine’s software automatically calculates the R
a, R
z, and R
max values. The measurement length was determined by the EN ISO 4287 standard [
40]. According to the standard, a measuring length of 0.8 mm was used for the injection-molded gear due to the smaller surface roughness, and a measuring length of 2.5 mm was used for the printed samples due to their higher roughness. The measurement direction was the same as the tooth direction. In all the cases, the measurement was made at a multiple of the measurement length, and the equipment calculated an average value from these values. These average values of the detected surface roughness values are analyzed.
8. Measurement Results
The measurements were performed on all three gears made on both printers as well as on the original injection-molded gear. On each gear, the measurement was carried out in three positions so that each position was 120° apart, as seen in
Figure 7.
The three values measured on one gear sample were then averaged. Then, the values measured on the three gears manufactured with the same printing technology were also averaged. Based on this, the standard deviation within one gear and the relative error compared to the theoretical value were calculated. The results of the span measurement are shown in
Table 5, the results of the pin measurement are shown in
Table 6, and the results of the chordal thickness measurement are shown in
Table 7. The value of the surface roughness was also determined for each gear in the dedicated positions. The results of the surface roughness measurement are summarized in
Table 8.
9. Three-Dimensional Scanning of the Gears
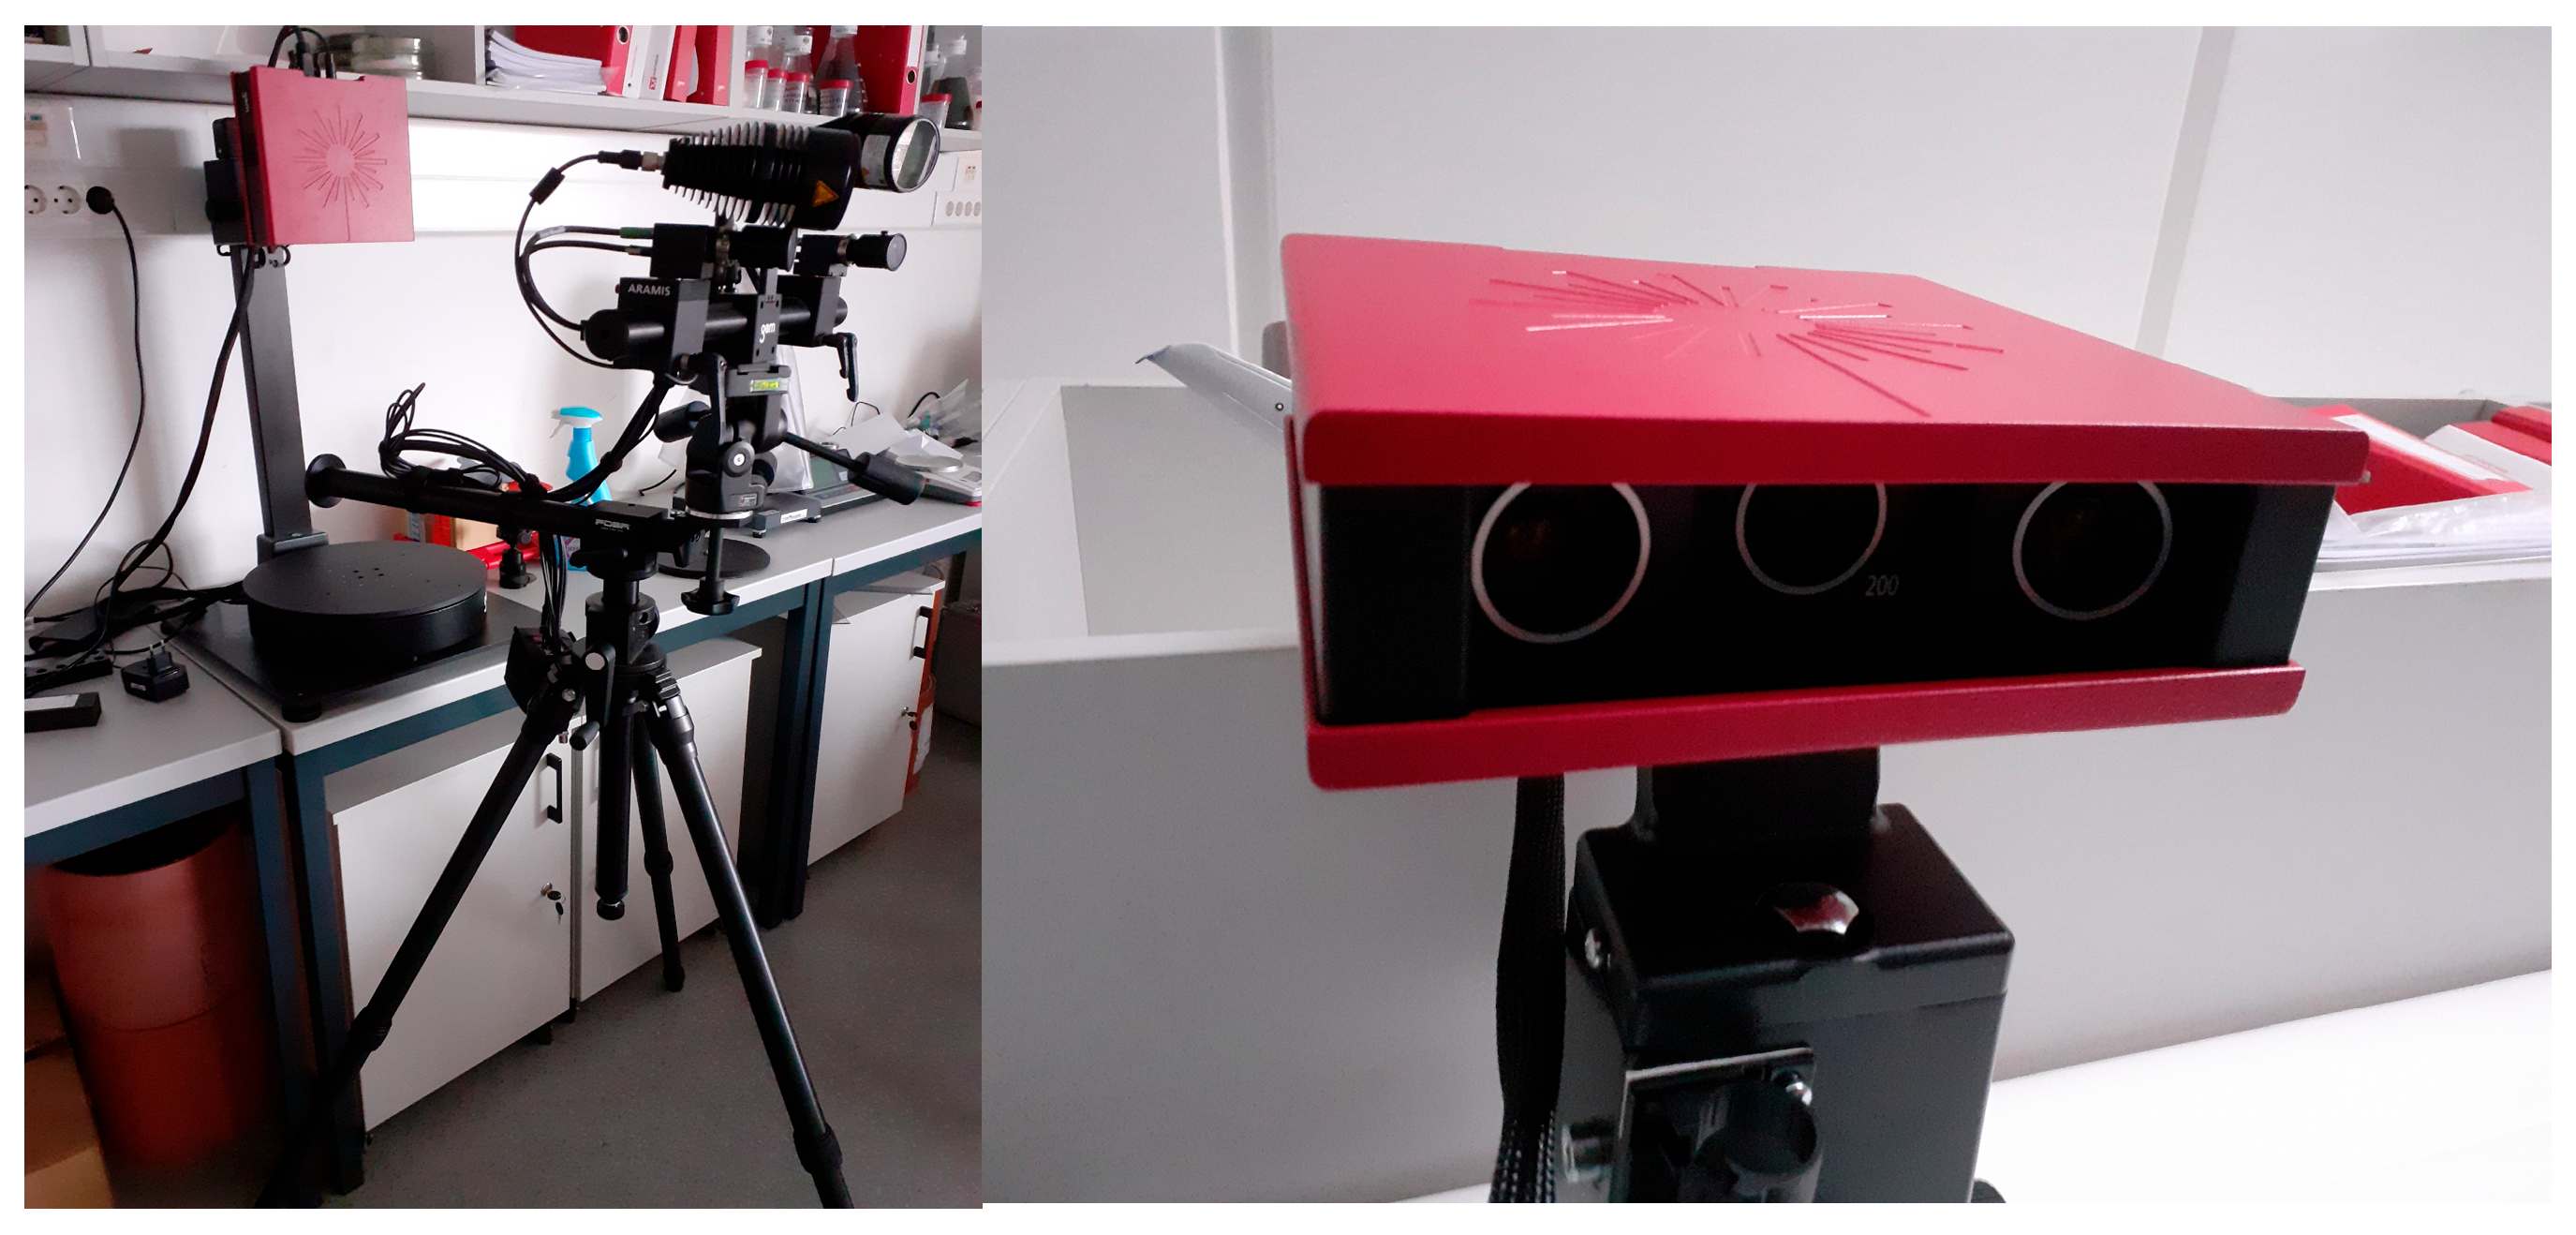
Each gear was 3D-scanned in order to obtain more precise data regarding the tooth surface geometry. For this purpose, the GOM Inspection 3D scanning hardware and software system was utilized. The GOM ATOS Core hardware is the specialist hardware for the three-dimensional measurement of small components up to 500 mm in size. It generates high-quality 3D data for applications such as reverse engineering and rapid prototyping in design and product development and enables efficient quality control. ATOS Core is used for the measurement of small and medium-sized objects, such as ceramic cores and cast or plastic parts. The theoretical accuracy of the scanner is influenced by system calibration, the measurement environment, and the characteristics of the measured object. The ATOS Core 200 generally provides high accuracy, but the exact values depend on the specific application and conditions. During the measurement, precise fringe patterns are projected onto the surface of the object and are recorded by two cameras and the projector unit. Thus, 3D surface points from three different ray intersections can be calculated. The sensor recognizes changing ambient conditions during operation and can compensate for these changes. To ensure the quality of the measuring data, the software of the sensor is continuously monitoring the calibration status, the transformation accuracy, environmental changes and part movements. The GOM software packages have been tested and certified by the PTB and NIST institutes, ensuring the reliability of the measurement results. In
Table 9, there is some further technical information about the 3D scanner used.
The measurement was set as
Figure 8 shows.
A matting spray was applied to each gear prior to 3D scanning in order to reduce surface reflectivity, thereby facilitating more accurate data acquisition during the scanning process.
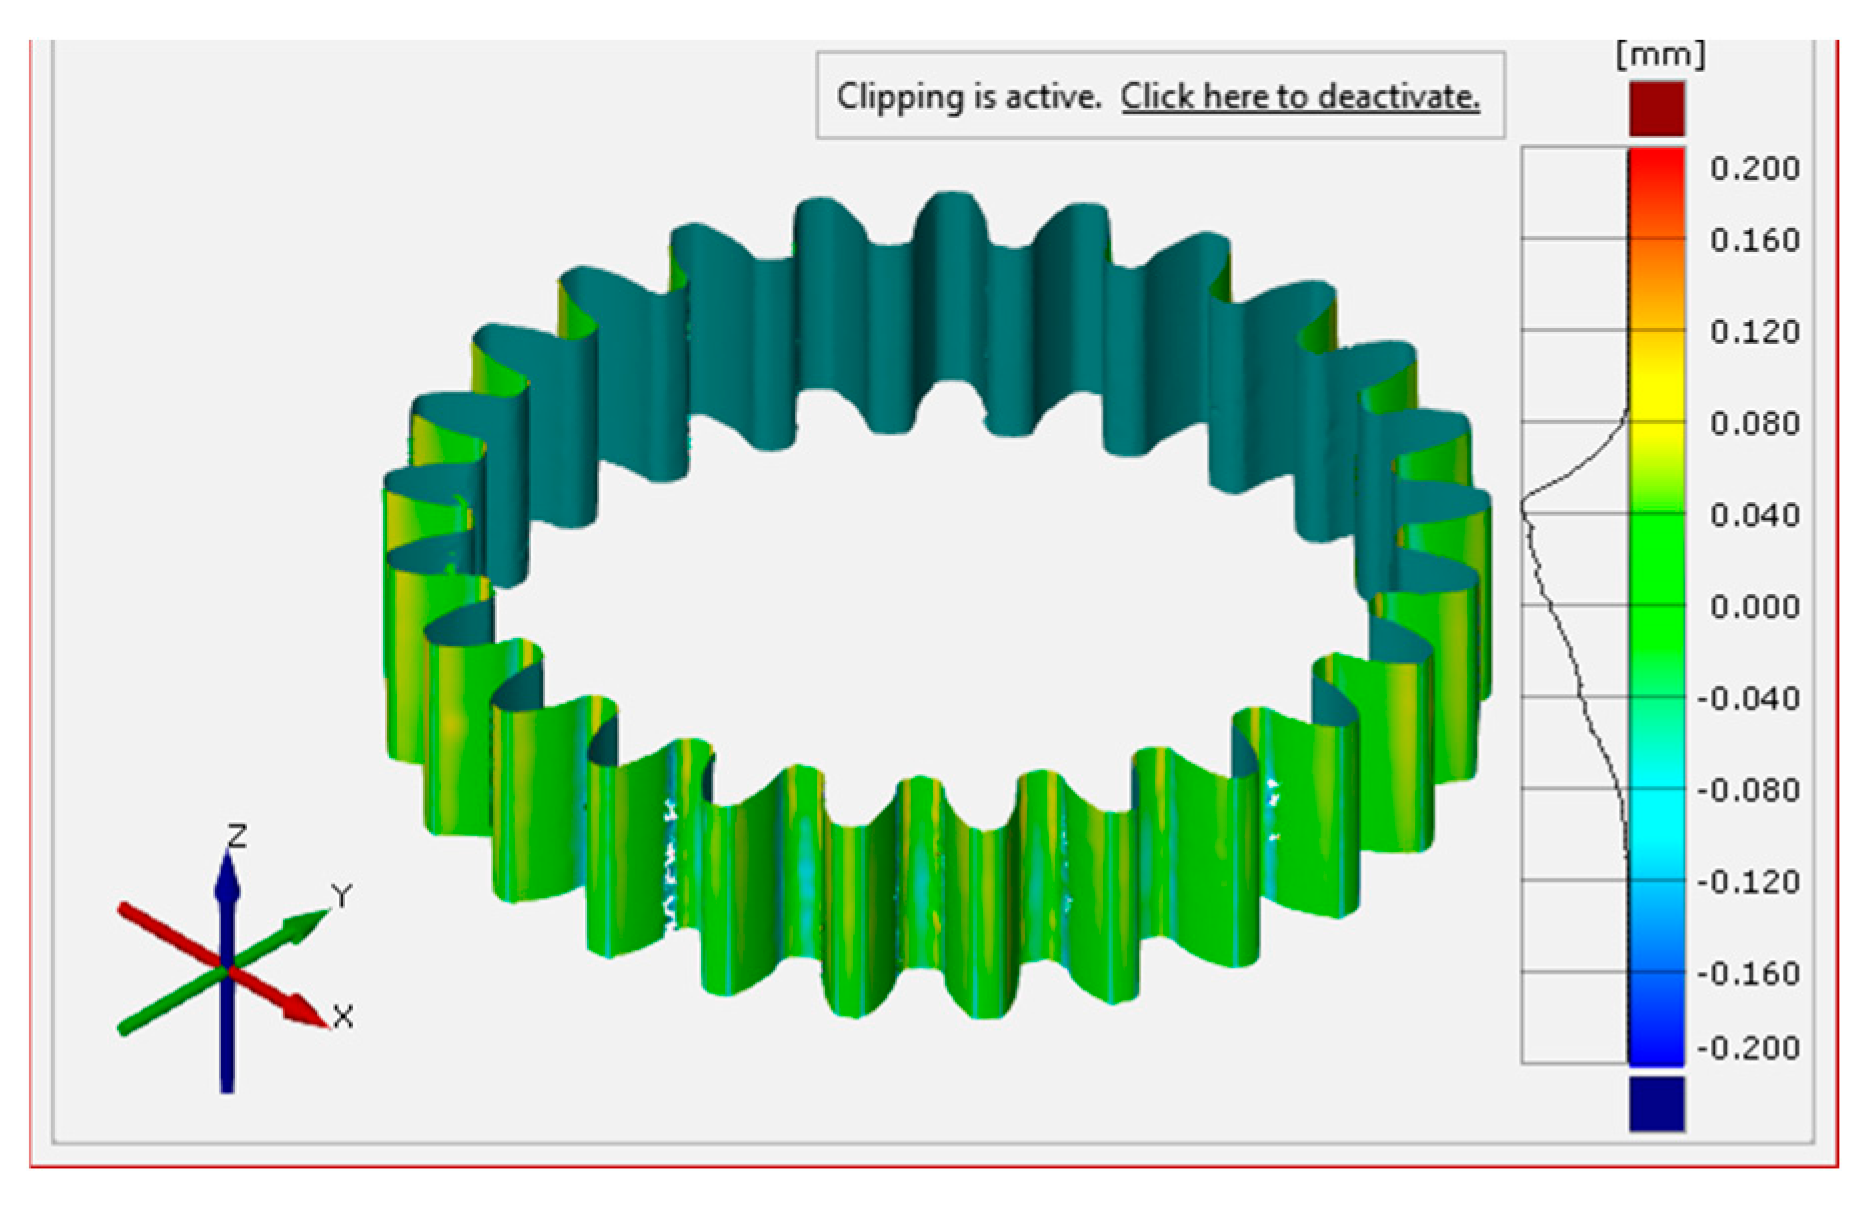
10. Results of the 3D Scanning
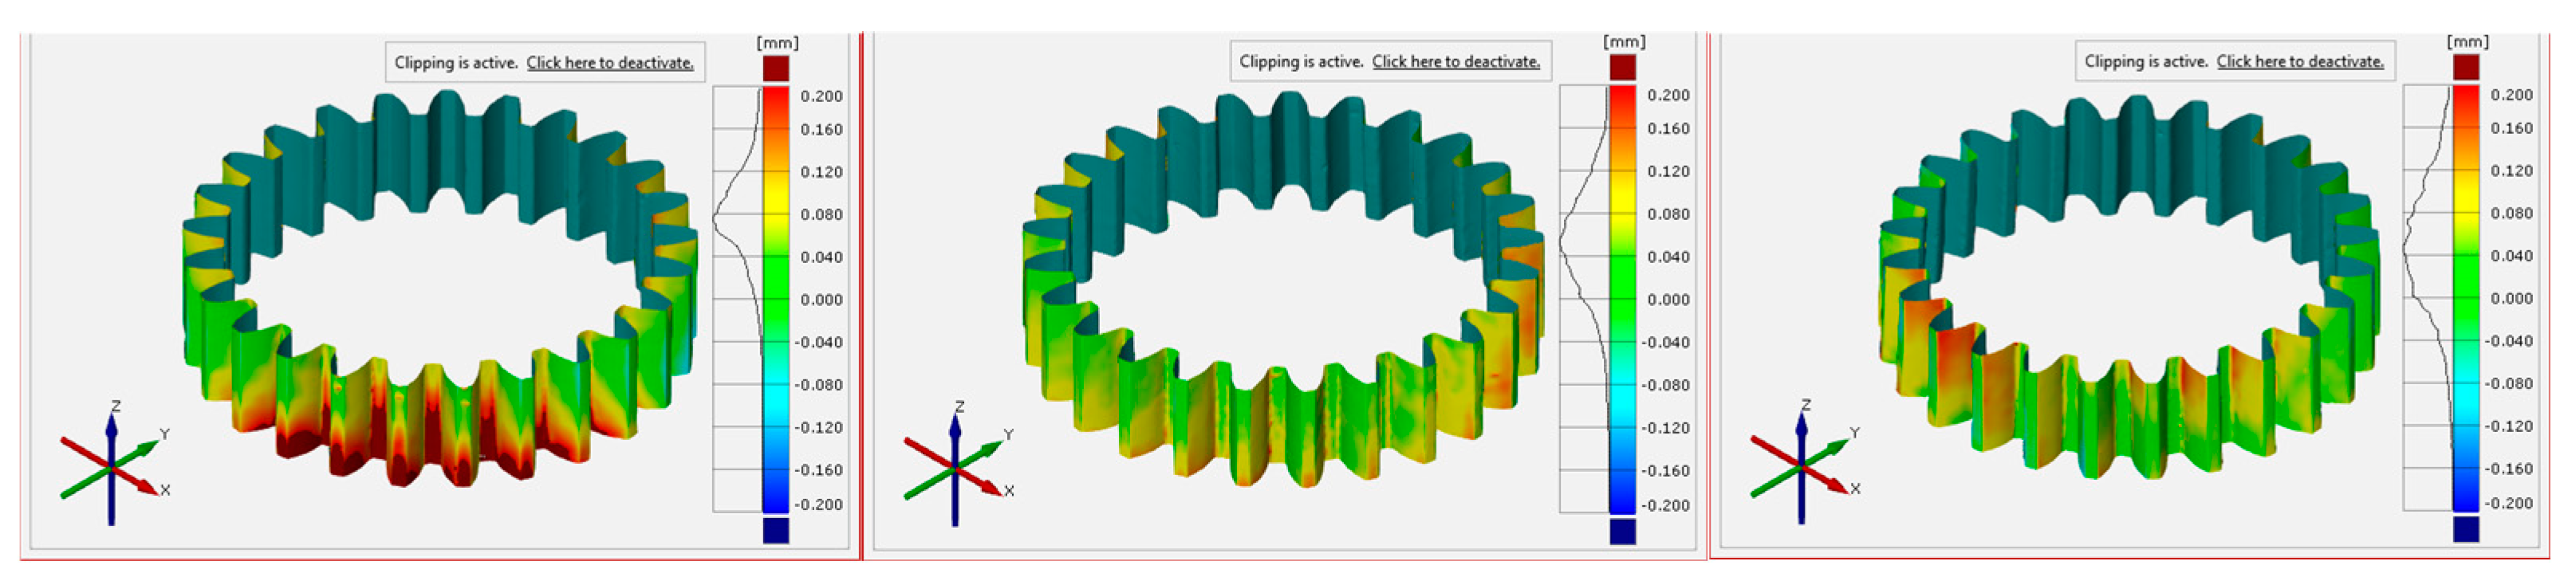
Our focus was solely on the surfaces of the teeth, since this data affects the quality of the meshing and running of the gears to a large degree. The surfaces generated by the 3D scanning were compared to the surfaces of the theoretical CAD model. The injection-molded gear was found to be the most precise in terms of surface deviation, as shown in
Figure 9.
As illustrated in the figure, certain sections of the gear appear to be missing. This is attributed to the reflective surface of the injection-molded gear, which interfered with the accuracy of the 3D scanning process. The results for the FDM-manufactured gears, presented in
Figure 10, more closely align with the theoretical model than those of the SLS-manufactured gears, shown in
Figure 11.
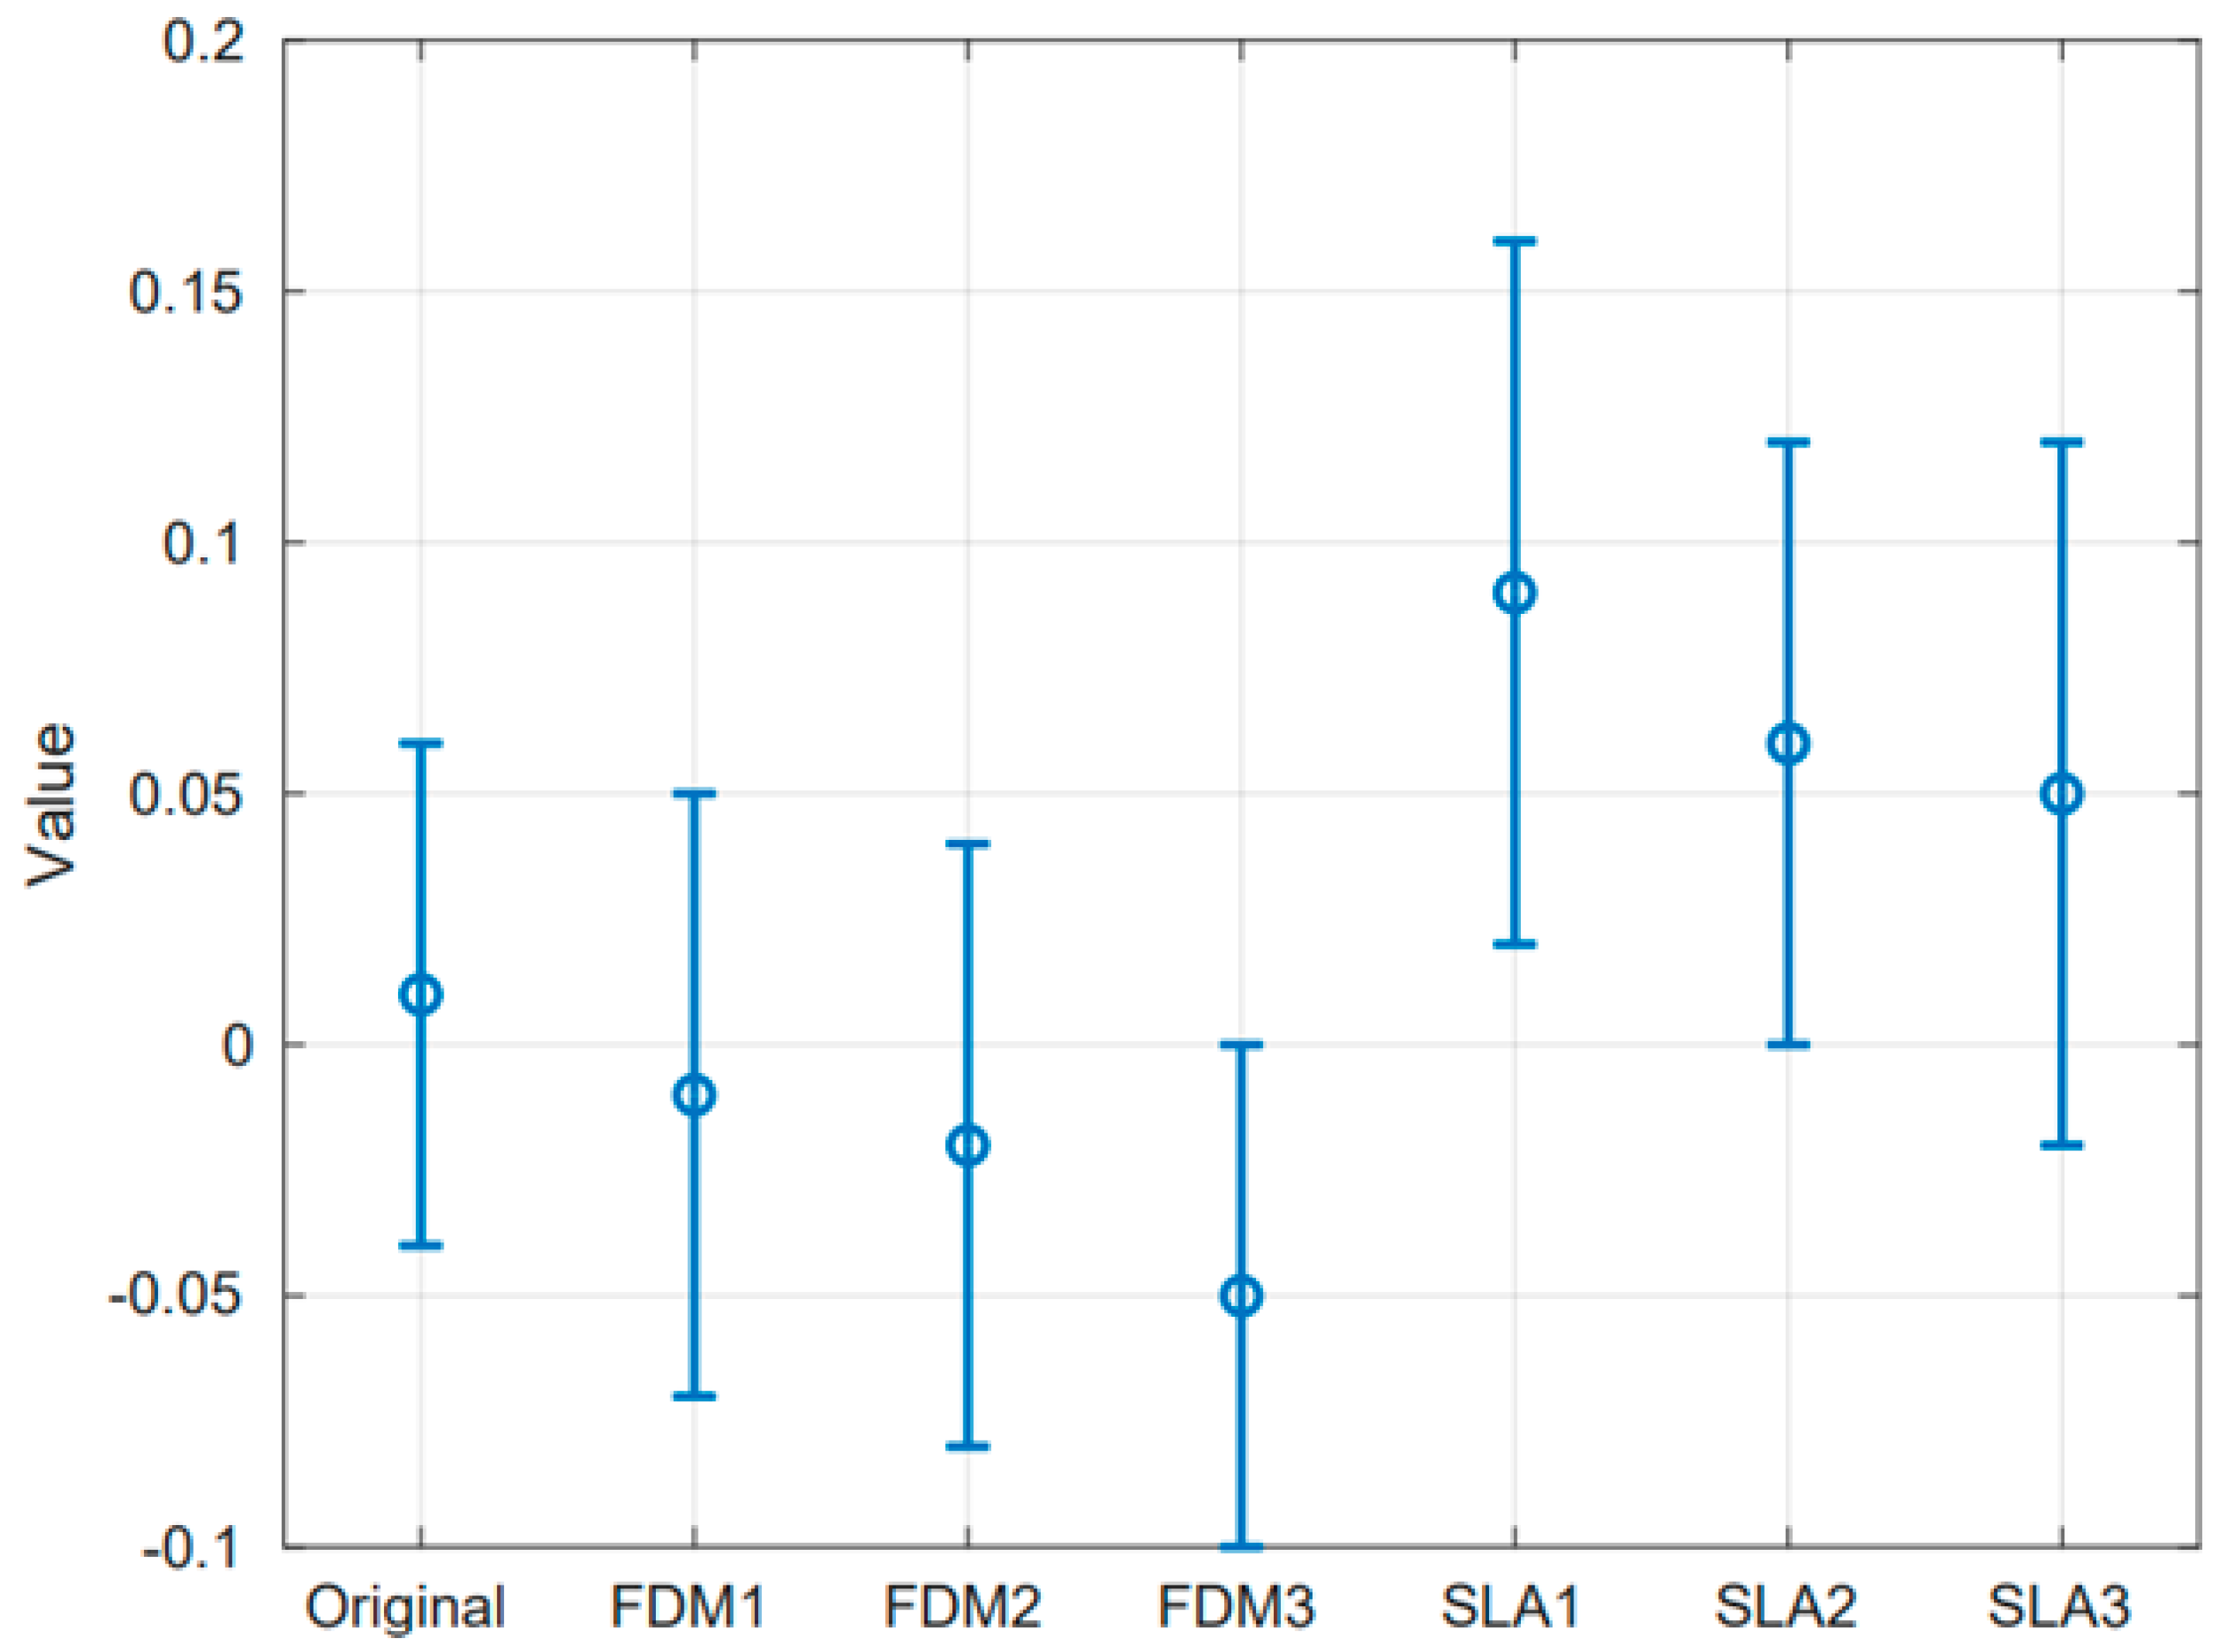
In addition, the data clearly indicate that SLS gears tend to exceed the theoretical dimensions in certain regions, whereas FDM gears typically fall below the theoretical values in those areas. This is due to the different 3D printing technology: in the case of FDM, the melted parts are deposited based on the theoretical geometry, and as they solidify, they shrink. In
Scheme 1, this trend can be clearly seen.
11. Discussion
Analyzing the collected data shown in the tables and based on the 3D scanning, it is reasonable to suppose that the gears produced with the FDM technology (Ultimaker machine, PLA material) outperform in terms of accuracy: the deviations from the theoretical dimensions are smaller and the relative errors are also lower than those of the gears produced with SLS technology (Form3 machine, resin material). Furthermore, the standard deviation calculated for individual FDM gears is lower, indicating a higher level of consistency in manufacturing quality compared to SLS-produced gears. Gears produced with SLS technology have larger dimensional deviations, and the relative error is significantly higher for each measured parameter. Although it was not directly measured, a runout error of the SLS gears can also be recognized based on the results of the pin measurement (the standard deviation is significantly higher). Following the analysis of the measured values at each position, the observed deviations can likely be attributed to the inclined orientation of the gears during the printing process. The relative error and standard deviation values for both FDM and SLS gears exceed those observed in the injection-molded reference gear, indicating reduced dimensional accuracy. In terms of surface roughness, it can be concluded that the SLS gears have better results, but worse than the injection-molded gear.
12. Conclusions
With regard to the practical applicability of the printed gears, FDM technology satisfies the requirements for dimensional accuracy; however, the resulting surface roughness exceeds the acceptable limits for the intended application. The higher surface roughness is due to the larger layer thickness of the technology, and thus, it cannot be significantly improved. If it is possible to improve the surface roughness in the framework of post-processing, then the technology could be applied in our case. In the case of SLS production, the gears usually show larger deviations than the permitted values, which would adversely affect the operation. It may be inferred, however, that by modifying the original model, by appropriately reducing the dimensions, a suitable gear could be printed. Since SLS technology meets the requirements of the appropriate surface roughness for the application, it is worth examining how the dimensions of the original model should be modified to obtain an accurate printed gear. A subject of further research would be to define a factor of modification to obtain a suitable gear using SLS technology.


