1. Introduction
Around 23% of the total anthropogenic CO
2 emissions globally are from the transport sector. With an expected 2 billion increase in light-duty vehicle ownership by 2050, an increase in the demand for fossil fuels will be inevitable. This will consequently have massive implications on energy security, climate change and urban air quality. With the global concern in reaching a more sustainable society, it has become critical for the automotive industry to reduce the environmental impacts of automobiles. Countries have employed financial burdens in aid to decarbonisation, such as high fuel taxes. Another strategy has been to employ alternative fuelled vehicles like Battery Electric Vehicles (BEVs), which have emerged as an alternative to internal combustion engine vehicles [
1].
Over the past decade interest in BEVs has increased as consumers and businesses become more environmentally conscious. This is also facilitated by improvements in BEV technology and better supporting infrastructure, which have helped reduce some of the concerns consumers have about adopting the new technology.
With the application of life cycle assessment (LCA) the environmental benefits of using sustainable transport such as BEVs have massive benefits in reducing Green House Gas emissions (GHG’s) over its Internal Combustion Engine counterpart, when charged from renewable energy sources. To reduce the emission of harmful gases and dependency on fossil fuels the use of sustainable transport like BEVs has intensified and is being pushed by governments globally with Electrical Power Research Institute (ERPI) reports validating that the use of BEVs would significantly reduce Green House Gas emissions. However, BEVs still only have a small share of global market sales, of around 14%. BEVs are generally less appealing to many consumers due to several issues in comparability, from underdeveloped battery technology, excessive upfront cost, lengthy charge times, limited range, and associated range anxiety [
2,
3].
Range anxiety conceptually emerged in the 1990s and can be concisely explained as the fear of the driver not reaching their desired destination while driving in a BEV. To this fact, it has been identified that range anxiety is one of the main obstacles that hold back the mass uptake of BEVs [
4].
Authors like Pevec [
5] have tried to attain the perspective of BEV and potential BEV owner views on range anxiety. The paper focuses on charge point infrastructure and asks questions on how BEV and non-BEV owners perceive charge point infrastructure in comparison to traditional refuelling stations. Also addressed are the key vehicle parameters that influence potential BEV owners in comparison to existing ones. All the questions posed give insight into what influences range anxiety such as State of Charge (SoC), and remaining range and, what circumstances would most affect BEV owners’ range anxiety and influence their decision to charge their vehicle.
Pevec [
6] also performs other survey-based analyses of other aspects that significantly affect range anxiety. It is found that SoC is an important variable in charging decisions and found that people start to feel uncomfortable at a lower SoC. The survey also highlighted people are more influenced by the remaining range when it comes to deciding on charge point destination irrelevant occupation and concluded that charge point frequency should be within a 7 km radius emphasising the importance of a BEV-supporting infrastructure.
Other work relating to range anxiety like Modi et al. [
7], uses more current methods. The work on accurately estimating the energy consumption of BEVs uses various convolutional neural networks (CNN). The energy consumption is estimated based on three parameters, vehicle speed, tractive effort, and road grade, with the goal of predicting the remaining energy more accurately. They use varying CNN with different layers to evaluate the most precise prediction. It is concluded that a CNN with 7 layers most accurately calculated energy consumption.
As a result of range anxiety being one of the more pressing issues that hold back the bulk distribution of BEVs, a large focus on addressing the issue has been the concern of academia, policymakers and industry alike. Noel et al. [
8] review range anxiety as a reactionary rhetoric and recognise that many literatures acknowledge the problem as purely a psychological issue rather than a technical one. An argument is made that literature gives a cloudy view on both subjects and any subsequent answers are incomplete. They conclude that most policies used to assuage the BEV range barrier would on the hole be ineffective when range anxiety is used a rhetorical excuse.
Yuan et al. [
9] also research range anxiety and focus on the negative effect it has on drivers’ emotions and behaviours. They find that range anxiety can significantly intervene the safe operation of vehicles, with driver experience, and satisfactory level of accessible charge points being significant contributors to negative emotions. They conclude that differing safety buffers for trips can have various effects, depending on trip length. Comment is also made on the most significant behaviour of drivers when under range anxiety stress, the most significant being speed reduction. Resistibility to the emotion is also a contributing factor much like gender, age, and maximum BEV range.
Wang et al. [
10] develops on the range anxiety issue and suggest that time anxiety is also a factor that contributes to BEV user discomfort. Via a time-model they estimated the differing tolerances in wating time. They found that users that can trust in BEV range estimation were happier to tolerate longer wait times. On the other hand, those who prefer to have higher charge status at the beginning of the journey are those who want to avoid charging mid journey, but the authors mention this view could be entirely personal and deserves more investigation. Further to their result, it showed that acceptable waiting times for users are affected by both time and range anxiety and further work needs carried out on the social-psychological aspects of range anxiety.
It is evident that research on Range Anxiety has a significant presence in literature, however the measurement of range anxiety is limited [
11]. On the whole range anxiety still remains one of the most substantial barriers in mass BEV adoption. The key challenges include limited real-world range, inconsistencies in fast charging and limited access for rural charging when home charging is unavailable. Also, variability connection types and confusing payment system only add to consumer frustrations. Even though government focus and advances in BEV technology such as cell performance and ultra-fast charging, the perception and consumer confidence in this technology and crucial for broader BEV adoption [
12,
13,
14]. With review of the respective literature, it is unclear if there is a tangible answer addressing range anxiety, however the problem is commonly experienced by drivers. Without doubt, the quantification of range anxiety should focus on the point at which drivers begin worrying about the remaining range. Appropriate quantification of range anxiety therefore encourages a more relatable metric to address the issue hence, the distance available when a BEVs battery cell is at lower SoC is used as a measure of range anxiety [
6]. The aim of this paper is to examine various battery performances in relation to cost, offering insights into selecting batteries that strike an optimal balance between performance and cost-effectiveness, ultimately helping to alleviate drivers’ concerns about range anxiety. Using longitudinal vehicle dynamic method, the remaining range of the BEV is estimated at lower SoC. Using a lithium-ion cell discharge curve, various cell energy are estimated based on their properties and remaining range is quantified. Inevitable of the growing adoption of BEV, Range Anxiety remains a major barrier for mass BEV uptake. While the numerous studies reviewed provide insight into the psychological and behavioural aspects, for example driver stress at lower SoC, trust in range estimation and chare point infrastructure, a distinct quantifiable metric for range anxiety is still somewhat lacking. Current models fail to connect driver discomfort with battery specific performance data. This study addresses this gap through modelling Lithium-Ion cell discharge curves and longitudinal vehicle dynamic method to estimate remaining range at higher DoD while comparatively reviewing different cell characteristics when drivers are subject to the stresses related to range anxiety, which does not seem to be reviewed in literature [
15,
16,
17]. In doing this it provides a practical insight into quantifying range anxiety.
The rest of the paper is as follows.
Section 2 explains in detail the process of estimating vehicle range.
Section 2.1 elaborates on time dependent velocity profiles, specifically the World Light Duty vehicle Test Procedure (WLTP).
Section 2.2 provides a rationale for the breakdown of a BEV.
Section 2.3 explain the governing longitudinal vehicle dynamic method, regenerative braking, and motor efficiency.
Section 2.4 explicitly explains how the battery was modelled, which consists of
Section 2.4.1 battery pack mass estimation and
Section 2.4.2 cell discharge energy estimation. The results are discussed in
Section 3. In
Section 4, the paper is concluded, and the most significant finding are brought forward. A direction for future work is also suggested.
2. Materials and Methods
Figure 1 illustrates the method used to estimate BEV range with respect to mass and remaining energy a higher DoD. The estimation relies on using a standardized drive cycle used to generate energy consumption based on a suggested mass breakdown. Once the overall vehicle weight was estimated the energy consumption is equated to remaining BEV range using a set of battery cell characteristic and discharge curves.
Furthermore, the Worldwide Harmonized Light Vehicles Test Procedure (WLTP) drive cycle—an industry-standard benchmark—was employed [
18,
19]. An extensive literature review was conducted to classify the fundamental vehicle dynamic equations essential for estimating vehicle energy consumption, which are widely accepted in vehicle performance calculations [
19,
20,
21,
22,
23]. In parallel, lithium-ion battery discharge characteristics were modelled using validated techniques, specifically through an adapted implementation of discharge curve modelling [
24]. With this solid theoretical foundation, the resulting range predictions are expected to be reliable.
2.1. Drive Cycle
In general Drive Cycles can be described as standardized time dependent velocity profiles used by automakers, researcher, and testers. Consequently, in more recent years, drive cycles have been extensively used in dynamometer testing or to establish emission outputs of internal combustion engine vehicle (ICEV). However, over the past decade or so, BEVs and other zero emission vehicles are becoming increasingly popular due to legislative factors and environment concerns. When studying these newer powertrains, Drive Cycle velocity profiles have become an important tool for performance evaluations. With access to such tools, a diverse range of systems can be evaluated. There is no globally standardized drive cycle however drive cycles like the like the World-wide harmonized Light duty Test (WLTP) are becoming mandated by auto manufacturers for the evaluation of performance statistics of newly released vehicle [
18].
The WLTP (Worldwide Harmonised Light Vehicles Test Procedure) includes several test cycles categorized by the Power-to-Mass Ratio (PMR), which is defined as the vehicle’s available power relative to its curb weight, excluding passengers and the driver. Vehicles are classified into three groups based on their PMR:
For the purposes of this paper, the WLTP Class 3B driving profile as it corresponds with the vehicle parameters, as shown in
Figure 2. This profile was selected because it closely reflects real-world driving conditions and scenarios. It has a total duration of 1800 s, covers 23.66 km, and includes a maximum velocity of 131.3 km/h. The cycle is divided into four sections: low, medium, high, and extra-high-speed phases. These correspond to driving conditions on high-density urban roads, lower-density urban roads, suburban roads, and motorways, respectively [
25].
Pavlovic et al. [
26] carried out a study on drive cycle type-approval and the real-world gaps on fuel consumption figures. They found that with the introduction of the WLTP, would have a significant improvement as far as Fuel consumption and CO
2 emission are concerned. when compared to the old New European Drive Cycle (NEDC). They comment on the WLTP being more robust than its predecessors with more severe changes made in incorrect mathematical and physical errors. Consequently, it was found that an increase more than 25% was made on CO
2 emissions. They conclude with the fact that the WLTP is a fundamental step in the de-carbonisation of the road transport system in Europe. In review of the literature the WLTP drive cycle was chosen as it better reflects real world driving condition though simulation of various environment and scenarios that relate to real world driving, these reasons alone and the added PRM made the WLTP protocol the best choice for estimating energy consumption [
27].
2.2. BEV BREAKDOWN
In this section the mass breakdown of a BEV in explained using available literature. Tisza and Czinege perform interesting work on material substitution in production off lightweight automobile components. They iterate the importance of weight reduction in the automobile industry for ecological benefits and provide a comprehensive and detailed breakdown of the mass composition and assign percentages for each component. However, from the prospective of this paper, their breakdown of a vehicle weight composition is what’s of most interest [
28].
Bauer et al. [
29] perform a comprehensive analysis on sets of current and future mid-sized passenger vehicles. His results iterate that BEV adoption can alleviate future climate worries provided the that the use of fossil fuels is also mitigated. However, from the avenue of this paper, the mass breakdown and projected future weights of BEVs are of most interest. Bauer et al. [
29] mass composition breaks down the vehicle into 4 system, being the Glider, Battery, Motor/Generator and Transmission. They provide good insight into the mass composition and provide a percentage breakdown of a BEV, which was used in conjunction with other literature to provide insight into the mass composition of a BEV.
Pollock et al. [
30] also provides a comprehensive mass breakdown of a BEV based on referenced literature. The work involves evaluating the comparative energy consumption of conventionally and alternatively fuelled vehicles, like BEVs. The work provides an estimation on the energy gap that needs to be bridged to afford BEVs a range comparative to their conventionally fuelled counterpart. The mass composition percentages provided in the paper were used to reflect the composition of a BEV (
Figure 3a). The Glider, which is a general term used to encompass other vehicle component such as the body in white, closures, suspension/chassis, electrical systems, lighting and interior, which along with the Transmission and Motor/Controller were regarded as a lumped mass and the 24% Battery Mass was subtracted from the overall weight of the BEV and calculated using Equation (1) were
is equal to the vehicle mass in kg.
Figure 3b shows the overall mass of the BEV. The battery contribution is explained in
Section 2.4.
Figure 4 show the simplified construction of a BEV namely the glider power source and drive components.
2.3. MATLAB Model
A MATLAB R2023a model was used in conjunction with the WLTP 3B velocity profile and the vehicle parameters seen in
Figure 2 and
Table 1 respectively. The model’s primary function is to provide energy consumption data for the estimation of BEV remaining range using a generic lithium-ion battery cell discharge curve.
Tomar et al. [
31] uses the Simulink software environment to evaluate power train design of electric vehicles. They use the Simulink environment to construct their model using pre-installed environment blocks. The model was constructed using various embedded blocks which consist of Driver, Battery, Motor, Differential, Vehicle and Wheels.
They further elaborate on the blocks embedded mathematical formulae and explain the fundamentals of the underlying equation which are the base for most models in literature.
Jambhale et al. [
32] quantify driving style implication on battery life. They give a good insight into the required equations to estimate BEV energy consumption. Their work indicates the mathematical formula required to predict energy consumption seen in Equations (2)–(5) where
is the aerodynamic resistance,
Is vehicle rolling resistance,
is gradient resistance and
is the inertial resistance forces respectively.
Is the summation of all forces and is expressed in Equation (6) and is the total force required to propel the vehicle forward.
represent the projected frontal area of the vehicle,
is air density,
is velocity in m/s,
is the gradient angle,
rolling resistance coefficient,
is vehicle mass in kg and
is the gravitational constant in m/s
2.
Their work also incorporates motor efficiency (
) and is calculated using Equation (7).
where
is Iron loss coefficient,
is Windage loss coefficient,
is Copper loss coefficient and
is the Motor loss constant.
is motor torque and
is motor angular velocity measured in radians.
Figure 5 shows the model motor efficiency output for the WLTP 3B drive cycle. The variations in the motor efficiency trend are generally explained though use of Equation (7). The equation has fixed losses which are higher at lower speed resulting in lower efficiencies. For higher speed these fixed coefficients have less of an effect hence at higher speeds efficiency is improved which is reflected in
Figure 5 with the coefficient used seen in
Table 2, therefore the motor efficiency is calculated for each increment of the drive cycle.
is calculated using Equation (8) where
is the motor angular velocity and estimated using Equation (9).
,
, and
are gear ratio wheel radius and instantaneous velocity respectively.
Suvak et al. [
33] works on the simulation of a full electric vehicle and uses the same set of longitudinal equations to estimate BEV energy consumption, however, they do not account for motor efficiency in their work. They go on to estimate the tractive power which is given by Equation (10) were
is the power required to drive the vehicle forward and
is the velocity provided by the velocity profile given in m/s.
However, when the vehicle is decelerating power is not needed and regenerative energy is produced. For this, a logic was employed to simulate the regenerative breaking effect when decelerating.
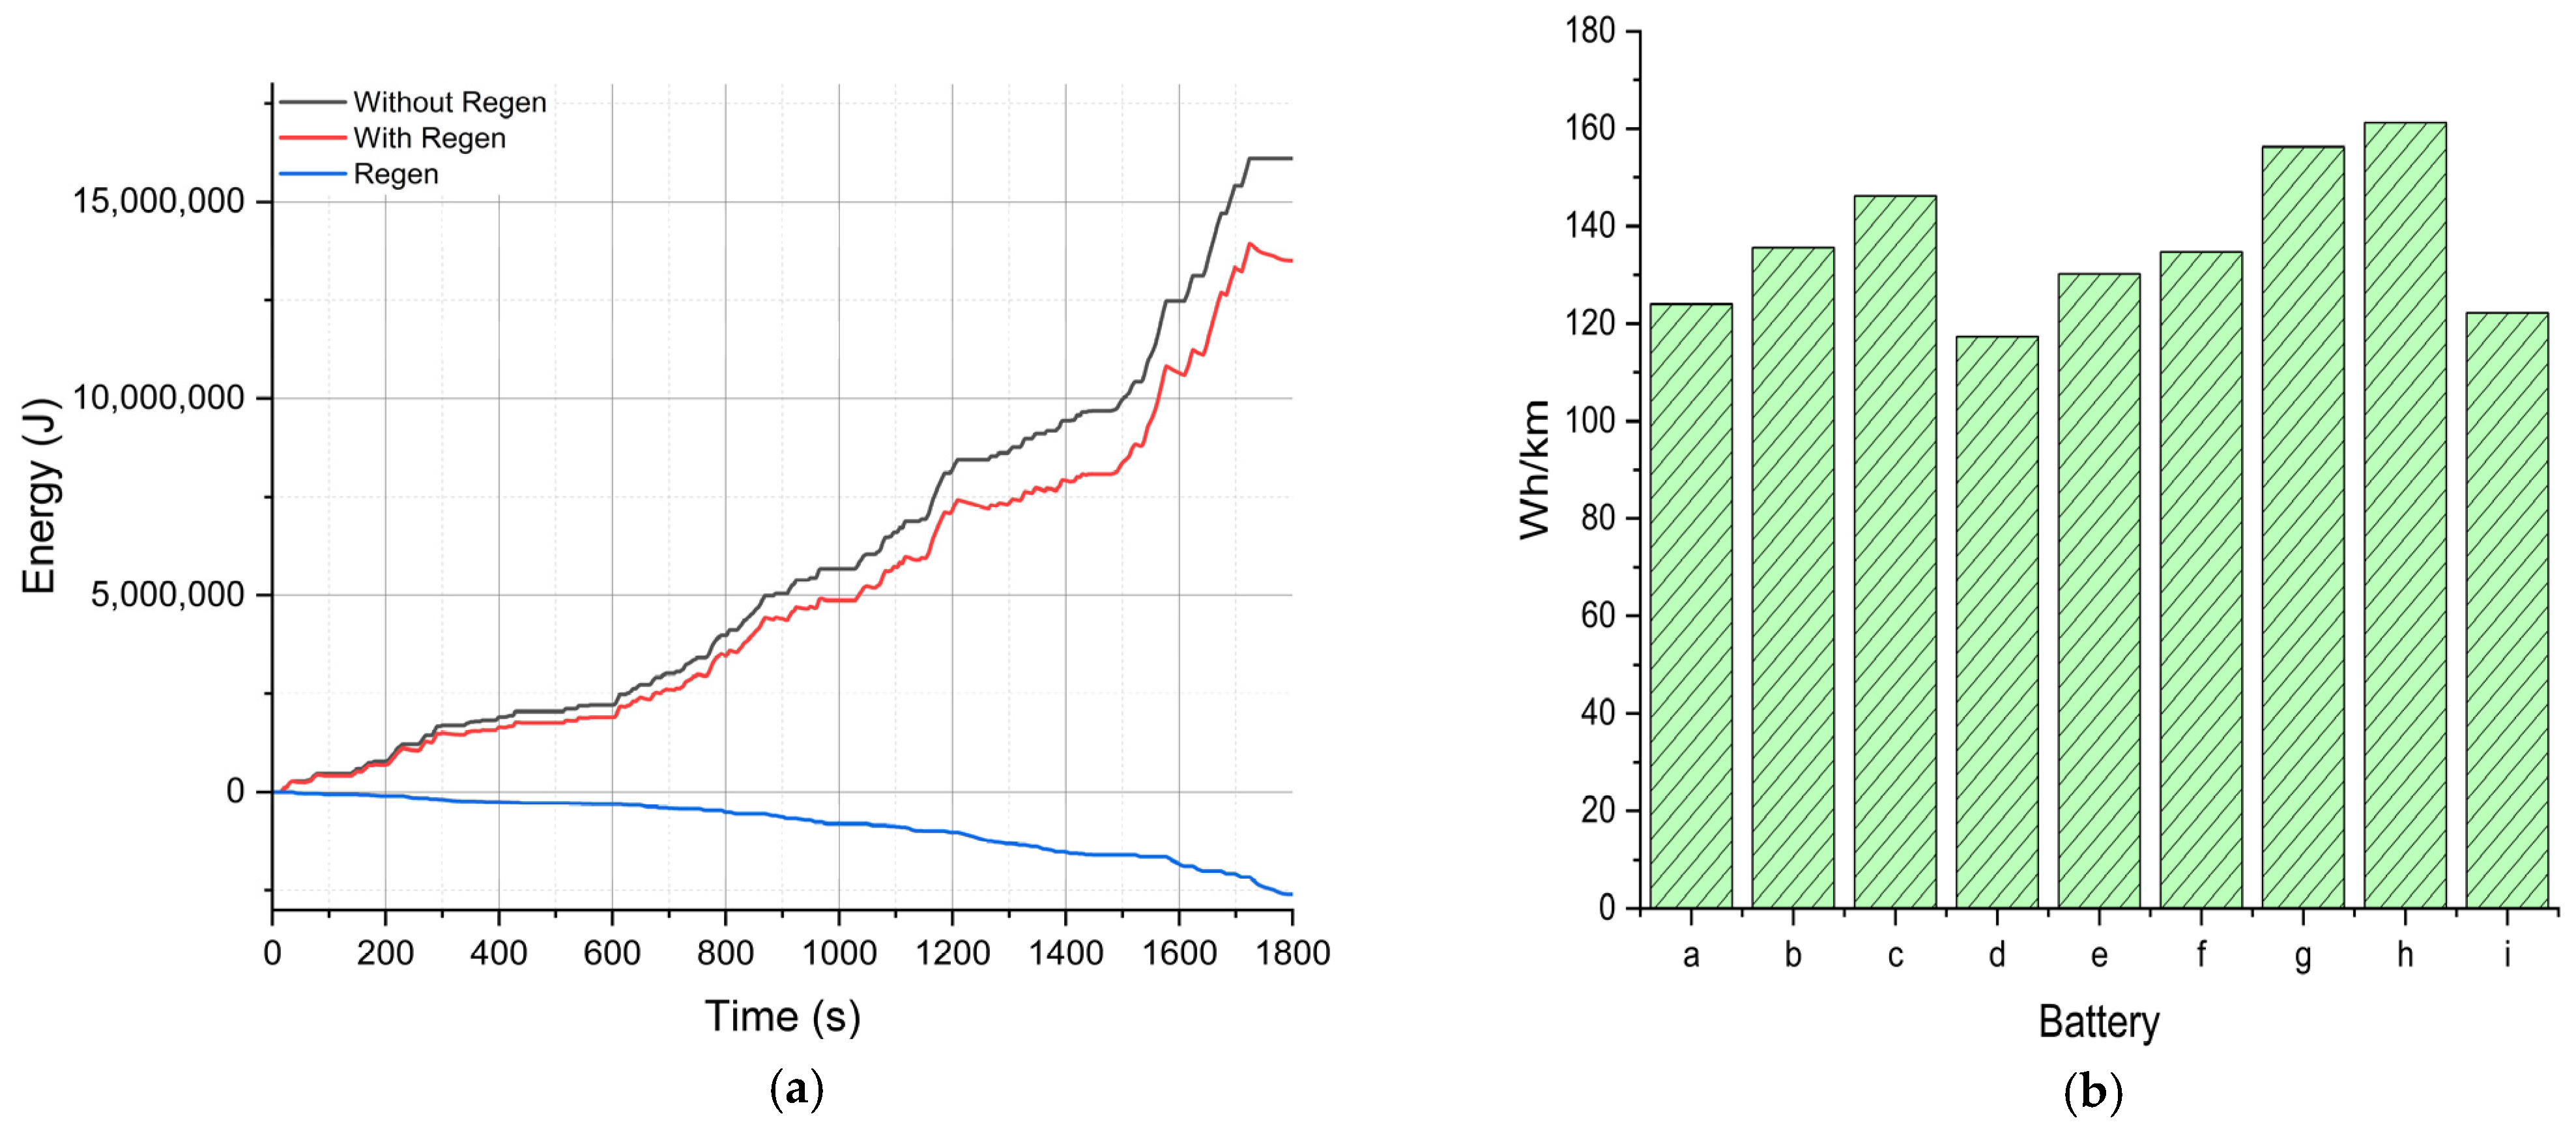
Figure 6a shows an energy consumption profile with and without regenerative breaking. When accelerating the thrust power is given by Equation (10) where
is gearbox efficiency and
is cell efficiency. When decelerating or in regenerative mode the regenerative power is given by Equation (11). For recuperation of energy in regenerative mode, a conservative fixed coefficient of 30% was used taken from literature. This was used to negate the complexity of brake blending estimations, which seemed more of a practical solution at this stage at of the estimation [
19,
20,
21].
The total power is the accumulation of both modes and is expressed and converted using Equations (13) and (14).
Figure 7 shows the Simulink model used for estimating energy consumption. The model uses the WLTP 3B drive cycle to estimate energy consumption based on a vehicle mass breakdown.
Figure 7a generates the distance and acceleration which is input into
Figure 7d model which then outputs the power required to satisfy the velocity input. Based on
Figure 7b mass estimation.
Figure 7c then outputs the accumulated energy required to complete the drive cycle [
19,
22,
23].
2.4. Battery Modelling
This section explains cell modelling and energy estimation for an idealized cell using the Shephard model. Factors like cell degradation and environmental effects (e.g., temperature) are not considered.
For the current state of art in Li-ion cell application in BEVs, operational emphasis is focused on the careful management of SoC and DoD parameters, with particularly focus on charge and discharge cut off voltages. This ensures that optimal cell operational safety, longevity and performance is achieved. Commonly cutoff voltages are generally limited to manufacturer specification and surpassing upper charge thresholds can negatively impact the cells operation through electrochemical degradation and increase the risk of thermal instability [
34]. Conversely lower cutoff voltage limits are also used to prevent deep discharge failures for example, copper dissolution and irreversible capacity losses [
34]. These advanced Battery Management Systems (BMS) are used with specified voltage cut offs to ensure reliable and safe battery operation throughout the vehicle’s lifecycle. Some of these specific cutoff parameters are given in
Table 3.
2.4.1. Battery Pack Mass Estimation
In early 2000 Ni-HM cells represented the most advanced cell chemistry and where they considered the initial step in acquiring the technology used today. However, nowadays Lithium-Ion (Li-Ion) batteries are the most wildly utilized cell chemistry in the automotive industry due to their higher specific energies. They offer better energy density and power to mass ratio which facilitate better batteries with reduced weight and sizes while remaining cost effective. Other benefits of using Li-Ion cells are memory effects. Li-Ion cells have greater ability to resist the gradual loss of their maximum energy capacity due to repeated charging when the cell is not sufficiently depleted, which in turn increases their life expectancy significantly [
35]. The cell characteristic plays a vital part in the optimum performance of a BEV. Massive gains in improving Li-Ion cells have made them an obvious choice from the perspective of efficiency, cost and even life cycle, which are imperative concerns from a BEV standpoint. There is a large variation in cell capacity when considering the current market, which can range from 2.3 Ah to over 120 Ah and are accompanied by varying behaviour’s, cost, and projected lifespans. Accompanying this are different cell formats such as pouch, cylinder and prismatic seen in
Figure 8 which also have varying influence on battery design and system characteristics [
36].
Using this knowledge a battery pack mass was calculated using a generic BEV energy rating of 22 kWh. Using energy capacity, the pack mass was calculated using the cell properties provided in
Table 3 which were obtained from Omar et al. [
37] data on the various battery cells for application in BEVs. Using a nominal voltage of 355.2 V and a capacity of 60 Ah, the number of cells required to construct the pack where calculated and rounded up to the nearest cell using Equations (15) and (16),
Figure 9 shows the MATLAB Model used to calculate the battery pack mass. The total amount of cells required for the battery is calculated using Equation (17). With the known number of cells required to satisfy the energy requirement, the weight of the battery was estimated using rearranged Equation (18) and expressed in Equation (19). The calculated mass of the battery is then substituted into Equation (1) and provides the overall mass of the vehicle for the subsequent estimation of energy consumption [
23,
38,
39].
2.4.2. Cell Discharge Energy Estimation
Hanifah et al. [
40] investigates the relationship between cell types and perceived range anxiety. Their research discovers the potential for lithium-Ion cells for increasing BEV distance due to high energy density. More interestingly are their illustrations of different cell discharge curves. They show various discharge characteristics in relation to cell chemistry. The Lithium-Ion trends show Open Circuit Voltage (OCV) as a function of cell residual energy. Interestingly it can be observed that voltage at lower SoC have a lower corresponding residual energy as the cut off voltage is approached. Also, volt drop significantly increases as the cut off voltage is approached, which is illustrated in
Figure 10 along with a representation of the energy available for the first and last 50%. The first 50% shown in green and the last 50% shown in purple.
Alvarez et al. [
24] works on quantifying aggressive driving style on BEV energy consumption. They use a series of MALAB based models to evaluate the dynamic behaviour of energy consumption, to give more accurate information on SoC. They describe some commonly used method of evaluating SoC such as Coulomb counting or using the Kalman filter method or even Artificial Intelligence. The interesting part of their work is how they characterize a discharge curve voltage as a function of SoC% and discharge rate. They further breakdown the equation used to produce the curve and, describe the function as using a set of coefficients to generate the familiar characteristics of a Li-ion cell.
Other factors like temperature can have a significant impact on cell behaviour which in turn negatively impacts BEV range. At lower temperature driver in cabin comfort is a contributor to the increase in overall energy consumption of the vehicle which reduces overall range. Other effects include the limited recuperation of energy in regenerative modes to assist in reducing premature cell aging at lower ambient temperatures [
41]. To help with simplicity of the model the assumption is made to consider the cell was used at optimal discharge temperature. For future work the effects of cell temperature will be considered.
Raszmann et al. [
42] also work on the Li-ion discharge modelling. They summarize a typical discharge curve into 3 zones, being exponential, nominal and discharge. They use a modification of shepherd’s battery model to estimate an idealized discharge curve. From these 3 points are chosen from a voltage vs. capacity graph with a C1 discharge rate. They go on to use the modelling technique to generate a steady state discharge model for better energy estimations.
Using the reviewed literature in this section an equation was used to generate an idealized Li-ion cell discharge curve. Using Equation (20), a curve was generated as a function of Depth of discharge (DoD) and open circuit voltage using the coefficients listed in
Table 4 with a generated with discharge curve seen in
Figure 11. The figure also shows the available energy for the first and last 10% of DoD with green and red showing the first and last 10% respectively.
Figure 12 shows the generated curves for each cells A to I. Where
is open circuit voltage,
is discharge rate and
,
,
,
,
and
are the respective coefficient which were manipulated to reflect cut off voltages. Using Equation (21) cell energy was estimated at the last 10% of charge as lower SoC has greater effect on associated Range Anxiety [
6]. Using Equation (22) the BEVs remaining range was calculated using the estimated energy consumption.
3. Results/Discussion
Using the simulation generated in this paper various cell technologies were evaluated. The cell data used characterizes the general attributes of Li-ion cells which account for:
Cell cut off voltage
Energy Density
Cell Efficiency
Cell Geometry
And Cost
Using the Simulink software environment a model was made that evaluates the energy consumption of a BEV using a standardized velocity profile. The model considers:
Based on the battery calculations the variation of battery weight had notable effect on overall energy consumption and remaining range. The distance at 90% DoD was greatest for cell F seen in
Table 5 at 18.68 km with a 134.7 Wh/km induced energy consumption along with the highest cost per km. Cell F also has the third highest battery weight overall at 1473.2 kg when considering all Batteries. Cell C performed worst of all the evaluated cells. The range at 90% DoD was only estimated at 12.40 km. Cell C also has the third highest energy consumption at 146.2 Wh/km with a battery weight of 1418.8 kg due to its energy density. It’s also worth noting that cell efficiency as Cell C has one of the lower cell efficiencies which will contribute to its low performance in both thrust and regen modes. Contrary to Cell C, Cell F has one of the higher efficiencies at 90% which meant it performed well even though it was on the heavier batteries. Cells F and C have a significant difference in distance to the tune of 6.28 km, however the difference in cost is also significant at
$729.6. However, this cost could be possibly considered situationally relative to certain circumstances like reaching home or reducing offsite charging cost [
43,
44,
45].
Cell G has the largest energy capacity and second largest range. It also has low efficiency but unlike the other cells with lower efficiency still returns a good range while still having a relatively low cost/km in comparison to cell F. This is possibly due to the cell having the highest capacity at 90 Ah. Cell A has the lowest cost/km and still returns a respectable range in comparison to the other more expensive cells evaluated, offering a 15.08 km range at 90% of DoD. The cell has excellent efficiency which is the reason it performs so well in thrust and regen modes, and only has 3.6 km less range than the highest performing cell, with a significantly lower cost per km at
$833.72, equating to
$231.59 per extra km which could possibly seem a small cost if the extra range can assist in reaching home or reaching a remote charge point. Cell H is the heaviest of all the prospective batteries, however this isn’t reflective of the batteries range. Even though it has a greater mass it still performs well with a 16.87 km range for the last 10% DoD. Consequently, it costs more per km than cell A at
$383.02. Cell I has a good range at lower DoD. It is also the lightest of the cells overall meaning it returns the lightest vehicle curbweight. The cells efficiency is 90.7%, so it also returns the lowest energy consumption of all the cells evaluated. The range for the last 90% DoD is 17.97 km which is only 0.88 km less than the best performing cell with respect to range at only an approximate 46% of the cost. Cell E on average could possibly be the best performing Cell considering all the attributes. Cell E range is only 0.16 km less than the best performing Cell while having a significantly lower cost per km at
$810.15. This is due to low relative cost when considering the cells’ high specific energy density. This in turn means the cell is relatively economical and returns a low energy consumption which is compounded by its high efficiency. From the result presented in
Table 5 it’s a fair assumption that many factors play a role with varying degrees of importance on cost effectively increasing range to mitigate range anxiety. From the estimation of energy consumption, it can be observed that the heaviest or lightest battery is not the only factor concerning range or returning the greatest or least energy consumption, one major contributing factor is cell efficiency.
Cell technology in BEVs involves critical trade-off between mass, driving range and cost, which are all directly dependent on each other. Heavier cells can certainly increase driving range through having higher capacities but have implications in increasing energy consumption and vehicle performance. Higher energy density cells can increase overall range but are reliant on most costly, less sustainable material that affects the overall cost of the vehicle. Other cheaper alternatives are available, but due to lower energy densities they return a smaller overall range and increase battery weight. Attempts to reduce costs through battery downsizing usually mean lightweighting of the vehicle needs to take place through using alternative materials which can offset costs. In real world application manufacturers must strike a balance that satisfies the consumer. These cost trade-offs influence both vehicle design and market acceptance and must strike a balance between consumer expectation of range and cost with added pressure of meeting environmental target. Hence making optimizing cell selections a complex challenge where cost-effectiveness depends on carefully balancing energy density, material cost, and system weight [
46,
47,
48,
49,
50,
51].
Many other factors have a significant effect on cell performance like driver attitude, driving environment, various mechanical efficiencies and environmental effects which were not included in this study. Other effects like cell State of Health and capacity fading due to age have significant effect on range. For future work all the mentioned variables will be the consideration for further study [
52].
4. Conclusions
In this study, various Li-ion cells were evaluated using a Simulink-based BEV energy consumption model. The model incorporated a simulated Li-ion discharge curve and accounted for key parameters such as cell efficiency, energy density, and mass—factors that significantly influence vehicle range and energy consumption. Efficiency emerged as a critical parameter in determining range and cost-effectiveness. For instance, Cell I, which demonstrated the highest efficiency at 90.7%, achieved one of the best ranges while also being the lightest battery in the study. In contrast, Cell C, with lower efficiency, showed the poorest performance in regenerative braking and thrust modes, resulting in the shortest range (12.40 km at 90% DoD) and a higher mid-range cost/km. Capacity also played an important role. Cell G, despite having relatively low efficiency, delivered a decent range due to its large 90 Ah capacity. It offered good range performance at a lower cost/km trade-off, although its heavier weight posed some limitations. Similarly, Cell H, with the highest energy capacity at 29.66 kWh, managed a respectable range of 16.87 km despite being the heaviest battery in the evaluation. Mass showed a nuanced influence on performance. While lower weight generally supported higher range, it was not the sole determining factor. For example, Cell I benefited from being the lightest, but its excellent efficiency amplified that advantage. Conversely, Cell H, although the heaviest, still returned competitive range values due to its high energy capacity. Cost-effectiveness, measured in terms of cost per kilometre, varied widely. Cell F achieved the longest range at 90% DoD (18.68 km) but came with the highest cost/km ($1274.04), highlighting a steep trade-off. On the other hand, Cell E provided a well-balanced performance across all metrics. With a near-optimal range of 18.5 km and a relatively low cost/km of $463.89, it emerged as one of the most promising options when considering both performance and economic viability. These findings suggest that cell efficiency and energy capacity are as influential as weight in determining BEV range, particularly at higher depths of discharge. While battery mass and discharge characteristics are vital, they must be evaluated alongside other real-world variables such as driver behaviour, road conditions, mechanical efficiencies, and environmental factors to produce accurate range estimates. Additionally, long-term considerations such as temperature effects, cell health and capacity fading will be explored in future work to more effectively address range anxiety and improve cost-efficiency in BEVs.


 ,
, 


