Performance Analysis and Hybrid Control Strategy Research of Vehicle Semi-Active Suspension for Ride Comfort and Handling Stability


Abstract
1. Introduction
1.1. Related Works on Semi-Active Suspension Control Strategy
1.2. Analysis of Related Works
- (1)
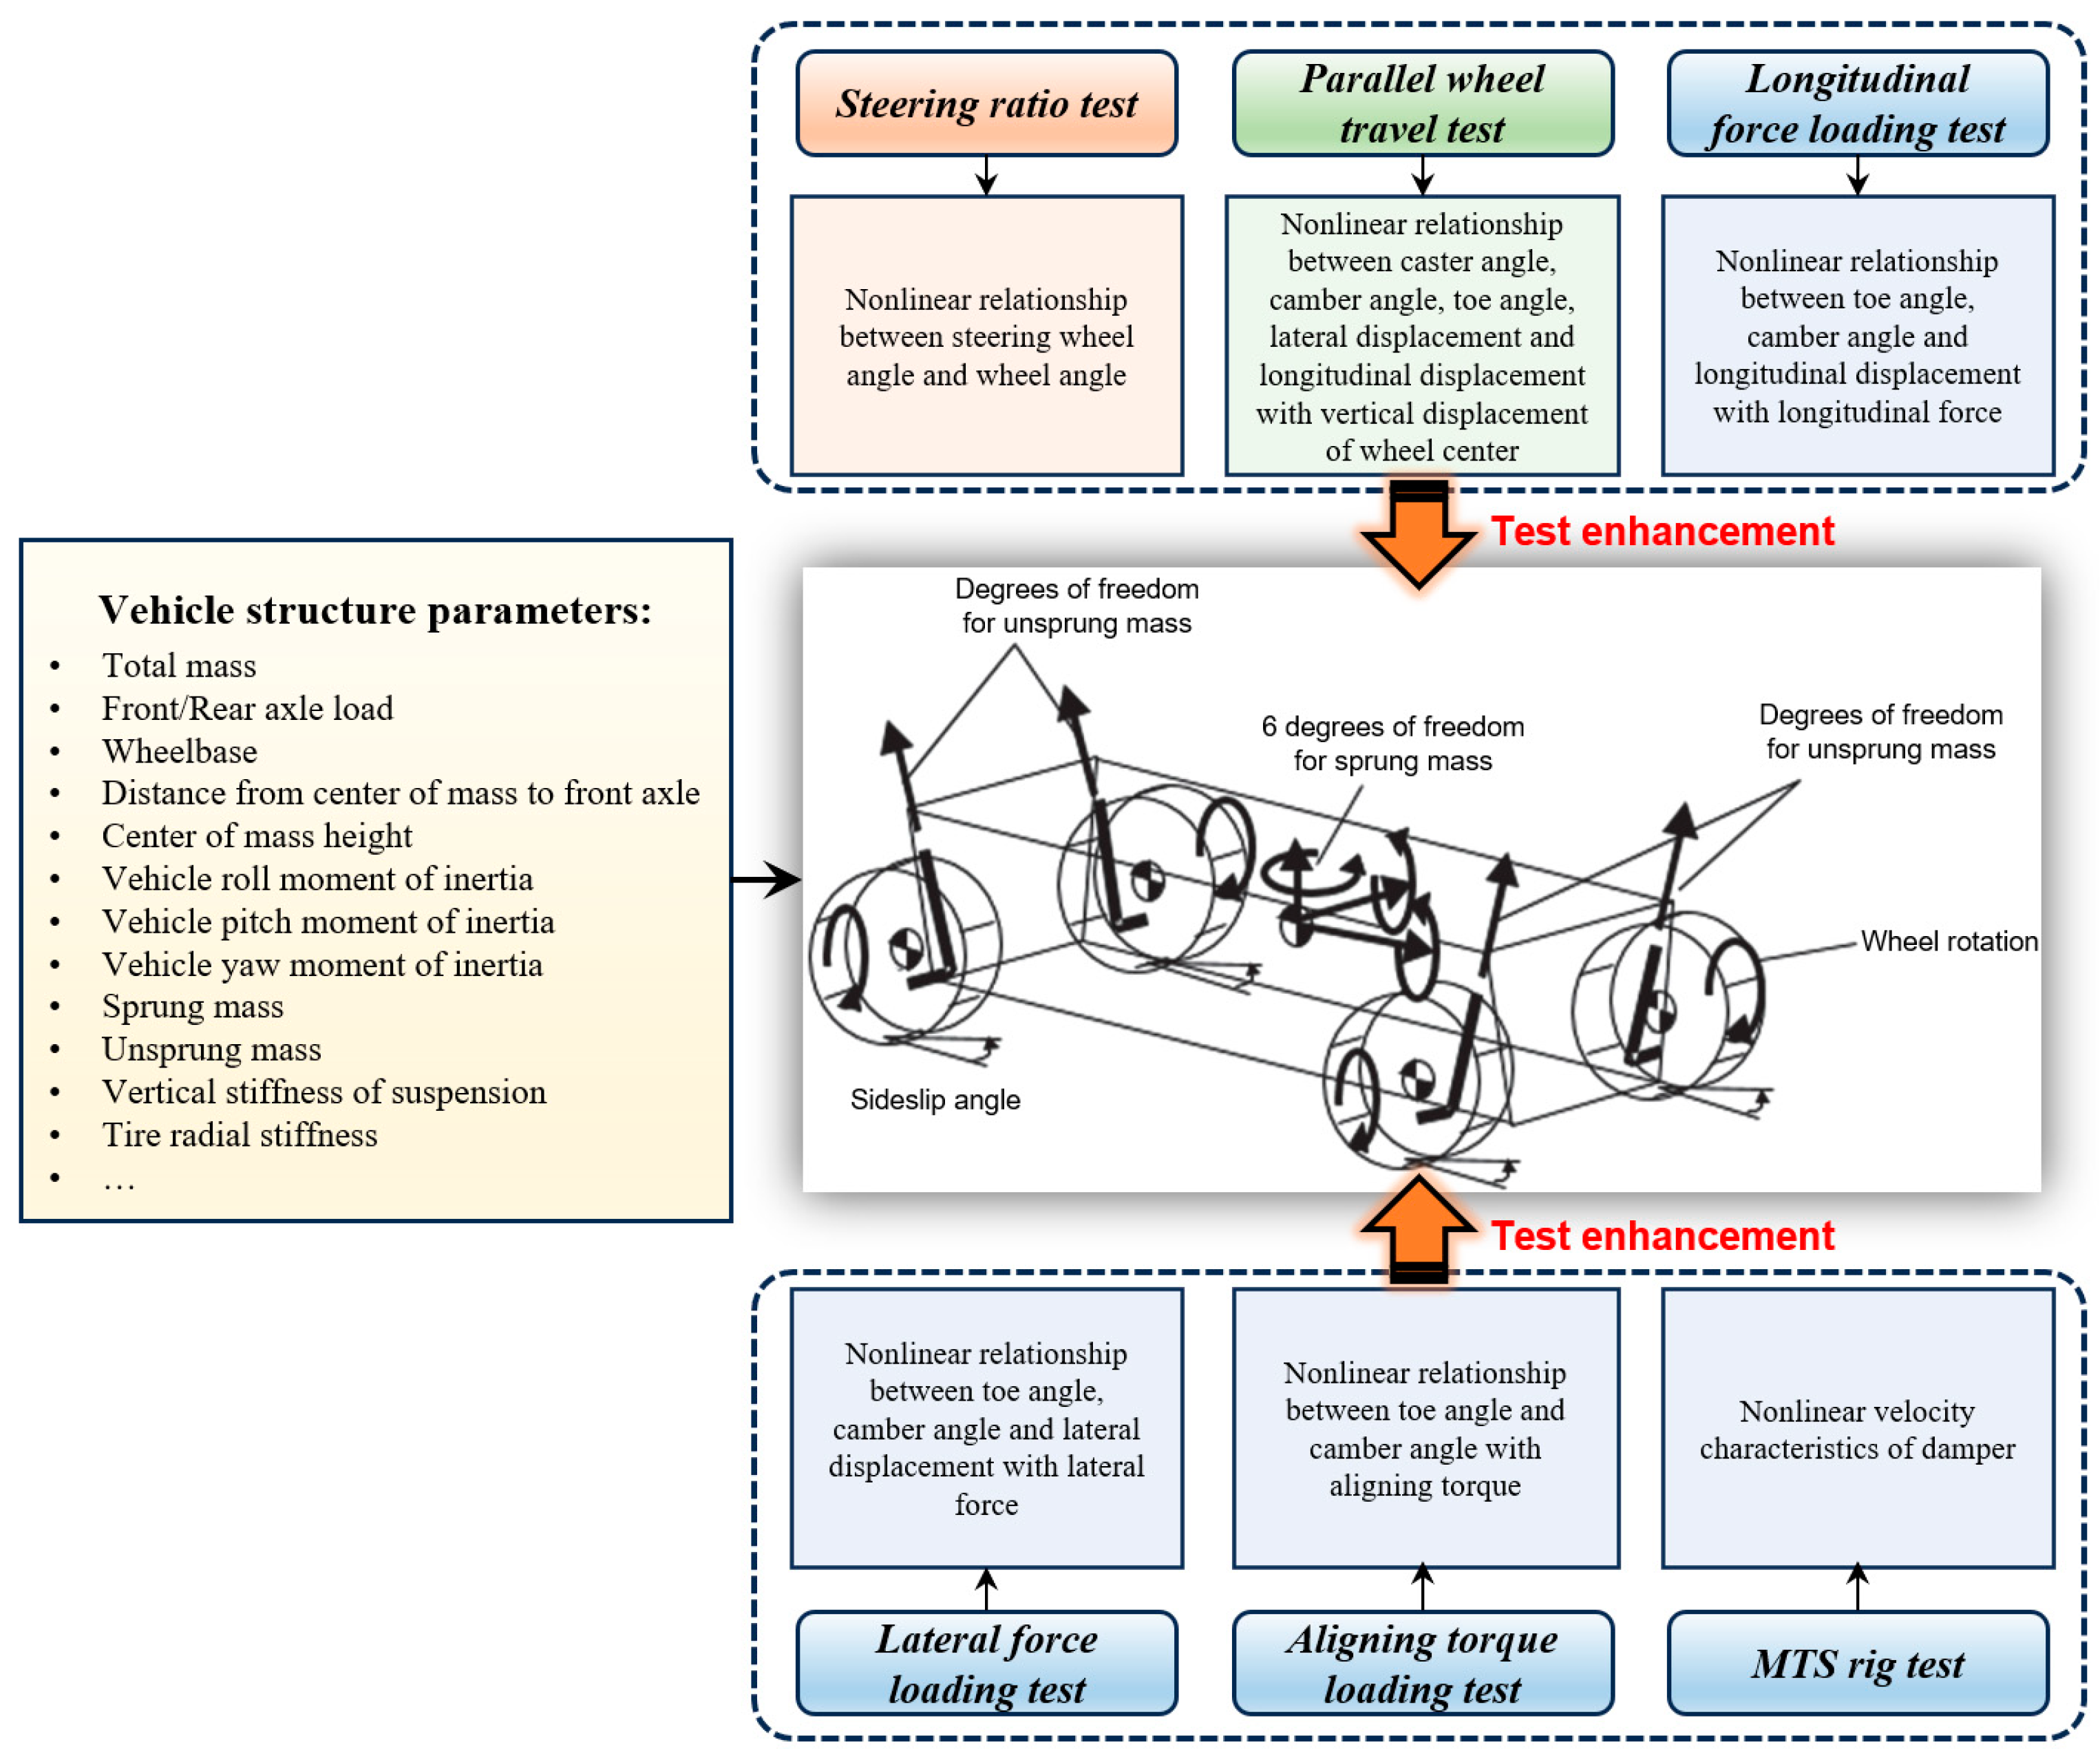
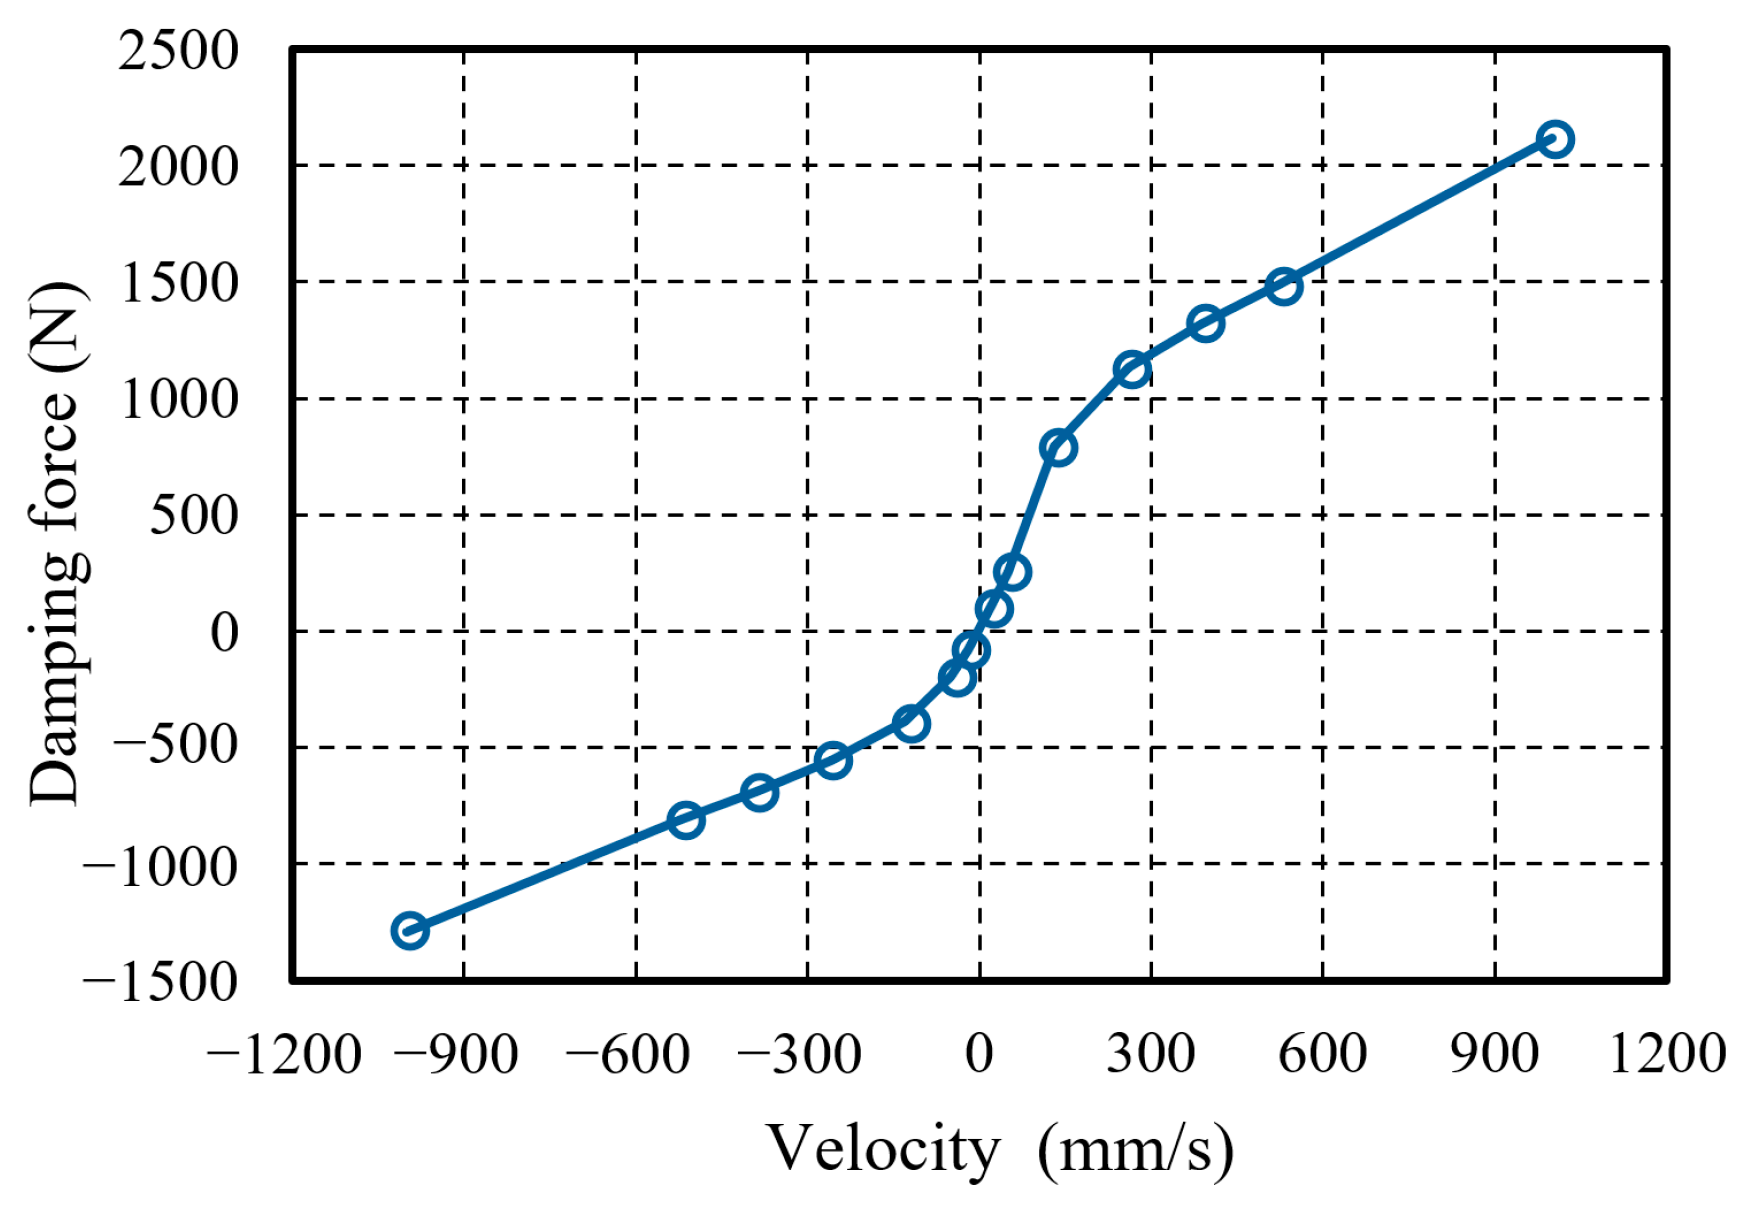
- In vehicle dynamics modeling, full parametric approaches offer computational efficiency but fail to accurately represent complex nonlinear constitutive properties. For example, the steering system has a steering gap and the damper has a valve open velocity, resulting in strongly nonlinear performance. In addition, experimental testing can directly capture the real performance of critical structures, but they have the problems of high costs and low efficiency. This circumstance leads to a reduction in the effectiveness and efficiency of the control strategy.
- (2)
- In the development of a semi-active suspension control strategy, vehicle performance metrics are multi-dimensional and inherently coupled. Solely optimizing ride comfort degrades handling stability, and an exclusive focus on handling stability compromises occupant comfort. The challenge is to develop a control strategy that simultaneously improves ride comfort and handling stability.
2. Development of High-Precision Vehicle Dynamics Model
2.1. Establishment of Vehicle Dynamics Model Based on Test Enhancement
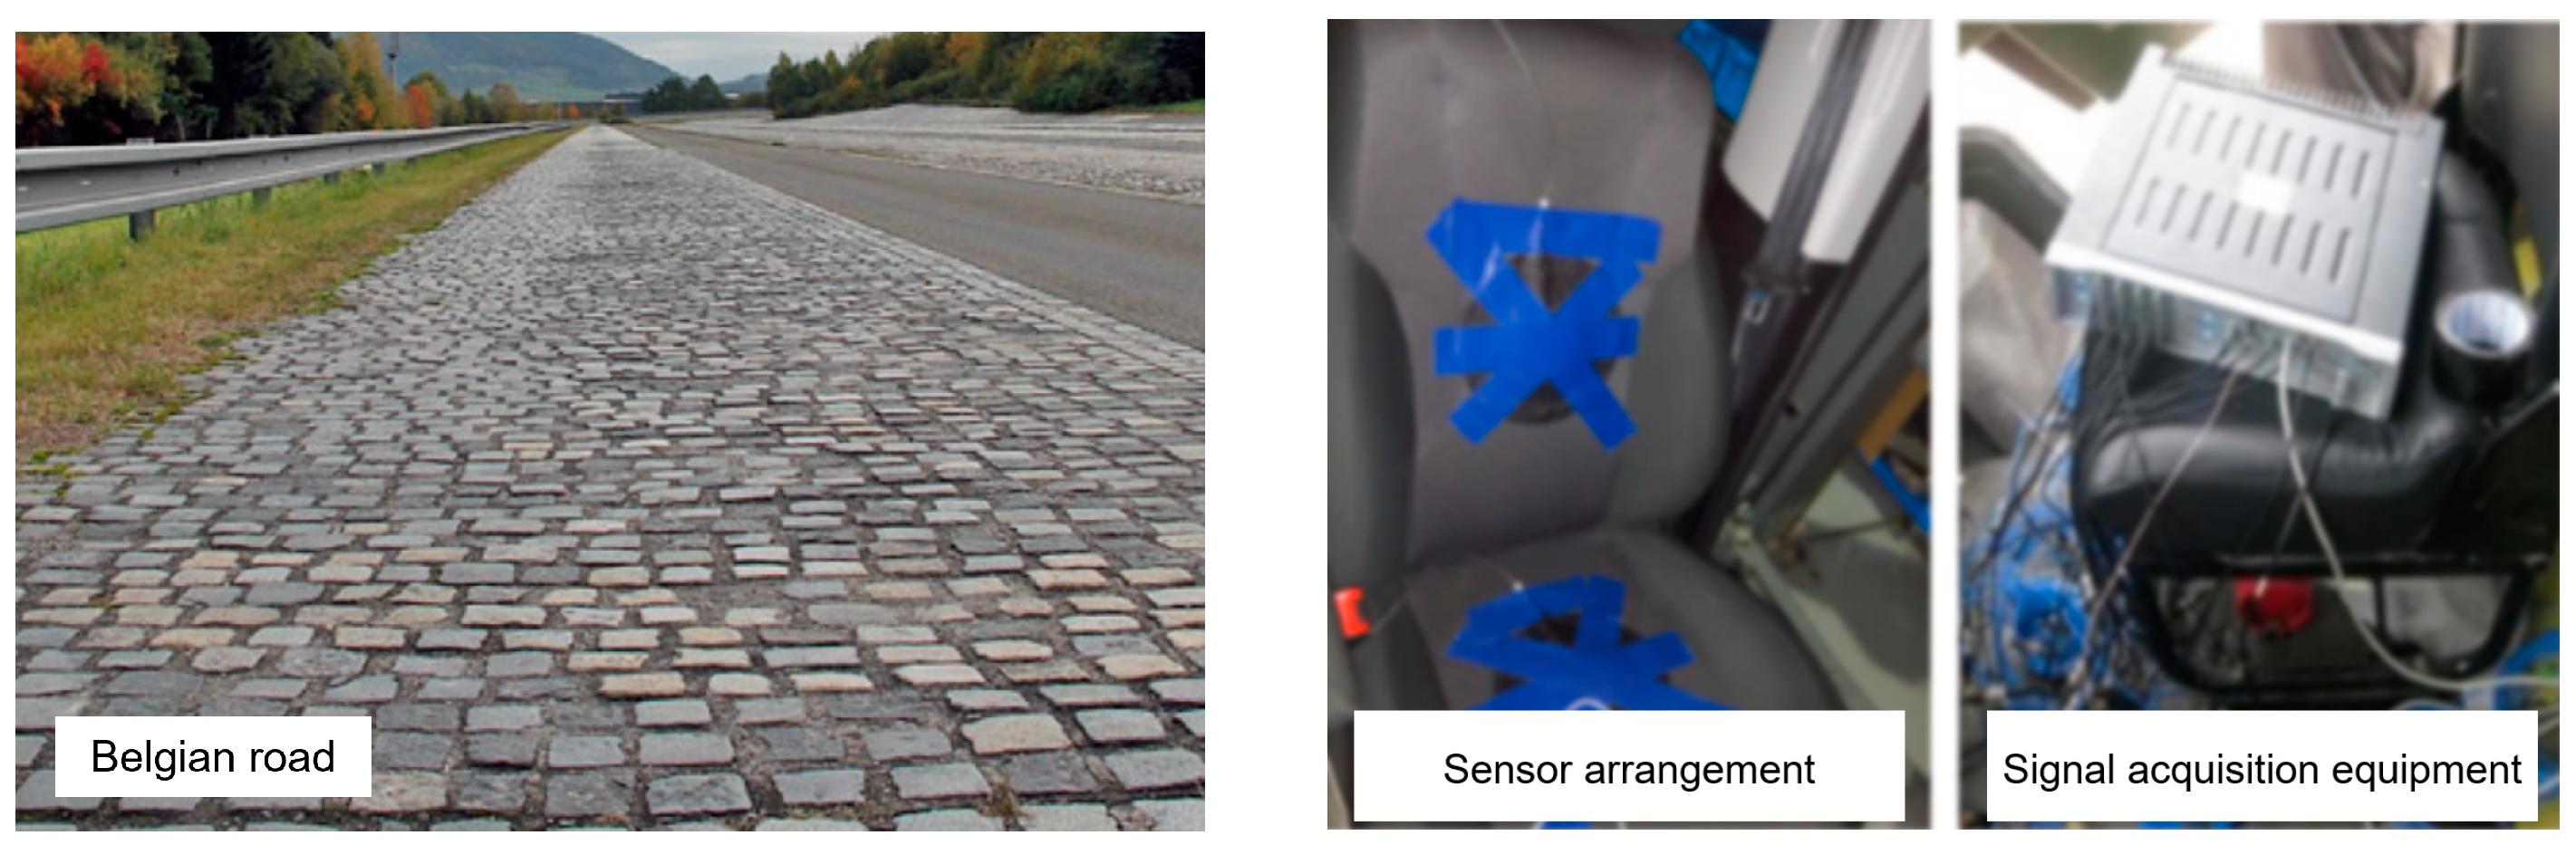
2.1.1. Road Model
2.1.2. Vehicle Dynamics Model
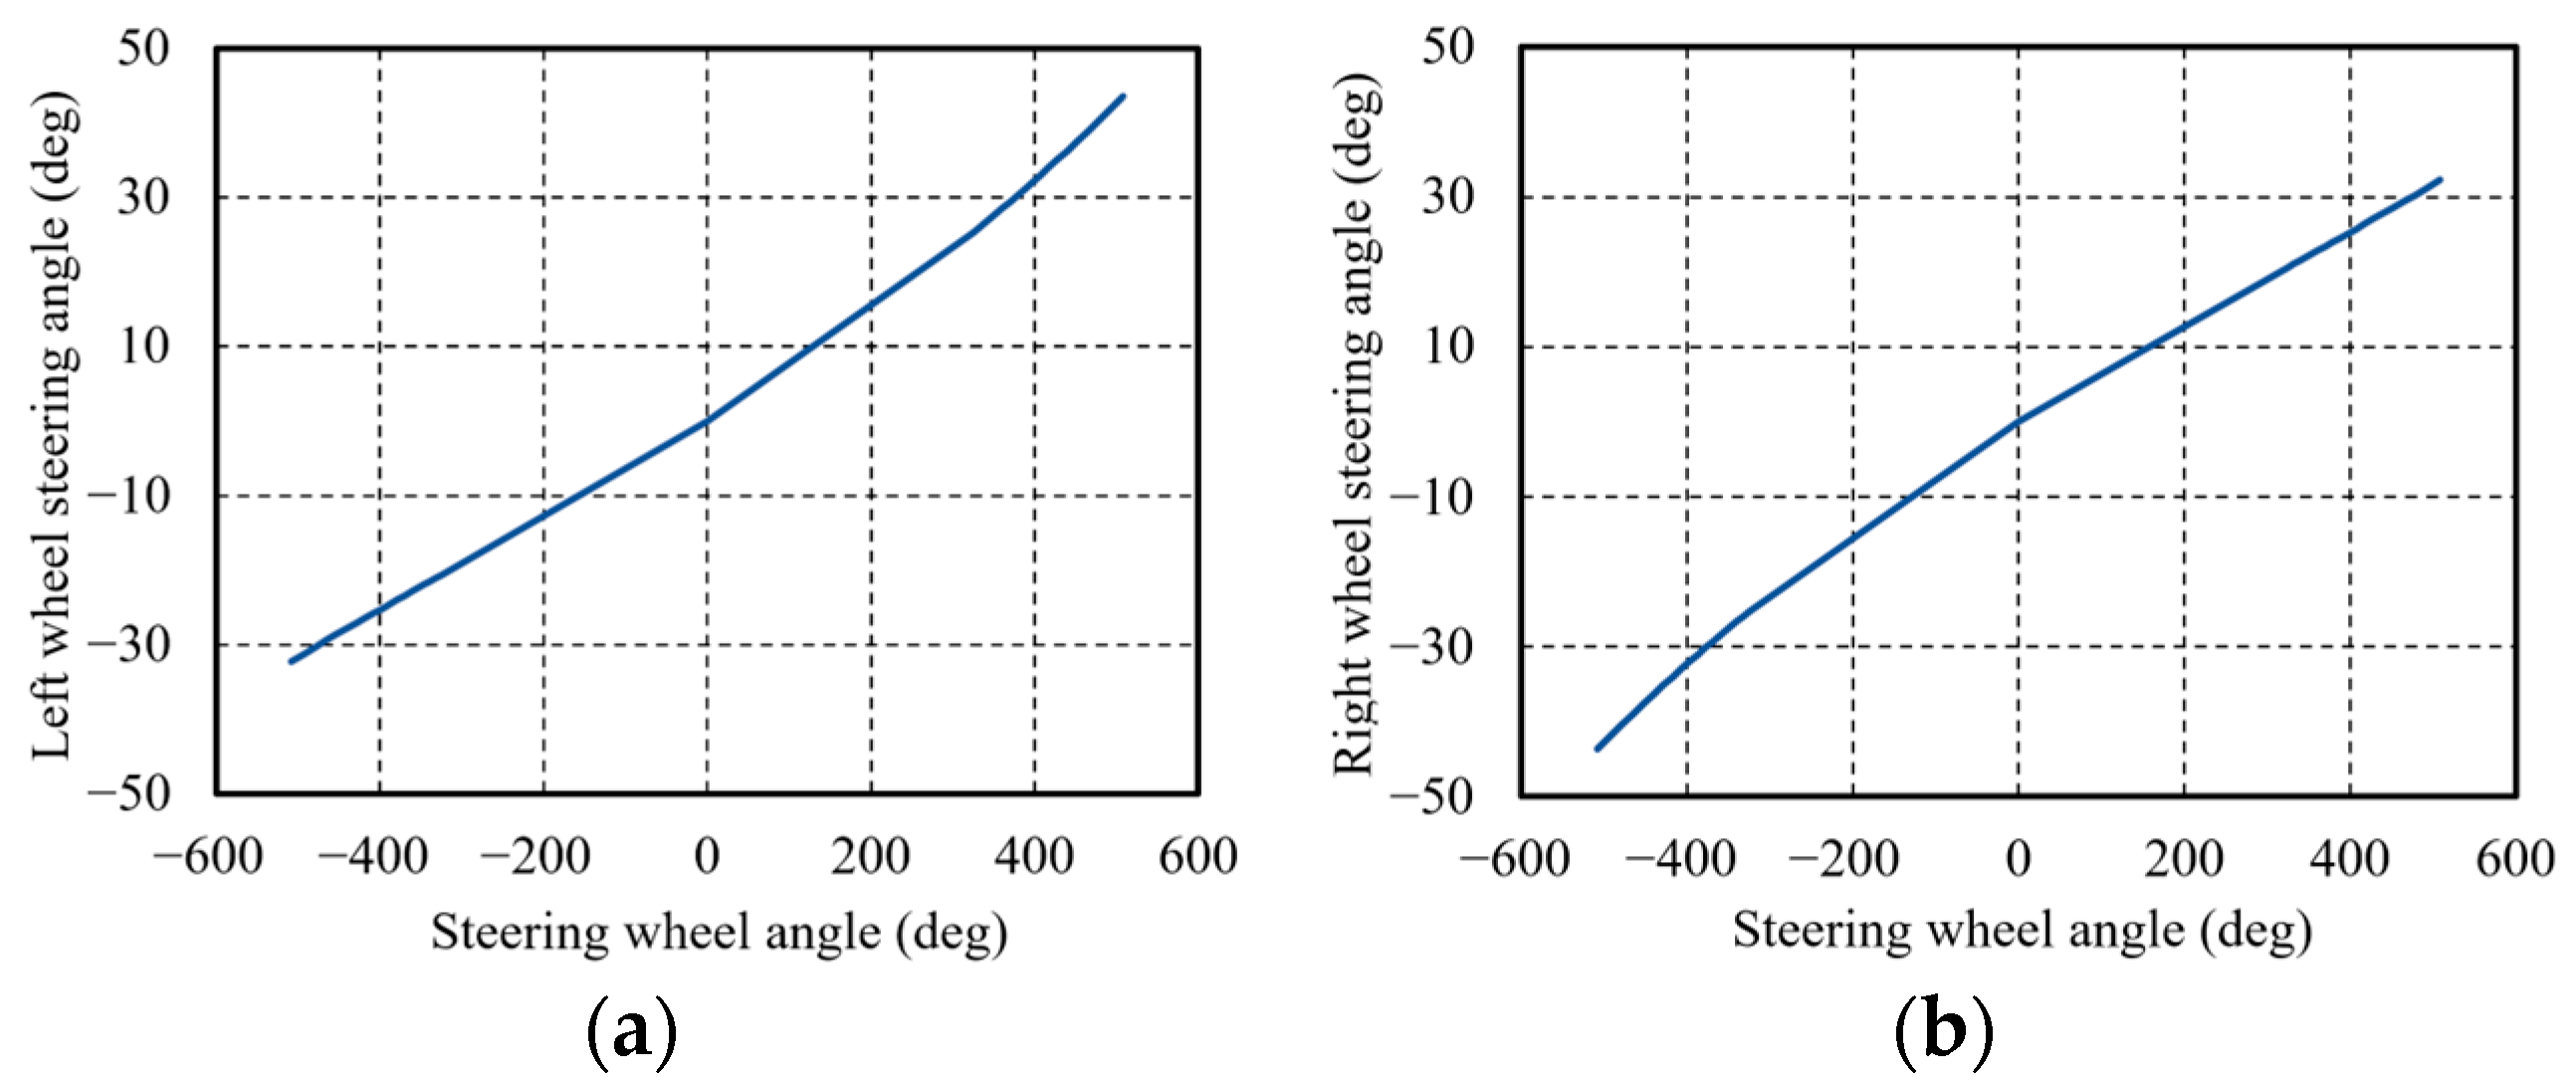
- Steering system dynamics characteristics
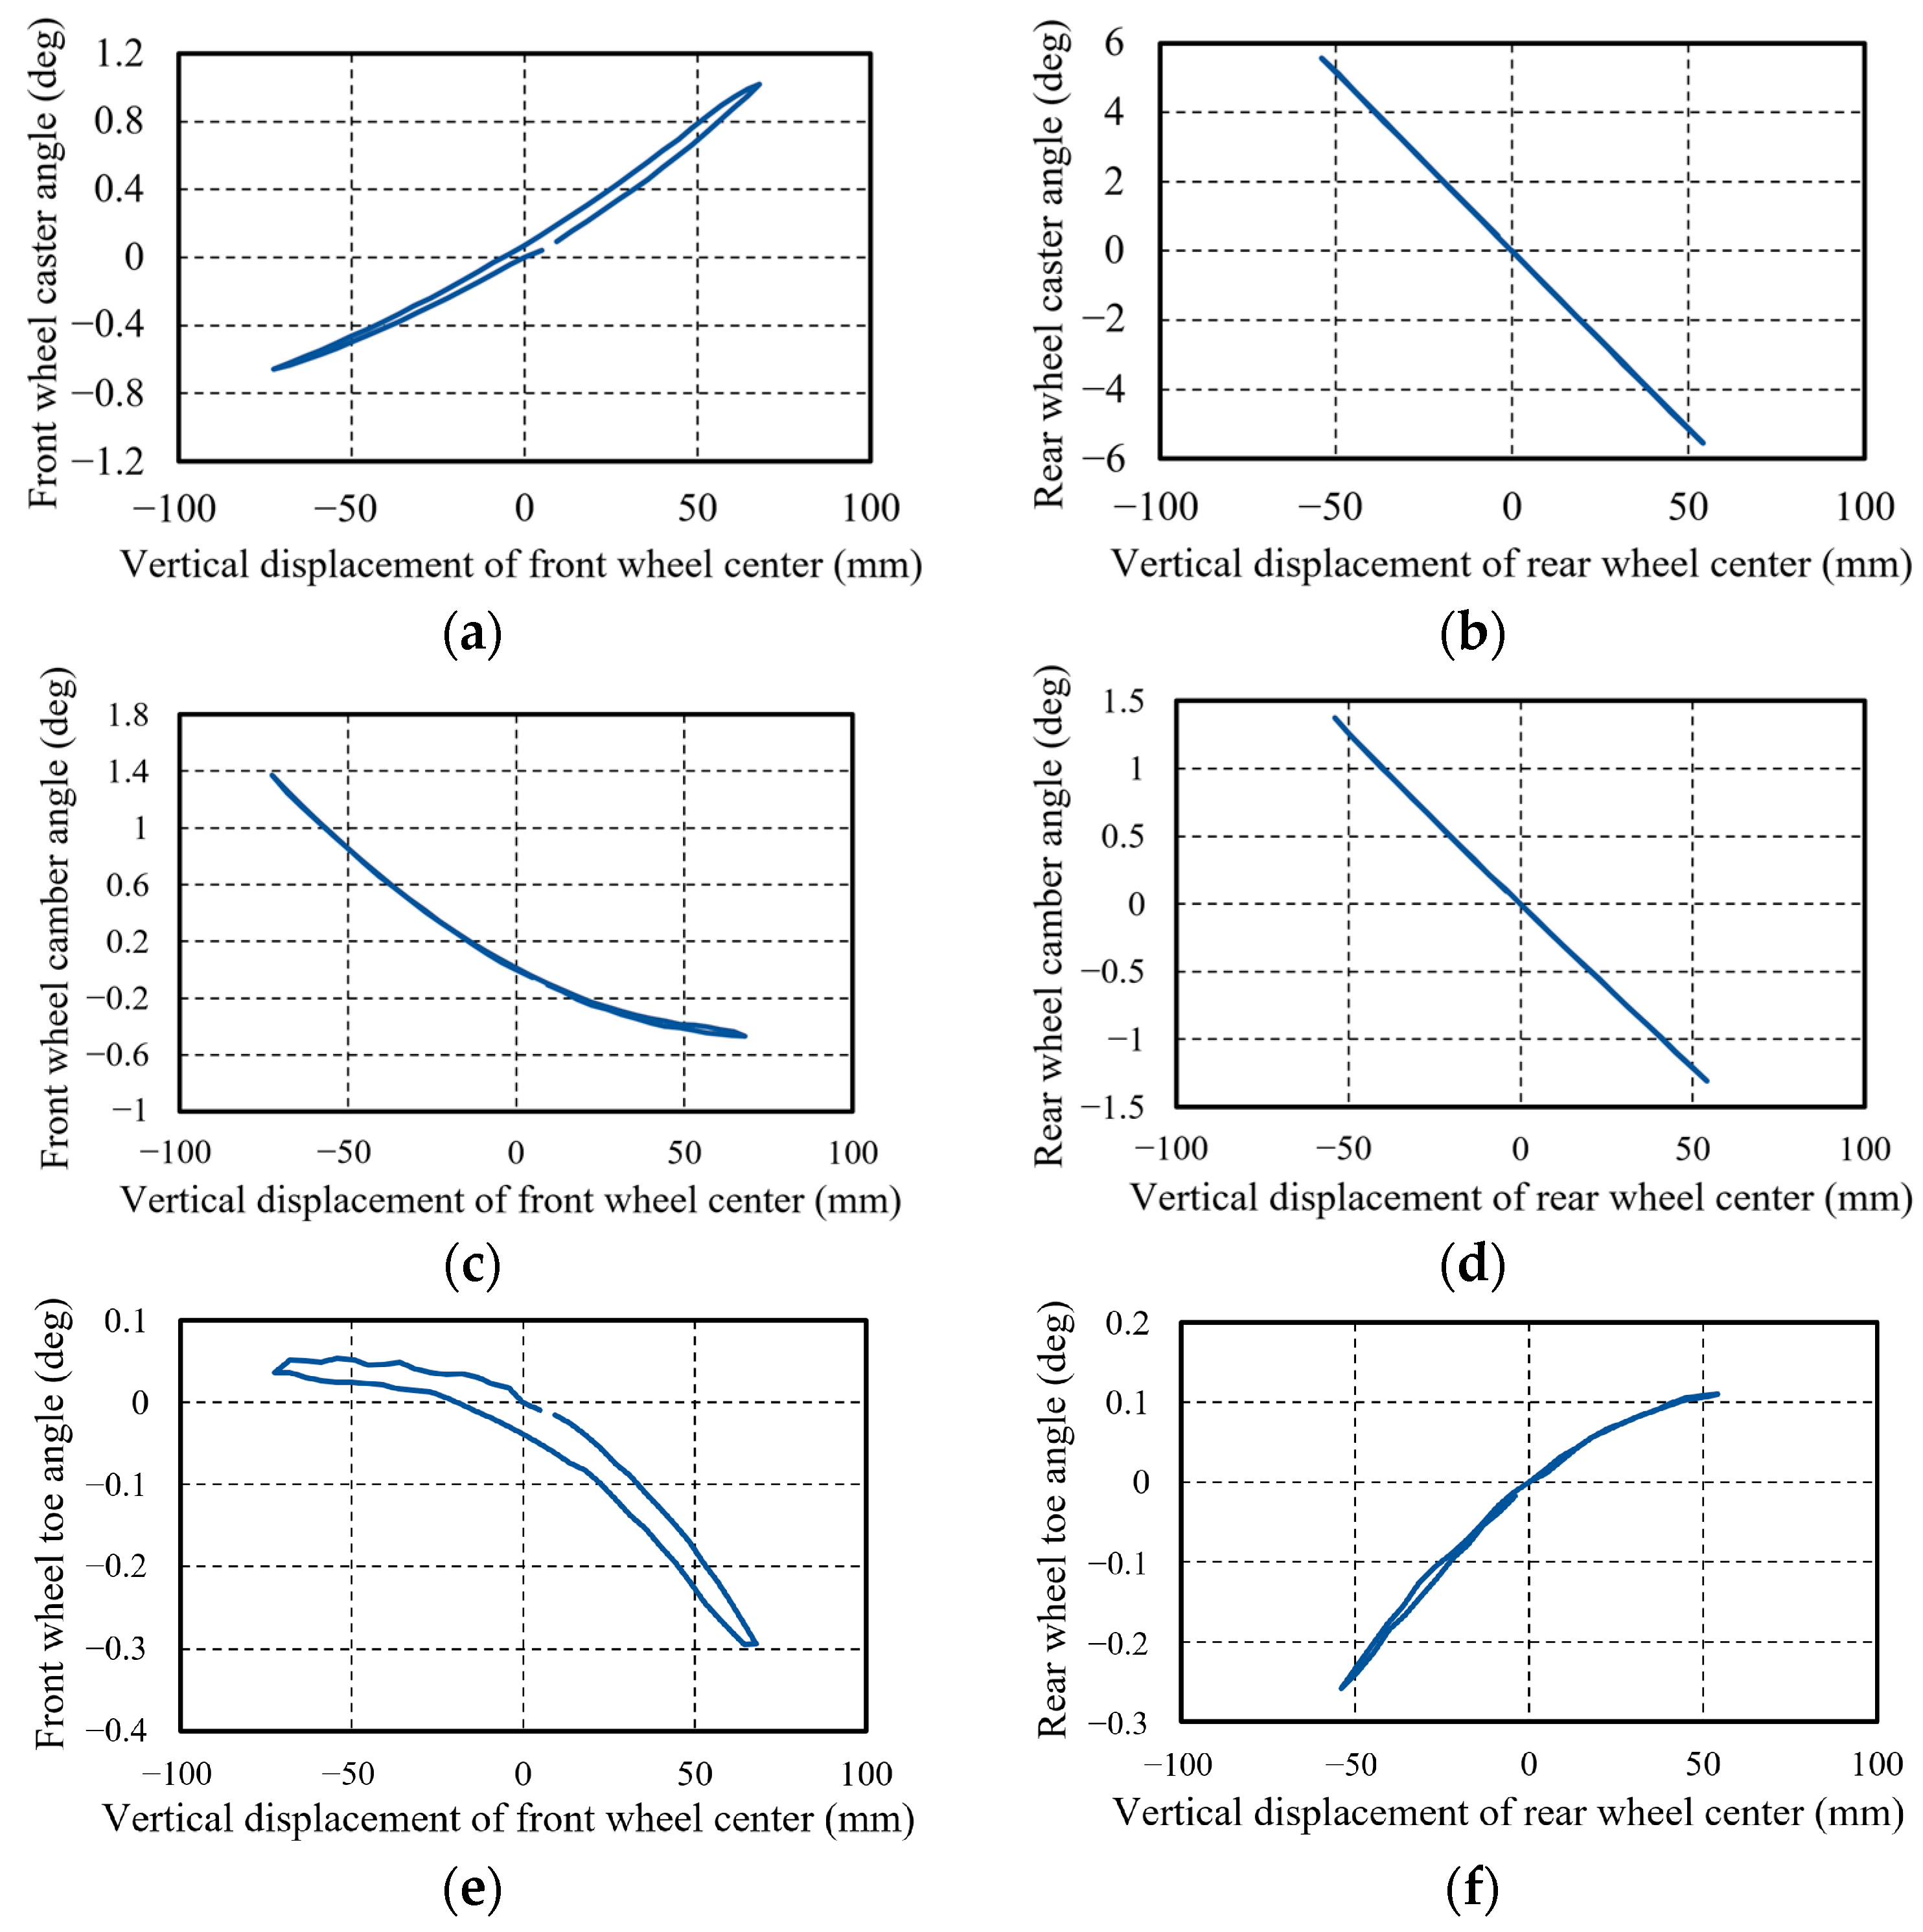
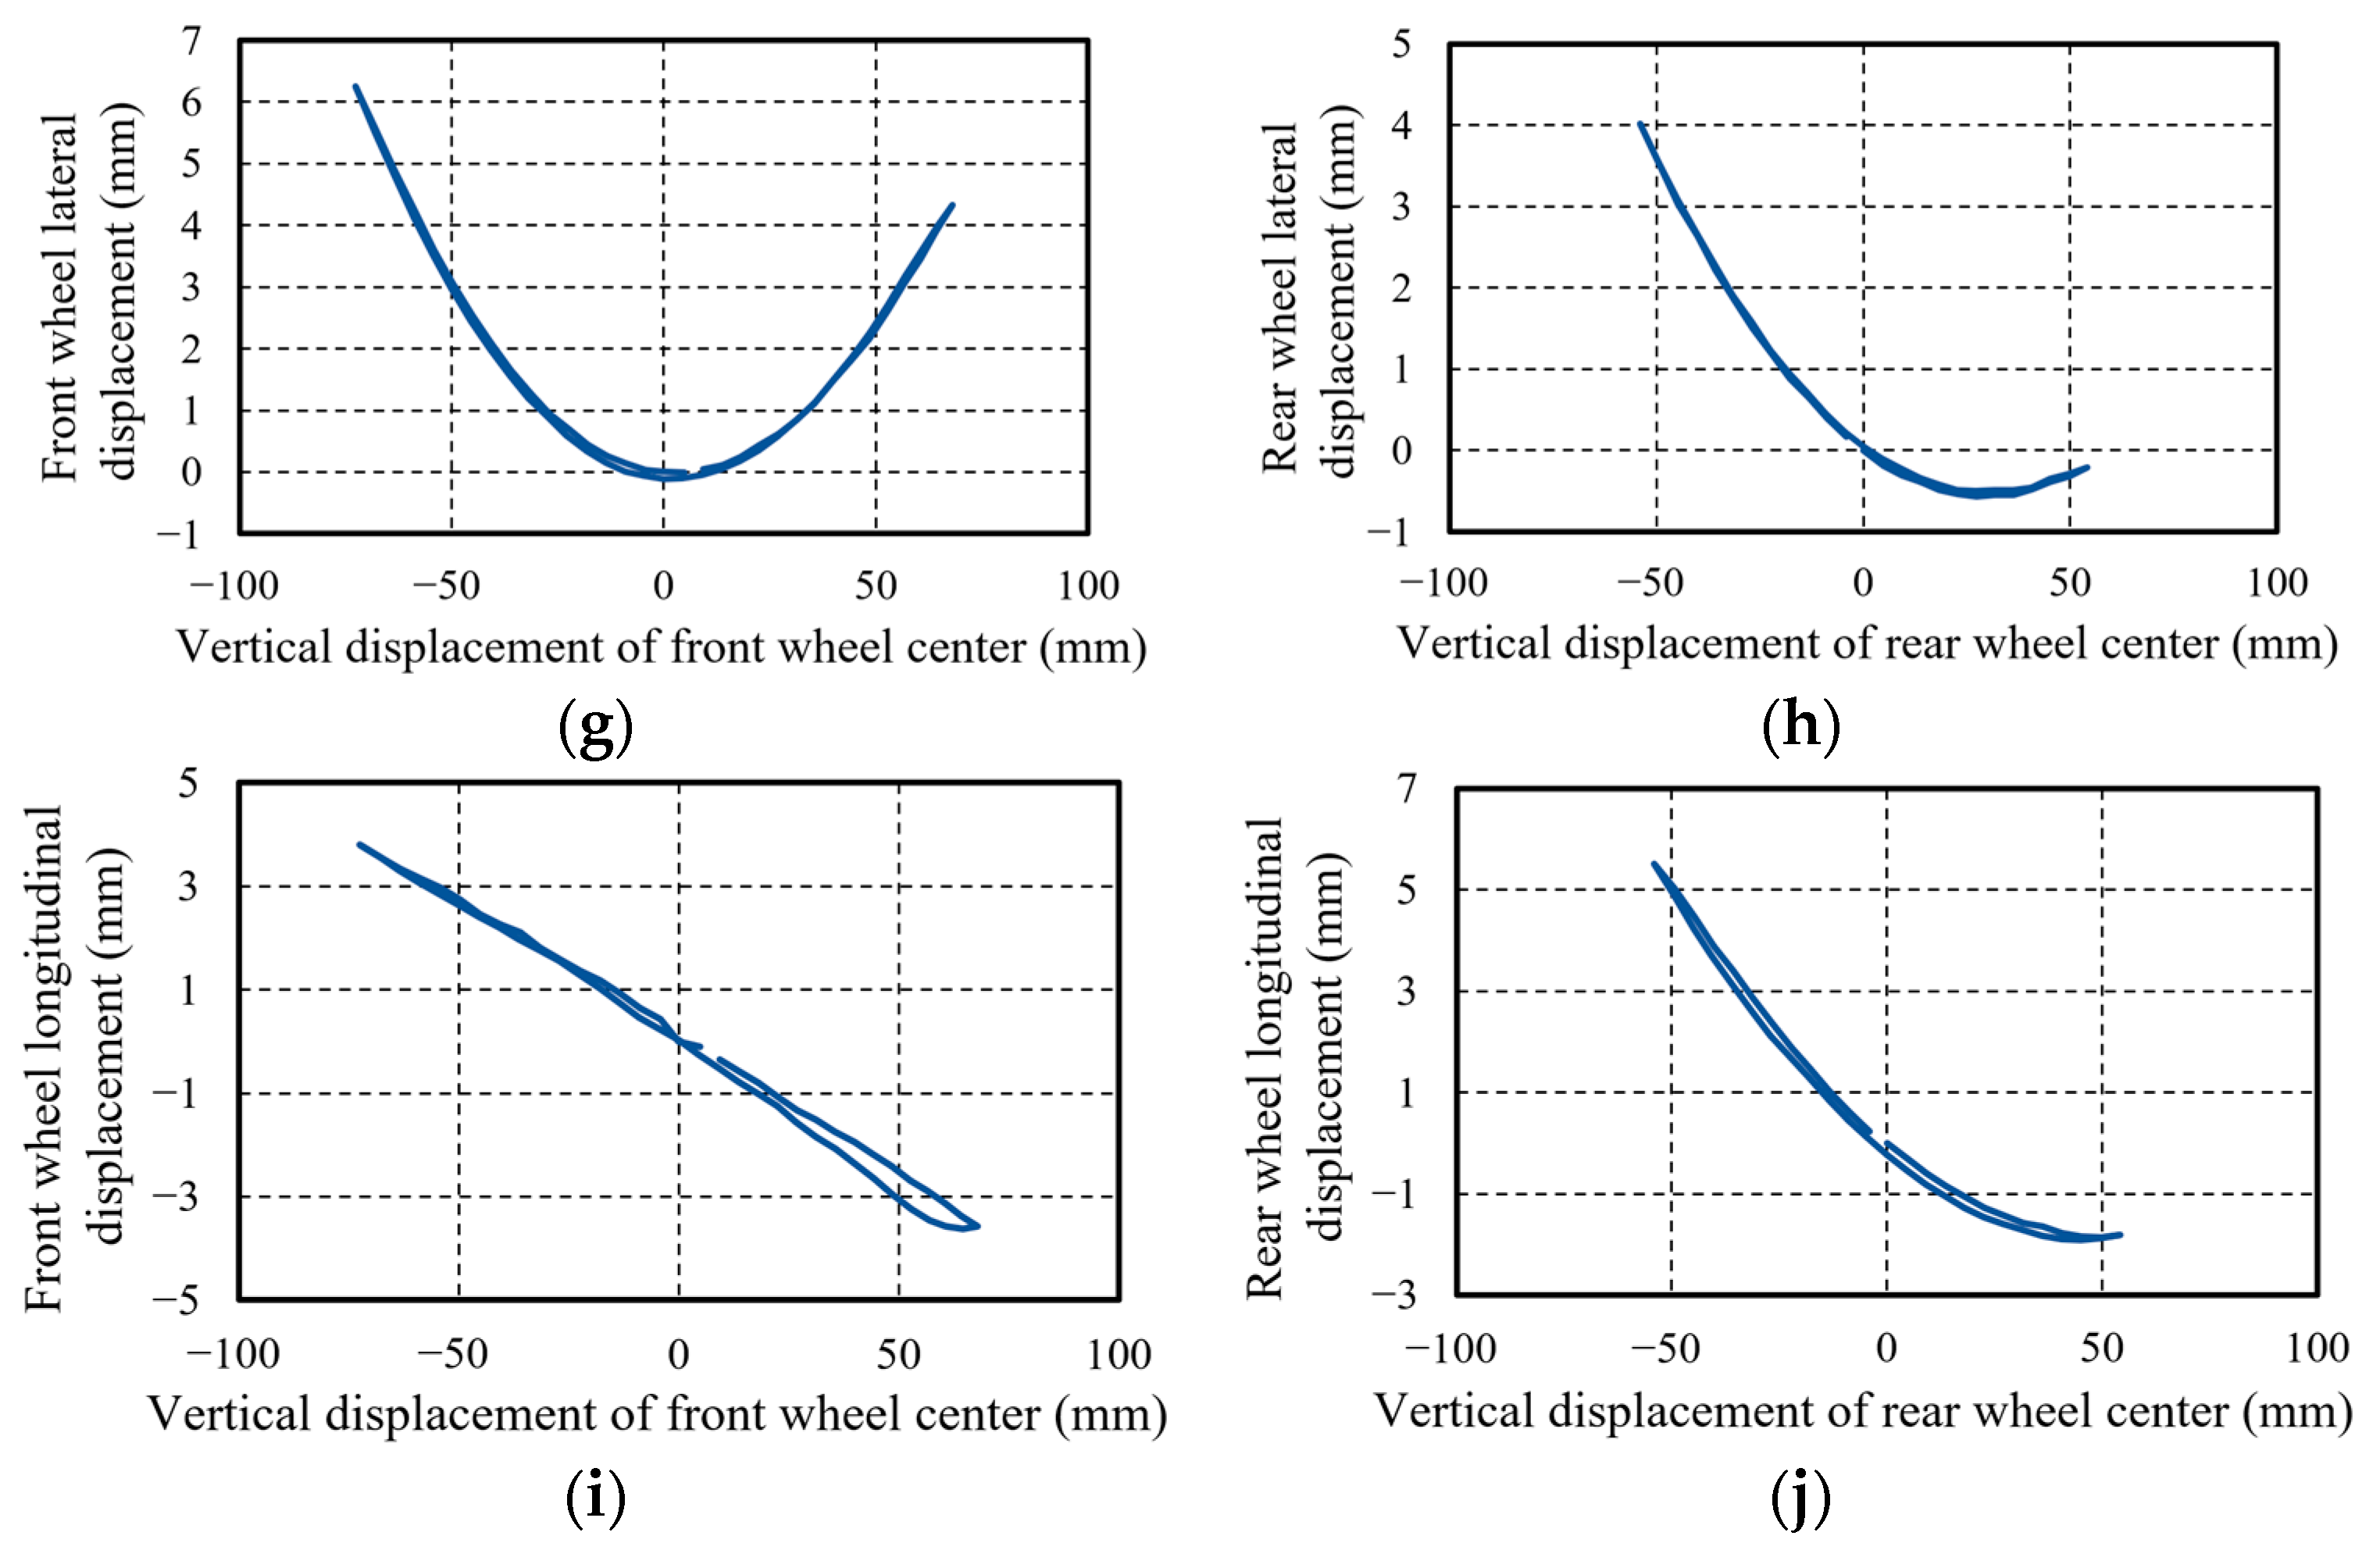
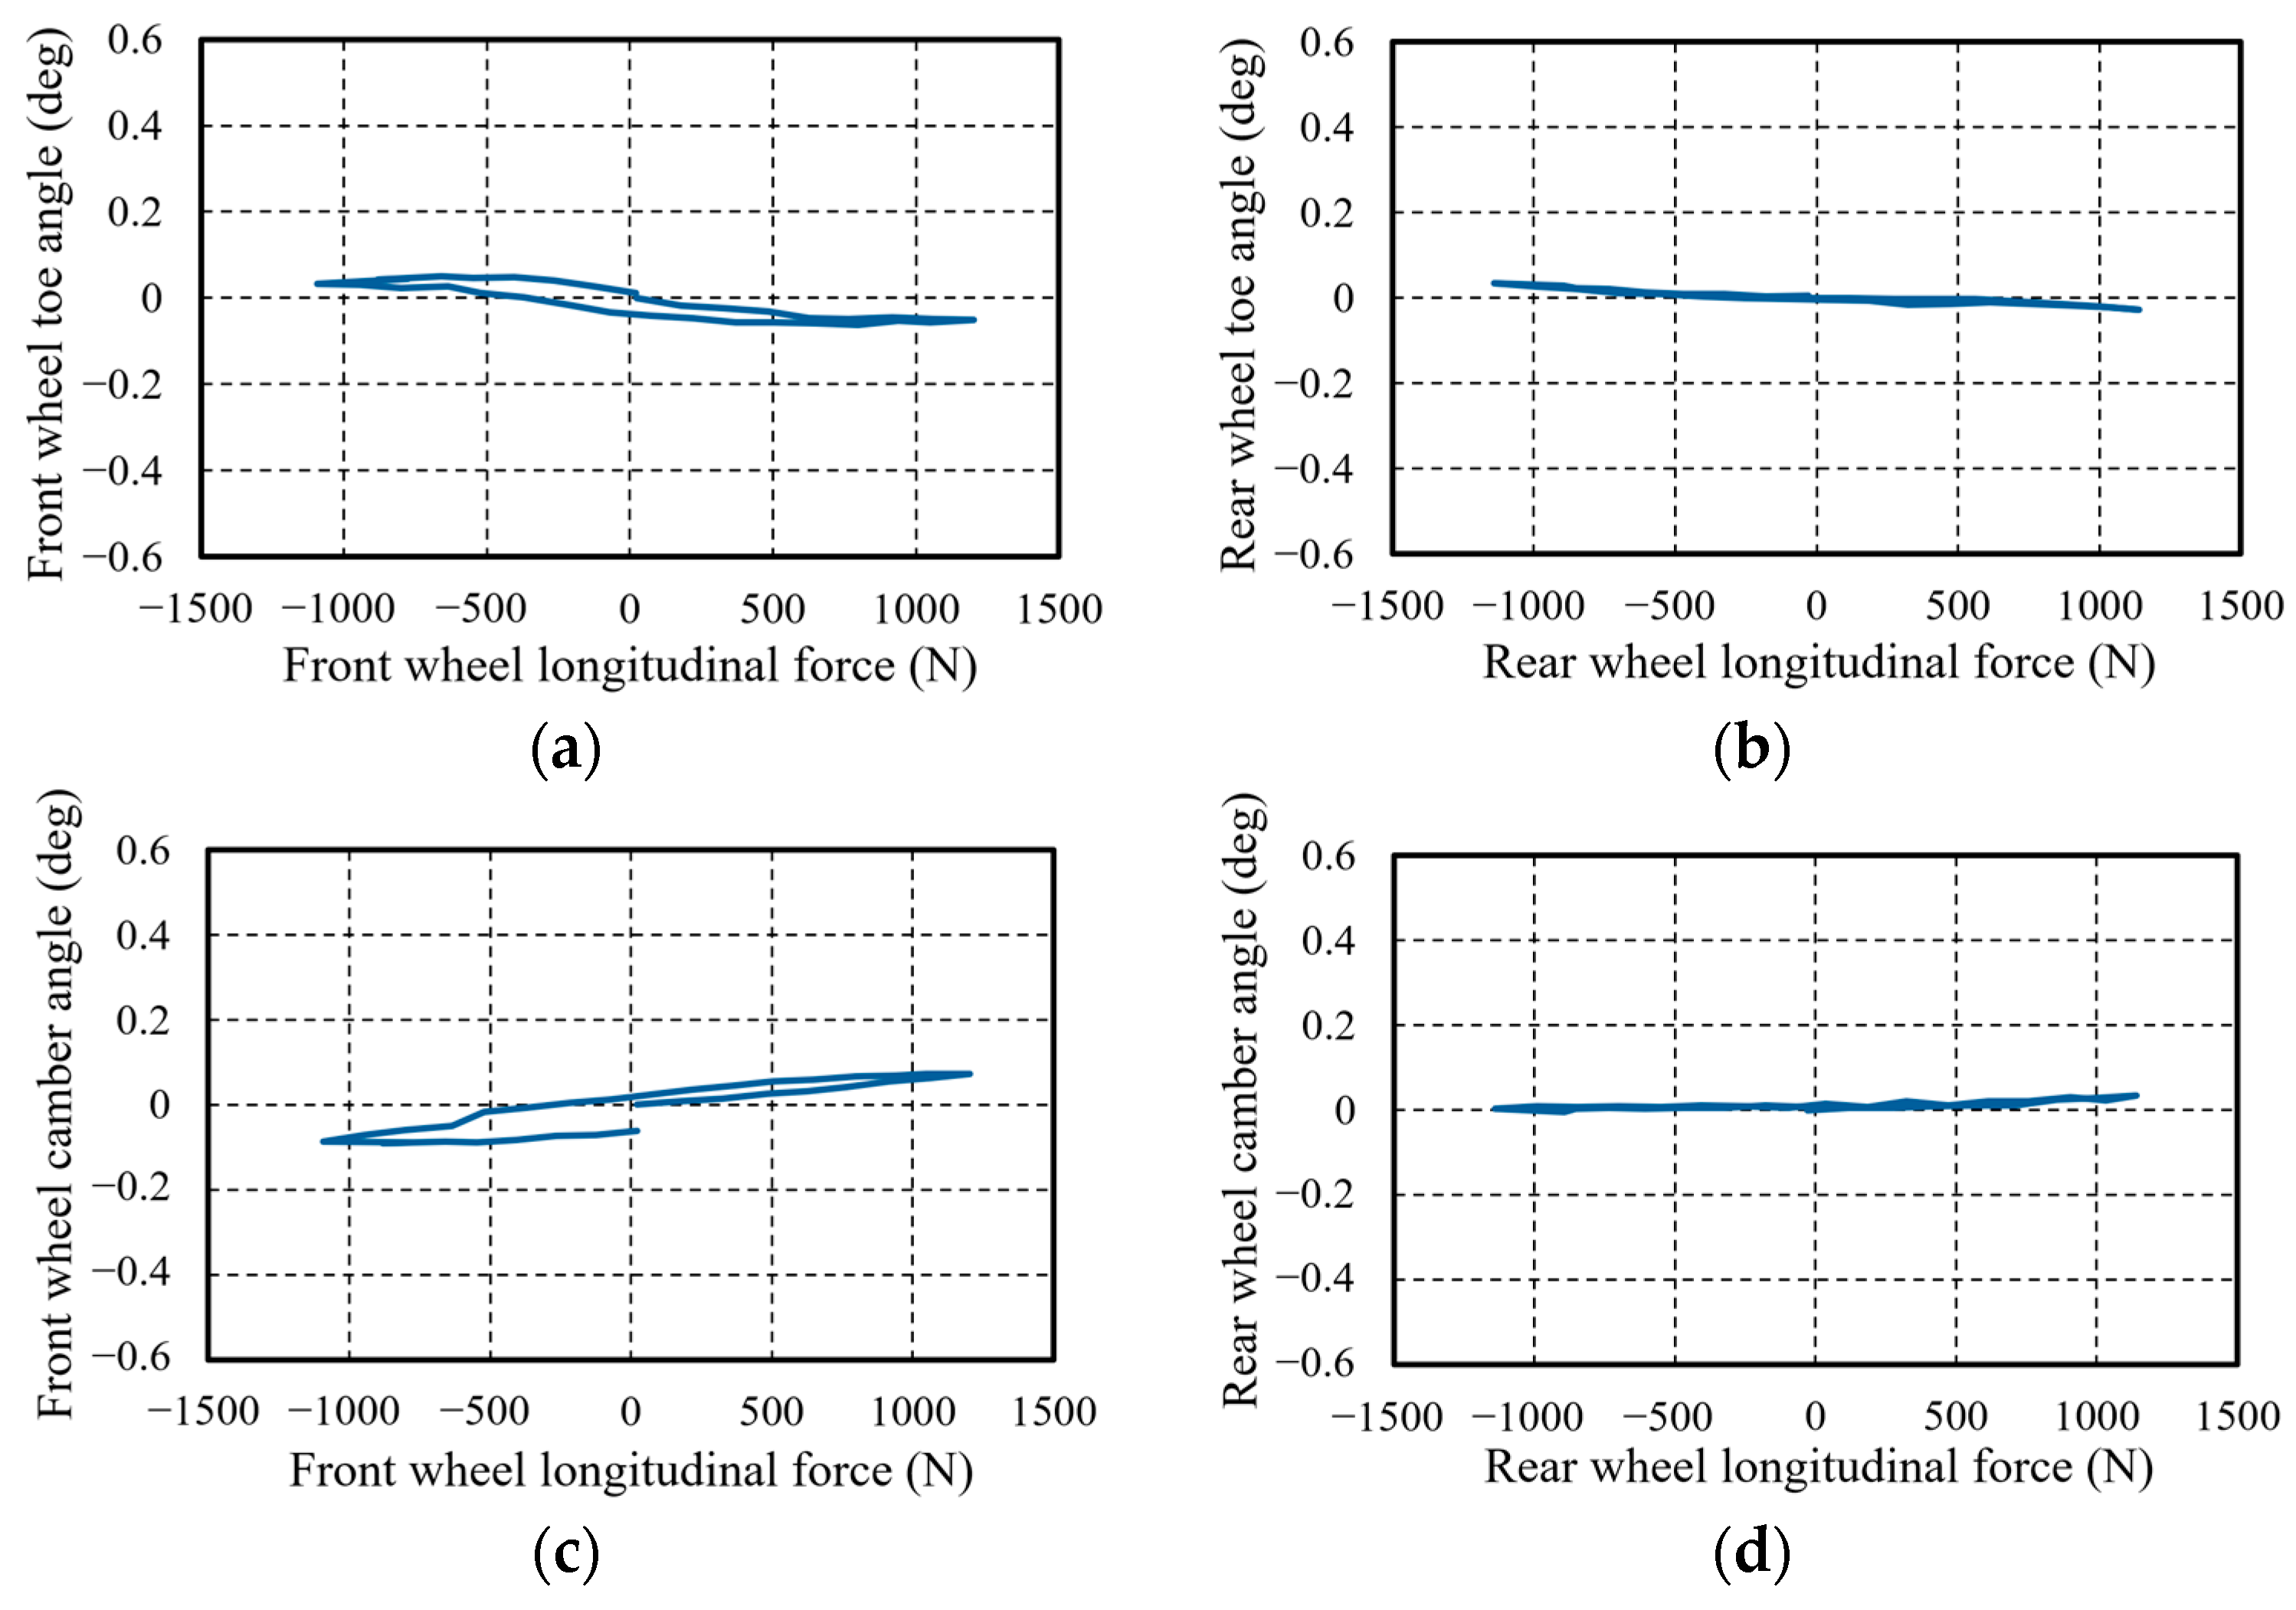
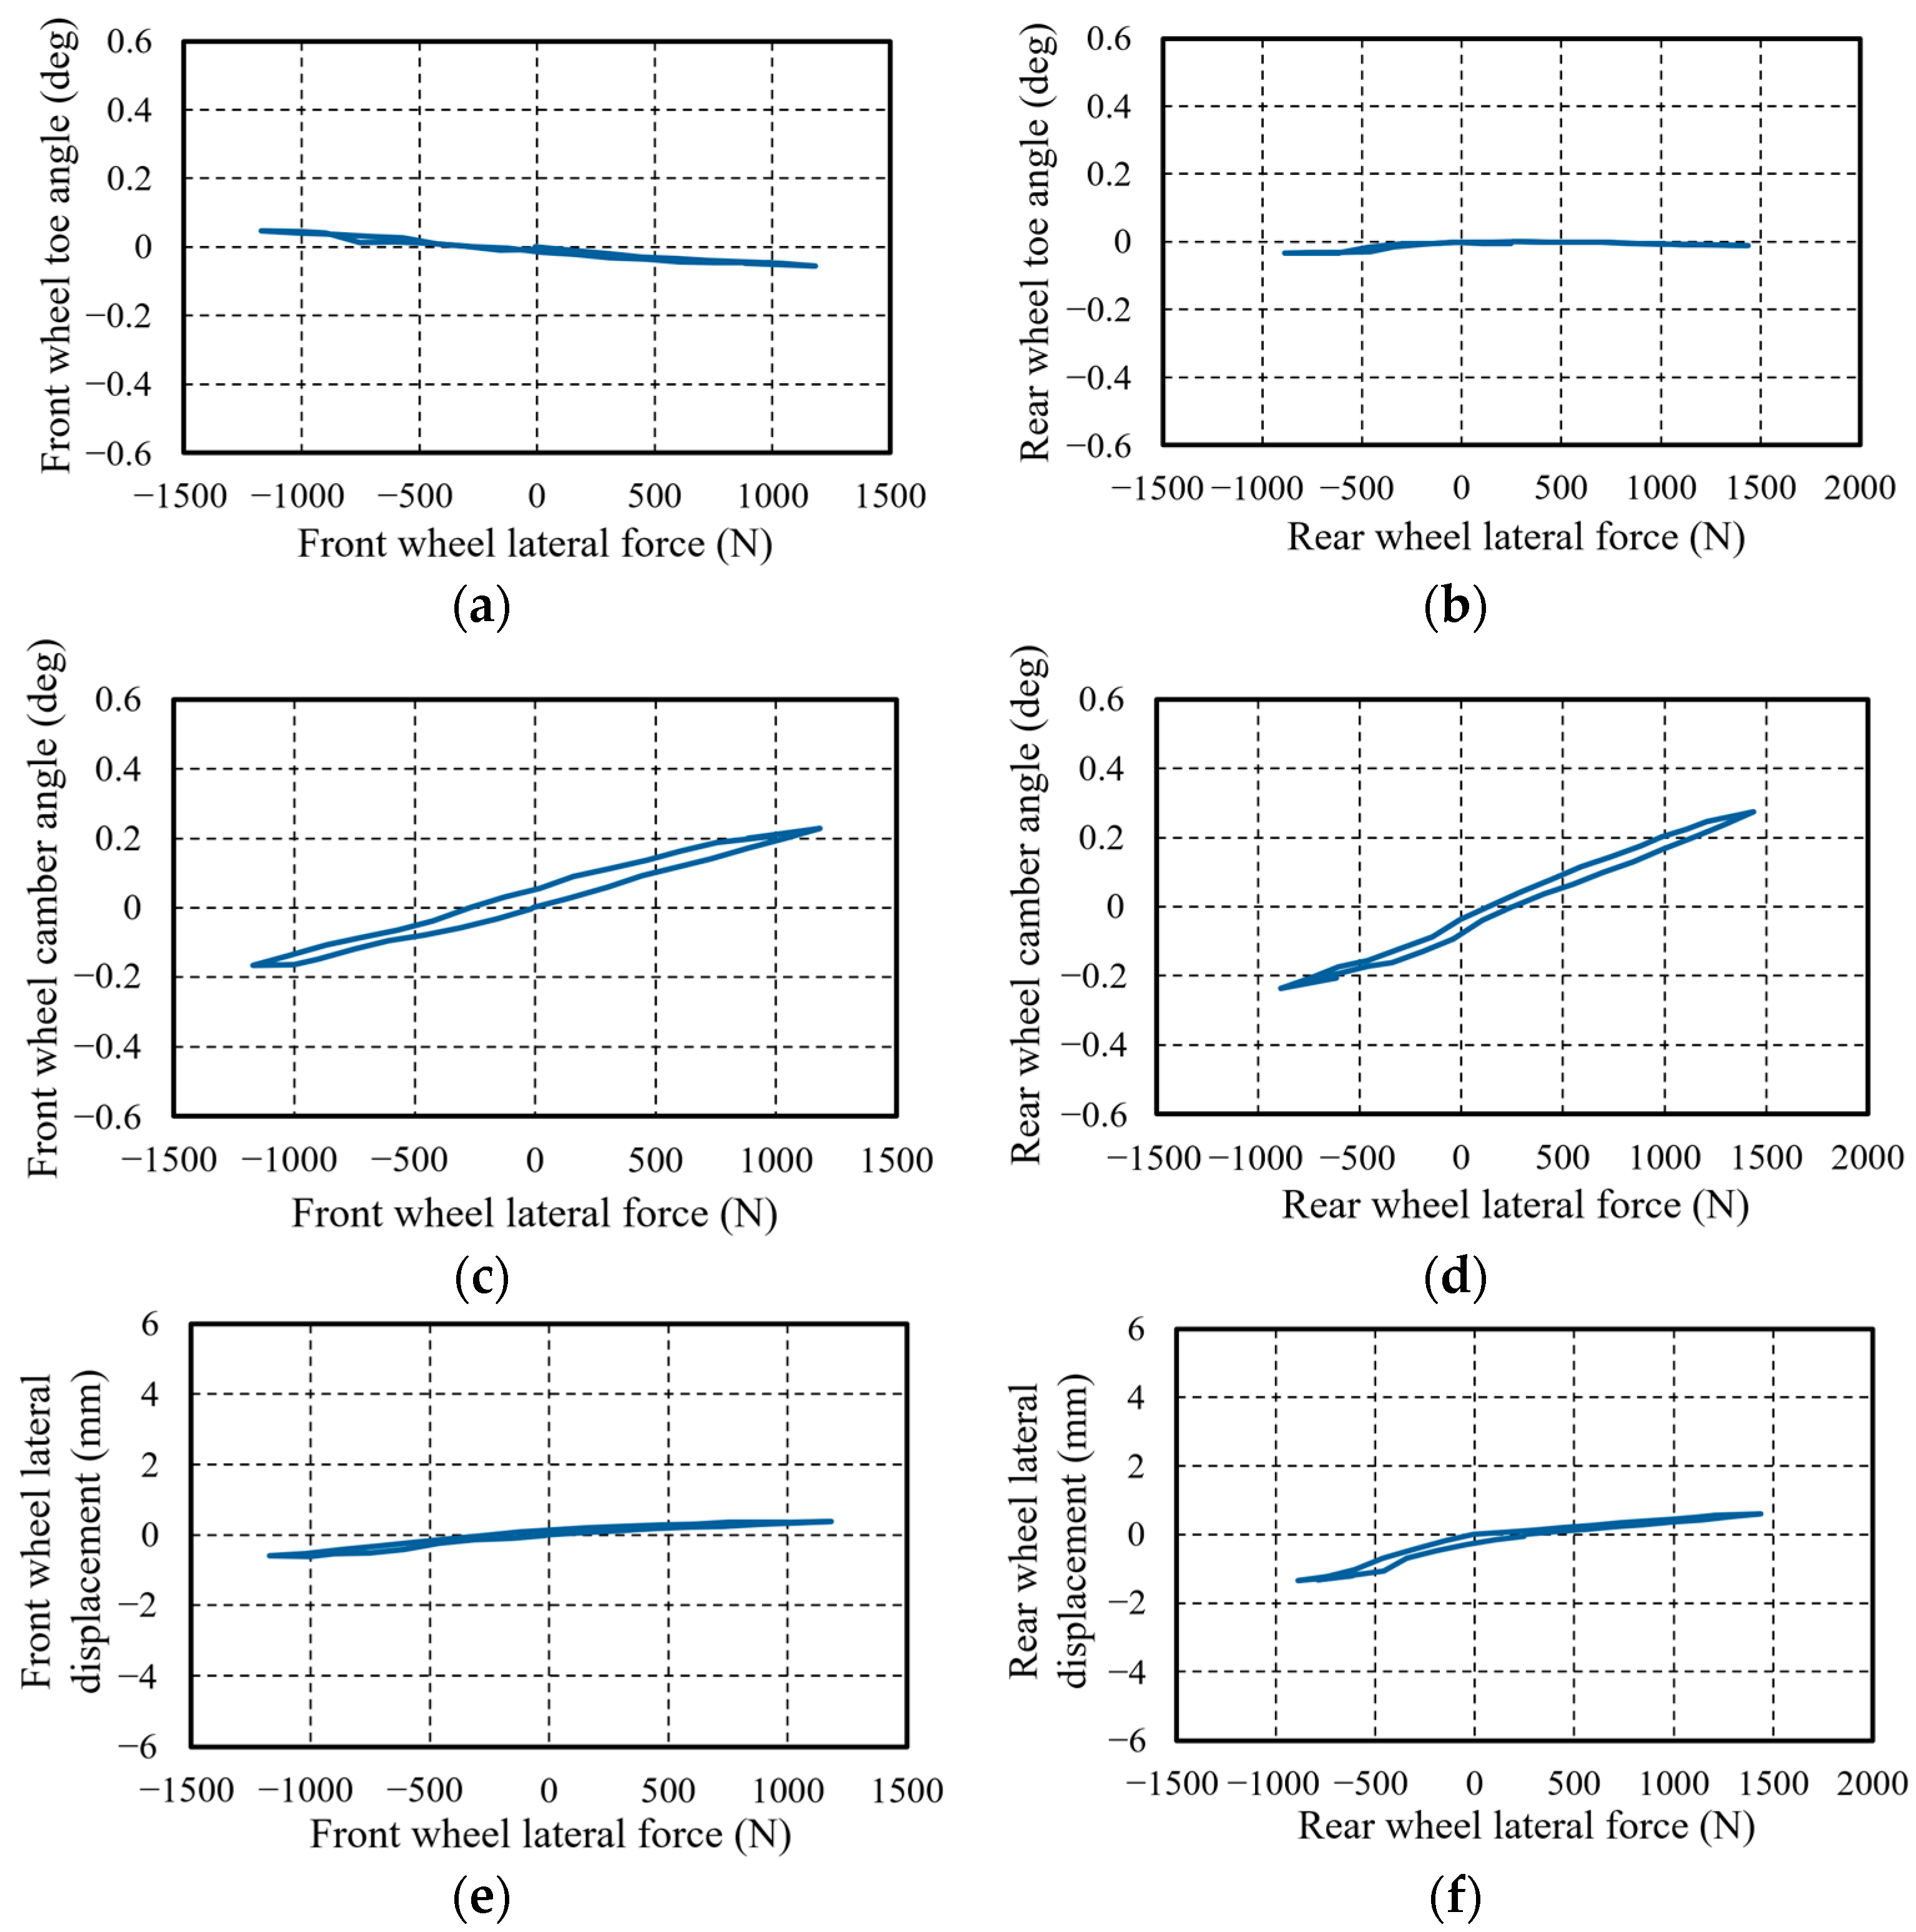
- Suspension system kinematics characteristics
- Suspension system compliance characteristics
2.2. Vehicle Dynamics Model Validation
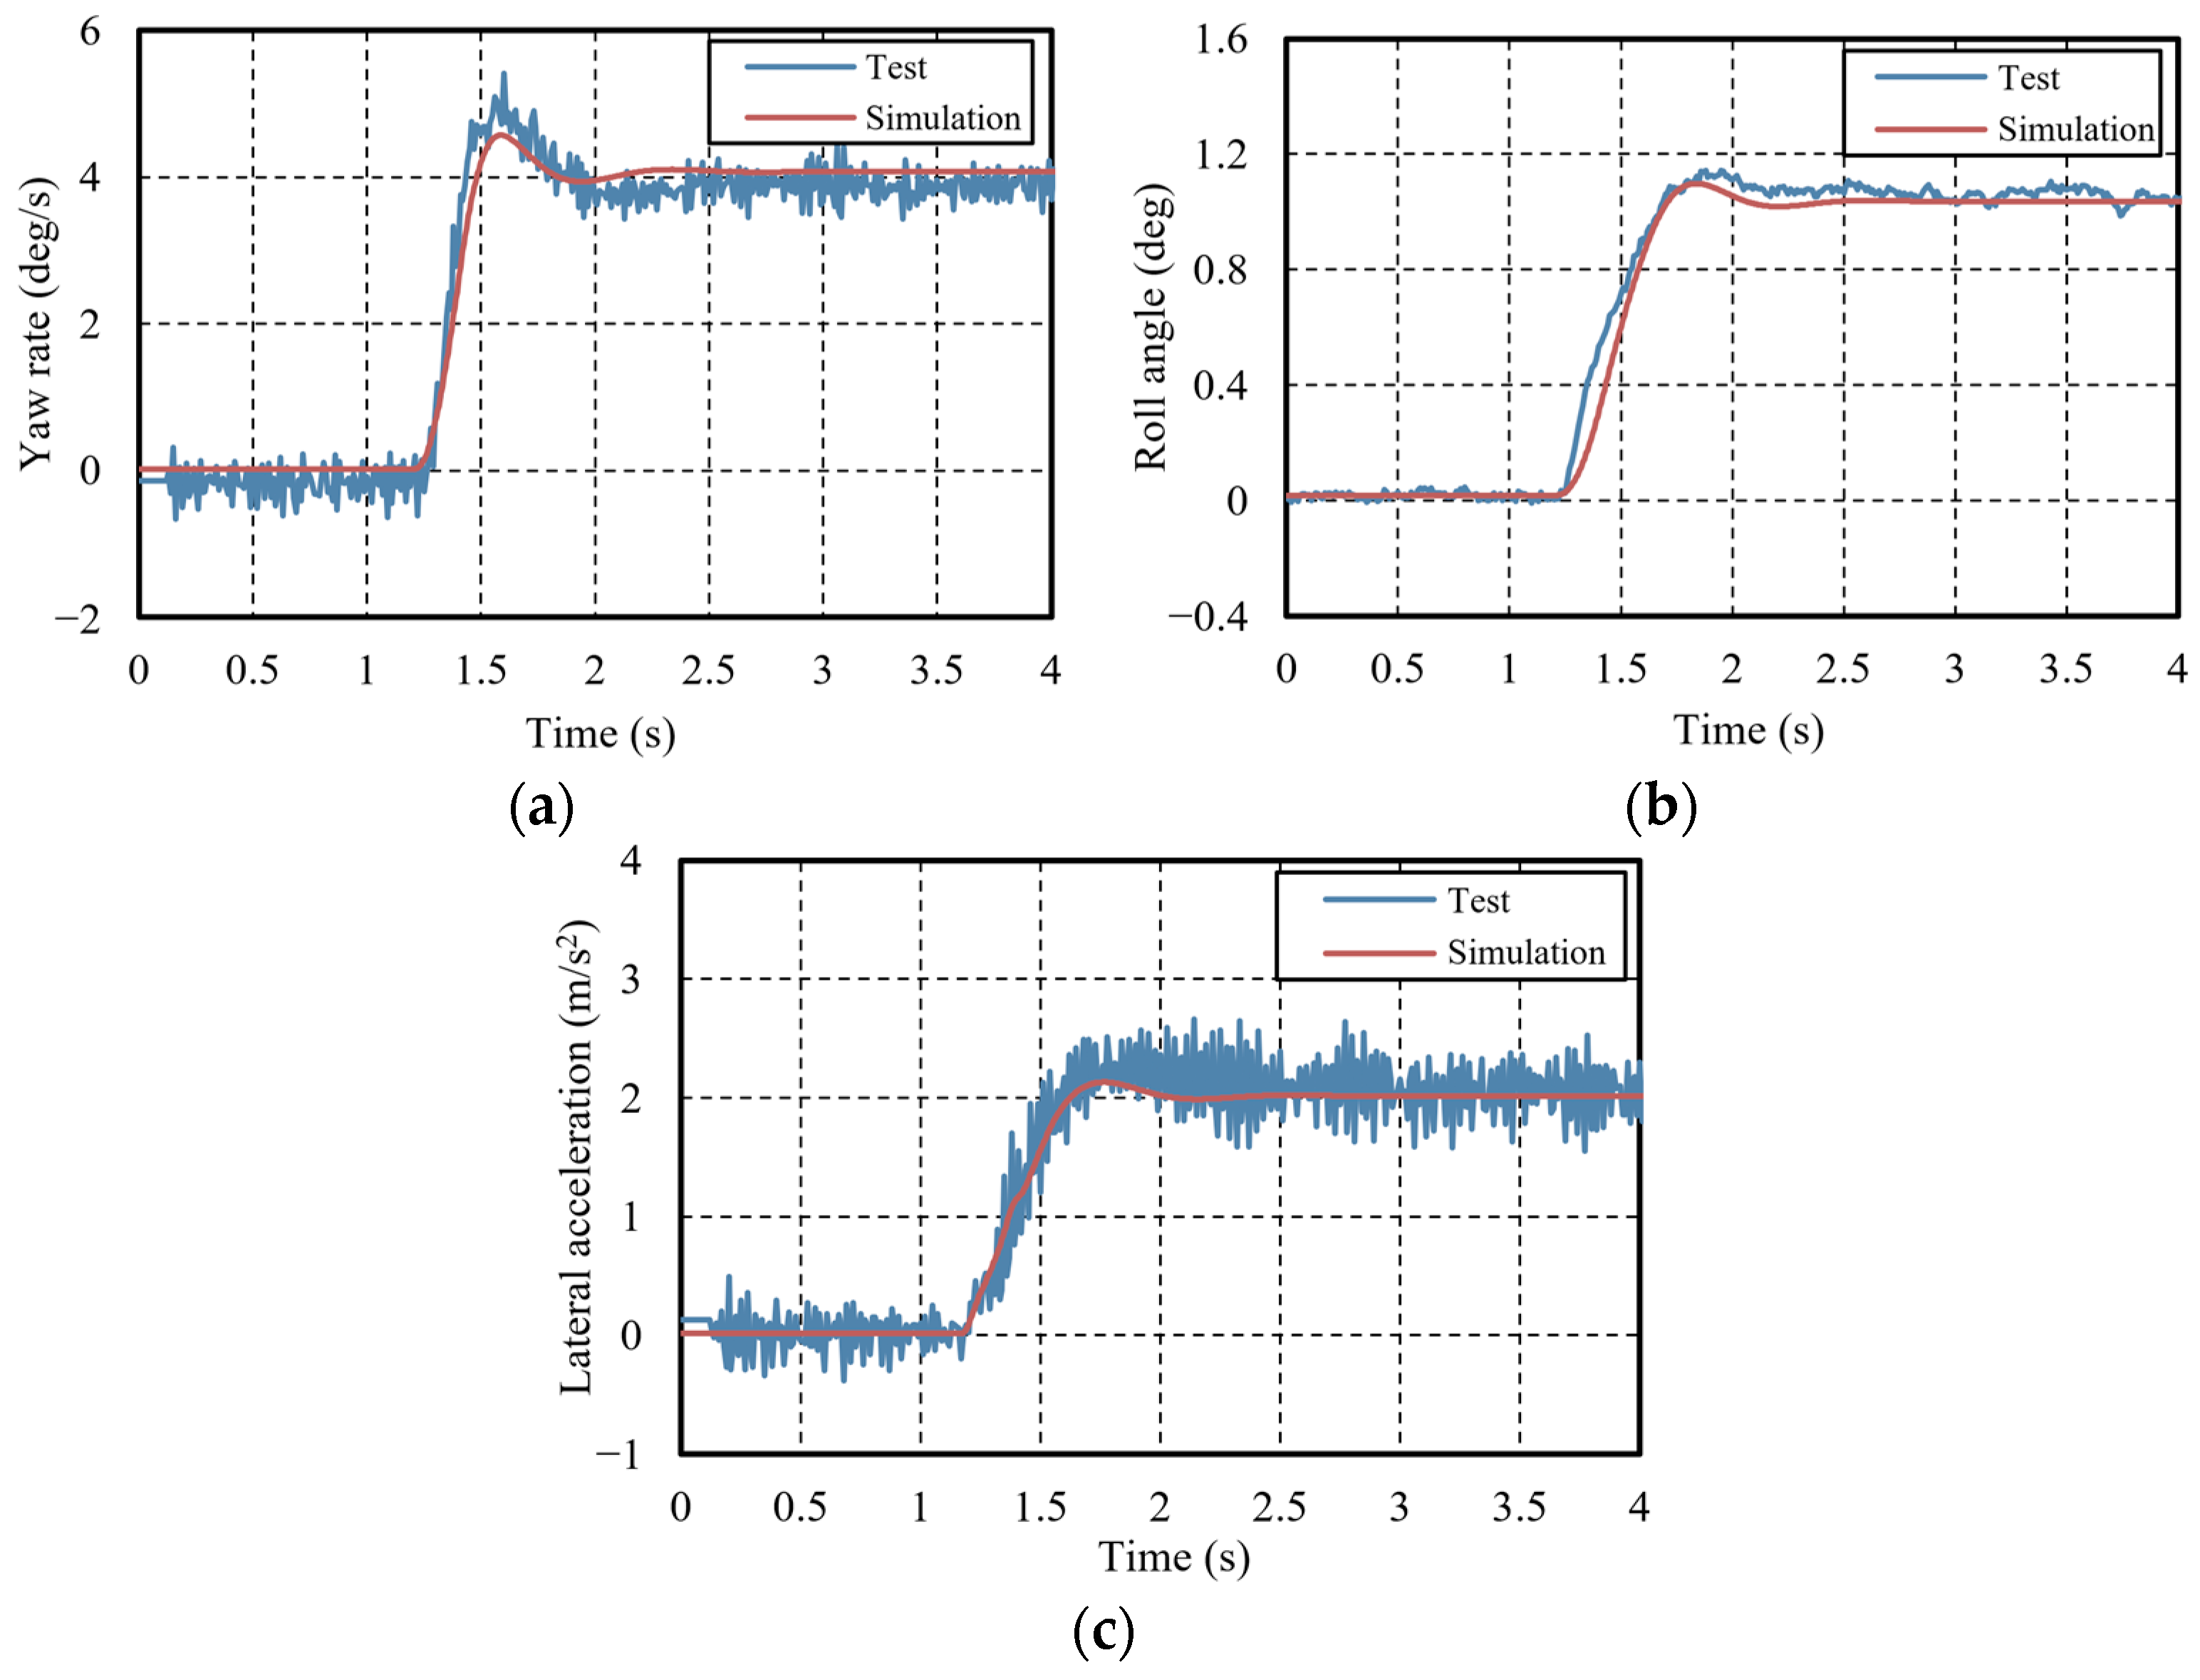
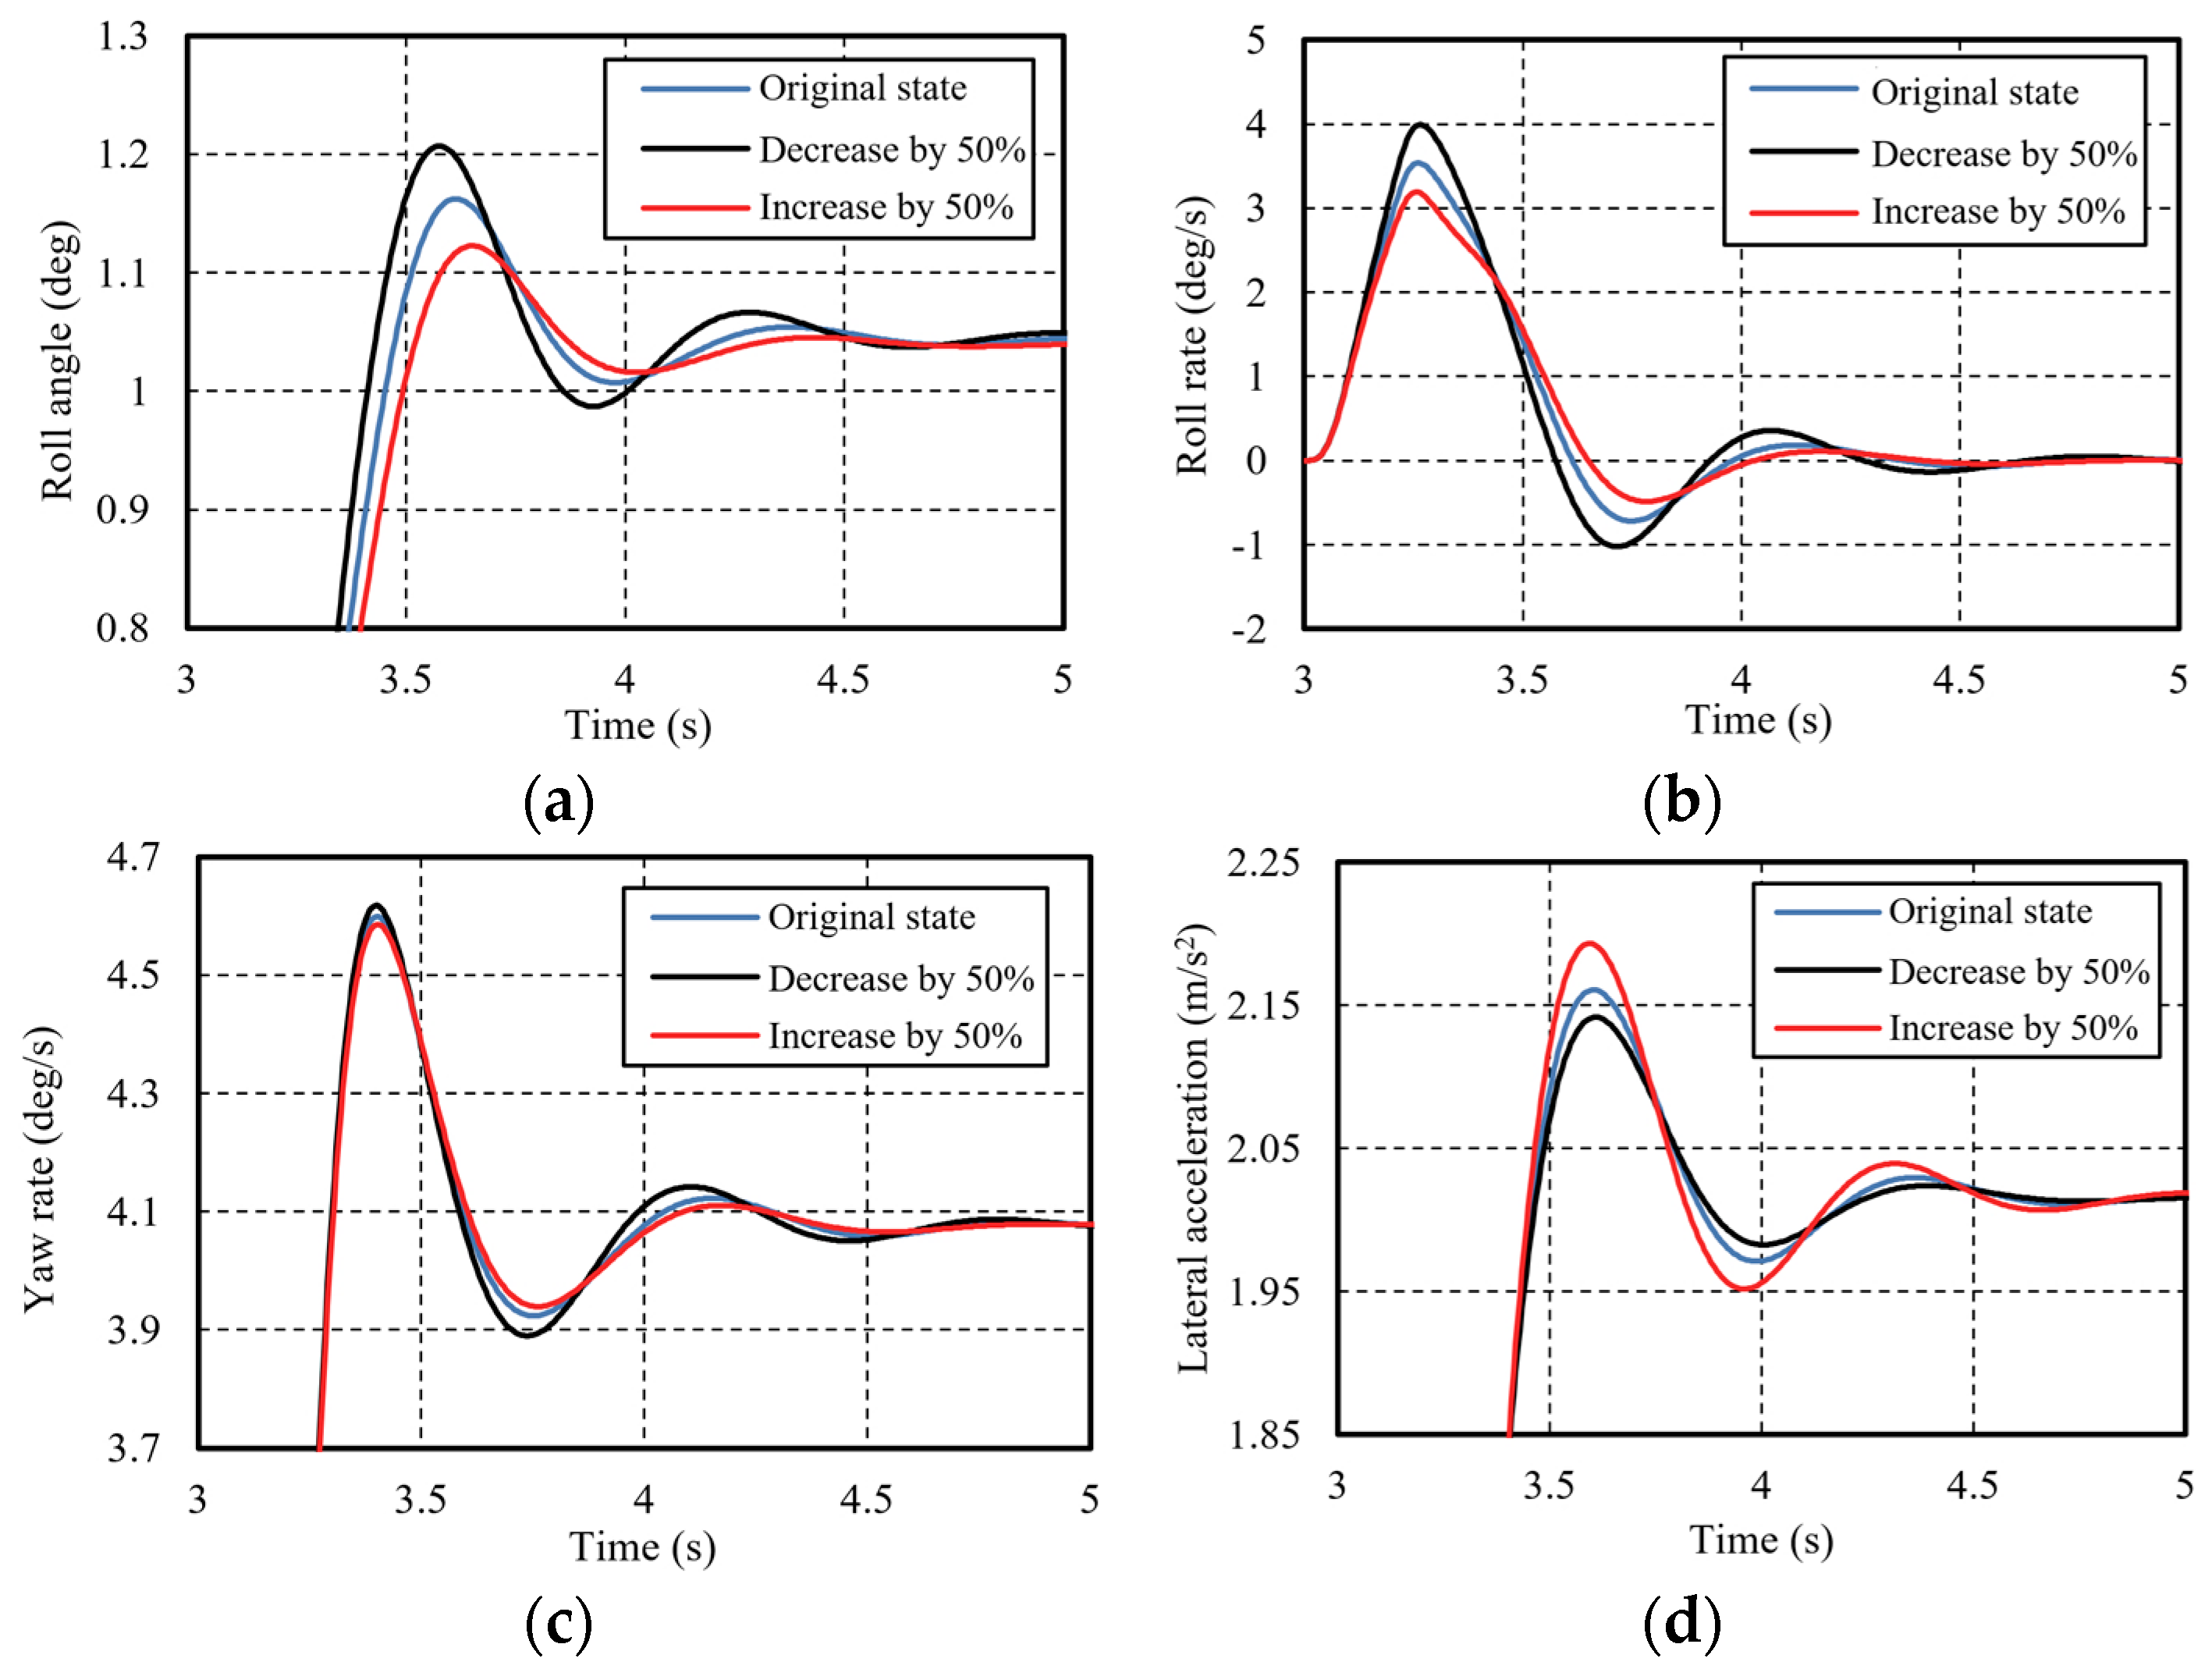
- Step input of steering wheel angle
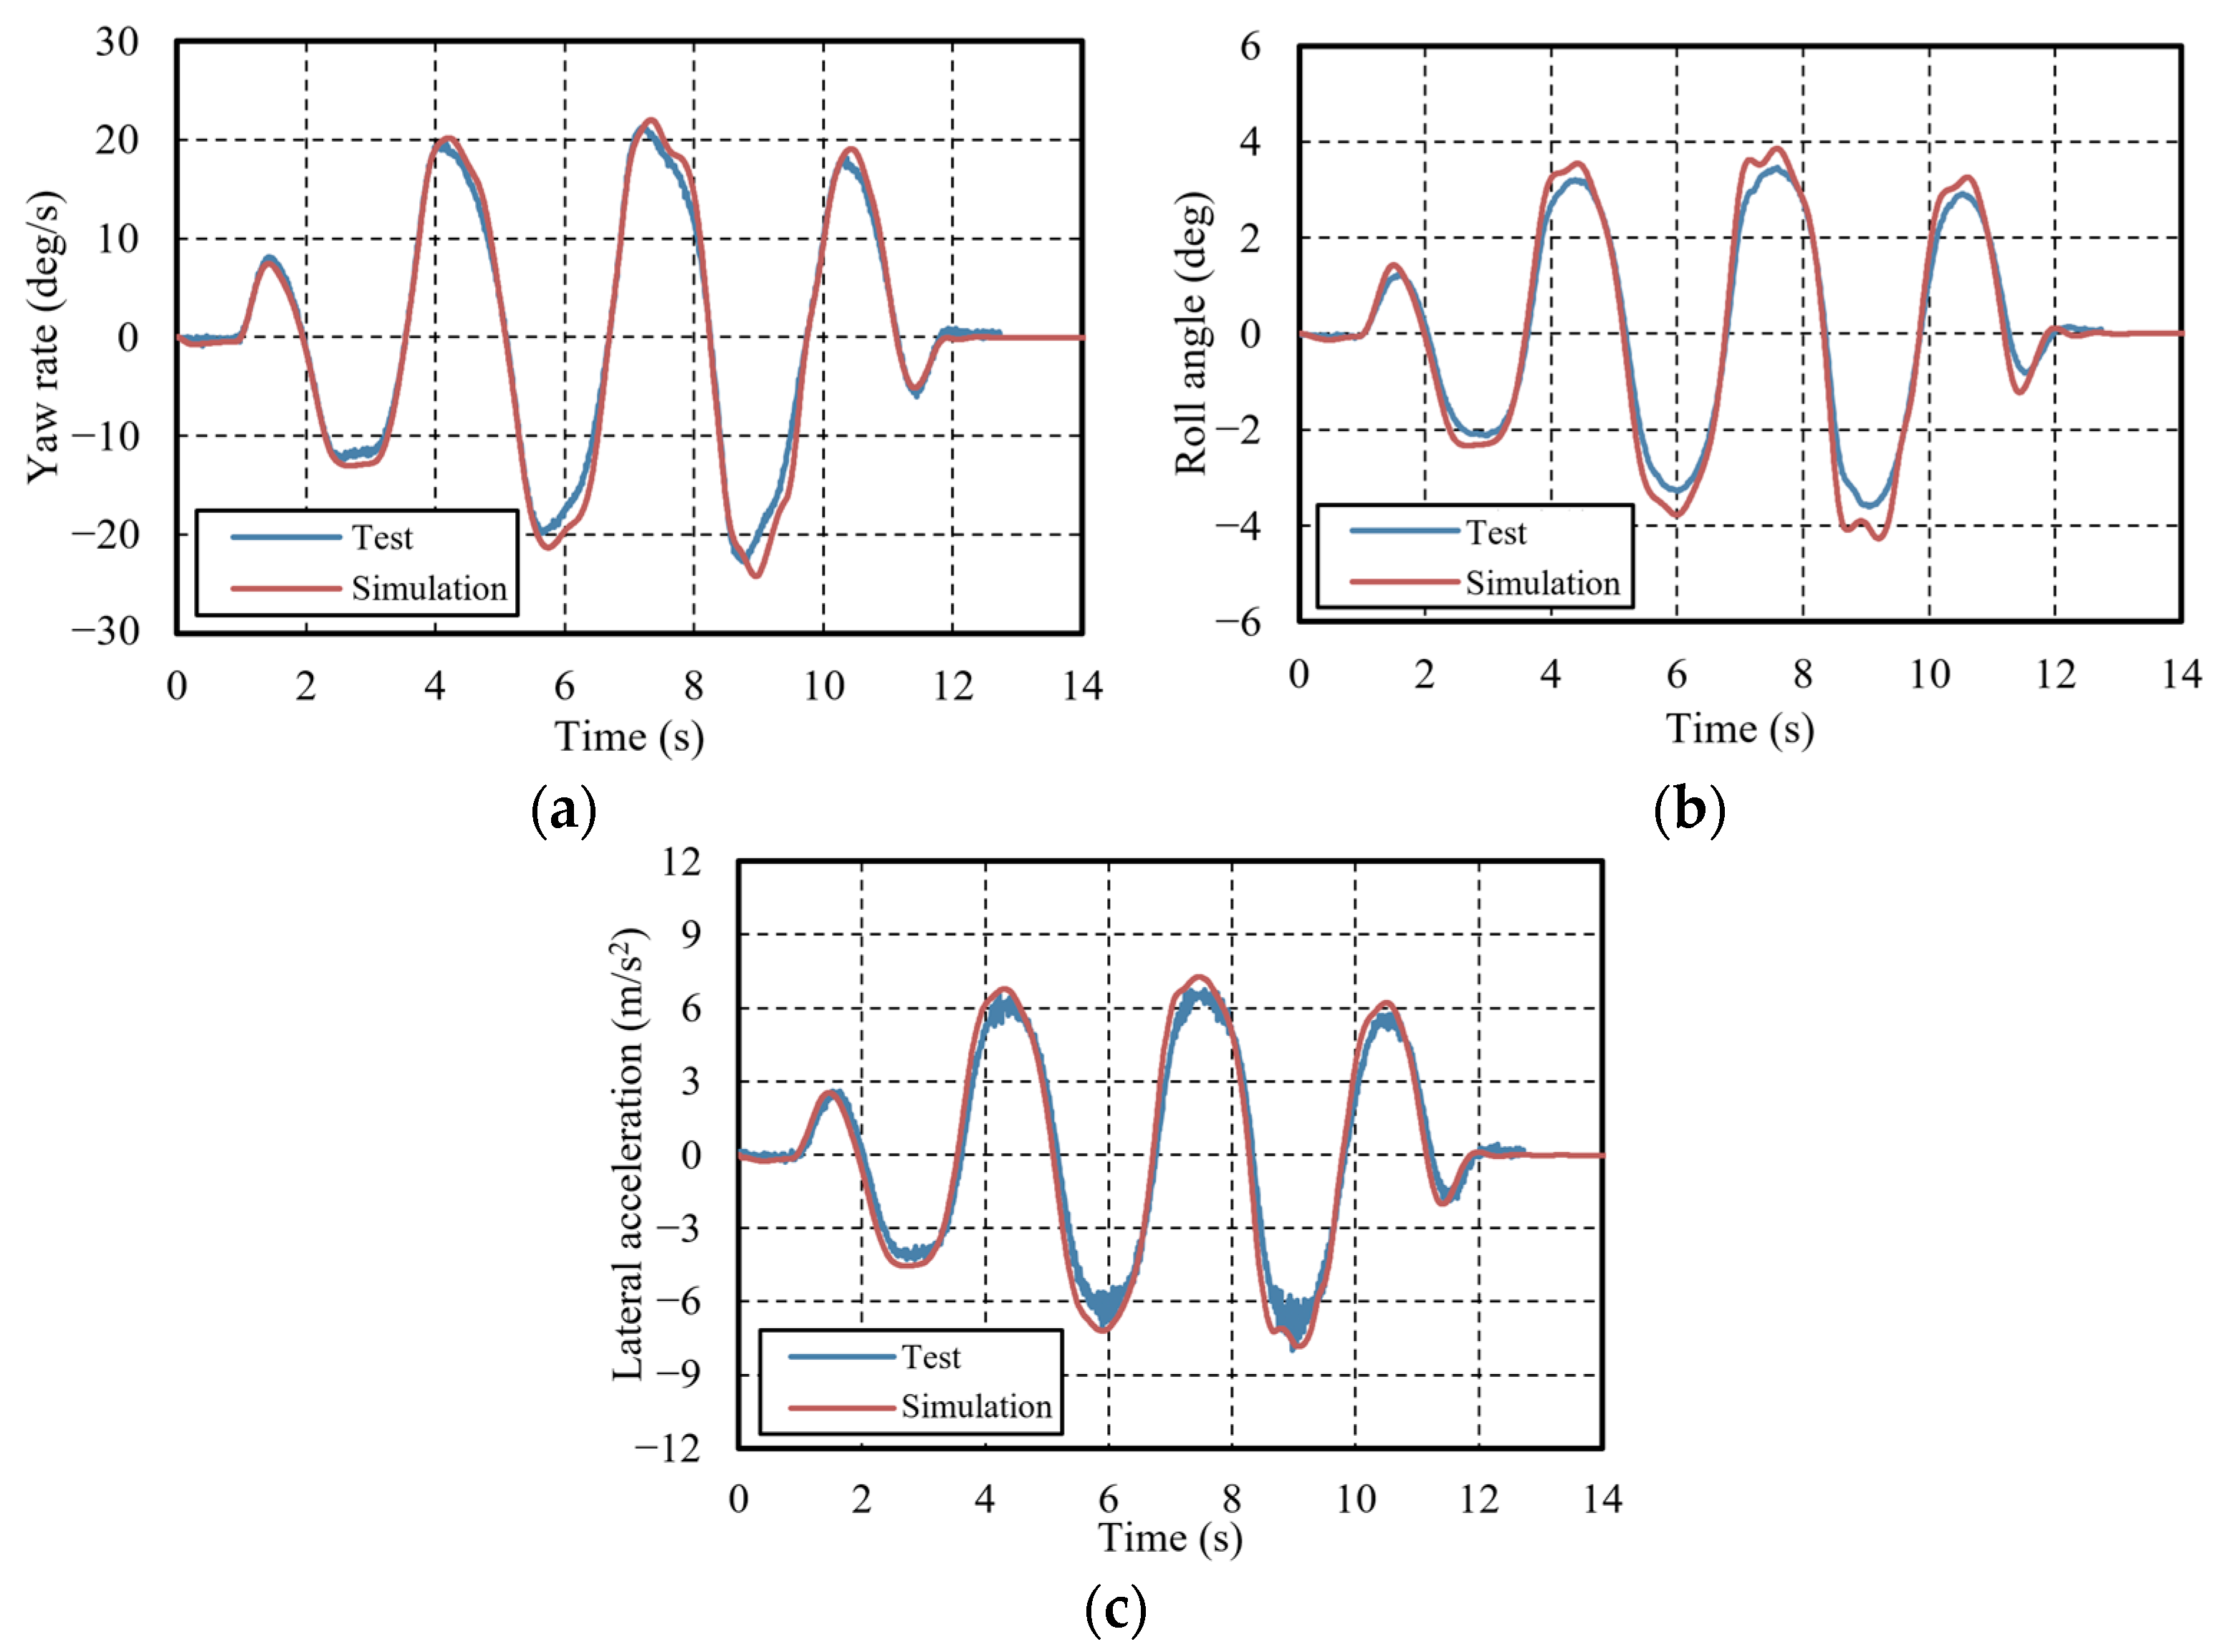
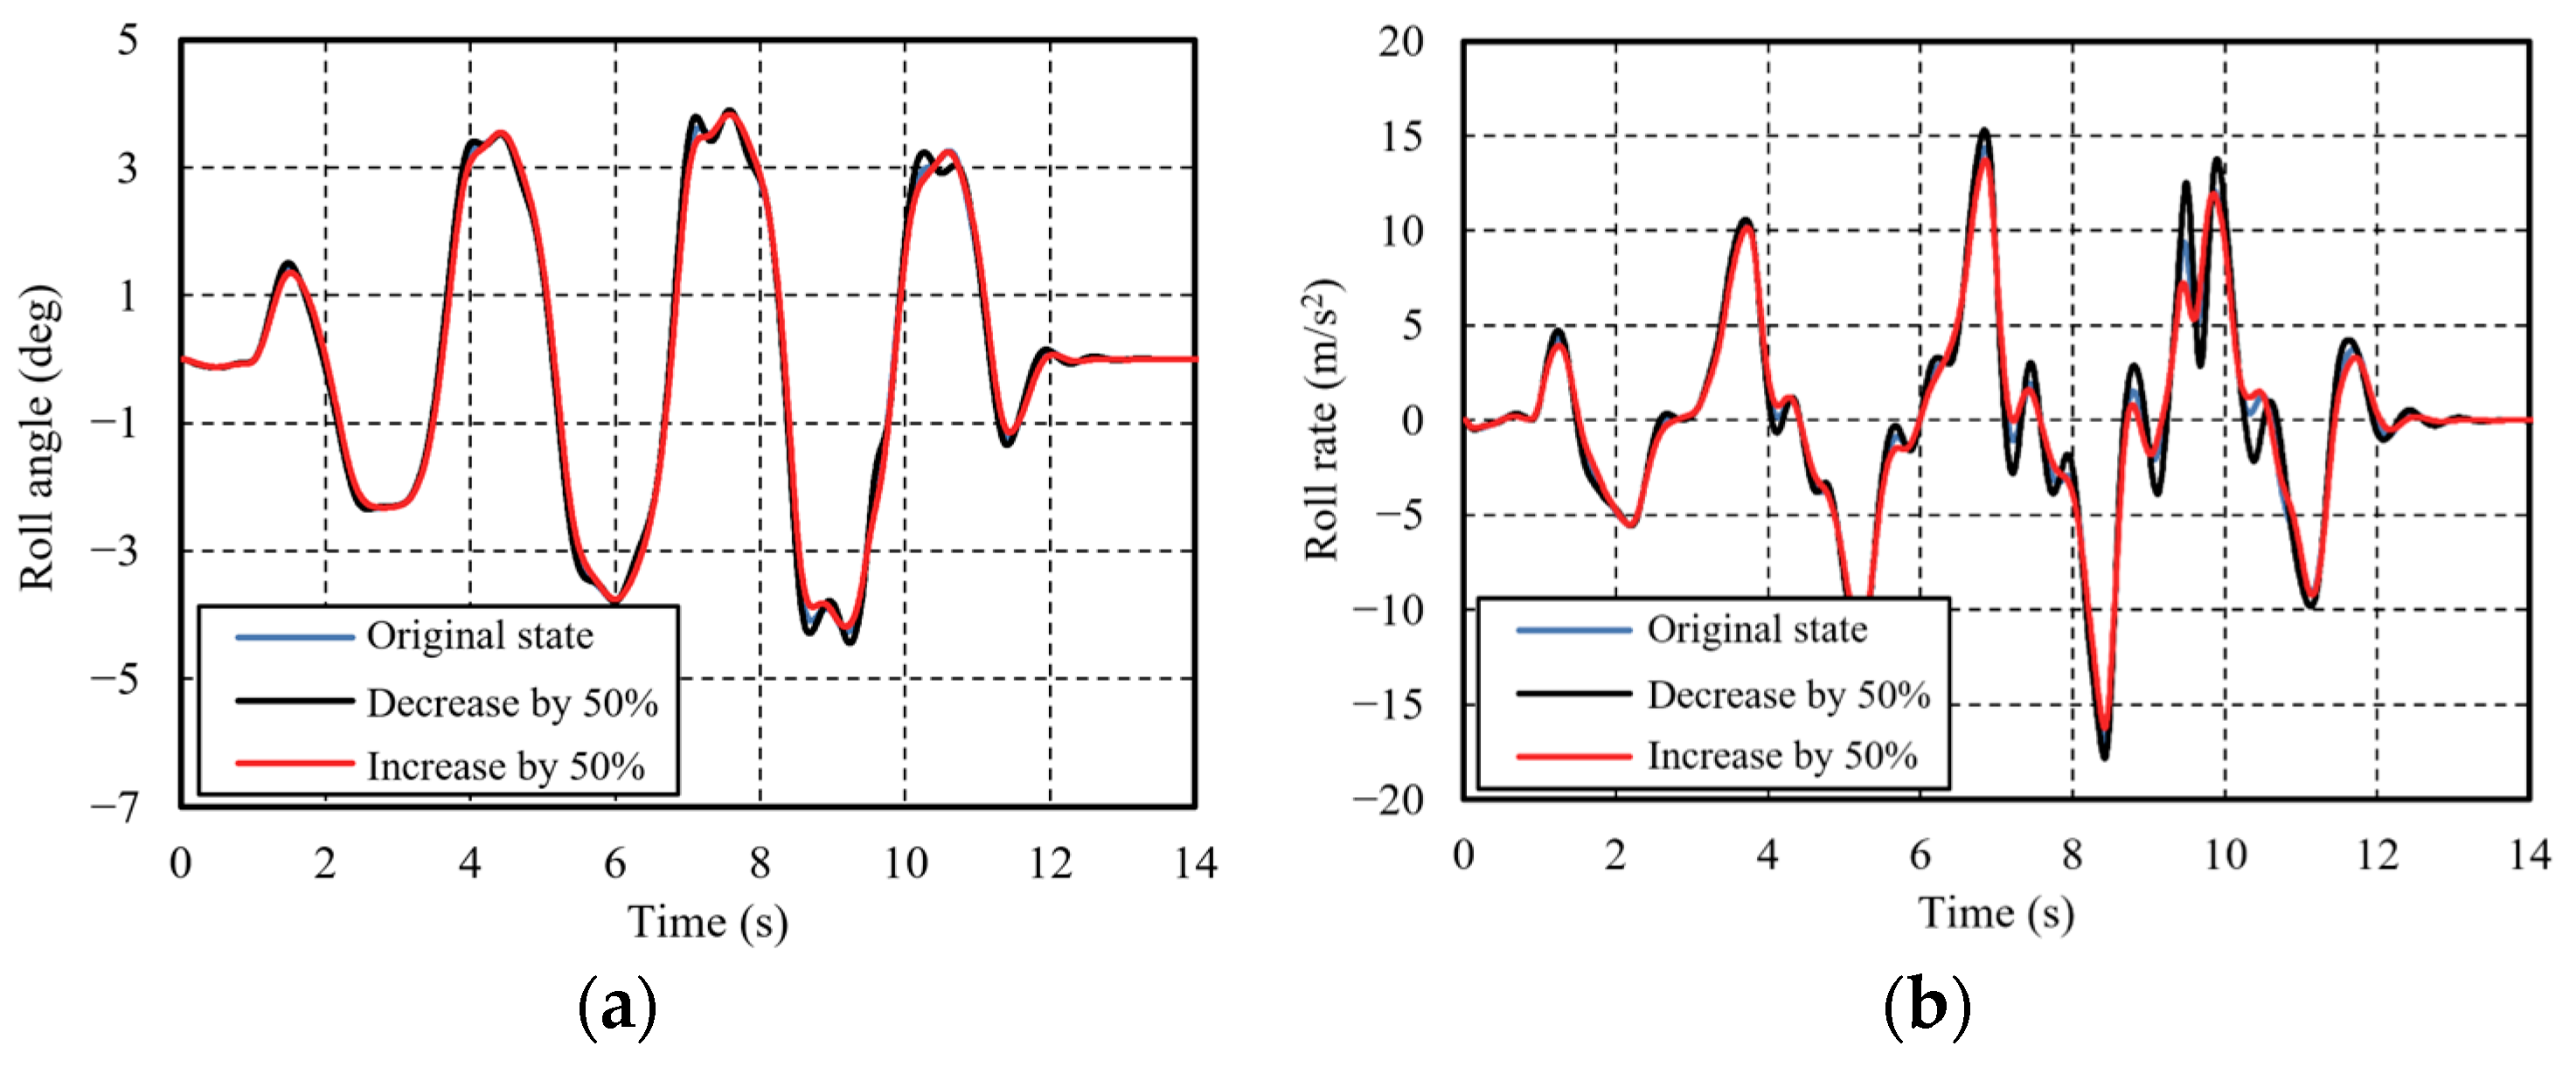
- Serpentine test
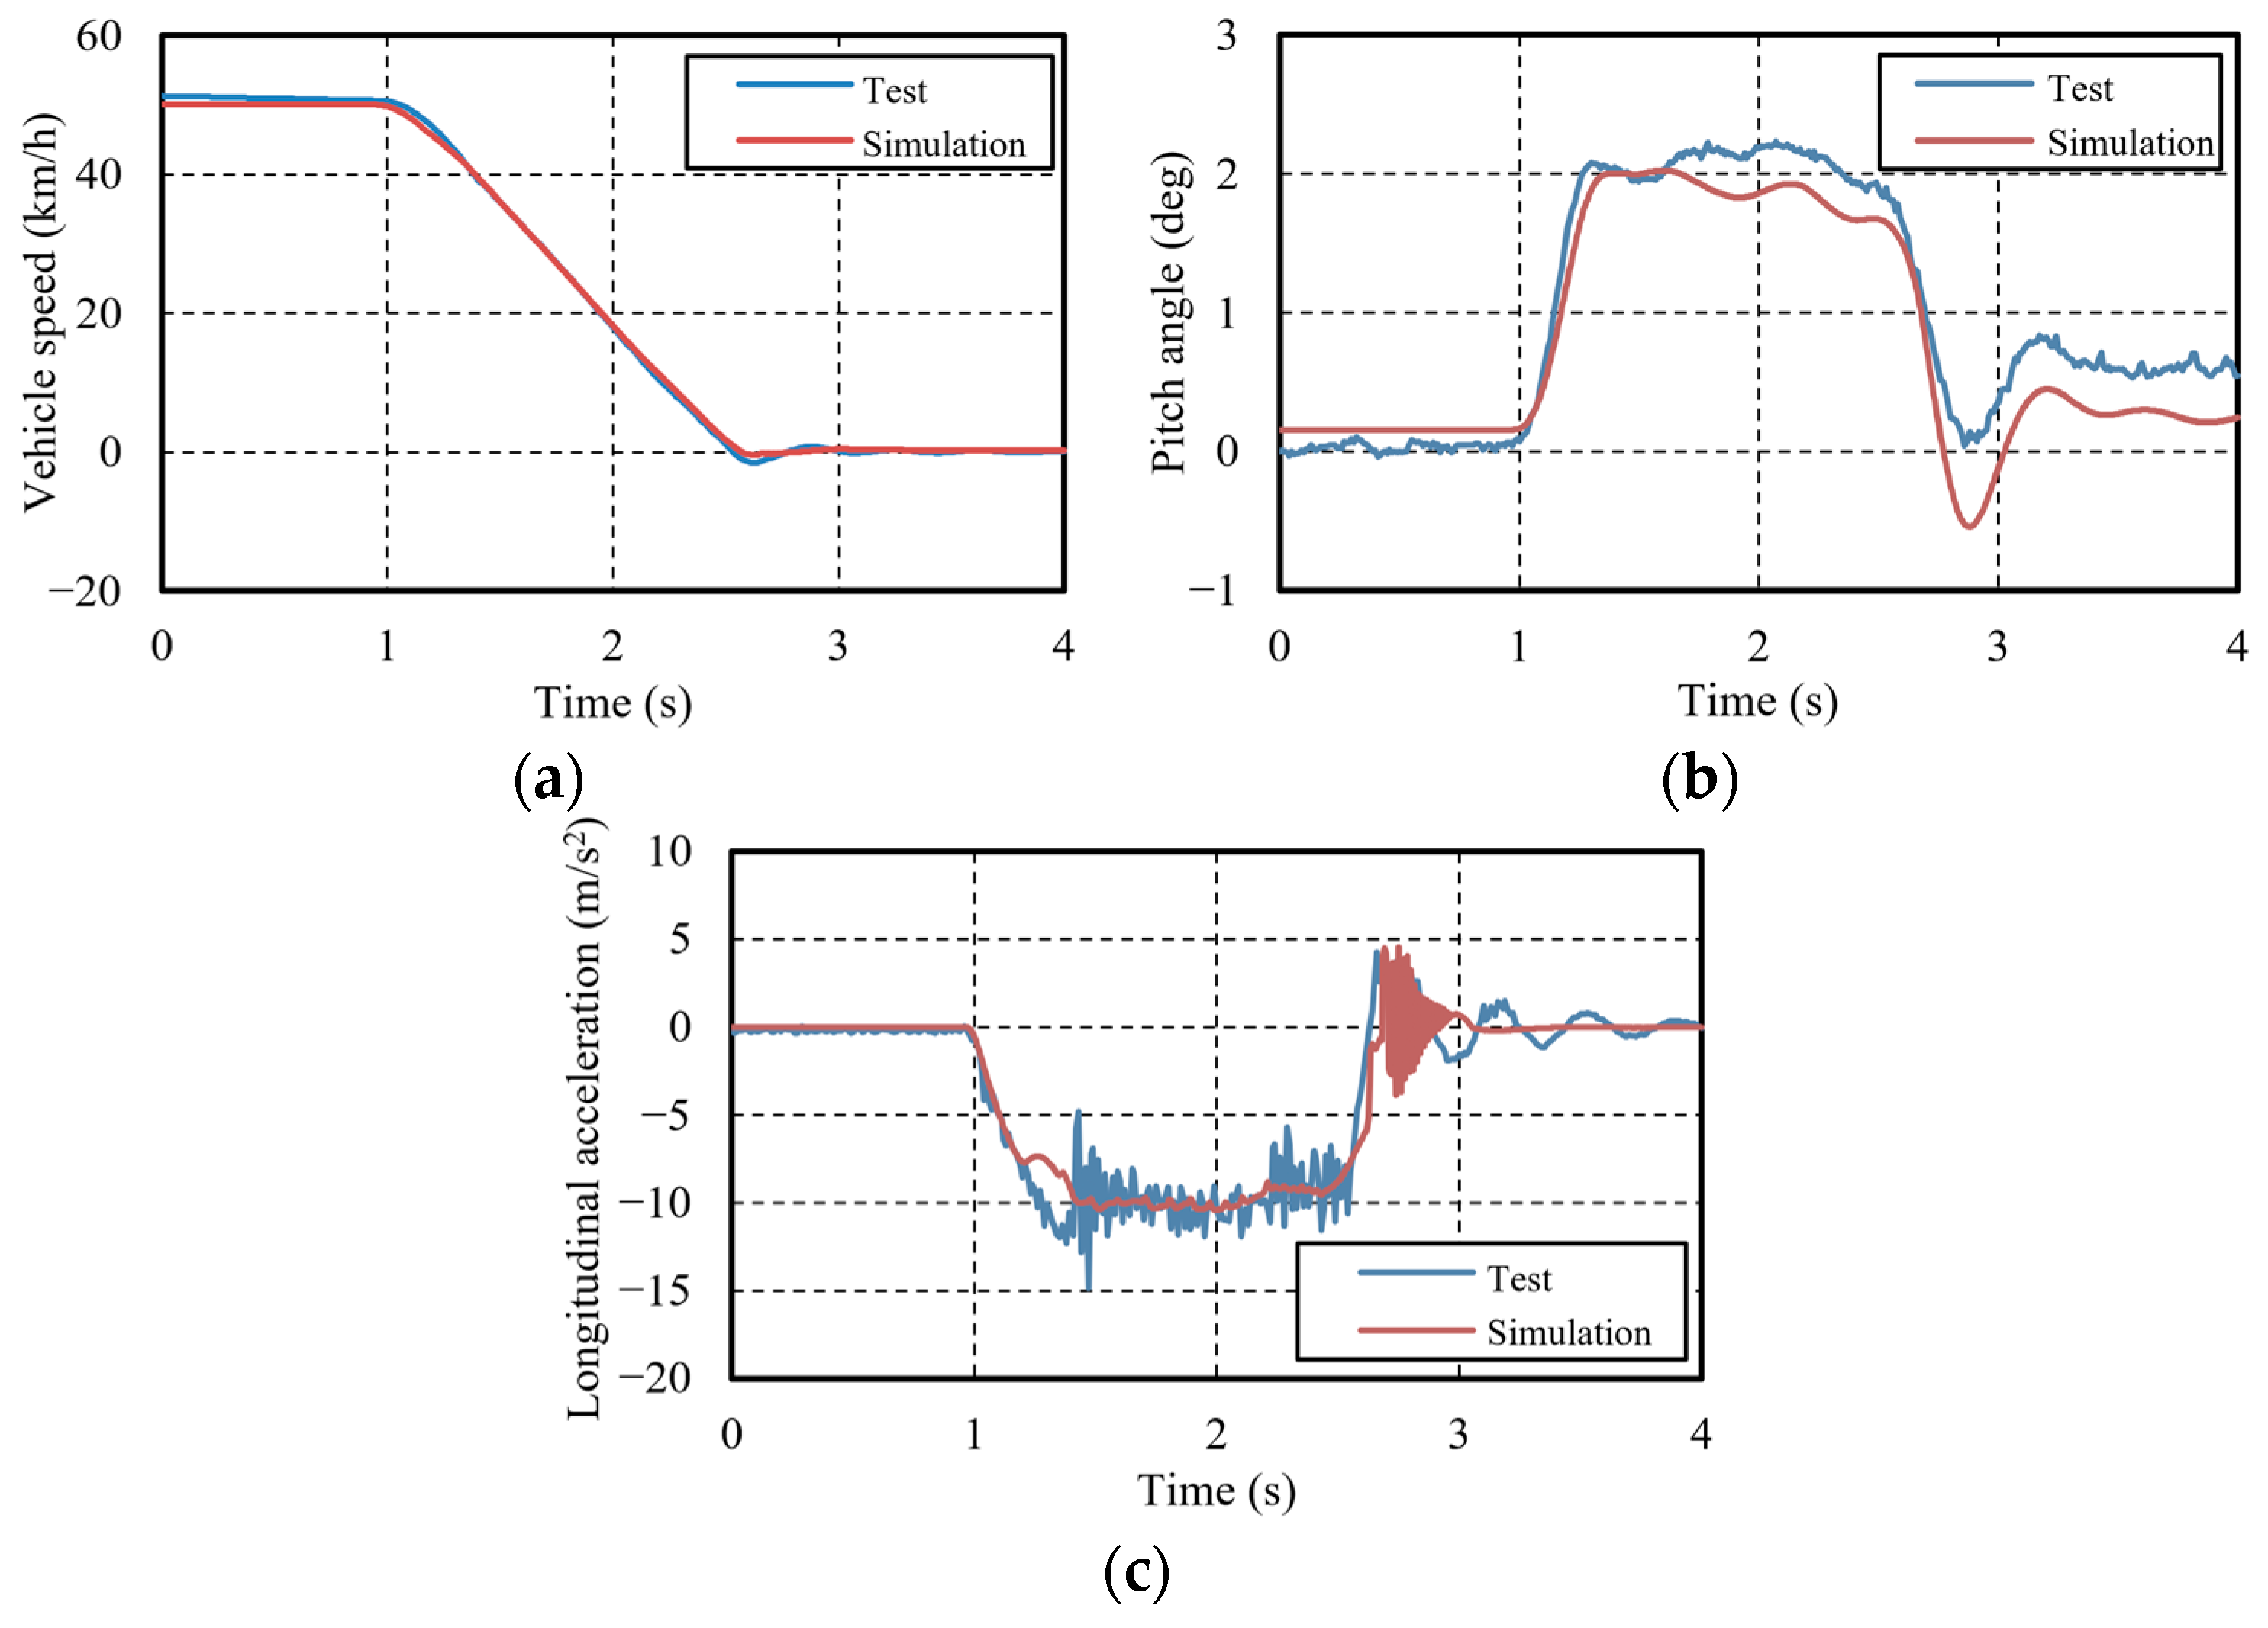
- Brake test
3. Development of Hybrid Control Strategy for Ride Comfort and Handling Stability
3.1. Vehicle Performance Influence Regularity Analysis
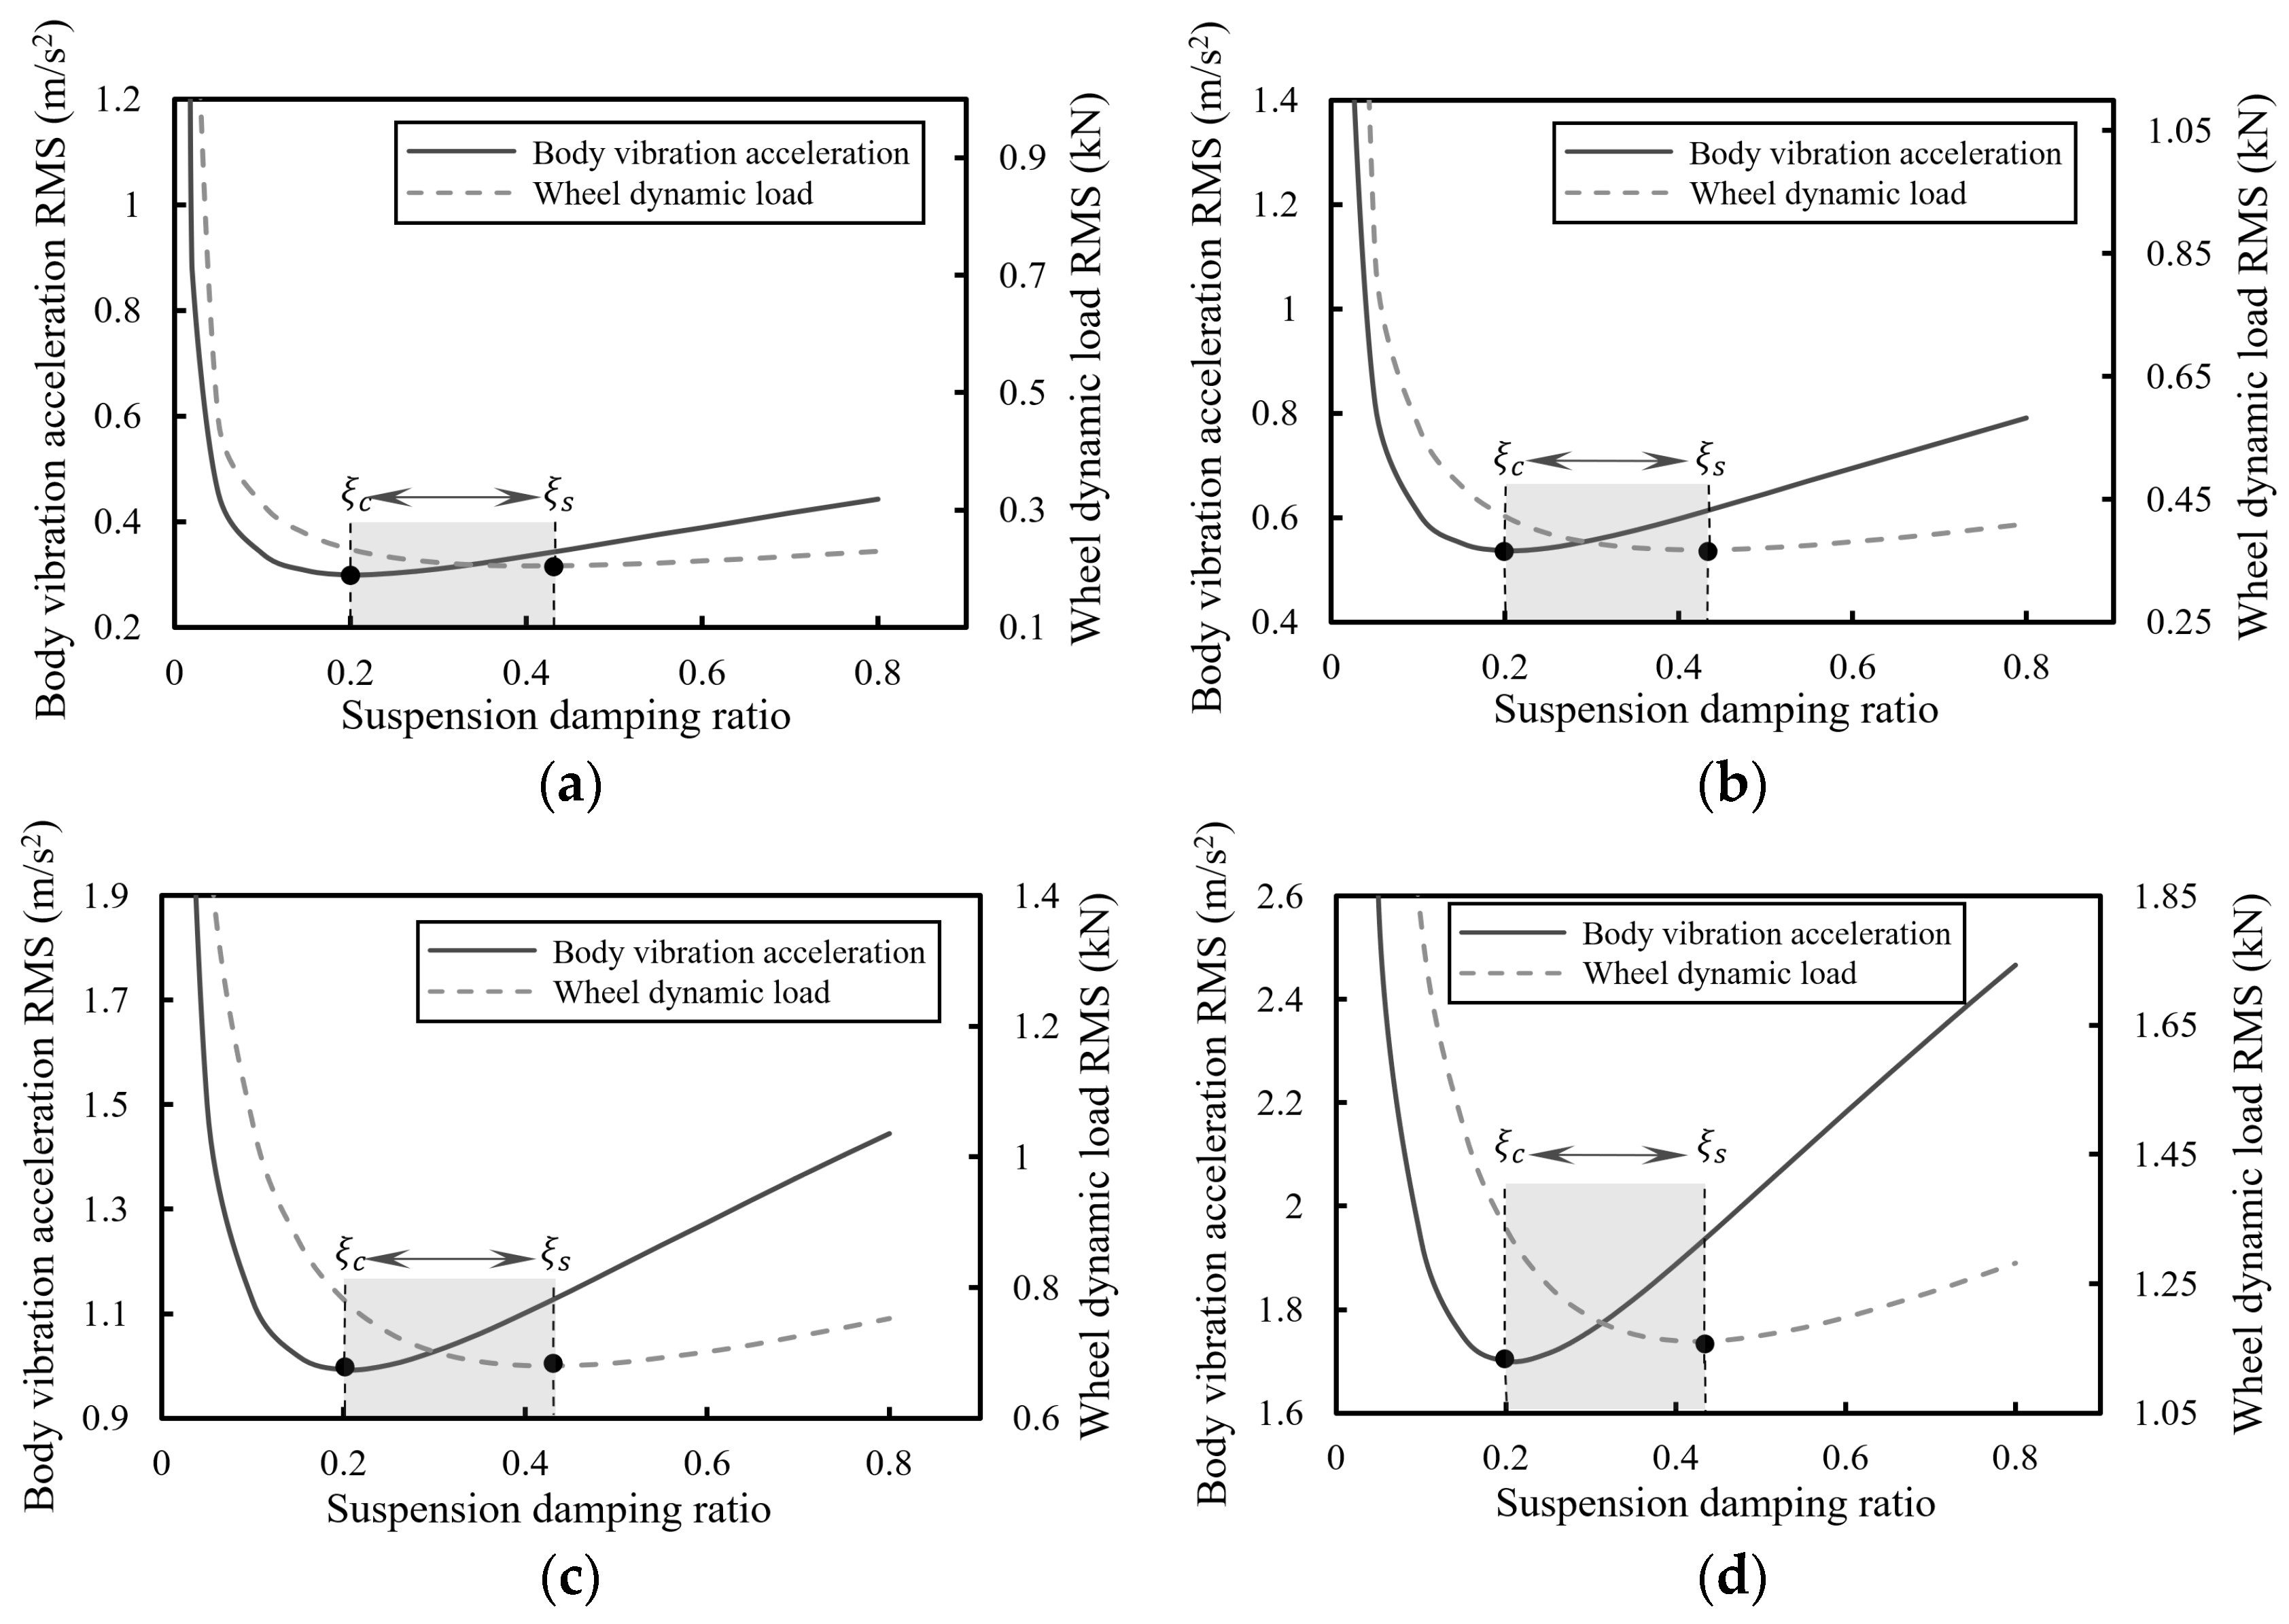
3.1.1. Ride Comfort Influence Regularity
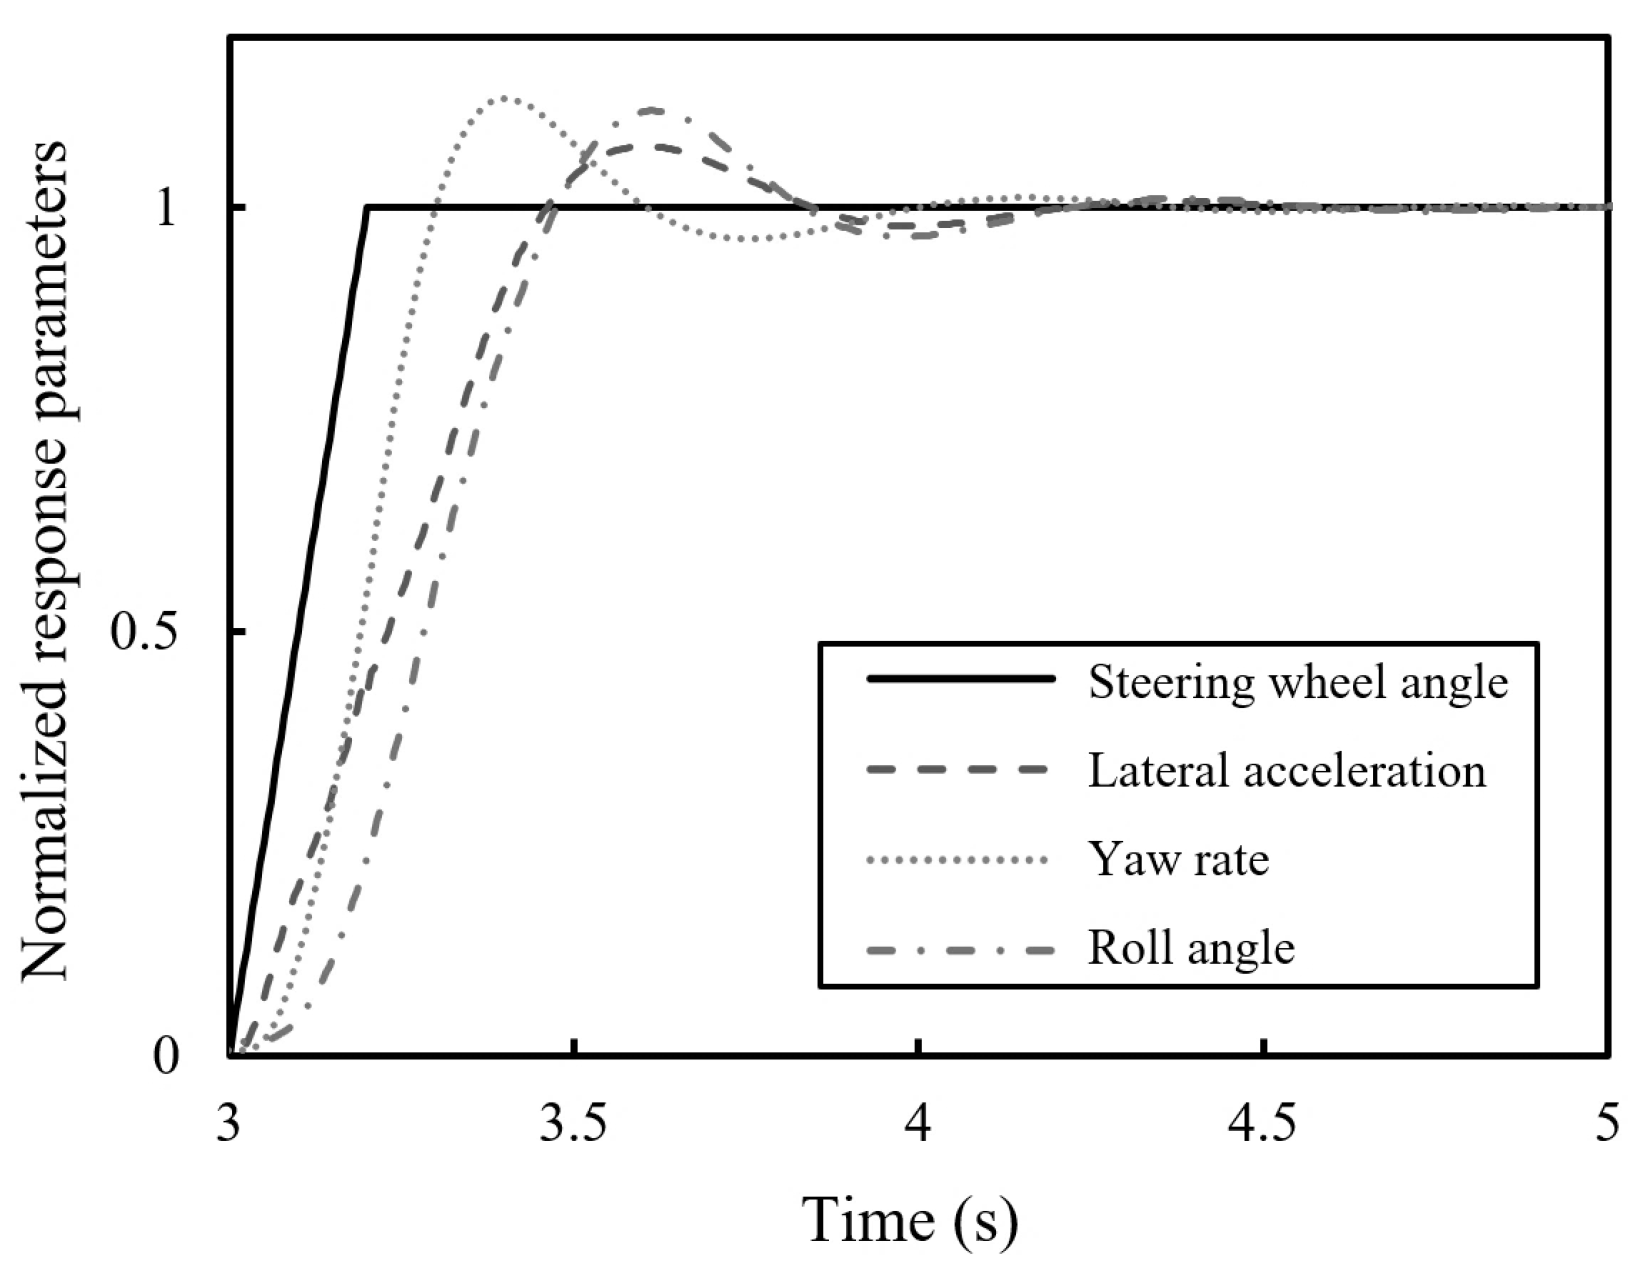
3.1.2. Handling Stability Influence Regularity
3.2. Hybrid Control Strategy Development
3.2.1. Ride Comfort Control Strategy
3.2.2. Handling Stability Control Strategy
3.2.3. Hybrid Control Strategy
4. Test Validation of Proposed Control Strategy
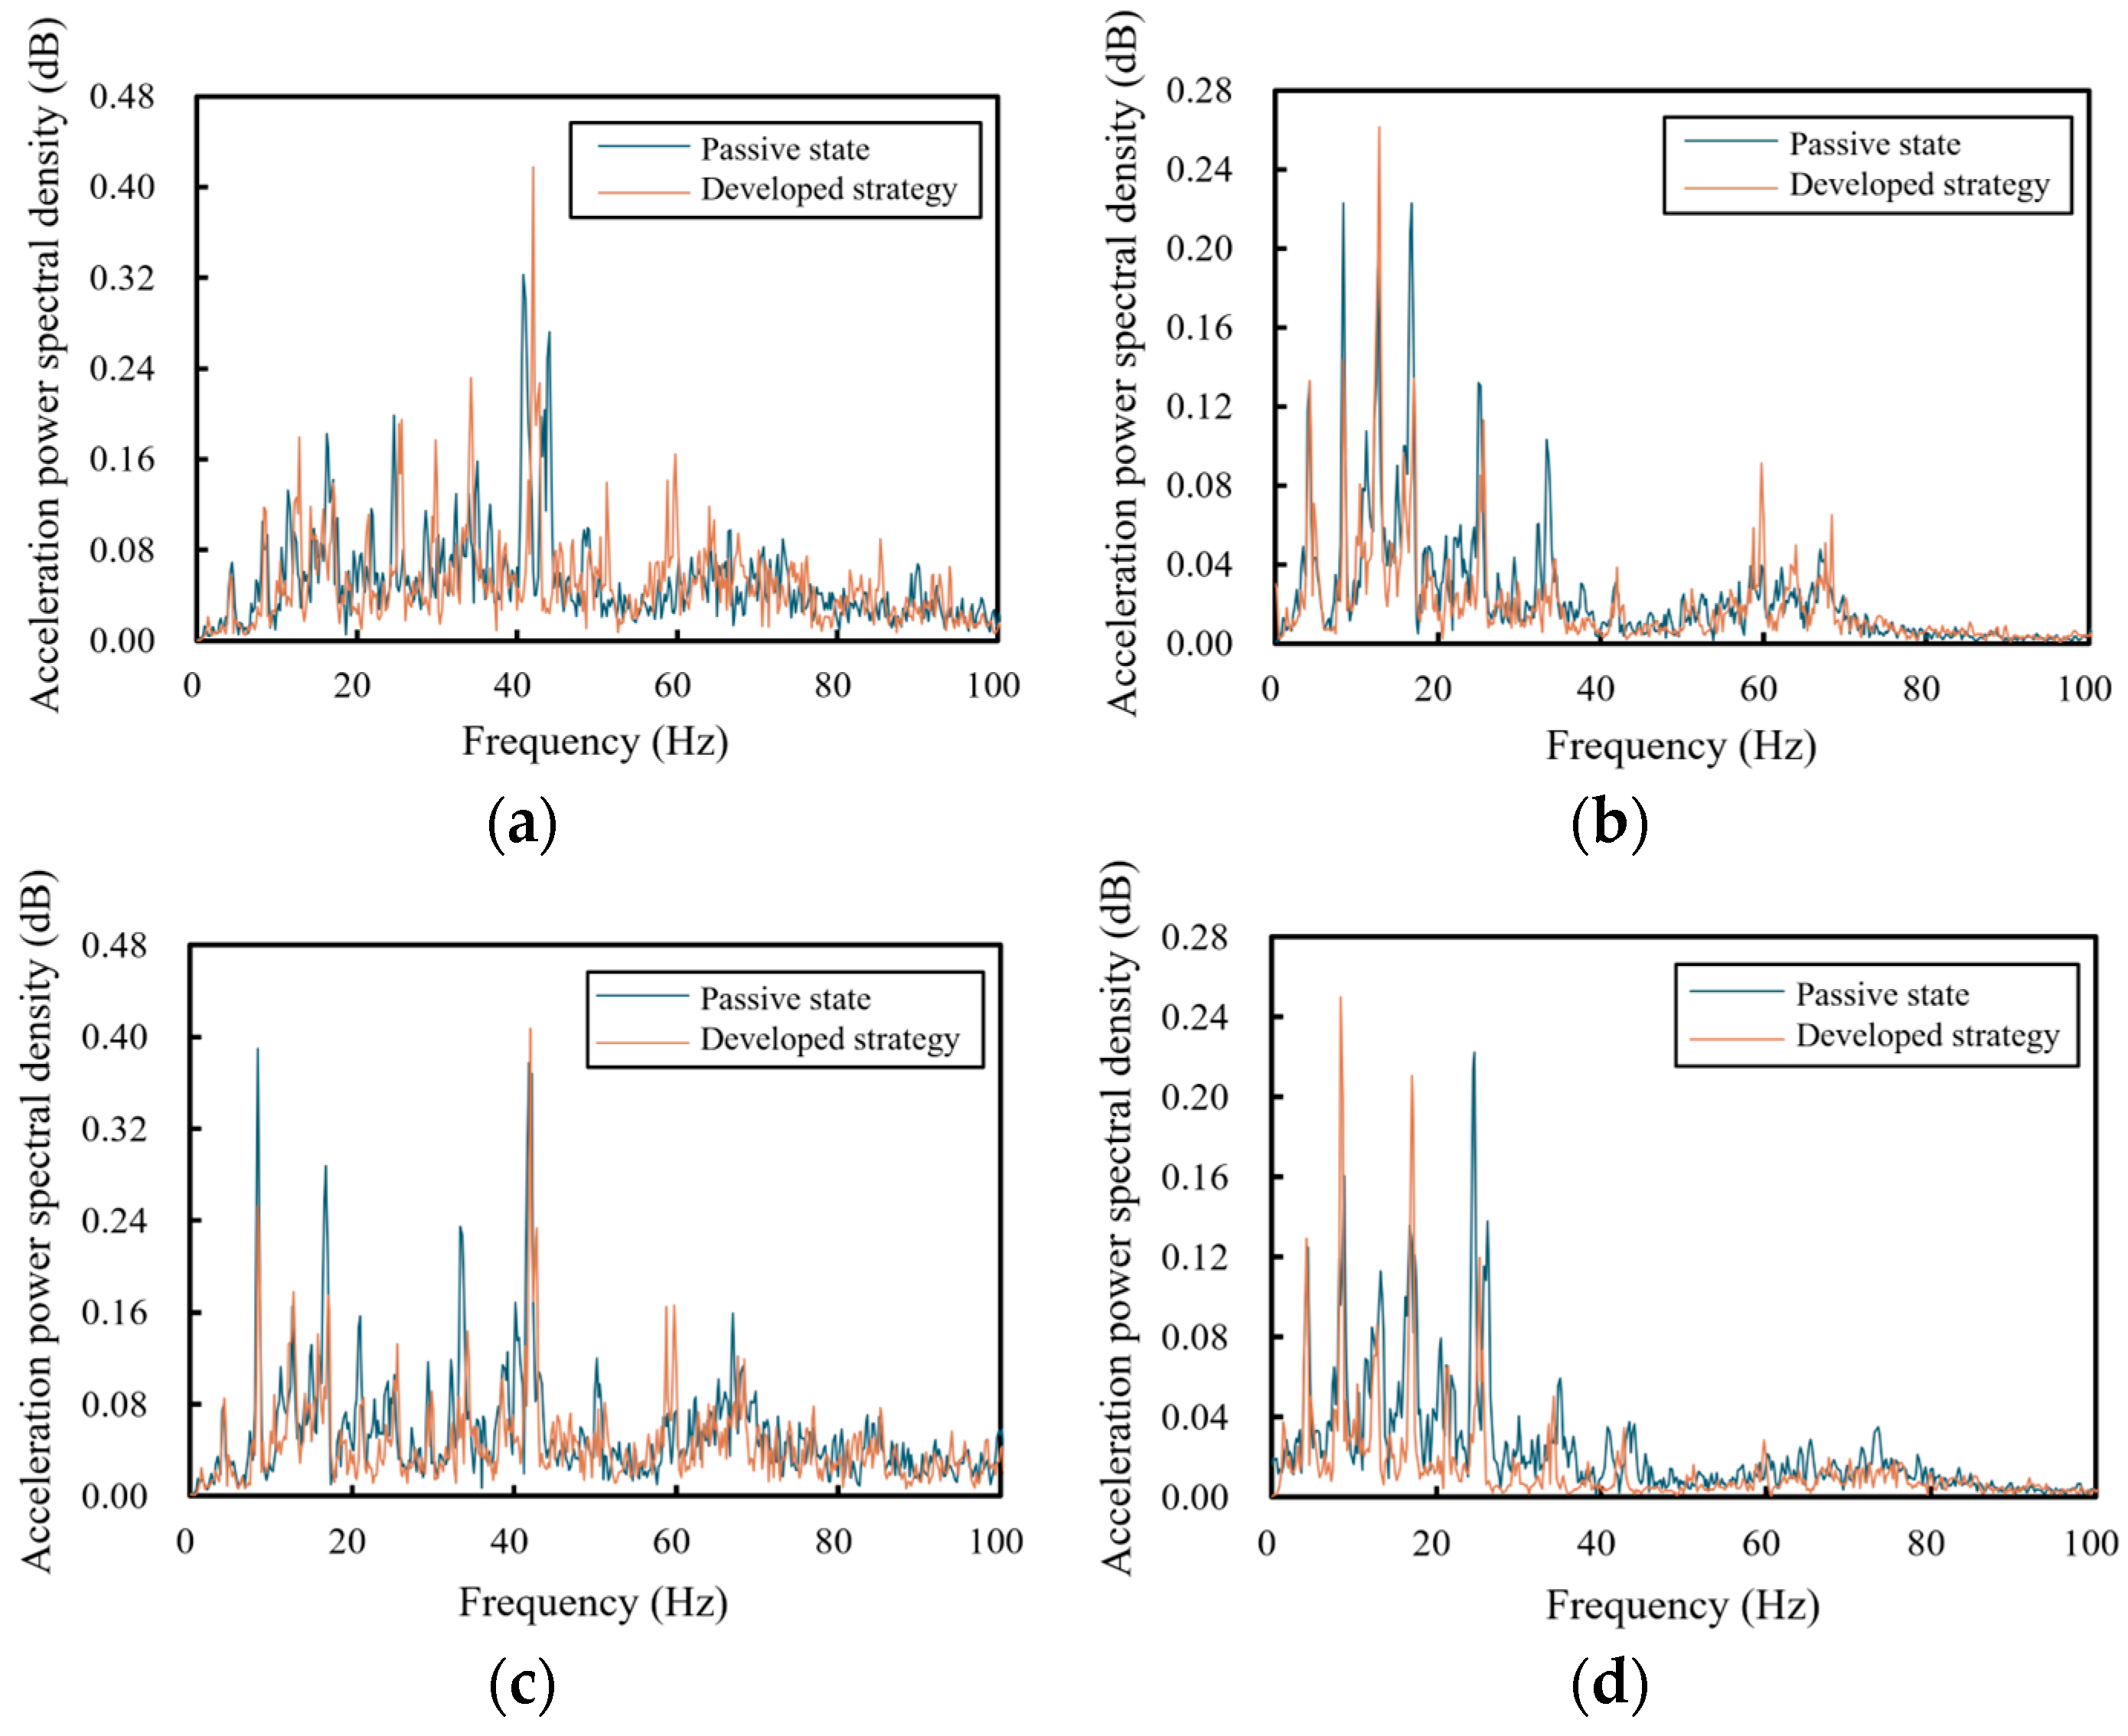
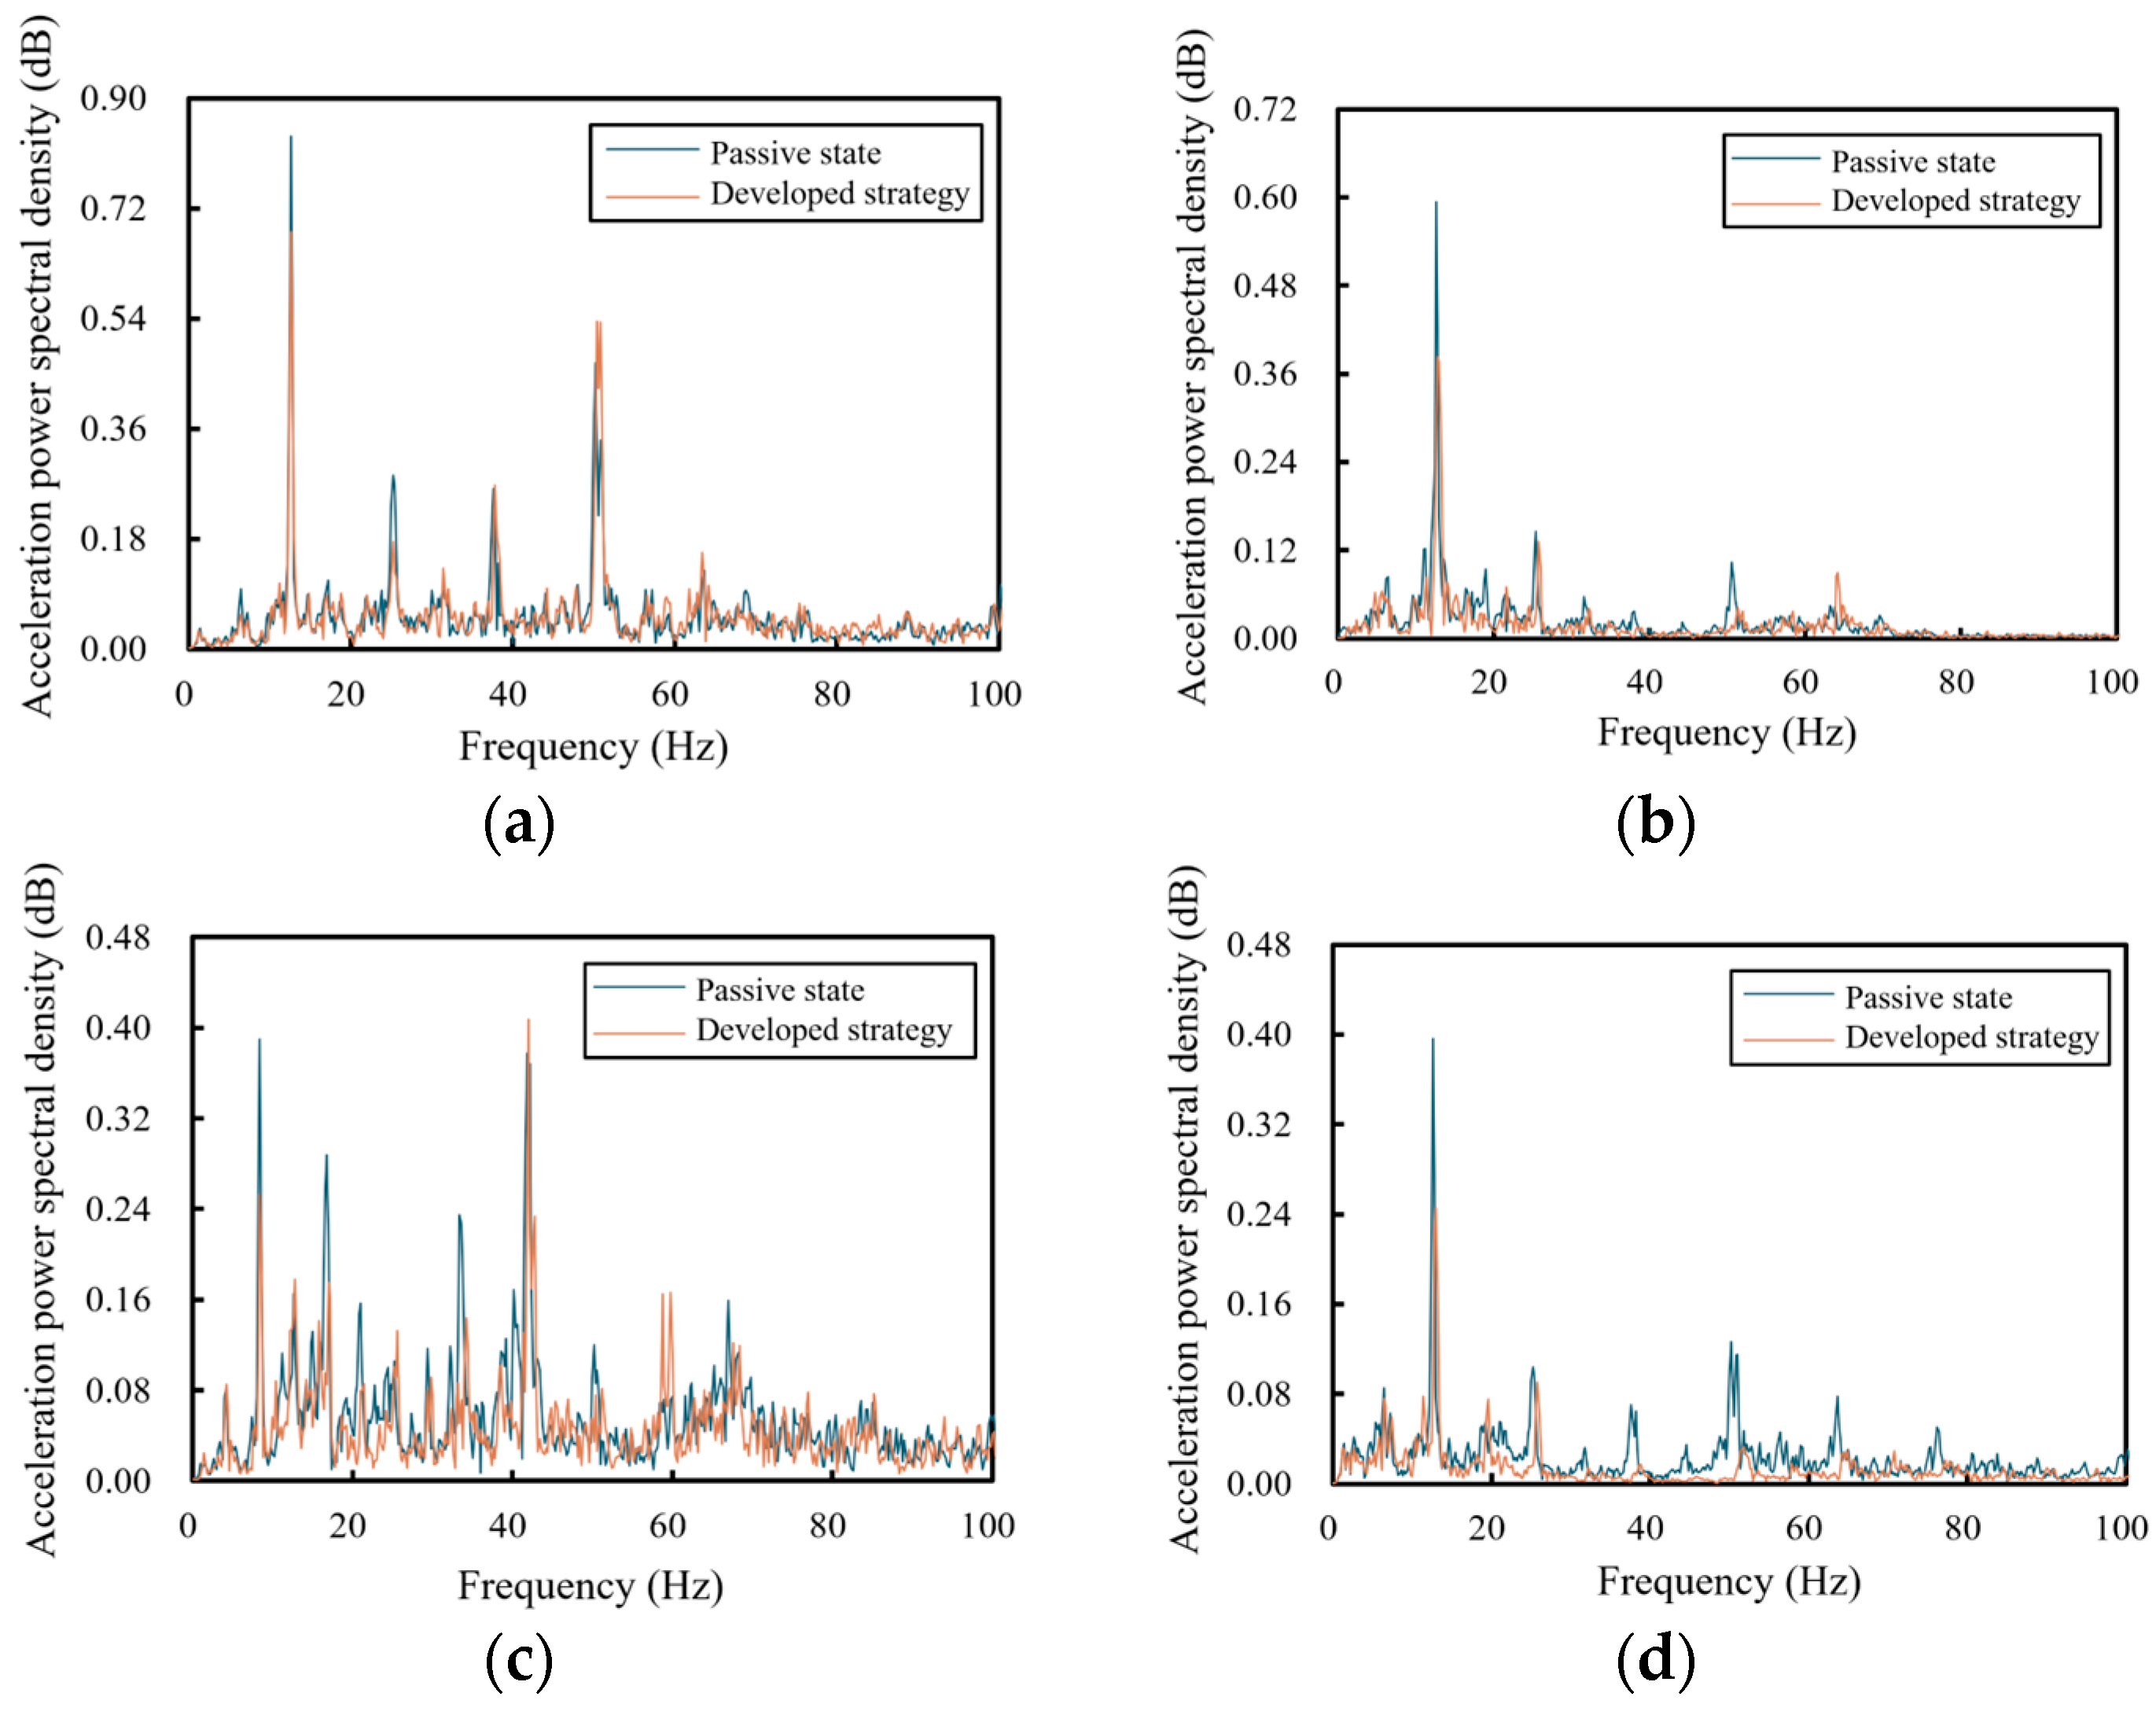
4.1. Ride Comfort Performance Validation
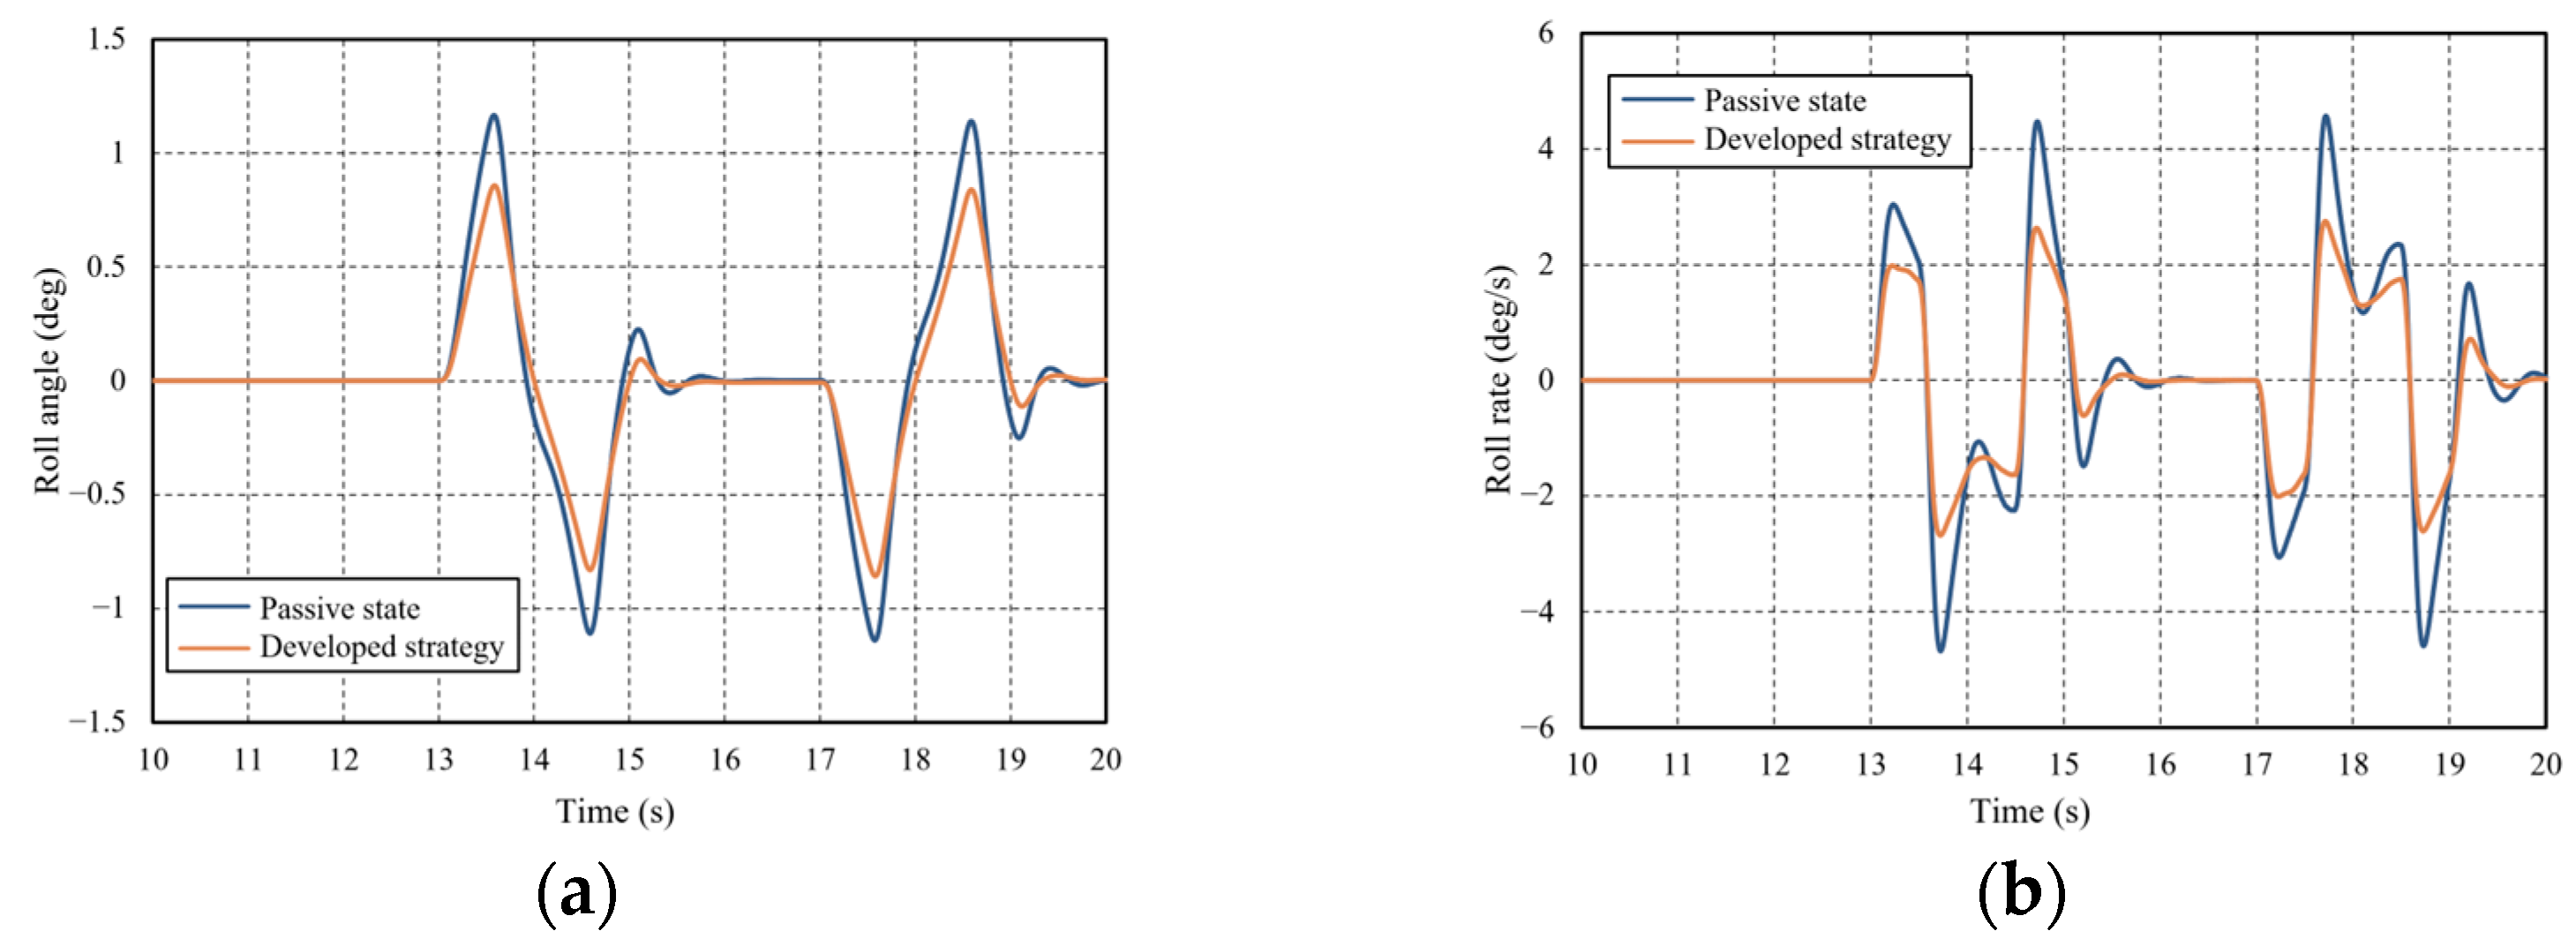
4.2. Handling Stability Performance Validation
5. Conclusions
Author Contributions
Funding
Data Availability Statement
Conflicts of Interest
References
- Rivera, S.; Kouro, S.; Vazquez, S.; Goetz, S.; Lizana, R.; Romero-Cadaval, E. Electric Vehicle Charging Infrastructure: From Grid to Battery. IEEE Ind. Electron. Mag. 2021, 15, 37–51. [Google Scholar] [CrossRef]
- Yang, M.; Dai, P.; Yin, Y.; Wang, D.; Wang, Y.; Huang, H. Predicting and Optimizing Pure Electric Vehicle Road Noise via a Locality-Sensitive Hashing Transformer and Interval Analysis. ISA Trans. 2025, 157, 556–572. [Google Scholar] [CrossRef]
- Huang, H.; Wang, Y.; Wu, J.; Ding, W.; Pang, J. Prediction and Optimization of Pure Electric Vehicle Tire/Road Structure-Borne Noise Based on Knowledge Graph and Multi-Task ResNet. Expert Syst. Appl. 2024, 255, 124536. [Google Scholar] [CrossRef]
- Huang, H.; Li, R.; Yang, M.; Lim, T.; Ding, W. Evaluation of vehicle interior sound quality using a continuous restricted Boltzmann machine-based DBN. Mech. Syst. Signal Process. 2017, 84, 245–267. [Google Scholar] [CrossRef]
- Zhou, S.; Walker, P.; Tian, Y.; Nguyen, C.T.; Zhang, N. Comparison on Energy Economy and Vibration Characteristics of Electric and Hydraulic in-Wheel Drive Vehicles. Energies 2021, 14, 2290. [Google Scholar] [CrossRef]
- Medina, H.; Carpenter, N. Transverse Third-Damper to Improve Suspension Systems for In-Wheel Motor Driven Electric Vehicles. J. Dyn. Syst. Meas. Control 2023, 145, 031003. [Google Scholar] [CrossRef]
- Zhao, J.; Yin, Y.; Chen, J.; Zhao, W. Evaluation and Prediction of Vibration Comfort in Engineering Machinery Cabs Using Random Forest with Genetic Algorithm. SAE Int. J. Veh. Dyn. Stab. NVH 2024, 8, 491–512. [Google Scholar] [CrossRef]
- Zhu, H.; Zhao, J.; Wang, Y.; Ding, W.; Pang, J.; Huang, H. Improving of Pure Electric Vehicle Sound and Vibration Comfort Using a Multi-Task Learning with Task-Dependent Weighting Method. Measurement 2024, 233, 114752. [Google Scholar] [CrossRef]
- Samaroo, K.; Awan, A.W.; Marimuthu, S.; Iqbal, M.N.; Daniel, K.; Shabbir, N. Performance Investigation of Active, Semi-Active and Passive Suspension Using Quarter Car Model. Algorithms 2025, 18, 100. [Google Scholar] [CrossRef]
- Feng, J.; Liang, J.; Lu, Y. An Integrated Control Framework for Torque Vectoring and Active Suspension System. Chin. J. Mech. Eng. 2024, 37, 10. [Google Scholar] [CrossRef]
- Yan, S.; Sun, W.; Gao, H. Vibration Suppression for Motor-Driven Uncertain Active Suspensions with Hard Constraints and Analysis of Energy Consumption. IEEE Trans. Syst. Man Cybern. Syst. 2022, 52, 618–630. [Google Scholar] [CrossRef]
- Savaia, G.; Sohn, Y.; Formentin, S.; Panzani, G.; Corno, M.; Savaresi, S.M. Experimental Automatic Calibration of a Semi-Active Suspension Controller via Bayesian Optimization. Control Eng. Pract. 2021, 112, 104826. [Google Scholar] [CrossRef]
- Chen, X.; Wang, Z.; Shi, H.; Jiang, N.; Zhao, S.; Qiu, Y.; Liu, Q. Review of Agricultural Machinery Seat Semi-Active Suspension Systems for Ride Comfort. Machines 2025, 13, 246. [Google Scholar] [CrossRef]
- Alexandru, C. A Method for Finding the Static Equilibrium of the Non-Steered Wheel Suspension Systems Used in Passenger Cars. Appl. Sci. 2022, 12, 7122. [Google Scholar] [CrossRef]
- Lee, G.; Hyun, M.; Kang, D. High-Efficiency Active Suspension Based on Continuous Damping Control. Int. J. Automot. Technol. 2022, 23, 31–40. [Google Scholar] [CrossRef]
- Kaldas, M.; Rivas, J.; Soliman, A. Initial Pitch Control for Semi-Active Suspension System. SAE Int. J. Veh. Dyn. Stab. NVH 2022, 6, 405–419. [Google Scholar] [CrossRef]
- Zhang, N.; Zhao, Q.; Huang, S. Optimal Sliding Mode Hierarchical Decoupled Control of Vehicle Semi-Active Suspension. Veh. Syst. Dyn. 2024, 1–31. [Google Scholar] [CrossRef]
- Han, K.; Hu, Y.; Zeng, D.; Yu, Y.; Xiao, L.; Yang, J.; Liu, W.; Gao, L. Vehicle Attitude Control of Magnetorheological Semi-Active Suspension Based on Multi-Objective Intelligent Optimization Algorithm. Actuators 2024, 13, 466. [Google Scholar] [CrossRef]
- Čorić, M.; Deur, J.; Kasać, J.; Tseng, H.E.; Hrovat, D. Optimisation of Active Suspension Control Inputs for Improved Vehicle Handling Performance. Veh. Syst. Dyn. 2016, 54, 1574–1600. [Google Scholar] [CrossRef]
- Lai, F.; Jiang, C.Y. Establishment and Simulation Analysis of 18 DOF Unified Dynamics Model of Automobile Chassis. Int. J. Control Autom. Syst. 2021, 19, 2323–2342. [Google Scholar] [CrossRef]
- Ataei, M.; Khajepour, A.; Jeon, S. Development of a Novel General Reconfigurable Vehicle Dynamics Model. Mech. Mach. Theory 2021, 156, 104147. [Google Scholar] [CrossRef]
- Kou, F.; Wang, R.; Hong, F.; Yang, H. Adaptive Backstepping Control of Semi-Active Suspension with Built-In Solenoid Valve. J. Vib. Shock 2022, 41, 1972–1992. [Google Scholar] [CrossRef]
- Tudón-Martínez, J.C.; Lozoya-Santos, J.J.; Morales-Menendez, R.; Ramirez-Mendoza, R.A. An Experimental Artificial-Neural-Network-Based Modeling of Magneto-Rheological Fluid Dampers. Smart Mater. Struct. 2012, 21, 085007. [Google Scholar] [CrossRef]
- Chen, J.; Yu, C.; Wang, Y.; Zhou, Z.; Liu, Z. Hybrid Modeling for Vehicle Lateral Dynamics via AGRU with a Dual-Attention Mechanism Under Limited Data. Control Eng. Pract. 2024, 151, 106015. [Google Scholar] [CrossRef]
- Lee, G.H.; Kim, D.-H.; Pak, J.M.; Ahn, C.K. Vehicle Sideslip Angle Estimation Using Finite Memory Estimation and Dynamics/Kinematics Model Fusion Based on Neural Networks. IEEE Trans. Intell. Transp. Syst. 2025, 26, 2157–2168. [Google Scholar] [CrossRef]
- Wen, H.; Huang, H.; Zhang, W. Research of Time Lag Characteristics of Pilot-Operated Solenoid Valve Damper Based on Multi-Physics Field. Proc. Inst. Mech. Eng. Part D J. Automob. Eng. 2025, 239, 1660–1684. [Google Scholar] [CrossRef]
- Hemanth, K.; Kumar, H.; Gangadharan, K.V. Vertical Dynamic Analysis of a Quarter Car Suspension System with MR Damper. J. Braz. Soc. Mech. Sci. Eng. 2017, 39, 41–51. [Google Scholar] [CrossRef]
- Mata, G.T.; Kumar, H.; Mahalingam, A. Performance Analysis of a Semi-Active Suspension System Using Coupled CFD-FEA Based Non-Parametric Modeling of Low Capacity Shear Mode Monotube MR Damper. Proc. Inst. Mech. Eng. Part D J. Automob. Eng. 2018, 233, 1214–1231. [Google Scholar] [CrossRef]
- Yoon, D.-S.; Choi, S.-B. Adaptive Control for Suspension System of In-Wheel Motor Vehicle with Magnetorheological Damper. Machines 2024, 12, 433. [Google Scholar] [CrossRef]
- Zhang, H.; Qi, Y.; Si, W.; Zhang, C. An Improved Adaptive Sliding Mode Control Approach for Anti-Slip Regulation of Electric Vehicles Based on Optimal Slip Ratio. Machines 2024, 12, 769. [Google Scholar] [CrossRef]
- Zhang, K.; As’arry, A.; Zhu, L.; Hairuddin, A.A.; Hassan, M.K.; Zain, M.Z.M. Enhancing Ride Comfort of Semi-Active Suspension Through Collaboration Control Using Dung Beetle Optimizer Optimized Fuzzy PID Controller. Adv. Mech. Eng. 2025, 17, 1–14. [Google Scholar] [CrossRef]
- Li, G.; Huang, Q.; Ni, L.; Zhou, X.; Zhou, C.; Hu, G. Research on Compound Control Strategy of Vehicle Magnetorheological Semi-Active Suspension. Mod. Manuf. Eng. 2022, 8, 1–9. [Google Scholar] [CrossRef]
- Liang, J.; Lu, Y.; Pi, D.; Yin, G.; Zhuang, W.; Wang, F. A Decentralized Cooperative Control Framework for Active Steering and Active Suspension: Multi-Agent Approach. IEEE Trans. Transp. Electrif. 2022, 8, 1414–1429. [Google Scholar] [CrossRef]
- Kim, J.; Lee, T.; Kim, C.-J.; Yi, K. Model Predictive Control of a Semi-Active Suspension with a Shift Delay Compensation Using Preview Road Information. Control Eng. Pract. 2023, 137, 105584. [Google Scholar] [CrossRef]
- Piñón, A.; Favela-Contreras, A.; Félix-Herrán, L.C.; Beltran-Carbajal, F.; Lozoya, C. An ARX Model-Based Predictive Control of a Semi-Active Vehicle Suspension to Improve Passenger Comfort and Road-Holding. Actuators 2021, 10, 47. [Google Scholar] [CrossRef]
- Savaia, G.; Formentin, S.; Panzani, G.; Corno, M.; Savaresi, S.M. Enhancing Skyhook for Semi-Active Suspension Control via Machine Learning. IFAC J. Syst. Control 2021, 17, 100161. [Google Scholar] [CrossRef]
- Lee, D.; Jin, S.; Lee, C. Deep Reinforcement Learning of Semi-Active Suspension Controller for Vehicle Ride Comfort. IEEE Trans. Veh. Technol. 2023, 72, 327–339. [Google Scholar] [CrossRef]
- Qin, Y.; Dong, M.; Zhao, F.; Gu, L. Suspension Semi-Active Control of Vehicles Based on Road Profile Classification. J. Northeast. Univ. (Nat. Sci.) 2016, 37, 1138–1143. [Google Scholar]
- Michelberger, P.; Palkovics, L.; Bokor, J. Robust Design of Active Suspension System. Int. J. Veh. Des. 1993, 14, 145–165. [Google Scholar] [CrossRef]
- Wu, Z.C.; Chen, S.Z.; Yang, L.; Zhang, B. Model of Road Roughness in Time Domain Based on Rational Function. Trans. Beijing Inst. Technol. 2009, 29, 795–798. [Google Scholar]
- Ren, H.; Chen, S.; Zhao, Y.; Liu, G.; Yang, L. State observer-based sliding mode control for semi-active hydro-pneumatic suspension. Veh. Syst. Dyn. 2016, 54, 168–190. [Google Scholar] [CrossRef]
- Shi, P.; Zhao, Q.; Wang, K.; Zhang, R.; Xiao, P. Simulation and Verification Analysis of the Ride Comfort of an In-Wheel Motor-Driven Electric Vehicle Based on a Combination of ADAMS and MATLAB. Int. J. Model. Simul. Sci. Comput. 2022, 13, 2250002. [Google Scholar] [CrossRef]
- Niu, Z.; Xin, S.; Liu, F. Design Method of Rack-and-Pinion Pair with Pure Rolling Variable Transmission Ratio. Proc. Inst. Mech. Eng. Part C J. Mech. Eng. Sci. 2024, 238, 7354–7372. [Google Scholar] [CrossRef]
- Yun, S.; Lee, J.; Jang, W.; Kim, D.; Choi, M.; Chung, J. Dynamic Modeling and Analysis of a Driving Passenger Vehicle. Appl. Sci. 2023, 13, 5903. [Google Scholar] [CrossRef]
- Hu, T.; Jiang, L.; Pan, L.; Chen, B.; Gong, N.; Yang, J.; Gong, X.; Sun, S. Development of a Semi-Active Suspension Using a Compact Magnetorheological Damper with Negative-Stiffness Components. Mech. Syst. Signal Process. 2025, 223, 111842. [Google Scholar] [CrossRef]
- GB/T 6323-2014; Controllability and stability test procedure for automotive. Standardization Administration of the People’s Republic of China: Beijing, China, 2014.
- Xu, X.; Su, P.; Wang, F. Coordinated Control of Dual-Motor Using the Interval Type-2 Fuzzy Logic in Autonomous Steering System of AGV. Int. J. Fuzzy Syst. 2021, 23, 1070–1086. [Google Scholar] [CrossRef]
- An, Y.; Wang, L.; Deng, X.; Chen, H.; Lu, Z.; Wang, T. Research on Differential Steering Dynamics Control of Four-Wheel Independent Drive Electric Tractor. Agriculture 2023, 13, 1758. [Google Scholar] [CrossRef]
- Cheng, Y.; Hu, R.; Xu, W.; Yu, L. Integrated Control Strategy of Semi-Active Suspension and In-Wheel Motors for Handling Limit of Electric Race Car. Proc. Inst. Mech. Eng. Part D J. Automob. Eng. 2023, 238, 4486–4504. [Google Scholar] [CrossRef]
- Zhao, L.; Zhou, C.; Yu, Y. A Research on Optimal Damping Ratio Control Strategy for Semi-Active Suspension System. Automot. Eng. 2018, 40, 41–47. [Google Scholar] [CrossRef]
- Huang, H.; Lim, T.C.; Wu, J.; Ding, W.; Pang, J. Multitarget Prediction and Optimization of Pure Electric Vehicle Tire/Road Airborne Noise Sound Quality Based on a Knowledge- and Data-Driven Method. Mech. Syst. Signal Process. 2023, 197, 110361. [Google Scholar] [CrossRef]
- Huang, H.; Huang, X.; Ding, W.; Yang, M.; Yu, X.; Pang, J. Vehicle Vibro-Acoustical Comfort Optimization Using a Multi-Objective Interval Analysis Method. Expert Syst. Appl. 2023, 213, 119001. [Google Scholar] [CrossRef]
- Negash, B.A.; You, W.; Lee, J.; Lee, C.; Lee, K. Semi-Active Control of a Nonlinear Quarter-Car Model of Hyperloop Capsule Vehicle with Skyhook and Mixed Skyhook-Acceleration Driven Damper Controller. Adv. Mech. Eng. 2021, 13, 1–14. [Google Scholar] [CrossRef]
- GB/T 4970-2009; Method of Running Test–Automotive Ride Comfort. Standardization Administration of the People’s Republic of China: Beijing, China, 2009.
- ISO 2631-1:1997; Mechanical Vibration and Shock–Evaluation of Human Exposure to Whole-Body Vibration–Part 1: General Requirements. International Organization for Standardization: Geneva, Switzerland, 1997.
- Yin, C.; Luo, D.; Yue, S. Study on Vibration Performance of Commercial Vehicle’s Cab-Seat Mounting System. J. Mach. Des. 2023, 40, 99–107. [Google Scholar] [CrossRef]
- Zhuang, C.; Wen, H.; Ni, X.; Zhang, D.; Bao, Y.; Huang, H. Optimization of Cab Vibration Comfort for Construction Machinery Based on Multi-Target Regression Forests. Machines 2022, 10, 1148. [Google Scholar] [CrossRef]
- Chen, S.; Zhao, Z.; Zhao, K. Coordinated Control of Trajectory Tracking and Yaw Stability of Four-Wheel-Independent-Drive Autonomous Electric Vehicles. J. Tongji Univ. (Nat. Sci.) 2024, 52, 185–196. [Google Scholar]
- ISO 3888-1:2018; Passenger Cars–Test Track for a Severe Lane-Change Manoeuvre–Part 1: Double Lane-Change. International Organization for Standardization: Geneva, Switzerland, 2018.
- Huang, H.; Huang, X.; Ding, W.; Zhang, S.; Pang, J. Optimization of Electric Vehicle Sound Package Based on LSTM with an Adaptive Learning Rate Forest and Multiple-Level Multiple-Objective Method. Mech. Syst. Signal Process. 2023, 187, 109932. [Google Scholar] [CrossRef]


| Road Surface Grades | α (m−1) | ρ (mm) |
|---|---|---|
| A | 0.111 | 37.7 |
| B | 0.111 | 75.4 |
| C | 0.111 | 150.8 |
| D | 0.111 | 301.6 |
| E | 0.111 | 603.2 |
| F | 0.111 | 1206.4 |
| Parameter | Value |
|---|---|
| Total mass | 1775 (kg) |
| Front/Rear axle load | 1085/690 (kg) |
| Wheelbase | 2750 (mm) |
| Distance from center of mass to front axle | 1050 (mm) |
| Center of mass height | 712 (mm) |
| Vehicle roll moment of inertia | 830 (kg·m−2) |
| Vehicle pitch moment of inertia | 3684 (kg·m−2) |
| Vehicle yaw moment of inertia | 3420 (kg·m−2) |
| Sprung mass | 410 (kg) |
| Unsprung mass | 68.5 (kg) |
| Vertical stiffness of suspension | 31,000 (N/m) |
| Tire radial stiffness | 220,000 (N/m) |
| Angle Step Input Test Metrics | Test Results | Simulation Results | Deviation |
|---|---|---|---|
| Peak value of yaw rate | 5.11 deg/s | 4.62 deg/s | −9.59% |
| Steady-state value of yaw rate | 4.16 deg/s | 4.08 deg/s | −1.92% |
| Peak value of roll angle | 1.14 deg | 1.09 deg | −4.39% |
| Steady-state value of lateral acceleration | 2.16 m/s2 | 2.02 m/s2 | −6.48% |
| Serpentine Test Metrics | Test Results | Simulation Results | Deviation |
|---|---|---|---|
| Peak average of yaw rate | 20.92 deg/s | 21.48 deg/s | 2.68% |
| Peak average of roll angle | 3.58 deg | 3.81 deg | 6.42% |
| Peak average of lateral acceleration | 7.12 m/s2 | 7.26 m/s2 | 1.97% |
| Brake Test Metrics | Test Results | Simulation Results | Deviation |
|---|---|---|---|
| Peak value of pitch angle | 2.21 deg | 2.02 deg | −8.60% |
| Peak value of longitudinal acceleration | −10.14 m/s2 | −9.22 m/s2 | −9.07% |
| Working Condition | RMS Value of Vertical Vibration Acceleration (m/s2) | |||||||
|---|---|---|---|---|---|---|---|---|
| Driver Seat | Driver Floor | Passenger Seat | Passenger Floor | |||||
| Passive State | Developed Strategy | Passive State | Developed Strategy | Passive State | Developed Strategy | Passive State | Developed Strategy | |
| 40 km/h | 1.21 | 1.18 | 0.69 | 0.60 | 1.34 | 1.09 | 0.68 | 0.51 |
| 60 km/h | 1.54 | 1.50 | 0.83 | 0.70 | 1.43 | 1.32 | 0.66 | 0.45 |
Disclaimer/Publisher’s Note: The statements, opinions and data contained in all publications are solely those of the individual author(s) and contributor(s) and not of MDPI and/or the editor(s). MDPI and/or the editor(s) disclaim responsibility for any injury to people or property resulting from any ideas, methods, instructions or products referred to in the content. |
© 2025 by the authors. Licensee MDPI, Basel, Switzerland. This article is an open access article distributed under the terms and conditions of the Creative Commons Attribution (CC BY) license (https://creativecommons.org/licenses/by/4.0/).
Share and Cite
Wang, F.; Wen, H.; Xie, S. Performance Analysis and Hybrid Control Strategy Research of Vehicle Semi-Active Suspension for Ride Comfort and Handling Stability. Machines 2025, 13, 393. https://doi.org/10.3390/machines13050393
Wang F, Wen H, Xie S. Performance Analysis and Hybrid Control Strategy Research of Vehicle Semi-Active Suspension for Ride Comfort and Handling Stability. Machines. 2025; 13(5):393. https://doi.org/10.3390/machines13050393
Chicago/Turabian StyleWang, Fei, Hansheng Wen, and Sanshan Xie. 2025. "Performance Analysis and Hybrid Control Strategy Research of Vehicle Semi-Active Suspension for Ride Comfort and Handling Stability" Machines 13, no. 5: 393. https://doi.org/10.3390/machines13050393
APA StyleWang, F., Wen, H., & Xie, S. (2025). Performance Analysis and Hybrid Control Strategy Research of Vehicle Semi-Active Suspension for Ride Comfort and Handling Stability. Machines, 13(5), 393. https://doi.org/10.3390/machines13050393