Article

Fatigue Damage Assessment of a Metro Vehicle Bogie Frame Based on Measured Field Load

School of Mechanical, Electronic and Control Engineering, Beijing Jiaotong University, Beijing 100044, China
*
Author to whom correspondence should be addressed.
Machines 2025, 13(4), 306; https://doi.org/10.3390/machines13040306
Submission received: 11 February 2025 / Revised: 1 April 2025 / Accepted: 4 April 2025 / Published: 9 April 2025
(This article belongs to the Section Vehicle Engineering)

Abstract

:
As the operating conditions of metro vehicles become more complex, the fatigue damage of metro bogie frames under actual operating conditions becomes increasingly difficult to evaluate realistically. After a period of operation of metro trains, the load excitation on the frame and its vibrations become more intense, which causes elastic resonance and leads to fatigue damage. Therefore, it is of high importance to establish test load conditions that match the actual operating environment to conduct fatigue reliability research on frames. To address this problem, in this study, we developed a high-precision force measurement frame and performed a long-term field test. The load optimization factor was used to quantify the load amplitude amplification near the modal frequency caused by the frame elastic resonance. The real load conditions and damage conditions of the fatigued weak position were obtained. Additionally, the square of the difference between the damage calculated via the load spectrum and the measured damage was used as the objective function; the calibrated test load spectrum fully covered the fatigued weak position damage as the constraint condition. The load spectrum calibration coefficient was obtained via multi-objective optimization through a genetic algorithm. The results showed that the damage calculated using the calibrated load agreed well with the real damage, and the ratio of the equivalent stress amplitude between the two was in the range of 1–2. The calibrated test load spectrum obtained in this study can be used for the structural optimization and fatigue reliability design of the later frame. The findings reported here can also be applied to other dynamic systems where fatigue failure is a critical issue.

1. Introduction

In recent years, with the increasing mileage of train operations, the problem of the insufficient fatigue reliability of some vehicle frames has gradually emerged, restricting the structure of the lightweight and healthy development of rail transport. In railway applications, a train must pass the strength evaluation tests specified by the European Standard EN 13749 [1], International Union of Railways Standard UIC 615-4 [2], and Japanese Industrial Standard JIS E 4207 [3], before coming into operation. However, fatigue failures still occur in the service process of the bogie frame, although its structural strength meets the relevant safety requirements [4,5,6,7] (Figure 1). Although wheel–rail forces and insufficient vehicle maintenance are important causes of fatigue failure in rail vehicle frames, they cannot directly guide the design and evaluation of bogie frames. It is necessary to conduct load research based on the structural characteristics of the bogie frame itself.
Therefore, measuring load history under the actual operating conditions is required for assessing bogie frame fatigue. In recent years, researchers in different fields have conducted several studies to accurately obtain the structural load conditions, which can be mainly classified into direct methods, indirect methods, and new algorithms [8].
The direct method uses force transducers to measure the load directly; here, load errors mainly arise from systematic structural and nonlinear coupling errors. The indirect method involves inverting the excitation load through the vibration system parameters and dynamic structural response, which can be further subdivided into the frequency- and time domain methods. The frequency domain method is based on a linear time-invariant system that uses the generalized frequency response transfer matrix of response and excitation to identify the loads; this method is suitable for smooth random loads [9,10]. The time domain method uses the dynamic equations of the system to back-calculate the dynamic force timescale through the response timescales, which has an intuitive identification effect [11,12,13,14,15]. However, the solution process is more complicated, less robust, and better suited for nonlinear systems. The newer algorithms include wavelet methods and genetic algorithms, characterized by high accuracy and a strong anti-interference ability [16,17,18,19]. Nevertheless, these techniques do not offer clarity on the physical meaning of the mathematical equations.
Therefore, different load recognition methods have differing adaptabilities and limitations, and hence, it is necessary to choose the appropriate method according to the practical engineering requirements. For the rail vehicle bogie frame, the existing multi-source load recognition direct method offers high accuracy [20,21,22,23]. In this study, we selected the direct method to decouple the load of a certain type of bogie frame for calibration; developed the force-measuring frame and components; and obtained the time histories signal of the frame load and fatigue stress at the weak point using field tests. Meanwhile, the test found the frame load signal to exhibit explicit elastic resonance characteristics. Several studies have investigated the causes of fatigue failure of metro vehicle system components [4,5]. However, the processing method of fatigue load amplitude amplification caused by elastic resonance in the metro frame, as well as further damage assessment of all fatigue weak points of the frame through the processed load, have rarely been examined, with the problem lying in the preliminary research stage [24]. Focusing on this issue, we (i) obtained the key parameters for the load optimization factor based on the operational modal analysis and the half-power bandwidth method; (ii) quantified the load amplitude amplification effect near the modal frequency; and (iii) obtained the real loads. The actual test load loses the phase information and cannot fully cover the fatigue weak points of the frame. Therefore, we used the square of the difference between the calculated and measured damage of the load spectrum as the objective function. Further, with the constraint that the experimental load spectrum comprehensively covers the fatigue weak point damages, the calibration coefficient matrix for the load spectrum was obtained through the multi-objective optimization of the genetic algorithm to establish a calibrated load spectrum. This spectrum achieved comprehensive damage coverage and improved the load description accuracy, and thus could be used as a test load condition for the structural optimization and fatigue reliability design of the frame at a later stage.
The rest of the article is organized as follows: Section 2 describes the test methods, primarily load series description; measurement points; calibration method; and field test. Section 3 describes the resonant load signal processing method, i.e., the load signal amplification phenomenon; load resonance frequency band optimization; and load optimization effect analysis. Finally, Section 4 describes the fatigue damage assessment based on test loads, i.e., load spectrum development; load spectrum calibration method with full damage coverage; and calibration result comparison.

2. Calibration and Field Test Methods

2.1. Load Series Description

The bogie frame employed in this study originates from the B-type metro vehicle bogie with a design life of 30 years; it is made of steel plates welded into an H-type structure, with rubber-cushioned steel and air springs for the first and second series of suspensions, respectively (Figure 2). The positive directions of the x-axis, y-axis, and z-axis correspond to the longitudinal, lateral, and vertical bogie frame axes, respectively.
The bogie frame was subjected to multi-source coupled loads. Based on its structural characteristics and stress mode, combined with the previously mentioned standards [1,2], the loads on the bogie frame were divided into two categories, i.e., loads affecting the (i) overall and (ii) local stress response of the frame, with a total of 14 types (Figure 2). Loads affecting the overall stress response of the frame include bouncing load (BCL), due to the vibrational component of the vertical force on the frame, roll load (ROL), due to the quasi-static component of the vertical force on the frame, twist load (TWL), caused by track irregularity, transverse load (TRL), from vehicle body inertia and lateral excitation of the wheel track, and lozenging load (LZL), due to the longitudinal lozenging force caused by dynamic action. On the other hand, loads affecting the local stress response of the frame included motor loads (motor vertical load (MVL) and motor transverse load (MTL)), due to motor operation and inertial vibration, gearbox vertical load (GEL), due to traction torque and vibration, longitude load (LOL), caused by the traction rod transmitting the traction force between the vehicle body and the frame, brake load (BRL), due to the force generated by the braking system, anti-roll bar load (ARL), and the damper loads (primary vertical damper load (PVDL), secondary vertical damper load (SVDL), and secondary transverse damper load (STDL)).

2.2. Measurement Points

This study adopted strain gauges to sensorize the frame to perform direct testing of each load. The main process was as follows: (i) calculate the strong response area of each load through finite element simulation; (ii) arrange a large number of strain gauges in the strong response area of each load; (iii) obtain identification points with a good decoupling degree of each load through the calibration test bench and obtain load identification matrix K n n ; and (iv) obtain the transfer matrix A i , n between each load system and each fatigue key point through the calibration test bench.
To obtain the positions of each load identification point on the frame, we take the bouncing load of the frame as an example. The frame was subjected to finite element analysis using the SOLID92 body unit for discretization, and a total of 1,620,885 discretized units were obtained (Figure 3a). The material density was 7830 kg/m3, the modulus of elasticity was 206 GPa, and Poisson’s ratio was 0.3. The MASS21 mass unit was employed to simulate the center of mass of the motor and other suspension parts. The BEAM188 beam unit was used to simulate the axle and swivel arm. The COMBIN14 spring unit was used to simulate the axle box spring, the constraint position for the axle wheelbase, and the axle center. Under the simulation loading conditions for the vertical load on the car body at the air spring positions of the frame, the strong response areas for axle load identification at positions 1–4 were obtained (Figure 3a). This analysis guided the placement of strain gauge groups and allowed for the subsequent selection of high-precision decoupling points. The strong response zones of the rest of the frame for each load system are shown in Figure 3b. Additionally, the stress at the weld seam was calculated through the combination of the EN13749 working conditions, and the fatigue key points (62 in total) were obtained by combining the team’s previous experience of dynamic stress testing and an experimental evaluation of similar structural frames to prepare for the comprehensive coverage of the actual damage of the test loads (Figure 3c).

2.3. Calibration Method

The force measurement frame was developed based on the strain measurement principle. Its load identification method can be expressed as follows:
ε i ( t ) = K i n F n ( t ) ,
which can be expanded in a matrix form as follows:
ε 1 ( t ) ε 2 ( t ) ε i ( t ) = K 1 , 1 K 1 , 2 K 1 , n K 2 , 1 K 2 , 2 K 2 , n K i , 1 K i , 2 K i , n F 1 ( t ) F 2 ( t ) F n ( t ) ,
where ε i is the strain response matrix; K i n is a load identification matrix representing the ith strain of the frame under the nth unit load; and F n is the load matrix.
By solving Equation (2) using the least-squares method, the inverse load, F n , can be directly obtained as follows:
F n = arg min F n K i n F n ε i 2 2 = K i n T K i n 1 K i n T ε i
However, Equation (3) is an ill-posed problem that can lead to an unstable solution to F n due to the presence of multi-source coupled loads. This effect is caused by the ill-conditioned matrix, K i n , which often has a large condition number. Even a small measurement noise can make the solution to Equation (3) extremely unstable. The error in its solution can be estimated as follows:
δ F n F n K i n ( K i n T K i n ) 1 K i n T δ ε i ε i
which shows that the error in F n can reach K i n ( K i n T K i n ) 1 K i n T times the error in strain response, i.e., the condition number of matrix, K i n , expressed as follows:
C o n d ( K i n ) = K i n ( K i n T K i n ) 1 K i n T
which is generally used to measure the quality of matrix conditions. Ill-posed problems tend to have relatively large condition numbers. To effectively control the size of C o n d ( K i n ) and suppress the load error, it is necessary to use the force measuring frame method to diagonalize the load identification matrix and obtain the calibration matrix K n n to remove the mutual influence between loads, as follows:
K n n = K 11 K n n
The nominal values of each load of the calculation frame were used for calibration, in tandem with the European standard EN 13749 [1]. The strain gauge group was arranged in combination with the aforementioned strong load response area. The calibration test bench was used to load 14 types load conditions in stages; measuring points with a smaller degree of coupling between each load were screened out (Figure 4). A Wheatstone full-bridge circuit (Figure 3b) was developed to identify each load, thereby improving the signal-to-noise ratio (SNR) and achieving high-precision decoupling from other multi-source loads of the force measurement frame.
Among them, the action positions of BCL, ROL, TWL, TRL, BRL, and LZL are equivalent to the bending cantilever beam structure. A bending load bridge sensor was constructed to improve the bending load SNR and compensate for the tensile and compressive deformation. The action positions of LOL, GEL, and damper loads primarily bore the axial force. A tensile and compressive load bridge sensor is constructed to improve the tensile and compressive load SNR and compensate for the bending and torsional deformation. The ARL acted on the anti-roll torsion bar with a set of perpendicularly installed strain gauges at its center. A torsional load bridge sensor was developed to improve the torsional load SNR. For the strong response area of load on complex structural shapes, such as the MVL and MTL, it is difficult to analyze the relationship between the load and the strain direction. Therefore, it is necessary to use a matrix-based load bridge sensor to assess the relationship and arrange the strain group. The full-bridge circuit was arranged by the exhaustive method to obtain the measurement points with the best degree of decoupling. After determining each load bridge, the load was calibrated and the identification bridge output strain was computed through least-squares linear fitting to further obtain K n n . Interference due to strong magnetic fields, noise, and vibrations were prevented, which may affect the test accuracy near the test site. The temperature of the test room and the relative humidity of the air were maintained at 10–20 °C and ≤ 80%, respectively. All load sensors and test equipment were calibrated by the national legal measurement unit and used within the measurement validity period.
To evaluate the effectiveness of diagonalizing the load transfer matrix K n n , the coupling degree between loads i and j can be obtained as follows:
γ i j = ε j F j ε i F i × 100 % ,
where γ i j is the coupling degree of the jth load to the ith load; ε i and ε j are the strain gauge responses of the ith load identification point under the ith and jth loads, respectively; and F i and F j are the nominal values of the ith and jth loads, respectively, estimated according to the European standard EN 13749 [1] and the measured load signals of previous metro vehicle bogie frames (taking the MVL as an example, the decoupling degree between loads is shown in Table 1).
The off-diagonal elements in the diagonalized calibration matrix were 1–2 orders of magnitude smaller than the diagonal elements (Table 1). The maximum degree of coupling between MVL and other load systems was 3.4%, which met the engineering error requirement of 5%, thereby realizing high-precision decoupling between frame loads.
After calibrating K n n , we further calibrated the transfer matrix, A i , n of each load system and fatigue key point, with a total of 62 stress measurement points (Figure 3c). Since the stress of each fatigue key point is the result of the combined action of each load, the dynamic stress response matrix, σ i , in preparation for the load to fully cover the actual loss, can be expressed as follows:
σ 1 ( t ) σ 2 ( t ) σ 62 ( t ) = A 1 , 1 A 1 , 2 A 1 , 14 A 2 , 1 A 2 , 2 A 2 , 14 A 62 , 1 A 62 , 2 A 62 , 14 F 1 ( t ) F 2 ( t ) F 14 ( t ) ,
where A i , n is the transfer matrix between each load system and the fatigue key points.
The frame was placed upright under the multi-channel hydraulic servo loading calibration platform, and the transfer matrices of each fatigue key point under the BCL, ROL, TWL, MVL, GEL, BRL, ARL, PVDL and SVDL were calibrated. The transfer matrices of each fatigue key point under the remaining load conditions were obtained by placing them in reverse under the multi-channel hydraulic servo loading calibration table (Figure 4).

2.4. Field Test

After calibrating and obtaining K n n and A i , n , it is necessary to encapsulate each load bridge and fatigue key point strain gauge to completely develop the force measuring frame (Figure 5). The encapsulated force measuring frame was placed and set up in the A01 vehicle to conduct the synchronous acquisition tests and strain gauge anti-interference tests for long cycles for wide-area service environments with multi-physical parameter response signals. The sampling frequency was set to 2000 Hz, and the test signals covered the entire operation period and line conditions to obtain the signals characterizing the loads, stresses, and vehicle operation states of the bogie frame. The accuracy and validity of the signals were ensured, laying the foundation for further research on the fatigue damage assessment of a metro vehicle bogie frame based on a measured field load.

3. Resonant Load Signal Processing Method

3.1. Load Signal Amplification Phenomenon

During the operation of the metro vehicle, the wheel–rail excitations widen the frame load test signal frequency, as shown in the time-frequency domain signal diagrams for the bouncing load and motor vertical load (Figure 6).
The time domain signals of the bouncing load and motor vertical load exhibited “beat” vibrations in the train over the curve stage (Figure 6a), generated by the synthesis of two excitations of similar frequencies, which can be expressed as follows:
x ( t ) = 2 X cos δ t 2 cos ( ω + δ 2 ) t
where x is a cosine signal with a frequency ω + δ / 2 (approximated as ω ) and X is the amplitude of the cosine signal. The amplitude of the signal varies according to the beat frequency 2 X cos δ t / 2 . The first and second simple harmonic oscillation frequencies are ω and ω + δ , respectively.
The main frequencies of the bouncing loads in the 0–10 Hz band were 1.4, 6.3, and 8.3 Hz (Figure 6b). The bouncing self-oscillation frequencies of the frame and the body were 1.2 and 6.1 Hz, respectively, with the former main frequency corresponding to the bouncing frequency of the body and the latter main frequency corresponding to the bouncing frequency of the frame, using the following relation [25]:
f 1 = 1 π k 1 k 2 m 2 2 k 1 + k 2 f 2 = 1 2 π 2 k 1 + k 2 m 1 ,
where m 1 = 2.4 t and m 2 = 19.5 t are the masses of the frame and the vehicle body, respectively, and k 1 = 1378 kN/m and k 2 = 736 kN/m are the vertical stiffness of the primary and secondary suspensions, respectively. Simultaneously, the bouncing load and motor vertical load amplitude signals in the 0–10 Hz band had a main frequency of 8.3 Hz in combination with the signal waterfall diagram (Figure 6c,d) for a vehicle running speed of 80 km/h, which is also the wheel rotation frequency [Equation (11)].
f n = v n 2 π r ,   n = 1 , 2 , 3
where f n is the excitation frequency caused by the n -th order polygon of the wheel, v is the speed, and r is the wheel radius ( r = 0.42 m).
The metro vehicle speed and the wheel–rail excitation both affect the bouncing and motor vertical loads (Figure 6c,d). The amplitude energy of the bouncing load at 53 Hz was generally distributed horizontally, which was independent of the vehicle speed and wheel rotation frequency. The large amplitude energy of the bouncing load at this frequency may be due to the wheel–rail coupling frequency of 45–55 Hz that resonated with the torsional mode of the frame. The motor vertical load displayed excessive amplitude energy at 41 Hz. According to Equation (11), the fifth-order polygon frequency of the wheel was close to 41 Hz. At the same time, the corrugation of the rails will also produce high-frequency vibrations. Therefore, it is possible that multiple wheel–rail excitation signals excite the mode near 41 Hz of the frame, resulting in the concentration of amplitude energy.
Due to the complex nature of metro lines, excitation frequency close to the modal frequency of the frame leads to beat vibrations. This can cause the system to vibrate without any external excitation, as the frame resonates and the load amplitude is amplified. To clarify whether the signal frequency corresponding to this type of beat vibration phenomenon is close to the modal frequency of the frame, we conducted a modal analysis of the entire frame via finite element analysis (Figure 3a). The constrained mode vibration shape and frequency within the 100 Hz range of the frame were calculated using the block Lanczos algorithm of the ANSYS 17 (Table 2).
The first two modal frequencies of the bogie frame were 41 and 51 Hz (Table 2). Combined with the above analysis, the main vibration frequencies of the bouncing and motor vertical loads were obtained as 53 and 41 Hz, respectively, corresponding to the second-order and first-order modal frequency of the frame, respectively. The load excitation frequency was close to the modal frequency, with the frame reaching resonance and causing load amplitude amplification. To accurately obtain the actual frame load, it is necessary to quantify the load amplitude component amplified by the resonance frequency to complete the optimization of the load identification matrix, K n n , in the resonance area.

3.2. Load Resonance Frequency Band Optimization

The load identification matrix, K n n , is obtained based on the (i) linear; (ii) time-invariance; and (iii) measurability assumptions. The linear assumption is not satisfied for the load resonance frequency band. This resonance problem is one of the key issues existing in the field of rail vehicle structural strength. Herein, we describe the load amplitude amplification problem near the resonance modal frequency through a second-order system. Therefore, the motion differential equation of the system under general periodic excitation can be expressed as follows:
m x ¨ + c x ˙ + k x = F ( t ) = a 0 2 + j = 1 a j cos j ω t + j = 1 b j sin j ω t ; x p ( t ) = a 0 2 k + j = 1 a j / k ( 1 j 2 r 2 ) 2 + ( 2 ξ j r ) 2 cos ( j ω t ϕ j ) + j = 1 b i / k ( 1 j 2 r 2 ) 2 + ( 2 ξ j r ) 2 sin ( j ω t ϕ j )
where m , c , and k are the mass, damping, and stiffness, respectively; a 0 , a j , and b j are constants; ϕ j , ξ , and r are the j th order modal phase angle, damping ratio, and frequency ratio, respectively; and r = ω / ω n , where ω n is the intrinsic frequency.
Assuming that the excitation in the short frequency band is a simple harmonic force, F ( t ) = F 0 cos ω t , the steady-state solution can be expressed as a simple harmonic function, and x p = X cos ( ω t ϕ ) . By substituting the solution into Equation (12), we obtain the following:
X = F 0 [ ( k m ω 2 ) 2 + c 2 ω 2 ] 1 / 2 ;   ϕ = arctan c ω k m ω 2
where X and ϕ are the response amplitude and phase angle, respectively.
The full solution to Equation (12) can be expressed as x ( t ) = x h ( t ) + x p ( t ) . In practical engineering, the damping ratio is generally small, and thus, the full solution can be expressed as follows:
x ( t ) = X 0 e ξ ω n t cos ( 1 ξ 2 ω n t ϕ 0 ) + X cos ( ω t ϕ ) ; X 0 = [ ( x 0 X cos ϕ ) 2 + 1 ( 1 ξ 2 ) ω n 2 ( ξ ω n x 0 + x ˙ 0 ξ ω n X cos ϕ ω X sin ϕ ) 2 ] 1 2 ; tan ϕ 0 = ξ ω n x 0 + x ˙ 0 ξ ω n X cos ϕ ω X sin ϕ 1 ξ 2 ω n ( x 0 X cos ϕ )
where x h , x p , x 0 , and ϕ 0 are the transient solution, steady-state solution, initial time value, and initial time phase angle of the system, respectively.
Since the final response of the system is forced vibration under external excitation, the transient response was neglected and only the amplitude change within the range of the steady-state response resonance mode was considered. By denoting the load identification matrix of the metro frame resonance frequency band as k r e a l ( r i , ξ ) and the load identification coefficient corresponding to K n n after the above calibration as k s t , the load after removing the resonance effect, F r e a l ( r i , ξ ) , can be expressed as follows:
F r e a l ( r i , ξ ) = k s t F s t ( r i , ξ ) k r e a l ( r i , ξ ) = κ ( r i , ξ ) F s t ( r i , ξ )
where r i is the frequency ratio in each narrow band of the resonance zone; F s t ( r i , ξ ) is the load containing the resonance component identified by the quasi-static calibration coefficient of the frame obtained through the proposed calibration test; and κ ( r i , ξ ) is the load optimization factor.
Since strain is the spatial gradient of the displacement field, for smaller deformations, the relationship between displacement and strain can be simplified to a linear relationship. Let ε ( t ) = x ( t ) / c , where c is a constant. The displacement to the small deformation strain can then be derived as follows:
ε ( t ) = x ( t ) c = X cos ( ω t ϕ ) c = F 0 / c [ ( k m ω 2 ) 2 + c 2 ω 2 ] 1 / 2 cos ( ω t ϕ ) = F 0 / ( c k ) [ ( 1 ( r ) 2 ) 2 + ( 2 ξ r ) 2 ] 1 / 2 cos ( ω t ϕ )
Assuming that the response within the narrow band of modal frequency is generated via simple harmonic excitation, when the simplified model of the single-degree-of-freedom second-order damped system describes the amplitude amplification component within a single modal frequency band, ω i takes the value of each narrow-band frequency within the resonance range. Therefore, Equations (15) and (16) can be combined to obtain the following:
F s t ( t ) = ε ( t ) k s t = F 0 / ( c k k s t ) [ ( 1 r i 2 ) 2 + ( 2 ξ r i ) 2 ] 1 / 2 cos ( ω i t ϕ )
Based on the critical frequency method [24], the ω i in the amplitude term frequency ratio r i in Equation (17) is replaced by the critical frequency ω 0 , and the corresponding frequency ratio is called the critical frequency ratio, r 0 . The real load after removing the modal amplification component in the narrow band can be expressed as follows:
F r e a l ( r 0 , ξ ) = F 0 / ( c k k s t ) [ 1 ( ω 0 ω n ) 2 ] 2 + ( 2 ξ ω 0 ω n ) 2 1 / 2 cos ( ω i t ϕ ) = F 0 / ( c k k s t ) ( 1 r 0 2 ) 2 + ( 2 ξ r 0 ) 2 1 / 2 cos ( ω 0 t ϕ )
Therefore, the load optimization factor within the resonance range can be expressed as follows:
κ ( r i , ξ ) = F s t ( r i , ξ ) F r e a l ( r 0 , ξ ) = [ ( 1 r 0 2 ) 2 + ( 2 ξ r 0 ) 2 ] 1 / 2 [ ( 1 r i 2 ) 2 + ( 2 ξ r i ) 2 ] 1 / 2
To quantify the amplitude amplification component within the resonance range of the quasi-static load, the key parameters of the load optimization factor required are the damping ratio, ξ , and the frequency ratio, r i . The damping ratio is identified by using the acceleration measurement point data under the online operation condition of the metro vehicle (measurement point locations shown in Table 3). This method is based on the polyreference least squares complex frequency domain (PolyMAX) method to conduct the operational modal analysis to identify the damping ratio. It is necessary to calculate the cross-power spectrum function of multiple acceleration output responses to approximate the frequency response function and use the maximum likelihood estimation to minimize the error. It has been previously successfully applied in the modal parameter identification of the bogie substructure [26].
Based on the acceleration test data of the frame (Table 3), the cross-correlation function of all the measurement points was calculated with respect to A01 as the reference point. The cross-power spectrum function of each measurement and identification point was averaged to obtain the SUM total cross-power spectrum [27,28]. The PolyMAX method was used to solve the modal parameters for the identification of the steady-state curve poles. The identification results were as follows: the first-order modal frequency and damping ratio were 39 Hz and 1.96%, respectively; while the second-order modal frequency was 53 Hz and the damping ratio was 1.77%. The modal judgment criterion MAC value of the response vibration was used to verify the accuracy of the frame modal identification results. The modal confidence criterion for identifying the modal vibration vectors ψ r and ψ s can be expressed as follows:
M A C ψ r , ψ s = ψ r T ψ s 2 ψ r T ψ r ψ s T ψ s
where ψ r and ψ s are the r th- and s th-order modal vibration modes, respectively. The MAC value has a range of 0–1; the smaller the MAC value, the better the independence of the two-order modal vibration modes and vice versa. The MAC values for the first- and second-order modes were both 9%, indicating that the two modal vibration modes were independent of each other, verifying the modal parameter identification results. The identified modal frequencies were essentially consistent with the aforementioned constrained modal analysis results. Therefore, the damping ratio of the first- and second-order modes of the proposed framework was 1.96% and 1.77%, respectively.
The resonance of the frame occurs not only at the resonant frequency point, but also in the surrounding resonance zone. The peak values of the amplitude curves of the bouncing load and motor vertical load resonance zone were 0.086 and 0.072 kN, respectively (Figure 7). The corresponding critical amplitudes were obtained (by multiplying the peak value with 1 / 2 ) as 0.061 and 0.051 kN, respectively. The corresponding frequency and frequency band are the half-power point and the resonance zone, respectively, and the left half-power point is the critical frequency. Therefore, the half-power point of the (i) bouncing load was 52 and 55 Hz, and the (ii) motor vertical load was 37 and 44 Hz. Considering the symmetry of the load optimization factor curve with respect to the resonance frequency, the resonance frequencies for the two types of loads were obtained as 53 and 41 Hz, respectively. We utilized the half-power point with a large range to calibrate the critical frequency and obtained the resonance zone of the (i) bouncing load as 51–55 Hz, and the (ii) motor load as 37–45 Hz. The critical frequencies of bouncing and motor vertical load calibration were 51 and 37 Hz.

3.3. Load Optimization Effect Analysis

In this study, we identified the low-order modal damping ratio of the frame based on the polyreference least squares complex frequency domain method; determined the resonance influence range and obtained the calibration critical frequency according to the half-power bandwidth method; and obtained the load optimization factor according to Equation (19). To compare and analyze the load signal processing effect in the resonance frequency band, we take the bouncing load of the bogie frame as an example for further study. The processing methods for other loads are the same and will not be repeated here.
The bouncing load (BCL) signal was selected for discrete Fourier transform and the discrete points in the frequency domain of the load resonance zone were divided by the corresponding load optimization factor to eliminate the resonance influence. Then, the discrete inverse Fourier transform was performed to obtain the load signal with the dynamic effect of the resonance zone removed. Both the measured and treated signals exhibited certain peaks in the resonance zone (Figure 8a). This is the system response caused by the wheel–rail excitation, which is in line with the practical situation and avoids the plateauing phenomenon caused by the amplitude amplification effect of the load removed from the resonance zone.
Based on the comparison of the bouncing vibration acceleration (BCA) and the effect of the treated load, the two types of signals were aligned based on the 0–10 Hz frequency band (Figure 8b). The amplitude change degree of the treated bouncing load and the tested bouncing acceleration in the resonance zone of 51–55 Hz were consistent. The vibration acceleration response based on the resonance area reflected the effectiveness of the treated load to a certain extent.
Load is the basis of fatigue design and the main source of damage to the frame. The fatigue key points with a greater bouncing load influence were used for verification and the stress measurement points (2-X4, 3-X5, and 4-X6) at the frame positioning arm seat were selected (Figure 3c). According to Miner’s linear cumulative damage law and S-N curve under variable amplitude loads, the stress equivalent value was calculated using Equation (21). The variable amplitude stress was equivalent to the constant stress, expressed as follows [5,21]:
σ e q = L l N 0 i = 1 k n i σ i m 1 m
where L is the total kilometres for complete service life (3.6 million km); l is the test mileage; N 0 is the number of load cycles during the fatigue test of the corresponding structure (generally 2 million times for welded structures); m is the fatigue index 3.5 for ordinary steel welded structures; and σ i and n i are the amplitude and action frequency of the stress spectrum, respectively.
Since the obtained load was the basic load system of the frame without elastic vibration, the stress affected by the resonance mode was calculated using corresponding band-stop filtering (Figure 8c,d). The calculated and measured stress amplitude ranges of the fatigue key points 2-X4 were similar; the overall trend in the time domain was highly consistent; and the frequency domain response was mainly concentrated within 10 Hz and in the range of 40–70 Hz (Figure 8c). The results of the other stress measurement points were also consistent with the measured results, and hence, will not be repeated here. The overall ratio of equivalent stress was between 0.8 and 1.1, the stress point ratio at the swing arm seat at 2-X4 was the smallest (0.8), while the other overall ratios were >1, meeting the requirements of frame fatigue assessment.

4. Fatigue Damage Assessment

After removing the load resonance component, the entire load system of the frame was divided into 16 equal-length load intervals, D [Equation (22)]. The upper and lower limits of each load level were calculated. The rain flow counting method [7] was used for cycle counting. The cycle amplitude and frequency were counted into the corresponding load level, and the corresponding cumulative frequency of each load interval was calculated.
D = F max F min N D i , u p = F min + i D D i , d o w n = F min + ( i 1 ) D H i = j = 1 i N j
where N = 16 is the load spectrum level; F max and F min are the maximum and minimum load values, respectively; D i , u p and D i , d o w n are the upper and lower limits of the i th load interval, respectively; H i is the cumulative frequency corresponding to the i th load interval; and N j is the frequency corresponding to the j th load interval.
The damage to the fatigue key points of the frame is the result of the combined action of each load system. The load spectrum was converted into a 16-level stress spectrum of the fatigue key points by combining each load system with the fatigue key point transfer matrix. The damage, D p f , generated at each stress measuring point, p , of the frame, was calculated through the stress amplitude spectrum, while the actual damage, D p s , generated at each stress, p , was calculated through the measured stress spectrum as follows:
D p f = L l j = 1 16 w = 1 14 n p j w σ p j w m N σ 0 m σ p j w = A p j w F j w D p s = L l j = 1 16 n p j σ p j m N 0 σ 0 m
where F j w is the j th level load amplitude of the w th load system; A p j w is the corresponding transfer matrix; σ p j w is the j th level stress amplitude of the stress spectrum calculated using the w th load system at the fatigue key point p ; n p j w is the number of stress cycles corresponding to the calculated stress spectrum; σ p j is the j th level stress amplitude of the measured stress spectrum at the fatigue key point p ; n p j is the number of stress cycles corresponding to the measured stress spectrum; and σ 0 is the allowable fatigue stress of the welded joint (refer to Equation (21) for the values of the other parameters).
To measure the effect of load spectrum construction, the ratio of calculated stress to the actual test stress was computed. The calculated damage, D p f , and the actual damage, D p s , were highly discrete, with the maximum (minimum) ratio being 2.9 (0.1) (Figure 9). The ratio of the calculated to the actual equivalent stress amplitude had a maximum (minimum) value of 1.4 (0.4) (Figure 10). The stress amplitude at certain locations was lower than the actual stress amplitude, resulting in poor reliability. This was due to the calculated damage being linearly superimposed through the damage of each load, which is not completely consistent with the mode of damage caused by the combined action of loads during the actual frame-loading process. The generally accepted ratio of the calculated equivalent stress to the measured equivalent stress is in the range of 1–2.
The load spectrum is a necessary condition for the design and reliability assessment of the structure. The damage calculated using the load spectrum of the structure should be ≥the actual damage of each fatigue key point under the actual service conditions. Therefore, it is necessary to calibrate the load spectrum based on the principle of damage consistency [29,30] [Equation (24)]. We obtained the load spectrum calibration coefficient, γ w , via multi-objective optimization of Equation (24) through the genetic algorithm [21]. By combining Equations (22) and (23), the ratio of the stress amplitude calculated using the calibrated load spectrum to the measured stress amplitude was obtained (Figure 11).
min p = 1 64 D p s D p c 2 D p c = γ w 3.5 D p f D p s D p c
where D p c is the calculated damage of the w th calibrated load spectrum; and γ w is the calibration coefficient of the w th load spectrum (Table 4).
The maximum (minimum) value of the ratio of the equivalent stress amplitude calculated using the calibrated load spectrum to the actual equivalent stress amplitude was 1.0 (2.0). The stress amplitude ratio of all fatigue key points of the frame was in the range of 1–2, and the discreteness degree of the stress amplitude ratio was much smaller than that generated by the load spectrum before calibration. The results show that the damage calculated using the calibrated load spectrum fully covered the actual damage. The load spectrum established by the proposed method meets the requirements of frame reliability design and fatigue assessment. Therefore, it can be used for test load conditions matching the line operation conditions, which is essential to ensure that the metro frame has sufficient fatigue reliability under the operation conditions.

5. Conclusions

In this study, a force-measuring frame was developed from the perspective of quasi-static fatigue research. The fatigue damage assessment of the frame was completed based on the measured load-time histories of the bogie frame and the stress-time histories of the fatigue key points. The primary conclusions of the study are detailed as follows:
(1)
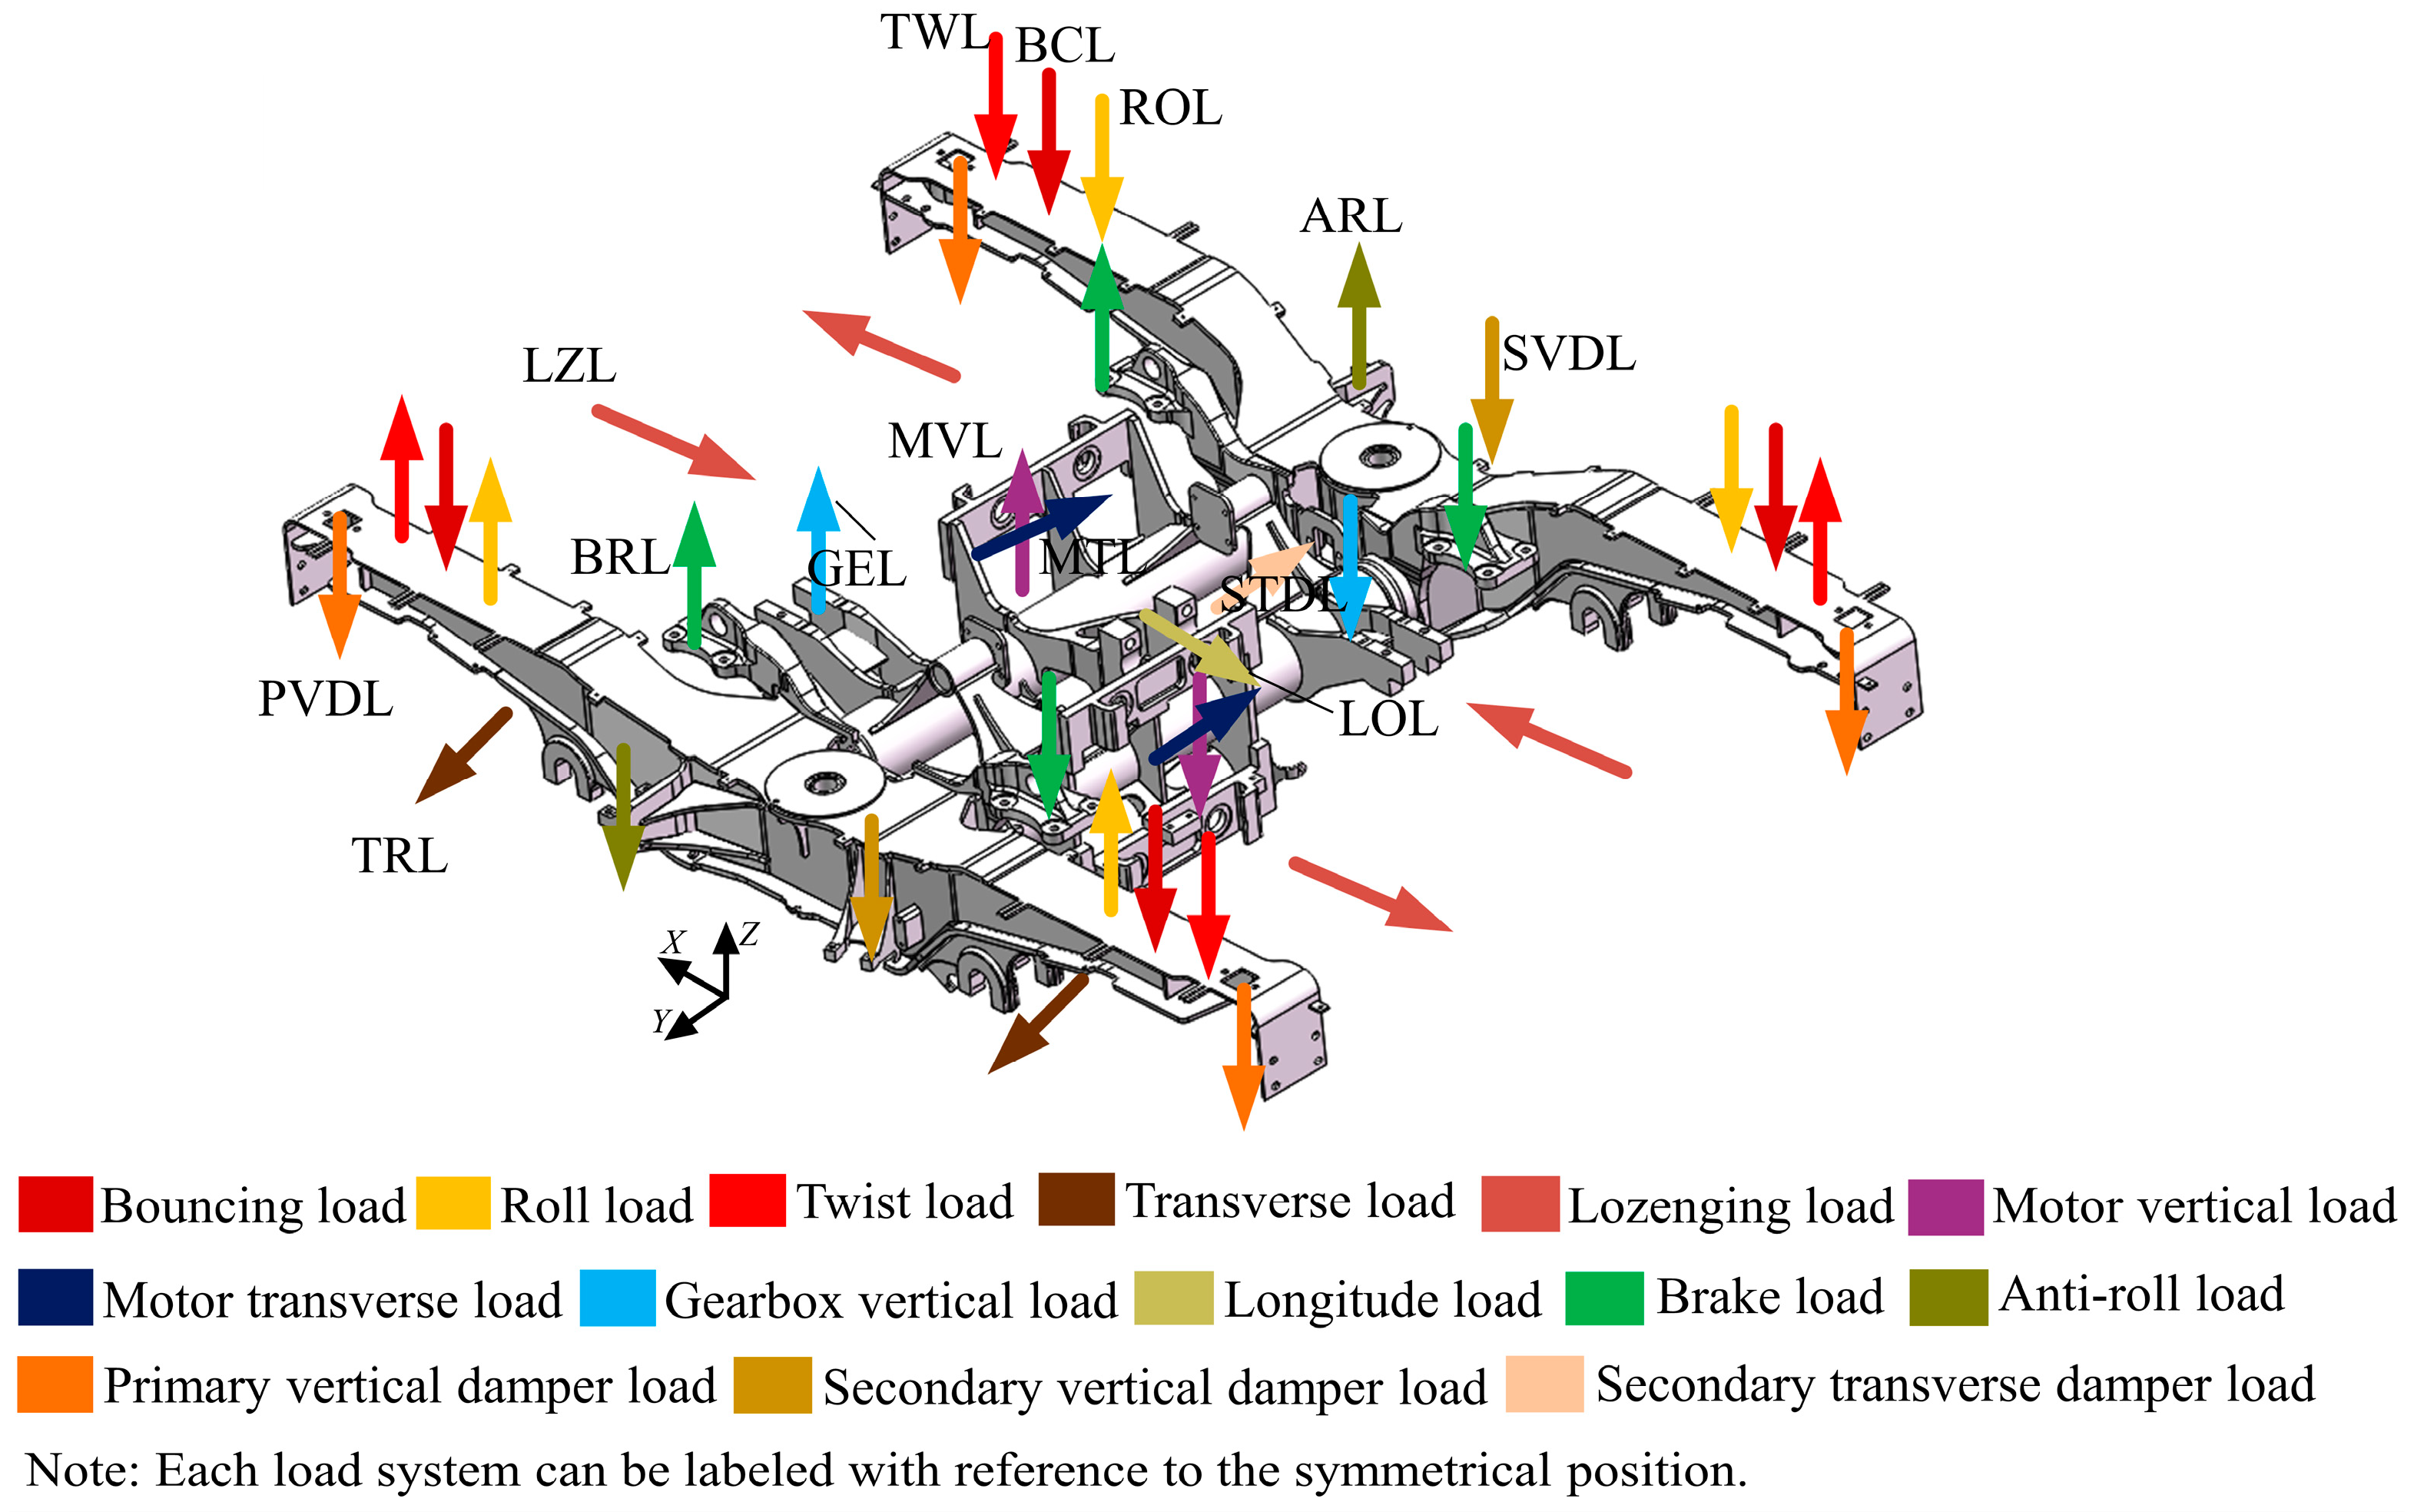
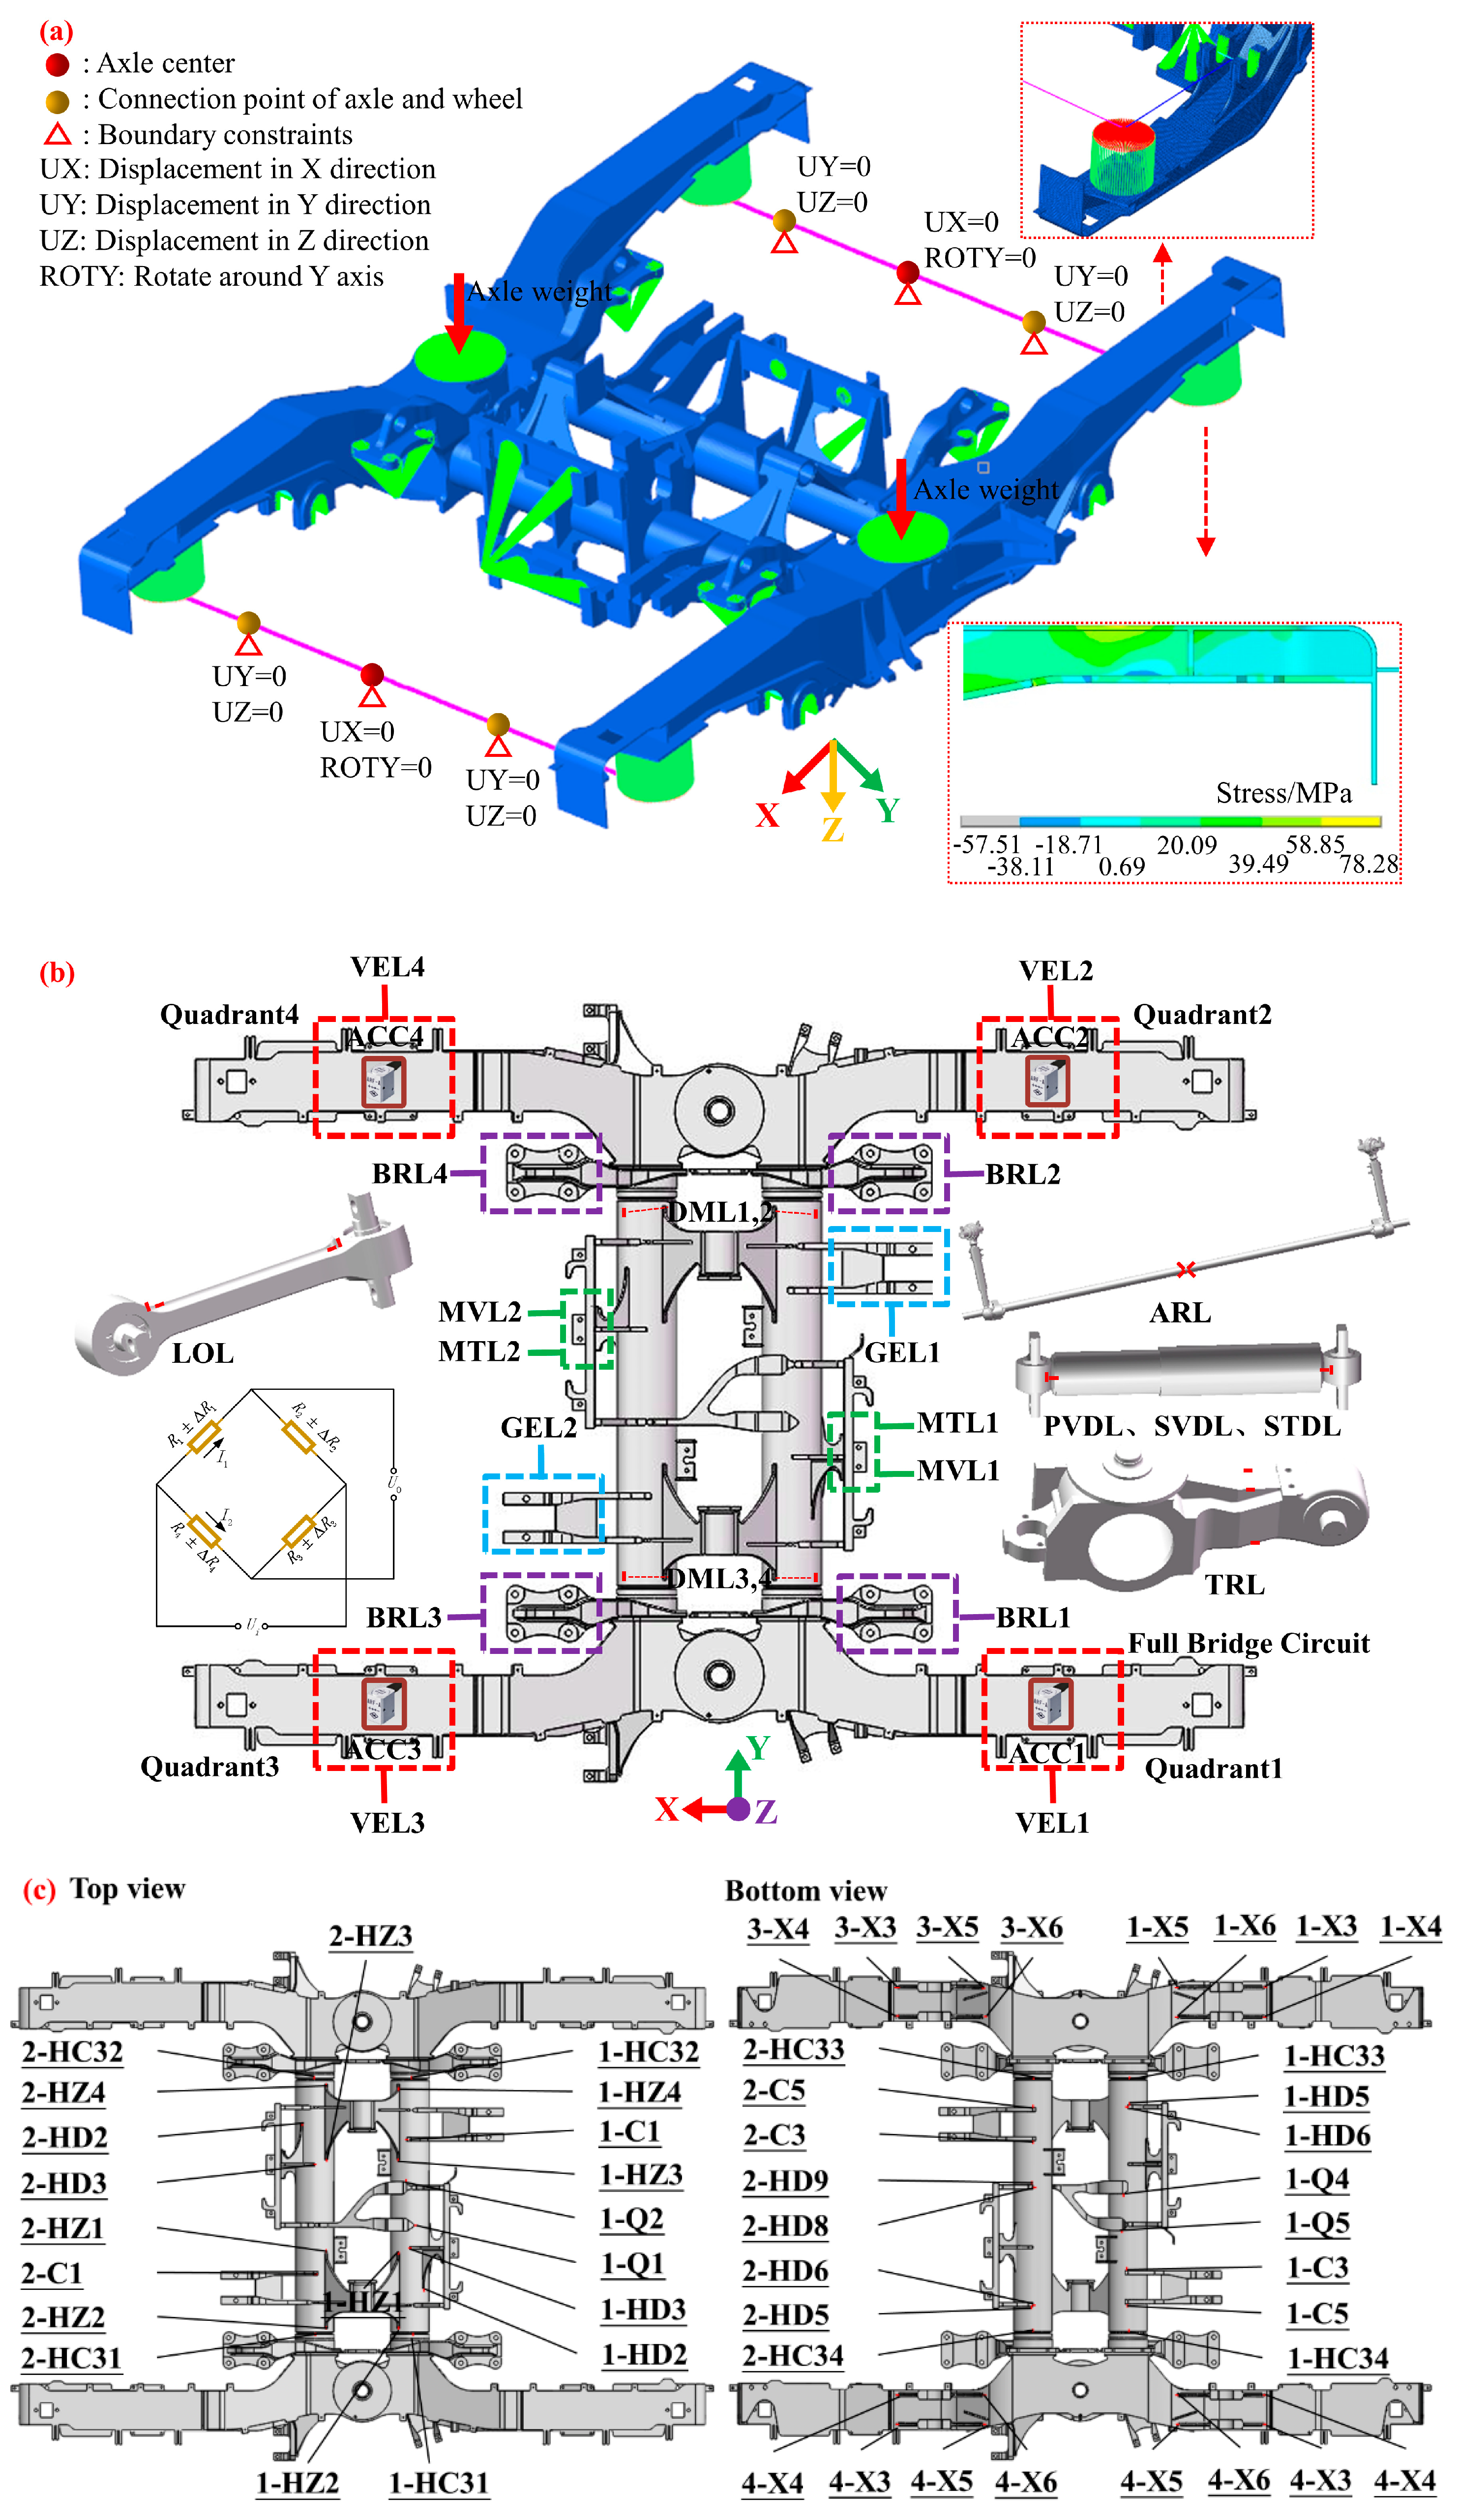
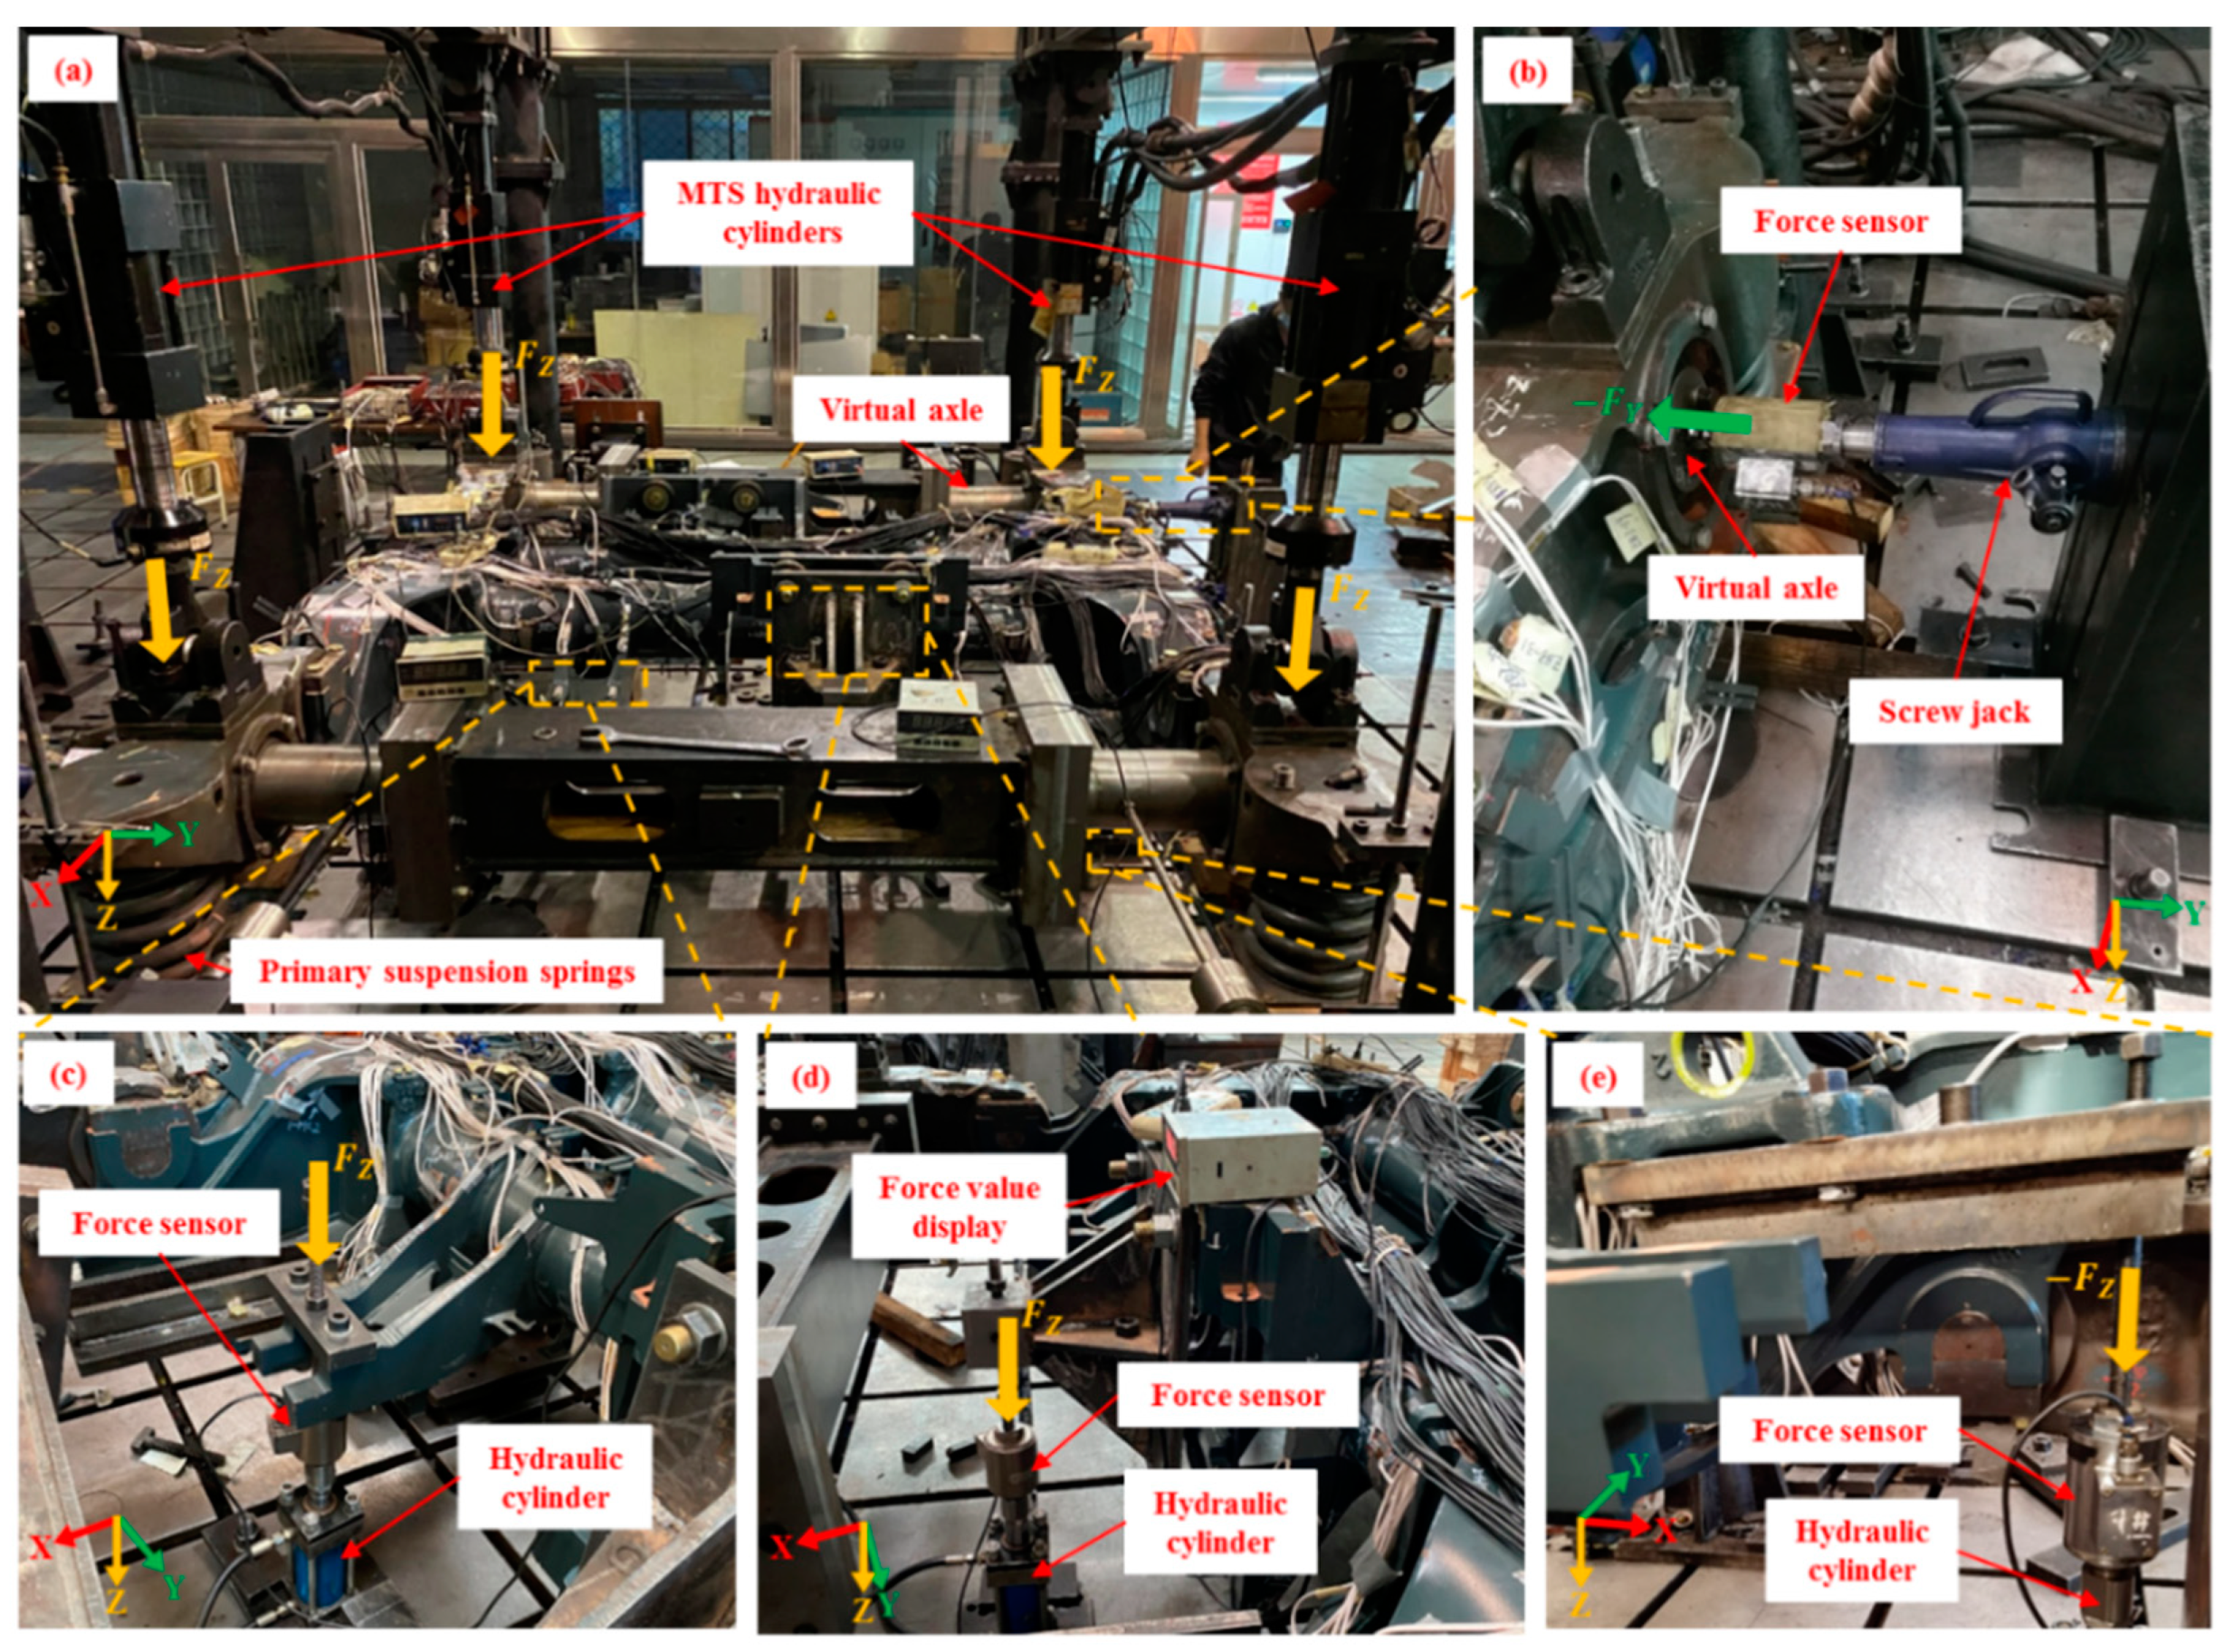
According to the motion characteristics and deformation mode of the B-type metro vehicle bogie, the frame load was divided into 14 types. The corresponding strain gauge sensors were designed for different deformation types of the load system. The load recognition matrix and fatigue key point transfer matrix were obtained through the calibration test bench. Subsequently, the high-precision force measuring frame was developed and the actual line test was carried out to obtain the load-time and fatigue key point stress-time histories;
(2)
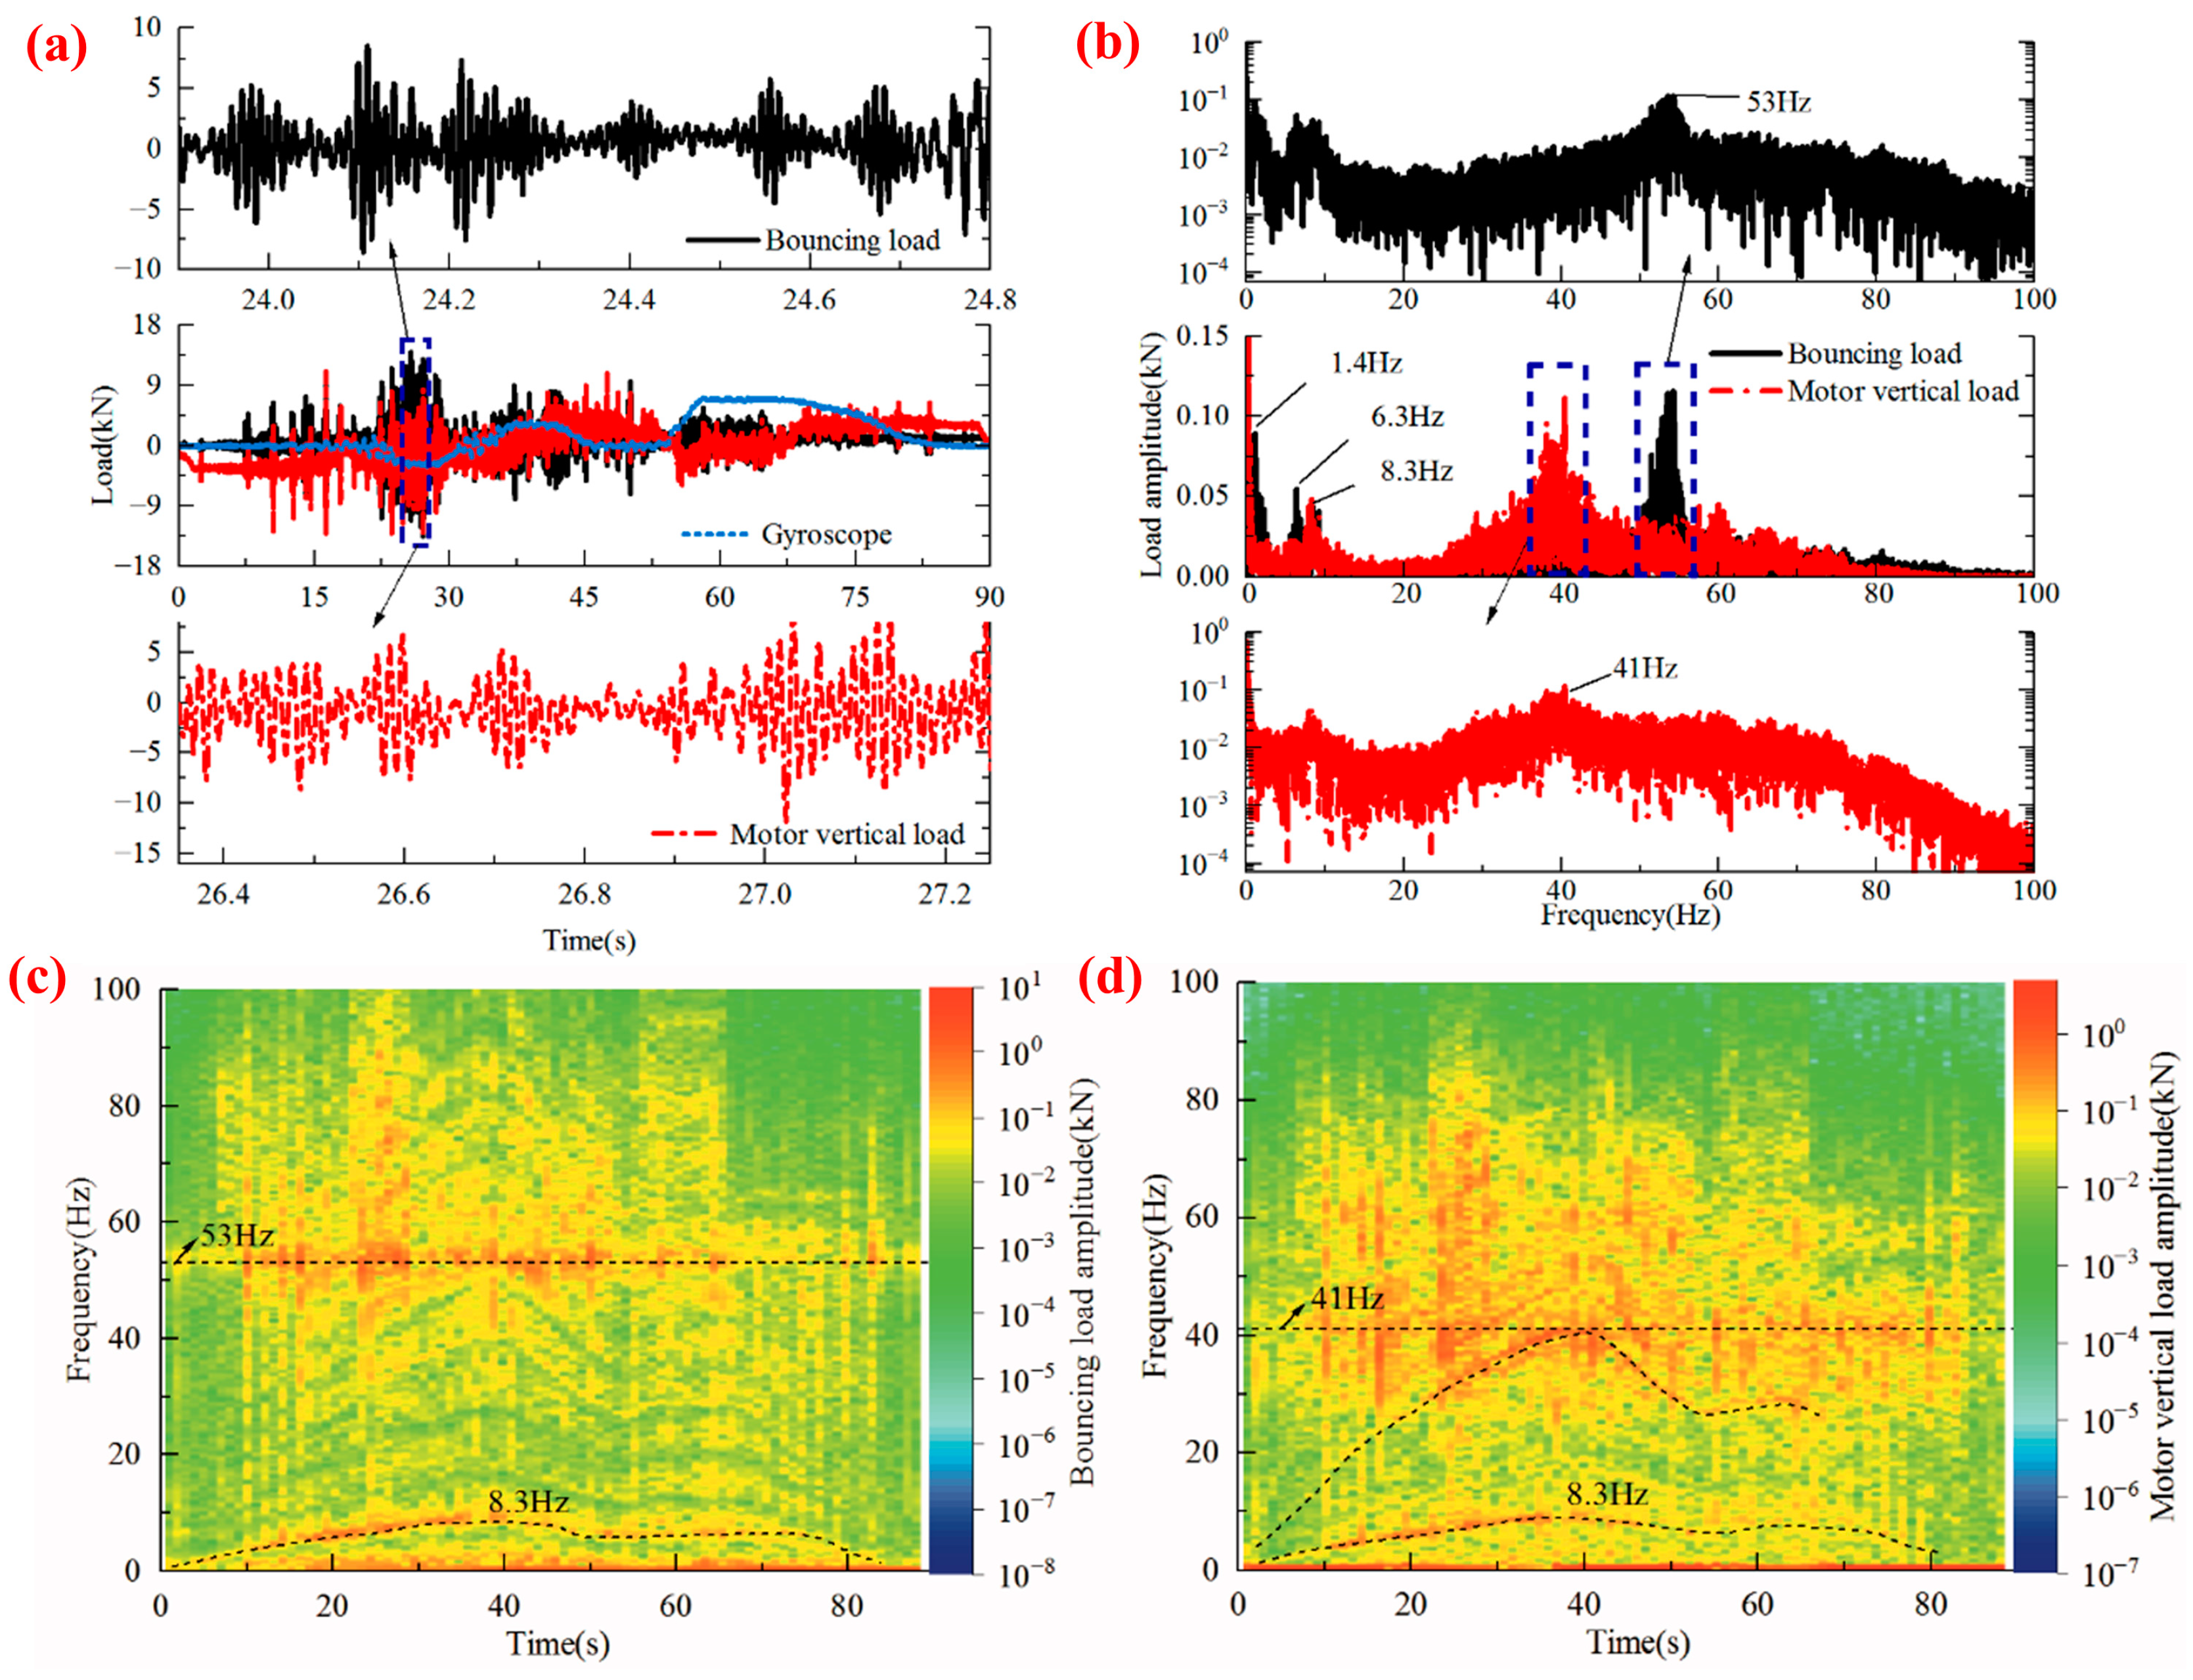
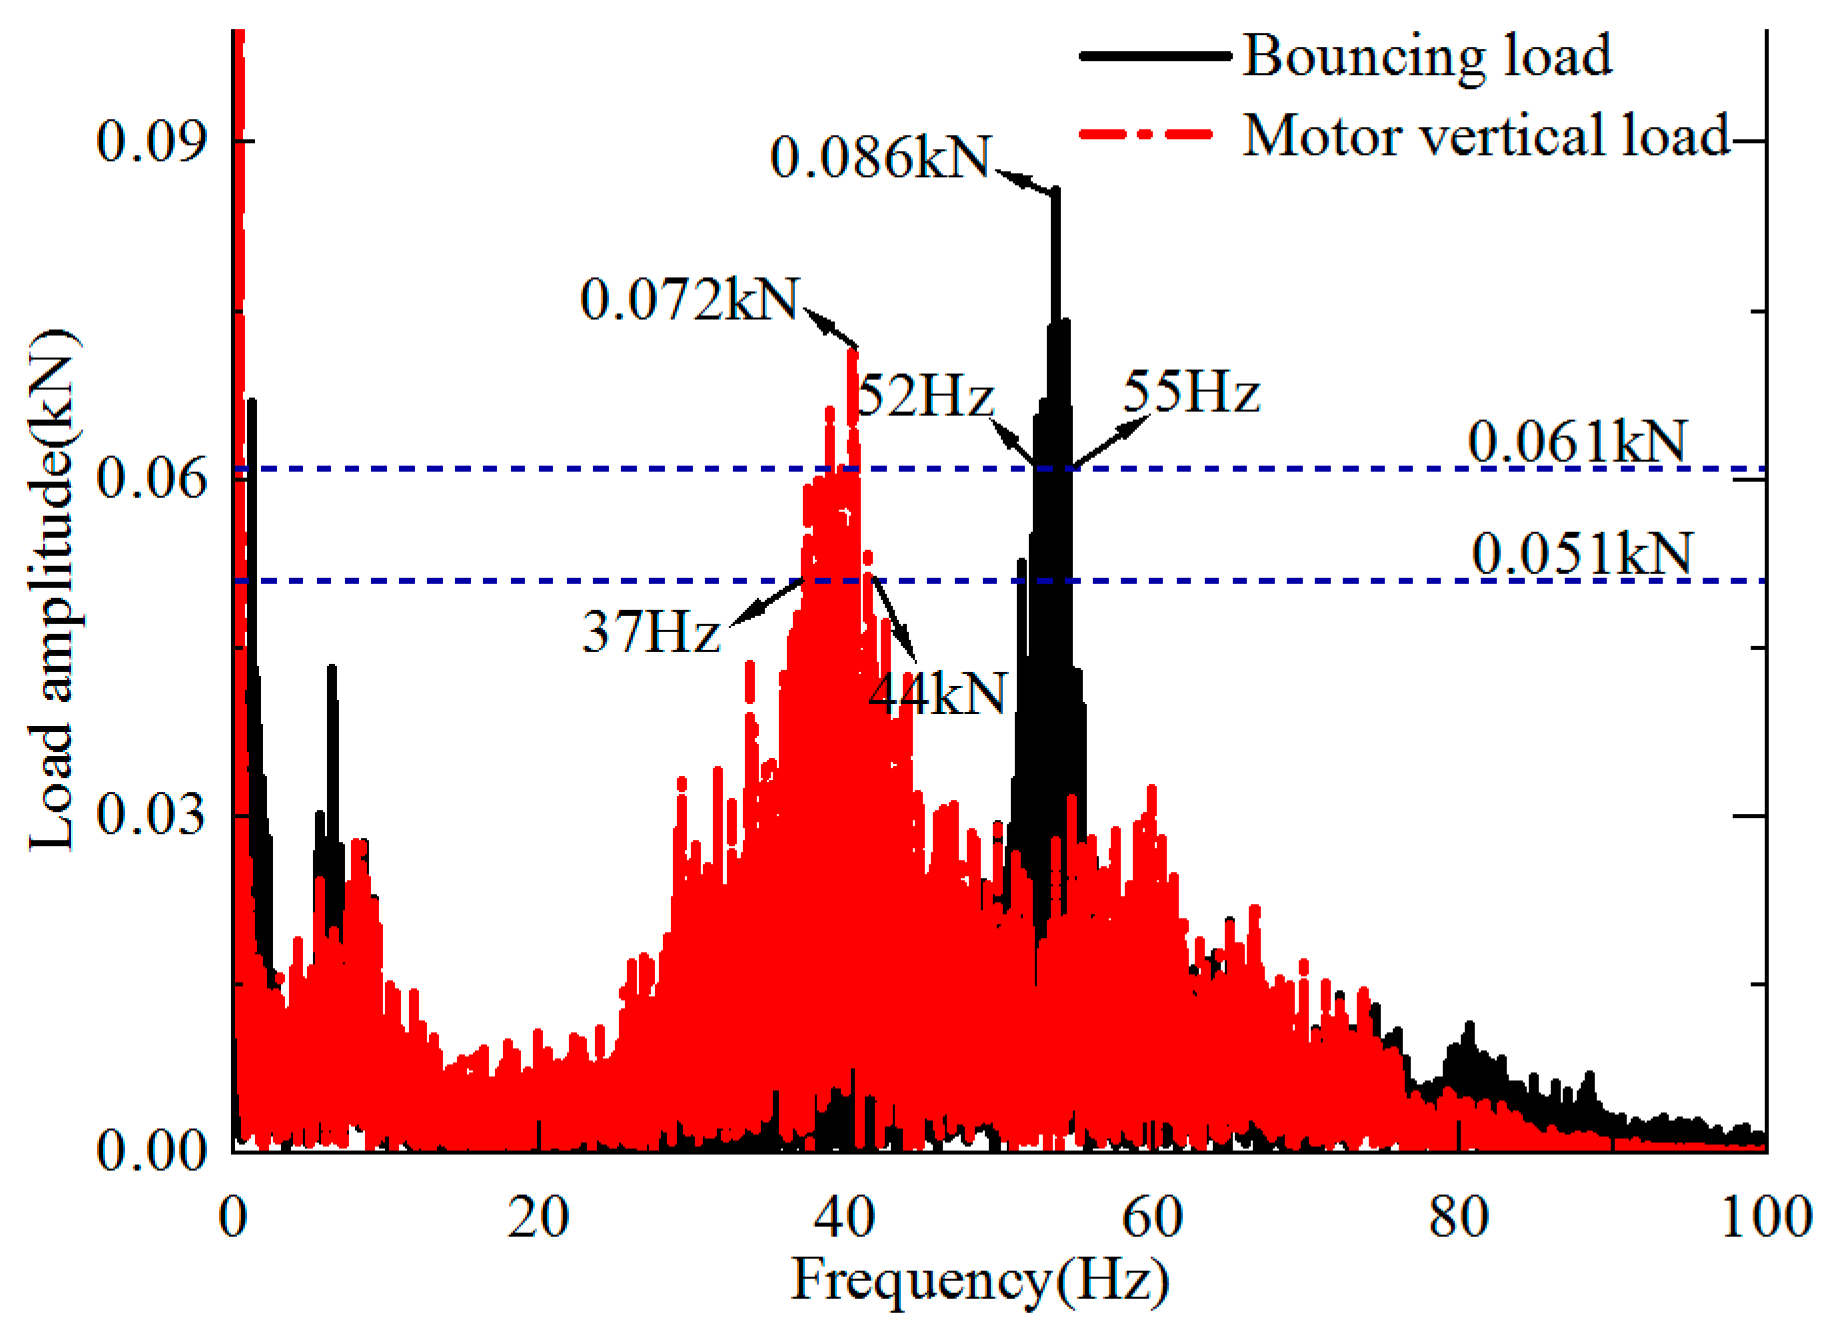
The load amplitudes near the resonant modes were quantized directly in the frequency domain by the second-order system, and the key parameters to quantify the load amplitude components were obtained as the damping and frequency ratios. The low-order modal damping ratios of the frame were determined based on the least-squares complex frequency domain method (first order: 1.96%; second order: 1.77%), and the resonance influence ranges were delineated based on the half-power bandwidths of the load amplitudes (bouncing load: 51–55 Hz; motor vertical load: 37–45 Hz);
(3)
The fatigue key point stress calculated using the processed load was consistent with the overall trend of the measured stress in the time-frequency domain, and the overall ratio of the equivalent stress amplitude was between 0.8 and 1.1. The degree of change in the amplitude of the treated bouncing load and the tested bouncing acceleration in the resonance region between 51 and 55 Hz were in good agreement. The results verify the effectiveness of the load amplitude component optimization method;
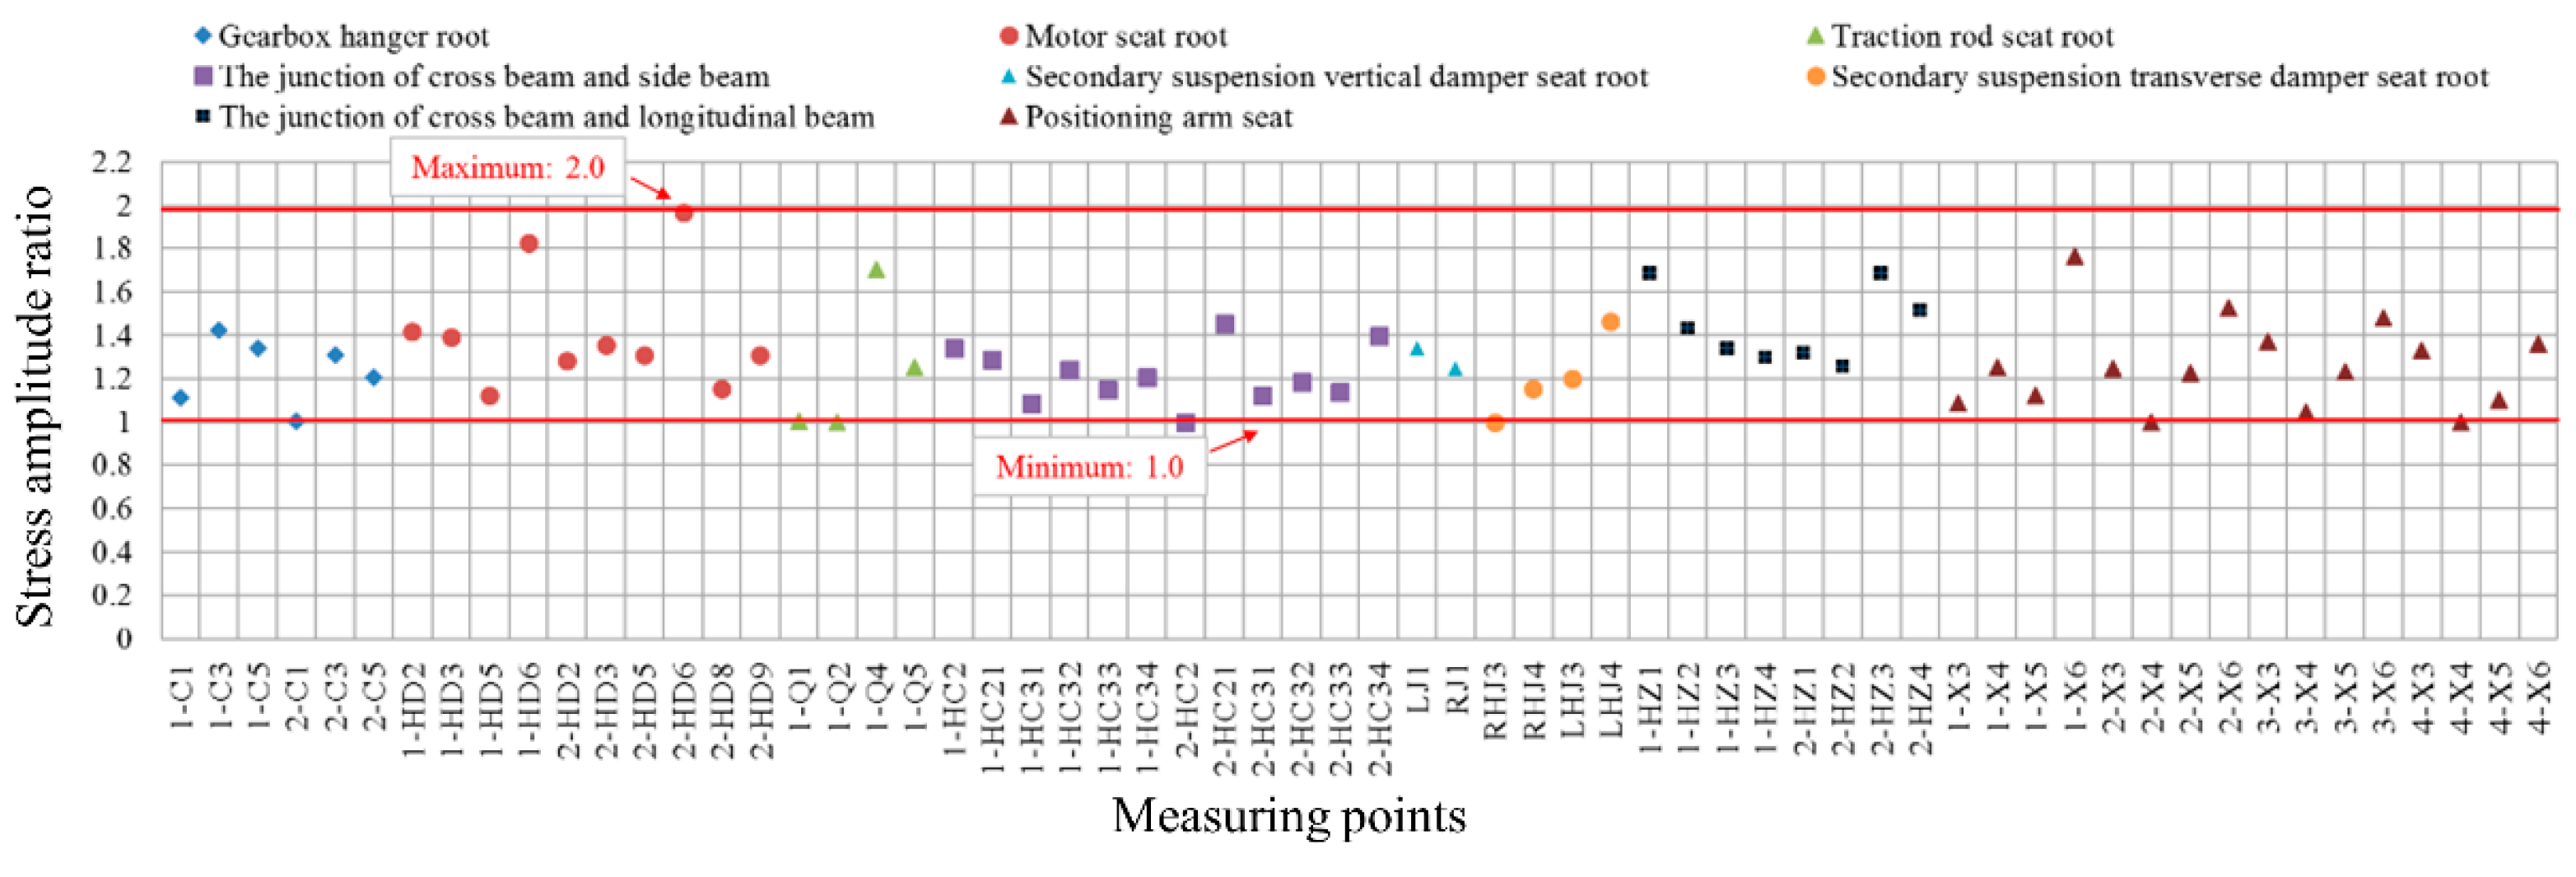
(4)
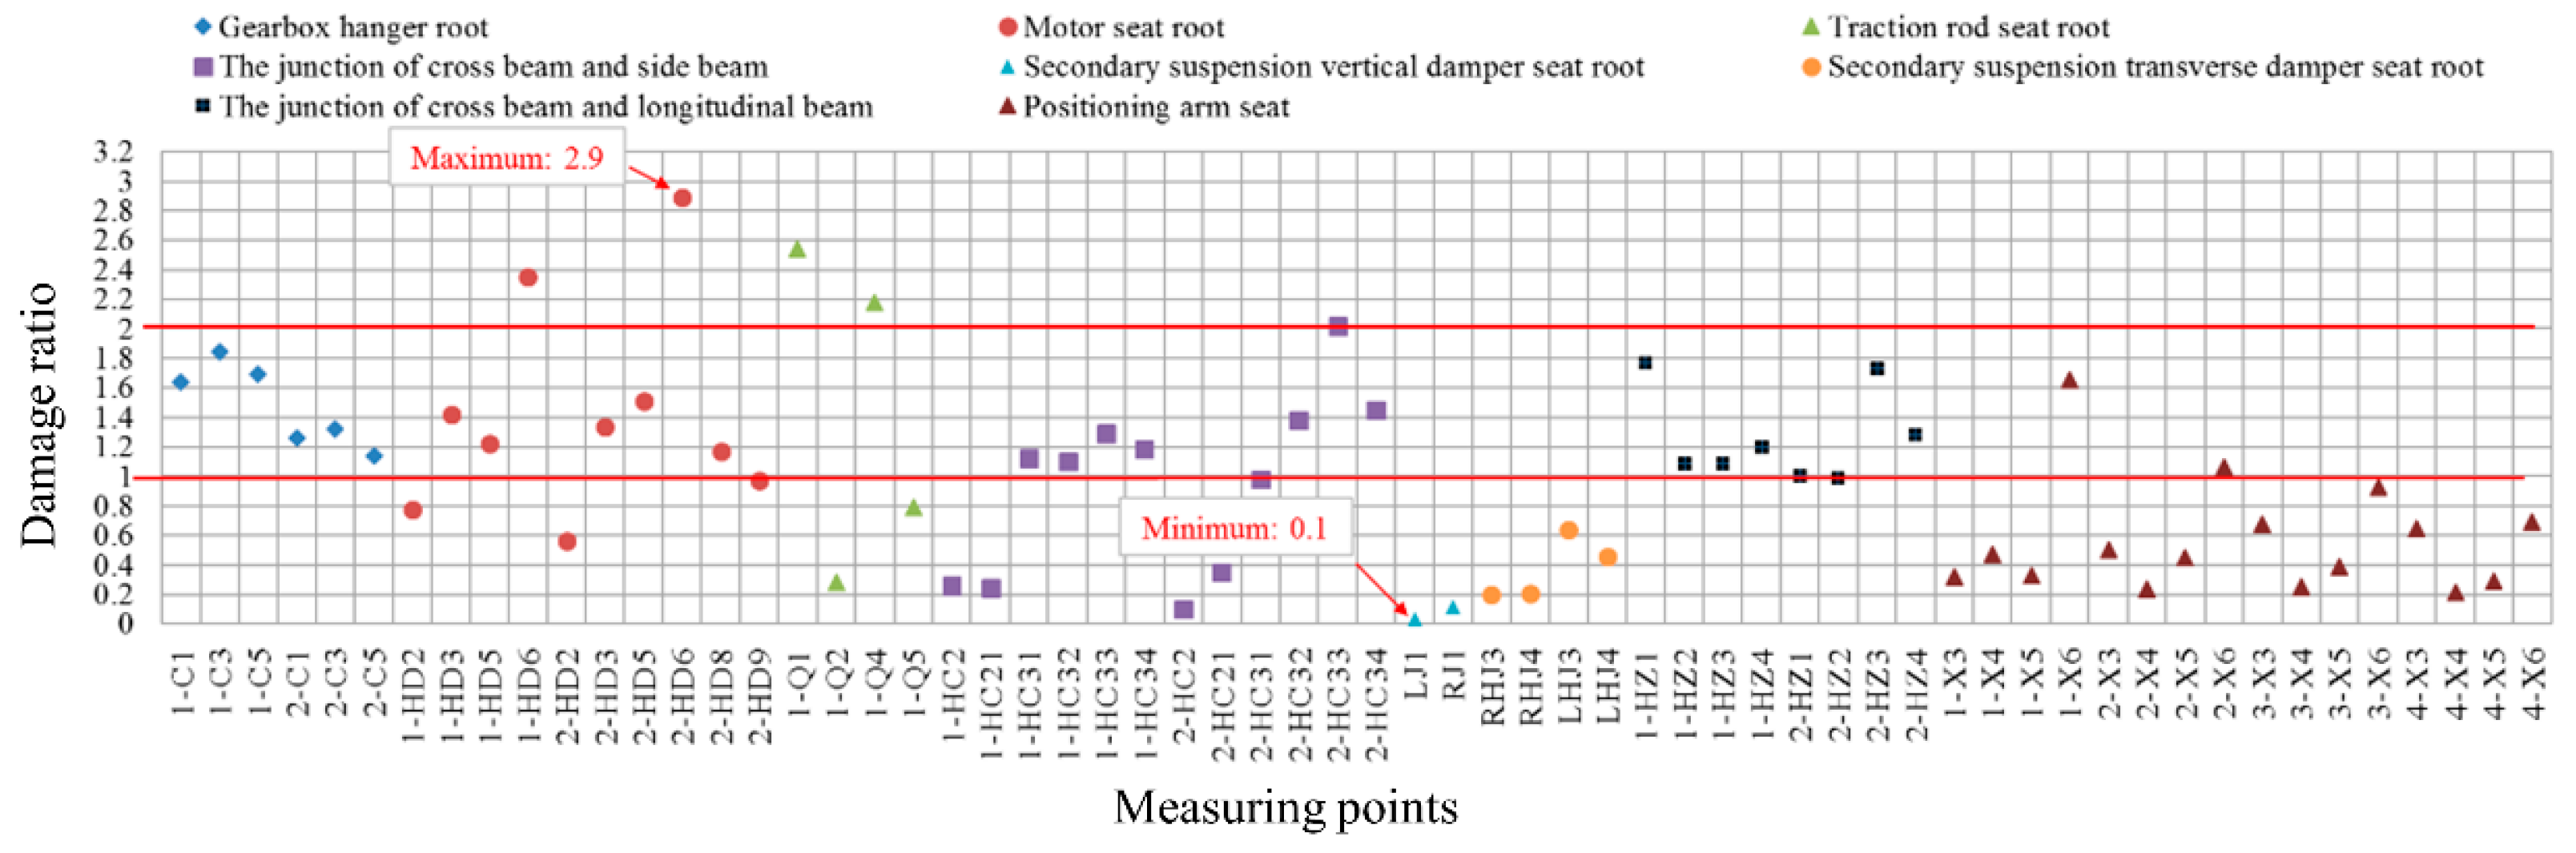
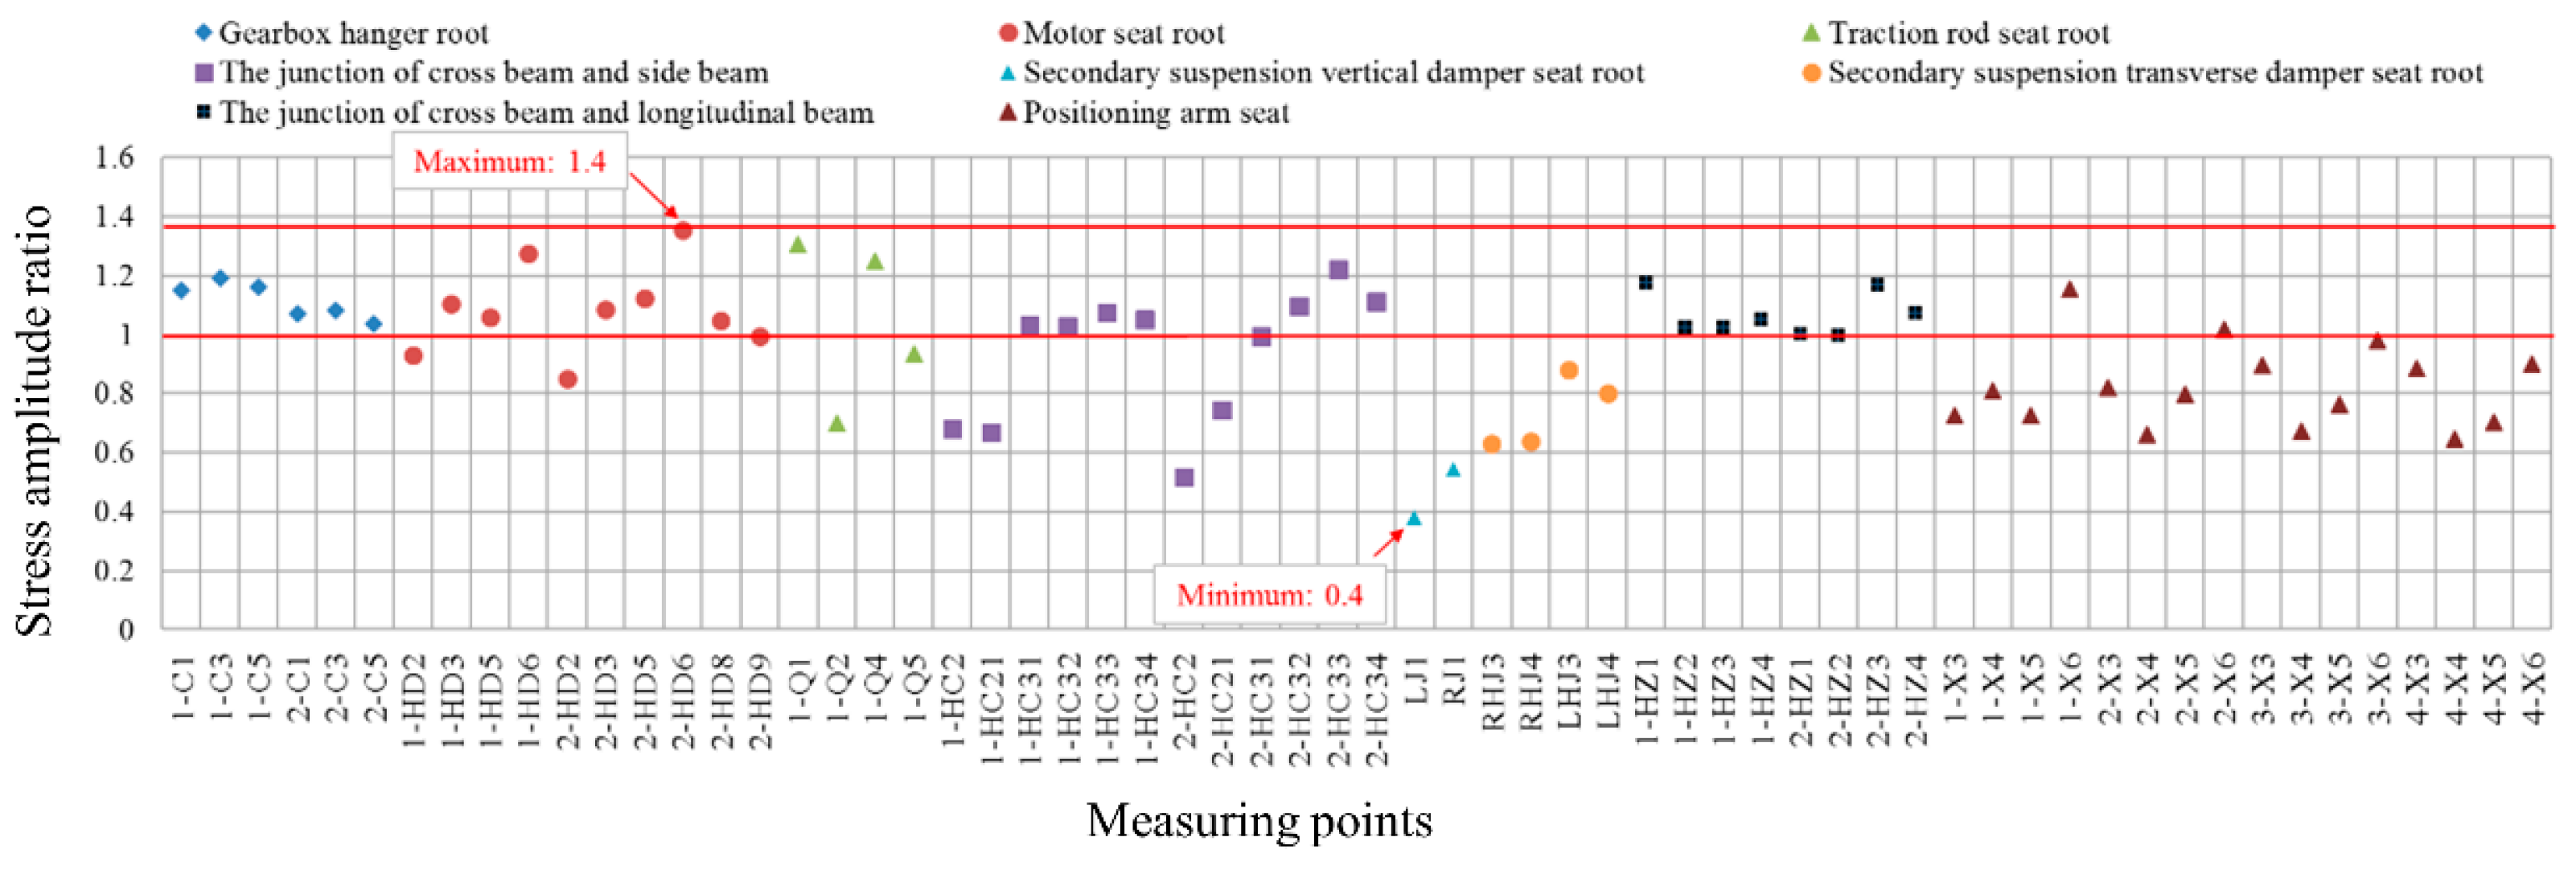
The measured load was directly used for the damage assessment of all fatigue key points of the frame, which could easily lead to the poor fatigue reliability of the frame. Based on the multi-objective optimization of the genetic algorithm, the damage consistency calibration load was obtained. The equivalent stress amplitude of all fatigue key points of the frame was calculated using the calibration load. Finally, the ratio of the equivalent and measured stress amplitude of the frame was found to be in the range of 1.0–2.0, which fulfilled the requirements of designing the reliability and fatigue assessment of the frame.

Author Contributions

Conceptualization, Y.W.; methodology, Y.W.; software, Y.W.; writing—original draft preparation, Y.W.; resources, Z.R.; writing—review and editing, Z.R.; funding acquisition, Z.R. All authors have read and agreed to the published version of the manuscript.

Funding

This work was supported by Key Program of National Natural Science Foundation of China (U2368215).

Data Availability Statement

The data will be made available upon request.

Conflicts of Interest

The authors declare that they have no known competing financial interests or personal relationships that could have appeared to influence the work reported in this paper.

References

  1. EN 13749; Railway Applications—Wheelsets and Bogies—Method of Specifying the Structural Requirements of Bogie Frames. CEN: Brussels, Belgium, 2011.
  2. UIC 615-4; Ed. 2: Motive Power Units—Bogies And Running Gear—Bogie Frame Structure Strength Tests. UIC: Paris, France, 2003.
  3. JIS E4207:2004; Test Methods of Static Load for Truck Frames and Truck Bolsters of Railway Rolling Stock. Standards Association: Tokyo, Japan, 2004.
  4. Zhang, Z.; Ru, C.; Li, Q. Study on a novel field-measured load calibration method for the life assessment of the metro bogie frame. Eng. Fail. Anal. 2022, 136, 106209. [Google Scholar] [CrossRef]
  5. Wang, B.J.; Li, Q.; Ren, Z.S.; Sun, S.G. Improving the fatigue reliability of metro vehicle bogie frame based on load spectrum. Int. J. Fatigue 2020, 132, 105389. [Google Scholar] [CrossRef]
  6. Yuan, Z.; Chen, X.; Ma, L.; Li, Q.; Sun, S.; Wei, Y. A segmented load spectrum model for high-speed trains and its inflection stress as an indicator for line quality. Int. J. Fatigue 2021, 148, 106221. [Google Scholar] [CrossRef]
  7. Li, J.; Ren, Z.; Wu, Y.; An, R. Fatigue damage assessment of high-speed train bogie frame load spectra based on phase reconstruction. Eng. Fail. Anal. 2024, 159, 108008. [Google Scholar] [CrossRef]
  8. Liu, R.; Dobriban, E.; Hou, Z.; Qian, K. Dynamic Load Identification for Mechanical Systems: A Review. Arch. Comput. Methods Eng. 2022, 29, 831–863. [Google Scholar] [CrossRef]
  9. Wang, J.; Wang, C.; Zhong, B.; Wang, T.; Guo, W.; Chen, W.; Sun, C. Uncorrelated multi-sources load identification in frequency domain based on improved Tikhonov regularization method. Int. J. Appl. Electromagn. Mech. 2016, 52, 983–990. [Google Scholar] [CrossRef]
  10. Gou, J.; Guo, W.; Wang, C.; Luo, W. A multi-strategy improved particle swarm optimization algorithm and its application to identifying uncorrelated multi-source load in the frequency domain. Neural Comput. Appl. 2017, 28, 1635–1656. [Google Scholar] [CrossRef]
  11. Gupta, D.K.; Dhingra, A.K. Input load identification from optimally placed strain gages using D-optimal design and model reduction. Mech. Syst. Signal Process. 2013, 40, 556–570. [Google Scholar] [CrossRef]
  12. Sun, Y.; Luo, L.; Chen, K.; Qin, X.; Zhang, Q. A time-domain method for load identification using moving weighted least square technique. Comput. Struct. 2020, 234, 106254. [Google Scholar] [CrossRef]
  13. Li, K.; Liu, J.; Han, X.; Jiang, C.; Zhang, D. Distributed dynamic load identification based on shape function method and polynomial selection technique. Inverse Probl. Sci. Eng. 2017, 25, 1323–1342. [Google Scholar] [CrossRef]
  14. Feng, W.; Li, Q.; Lu, Q. Force localization and reconstruction based on a novel sparse Kalman filter. Mech. Syst. Signal Process. 2020, 144, 106890. [Google Scholar] [CrossRef]
  15. Feng, W.; Li, Q.; Lu, Q.; Wang, B.; Li, C. Time domain force localization and reconstruction based on hierarchical Bayesian method. J. Sound Vib. 2020, 472, 115222. [Google Scholar] [CrossRef]
  16. Yang, H.; Jiang, J.; Chen, G.; Zhao, J. Dynamic load identification based on deep convolution neural network. Mech. Syst. Signal Process. 2023, 185, 109757. [Google Scholar] [CrossRef]
  17. Zhou, J.M.; Dong, L.; Guan, W.; Yan, J. Impact load identification of nonlinear structures using deep Recurrent Neural Network. Mech. Syst. Signal Process. 2019, 133, 106292. [Google Scholar] [CrossRef]
  18. Wang, W.; Yan, L.; Wang, T.; Guan, S.; Zhang, C.; Zhang, Y.; Wang, D. Dynamic Load Identification Method of Rock Roadheader Using Multi Neural Network and Evidence Theory. In Proceedings of the 2016 IEEE International Conference on Mechatronics and Automation, Harbin, China, 7–10 August 2016; pp. 1238–1243. [Google Scholar]
  19. Tian, M.; Wang, W.; Song, L.; Song, Y.; Yan, L.; Xia, Y. A Dynamic Load Identification Method for Rock Roadheaders Based on Wavelet Packet and Neural Network. In Proceedings of the 2015 10th IEEE Conference on Industrial Electronics and Applications, Auckland, New Zealand, 15–17 June 2015; pp. 672–676. [Google Scholar]
  20. Ji, C.; Sun, S.; Li, Q.; Wang, W.; Ren, Z.; Yang, G. A novel method for the general application of measured load spectra to different high-speed train bogie frames based on virtual track irregularity. Measurement 2022, 198, 111369. [Google Scholar] [CrossRef]
  21. Ji, C.; Sun, S.; Li, Q.; Ren, Z.; Yang, G. Realistic fatigue damage assessment of a high-speed train bogie frame by damage consistency load spectra based on measured field load. Measurement 2020, 166, 108164. [Google Scholar] [CrossRef]
  22. Zou, H.; Sun, S.; Li, Q.; Ren, Z. Analysis of the Load-Stress Response Characteristics of the Bogie Frame in Intercity Electric Multiple Unit. Chin. J. Mech. Eng. 2018, 31, 26. [Google Scholar] [CrossRef]
  23. Ma, S.; Sun, S.; Wang, B.; Wang, N. Estimating load spectra probability distributions of train bogie frames by the diffusion-based kernel density method. Int. J. Fatigue 2020, 132, 105352. [Google Scholar] [CrossRef]
  24. Ma, S.; Sun, S.; Jin, X.; Wang, N.; Wang, B. Reduction of Modal Vibration Effect in Load Identification of a Train Bogie Frame, IOP conference series. Earth Environ. Sci. 2021, 692, 22100. [Google Scholar] [CrossRef]
  25. Zeng, J.; Wu, P.; Hao, J. Analysis of vertical vibration reduction for railway vehicle systems. Zhongguo Tie Dao Ke Xue 2006, 27, 62. [Google Scholar]
  26. Maamar, A.; Abdelghani, M.; Le, T.; Gagnol, V.; Sabourin, L. Operational modal identification in the presence of harmonic excitation. Appl. Acoust. 2019, 147, 64–71. [Google Scholar] [CrossRef]
  27. Feng, K.; Ji, J.C.; Zhang, Y.; Ni, Q.; Liu, Z.; Beer, M. Digital twin-driven intelligent assessment of gear surface degradation. Mech. Syst. Signal Process. 2023, 186, 109896. [Google Scholar] [CrossRef]
  28. Zhou, Y.; Wang, X.; Que, H.; Guo, R.; Lin, X.; Jin, S.; Wu, C.; Hou, Y. Torque effect on vibration behavior of high-speed train gearbox under internal and external excitations. Railw. Eng. Sci. 2024, 32, 229–243. [Google Scholar] [CrossRef]
  29. Zhu, N.; Sun, S.; Li, Q.; Zou, H. Theoretical research and experimental validation of elastic dynamic load spectra on bogie frame of high-speed train. Chin. J. Mech. Eng. 2016, 29, 498–506. [Google Scholar] [CrossRef]
  30. Zhu, N.; Sun, S.; Li, Q.; Zou, H. Theoretical research and experimental validation of quasi-static load spectra on bogie frame structures of high-speed trains. Acta Mech. Sin. 2014, 30, 901–909. [Google Scholar] [CrossRef]
Figure 1. Fatigue cracks on the bogie frame.
Machines 13 00306 g001
Figure 2. Structure and load series of a metro vehicle bogie frame.
Machines 13 00306 g002
Figure 3. (a) Finite element modeling for the frame; (b) load and acceleration measurement points; and (c) dynamic stress measurement points.
Machines 13 00306 g003
Figure 4. Load and stress loading calibration tests. (a) Calibration of the overall frame vertical load; (b) transverse load; (c) gearbox vertical load; (d) motor vertical load; and (e) brake load.
Machines 13 00306 g004
Figure 5. Development process of the multi-physical parameter synchronous acquisition test system. (a) Metro vehicle under test; (b) components used to develop the force measurement frame; (c) sensors employed in the test; (d) data acquisition equipment and control systems; and (e) gateway and remote data acquisition system.
Machines 13 00306 g005
Figure 6. Load time-frequency domain signals. (a) Load signals of the frame subjected to beat vibrations; (b) amplitude spectrum of the load signals; and short-time Fourier transform of the (c) bouncing and (d) motor vertical loads.
Machines 13 00306 g006
Figure 7. Resonance frequency band division based on the half-power bandwidth method.
Machines 13 00306 g007
Figure 8. Load optimization effect. (a) Measured and treated load time-frequency domain signal; (b) load and acceleration frequency domain signals; (c) fatigue key point prediction and measured results; and (d) calculated and measured equivalent stress.
Machines 13 00306 g008
Figure 9. Ratio of damage calculated using load spectrum to actual damage.
Machines 13 00306 g009
Figure 10. Ratio of equivalent stress amplitude calculated using load spectrum to actual equivalent stress amplitude.
Machines 13 00306 g010
Figure 11. Ratio of the equivalent stress amplitude calculated using the load spectrum after calibration to the actual equivalent stress amplitude.
Machines 13 00306 g011
Table 1. MVL decoupling degree.
Load TypeNominal Value (kN) ε i ,   ε j ( 10 6   μ ε kN 1 ) γ ij / %
Bouncing load100.10.1
Roll load50.30.1
Twist load20.60.1
Transverse load350.30.8
Lozenging load140.30.3
Motor vertical load32.539.4100
Motor transverse load25.80.40.8
Gearbox vertical load29.40.51.1
Longitude load23.91.83.4
Brake load8.50.50.3
Anti-roll bar load1700
Primary vertical damper load200
Secondary vertical damper load0.80.20.1
Secondary transverse damper load1.600
Table 2. Constrained modes of the first eight orders of the bogie frame.
Modal OrderModal FrequencyVibration Pattern
Mode 141Frame twist
Mode 251Reverse twist of frame
Mode 373Sagging of frame side beams
Mode 478Alternate coaxial sides of the frame deformed inward and outward
Mode 579Lozenging deformation
Mode 683Reverse transverse bending of frame side beams
Mode 795Same direction transverse bending of frame side beams
Mode 8102First-order sag bends in the same direction and first-order transverse bends in the opposite direction of the frame side beams
Table 3. Acceleration point locations.
Measuring PointInstallation LocationQuadrant Description
A01Bogie frameQuadrant1
A02Bogie frameQuadrant2
A03Bogie frameQuadrant3
A04Bogie frameQuadrant4
A05Air spring seatAir spring seat near frame quadrant 1
A06Air spring seatAir spring seat near frame quadrant 3
B01Brake seatBrake seat near frame quadrant 1
B02Brake seatBrake seat near frame quadrant 2
B03Brake seatBrake seat near frame quadrant 3
B04Brake seatBrake seat near frame quadrant 4
M01MotorAbove the motor mass center near frame quadrant 2
M02MotorAbove the motor mass center near frame quadrant 4
G01GearboxGearbox near frame quadrant 1
G02GearboxGearbox near frame quadrant 3
Table 4. Calibration coefficient of each load spectrum.
Load SpectrumBCLROLTWLTRLLZLMVLMTL
Calibration coefficient1.71.20.50.52.00.55.0
Load SpectrumGELLOLBRLARLPVDLSVDLSTDL
Calibration coefficient1.40.60.52.65.04.81.1
Disclaimer/Publisher’s Note: The statements, opinions and data contained in all publications are solely those of the individual author(s) and contributor(s) and not of MDPI and/or the editor(s). MDPI and/or the editor(s) disclaim responsibility for any injury to people or property resulting from any ideas, methods, instructions or products referred to in the content.

