Article

Performance Analysis and Optimization of a Bio-Inspired Spider-Web-Shaped Energy Absorbing Component for Legged Landers

1
School of Mechanical and Materials Engineering, North China University of Technology, Beijing 100144, China
2
Beijing Institute of Astronautical Systems Engineering, China Academy of Launch Vehicle Technology, Beijing 100076, China
3
Beijing Spacecrafts, China Academy of Space Technology, Beijing 100094, China
4
School of Mechanical Engineering, University of Science and Technology Beijing, Beijing 100083, China
5
School of Mechanical Engineering and Automation, Beihang University, Beijing 100191, China
*
Author to whom correspondence should be addressed.
Machines 2025, 13(11), 1035; https://doi.org/10.3390/machines13111035 (registering DOI)
Submission received: 3 October 2025 / Revised: 29 October 2025 / Accepted: 5 November 2025 / Published: 8 November 2025
(This article belongs to the Section Machine Design and Theory)

Abstract

Inspired by the structural characteristics of natural spider webs, a simplified configuration composed of multi-layer regular polygons was developed to design a novel energy absorbing component for legged landers. To investigate its compressive energy-absorption behavior, a parameterized finite element model (FEM) was established. By integrating optimized Latin hypercube experimental design with the FEM, the energy absorption characteristics under varying structural parameters were evaluated. Based on the FEM results, response surface methodology was employed to construct surrogate models that capture the mapping relationships between design parameters and performance indices. Using these surrogate models, the energy-absorbing component was optimized under three different ranges of average buffering force. Three optimized components with distinct average buffering forces were selected and connected in series, and their force–displacement responses during compression were computed through finite element simulations. The obtained response curves were incorporated into a multibody dynamics model of a Mars lander to verify performance, demonstrating that the lander can achieve effective soft landing.

1. Introduction

With the rapid advancement of science and technology, human exploration is no longer confined to Earth. Probing the Moon, Mars, and even more distant planets has become one of the major frontiers in contemporary scientific research. In extraterrestrial exploration missions, the safe delivery of robotic probes to planetary surfaces is a critical stage [1,2]. A review of past missions worldwide shows that legged landers are widely employed to achieve soft landings, such as the U.S. Apollo Lunar Module, China’s Chang’e-3 lunar probe, NASA’s Viking 2 Mars lander, and NASA’s Phoenix Mars lander. As a landing system with relatively high reliability, the legged lander requires continuous innovation and research.
One of the key research focuses in legged lander development is the design of the energy-absorbing system, in which the choice of energy-absorbing components directly determines the overall performance [3]. At present, metallic porous materials are commonly used as fillers for the energy absorbers in legged landers—for example, aluminum honeycomb and aluminum foam. These materials primarily dissipate the impact energy generated during the landing process through plastic deformation [4,5]. Extensive studies have been carried out on the energy absorption characteristics of metallic porous materials. For instance, Li, Liaghat and Hong et al. [6,7,8] combined theoretical analysis and experimental validation to investigate the energy absorption behavior of hexagonal honeycomb materials under out-of-plane compression. Li et al. [9] employed finite element methods to compare the energy absorption properties of hexagonal and staggered square honeycombs under out-of-plane loading, and they further optimized their performance using response surface methodology. Deng, Hu and Han et al. [10,11,12,13] examined honeycombs with triangular, staggered triangular, square, staggered square, hexagonal, and star-shaped topologies, analyzing their compressive energy absorption behaviors. In addition, Zhang, Luo and Zeng et al. [14,15,16] investigated the buffering performance of metal foams and lattice structures through crushing experiments and finite element simulations. Liang et al. [17] integrated simulation data from finite element models of honeycomb compression into a single-leg dynamic model of a lander, and they validated the simulation against single-leg drop tests. Li and Chen et al. [18,19] further proposed equivalent finite element modeling approaches for honeycomb absorbers in landers, incorporating the simulation results into full-vehicle dynamics models to evaluate soft-landing performance.
To expand the design paradigm for energy absorbers in legged landers, bio-inspired design strategies can be introduced. In nature, spider webs are capable of dispersing the impact of high-speed intrusions, such as insects, across the entire web, thereby achieving efficient buffering. In this study, a novel energy-absorbing component was innovatively designed by mimicking the structural characteristics of spider webs. Through parametric finite element modeling, optimized Latin hypercube sampling, and the response surface method, a mapping model between structural parameters and performance was established. Based on this model, three components with different buffering capacities were optimized. Finally, these components were creatively connected in series to construct a hierarchical buffering system, and dynamic simulations verified that the proposed system can effectively achieve soft landing for a Mars lander.

2. Configuration of the Bio-Inspired Spider-Web-Shaped Energy Absorber

The geometry of natural spider webs is highly complex, and due to manufacturing constraints, it is difficult to replicate their exact structural form. Therefore, in this study, the spider-web structure is simplified as follows:
  • The web is represented by n concentric layers of regular polygons. All polygons have the same number of edges, and the layers are defined sequentially from the innermost (Layer 1) to the outermost (Layer n).
  • All polygons lie in the same plane, share a common geometric center, and contain at least one pair of mutually parallel edges between adjacent layers.
  • Let the circumcircle radius of the i-th layer polygon be Ri (i ≥ 1), For the adjacent inner and outer layers, the radii are denoted as Ri−1 and Ri+1, respectively. With R0 ≡ 0, the difference in circumcircle radii between two adjacent layers is defined as the layer thickness, expressed as:
δ i = R i R i 1 δ i + 1 = R i + 1 R i
4.
The thickness of successive layers increases in a geometric progression, i.e., δi+1 = i, where c denotes the thickness ratio. According to this definition and the formula for a geometric sequence, the corresponding relationship among the radii can be derived.
R i = δ 1 ( 1 c i ) 1 c = R 1 ( 1 c i ) 1 c c 1 R i = i R 1 c = 1
5.
The polygons of adjacent layers are connected by line segments extended through the common geometric center, and all structural members of the web are assigned a uniform width.
Based on these rules, a simplified spider-web structure composed of three layers of regular hexagons is illustrated in Figure 1.
By extruding the above-described simplified spider-web cross-section along the out-of-plane direction, a spider-web-shaped energy absorber can be obtained, analogous to conventional honeycomb absorbers. A schematic of the absorber with three hexagonal layers is shown in Figure 2.

3. Performance Analysis of the Bio-Inspired Spider-Web-Shaped Energy Absorber

3.1. Parameterized FEM of the Energy Absorber

As discussed in Section 2, the spider-web-shaped energy absorber can be configured in numerous specifications. Considering its complex geometry and manufacturing challenges, experimental investigation of its buffering performance would incur high costs. Finite element analysis (FEA), with its advantages of high accuracy and ease of implementation, has therefore been widely employed in the study of the energy absorption behavior of thin-walled structures. In this work, the out-of-plane compression process of the spider-web-shaped energy absorber was simulated using ABAQUS 2019 software [17].
Due to the large number of possible configurations, multiple parameters must be considered in model construction. These include the thickness d of the metallic foil material, the number of polygon edges m per web layer, the number of layers n, the thickness ratio c between adjacent layers, the circumcircle radius R of the polygon, the overall absorber height h, and the material property parameters. Clearly, manually constructing finite element models for absorbers of different specifications would be highly time-consuming. To address this, a parameterized modeling program was developed in Python language, enabling automated generation of absorber models. The program performs geometry creation, finite element meshing, boundary condition assignment, and simulation of the out-of-plane compression process.
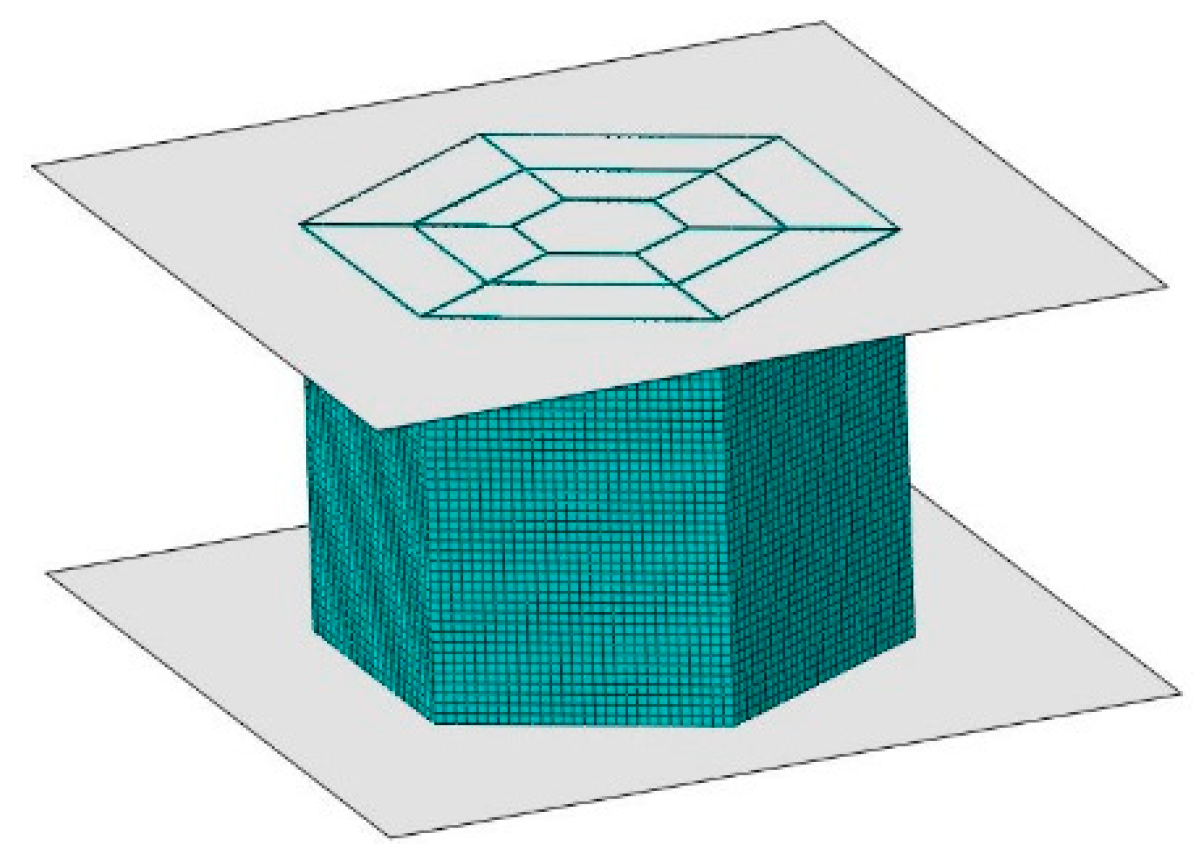
The FEM of the spider-web-shaped energy absorber generated using the parameterized modeling program is shown in Figure 3.
The FEM consists of two rigid plates positioned above and below the energy absorber. The lower rigid plate is fixed, with the absorber attached to it, while the upper plate moves downward at a constant velocity and stops once the prescribed compression stroke is reached, thereby simulating the out-of-plane compression process. The problem is solved using the explicit dynamic analysis method [17]. In the model, both the internal contacts of the absorber and the interactions between the absorber and the rigid plates are defined using the general contact algorithm in ABAQUS/Explicit. Friction between contact surfaces is modeled using the Coulomb friction law, with the dynamic friction coefficient set to 0.1.
In this study, aluminum alloy 3003-H18 is selected as the material for the spider-web-shaped energy absorber, and its material properties are listed in Table 1.

3.2. FEA of Buffering Performance

The spider-web-inspired energy-absorbing component described in this study can be applied to Mars landers, Moon landers, and other landing cushioning environments. Considering the dimensional constraints of the inner and outer cylinders of the supporting strut that houses the absorber, and to avoid instability during compression due to excessive length, the circumcircle radius of the outermost polygon is set as Rn = 28 mm, and the absorber height as h = 40 mm. Under these conditions, the design variables of the absorber include the number of polygon edges per layer (m), the number of layers (n), the thickness ratio (c) between adjacent layers, and the foil thickness (d) of the metallic material used in fabrication. According to Equation (2), the following relationship holds:
R 1 = R n ( 1 c ) 1 c n c 1 R 1 = R n n c = 1
According to Equations (2) and (3), the following relationship can be derived.
R i = R n ( 1 c i ) 1 c n c 1 R i = i R n n c = 1
Based on Equation (4), the cross-sectional geometry of the spider-web-shaped energy absorber for use in Mars landers can be determined. The ranges of the four design parameters—m, n, c, and d—are specified in Table 2.
In the design of energy absorbers for landers, the specific energy absorption (SEA) is commonly used to characterize the energy absorption capability of the component. SEA is defined as the energy absorbed per unit mass of the absorber, and its expression is given as follows [21]:
S AE = ʃ 0 l max F ( l ) d l M
In the above expression, M denotes the mass of the absorber, l represents the compression displacement, lmax is the prescribed compression stroke, and F(l) refers to the reaction force of the absorber at displacement l.
In addition to SAE, attention must also be given to the peak force (Fmax) and the average force (Fave) generated within the prescribed compression stroke. Appropriate values of Fmax and Fave ensure that the absorber provides sufficient energy dissipation without inducing destructive impact loads. The expression for Fave is given as follows:
F ave = ʃ 0 l max F ( l ) d l l max
To evaluate the buffering performance of the spider-web-shaped energy absorber, an optimized Latin hypercube sampling scheme was employed to extract 40 sample points within the parameter ranges specified in Table 2. These sample points were then substituted into the parameterized finite element model for compression simulations. In the simulations, the prescribed compression stroke lmax was set to two-thirds of the absorber height, i.e., 27 mm [22], and the total simulation time for the compression process was set to 10 ms. The simulations were performed using Abaqus 2019 on a computer equipped with an Intel Core i5-10500 CPU and 8 GB of RAM, with a typical computation time of approximately 2 h. The corresponding simulation results are summarized in Appendix A Table A1. Based on the analysis presented in this section, optimization of the spider-web-shaped energy absorber will be carried out in the subsequent sections, with the objective of achieving the best possible buffering performance.

4. Optimization of the Cushioning Performance of the Bio-Inspired Spider-Web Energy Absorber

4.1. Response Surface Surrogate Model

The optimization design of the bio-inspired spider-web energy absorber requires multiple iterations of optimization, whereas finite element simulations are highly time-consuming. If the FEM were directly employed for iterative optimization, the computational efficiency would be severely constrained. To address this issue, an incomplete fourth-order polynomial response surface model, as expressed in Equation (7), is adopted in this study to establish the mapping relationships of SAE, Fmax, and Fave with respect to the design variables m, n, c, and d. By substituting the surrogate response surface model for the FEM during optimization iterations, the computational efficiency can be significantly improved.
φ = β 0 + β 1 m + β 2 n + β 3 c + β 4 d + β 5 m 2       + β 6 n 2 + β 7 c 2 + β 8 d 2 + β 9 m n + β 10 m c       + β 11 m d + β 12 n c + β 13 n d + β 14 c d + β 15 m 3       + β 16 n 3 + β 17 c 3 + β 18 d 3 + β 19 m 4 + β 20 n 4       + β 21 c 4 + β 22 d 4
In Equation (7), φ denotes the estimated value of any of the three response variables, namely SAE, Fmax, or Fave, while βᵢ represents the coefficients of the polynomial terms. By substituting the input–output data of the 40 sample points obtained from the experimental design into Equation (7), the response surface model can be expressed in vector form, as given in Equation (8).
Y = X β + ε = Y ^ + ε
In Equation (8), X denotes the input variable matrix of the polynomial, β represents the column vector of the polynomial coefficients to be determined, Y ^ denotes the column vector of the output values of the sample points, represents the column vector of the estimated values of the response surface model, and ε represents the column vector of errors. The coefficient vector β can be obtained by applying the least-squares method, as expressed below [9,23].
β = ( X T X ) 1 X T Y
In this study, the root mean square relative error (RMSE) and the adjusted coefficient of determination (R2) are employed to evaluate the fitting accuracy of the response surface model with respect to the sample points, as expressed in Equations (10)–(12).
R MSE = i = 1 40 ( y i y ^ i ) 2 i = 1 40 y i
R 2 = 1 ξ × i = 1 40 ( y i y ^ i ) 2 i = 1 40 ( y i y ¯ ) 2
ξ = 40 1 40 ( n β 1 )
In Equations (10) and (11), yi denotes the output value of the sample point, y ^ i represents the corresponding estimated value obtained from the response surface model, and y ¯ i indicates the mean value of all yi. The term nβ denotes the number of polynomial terms in the response surface model. The correction factor ξ is introduced to eliminate the influence of the polynomial term count on the accuracy assessment [24]. A smaller RMSE approaching zero and an R2 value approaching unity indicate higher model accuracy.
To mitigate potential sources of error, such as polynomial oscillations caused by an excessive number of terms, a key-term screening strategy was adopted for the response surface model. Specifically, the polynomial terms were iteratively filtered, and 14 terms were retained to fit the sample points. The final expression of the response surface model was determined by selecting the combination of terms that yielded an R2 value closest to unity.
Based on this analysis, the approximate expressions of SAE, Fmax, and Fave were obtained, as expressed in Equations (13)–(15). The accuracy evaluation results of the response surface model are summarized in Table 3.
S AE = 7.4771 7.4555 × c + 8.9039 × n + 1133.1855 × d 2             2.7557 × n 2 + 2.1697 × d × m 0.7272 × c × m             + 4.2003 × c × n +   0.2752 × m × n 7985.8002 × d 3             + 0.0101 × m 3 + 0.1796 × n 3 + 18122.0470 × d 4             0.0006 × m 4
F max = 32458.3759 1756.7458 × d + 120522.3358 × c                 2.3570 × m + 19727.5827 × d 2 167242.4103 × c 2                 + 29.7388 × d × c + 5.2444 × d × m + 15.8082 × d × n                 + 1.9807 × c × m 96758.6335 d 3 + 102988.5079 c 3                 + 173036.6961 × d 4 + 23751.3722 × c 4
F ave = 18.6243 399.1204 × t + 3476.1694 × t 2               0.3947 × m + 0.5432 × n 2 + 7.9682 × t × m               + 17.2742 × t × n 0.0590 × c × m + 0.2449 × m × n               16608.9661 × t 3 + 0.0418 × m 3 + 0.0366 × n 3               + 30696.1589 × t 4 0.0015 × m 4
The results demonstrate that the response surface model can accurately capture the mapping relationships between SAE, Fmax, Fave and the design variables m, n, c and d.

4.2. Optimization of Buffering Performance

To achieve buffer components with optimal energy absorption performance, optimization methods are applied in the design process. In this study, the classification of buffer components is based on the value of the average buffering force Fave observed during compression. Accordingly, the components are categorized into three types: weak buffering, moderate buffering, and strong buffering. The corresponding ranges of Fave for these three categories are summarized in Table 4.
For each of the three categories of buffer components, optimization design is conducted with the dual objectives of maximizing the specific energy absorption SAE and minimizing the peak buffering force Fmax, while constraining the average buffering force Fave within the ranges specified in Table 4. Based on these considerations, the mathematical optimization models for weak, moderate, and strong buffering components are formulated as follows.
min F max max S AE s . t . F ave > 9 F ave < 12 x ( L ) < x < x ( U )
min F max max S AE s . t . F ave > 12 F ave < 15 x ( L ) < x < x ( U )
min F max max S AE s . t . F ave > 15 F ave < 18 x ( L ) < x < x ( U )
In Equations (16)–(18), “min” denotes minimization, “max” denotes maximization, and “s.t.” denotes “subject to”; x = (m, n, c, d)T represents the vector of design variables, while x(L) and x(U) denote the corresponding lower and upper bounds of the design variables, respectively.
The optimization problems are solved using the NSGA-II algorithm, with the algorithmic parameter settings provided in Table 5. The NSGA-II algorithm is an elitism-based multi-objective evolutionary algorithm that maintains population diversity and achieves global optimization through fast non-dominated sorting and crowding distance evaluation. Its main procedures include population initialization, fitness evaluation, selection, crossover, and mutation. This algorithm is adopted for its excellent convergence, uniform solution distribution, and high computational efficiency in solving complex multi-objective optimization problems.
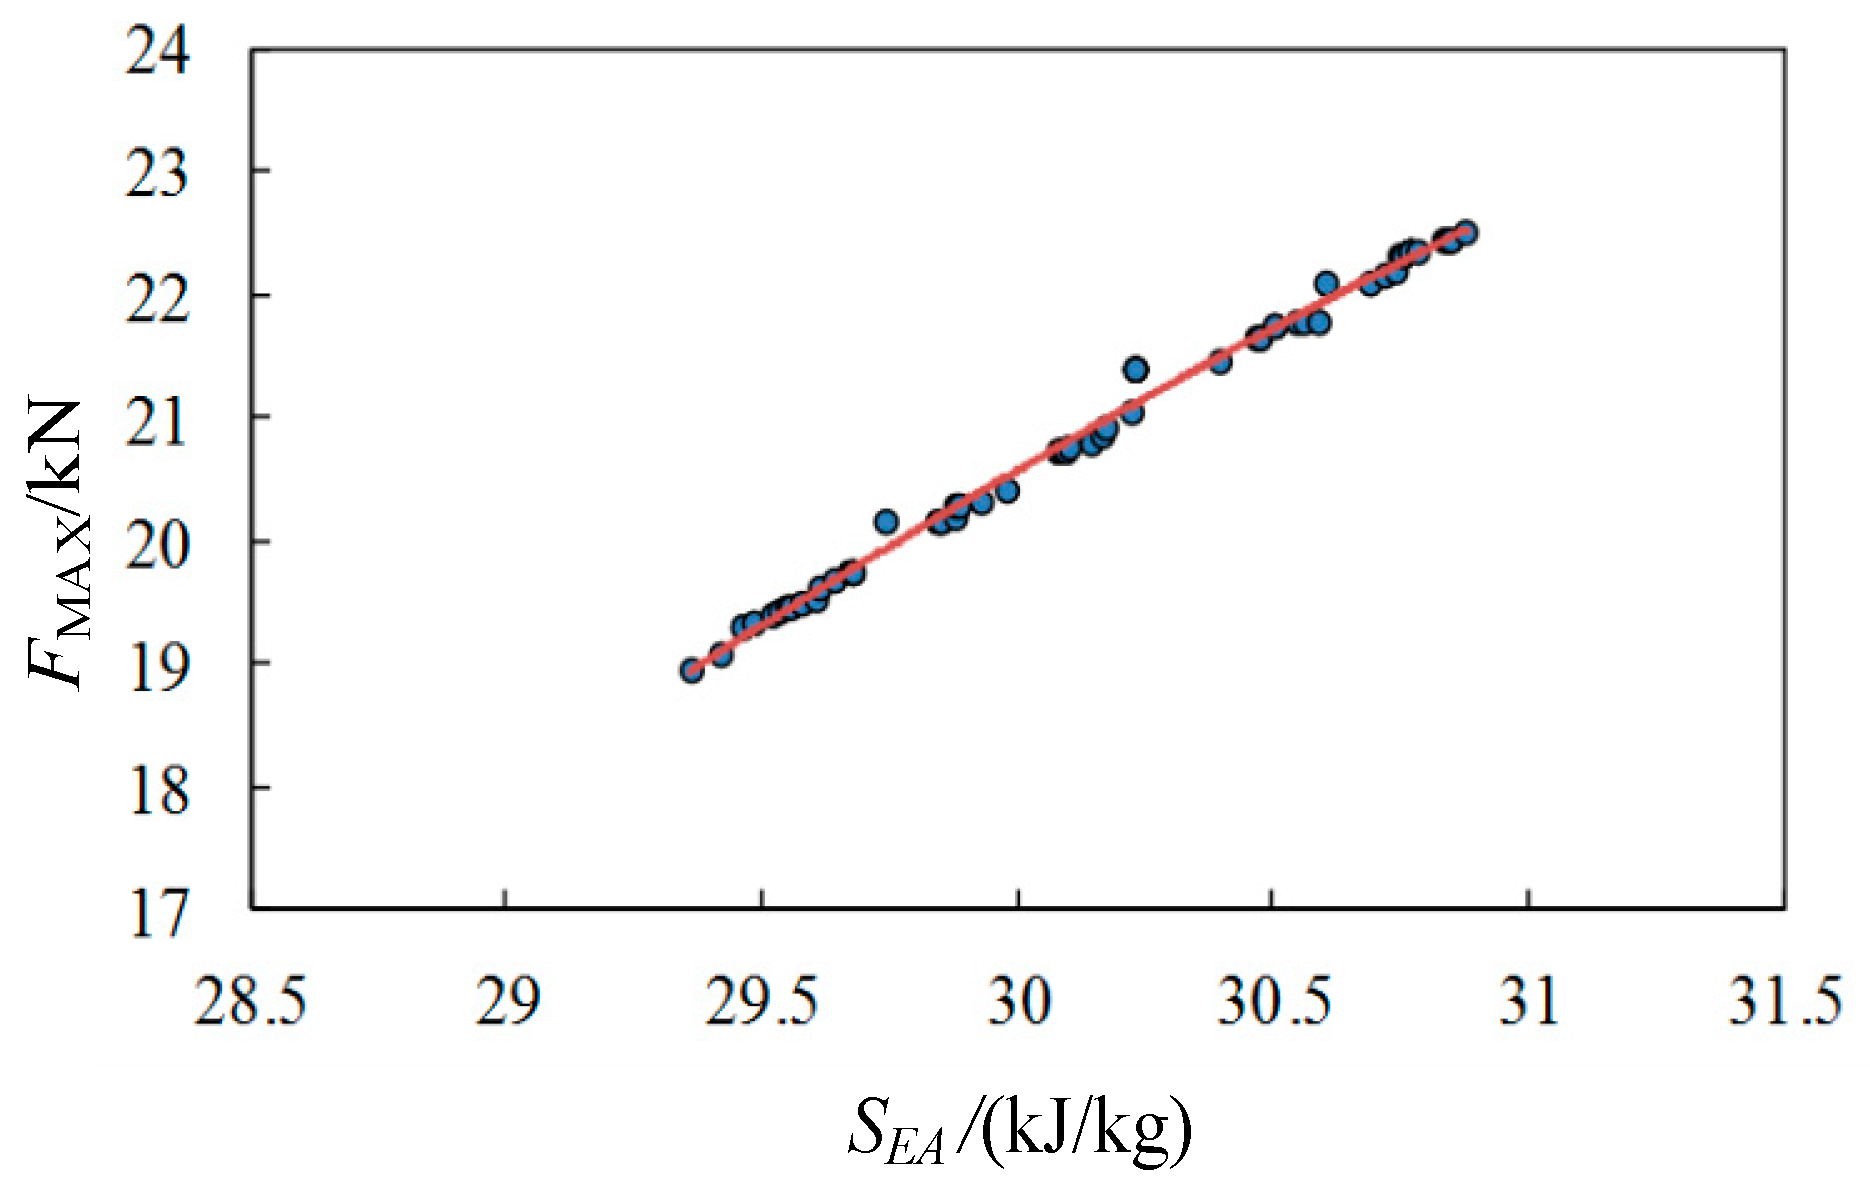
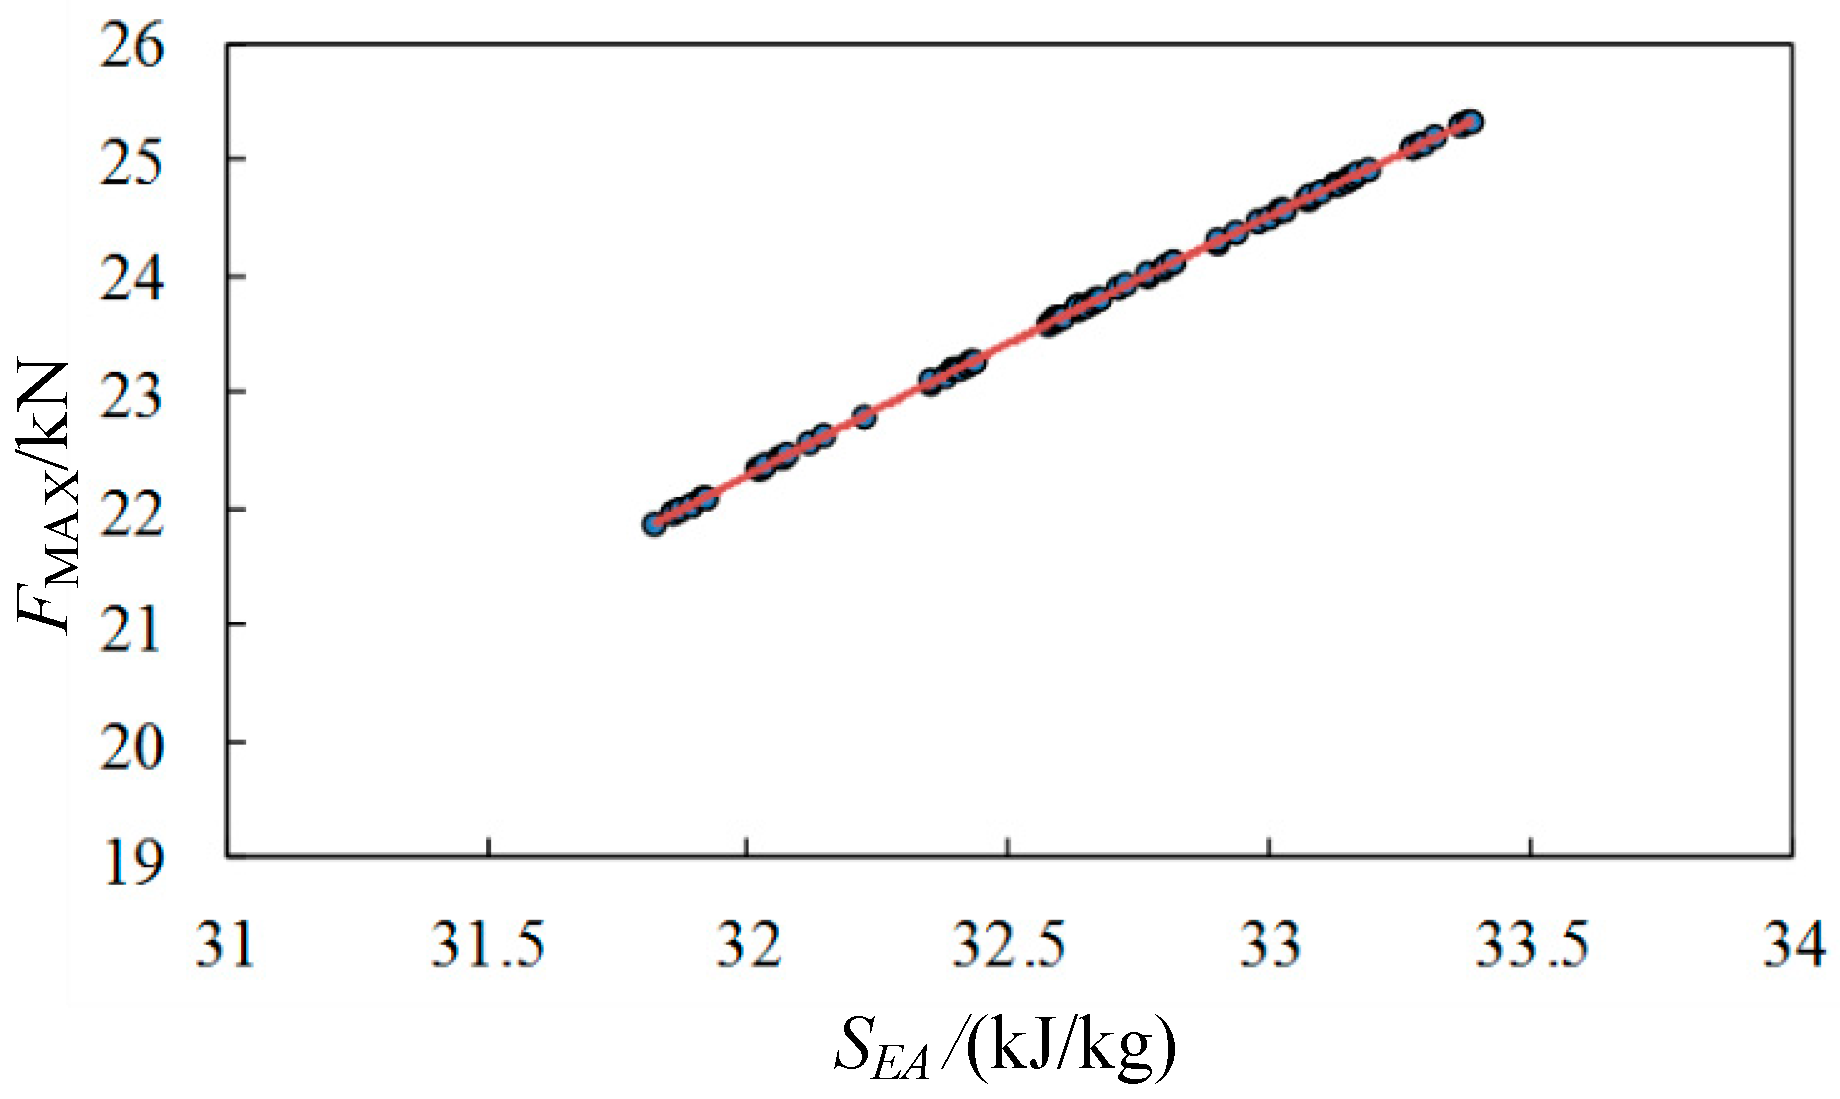
To enhance computational efficiency, the response surface model was employed during the optimization process to estimate the values of SAE, Fmax, and Fave. Through iterative optimization, Pareto optimal solution sets were obtained for the three mathematical models, from which the corresponding Pareto frontiers were plotted, as shown in Figure 4, Figure 5 and Figure 6.
For the final selection, the solution with the minimum Fmax was identified as the optimal design. The resulting optimal solutions for the three categories of energy-absorbing components are summarized in Table 6.

5. Integrated Energy-Absorption Performance Analysis of the Lander

5.1. Performance Evaluation of Serially Arranged Energy-Absorbing Components

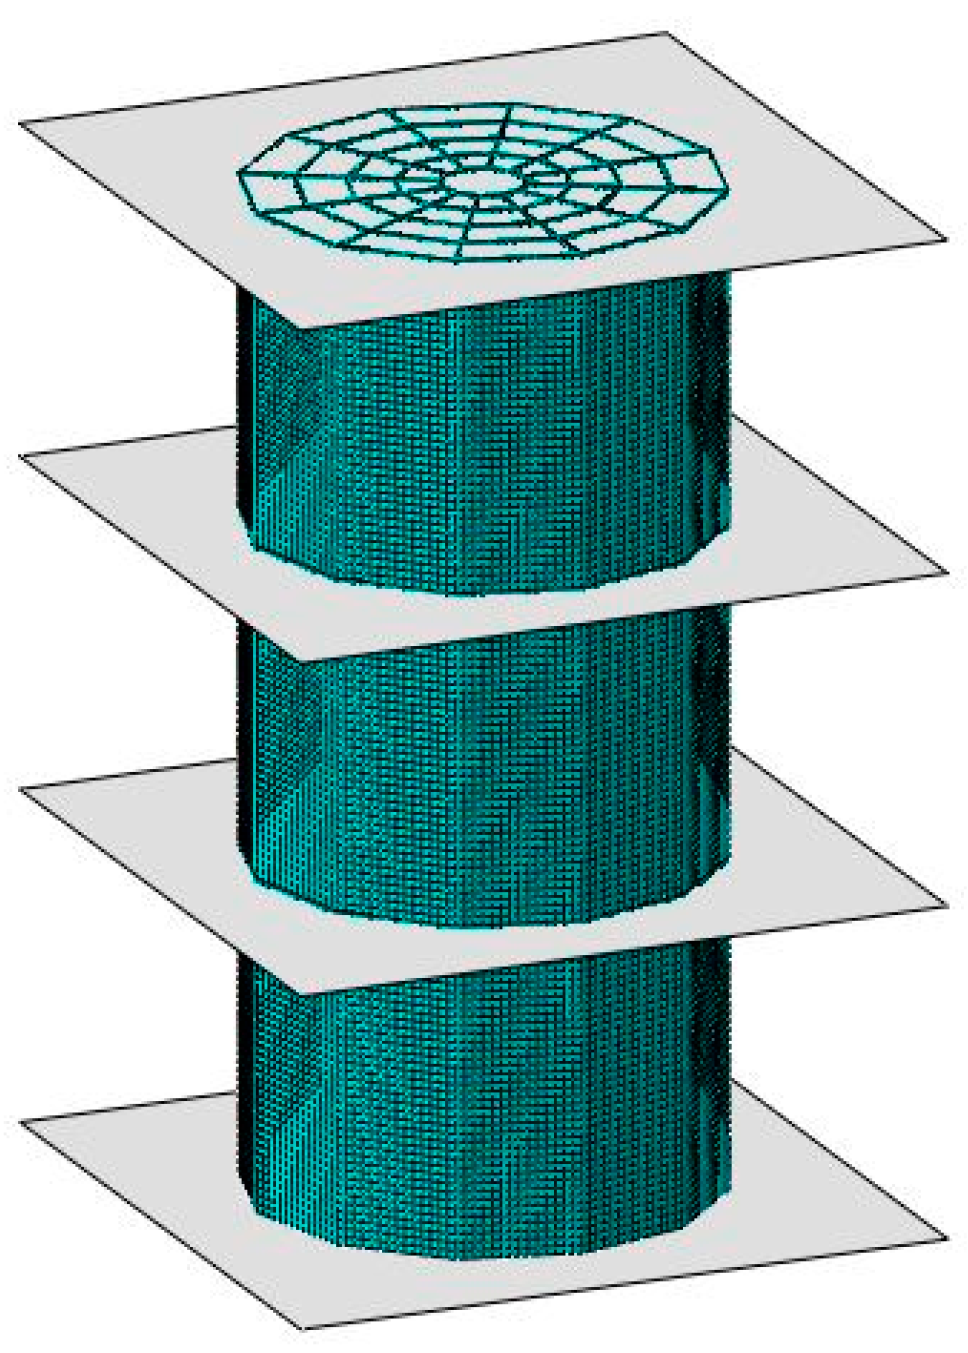
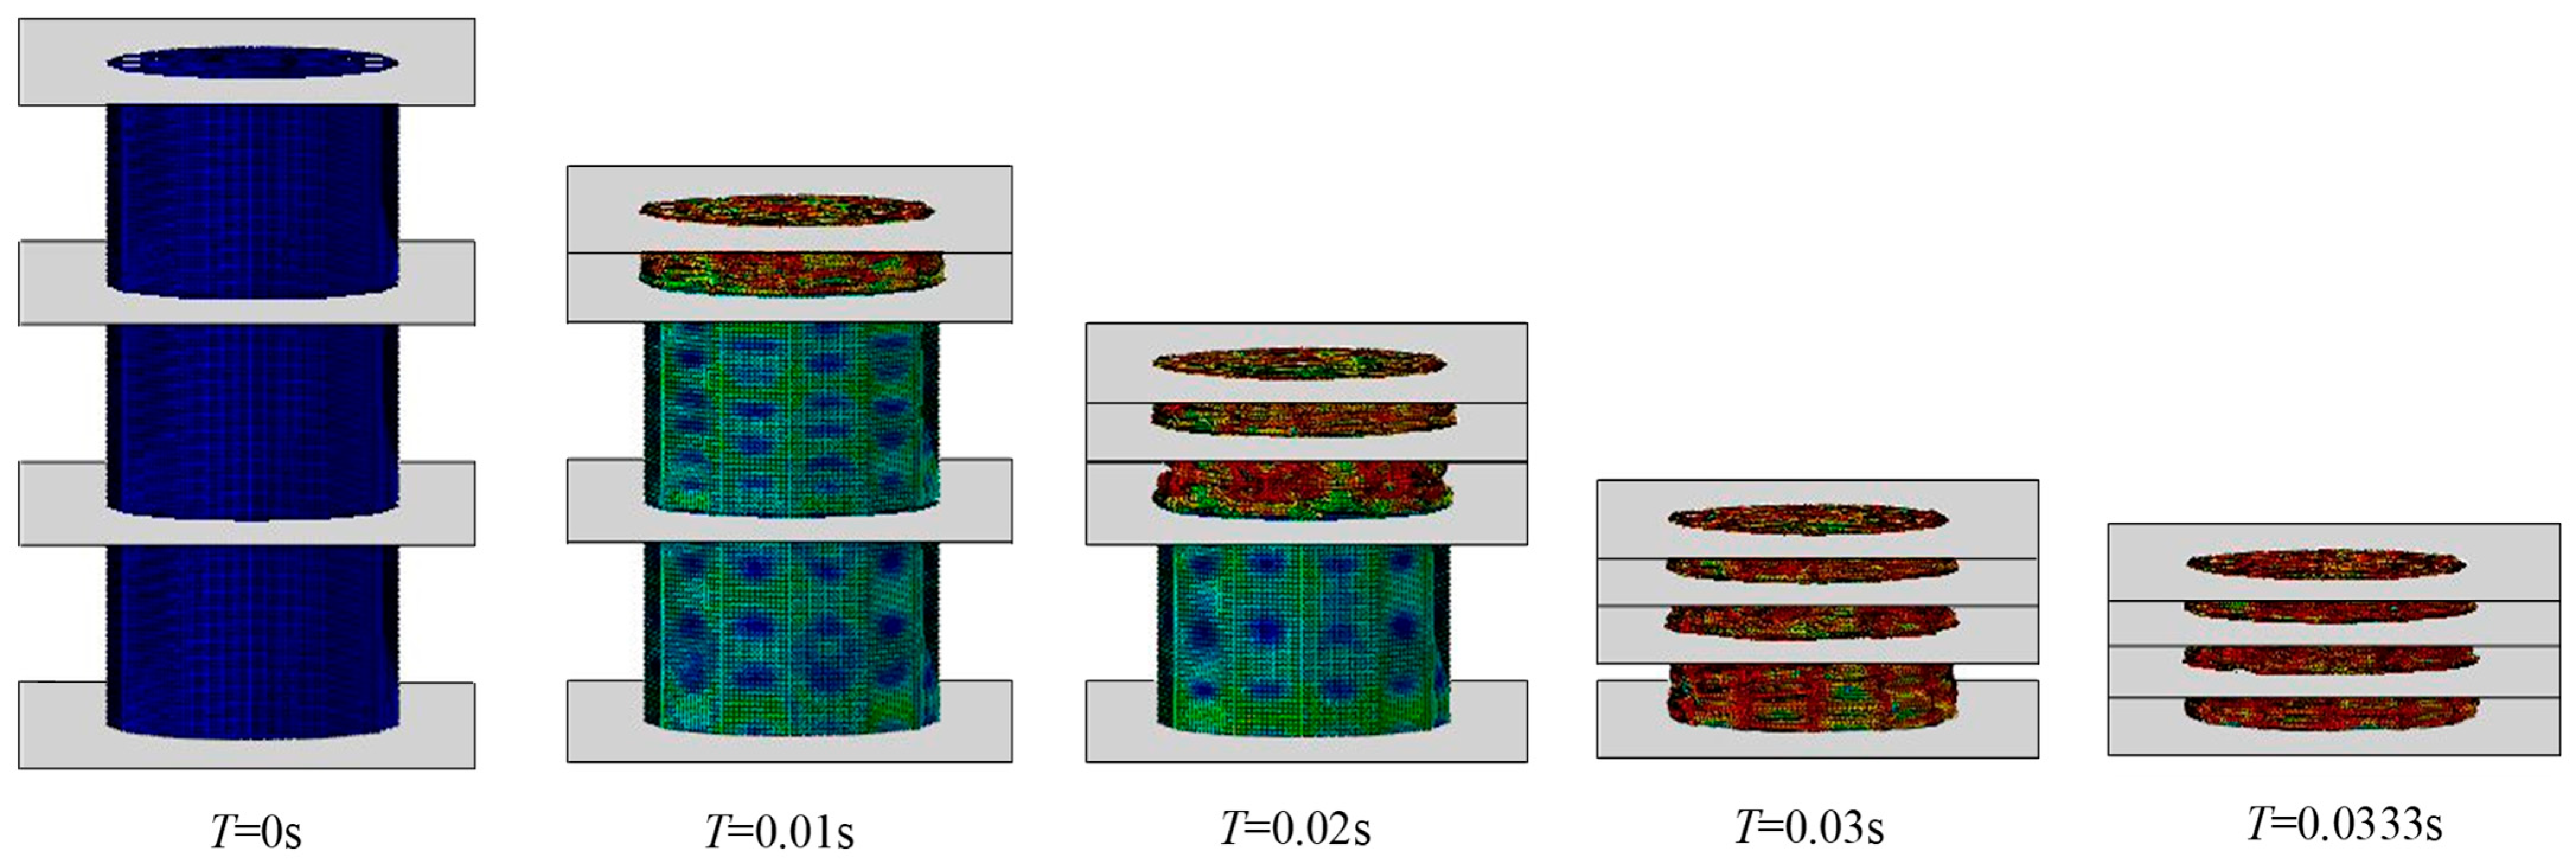
To enhance the adaptability of the lander under multiple operating conditions, different types of energy-absorbing components are typically installed in a graded serial configuration within the shock absorber [25]. Specifically, under nominal conditions, the weak energy-absorbing components dissipate the majority of the impact energy, whereas under severe conditions, the strong energy-absorbing components are activated to prevent failure of the system. Considering that the maximum stroke of the Mars lander’s shock-absorbing strut is 120 mm, this study arranges the three types of bio-inspired spider-web-shaped components (as listed in Table 6) in series, with the weak component positioned at the top and the strong component at the bottom. The corresponding FEM is illustrated in Figure 7.
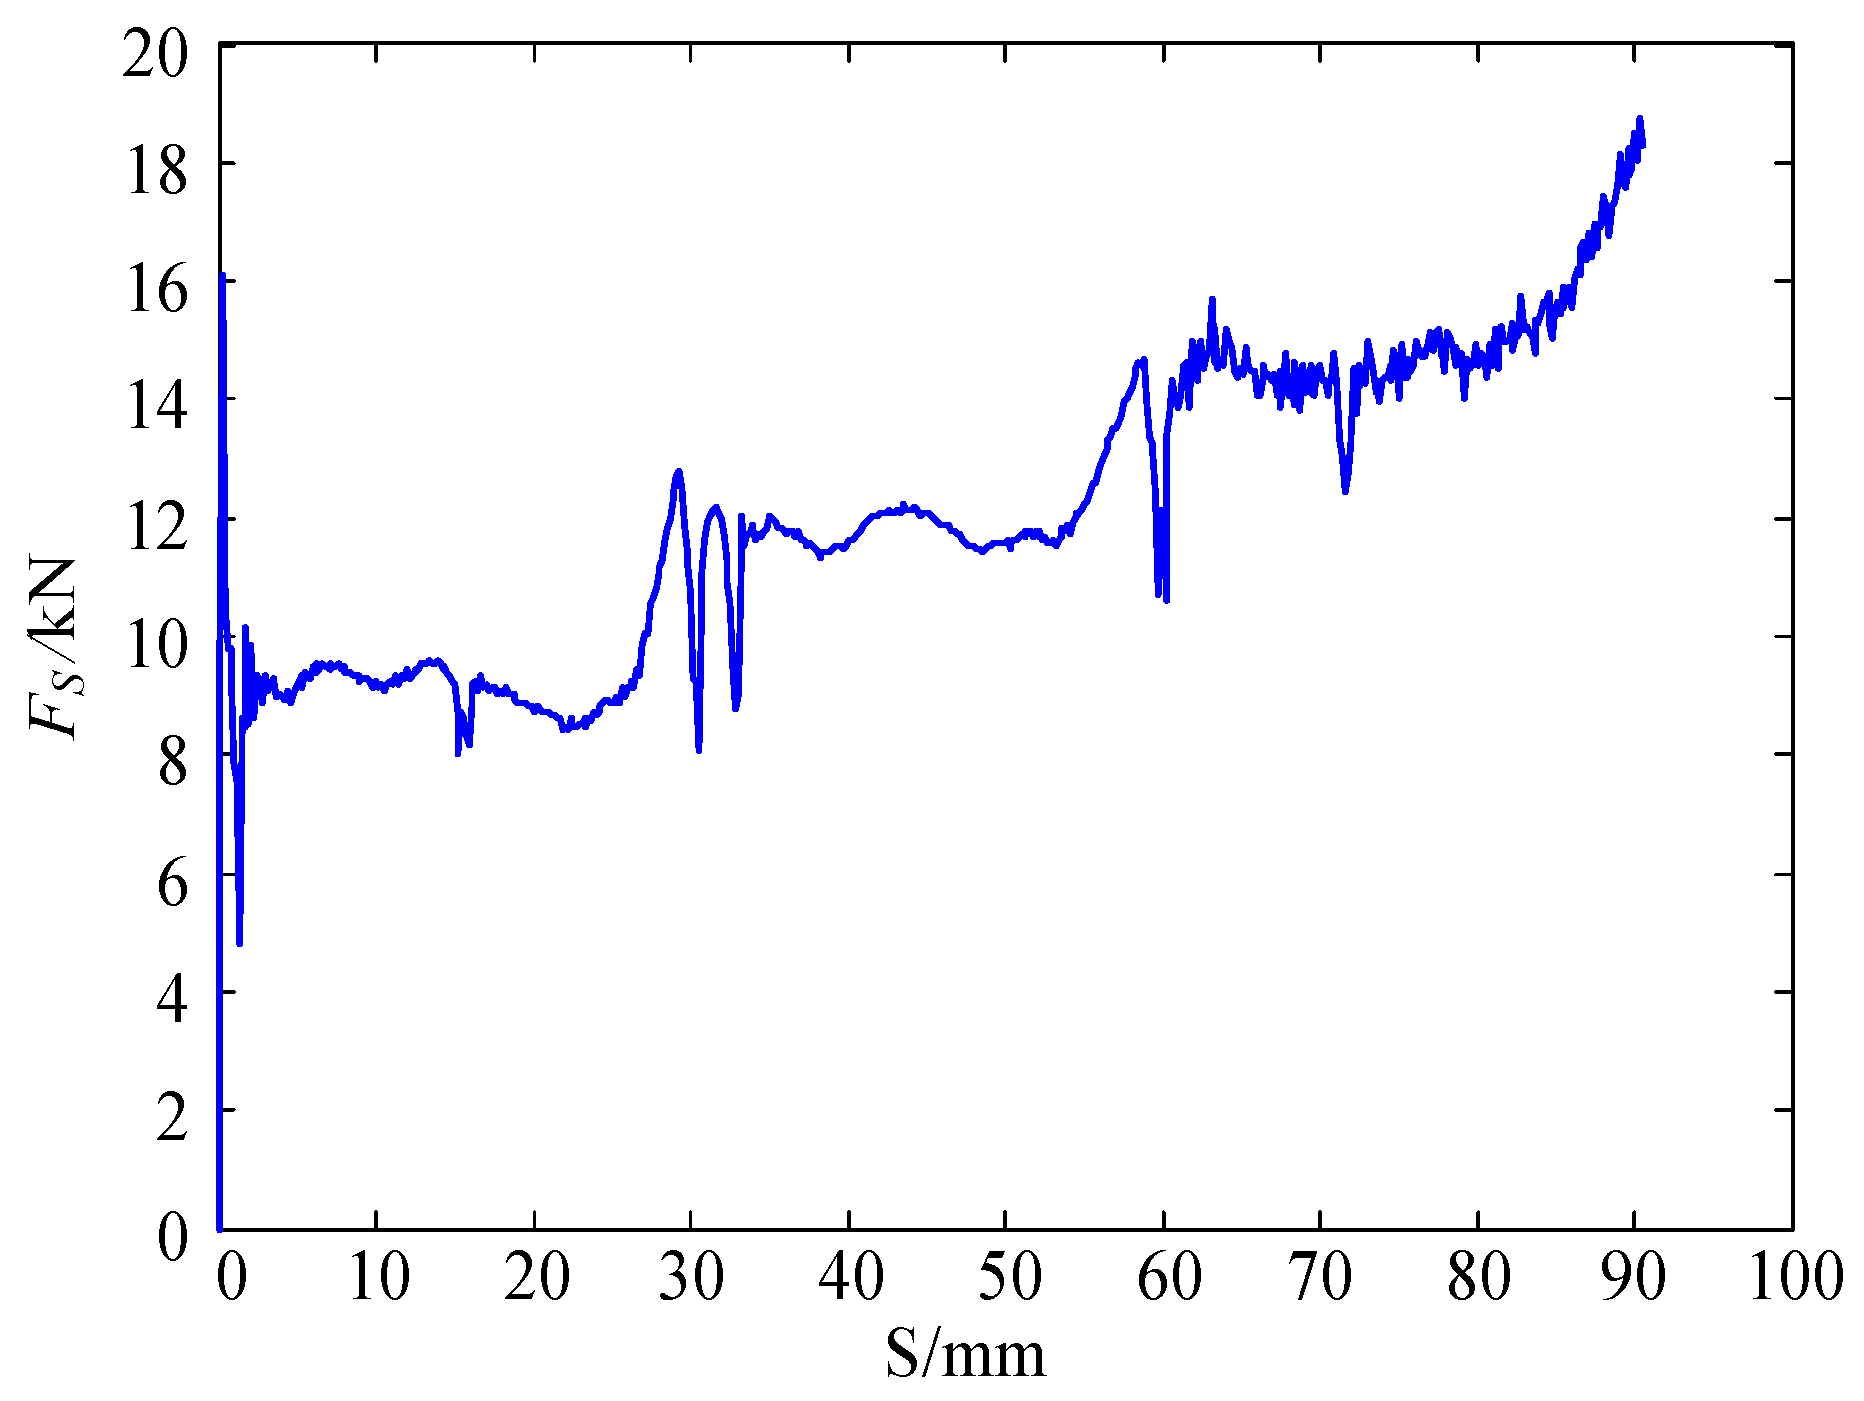
The compression behavior of the serially assembled spider-web-shaped components is analyzed using the finite element model. The maximum compression stroke is set to 90 mm, with the compression velocity kept consistent with that applied in the single-component simulations. Based on this setup, the relationship curve between compression displacement S and compressive force FS, as well as the simulated deformation process, are obtained and presented in Figure 8 and Figure 9, respectively.

5.2. Dynamic Analysis of the Entire Lander

The Mars lander equipped with the proposed bio-inspired spider-web-shaped energy-absorbing components is shown in Figure 10.
The lander consists of a central body structure and four identical shock absorption mechanisms uniformly distributed around its perimeter. Each mechanism is composed of a main strut, an auxiliary strut, a footpad, and a buffer rod. The upper end of the buffer rod is rigidly connected to the body, while its lower end is joined to the main strut through a universal joint. The lower end of the main strut is fixed to the footpad. The outer tube of the auxiliary strut is connected to the body via a universal joint, its inner tube is linked to the main strut through a spherical joint, and the space between the inner and outer tubes is filled with the energy-absorbing component to dissipate impact energy.
A multibody dynamics simulation model of the lander’s soft-landing process was developed in ADAMS [26,27]. To enhance computational efficiency, components undergoing small deformations were modeled as rigid bodies, while the effects of large deformation components were simulated using equivalent modeling techniques.
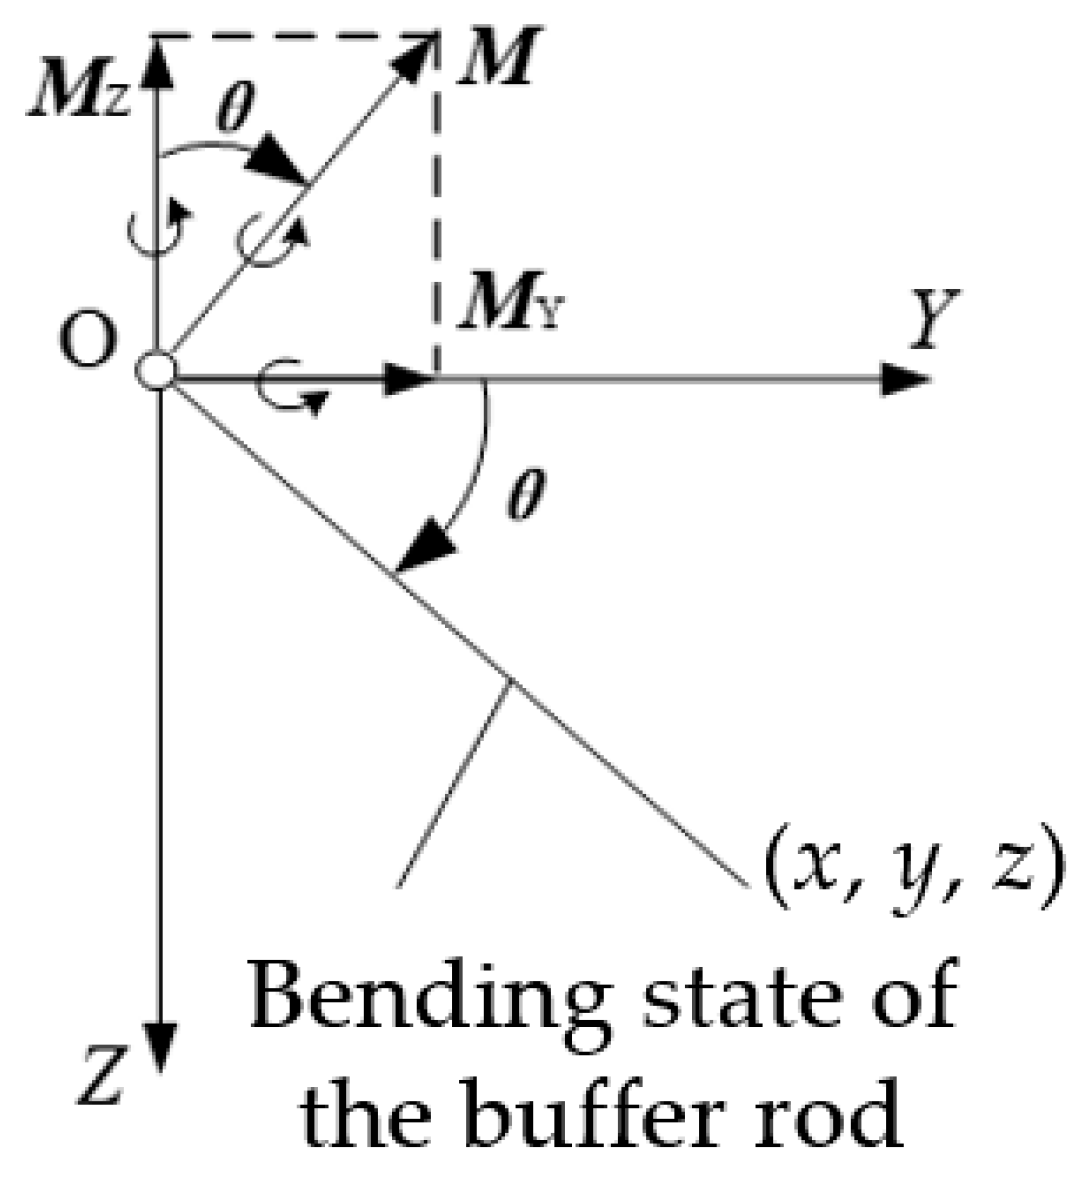
Considering that the buffer rod primarily absorbs impact energy through bending deformation, the behavior was simulated using the following method, which was previously described by the authors in reference [28]. As illustrated in Figure 11, two rigid bodies were established with mass properties defined according to the actual buffer rod. Rigid body 1 is connected to point O on the lander’s body through a universal joint, while rigid body 2 is constrained to move along the axis of rigid body 1. In the undeformed state, the buffer rod’s axis coincides with the global X-axis. When bending deformation occurs, a resisting bending moment M is generated. By decomposing M orthogonally into the Y- and Z-axis components, the corresponding bending moments MY and MZ can be obtained. Therefore, torque components MY and MZ were applied at point O on rigid body 1 to simulate the effect of the bending moment. Meanwhile, a translational motion S was applied to rigid body 2 to reproduce the displacement of the free end of the buffer rod. As shown in Figure 3, both M and S are functions of the deflection angle α between rigid bodies 1, 2 and the X-axis. A FEM of the buffer rod was developed, and by applying a bending moment, the relationships between αM and αS were obtained. The fitted curves are presented in Figure 12.
When considering only the bending deformation of the buffer rod, its top view can be represented as a line segment located within the YZ plane, forming an angle θ with the Y-axis, as illustrated in Figure 13.
By measuring the coordinates (x, y, z) of the end of rigid body 2 relative to point O, the angle α can be determined as expressed in Equation (19). Subsequently, MY, MZ and S can be derived according to Equations (20), (21), and (22), respectively.
α = arccos x x 2 + y 2 + z 2
M Y = z y 2 + z 2 × f ( a )
M Z = y y 2 + z 2 × f ( a )
S = g ( α )
The functions f and g correspond to the curve relationships shown in Figure 12, which are modeled in ADAMS using a Spline function. By substituting Equations (20)–(22) into the rigid-body model, the effect of the buffer rod can be simulated.
The performance of the spider-web-inspired buffer element is represented by introducing a force FD between the inner and outer cylinders of the auxiliary strut, which is a function of their relative displacement D. The functional relationship between FD and D follows the curve illustrated in Figure 9.
The interaction force between the footpad and the landing surface is decomposed into a normal impact force and a tangential friction force. The normal impact force is modeled using a nonlinear damping spring model, while the tangential friction force is described using a Coulomb friction model [26,27,29].
Neglecting active control errors during the powered descent phase, the lander is assumed to have zero horizontal velocity and zero angular velocity about all three axes at touchdown, with a vertical velocity of 3.5 m/s and a total mass of approximately 800 kg. The variable landing condition parameters considered include the distribution of surface craters nf, the slope of the landing surface α, and the yaw angle of the lander at touchdown θp. The definitions of these three parameters have been described in detail in Refs. [27,30] and are therefore not repeated here. Their value ranges are summarized in Table 7.
The primary aspects of soft-landing performance considered in this study include the following four criteria:
  • Anti-overturning capability of the lander. The vertical plane containing the center points of any two adjacent footpads is defined as the overturning plane. During landing, the minimum distance LD between the lander’s center of mass and the overturning plane must remain greater than zero [31]; otherwise, the lander is regarded as overturned.
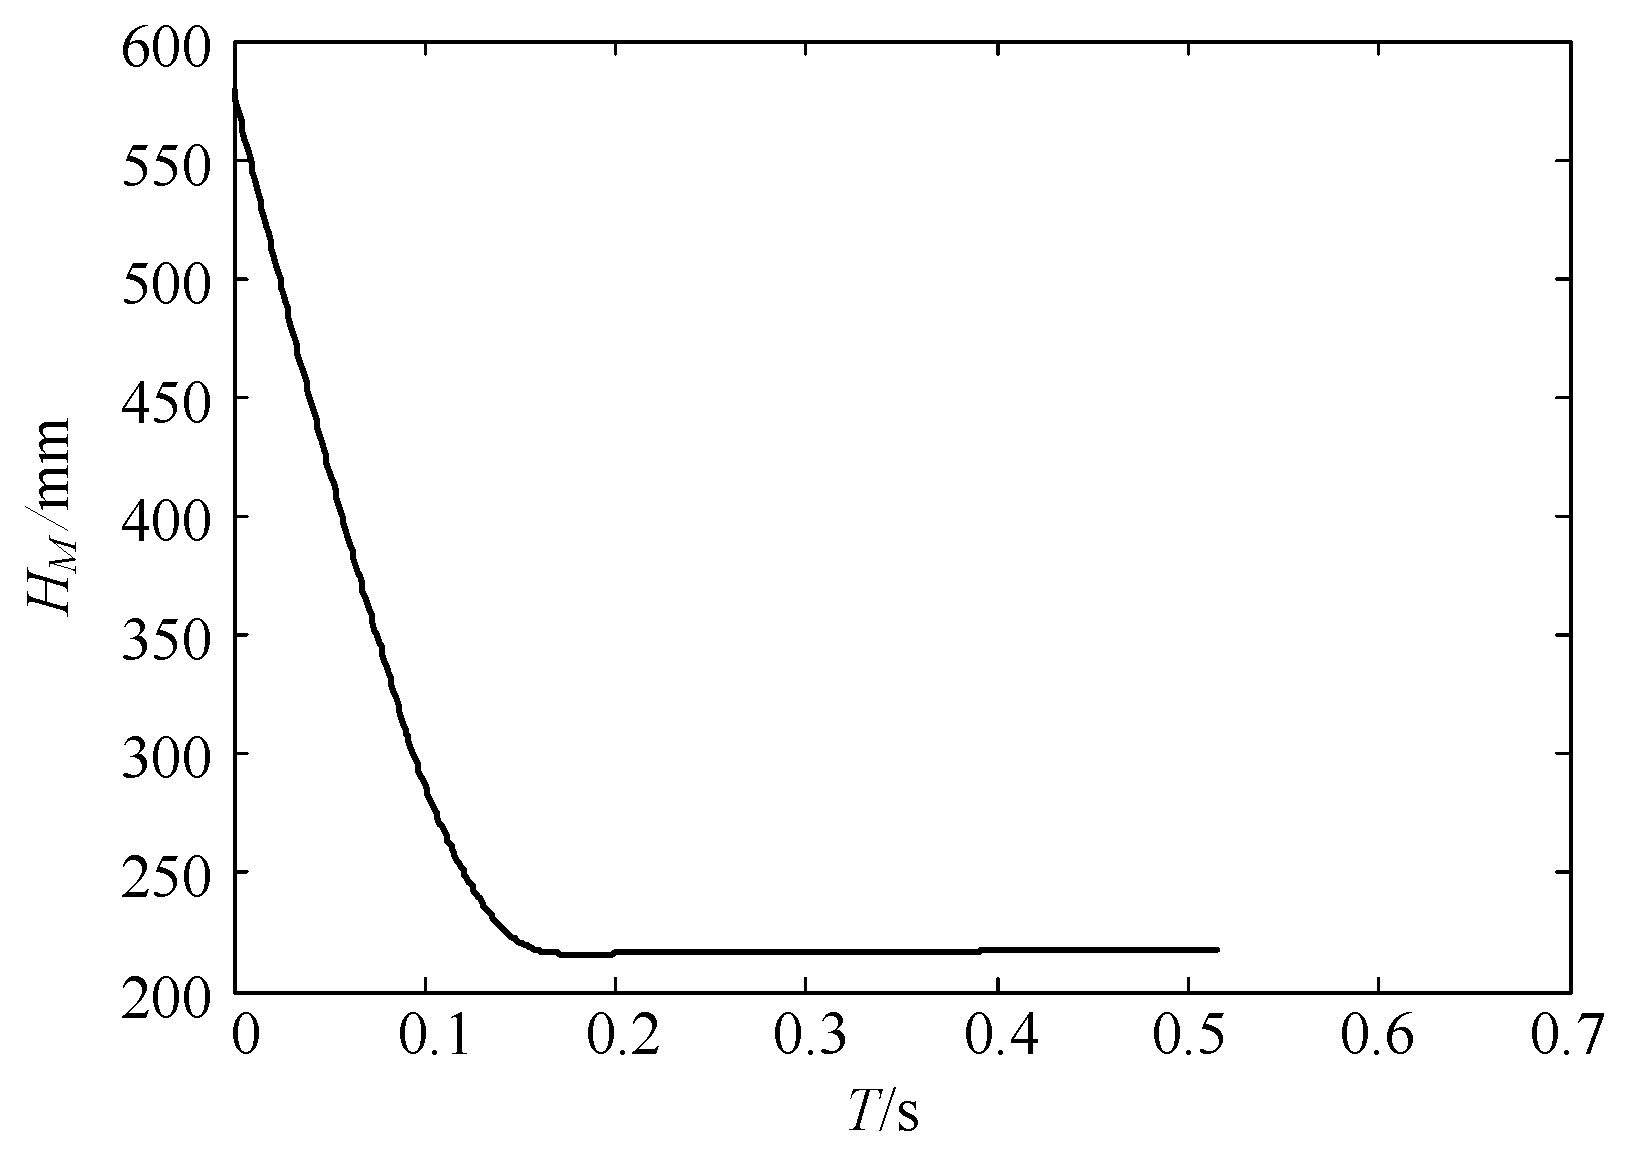
  • Anti-damage capability of the main engine nozzle. During touchdown, the minimum vertical distance HM between the center point of the nozzle bottom—located at the base of the lander’s main structure—and the planetary surface must be greater than 200 mm.
  • Acceleration overload characteristics. Considering that the payload instruments onboard the lander can only withstand limited overloads, the acceleration overload GL during the soft-landing process should generally not exceed 13 g to ensure the success of the exploration mission.
  • Energy absorption performance of the auxiliary struts. As the primary energy-absorbing components of the lander, the auxiliary struts must ensure that their buffer stroke DM remains less than 80 mm under nominal landing conditions.
The farther the values of LD, HM, GL, and DM are from their allowable boundaries, the better the soft-landing performance of the lander.
Based on the full multibody dynamic simulation model of the system, a full factorial experimental design method is employed to evaluate the soft-landing performance. In the design, the parameter nf (number of craters) is set to 0, 1, 2, and 3; the surface slope α is varied from 1° to 8° with an increment of 1°; and the yaw angle at touchdown θp is varied from 0° to 45° with an increment of 1°. According to the principles of full factorial design, a total of 4 × 8 × 46 = 14,724 dynamic simulations are required to complete the stability analysis of the lander. Based on these 1472 landing scenarios, the simulation results of the lander’s soft-landing performance are summarized in Table 8 and Table 9.
The simulated performance curves corresponding to the four representative landing conditions listed in Table 9 are presented in Figure 14, Figure 15, Figure 16 and Figure 17.
The above analysis demonstrates that the Mars lander equipped with the bio-inspired spider-web buffer elements exhibits favorable soft-landing performance.

6. Conclusions

In this study, a bio-inspired spider-web buffer element for legged landers was proposed, and a parameterized FEM was established. By integrating experimental design with finite element simulations, the compression and buffering performance of the element under varying configuration parameters was systematically investigated. Based on the FEA results and the response surface methodology, polynomial surrogate models were constructed to accurately capture the mapping relationship between configuration parameters and buffering performance indicators. On this basis, the NSGA-II algorithm was employed to optimize the buffer element design, yielding three optimized configurations with superior buffering performance across different ranges of average buffering force.
The three optimized elements were then combined in series, and their buffering performance was analyzed using FEA, resulting in force–displacement curves during the compression process. These curves were further incorporated into a multibody dynamic simulation model of a Mars lander, where the lander’s soft-landing performance was evaluated. The simulation results confirmed that the lander equipped with the proposed spider-web buffer elements exhibits excellent soft-landing capability.
The proposed spider-web buffer element provides a novel design concept for the selection of energy-absorbing components in deep-space exploration landers. Moreover, the methodology presented in this work is characterized by low cost and high efficiency, making it broadly applicable to the development of other types of buffer elements. In future work, the authors will continue to explore new designs of buffering components and conduct experimental validation of these components.

Author Contributions

Conceptualization, X.L.; methodology, X.L. and H.W.; data investigation, K.Y. and B.Z.; analysis and validation, X.L. and X.W.; writing—original draft, X.L.; writing—review and editing, X.L., K.L. and S.Z. All authors have read and agreed to the published version of the manuscript.

Funding

This research was sponsored by the Youth Research Special Project of NCUT (Project No. 2025NCUTYRSP007) and supported by the Open Project Program of State Key Laboratory of Virtual Reality Technology and Systems, Beihang University (No. VRLAB2025C14).

Data Availability Statement

Data are contained within the article.

Conflicts of Interest

The authors declare no conflicts of interest.

Appendix A

Table A1. Simulation results of experimental design.
mncd/mmSAE/(kJ/kg)Fmax/kNFave/kN
841.05640.117.5490288810.88274.183177143
1031.13850.102616.9098122410.98913.716534733
951.15380.105121.7551707213.00666.317426602
741.14870.107717.1837112711.64654.135951659
1141.08210.110321.8781890113.34986.408761329
751.13330.112819.368841714.025.601514532
1031.03080.115417.7316017311.6854.403440465
761.02560.117920.3411097917.30447.256318687
961.08720.120524.3929482616.84449.26953239
1251.15380.123127.5039346118.59410.39317247
10510.125623.4656032617.36268.858411942
831.07690.128216.5321089212.7074.193494049
1141.18970.130823.4001169415.69458.000165678
961.17950.133326.2582630720.073910.5743346
1251.05130.135927.5766606319.389811.81879401
641.07180.138517.9843544414.5245.396871558
841.00510.14120.7150246715.69257.039913792
931.17440.143618.7303396714.7235.520142033
751.19490.146221.9559269816.72458.047709455
1131.10260.148720.4868121216.58526.788772706
1141.01540.151324.8543448818.652610.08825538
761.09230.153823.2086294221.890110.42033155
951.10770.156425.1742138720.220811.04137353
641.14360.15919.7535755216.47056.681771614
1251.12310.161529.0807072823.18114.53231237
1061.11790.164129.6539572726.011915.64965319
1051.20.166728.2479109821.565513.31839603
751.01030.169221.7785701622.08979.901310134
1031.02050.171822.0299830317.56888.148217814
641.0410.174419.5218951618.57287.436543735
1151.03590.176929.3166486624.899715.92152359
831.11280.176919.7944914616.58926.909014085
1141.16920.182127.2000221622.280912.98523383
861.16410.184627.9652423426.581315.12543305
651.09740.187222.3032861521.768210.35510301
841.18460.189724.1462863421.584910.63247246
1241.06150.192328.9647103524.659715.34592751
941.04620.194925.6006945823.561112.39905185
861.06670.197427.6014653727.527616.7534547
1051.12820.230.3178487728.660917.51730797

References

  1. Maeda, T.; Otsuki, M.; Hashimoto, T.; Hara, S. Attitude stabilization for lunar and planetary lander with variable damper. J. Guid. Control Dyn. 2016, 39, 1790–1804. [Google Scholar] [CrossRef]
  2. Lin, Q.; Kang, Z.Y.; Ren, J.; Zhao, Q.; Nie, H. Impact Analysis of lunar lander soft landing performance caused by the body gravity centerline shift. J. Aerosp. Eng. 2015, 28, 04014104. [Google Scholar] [CrossRef]
  3. Ponnusamy, D.; Maahs, G. Development and testing of leg assemblies for robotic lunar lander. In Proceedings of the 14th European Space Mechanisms and Tribology Symposium, Constance, Germany, 28–30 September 2011. [Google Scholar]
  4. Doiron, H.H.; Zupp, G.A. Apollo lunar module landing dynamics. In Proceedings of the Structure Dynamics and Materials Conference and Exhibit, Atlanta, GA, USA, 3–6 April 2000. [Google Scholar]
  5. Yang, J.Z.; Zeng, F.M.; Man, J.F.; Zhu, W. Design and verification of the landing impact attenuation system for Chang’E-3 lander. Sci. China Technol. 2014, 44, 440–449. [Google Scholar] [CrossRef]
  6. Li, M.; Liu, R.Q.; Luo, C.J.; Guo, H.; Ding, B. Numerical and experimental analyses on series aluminum honeycomb structures under quasi-static load. J. Vib. Shock 2013, 32, 50–56. [Google Scholar]
  7. Liaghat, G.H.; Alavinia, A. A comment on the axial crush of metallic honeycombs by WU and JIANG. Int. J. Impact Eng. 2003, 28, 1143–1146. [Google Scholar] [CrossRef]
  8. Hong, S.T.; Pan, J.; Tang, T. Quasi-static crush behavior of aluminum honeycomb specimens under compression dominant com-bined loads. Int. J. Plast. 2006, 22, 73–109. [Google Scholar] [CrossRef]
  9. Li, M.; Deng, Z.Q.; Guo, H.W.; Liu, R.Q.; Ding, B.C. Optimizing crashworthiness design of square honeycomb structure. J. Cent. South Univ. Technol. 2014, 21, 912–919. [Google Scholar] [CrossRef]
  10. Deng, L.; Wang, A.W.; Mao, L.W.; Li, K.B. Energy absorption characteristics of a square hole honeycomb sandwich plate under blast loading. J. Vib. Shock 2012, 31, 186–189. [Google Scholar]
  11. Hu, L.L.; Chen, Y.L. Mechanical properties of triangular honeycombs under in-plane impact loading. J. Vib. Shock 2011, 30, 226–229. [Google Scholar]
  12. Liu, R.Q.; Guo, H.W. Crashworthiness optimization of different topological structures of metal honeycomb used in a legged-typed lander. J. Vib. Shock 2013, 32, 7–14. [Google Scholar]
  13. Han, H.L.; Zhang, X.C. In-plane dynamic impact response characteristics of periodic 4-point star-shaped honeycomb struc-tures. J. Vib. Shock 2017, 36, 223–231. [Google Scholar]
  14. Zhang, G.Q. Energy Absorption and Low Velocity Impact Damage Resistance of Composite Lattice Structures; Harbin Institute of Technology: Harbin, China, 2014. [Google Scholar]
  15. Luo, C.J.; Liu, R.Q.; Deng, Z.Q.; Wang, C.; Li, M. Experimental studies of energy absorber filled with aluminum foam on the thin-walled met-al tube’s plastic deformation. J. Vib. Shock 2009, 28, 26–30. [Google Scholar]
  16. Zeng, F.; Pan, Y.; Hu, S.S. Evaluation of cushioning properties and energy-absorption capability of foam aluminium. Explos. Shock 2002, 22, 358–362. [Google Scholar]
  17. Liang, D.P.; Chai, H.Y.; Zeng, F.M. Nonlinear finite element modeling and simulation for landing leg of lunar lander. J. Beijing Univ. Aeronaut. Astronaut. 2013, 39, 11–15. [Google Scholar]
  18. Li, M. Research on Energy Absorbers of Legged-Type Lander and Dynamic Simulation on Its Soft Landing Process; Harbin Institute of Technology: Harbin, China, 2013. [Google Scholar]
  19. Chen, J.B.; Nie, H.; Zhao, J.C.; Bai, H.M.; Bo, W. Research of the factors of buffering performance in lunar lander. J. Astronaut. 2008, 29, 1729–1732. [Google Scholar]
  20. Tang, S. The Behavior of Aluminum Honeycomb Under Static and Dynamic Compression; Central South University: Changsha, China, 2014. [Google Scholar]
  21. Liu, R.Q.; Luo, C.J.; Wang, C.; Deng, Z.; Li, M. Research on cushion properties and its evaluation methods of legged-type lander’ s shock absorber. J. Astronaut. 2009, 30, 1180–1188. [Google Scholar]
  22. Yue, S.; Nie, H.; Zhang, M.; Luo, C. Analysis on performance of a damper used for vertical landing reusable launch vehicle. J. Astronaut. 2016, 37, 646–656. [Google Scholar]
  23. Kurtaran, H.; Eskandarian, A.; Marzougui, D. Crashworthiness design optimization using successive response surface approximations. Comput. Mech. 2002, 29, 409–421. [Google Scholar] [CrossRef]
  24. Song, S.G. Research on Design Method of Space Mechanism Based on Digital Design Theory; Beijing University of Aeronautics and Astronautics: Beijing, China, 2013. [Google Scholar]
  25. Blanchard, U.J. Full-Scale Dynamic Landing-Impact Investigation of a Prototype Lunar Module Landing Gear; National Aeronautics and Space Administration: Washington, DC, USA, 1969.
  26. Nohmi, M.; Miyahara, A. Modeling for lunar lander by mechanical dynamics software. In Proceedings of the Modeling and Simulation Technologies Conference and Exhibit, San Francisco, CA, USA, 15–18 August 2005. [Google Scholar]
  27. Wu, H.Y.; Wang, C.J.; Ding, J.Z.; Man, J.; Luo, M. Soft landing performance optimization for novel lander based on multiple working conditions. J. Beijing Univ. Aeronaut. Astronaut. 2017, 43, 776–781. [Google Scholar]
  28. Wu, H.Y.; Wang, C.J.; Ding, Z.M.; Ding, J.Z.; Liu, X.A. Configuration Optimization of Landing Gear under Two Kinds of Landing Modes. J. Astronaut. 2017, 38, 1032–1040. [Google Scholar]
  29. Wu, H.Y.; Wang, C.J.; Ding, J.Z.; Wang, J.; Luo, M. Collision parameters updating for single-leg dynamics simulation model of novel lander. J. Vib. Shock 2018, 37, 50–55. [Google Scholar]
  30. Wu, H.Y.; Wang, C.J.; Ding, J.Z.; Ding, Z. Dynamics simulation analysis for novel lander based on two kinds of landing mode. In Proceedings of the 9th International Conference on Measuring Technology and Mechatronics Automation, Changsha, China, 14–15 January 2017. [Google Scholar]
  31. Zupp, G.A.; Doiron, H.H. A Mathematical Procedure for Predicting the Touchdown Dynamics of a Soft-Landing Vehicle: NASA-TN-D-7045; NASA: Washington, DC, USA, 1971.
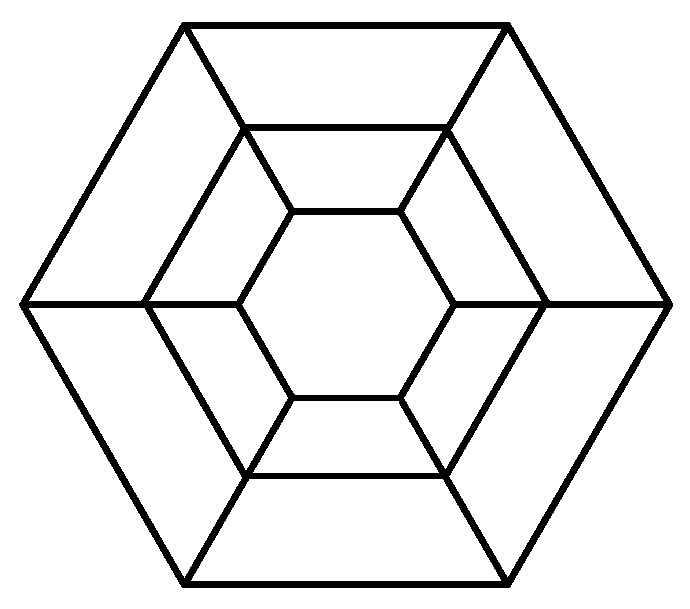
Figure 1. Cobweb-structure with three-layer regular hexagons.
Machines 13 01035 g001
Figure 2. Cobweb type buffer element with three-layer regular hexagons.
Machines 13 01035 g002
Figure 3. Finite element model of cobweb type buffer element.
Machines 13 01035 g003
Figure 4. Pareto front of weak buffering component.
Machines 13 01035 g004
Figure 5. Pareto front of moderate buffering component.
Machines 13 01035 g005
Figure 6. Pareto front of strong buffering component.
Machines 13 01035 g006
Figure 7. FEM of Serial Energy-Absorbing Components.
Machines 13 01035 g007
Figure 8. The function curve of SFS.
Machines 13 01035 g008
Figure 9. Compression Process of Serial Energy-Absorbing Components.
Machines 13 01035 g009
Figure 10. Configuration of lander.
Machines 13 01035 g010
Figure 11. Equivalent method of buffer beam.
Machines 13 01035 g011
Figure 12. Mechanical behavior of buffer rod.
Machines 13 01035 g012
Figure 13. Vertical view of buffer rod.
Machines 13 01035 g013
Figure 14. The change curve of LD with time.
Machines 13 01035 g014
Figure 15. The change curve of HM with time.
Machines 13 01035 g015
Figure 16. The change curve of GL with time.
Machines 13 01035 g016
Figure 17. The change curve of DM with time.
Machines 13 01035 g017
Table 1. Material attribute of AL3003H18 [20].
Density (kg·m−3)Elastic Modulus (GPa)Poisson’s RatioYield Strength (MPa)
12.73 × 103680.33185
Table 2. Parameter ranges of buffer element.
mncd (mm)
6~123~61~1.20.1~0.2
Table 3. Accuracy analysis table of response surface models.
MetricR2RMSE
SAE0.9950.00157
Fmax0.9840.00410
Fave0.9990.00194
Table 4. Range of average value of buffer force.
TypeWeak BufferingModerate BufferingStrong Buffering
Ranges of Fave (kN)9~1212~1515~18
Table 5. Value of optimal parameters.
ParameterPopulation SizeNumber of GenerationsCrossover
Index
Mutation
Index
Crossover
Probability
Value124010200.9
Table 6. Value of optimum solution.
Type of Energy-Absorbing Componentmncd (mm)
Weak buffering1251.0650.113
Moderate buffering1261.1010.120
Strong buffering1261.2000.141
Table 7. Range of parameters of initial landing conditions.
ParameterValue
α (°)1~8
nf0, 1, 2, 3
θp (°)0~45
Table 8. Soft landing performance analysis results of lander.
Performance IndexExtreme ValueNumber of Cases Exceeding Allowable Limit
Minimum LD807.308 mm0
Minimum HM216.185 mm0
Maximum GL11.234 g0
Maximum DM75.366 mm0
Table 9. Soft landing conditions analysis results of lander.
Performance Indexα (°)θp (°)nf
Minimum LD8382
Minimum HM503
Maximum GL1432
Maximum DM8261
Disclaimer/Publisher’s Note: The statements, opinions and data contained in all publications are solely those of the individual author(s) and contributor(s) and not of MDPI and/or the editor(s). MDPI and/or the editor(s) disclaim responsibility for any injury to people or property resulting from any ideas, methods, instructions or products referred to in the content.