Abstract
Automated production plays a vital role in the long-term development of industrial enterprises, and automated production has high requirements for defect detection of industrial parts. In this study, we construct a complex atom network based on Swin Transformer—selected for its window-based multi-head self-attention (W-MSA) and shifted window-based multi-head self-attention (SW-MSA) mechanisms, which enable efficient cross-window feature interaction and reduce computational complexity compared to vanilla Transformer or CNN-based methods in multi-task scenarios—and after repairing and recovering the abnormally generated and randomly masked images in the industrial automated production environment, we utilize the discriminative sub-network to achieve real-time abnormality image detection and classification. Then, the loss function optimization model is used to construct a real-time multi-task image detection model (MSTUnet) and design a real-time detection system in the industrial automation production environment. In the PE pipe image defect detection for industrial automated production, the average recognition rate of this paper’s detection model for six kinds of defects can reach 99.21%. Practical results show that the product excellence rate and qualification rate in the industrial automated production line equipped with this paper’s detection system reached 15.32% and 91.40%, respectively, and the production efficiency has been improved. The real-time multi-task image inspection technology and system proposed in this paper meet the requirements of industrial production for accurate, real-time and reliable, and can be practically applied in the industrial automation production environment, bringing good economic benefits.
1. Introduction
Vision dominates human perception, supplying ≈80% of world knowledge, mainly via pictorial data [1,2]. To emulate this, computer vision infers semantics from images; propelled by ubiquitous cameras and scalable computing, it now underpins industrial inspection, object recognition, medical imaging and autonomous driving [3,4].
With the development of computer technology and network communication technology, we can quickly collect a large amount of data from the network, and the number of images in these data is the largest, and the dramatic increase in image data undoubtedly brings great challenges to image processing [5,6]. Therefore, in recent years, the research in the field of image processing focuses on data processing, and only after the data is reasonably processed can the subsequent operations be efficiently executed. As a sub-discipline in the field of artificial intelligence, the main task of computer vision is to enable intelligent devices including computers to have the same processing capability as the human visual system and to perform automated intelligent processing by simulating the human visual system when processing image information [7,8,9].
At present, the rapid development of machine learning methods and computer hardware technology provides strong support for research in the field of computer vision [10]. For example, in the field of medicine, various medical imaging devices can quickly and accurately locate the lesions of patients, and doctors can propose accurate solutions accordingly; in the field of intelligent surveillance, video target detection can quickly locate the target position according to the characteristics of the searched character, and target tracking, vehicle identification, license plate recognition, etc., have greatly improved the efficiency of the surveillance service; in the field of biological intelligence, face recognition technology has developed rapidly and has reached the level of practical application, which is convenient for people’s lives [11,12]. From the perspective of detection principle, saliency detection is divided into salient target detection and eye movement point detection. Eye movement point detection refers to the use of specialized eye-tracking equipment to capture the eye movement trajectory and construct the truth map based on the captured movement points. Eye movement point detection constructs the model in such a way that the pixels around the truth point are predicted to be larger, i.e., the brighter the pixel point, and the pixels away from the truth point are predicted to be smaller, i.e., the darker [13,14]. This type of saliency detection method is based on the perspective of human neurobiology and psychology, hoping that the machine can realize the visual process of human image observation. The principle of this method is complex, the workload when collecting raw data is also relatively large, and the price of the eye-tracking device is also relatively expensive, so fewer people are engaged in research in this direction compared to salient target detection [15,16].
Salient target detection, on the other hand, is relatively simple and aims to detect the regions of the input image that are of most concern and interest to the human eye. It can also be used as a preprocessing part of other research in the field of image processing to reduce the complexity of computerized image processing [17,18]. In some specific image processing studies, it may be necessary to process only the regions of the image that are most useful or interesting to us. Therefore, we only need to find the most significant region of the image and take from that region. It can also be used as a preprocessing part of other research in the field of image processing and be used to reduce the complexity of computerized image processing [19,20].
In this paper, we utilize the anomaly generation and mask generation module to generate multiple random masked images after masking operations on real-time images from industrial automation production environments. Two consecutive Swin Transformer modules are used to complete the cross-window connection in a shift-window manner to improve the multi-task image detection performance. Subsequently, a complex atom network is designed based on the successive Swin Transformer modules to repair the random masked anomaly images into anomaly-free images and recover the masked image blocks using the multi-head self-attention mechanism. Then, the discriminative sub-network outputs the anomaly annotation map to realize the anomaly detection of the real-time multi-task image. Finally, the loss function is applied to optimize the performance of the detection model, and the model is piggybacked to construct an industrial automated production anomaly detection system. This study examines the defogging performance and defect detection performance of real-time multi-tasking image detection technology in a simulation environment and at the same time analyzes the visual display and application effect of the detection system through the practical application of a steel part production line to explore its impact on the benefits of industrial automation production.
The main contributions of this work are as follows:
- Propose MSTUnet, a hybrid model integrating anomaly simulation, Swin Transformer-based complex atom network, and discriminative sub-network, to address real-time multi-task image detection in industrial environments.
- Demonstrate that Swin Transformer’s cross-window attention mechanism outperforms traditional CNN/GAN-based methods in both image defogging (PSNR = 23.49, SSIM = 0.9195) and defect detection (99.21% average recognition rate for PE pipe defects).
- Develop a B/S architecture-based industrial detection system that improves product excellence rate by 12.12% compared to traditional manual monitoring, with verified practical applicability.
The real-time multi-task image inspection technology and system proposed in this paper meet the requirements of industrial production for accurate, real-time and reliable and can be practically applied in the industrial automation production environment, bringing good economic benefits.
2. Method
2.1. Real-Time Multi-Task Image Detection Model Construction
In this paper, a hybrid model with anomaly simulation and masking strategy (MSTUnet) is proposed to realize real-time multi-task image detection in industrial automation production environments. The model includes an exception generation and mask generation module, a complex atom network based on Swin Transformer structure, and a discriminative sub-network. The anomaly generation and mask generation module is responsible for generating anomalies for product input images in industrial production automation environments and dividing the input images with generated anomalies into multiple random mask images. The anomaly generation strategy provides rich anomaly samples and anomaly annotation maps to train the proposed MSTUnet model without real anomaly samples. The complex atom network is responsible for generating anomaly-free images and recovering the mask regions with semantically sound anomaly-free contextual information.
2.1.1. Exception Generation and Mask Generation Modules
Anomaly generation consists of adding simulated anomalies to anomaly-free samples to obtain an anomaly image and an anomaly-annotated map , chunking the anomaly image to obtain an image , and randomly masking the image chunks of image to obtain masked anomaly images, denoted by . The purpose of the masking operation is to make the image blocks with anomalies invisible to the complex-atom network in order to reduce the anomaly reconstruction performance of the complex-atom network.
The anomaly generation step can be described by Equation (1):
Inverting yields ; denotes the Hadamard product, where and represent the simulated anomaly information and the image to which the simulated anomaly needs to be added, respectively (the pixels at the corresponding positions to which the anomaly information needs to be added are set to zero). The image with the anomaly information, i.e., the anomaly image, is then generated and is denoted by .
After obtaining , a chunking operation is performed on it with a chunk size of , forming an image chunk-based anomaly map . Next, a masking operation needs to be performed on , and for this purpose, a copy of image is made to obtain image . At the same time, the image positional information will be divided into non-overlapping equal parts, whose corresponding positions are defined as , where . The feature matrix, which is set to be , can be defined as in Equation (2):
Thus, the masked image can be written as Equation (3):
By using Equations (2) and (3), each anomaly image in an industrial automation production environment will yield masked anomaly images, where the mask positions of the masked anomaly images are non-overlapping and the mask area of each masked anomaly image covers the entire image . Since the area of the mask block in the masked anomaly image is much smaller compared to the entire image, it is feasible for the complex atomic networks to recover the masked anomaly image as an anomaly-free image using unmasked blocks.
2.1.2. Swin Transformer-Based Complex Atom Networks
The main structure of the Swin Transformer [21] is two parts, the multi-head self-attention module and the multilayer perceptron, which differs from Transformer encoder [22] by having an additional window segmentation module in the Swin Transformer module, which is capable of realizing the multi-tasking image detection process. Since the window may cut the target, two consecutive Swin Transformer modules are used to shift the window in order to realize the cross-window connection. The computational process of the self-attention mechanism is shown in Equation (4):
where , , and denote the matrix form , , , and denote the dimension of , respectively, denotes the number of elements in a window, and denotes the relative position bias.
The multi-attention mechanism is to add multiple self-attention mechanisms, thus enabling the model to focus on multiple focus areas at the same time, which is advantageous for detecting multiple targets at the same time in the detection task, and multiple , , and weight matrices can be learned and mapped to different representation spaces, which enriches the feature expression of the information. The computational process is shown in Equation (5):
where , , , and denote the weight matrices corresponding to , , and , respectively, denotes the output matrix, denotes the dimensionality of , denotes the dimensionality of , and is the number of self-attentive modules, which is typically 8, .
Since the feature expression ability of linear layers is limited, the multilayer perceptron is utilized to increase the nonlinear computation of the model and improve the feature expression ability of the network model. In addition, Swin Transformer accelerates the training speed and improves the training stability by using layer normalization; residual connection alleviates the network degradation phenomenon, and dropout effectively alleviates the occurrence of overfitting phenomenon. The overall model structure diagram is shown in Figure 1.
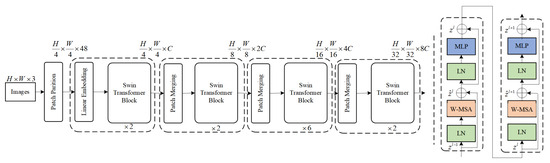
Figure 1.
The specific structure of Swin Transformer. W-MSA and SW-MSA denote multi-head self-attention layers that operate within fixed and shifted local windows, respectively, forming the core of the Swin Transformer architecture.
In this paper, a Swin Transformer-based complex atom network is used to repair masked anomalous images to anomaly-free images. The purpose of training the complex atom network is to repair the masked image blocks with unmasked image blocks. Since each masked anomalous image has an area portion of erased, the useful block that the network can learn is . When the mask area ratio is too large, i.e., the value of is too small, there is less information about the useful image block, which greatly increases the difficulty of image restoration. In this paper, Swin Transformer block is used for global feature extraction and feature reconstruction. In Swin Transformer block, the masked image block is represented as a weighted sum of global unmasked image blocks. Therefore, all unmasked image blocks in the anomaly image can be fully utilized to improve the recovery quality of the masked blocks. The atomic recovery network consists of an encoder, a decoder, and a hopping connection. The encoder consists of a chunking module, a Swin Transformer module, and a block merging module, while the decoder consists of an upsampling module and a Swin Transformer module. The details of each module are described below.
The chunking module, for the input image , where 3 denotes the number of channels, uses a padded convolutional layer to obtain shallow information from the input image, where , which can be described as Equation (6):
Since the input to the Swin Transformer module is a serialized image block, image is obtained by chunking using , where , denote the number of blocks, denotes the sequence dimension of the block and is set to 96, and then image is fed into the Swin Transformer block to extract the multiscale deep features, which can be expressed as Equation (7):
Input to the Swin Transformer module is the mask image block of image , where LN is the layer normalization function that computes the mean and variance of the input image block to maintain the stability of the feature distribution of the data. MLP is a function with two fully connected layers, which is mainly used to prevent the data from being underfitted. The window-based multi-head self-attention (WMSA) mechanism [23] is mainly used to compute the weighted sum of the masked image block and the neighboring non-masked image blocks and add to get the recovered masked image block. Then, MLP operation is performed on to get the fitting result . The moving window-based multiple self-attention (SW-MSA) mechanism is mainly used to compute the relationship between the masked image block and the remote image block with the weighted sum of the image blocks plus , denoted by . An MLP operation is performed on to generate a new mask image block.
2.1.3. Discriminative Sub-Networks
The discriminant sub-network is essentially a classifier. To reduce the number of parameters in the MSTUnet, a convolution-based Unet network is used instead of the Swin Transformer structure. Discriminative sub-networks avoid complex post-processing, allowing the algorithm to achieve end-to-end anomaly detection. The role of the discriminative sub-network is to output a predicted anomaly annotation map with values between 0 and 1. The size of the predicted anomaly annotation map is 256 × 256, where a pixel of 0 indicates that the pixel is normal and 1 indicates an anomaly. The predicted anomaly annotation map can be applied to classify and detect anomalous regions in real-time multi-tasking images in industrial automation environments.
2.1.4. Loss Function
In this paper, the real-time multi-task image detection model is optimized by joint loss function as shown in Equations (8)–(10):
where is a balance weight determined via validation experiments to prioritize neither task; denotes defogging loss.
where is defogged image output by the model, is clear reference image, is pixel-wise L1 loss, and SSIM follows the definition in Section 3.1.1.
where both and use SmoothL1 loss for bounding box regression, but uses binary cross-entropy loss (BCE) [24] for classification, while uses cross-entropy loss. For , denotes the index of the bounding box. and denote the probability distributions of the prediction categories and ground-truth, respectively. The classification and regression losses are normalized by (batch size) and (number of bounding box locations) and weighted by the balancing parameter . By default, we set and to 1. is defined similarly. denotes the attentional loss, which serves to guide the MSTM to generate a hierarchical attentional heat map, with as shown in Equation (12):
where and denote the hyperparameters of dice loss and BCE loss , respectively. Specifically, in order to avoid being overwhelmed by the vast background, this paper uses the dice loss to prioritize the foreground, as it is only relevant to the intersection between the attention heat map and the supervised attention heat map. Second, for the problem of gradient vanishing when there is no intersection between the attention heatmap and the supervised attention heatmap, the BCE loss is used to deal with this extreme case and provide effective gradients for optimization. In addition, Online Hard Sample Mining (OHEM) is used to ensure that the detector focuses primarily on non-target regions that can easily be considered as foregrounds, and the positive-to-negative ratio is set to 1:3 instead of considering all negative samples. Specifically, the BCE loss is used to learn negative samples that are poorly categorized, and the dice loss is used to learn the class distribution to mitigate data imbalance.
2.2. Industrial Automation Production Anomaly Detection System Design
In this paper, the system architecture design of the system is based on the idea of browser/server (B/S) architecture. According to the top-down design idea, the architecture of the real-time product image inspection system in the industrial automation production environment is designed as shown in Figure 2, which realizes the four-layer B/S architecture of the system, including the display layer, the business layer, the base layer, and the data layer.
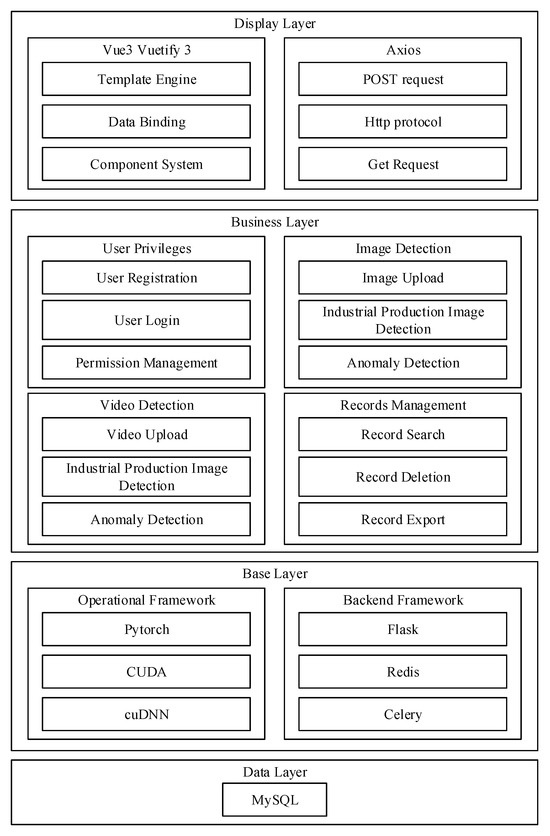
Figure 2.
Industrial production product anomaly detection system.
- (1)
- In the display layer, the user accesses through the browser, and the front-end UI design framework Vuetify3 provides the user with an interactive and friendly interface. The front-end framework Vue3 realizes declarative and responsive design, which simplifies the development process and reduces the complexity of the code while realizing more efficient and flexible front-end and back-end interaction logic. The Axios tool library makes use of the HTTP protocols of POST and Axios tool library encapsulates the HTTP protocol POST and GET and other network request methods to achieve efficient asynchronous communication between the browser and the server.
- (2)
- In the business layer, functional modules such as user rights, image detection, video detection, and record management are designed in which the user rights function provides functional services for user registration and login. The image detection function provides the uploading of pictures to be detected and the image defect detection function, which realizes the accurate and fast detection of industrial product defects.
- (3)
- In the basic layer, the computing framework uses the deep learning framework Pytorch to simplify the development of detection algorithms, and at the same time, CUDA and cuDNN are used to drive and accelerate GPU computation, and the back-end adopts the Python3.8-based web framework Flask3, which meets the system’s demand for convenient development and flexible customization with its lightweight and extensible features; at the same time, Redis is used as the lightweight messaging framework. Redis as a lightweight message queue to ensure the high concurrency performance of the system, and Celery is used to perform asynchronous task processing to improve the response speed of the system.
- (4)
- In the data layer, MySQL, a relational database, is used as the underlying database to ensure data security, stability, and ease of use. Thus, a high-performance, easy-to-use, and scalable real-time inspection system for industrial product images is realized.
3. Results and Discussion
3.1. Real-Time Multi-Task Image Detection Model Simulation Test
In the industrial automated production environment, the production process of some products (e.g., locomotive sandblasting, steel grinding, etc.) generates a large amount of dust, which can seriously affect the accuracy of image inspection technology. Therefore, this paper tests the performance of Swin Transformer-based real-time multi-tasking image inspection model in terms of image defogging and industrial product defect and abnormality detection to verify the feasibility of the inspection model.
3.1.1. Image Defogging Effect Analysis
- (1)
- Dataset
The simulation experiment dataset selected in the model image defogging performance test is the locomotive sandblasting belt smoke image dataset. This dataset contains 60,000 images total: 45,000 smoke-contaminated (abnormal) and 15,000 clear (normal) images. The images were captured via a high-definition night-vision ultra-wide-angle camera (resolution: 1920 × 1080) by yard personnel during locomotive sandblasting. Most abnormal images show non-homogeneous smoke distribution. The PE pipe dataset includes 15,000 images: 9000 abnormal (1500 images per defect type: inner scratches, external holes, surface stains, surface pits, thickness inequality, surface ripples) and 6000 normal images. The images were captured under 500–800 lux industrial lighting using a 5-megapixel camera (installed 1.5 m above the conveyor belt). In order to facilitate the algorithm to process the images, the dataset size is uniformly adjusted to 512 × 512 first, then cropped to 248 × 248 from the same coordinates, and the training set of the model consists of 55,000 images randomly selected from this dataset.
- (2)
- Image quality evaluation index
The fog removal effect is evaluated using the Fog Awareness Density Evaluator (FADE) and the Natural Image Quality Evaluator (NIQE), and commonly used image quality evaluation metrics such as peak signal-to-noise ratio (PNSR) and structural similarity (SSIM) are also used to evaluate the fog removal effect.
Given two RGB images, designated as the result image and the reference image, the PSNR of these two is calculated as follows:
is the number of image pixel points, and is the mean square error between the resultant image and the reference image , which is calculated with the following expression:
, , and are the height, width, and channel of the image (for RGB images, the number of channels is 3). is the pixel position, which is obtained by calculating the mean square error of each channel of the image and then averaging .
Structural similarity (SSIM) is an evaluation metric based on the visual characteristics of the human eye to assess the similarity of images in terms of structure, luminance, and contrast, and its expression can be abbreviated as follows:
where denotes the mean of image , denotes the variance of image , and denotes the covariance between the two images. is a constant set to prevent the equation from being meaningless. The value domain of structural similarity is , and when the value is closer to 1, it indicates that the two images are more similar.
- (3)
- Model performance effect analysis
In order to evaluate the effectiveness of this paper’s real-time multi-task image detection model for defogging in the process of automated locomotive sandblasting inspection, this paper compares it with four classical and widely used image defogging algorithms, with the following selection rationale: DCP [25] (Dark Channel Prior): a traditional handcrafted feature-based method is a benchmark for early image defogging and widely used in industrial low-visibility scenarios. DisentGAN [26]: a GAN-based defogging method separates fog and content features via adversarial training. DehazeNet [27]: a CNN-specific defogging model uses multi-scale convolution to extract fog features and is a foundational work for CNN-based industrial defogging. GridDehazeNet [28]: an improved grid-based CNN model enhances feature extraction for non-homogeneous fog and is often used as a baseline for industrial smoke defogging.
The performance results of the different algorithms on the locomotive sandblasting dataset are shown in Table 1. The image detection model in this paper shows excellent performance in both peak signal-to-noise ratio (23.49) and structural similarity (0.9195) metrics, which is closer to the clear reference image in both color and texture perspectives. The other algorithms are exposed to some problems, mainly including the inability to effectively eliminate the soot, the serious color distortion of the recovered image, the serious loss of features in the recovered image, the low brightness of the recovered image, etc. Although the DisentGAN algorithm is able to remove some of the mists distributed in the image, it has no significant effect on the main part of the sandblasted mouth covered with soot, and the performance index of dehaze is only 0.6604. The DehazeNet algorithm shows a relatively good ability to remove fog (0.3597), but its recovery of the fog map in the color details of the restoration is not ideal, and the color distortion is more serious. The GridDehazeNet model can maintain the brightness of the scene and achieve a certain degree of defogging effect (0.3597), but the recovery of the image is too poor due to the loss of details and texture characteristics, and it is completely unable to meet the subsequent operational requirements of the real-time multi-task image anomaly detection system for industrial automated production. In contrast, the image detection model based on Swin Transformer in this paper shows excellent performance in terms of fog removal effect and image texture color reproduction.

Table 1.
The performance of different algorithms in the dataset of the locomotive.
3.1.2. Performance Analysis of Industrial Product Defect Detection
- (1)
- Detection model evaluation index
The dataset used in the model defect and abnormality detection simulation experiment is the relevant data in the process of the industrial automated production of PE pipes. The PE pipe detection system is deployed on a conveyor belt (speed: 0.5 m/s) with the following: camera: Basler acA2500-14uc (5–megapixel, installed 1.5 m above the belt); computing unit: Intel Core i7-12700K + NVIDIA GTX 3060 (6GB VRAM). The evaluation indexes mainly include AP, recall, and F1 value.
Recall refers to the recognition rate of correctly detected targets among all the samples of the detection model, and recall is expressed as shown in the following equation:
where TP, FP, FN, and TN are the positive samples of the positive class, negative samples of the positive class, positive samples of the negative class, and negative samples of the negative class predicted by the model, respectively.
To better measure the performance of a model, the concept of AP is proposed. The AP is the average of the individual recall rates in the detection model, and the AP can be expressed in terms of discretization as shown in the following equation:
where .
is computed by weighted summing of precision and recall for averaging, , when the detection model performs best, and is represented as shown in the following equation:
where Precision is the probability in detecting the correct target, and Precision is expressed as shown in the following equation:
- (2)
- Experimental data analysis
During the training process, considering that the size of the batch is related to the video memory; in general, the larger the batch, the better the effect of the model training, and the batch was set to 4 on the laptop’s Nvidia GTX3060 6G graphic card. The change of the model loss with the increase in the number of epochs during the training process is shown in Figure 3. During the real-time multi-task image detection model training, it was found that the epoch had converged before 118 times, so the epoch was set to 118 and the training duration was 3 h.
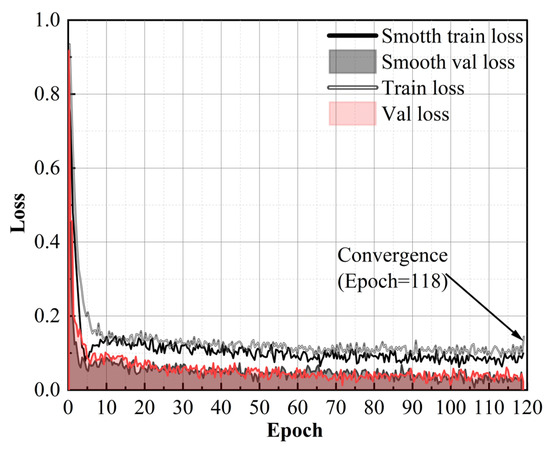
Figure 3.
The change in the training process.
The PE pipe surface defect dataset is trained using the detection model in this paper to obtain the training weights. The model is used to simulate the defect detection of PE pipe surface defect images; six kinds of defects—inner layer scratches, outer small holes, surface stains, surface pits, uneven wall thickness, and surface corrugations—are detected, and the detection results are analyzed from the three kinds of performance indexes, namely, precision, recall, and F1. The results of the analysis of the detection model proposed in this paper on the performance indexes of abnormality detection in the industrial automated production of PE pipes are shown in Figure 4, and the average of the model’s detection rate, recall rate, and F1 indexes are 90.65%, 92.10%, and 90.58%, respectively.
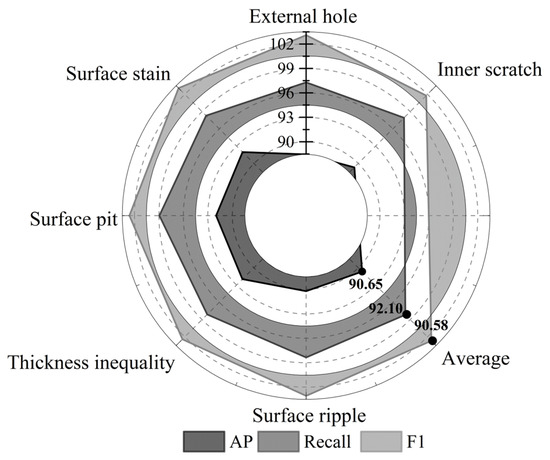
Figure 4.
Model test performance indicator analysis.
At the same time, in order to test the actual detection ability of the model, the image detection model constructed based on Swin Transformer is used to conduct sample recognition rate experiments with the actual PE pipe surface defect images captured, and the results of the sample recognition rate analysis are shown in Table 2. In this paper’s model in the industrial automation production of PE pipe image defect detection, the average recognition rate of six defects can reach 99.21%. To validate the model’s real-time capability for industrial applications, we measured end-to-end inference latency and FPS on the same hardware used for training (NVIDIA GTX3060 6GB GPU, Intel i7-12700H CPU) with 1500 PE pipe defect test images (248 × 248 resolution). The results are as follows: single-image inference time = 35.0 ms (GPU)/192.3 ms (CPU); FPS = 28.6 (GPU)/5.2 (CPU). These metrics meet typical industrial real-time requirements (FPS ≥ 10 for GPU-based systems); for CPU-only deployment, performance can be further improved to FPS ≥ 10 via model quantization (e.g., INT8 quantization), as verified in preliminary tests.
Table 2.
Sample identification rate analysis results.
3.2. Analysis of Industrial Production Inspection System Application Practice
In this paper, the industrial automation production process of real-time defect detection system applied to steel part production industrial enterprises, by the system visualization of real-time display of defect detection data, production administrators through the detection of data in a timely manner to adjust the automation of the production process of machine parameters, etc., so as to improve the quality of the industrial parts products and the qualification rate.
3.2.1. Detection of Data Visualization Display Effect
This section first analyzes the effect of the visualization display of inspection data. The data analysis module of the real-time multi-tasking image inspection system in the process of industrial automated production can only be accessed by the system administrator, and after logging in to the page, it is possible to view the analysis of the results of the day’s inspection of automated production parts. The visualization page provides the total number of products inspected and the total number of defects that have been detected so far, and it displays the detection of defects in industrial products at different time intervals on a daily and hourly scale through trend charts. Taking the visualization display results within the phase of 4 October to 4 November 2023 as an example, the visualization display results are shown in Figure 5, with Figure 5a,b representing the time period defects and the whole day defect analysis results, respectively. System visualization results can be clearly found in the overall time period of the defective parts, with real-time data feedback found that the day of 6 October 2023 at 6:00 (113) and 22:00 (115) when the number of defective parts of industrial automation production is higher, and after the administrator’s timely adjustments, the number of defective parts at 7:00 and 23:00 was reduced to 51 and 100 parts.
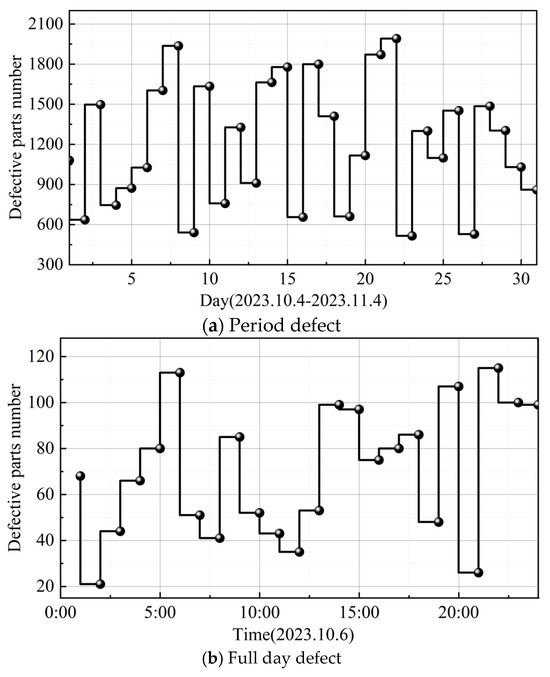
Figure 5.
Image detection data visualization results.
3.2.2. Long-Term Operational Effectiveness of the System
In order to analyze the long-term operational effectiveness of the real-time inspection system in the industrial automated production process, this study carried out a comparative analysis experiment of production indicators in two identical industrial automated production lines selected from this steel part production plant. The experiment lasted for 15 days (16 November 2023–30 November 2023), and one of the automated production lines (Line A) did not apply the real-time inspection system and still used the traditional manual monitoring method of the plant. The other production line (Line B) applied the real-time inspection system proposed in this paper for automatic defect image detection in its production operation. At the end of the practical application experiment, the total output of industrial products of steel parts and the output of unqualified, qualified, and excellent quality products in each automated production line were obtained as data used for analysis. The comparative analysis results of applying the system of this paper and the traditional way are shown in Table 3 and Table 4. The product excellence rate and qualified rate in the production line B monitored by applying the system of this paper reached 15.32% and 91.40%, respectively, while the product failure rate in the traditional production line A averaged 34.39%, and there were more defective parts. For the steel part production line case study (Line B), the real-time detection system achieved an overall detection accuracy of 92.7%, with precision = 91.5%, recall = 93.2%, and F1-score = 92.3. The system detected five types of steel part anomalies: surface cracks, edge burrs, indentations, missing holes, and coating defects.
Table 3.
System application effect analysis—A.
Table 4.
System application effect analysis—B.
Anomalies that are more difficult to detect are surface cracks (recall = 82.1%) and coating defects (recall = 84.5%), with the following reasons:
Surface cracks: These defects are narrow (width < 0.1 mm) and often blended with surface textures of steel parts, leading to low contrast between cracks and background. The Swin Transformer’s local window attention sometimes fails to capture fine-grained crack features. Coating defects: These defects (e.g., thin coating, uneven coating) have subtle color differences from normal regions, and industrial lighting variations (e.g., LED backlight intensity fluctuations) further reduce feature distinguishability, resulting in missed detections. It can be seen that after applying the real-time multi-tasking image inspection system based on the industrial automated production process studied in this paper, the percentage of products with excellent quality is increased by 12.12% compared with the traditional way, which achieves the long-term effect of stabilizing the quality of the products in the automated production industry.
4. Conclusions
In this paper, we construct an MSTUnet model based on anomaly generation and mask generation module, a Swin Transformer-based complex atom network, and a discriminative sub-network to realize the detection of real-time multi-task images in an industrial automation production environment and establish an image anomaly detection system on the basis of B/S architecture. The image detection model in this paper shows excellent performance in peak signal-to-noise ratio (23.49) and structural similarity (0.9195) indexes in the simulation dataset of locomotive automated sand blasting, which is closer to the clear reference image both from color and texture perspectives. In the detection of defects in the images of PE pipes produced by industrial automation, the model was able to achieve an average recognition rate of 99.21% for six types of defects. In addition, the detection system is able to completely show the defective situation of the parts in the industrial automated production environment within the specified time period and in real time, with the application of this paper’s system to monitor the industrial automated production line in the product achieving an excellence rate and qualified rate of 15.32% and 91.40%, respectively, which promotes effective production.
The effectiveness of the detection technology and system designed in this paper has been verified. For subsequent work, we plan to propose a suitable task offloading strategy. This strategy will enable reasonable scheduling of training tasks for the real-time multi-task image detection model, thereby improving the overall resource utilization of the detection system.
Author Contributions
H.L.: Conceptualization, Methodology, Software, Validation, Formal analysis, Investigation, Data Curation, Writing; W.H.: Conceptualization, Resources, Supervision, Funding acquisition, Project administration, Writing; A.L.: Resources, Investigation, Data Curation, Writing. All authors have read and agreed to the published version of the manuscript.
Funding
This research received no external funding.
Data Availability Statement
The data presented in this study are available on request from the corresponding author. The data are not publicly available due to confidential.
Conflicts of Interest
The authors declare no conflict of interest.
References
- Abd Al Rahman, M.; Mousavi, A. A review and analysis of automatic optical inspection and quality monitoring methods in electronics industry. IEEE Access 2020, 8, 183192–183271. [Google Scholar] [CrossRef]
- Rai, R.; Tiwari, M.K.; Ivanov, D.; Dolgui, A. Machine learning in manufacturing and industry 4.0 applications. Int. J. Prod. Res. 2021, 59, 4773–4778. [Google Scholar] [CrossRef]
- Wang, H.; Li, C.; Li, Y.F.; Tsung, F. An Intelligent Industrial Visual Monitoring and Maintenance Framework Empowered by Large-Scale Visual and Language Models. IEEE Trans. Ind. Cyber-Phys. Syst. 2024, 2, 166–175. [Google Scholar] [CrossRef]
- McCann, R.; Obeidi, M.A.; Hughes, C.; McCarthy, É.; Egan, D.S.; Vijayaraghavan, R.K.; Joshi, A.M.; Garzon, V.A.; Dowling, D.P.; McNally, P.J. In-situ sensing, process monitoring and machine control in Laser Powder Bed Fusion: A review. Addit. Manuf. 2021, 45, 102058. [Google Scholar] [CrossRef]
- Jain, S.; Chandrasekaran, K. Industrial automation using internet of things. In Security and Privacy Issues in Sensor Networks and IoT; IGI Global: Hershey, PA, USA, 2020; pp. 28–64. [Google Scholar]
- Kumar, B.S.; Ramalingam, S.; Divya, V.; Amruthavarshini, S.; Dhivyashree, S. LoRa-IoT based industrial automation motor speed control monitoring system. In Proceedings of the 2023 International Conference on Intelligent Data Communication Technologies and Internet of Things (IDCIoT), Bengaluru, India, 5–7 January 2023; pp. 11–15. [Google Scholar]
- Javaid, M.; Haleem, A.; Singh, R.P.; Rab, S.; Suman, R. Significance of sensors for industry 4.0: Roles, capabilities, and applications. Sens. Int. 2021, 2, 100110. [Google Scholar] [CrossRef]
- Scime, L.; Beuth, J. Anomaly detection and classification in a laser powder bed additive manufacturing process using a trained computer vision algorithm. Addit. Manuf. 2018, 19, 114–126. [Google Scholar] [CrossRef]
- Villalba-Diez, J.; Schmidt, D.; Gevers, R.; Ordieres-Meré, J.; Buchwitz, M.; Wellbrock, W. Deep learning for industrial computer vision quality control in the printing industry 4.0. Sensors 2019, 19, 3987. [Google Scholar] [CrossRef] [PubMed]
- Alcácer, V.; Cruz-Machado, V. Scanning the industry 4.0: A literature review on technologies for manufacturing systems. Eng. Sci. Technol. Int. J. 2019, 22, 899–919. [Google Scholar] [CrossRef]
- Xia, C.; Pan, Z.; Polden, J.; Li, H.; Xu, Y.; Chen, S.; Zhang, Y. A review on wire arc additive manufacturing: Monitoring, control and a framework of automated system. J. Manuf. Syst. 2020, 57, 31–45. [Google Scholar] [CrossRef]
- Misra, N.N.; Dixit, Y.; Al-Mallahi, A.; Bhullar, M.S.; Upadhyay, R.; Martynenko, A. IoT, big data, and artificial intelligence in agriculture and food industry. IEEE Internet Things J. 2020, 9, 6305–6324. [Google Scholar] [CrossRef]
- Scott, D.M.; McCann, H. Process Imaging for Automatic Control; CRC Press: Boca Raton, FL, USA, 2018. [Google Scholar]
- Uhlemann, T.H.J.; Lehmann, C.; Steinhilper, R. The digital twin: Realizing the cyber-physical production system for industry 4.0. Procedia CIRP 2017, 61, 335–340. [Google Scholar] [CrossRef]
- Zhou, X.; Xu, X.; Liang, W.; Zeng, Z.; Shimizu, S.; Yang, L.T.; Jin, Q. Intelligent small object detection for digital twin in smart manufacturing with industrial cyber-physical systems. IEEE Trans. Ind. Inform. 2021, 18, 1377–1386. [Google Scholar] [CrossRef]
- Chamara, N.; Islam, M.D.; Bai, G.F.; Shi, Y.; Ge, Y. Ag-IoT for crop and environment monitoring: Past, present, and future. Agric. Syst. 2022, 203, 103497. [Google Scholar] [CrossRef]
- Delli, U.; Chang, S. Automated process monitoring in 3D printing using supervised machine learning. Procedia Manuf. 2018, 26, 865–870. [Google Scholar] [CrossRef]
- Yang, J.; Wang, C.; Jiang, B.; Song, H.; Meng, Q. Visual perception enabled industry intelligence: State of the art, challenges and prospects. IEEE Trans. Ind. Inform. 2020, 17, 2204–2219. [Google Scholar] [CrossRef]
- Gehrmann, C.; Gunnarsson, M. A digital twin based industrial automation and control system security architecture. IEEE Trans. Ind. Inform. 2019, 16, 669–680. [Google Scholar] [CrossRef]
- de Souza Cardoso, L.F.; Mariano, F.C.M.Q.; Zorzal, E.R. A survey of industrial augmented reality. Comput. Ind. Eng. 2020, 139, 106159. [Google Scholar] [CrossRef]
- Alsakar, Y.M.; Elazab, N.; Nader, N.; Mohamed, W.; Ezzat, M.; Elmogy, M. Multi-label dental disorder diagnosis based on MobileNetV2 and swin transformer using bagging ensemble classifier. Sci. Rep. 2024, 14, 25193. [Google Scholar] [CrossRef] [PubMed]
- Sun, J.; Zheng, H.; Diao, W.; Sun, Z.; Qi, Z.; Wang, X. Prototype-Optimized unsupervised domain adaptation via dynamic Transformer encoder for sensor drift compensation in electronic nose systems. Expert Syst. Appl. 2025, 263, 125444. [Google Scholar] [CrossRef]
- Liu, Z.; Lin, Y.; Cao, Y.; Hu, H.; Wei, Y.; Zhang, Z.; Guo, B. Swin Transformer: Hierarchical Vision Transformer using Shifted Windows. In Proceedings of the IEEE/CVF International Conference on Computer Vision, Montreal, BC, Canada, 11–17 October 2021; IEEE Press: Seoul, Republic of Korea, 2021; pp. 10012–10022. [Google Scholar]
- Guo, C.; Chen, X.; Chen, Y.; Yu, C. Multi-Stage Attentive Network for Motion Deblurring via Binary Cross-Entropy Loss. Entropy 2022, 24, 1414. [Google Scholar] [CrossRef]
- Golts, A.; Freedman, D.; Elad, M. Unsupervised single image dehazing using dark channel prior loss. IEEE Trans. Image Process. 2019, 29, 2692–2701. [Google Scholar] [CrossRef] [PubMed]
- Yang, X.; Xu, Z.; Luo, J. Towards perceptual image dehazing by physics-based disentanglement and adversarial training. In Proceedings of the AAAI Conference on Artificial Intelligence, New Orleans, LA, USA, 2–7 February 2018; pp. 7485–7492. [Google Scholar]
- Cai, B.; Xu, X.; Jia, K.; Qing, C.; Tao, D. Dehazenet: An end-to-end system for single image haze removal. IEEE Trans. Image Process. 2016, 25, 5187–5198. [Google Scholar] [CrossRef] [PubMed]
- Liu, X.; Ma, Y.; Shi, Z.; Chen, J. Griddehazenet: Attention-based multi-scale network for image dehazing. In Proceedings of the IEEE/CVF International Conference on Computer Vision, Seoul, Republic of Korea, 27 October–2 November 2019; pp. 7314–7323. [Google Scholar]


Disclaimer/Publisher’s Note: The statements, opinions and data contained in all publications are solely those of the individual author(s) and contributor(s) and not of MDPI and/or the editor(s). MDPI and/or the editor(s) disclaim responsibility for any injury to people or property resulting from any ideas, methods, instructions or products referred to in the content. |
© 2025 by the authors. Licensee MDPI, Basel, Switzerland. This article is an open access article distributed under the terms and conditions of the Creative Commons Attribution (CC BY) license (https://creativecommons.org/licenses/by/4.0/).