Article

Time-Frequency Conditional Enhanced Transformer-TimeGAN for Motor Fault Data Augmentation

1
Kaiserslautern Intelligent Manufacturing School, Shanghai Dianji University, Shanghai 201306, China
2
Electrical Engineering College, Shanghai Dianji University, Shanghai 201306, China
*
Author to whom correspondence should be addressed.
Machines 2025, 13(10), 969; https://doi.org/10.3390/machines13100969
Submission received: 27 August 2025 / Revised: 7 October 2025 / Accepted: 17 October 2025 / Published: 20 October 2025
(This article belongs to the Section Electrical Machines and Drives)

Abstract

Data augmentation is crucial for electric motor fault diagnosis and lifetime prediction. However, the diversity of operating conditions and the challenge of augmenting small datasets often limit existing models. To address this, we propose an enhanced TimeGAN framework that couples the original architecture with transformer modules to jointly exploit time- and frequency-domain information to improve the fidelity of synthetic motor signals. The method fuses raw waveforms, envelope features, and instantaneous phase-change cues to strengthen temporal representation learning. The generator further incorporates frequency-domain descriptors and adaptively balances time–frequency contributions through learnable weighting, thereby improving generative performance. In addition, a state-conditioning mechanism (via explicit state annotations) enables controlled synthesis across distinct operating states. Comprehensive evaluations—including PCA and t-SNE visualizations, distance metrics such as DTW and FID, and downstream classifier tests—demonstrate strong adaptability and robustness on both public and in-house datasets, substantially enhancing the quality of generated time series.

1. Introduction

In industrial production, the operating condition of electric motors directly affects the efficiency of critical equipment [1]. The rise of deep learning has spawned a large body of methods for fault diagnosis and prognosis, yielding substantial progress in industrial applications that require cross-domain generalization and unknown-class fault diagnosis [2,3]. However, as motor hardware continues to improve, collecting realistic and fully annotated fault data has become increasingly difficult [4]; training such models typically demands large quantities of reliable normal and faulty samples to secure strong generalization. To address data scarcity and distribution shift, data augmentation, synthetic data generative modeling, and self- or semi-supervised learning are often coupled with simulation-to-real co-design and consistency constraints, thereby enhancing the effectiveness of model training [5].
In machine learning and the broader computer industry, data augmentation has traditionally relied on manual simulation and synthesis, often through noise injection [6], interpolation-based synthesis [7], or fuzzy processing [8]. With the advent of deep learning, augmentation methodologies have become more automated and sophisticated, incorporating reinforcement learning-driven policies [9], analog synthesis [10], and mixed-sample strategies [11] to enhance effectiveness and generalization. Nevertheless, given the rapid evolution of neural architectures, many of these approaches remain comparatively simple and may lack diversity and realism, thereby limiting their applicability to more complex models.
The advent of Generative Adversarial Networks (GANs) [12] and Variational Autoencoders (VAEs) [13] has opened new avenues for data augmentation. GANs leverage adversarial training to synthesize realistic samples, thereby expanding training sets in data-scarce scenarios, while VAEs facilitate small-sample learning through self-supervised objectives and unsupervised pretraining. Building on these foundations, numerous derivatives have emerged, including DCGAN [14,15] with deep convolutional/transpose-convolutional architectures, WGAN [16] based on the Wasserstein distance, conditional variants such as C-GAN [17] and CVAE [18], CycleGAN [19] employing cycle-consistency constraints, and Factor-VAE [20] promoting disentangled latent factors. Collectively, these semi-supervised and unsupervised methods reduce reliance on manual labeling and learn high-dimensional representations by modeling the underlying data distribution. The MDGCML framework—a multi-source domain gradient-coordination approach—enhances robustness to noise and unknown factors in few-sample regimes, thereby enabling more effective learning and training [21]. Together, these advances have substantially propelled the development of data augmentation methodologies [22].
However, when confronted with long and variable-length time series, conventional GAN-based models exhibit reduced efficiency: they prioritize distributional alignment while often overlooking temporal dependencies and long-range dynamics. As a result, their performance on time-series generation is frequently suboptimal [23].
TimeGAN [24] is a generative framework for time series that couples a sequence encoder with an autoregressive RNN within a multi-stage GAN architecture. It captures both distributional characteristics and temporal dynamics through an unsupervised and self-supervised co-training scheme that learns a shared latent space; operating in this hidden space enhances interpretability and improves similarity and predictability of the synthesized data [25,26]. In industrial motors, operational vibration and acoustic noise are ubiquitous, and faults introduce periodic anomalies and impulsive disturbances. The prevalence of outliers and the long temporal span complicate TimeGAN’s learning of motor-state vibration signals, often yielding sequences that diverge from the true distribution over extended horizons. To mitigate long-term dependency issues, the RNN component in TimeGAN can be replaced with LSTM [27,28] or Bi-LSTM [29,30]; 1D CNNs also retain strong temporal feature-extraction capability, capturing local- and multi-scale patterns along the time axis with high parameter efficiency [31]. For multi-source signals, an OOBN-based framework performs decision-level fusion via Bayesian networks and evidence weighting, thereby improving inference reliability; in addition, residual-analysis and excitation-factor modules enhance robustness to noise and operational uncertainties [32,33]. Incorporating self-attention mechanisms [34] or Transformer modules [35] into TimeGAN strengthens the modeling of latent representations and temporal dependencies, further improving generative performance.
Despite demonstrated improvements in data quality, several challenges remain for augmenting class-specific motor-state data: (1) for periodic signals (vibration and current), many generators underemphasize temporal dependencies and their alignment with the underlying process, leading to ineffective cycle-level learning; (2) models trained purely in the time domain or under weak conditioning exhibit limited robustness to the intrinsic variability and noise of the raw signals; and (3) for multivariate time series, generators tend to match overall statistical properties while neglecting informative frequency-domain structure.
In this paper, we present Transformer-TimeGAN, a generative framework that leverages time-domain envelope signals and instantaneous phase variations to strengthen temporal representation learning. Within the generator, a cross-attention mechanism fuses time- and frequency-domain representations, while a learnable dynamic-weighting module adaptively balances their contributions, thereby improving synthesis fidelity. The contributions of this study are summarized as follows:
(1)
In the time-domain generator, a Transformer architecture integrates features from the raw waveform, the envelope, and instantaneous phase variations. A time-step (positional) embedding reinforces temporal dependencies, thereby enhancing the model’s capacity to learn informative time-domain representations.
(2)
The generator hierarchy is divided into a time-domain hierarchy as well as a frequency-domain hierarchy, both of which are learned and then dynamically weighted to make the total generator more focused on the fusion features.
(3)
Label-Conditioning Constraints: Discrete labels are embedded into a continuous conditional space and, after linear projection, concatenated with the input signal. Layer-wise conditioning in the latent space steers features toward the specified condition, ensuring that the generated outputs remain well-aligned with the original signal.
(4)
The delay loss function is established to emphasize the continuity and correlation between each time step and the subsequent time steps, smoothing out the delay loss, and combining the discriminator loss as one of the criteria for judging the generation of the generator.
The paper is organized as follows: Section 2 describes the generative model constructed in this paper; Section 3 validates the differences between the generated data and the original data using the publicly available dataset [36], as well as the self-constructed dataset as an example; Section 4 provides the conclusions.

2. Materials and Methods

2.1. Theory

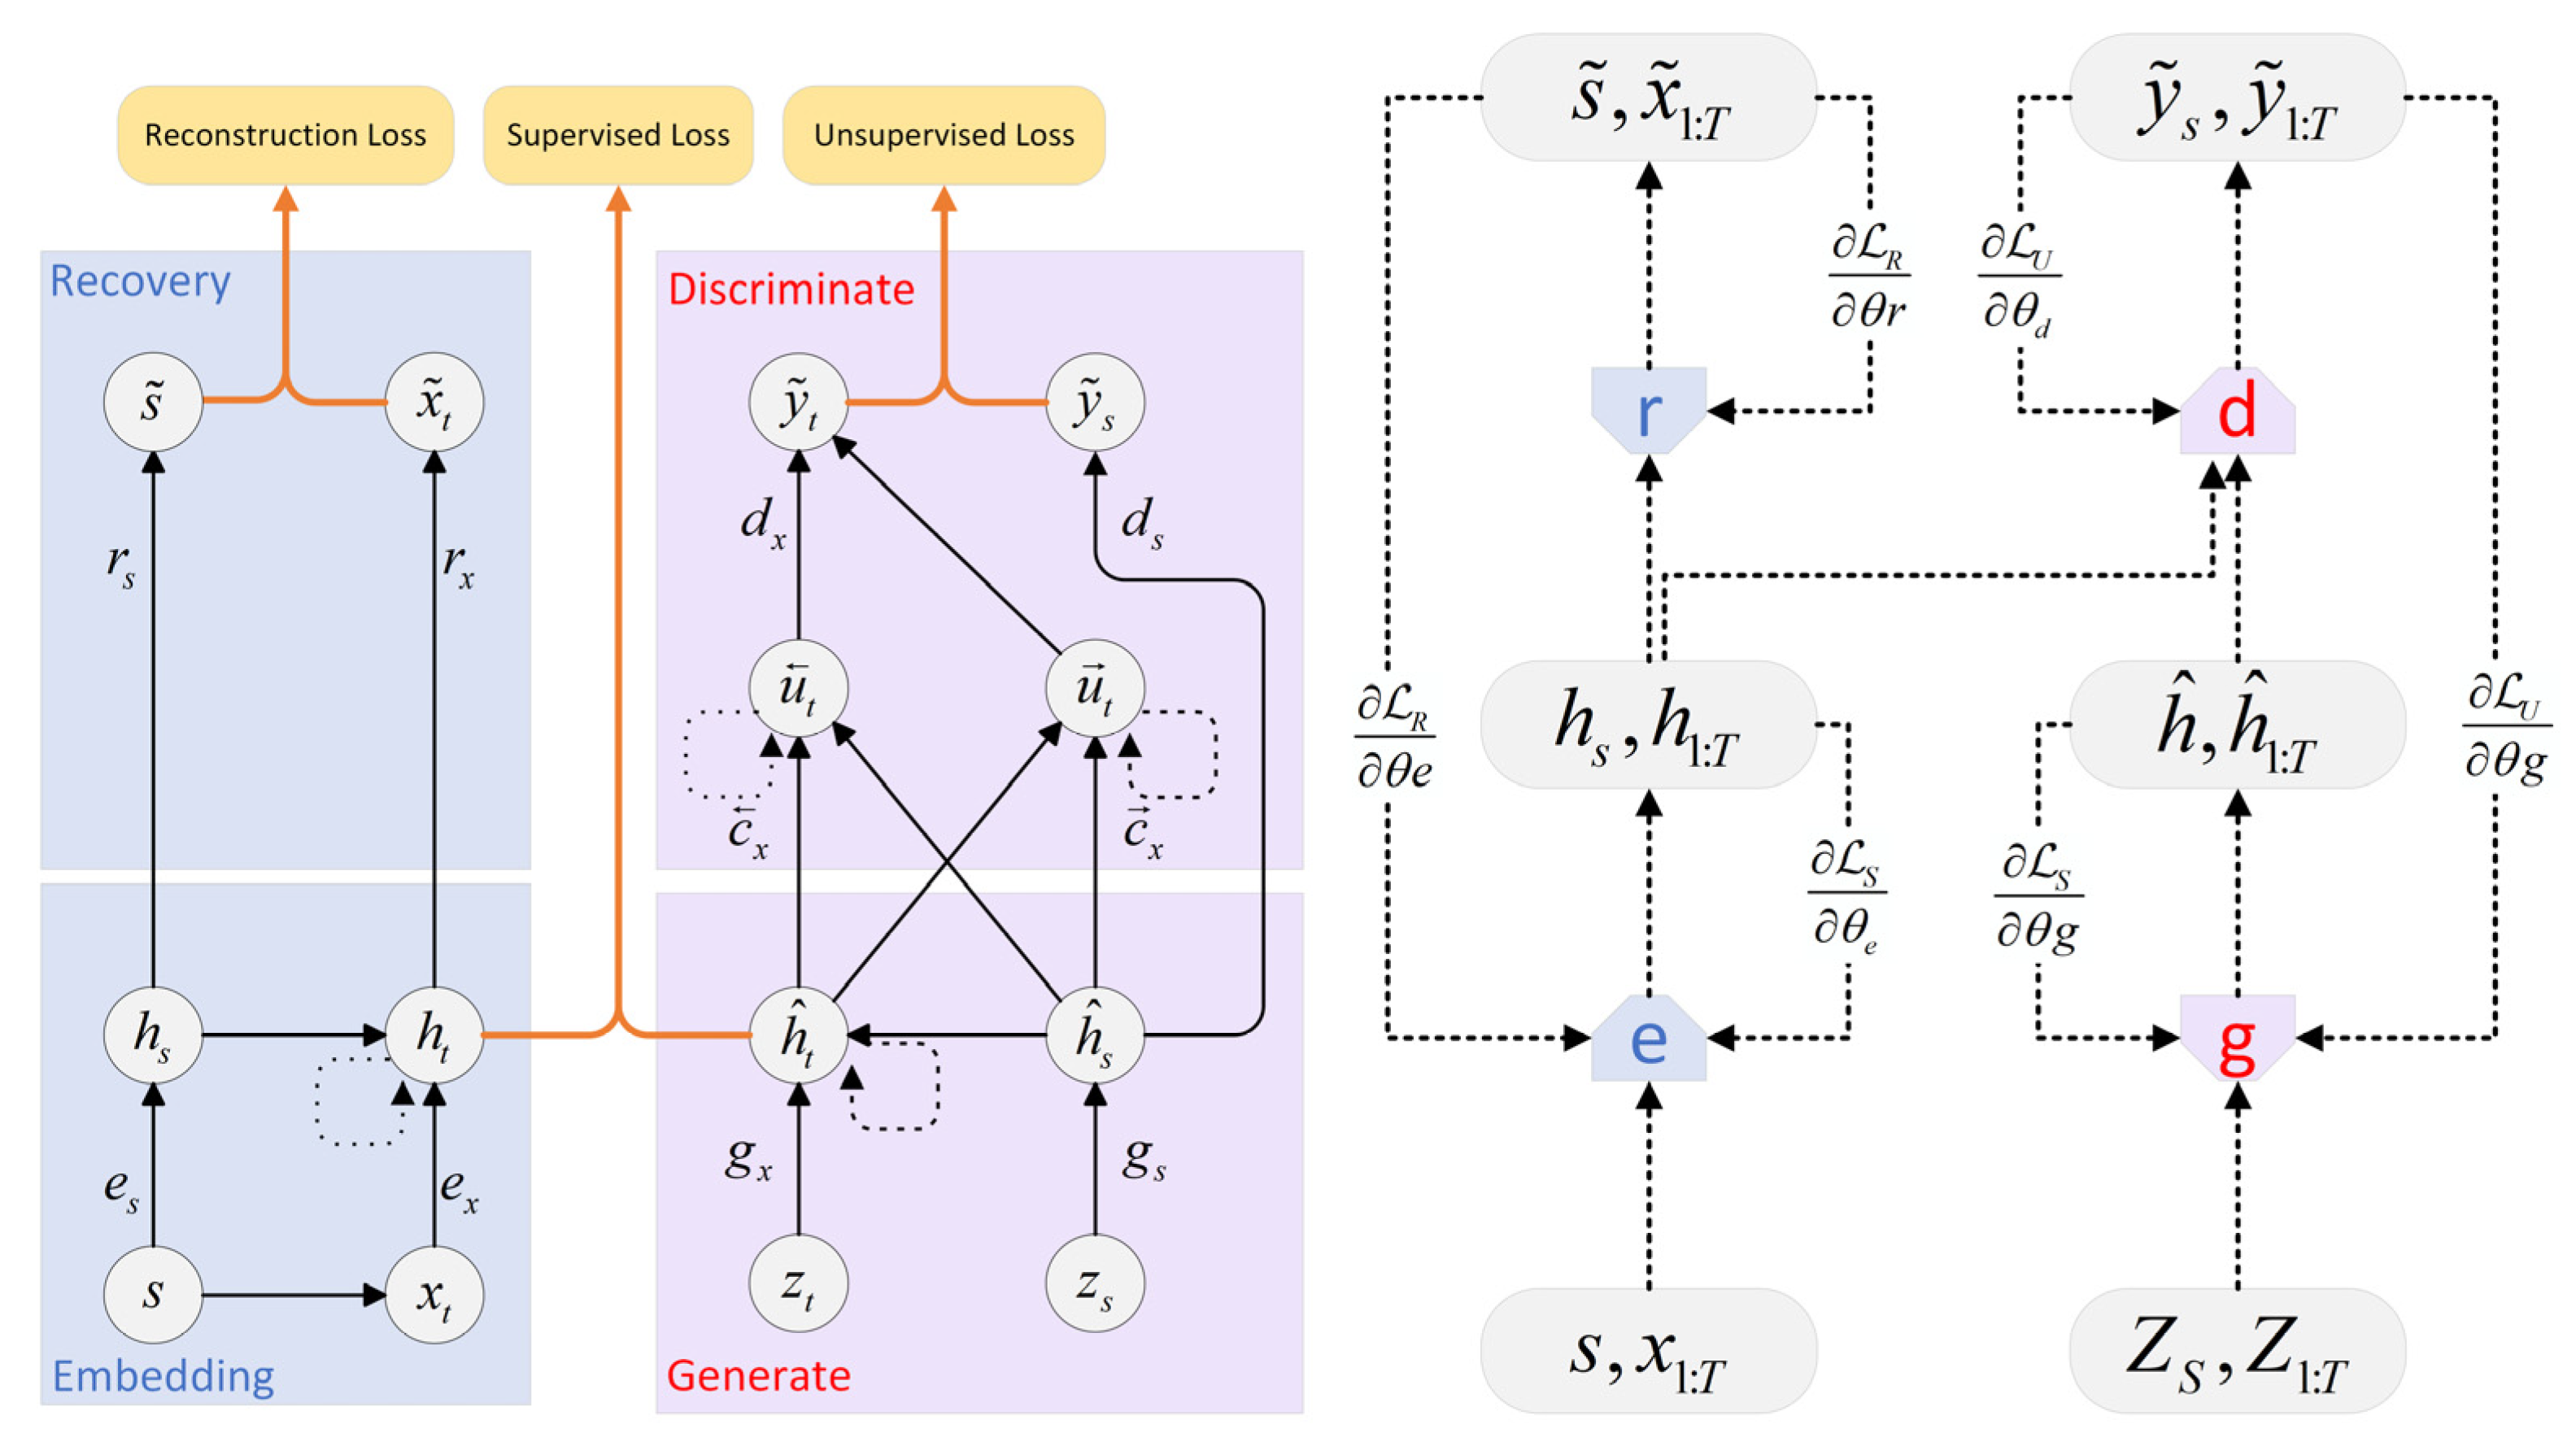
TimeGAN consists of an embedding layer, a recovery (decoder) layer, a supervision layer, and a generator, as shown in Figure 1. Unlike conventional GANs, TimeGAN introduces an explicit encoding component, a joint training scheme, and a tailored loss that couple adversarial and supervised objectives to learn temporally coherent latent representations. The goal is to learn a model from the original dataset M , such that the joint density over the static feature vector S S and the temporal feature sequence X X denoted p ^ S , X 1 : T , approximates the true distribution p S , X 1 : T in (1). Using an autoregressive factorization, we further define per-time-step targets with density p ^ X t | S , X 1 : t 1 that approximate p X t | S , X 1 : t 1 for each t in (2). p denotes a probability distribution, and T is the sequence length used for training.
Under an idealized GAN formulation, the distribution-matching objective reduces to the Kullback–Leibler (KL) divergence, whereas the supervised component corresponds to maximum-likelihood estimation.
min p ^   M p S , X 1 : T p ^ S , X 1 : T
min p ^   M p X t | S , X 1 : t 1 p ^ X | S , X 1 : t 1
TimeGAN has three main types of joint losses:

2.1.1. Reconstructions Loss (Embedding and Recovery)

The embedding and recovery layers establish a mapping between observed features and a latent space, enabling the adversarial module to capture fundamental temporal dynamics through low-dimensional representations. The embedding function e : S × t X H S × t H X maps the static feature vector s and the dynamic sequence x to their latent counterparts H S and H X , respectively, h S , h 1 : T = e s , x 1 : T
h S = e S ( s ) h t = e X h S , h t 1 , x t
e S : S H S denotes the static encoder that maps the static features S to the latent static space H S ; h S is the resulting latent vector. e X : H S × H X × X denotes the temporal encoder, applied iteratively along the sequence, which maps h S to the latent temporal state h t .
The recovery function r : H S × t H X S × t X maps latent representations back to the original spaces s ˜ and x ˜ for producing reconstructions, s ˜ , x ˜ 1 : T = r h s , h 1 : T
s ˜ = r S h S x ˜ t = r X h t
r S : H S S and r X : H X X denote the decoders that recover the embedded latent static and temporal representations to the original spaces S and X , respectively.
The reconstruction loss R is defined to assess whether the embedding–recovery pipeline accurately maps the latent variables h S , h 1 : T to s ˜ , x ˜ 1 : T so that the reconstructions match the original data s , x 1 : T .
R = E s , x 1 : T ~ p s s ˜ 2 + t x t x ˜ t 2

2.1.2. Unsupervised Loss (Generator and Discriminator)

The sequence generator operates on static and dynamic inputs sampled from prior noise spaces Z S and Z X , respectively. Random vectors z s and z t are drawn and transformed into the generative latent spaces H S and H X . The generator function g : Z S × t Z X H S × t H X maps the static–dynamic tuple of noise vectors to latent codes, h ^ s , h ^ 1 : T = g z s , z 1 : T .
h ^ S = g S z S · h ^ t = g X h ^ S , h ^ t 1 , z t
g S : Z S H S denotes the static generator that maps the static noise space Z S to the latent space H S ; g X : H S × H X × Z X H X denotes the temporal generator, applied recursively over time, which maps h ^ S to the latent state h ^ t .
The discriminator, analogous to the generator, operates in the embedding space. The mapping d : H S × t H X [ 0 , 1 ] × t 0 , 1 takes static and temporal latent codes as input and returns discrimination scores y ˜ , y ˜ 1 : T = d h ˜ s , h ˜ 1 : T . h ˜ S , h ˜ 1 : T denotes latent embeddings that may correspond to encoded real data h S , h 1 : T or generated data h ^ S , h ^ 1 : T , which is the output y ˜ S , y ˜ 1 : T 0 , 1 represent class-posterior scores.
y ˜ S = d S h ˜ S · y ˜ t = d X u t , u t
where d S and d X are the static and temporal discriminative components, respectively.
u t = c X h ˜ S , h ˜ t , u t 1 and u t = c X h ˜ S , h ˜ t , u t 1 respectively denotes forward and backward hidden-state sequences. c X and c X are recurrent transition functions. The unsupervised loss function L U reflects the adversarial relationship between the generator and the discriminator, which maximizes the likelihood of truly classifying the training data h S , h 1 : T by the discriminator, while minimizing this likelihood for the generator, versus generated sequences h ^ S , h ^ 1 : T , whereas the generator is trained to minimize this objective and thereby fool the discriminator.
U = E s , x 1 : T ~ p log y S + t log y t + E s , x 1 : T ~ p ^ log 1 y ^ S + t log 1 y ^ t

2.1.3. Supervised Loss

The supervised term s encourages the generator to match per-time-step conditional distributions. It contrasts the encoder-induced real conditional p H t | H S , H 1 : t 1 with the generator-induced conditional p ^ H t | H S , H 1 : t 1 using a maximum-likelihood criterion of negative log-likelihood.
S = E s , x 1 : T ~ p t h t g X h S , h t 1 , z t 2
where E denotes the expected value under the distribution.
The learning procedure incorporates two additional objectives. The embedding and recovery modules are optimized to preserve temporal relevance while compressing the representation by minimizing a weighted combination of the supervised and reconstruction terms:
min θ e , θ r ( α S + R )
The generator is trained, in adversarial interplay with the discriminator, to maintain classification accuracy while reducing the supervised loss, via
min θ g ( β S + max θ d R )
where θ e stands for embedding layer; θ r stands for recovery layer; θ g stands for generator; θ d stands for discriminator, α ; and β stands for hyperparameter; α takes the value of 1; β takes the value of ten.

2.2. Proposed Method

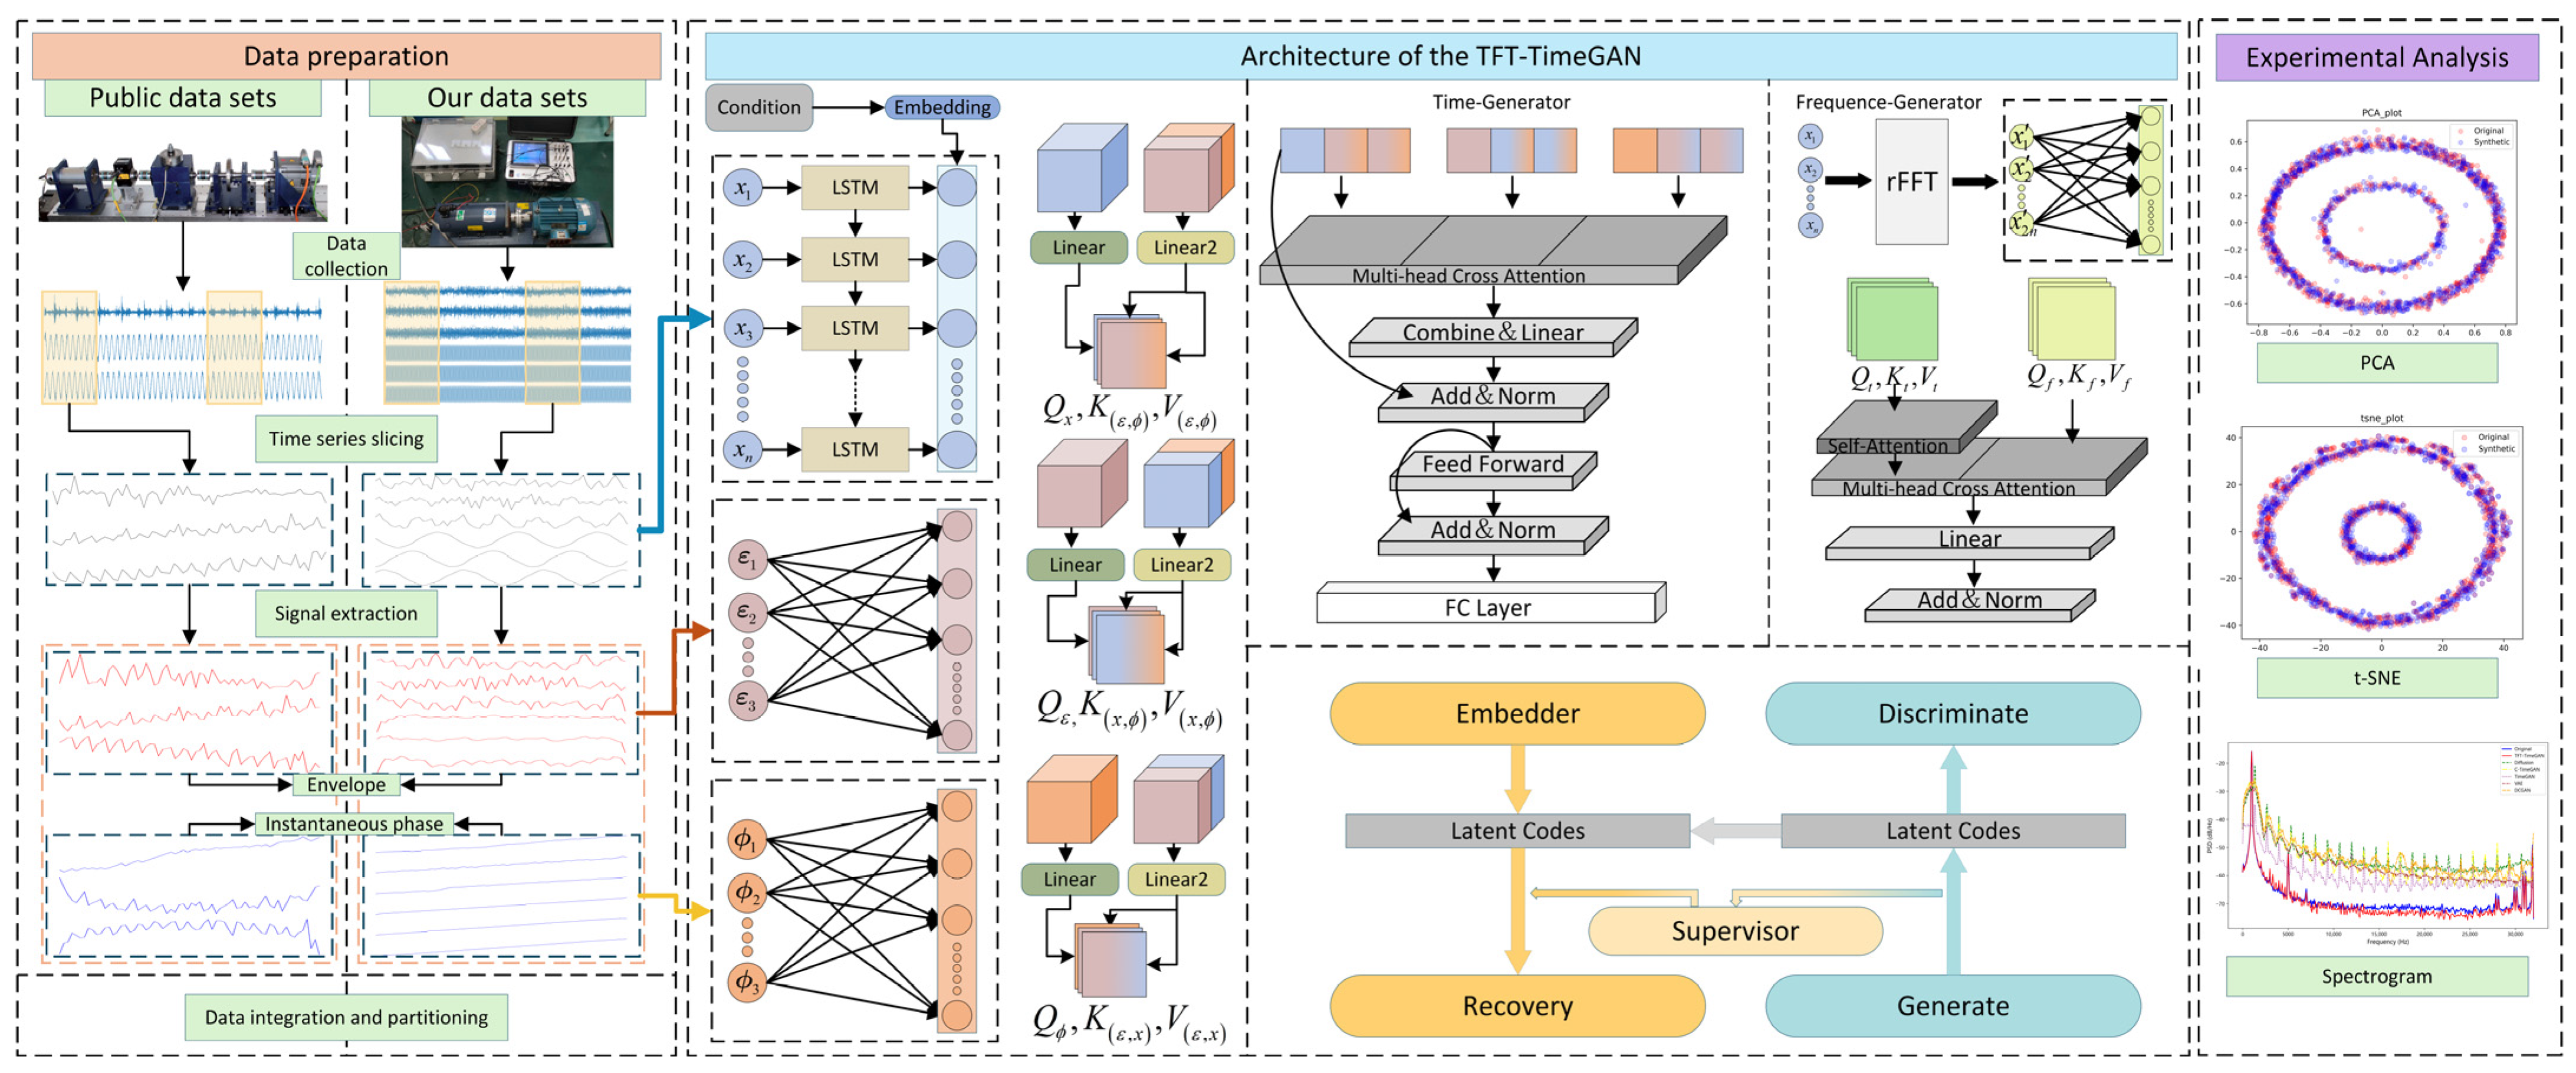
Figure 2 illustrates Transformer–TimeGAN, which integrates five components: an embedding layer, a recovery layer, a supervision layer, a generator, and a discriminator. In the time domain, the Hilbert transform is applied to the raw signals to obtain the envelope and instantaneous phase, which serve as auxiliary cues. Labeled vibration and current signals constitute the primary inputs, while their envelope and phase features are treated as secondary inputs. These streams undergo independent feature extraction and are subsequently fused through a Transformer layer. In parallel, frequency-domain descriptors are derived via the Fourier transform to construct a frequency-domain generator. The time- and frequency-domain generators are then fused, with their contributions dynamically regulated by learnable weights. Along the generation pathway, the data are processed by linear projections, residual blocks, normalization, and position-wise feed-forward networks. The synthesized outputs are finally validated using a comprehensive suite of performance metrics.
Within the framework, the embedding, recovery, supervision, and discriminator modules adopt the same transformer-based backbone as the time-domain branch. The generator itself consists of two coordinated submodules—a time-domain generator and a frequency-domain generator.

2.3. Data Calculation and Extraction

Motor-operating-status signals (vibration and current) are acquired by heterogeneous sensors distributed across the equipment. These channels exhibit homogeneity and cross-channel correlation, and their mutual influence intensifies as the channel count increases. Consequently, channel-aware guidance is required so that each channel is generated in a direction consistent with its real counterpart, enabling the model to better capture the underlying data distribution, latent structure, and temporal dependencies. To this end, the framework extracts the envelope ε and instantaneous phase from the raw signal via the Hilbert transform (12) and phase analysis (13). These features are used as auxiliary inputs that help the generator more effectively recover the intrinsic characteristics of the original signals.
x ^ ( t ) = 1 π x τ t τ d τ
X ^ = H X Z = X + j X ^ E = Z = X 2 + X ^ 2 ϕ = arg ( Z ) = tan 1 X ^ X
where X denotes the original signal; Z = H X is the complex analytic signal obtained via the Hilbert transform H (equivalently denoted X ^ ). The envelope and phase are given by ε and ϕ , respectively. The instantaneous phase change is computed by discrete differencing with boundary handling as seen in (14).
Δ ϕ t = ϕ 1 - ϕ 0 t = 0 Δ ϕ t = ϕ i + 1 - ϕ i - 1 0 < t n - 1 Δ ϕ t = ϕ n - ϕ n - 1 t = n
Δ ϕ denotes the phase difference. The three input streams (raw signal, envelope, and Δ ϕ ) are projected to a common feature dimensionality via linear layers. Optional label conditioning is realized by mapping discrete labels to a continuous conditional embedding. After temporal reconstruction to match the sequence length, this embedding is integrated with the original signal, and a subsequent linear projection restores the original signal dimensionality.

2.4. Generator Model

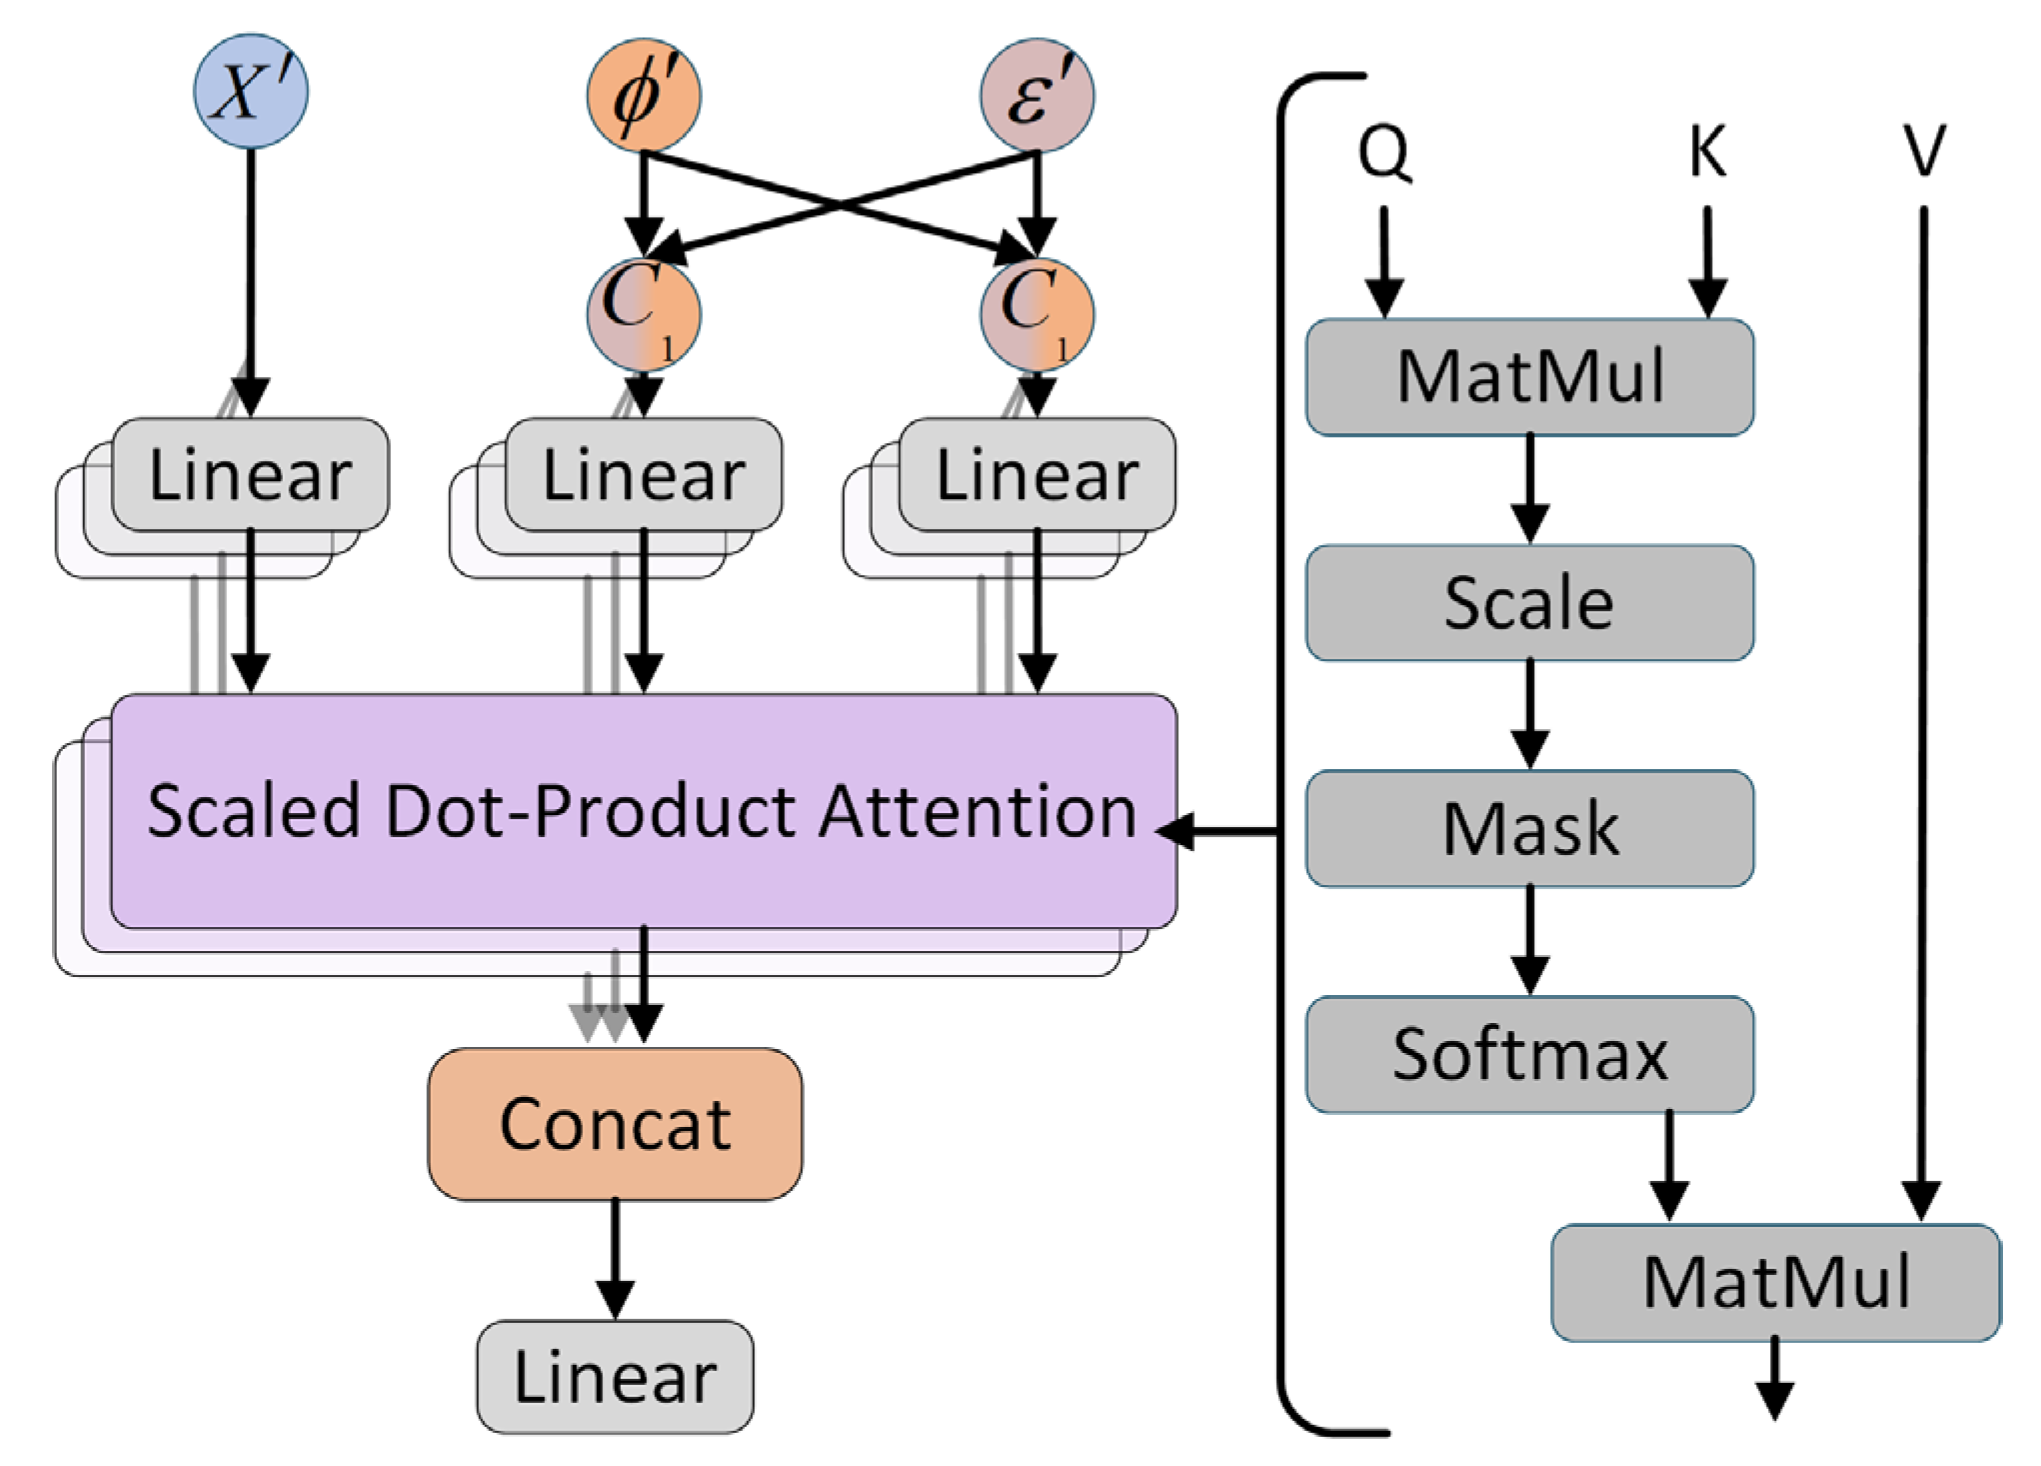
The condition-augmented raw signal is first passed through a positional-encoding layer; after injecting time-step information, it is fed to the encoder for feature extraction. The Hilbert-derived envelope and instantaneous-phase features are then supplied to a cross-attention block together with the encoded signal, guiding the hierarchy to attend to salient latent characteristics of the original waveform.
Signal synthesis is realized through two coordinated branches: a time-domain branch and a frequency-domain branch. The frequency-domain representation is obtained by applying a fast Fourier transform (FFT) to the time-domain signal and is then projected via a linear layer to match the time-domain dimensionality. The two branches are fused using scaled dot-product attention, and the fused representation is propagated to the subsequent layer.
M b , f , d = X b , f , d = ( X b , f , d ) 2 + X b , f , d 2
Φ b , f , d = arg X b , f , d = arctan X b , f , d X b , f , d
b indexes samples within a mini-batch; f denotes the frequency bin of a sample; and d indexes the feature (channel) dimension. Complex-valued quantity X ( ) and X ( ) denote its real and imaginary parts, respectively.
The fusion computation is illustrated in Figure 3 and Figure 4. In the time-domain module, the vibration signals and current signals X = [ x 1 , x 2 , x n ] as the queries Q for the cross-attention block. The Hilbert-derived envelope ε N 1 × N 2 × N N 1 × D ε and the instantaneous-phase feature ϕ N 1 × N 2 × N n 1 × D ϕ are concatenated along the feature dimension to form C 1 = C ε , ϕ N 1 × N 2 × N n 1 × D ε + D ϕ .
In the first attention block, the vibration and current signals are linearly projected to form the queries Q . The envelope and instantaneous-phase features are concatenated along the feature axis, projected to a common dimensionality, and used as keys K and values V , Similarities are computed via scaled dot-product Q K T , and normalized with a softmax to obtain attention weights, which are then applied to V to yield the fused representation. Across the three heads, head-wise weights are adaptively assigned before aggregation. The block output is finalized with a residual connection followed by layer normalization.
Q X = X W Q X   K C 1 = C 1 W K C 1   V C 1 = C 1 W V C 1
A t t e n t i o n Q X , K C 1 , V C 1 = s o f t m a x Q X K C 1 T d k V C 1
Linear projections are computed according to Equation (17), and attention weights follow the scaled dot-product formulation in Equation (18). In the frequency-domain branch, the output of the time-domain generator serves as the queries Q while the frequency-domain features provide the keys K and values V .

2.5. Delay Loss

In time-series modeling, temporal attributes are inseparable from the underlying data distribution; for periodic sequences, preserving temporal structure is particularly important. Although TimeGAN incorporates time-step labels during training, non-stationary signals with complex, vibration-like variations often drive optimization toward global distributional matching, thereby underemphasizing fidelity at local time steps. To mitigate this effect, a delay-consistency loss d is introduced. To enforce alignment between generated and real sequences at corresponding time indices (within a selected time-step range) using a mean-squared-error criterion:
d = 1 B T τ J b = 1 B t = 1 T τ j = 1 J X b , t , j X ^ b , t + τ , j 2
where X denotes the training (real) data and X ^ the generated data; B is the batch size; T is the sequence length, J is the feature (channel) dimension. A smaller value of d indicates better generation within localized segments by enforcing agreement between each sample and its τ -step-shifted counterpart.

2.6. Measurement Methods

FID (Fréchet Inception Distance) compares the feature-space distributions of real and generated data by matching their first two moments (mean vectors μ r , μ g and covariance matrices Σ r , Σ g ) (smaller is better).
F I D = μ r μ g 2 + Tr Σ r + Σ g 2 ( Σ r Σ g ) 1 / 2
DTW (Dynamic Time Warping) computes the minimum cumulative alignment cost between two sequences X and Y over all monotone warping paths (smaller is better).
D T W ( X , Y ) = min p a t h ( i , j ) p a t h D ( i , j )
Wasserstein Distance measures the minimal “transport cost” required to move probability mass from P to Q (smaller is better).
W ( P , Q ) = inf γ Π ( P , Q ) E ( x , y ) γ [ x y ]
KS (Kolmogorov–Smirnov) test compares the one-dimensional distributions of real and generated samples via the maximum difference between their empirical CDFs (smaller is better).
K S X , Y = sup F ^ n x G ^ m x F ^ n x = 1 n i = 1 n I X i x G ^ m x = 1 m j = 1 m I Y j x
MMD (Maximum Mean Discrepancy) measures the discrepancy between multivariate distributions in an RKHS induced by kernel k ; with a characteristic kernel, MMD = 0 if the two distributions are identical (smaller is better).
M M D 2 ( P , Q ; k ) = E x , x P k x , x + E y , y Q k y , y 2 E x P , y Q k x , y
AUC (Area Under the ROC Curve), used in classifier two-sample tests, quantifies how well a discriminator separates real from generated data; it equals the probability that a random real sample receives a higher score than a randomly generated one (closer to 0.5 is better).
A U C = Pr S r e a l > S g e n + 1 2 Pr S r e a l = S g e n
The discriminative score assesses separability between generated and real data using a binary classifier. Scores near chance level indicate that the classifier cannot reliably distinguish the two sets—hence higher fidelity—whereas larger deviations from chance suggest poorer generative quality.
The predictive score trains a forecaster on synthetic sequences and evaluates one-step predictions on real sequences; the metric is the mean absolute error (MAE) averaged over time steps, with lower values indicating that the dynamics learned from synthetic data better match those of the real data.
PCA and t-SNE visualize the distributions of real and generated samples in a low-dimensional space, while power spectral density (PSD) compares their energy distributions in the frequency domain.

3. Experimental Verification

3.1. Experimental Condition

Two datasets were employed the Paderborn University bearing dataset and laboratory dataset of motor faults; both contain vibration and current signals. Experiments were implemented in Python (3.9.21) using PyTorch (2.3.0+cu121) and executed on a workstation with an Intel Core i5-14600KF CPU (Intel, Santa Clara, CA, USA) and an NVIDIA GeForce RTX 4060 Ti GPU (16 GB) (NVIDIA, Santa Clara, CA, USA).
The framework comprises an embedding module, a recovery module, a supervision module, a generator, and a discriminator. Each module employs a four-layer LSTM together with four transformer layers using multi-head attention with four heads and 24 hidden units per layer. Training was conducted for 6000 iterations using the Adam optimizer with a learning rate of 0.001 and a mini-batch size of 128.
Computational cost and real-time performance are critical for industrial deployment; accordingly, we benchmarked each model by reporting the wall-clock time for 1000 forward passes and its theoretical FLOPs (per forward passes) [37], from which the average per-pass latency can be derived. The two datasets share an identical training protocol, and the model-specific architectural and optimization hyperparameters are summarized in Table 1. To establish the validity of the proposed approach, we conducted ablation experiments in Table 2 and, additionally, benchmarked it against five representative generative/diffusion models and further evaluated robustness from four complementary perspectives: downscaled inputs, time-domain characteristics (Table 3), frequency-domain characteristics, and data-distribution similarity.
A denotes the computational embedding loss process; B denotes the computational supervised loss process; C denotes the joint training process.

3.2. The Paderborn University (PU) Bearing Dataset

3.2.1. Details of Data Sources (PU Dataset)

The Paderborn University bearing dataset was acquired at 64 kHz and contains one vibration channel and two current channels with 6203 rolling bearings. The test bench is illustrated in Figure 5. For each bearing signal, 30 non-overlapping segments of 1024 time steps were randomly extracted, forming a composite pool of samples. For model training, sequences were further segmented into windows of length 48 with a stride of 1, yielding 30,672 samples in total. 8:2 split was used for training and testing. All signals underwent min–max normalization to facilitate training convergence.
Five fault categories were selected. The chosen types and their operating conditions are summarized in Table 4.

3.2.2. Experimental Analysis (PU Dataset)

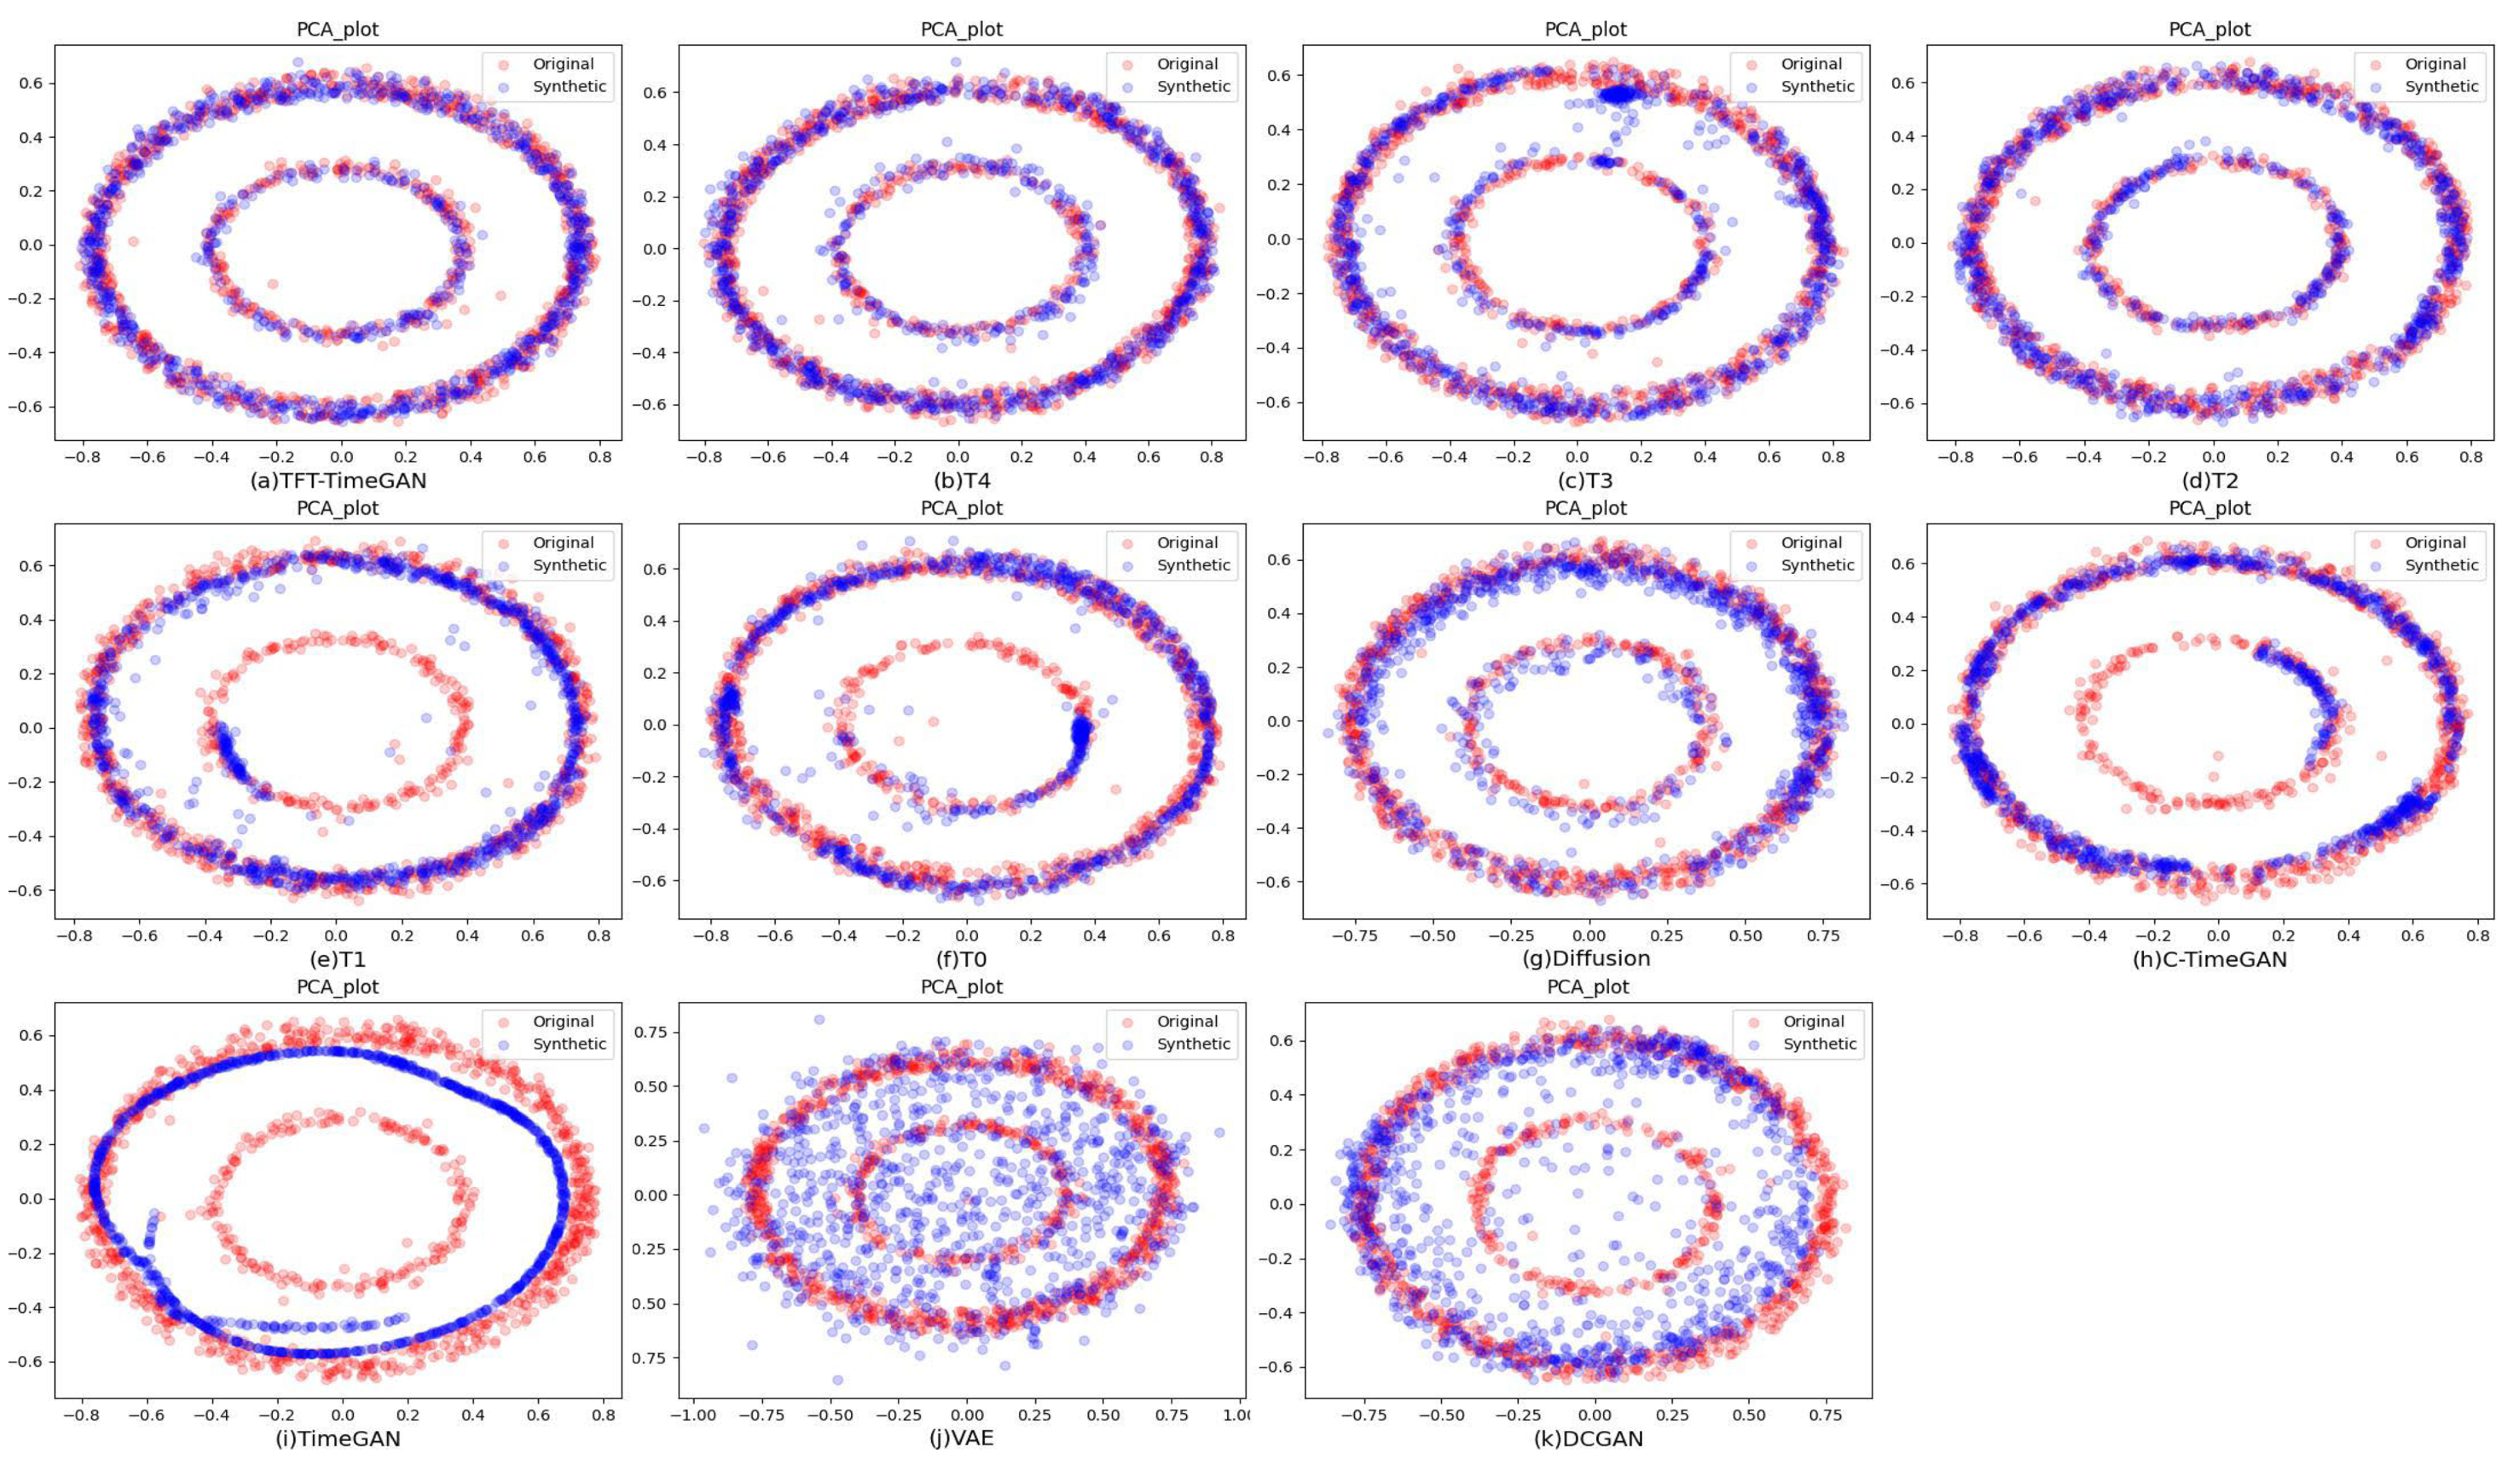
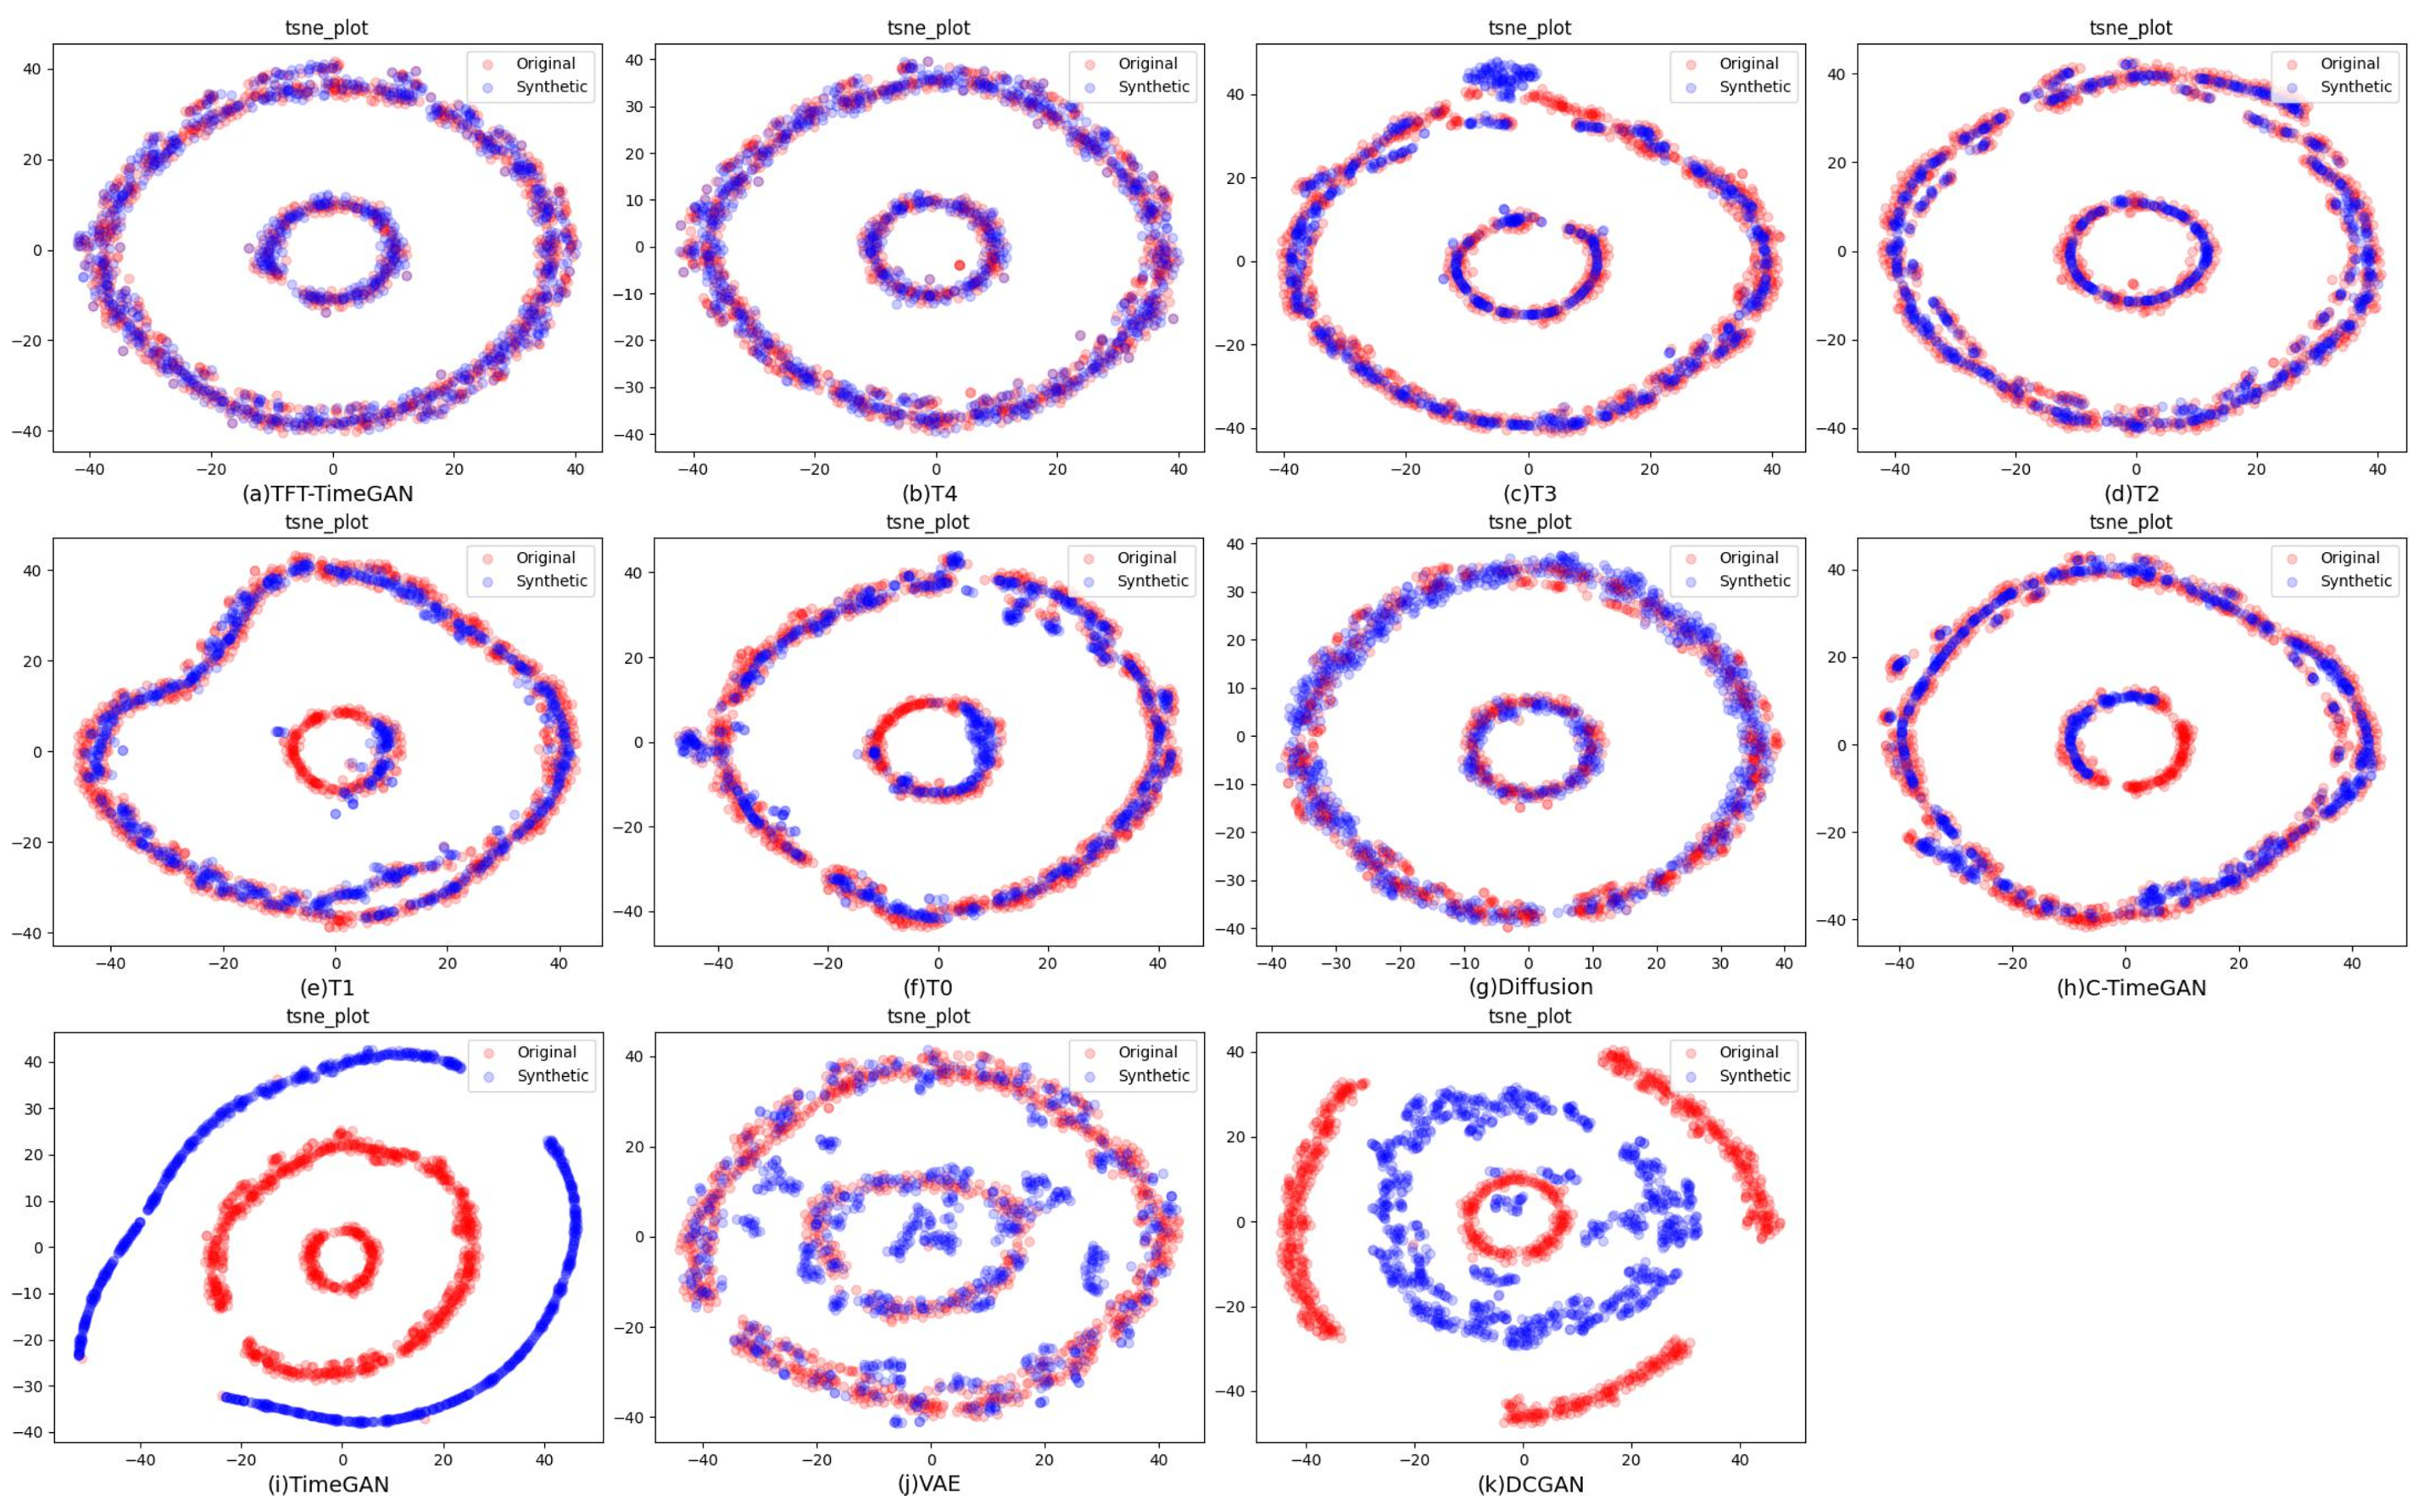
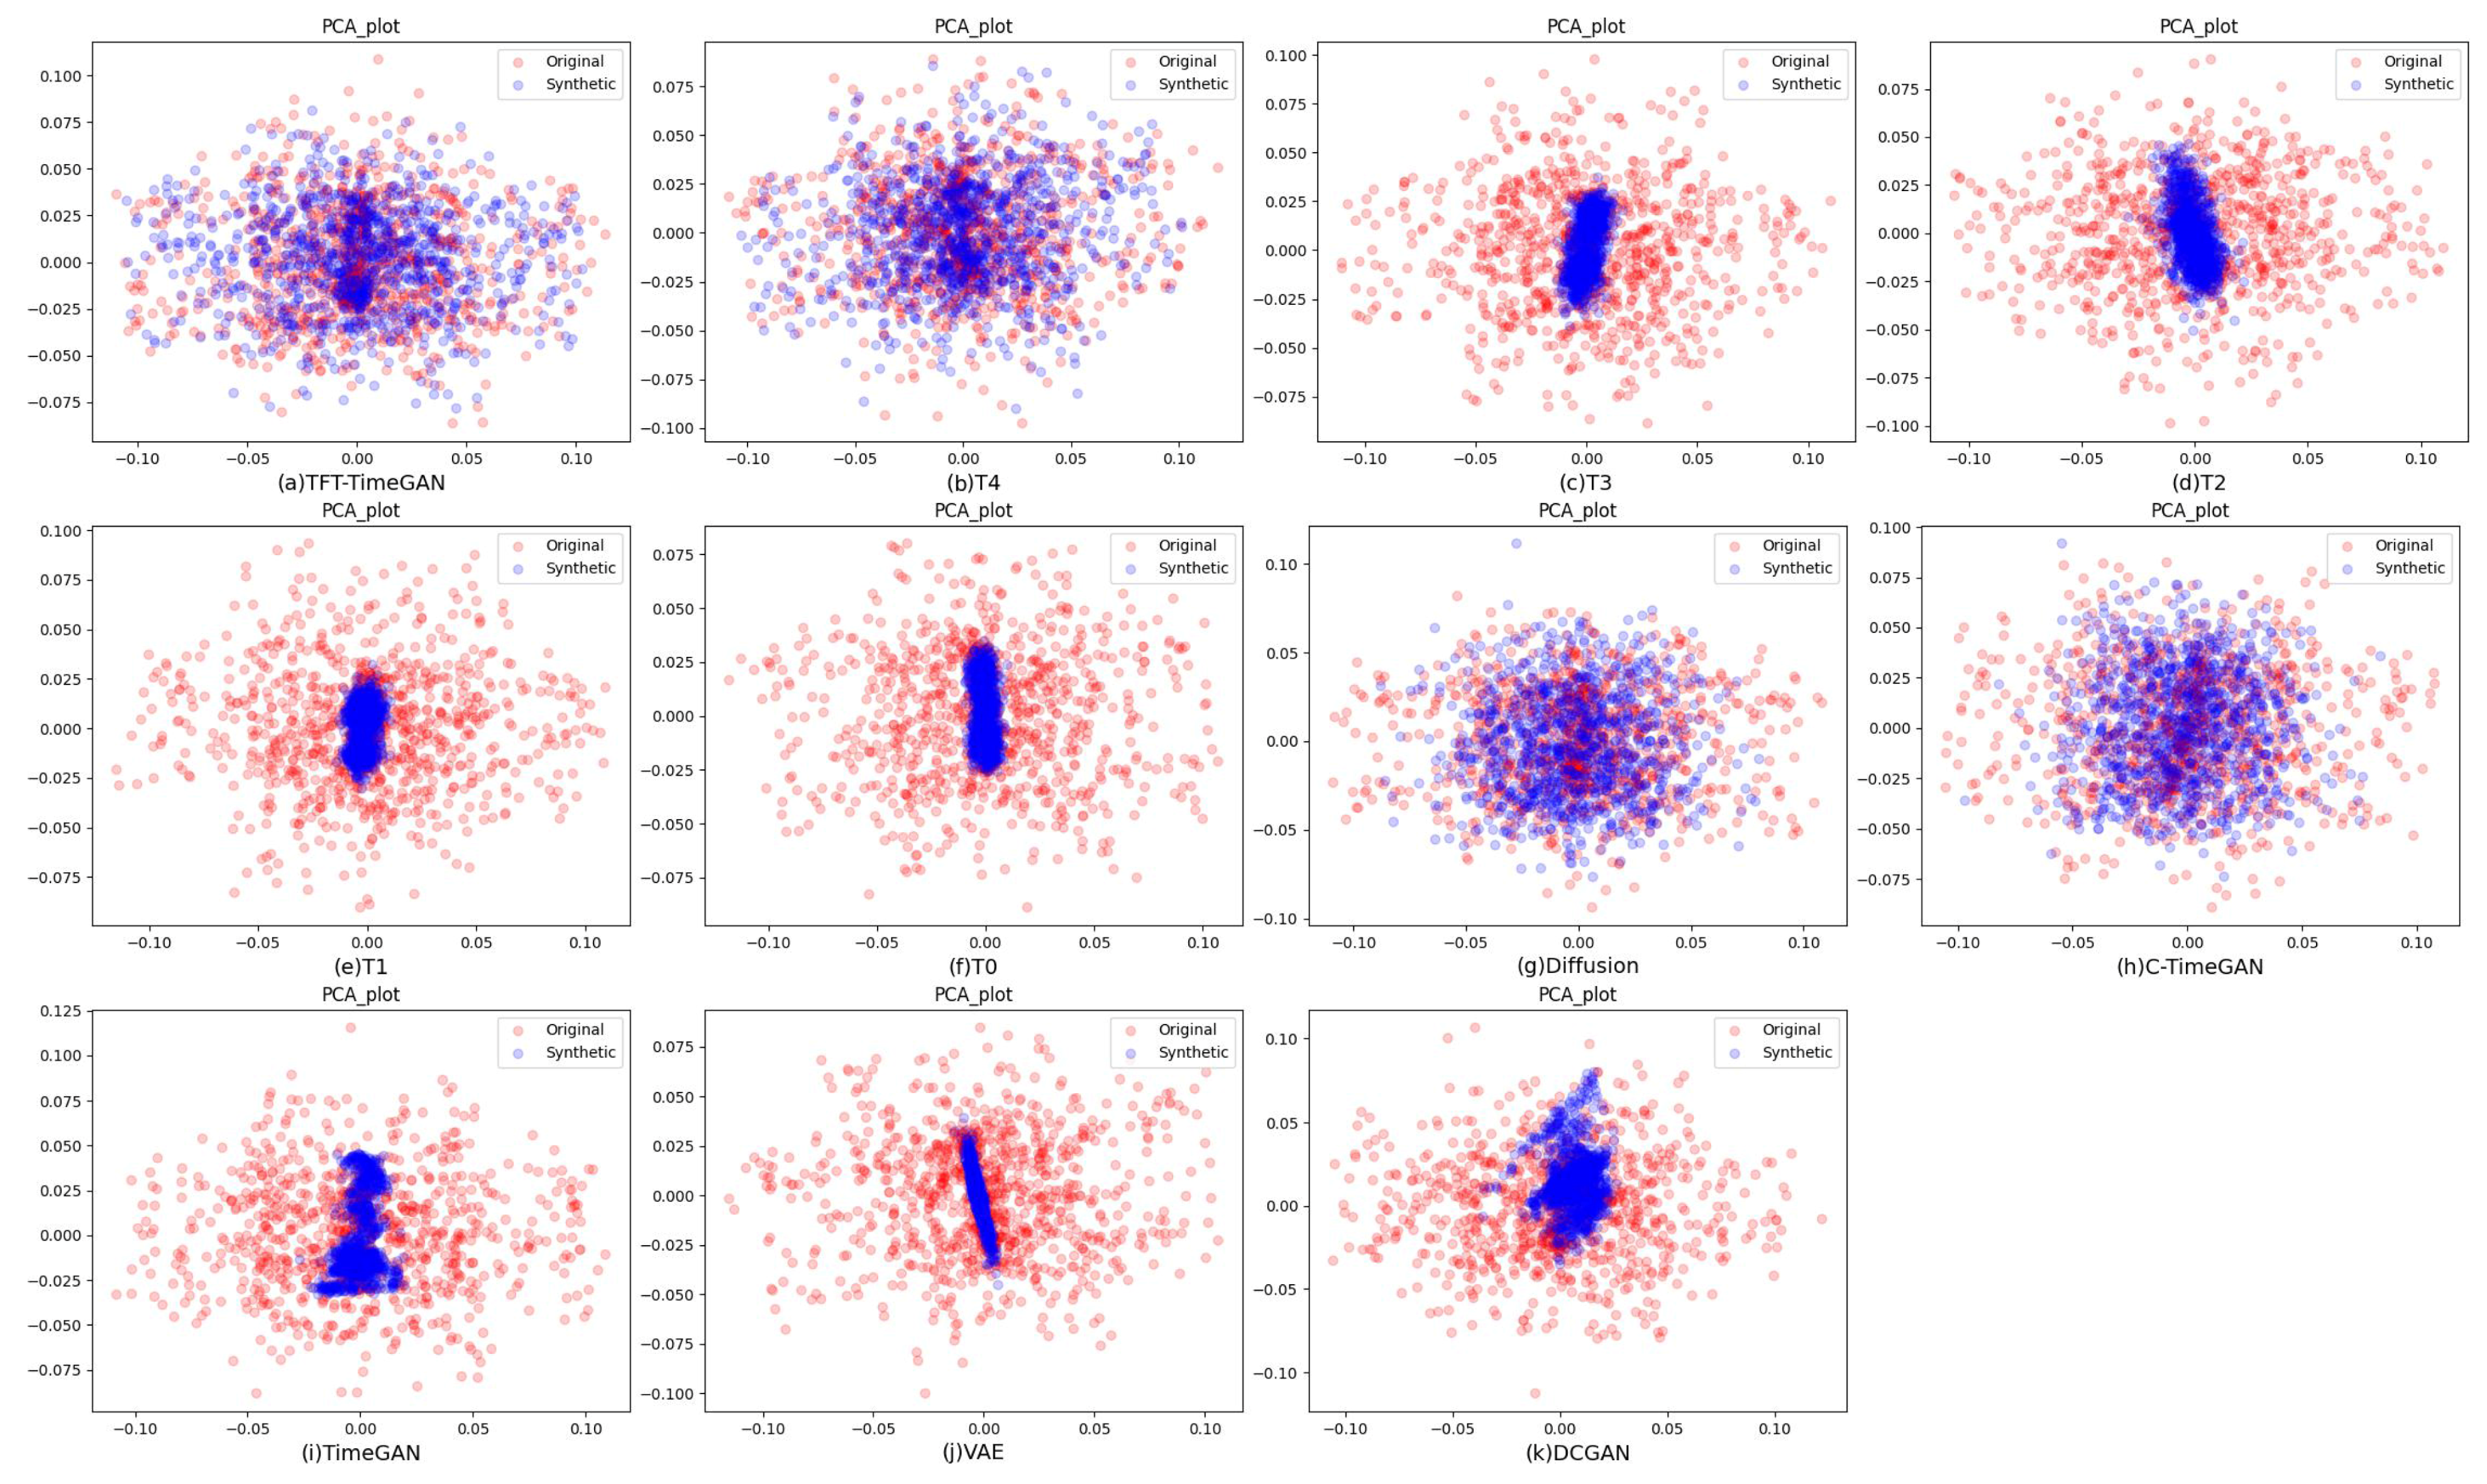
Figure 6 and Figure 7 display PCA and t-SNE visualizations of the temporal data, respectively. Red points indicate original samples and blue points indicate generated samples. The distributions produced by TFT–TimeGAN align more closely with the original data, exhibiting greater overlap and similar cluster geometry. This alignment suggests that the model captures both global structure and fine-grained temporal variations, thereby achieving higher generative fidelity.
Table 5 reports five complementary metrics that probe distributional similarity, temporal alignment, and task usefulness. TFT–TimeGAN attains an FID of 0.003 ± 0.003, a DTW of 3.292 ± 1.247, and Wasserstein distance of 0.031 ± 0.009. The synthetic sequences occupy a feature distribution that closely matches the real data, while also remaining temporally well aligned at the sequence level. The relatively small dispersions further suggest stable training and low sensitivity to initialization.
The discriminative score equals 0.044 ± 0.068, which is near the indistinguishability regime for a binary classifier, implying that the learned manifold is hard to separate from the real one. The predictive score equals 0.067 ± 0.009 in mean absolute error when a forecaster trained on synthetic data is evaluated on real sequences. This low error indicates that the synthetic data preserve dynamics that transfer to real-world prediction, rather than merely matching marginal statistics.
Consistently low values across FID, DTW, Wasserstein distance, discriminative score, and predictive score indicate that TFT–TimeGAN improves both global distributional fidelity and local temporal coherence. The gains are consistent with the design choices of the model: envelope and instantaneous-phase cues guide temporal representation learning; multi-head cross-attention fuses time- and frequency-domain information; dynamic weighting balances both domains during synthesis; the delay-consistency loss emphasizes alignment at corresponding time steps. Together, these components reduce mode bias, improve cycle-level fidelity in periodic regimes, and enhance robustness under non-stationary variations.
TFT–TimeGAN delivers the strongest overall alignment across the metrics: it achieves the lowest KS, indicating the smallest marginal distribution discrepancy versus real data—about a 51% reduction relative to TimeGAN and 30% relative to diffusion. Its discriminator AUC is 0.570 ± 0.028, substantially nearer to the chance regime than all baselines (36% closer than TimeGAN, 24% closer than diffusion), TFT–TimeGAN attains the best MMD, improving on TimeGAN by ~4.1%. The ablation series exhibits monotonic gains in KS and a steady shift in AUC toward 0.5, culminating in TFT–TimeGAN; this progression supports the effectiveness of the added mechanisms—time–frequency fusion with multi-head cross-attention, dynamic weighting, delay-consistency loss, and conditioning—in reducing distributional shift and improving cycle-level fidelity. The corresponding metrics are summarized in Table 6.
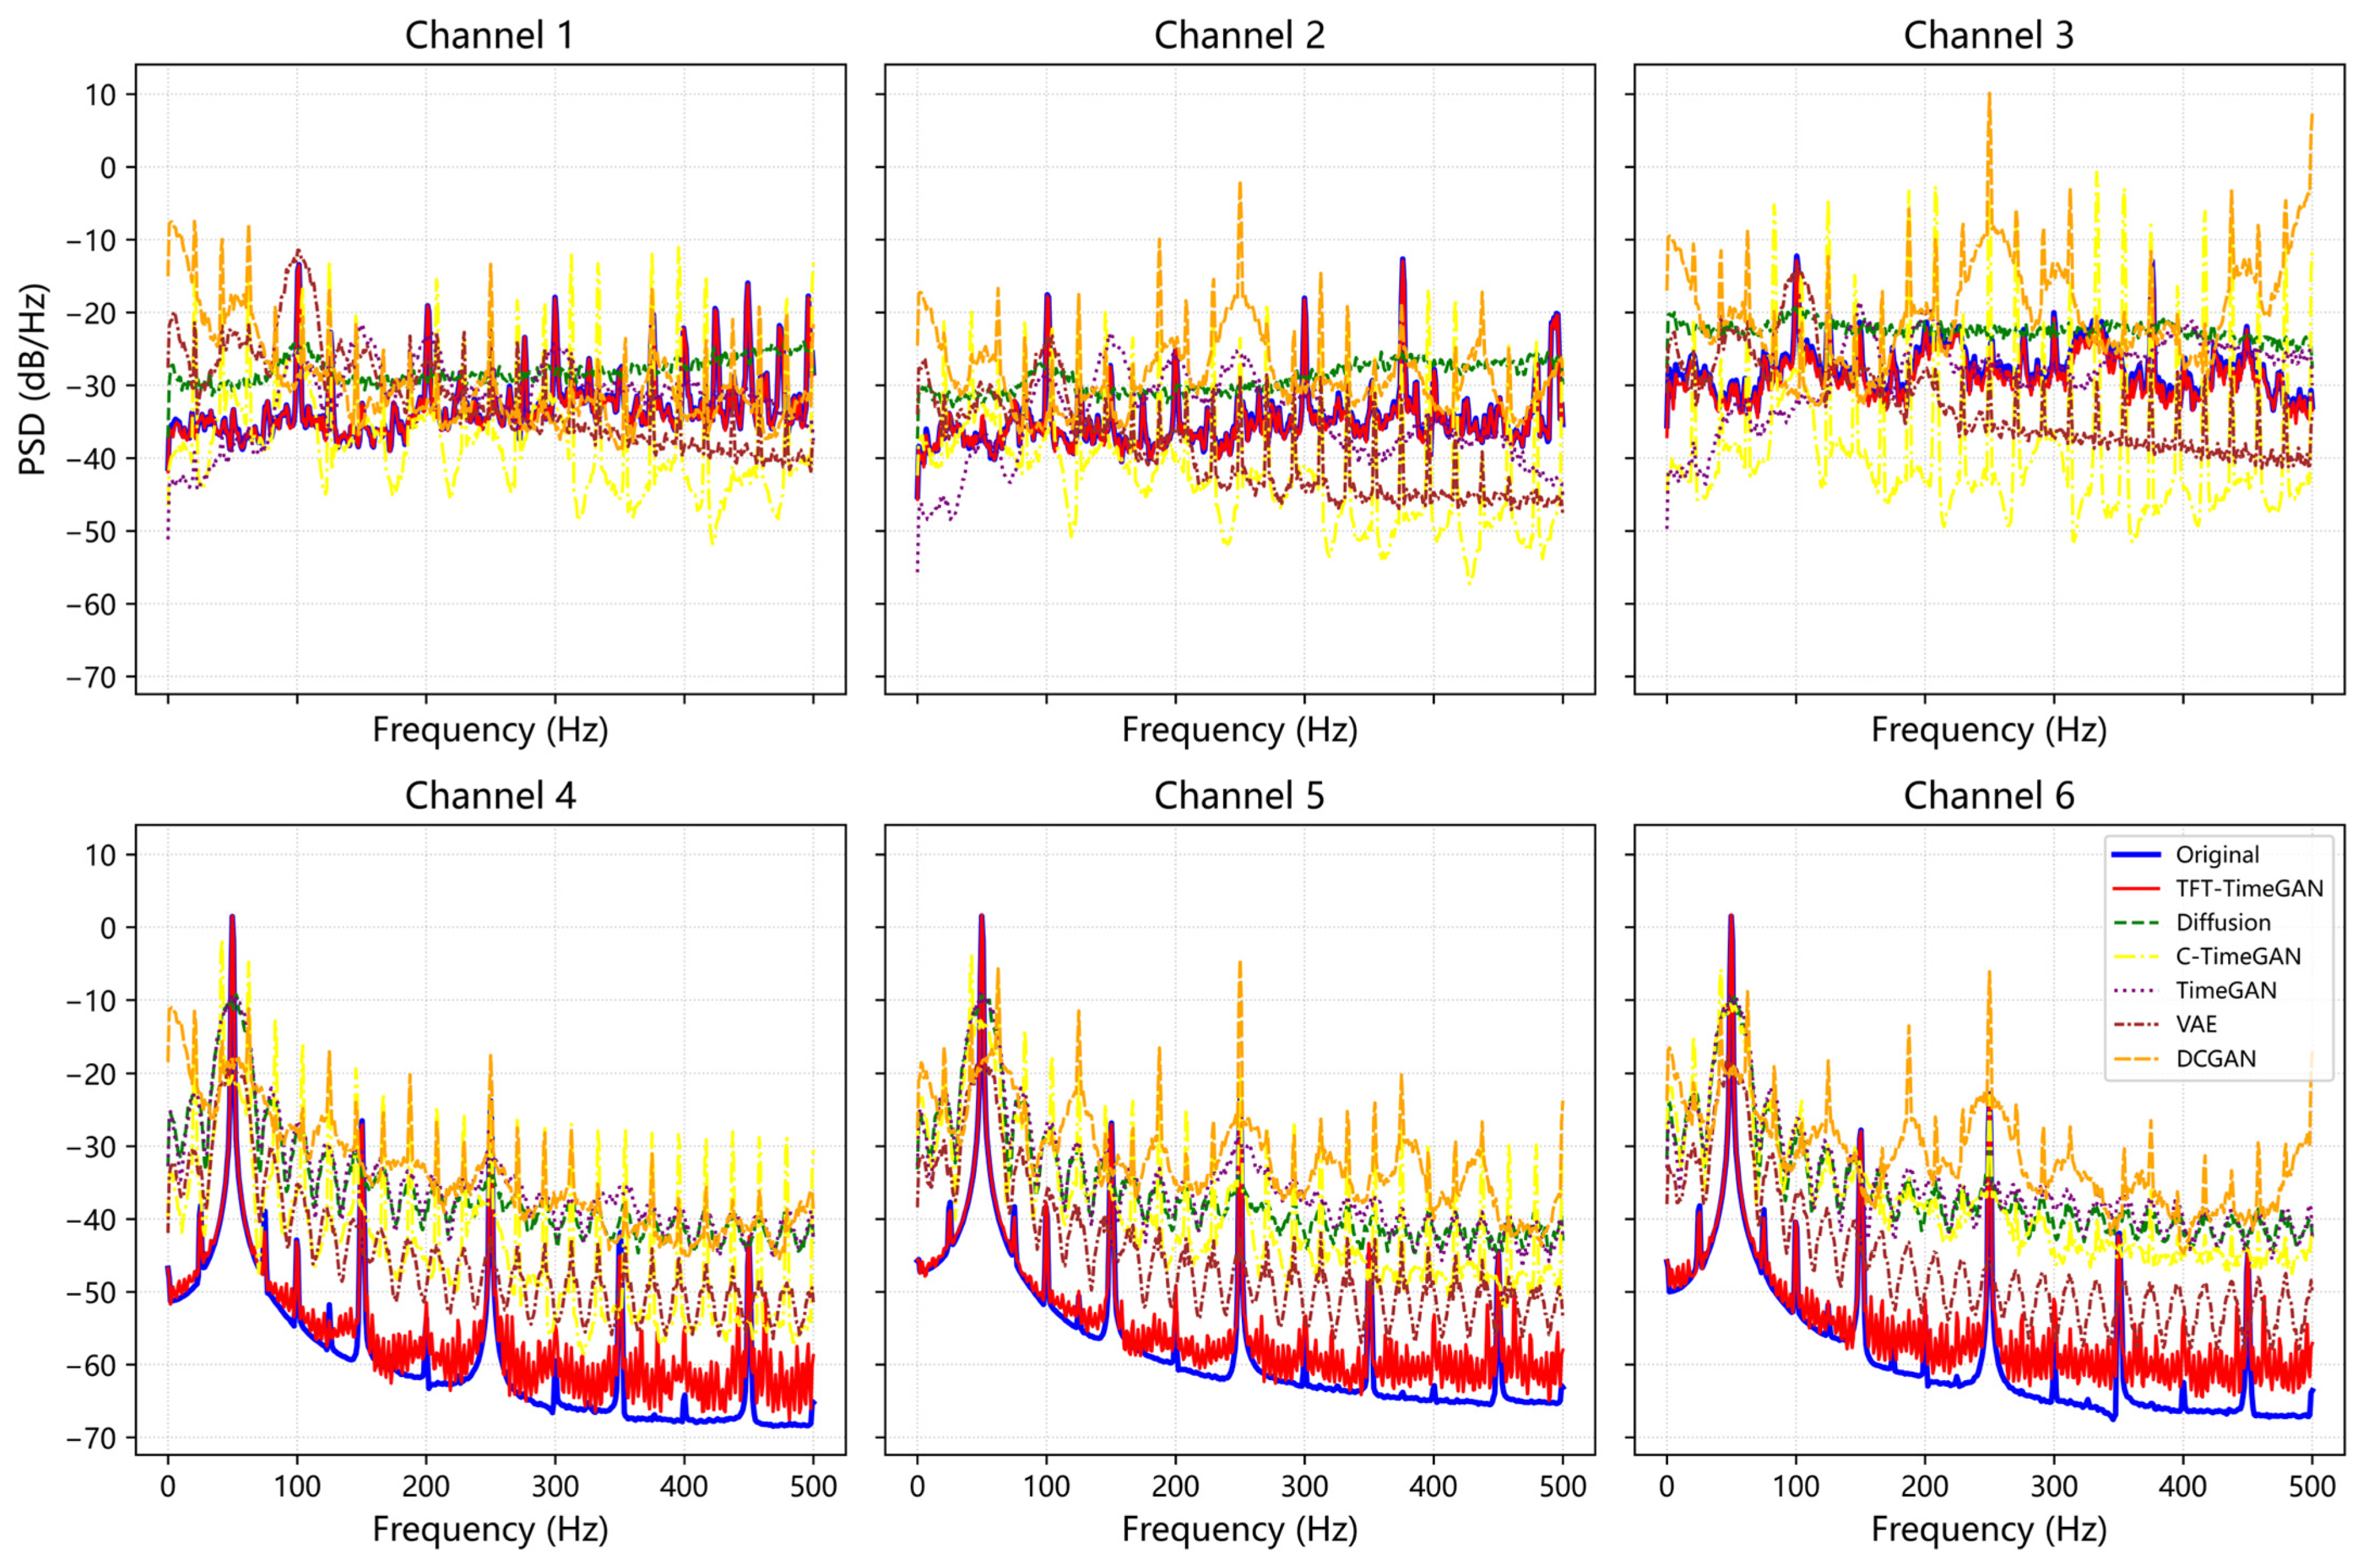
Figure 8 shows power spectral density curves: blue denotes the original signals and red denotes the TFT–TimeGAN outputs. Across both vibration and current channels, the generated spectra closely match the real spectra, reproducing dominant overall energy profiles. This overlap indicates that TFT–TimeGAN preserves the frequency-domain energy distribution and yields high-quality synthetic signals.

3.3. Laboratory Collection Datasets

3.3.1. Details of Data Sources (Our Dataset)

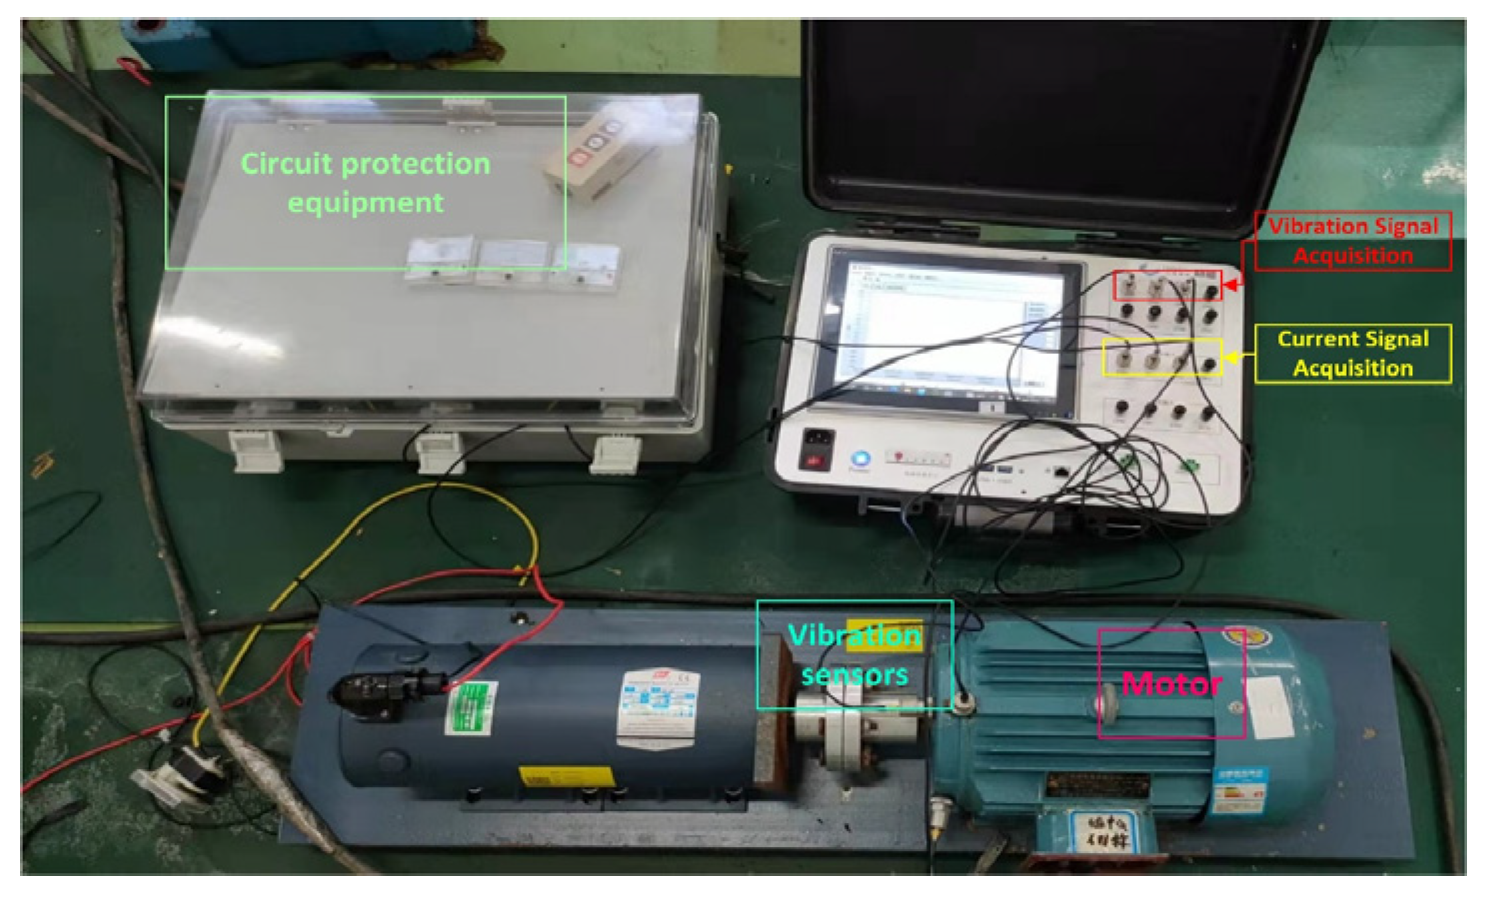
Figure 9 shows the test bench equipped with a three-phase induction motor. Table 7 presents the detailed motor parameters. The motor is rated at 3 kW and operated at 1420 rpm under 25% load. Signals were sampled at 1 kHz. Both vibration and stator current were acquired, with three channels recorded for each signal type. Figure 10 summarizes six operating classes: one healthy condition and five faults—inter-turn short circuit, rotor eccentricity, broken rotor bars, bearing inner-race fault, and bearing outer-race fault. A 3 kW DC servomotor is mechanically coupled to the drive end of the three-phase induction motor via a shaft coupling. Adjustable resistive load elements are connected across the servomotor terminals to realize variable-load operation of the induction motor. Vibration signals are measured with sensors mounted at the drive end in three orthogonal directions (horizontal, vertical, axial). Sensor outputs pass through a conditioning unit and are then fed to a multifunction data-acquisition card to record the three-axis vibration signals. Current signals are measured via a current transformer inserted in the protection circuit on the three-phase input. The transformer output is routed to the data-collection box and subsequently to the same multifunction to complete acquisition of the motor current signals.
Each record was acquired for 10 s. From each record, segments of 1024 time steps were extracted; five segments were randomly selected and aggregated to form one composite sample. For model training, sequences were windowed with a length of 48 time steps and a stride of one. The dataset was split into training and test partitions in an 8:2 ratio. All signals were scaled using min–max normalization to accelerate convergence.

3.3.2. Experimental Analysis (Our Dataset)

The self-built dataset comprises three vibration channels and three current channels. TFT–TimeGAN was trained under the same protocol as before. Figure 11 and Figure 12 present the dimensionality-reduced visualization, where the generated and real multichannel sequences exhibit closely aligned point-set distributions with similar cluster geometry. This result indicates that TFT–TimeGAN maintains robust fidelity and structure preservation in the multichannel setting.
Table 8 shows that TFT–TimeGAN achieves the lowest distances and error scores across all methods. FID equals 0.014 ± 0.022; DTW equals 7.133 ± 2.688; and the 1-Wasserstein distance equals 0.039 ± 0.010. Relative to the strongest ablation T4, FID is reduced by about 36%, DTW by about 12%, and the 1-Wasserstein distance by about 15%. These results indicate that the synthetic sequences lie very close to the real manifold in both global feature distribution and sequence-level alignment. The discriminative score of 0.044 ± 0.044 is near the indistinguishability regime for a binary classifier, confirming that real and synthetic sequences are difficult to separate. The predictive score of 0.094 ± 0.024 is the lowest in the table, showing that a forecaster trained on synthetic data generalizes well to real sequences.
TFT–TimeGAN demonstrates superior alignment across all metrics in Table 9: the KS value is 0.053 ± 0.005, implying the smallest marginal distribution gap and corresponding to reductions of 58.6% versus TimeGAN, 36.1% versus diffusion, and 88.7% versus DCGAN; the discriminator AUC is 0.666 ± 0.017, closest to the 0.5 chance level, shrinking the distance to chance by 56.2%, 39.4%, and 66.6% relative to TimeGAN, diffusion, and DCGAN, respectively; and the MMD is 2.839 ± 0.001, improving by 1.9% over TimeGAN, about 1.0% over diffusion and C-TimeGAN, 4.8% over VAE, and 5.7% over DCGAN. The consistently small standard deviations—especially for MMD—further indicate stable training.
Figure 13 demonstrates that, when trained on multichannel data, the generative model faithfully captures frequency-domain structure: the energy spectra of the synthesized signals closely track those of the original signals across channels.
To assess the model’s generalization ability, classification experiments were conducted on two public datasets: the Paderborn University bearing dataset and the Southeast University gearbox dataset (vibration signal). Details of the Southeast University gearbox dataset are provided in Table 10.
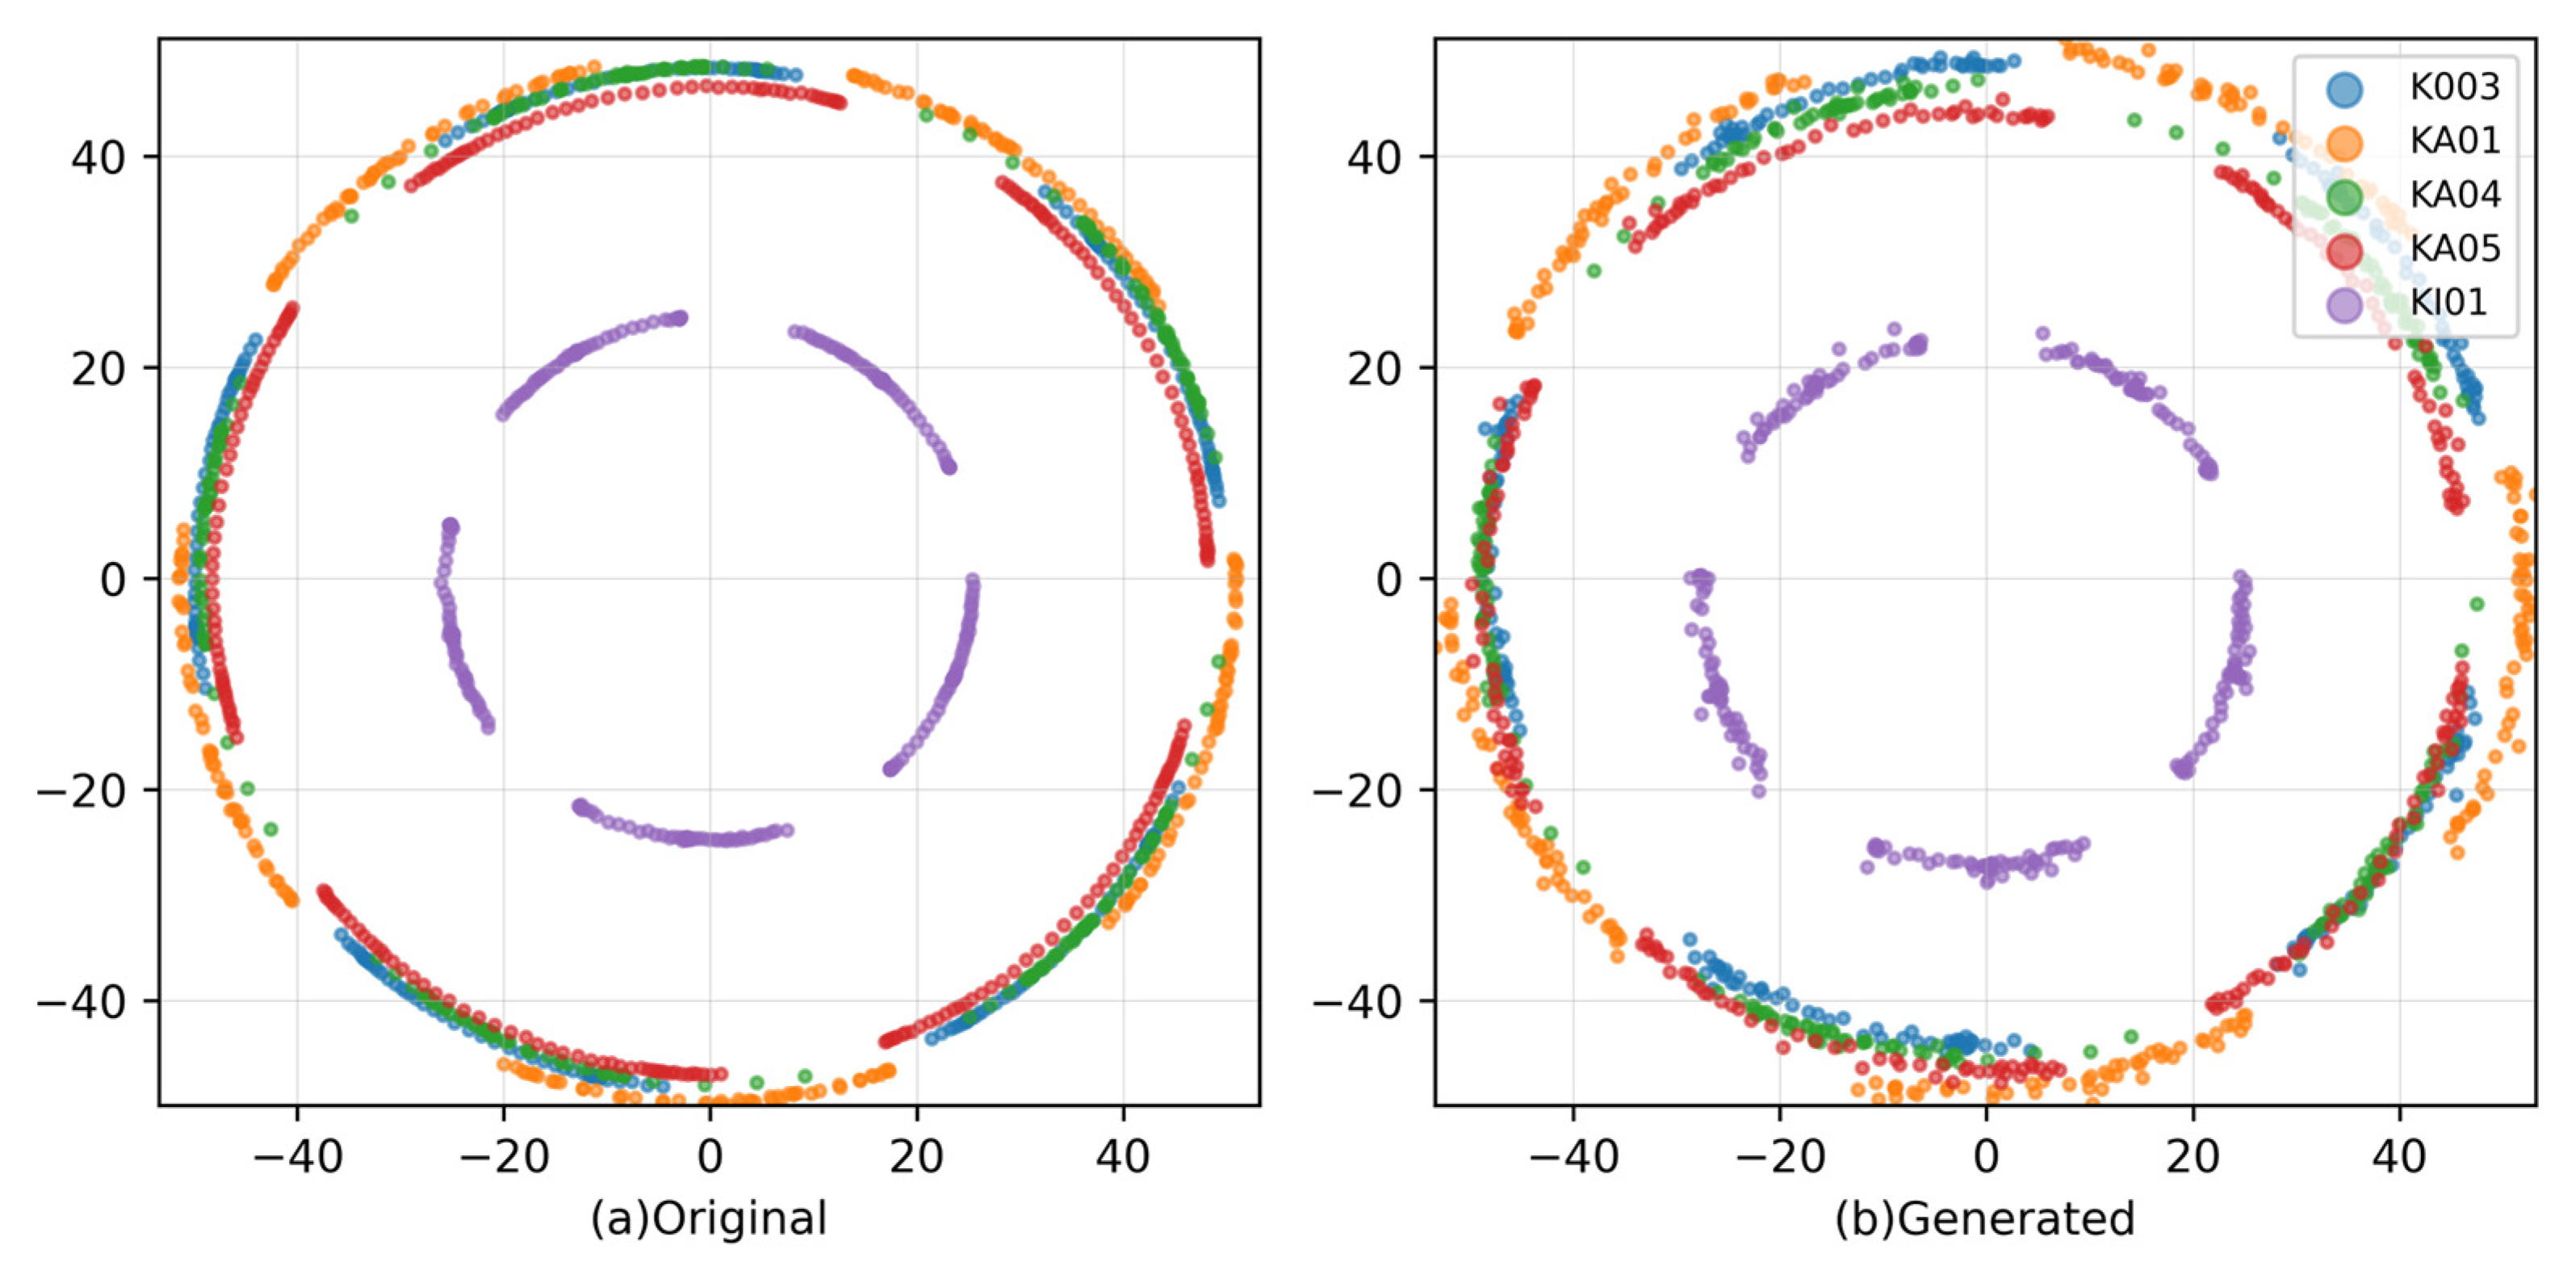
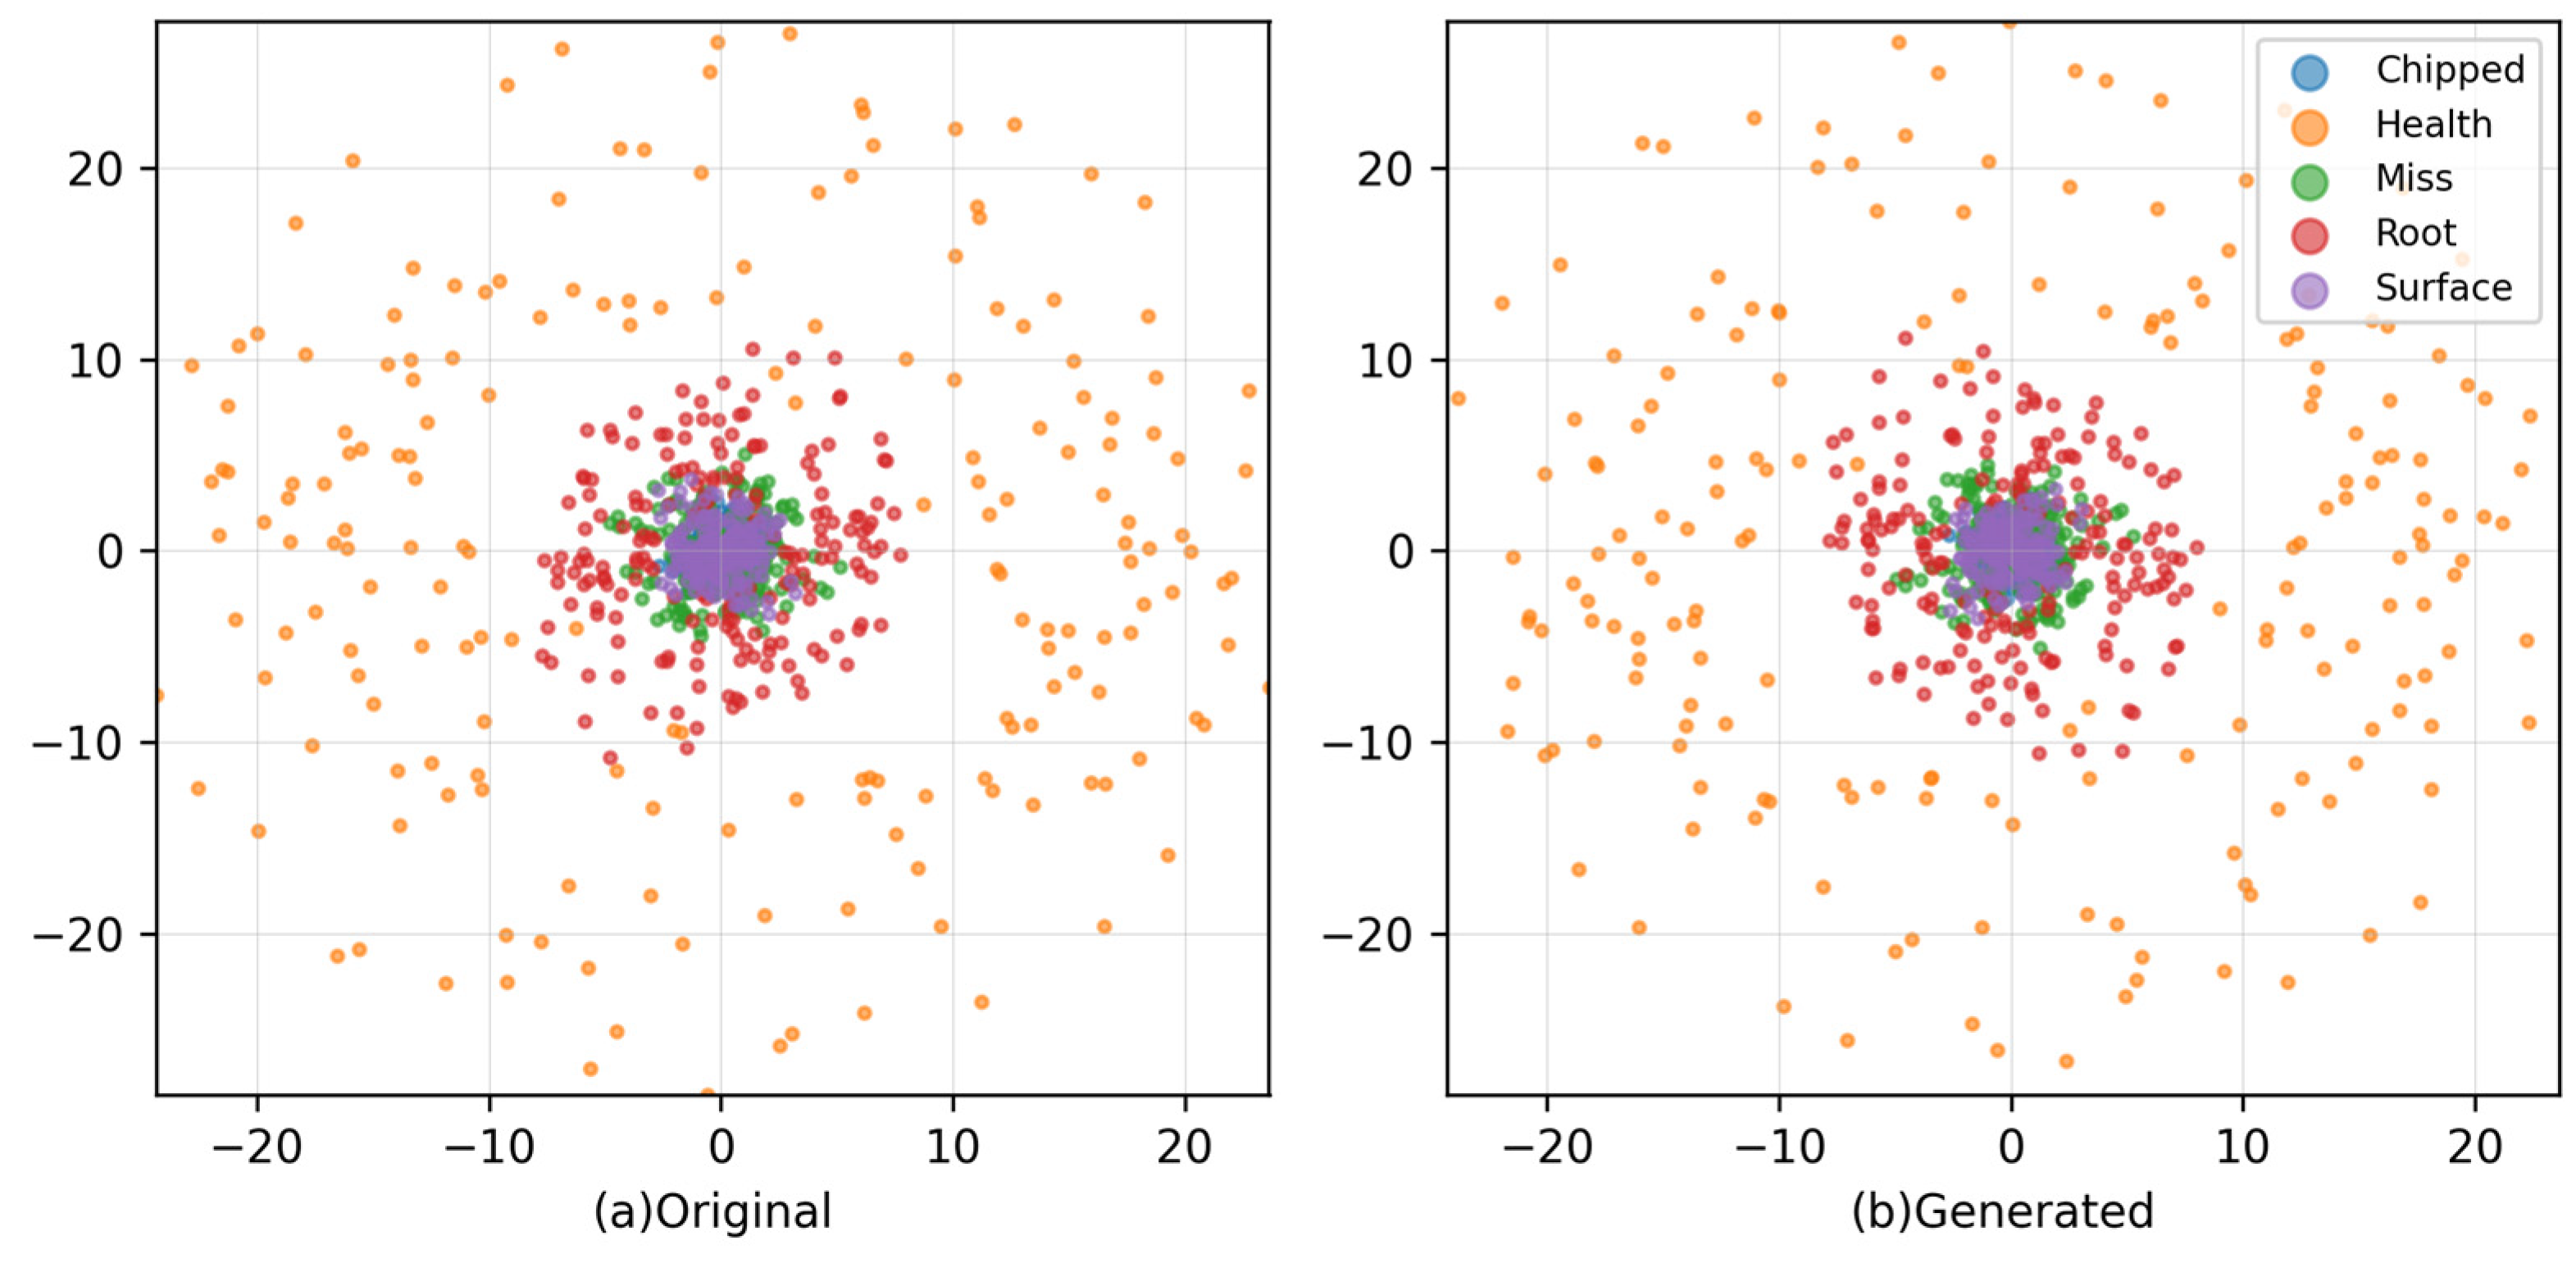
After synthesizing and denormalizing samples for all fault categories across both datasets, PCA was applied for visualization, as shown in Figure 14 and Figure 15. Although the synthetic segments exhibit slightly coarser local detail than the originals, their point-set distributions largely coincide with those of the real data, indicating preservation of the global feature structure.
A lightweight one-dimensional convolutional classifier is used, consisting of three 1D convolution layers followed by global adaptive average pooling and a final linear head. Training strictly follows a synthetic-to-real domain split: the generator outputs form the training set and the real signals form the validation set. Sequences are segmented into windows of length 128 with a stride of 12. Optimization uses Adam with a learning rate of 0.001, cross-entropy loss, and a batch size of 128. Validation is performed at fixed intervals and reports window-level accuracy, precision, recall, F1 including macro averages, and a row-normalized confusion matrix, as shown in Figure 16. To assess statistical robustness, the experiment is repeated five times with distinct random seeds, and results are summarized as the mean and the unbiased standard deviation across runs.
Table 11 and Table 12 summarizes per-class precision, recall, F1-score, and overall accuracy on two datasets. On the PU dataset, accuracy reaches 0.937 ± 0.018; classes KI01 and KA04 are near ceiling with precision 0.996 ± 0.004, recall 0.999 ± 0.001, F1 0.997 ± 0.002 for KI01, and precision 0.988 ± 0.009, recall 0.976 ± 0.022, F1 0.982 ± 0.010 for KA04. K003 remains strong with F1 0.917 ± 0.017, while KA05 shows a lower F1 of 0.895 ± 0.035, and KA01 exhibits reduced and variable recall at 0.871 ± 0.123, suggesting confusion among bearing-fault types with similar signatures. On the SEU dataset, accuracy is 0.948 ± 0.012; Health, Miss, and Root are reliably identified with F1-scores 0.984 ± 0.034, 0.970 ± 0.008, and 0.966 ± 0.054. Chipped attains high recall 0.996 ± 0.007 but lower precision 0.882 ± 0.028, indicating occasional false positives, Surface maintains high precision 0.983 ± 0.034 but lower recall 0.796 ± 0.065 and F1 0.877 ± 0.026. Overall, the results indicate that synthetic data from TFT–TimeGAN support classifiers that transfer well to real signals, with generally tight deviations implying stable behavior; residual errors likely arise from overlapping temporal–spectral characteristics and class imbalance.

4. Conclusions

This study presented TFT–TimeGAN, a time–frequency generative framework that augments vibration and current signals. The method integrates envelope and instantaneous phase features to emphasize local temporal changes, fuses time- and frequency-domain representations through multi-head cross-attention with dynamic weighting, and applies delay-consistency constraints and label conditioning to strengthen temporal alignment and class control. Validation was conducted on the PU dataset with three channels and on a self-constructed dataset with six channels, together with ablation variants.
Across both datasets, the model achieved uniformly low distributional distances—FID, DTW, and 1-Wasserstein—as well as reduced KS, MMD, and discriminator AUC approaching chance (0.5), indicating close alignment with real data in both global statistics and sequence-level timing. PCA and t-SNE showed substantial overlap between synthetic and real point sets, while PSD comparisons confirmed preservation of frequency-domain energy structure. In downstream evaluation, classifiers trained with the proposed data achieved an accuracy exceeding 93%, and discriminative and predictive scores remained low, supporting both realism and task usefulness. Ablation results further verified that each component—time–frequency fusion, dynamic weighting, delay-consistency loss, and conditioning—contributed to the observed gains. Overall, TFT-TimeGAN offers a robust and generalizable pathway for high-fidelity augmentation of multichannel motor signals, improving data quality.
Compared with baseline models, TFT–TimeGAN retains a comparable forward (sampling) pathway; however, multi-feature fusion and attention introduce additional training-time sample and memory overhead and increase inference latency and computational load. The model is also sensitive to hyperparameters such as hidden dimensionality and the number of attention heads. To mitigate these issues, future work may adopt mixed-precision training (AMP) and self-supervised pretraining to reduce training epochs and memory usage, employ local or linear-time attention to compress inference cost, and incorporate adaptive mechanisms together with stabilization strategies such as EMA, spectral normalization, and early stopping, thereby improving hyperparameter robustness while maintaining training stability.
Author Contributions

Conceptualization, B.L. and Y.Z.; methodology, B.L. and Y.Z.; software, Y.Z.; validation, Y.Z.; formal analysis, B.L. and Y.Z.; investigation, R.R.; resources, G.X.; data curation, R.R. and W.L.; writing—original draft preparation, Y.Z. and B.L.; writing—review and editing, B.L. and Y.Z.; visualization, R.R., W.L., and G.X.; supervision, G.X.; project administration, Y.Z.; funding acquisition, B.L. All authors have read and agreed to the published version of the manuscript.

Funding

This research was funded by the Shanghai Professional and Technical Services Platform Project (23DZ2290500).

Data Availability Statement

The data presented in this study are openly available at [10.21227/ZRVG-6E40].

Conflicts of Interest

The authors declare that they have no known competing financial interests or personal relationships that could have appeared to influence the work reported in this paper.

References

  1. Xue, Y.; Wen, C.; Wang, Z.; Liu, W.; Chen, G. A Novel Framework for Motor Bearing Fault Diagnosis Based on Multi-Transformation Domain and Multi-Source Data. Knowl. Based Syst. 2024, 283, 111205. [Google Scholar] [CrossRef]
  2. Wang, C.; Liu, X.; Yang, J.; Jie, H.; Gao, T.; Zhao, Z. Addressing Unknown Faults Diagnosis of Transport Ship Propellers System Based on Adaptive Evolutionary Reconstruction Metric Network. Adv. Eng. Inform. 2025, 65, 103287. [Google Scholar] [CrossRef]
  3. Wang, C.; Jie, H.; Yang, J.; Gao, T.; Zhao, Z.; Chang, Y.; See, K.Y. A Multi-Source Domain Feature-Decision Dual Fusion Adversarial Transfer Network for Cross-Domain Anti-Noise Mechanical Fault Diagnosis in Sustainable City. Inf. Fusion 2025, 115, 102739. [Google Scholar] [CrossRef]
  4. Xiao, L.; Duan, F.; Tang, J.; Abbott, D. A Noise-Boosted Remaining Useful Life Prediction Method for Rotating Machines Under Different Conditions. IEEE Trans. Instrum. Meas. 2021, 70, 3512612. [Google Scholar] [CrossRef]
  5. Ren, X.; Qin, Y.; Wang, B.; Cheng, X.; Jia, L. A Complementary Continual Learning Framework Using Incremental Samples for Remaining Useful Life Prediction of Machinery. IEEE Trans. Ind. Inf. 2024, 20, 14330–14340. [Google Scholar] [CrossRef]
  6. Martins, D.H.C.S.S.; De Lima, A.A.; Pinto, M.F.; Hemerly, D.D.O.; Prego, T.D.M.; E Silva, F.L.; Tarrataca, L.; Monteiro, U.A.; Gutiérrez, R.H.R.; Haddad, D.B. Hybrid Data Augmentation Method for Combined Failure Recognition in Rotating Machines. J. Intell. Manuf. 2023, 34, 1795–1813. [Google Scholar] [CrossRef]
  7. Liu, D.; Zhong, S.; Lin, L.; Zhao, M.; Fu, X.; Liu, X. Deep Attention SMOTE: Data Augmentation with a Learnable Interpolation Factor for Imbalanced Anomaly Detection of Gas Turbines. Comput. Ind. 2023, 151, 103972. [Google Scholar] [CrossRef]
  8. Li, Y.; Gault, R.; McGinnity, T.M. Probabilistic, Recurrent, Fuzzy Neural Network for Processing Noisy Time-Series Data. IEEE Trans. Neural Netw. Learn. Syst. 2022, 33, 4851–4860. [Google Scholar] [CrossRef]
  9. Dai, W.; Mo, Z.; Luo, C.; Jiang, J.; Zhang, H.; Miao, Q. Fault Diagnosis of Rotating Machinery Based on Deep Reinforcement Learning and Reciprocal of Smoothness Index. IEEE Sens. J. 2020, 20, 8307–8315. [Google Scholar] [CrossRef]
  10. Li, H.; Yeo, J.H.; Bornsheuer, A.L.; Overbye, T.J. The Creation and Validation of Load Time Series for Synthetic Electric Power Systems. IEEE Trans. Power Syst. 2021, 36, 961–969. [Google Scholar] [CrossRef]
  11. Tang, M.; Meng, C.; Wu, H.; Zhu, H.; Yi, J.; Tang, J.; Wang, Y. Fault Detection for Wind Turbine Blade Bolts Based on GSG Combined with CS-LightGBM. Sensors 2022, 22, 6763. [Google Scholar] [CrossRef] [PubMed]
  12. Tran, N.-T.; Tran, V.-H.; Nguyen, N.-B.; Nguyen, T.-K.; Cheung, N.-M. On Data Augmentation for GAN Training. IEEE Trans. Image Process. 2021, 30, 1882–1897. [Google Scholar] [CrossRef] [PubMed]
  13. Cai, B.; Yang, S.; Gao, L.; Xiang, Y. Hybrid Variational Autoencoder for Time Series Forecasting. Knowl. Based Syst. 2023, 281, 111079. [Google Scholar] [CrossRef]
  14. Shen, J.; Ni, B.; Ding, Y.; Xiong, J.; Zhong, Z.; Chen, J. Aftershock Ground Motion Prediction Model Based on Conditional Convolutional Generative Adversarial Networks. Eng. Appl. Artif. Intell. 2024, 133, 108354. [Google Scholar] [CrossRef]
  15. Liang, G.; Hu, J.; Yang, K.; Song, S.; Liu, T.; Xie, N.; Yu, Y. Data Augmentation for Predictive Digital Twin Channel: Learning Multi-Domain Correlations by Convolutional TimeGAN. IEEE J. Sel. Top. Signal Process. 2024, 18, 18–33. [Google Scholar] [CrossRef]
  16. Shi, Y.; Li, J.; Li, H.; Yang, B. An Imbalanced Data Augmentation and Assessment Method for Industrial Process Fault Classification with Application in Air Compressors. IEEE Trans. Instrum. Meas. 2023, 72, 3521510. [Google Scholar] [CrossRef]
  17. Chrysos, G.G.; Kossaifi, J.; Zafeiriou, S. RoCGAN: Robust Conditional GAN. Int. J. Comput. Vis. 2020, 128, 2665–2683. [Google Scholar] [CrossRef]
  18. Sadeghi, M.; Leglaive, S.; Alameda-Pineda, X.; Girin, L.; Horaud, R. Audio-Visual Speech Enhancement Using Conditional Variational Auto-Encoders. IEEE/ACM Trans. Audio Speech Lang. Process. 2020, 28, 1788–1800. [Google Scholar] [CrossRef]
  19. Huang, W.; Chen, H.; Zhao, Q. Fault Diagnosis of Inter-Turn Fault in Permanent Magnet-Synchronous Motors Based on Cycle-Generative Adversarial Networks and Deep Autoencoder. Appl. Sci. 2024, 14, 2139. [Google Scholar] [CrossRef]
  20. Yokkampon, U.; Mowshowitz, A.; Chumkamon, S.; Hayashi, E. Robust Unsupervised Anomaly Detection with Variational Autoencoder in Multivariate Time Series Data. IEEE Access 2022, 10, 57835–57849. [Google Scholar] [CrossRef]
  21. Wang, C.; Shu, Z.; Yang, J.; Zhao, Z.; Jie, H.; Chang, Y.; Jiang, S.; See, K.Y. Learning to Imbalanced Open Set Generalize: A Meta-Learning Framework for Enhanced Mechanical Diagnosis. IEEE Trans. Cybern. 2025, 55, 1464–1475. [Google Scholar] [CrossRef] [PubMed]
  22. Qi, G.-J.; Luo, J. Small Data Challenges in Big Data Era: A Survey of Recent Progress on Unsupervised and Semi-Supervised Methods. IEEE Trans. Pattern Anal. Mach. Intell. 2022, 44, 2168–2187. [Google Scholar] [CrossRef] [PubMed]
  23. Liu, S.; Poccia, S.R.; Candan, K.S.; Sapino, M.L.; Wang, X. Robust Multi-Variate Temporal Features of Multi-Variate Time Series. ACM Trans. Multimed. Comput. Commun. Appl. 2018, 14, 1–24. [Google Scholar] [CrossRef]
  24. Yoon, J.; Jarrett, D.; van der Schaar, M. Time-Series Generative Adversarial Networks. In Advances in Neural Information Processing Systems; Wallach, H., Larochelle, H., Beygelzimer, A., d’Alché-Buc, F., Fox, E., Garnett, R., Eds.; Curran Associates, Inc.: Red Hook, NY, USA, 2019; Volume 32. [Google Scholar]
  25. Liu, Z.G.; Ji, T.Y.; Chen, J.W.; Zhang, L.J.; Zhang, L.L.; Wu, Q.H. Conditional-TimeGAN for Realistic and High-Quality Appliance Trajectories Generation and Data Augmentation in Nonintrusive Load Monitoring. IEEE Trans. Instrum. Meas. 2024, 73, 2514415. [Google Scholar] [CrossRef]
  26. Zhang, Y.; Wang, J.; Yin, Z.; Shao, Y.; Kang, J.; Ma, Z. Mitigation Imbalance Distribution: Data Augmentation of Local Small Sample for Building Electricity Load in Time-Series Generative Adversarial Network. J. Build. Eng. 2025, 99, 111549. [Google Scholar] [CrossRef]
  27. Liu, Y.; Liang, Z.; Li, X. Enhancing Short-Term Power Load Forecasting for Industrial and Commercial Buildings: A Hybrid Approach Using TimeGAN, CNN, and LSTM. IEEE Open J. Ind. Electron. Soc. 2023, 4, 451–462. [Google Scholar] [CrossRef]
  28. Sim, Y.-S.; Lee, C.-K.; Hwang, J.-S.; Kwon, G.-Y.; Chang, S.J. AI-Based Remaining Useful Life Prediction for Transmission Systems: Integrating Operating Conditions with TimeGAN and CNN-LSTM Networks. Electr. Power Syst. Res. 2025, 238, 111151. [Google Scholar] [CrossRef]
  29. Ma, Z.; Sun, Y.; Ji, H.; Li, S.; Nie, S.; Yin, F. A CNN-BiLSTM-Attention Approach for EHA Degradation Prediction Based on Time-Series Generative Adversarial Network. Mech. Syst. Signal Process. 2024, 215, 111443. [Google Scholar] [CrossRef]
  30. Chen, Y.; Wang, X.; Wang, Y.; Gao, Y.; Qu, J.; Dai, H.; Xu, C. Multi-Combination Fault Data Augmentation Method of Aero-Engine Gas Path Based on Extraction TimeGAN. Measurement 2025, 242, 115778. [Google Scholar] [CrossRef]
  31. Tang, Y.; Yu, X.; Qiu, J.; Guo, Y.; Yang, L.; Jiang, K. Reversibly Switchable Magnetically Controlled Solid-Liquid Triboelectric Nanogenerator Using Hierarchical Ecoflex/NdFeB Magnetic Polymer Surface. Adv. Funct. Mater. 2025, 35, 2415449. [Google Scholar] [CrossRef]
  32. Kong, X.; Cai, B.; Khan, J.A.; Gao, L.; Yang, J.; Wang, B.; Yu, Y.; Liu, Y. Concurrent Fault Diagnosis Method for Electric-Hydraulic System: Subsea Blowout Preventer System as a Case Study. Ocean Eng. 2024, 294, 116818. [Google Scholar] [CrossRef]
  33. Kong, X.; Cai, B.; Yu, Y.; Yang, J.; Wang, B.; Liu, Z.; Shao, X.; Yang, C. Intelligent Diagnosis Method for Early Faults of Electric-Hydraulic Control System Based on Residual Analysis. Reliab. Eng. Syst. Saf. 2025, 261, 111142. [Google Scholar] [CrossRef]
  34. Tang, P.; Li, Z.; Wang, X.; Liu, X.; Mou, P. Time Series Data Augmentation for Energy Consumption Data Based on Improved TimeGAN. Sensors 2025, 25, 493. [Google Scholar] [CrossRef]
  35. Sapai, S.; Loo, J.Y.; Ding, Z.Y.; Tan, C.P.; Baskaran, V.M.; Nurzaman, S.G. A Deep Learning Framework for Soft Robots with Synthetic Data. Soft Robot. 2023, 10, 1224–1240. [Google Scholar] [CrossRef]
  36. Lessmeier, C.; Kimotho, J.K.; Zimmer, D.; Sextro, W. Condition Monitoring of Bearing Damage in Electromechanical Drive Systems by Using Motor Current Signals of Electric Motors: A Benchmark Data Set for Data-Driven Classification. PHM Soc. Eur. Conf. 2016, 3, 1. [Google Scholar] [CrossRef]
  37. Wang, C.; Yang, J.; Jie, H.; Tao, Z.; Zhao, Z. A Lightweight Progressive Joint Transfer Ensemble Network Inspired by the Markov Process for Imbalanced Mechanical Fault Diagnosis. Mech. Syst. Signal Process. 2025, 224, 111994. [Google Scholar] [CrossRef]
Figure 1. Computational workflow of TimeGAN.
Machines 13 00969 g001
Figure 2. TFT-TimeGAN overall framework.
Machines 13 00969 g002
Figure 3. Multi-head cross-attention.
Machines 13 00969 g003
Figure 4. Scaled dot-set attention computation workflow.
Machines 13 00969 g004
Figure 5. Data acquisition platform (PU).
Machines 13 00969 g005
Figure 6. PU dataset demonstration of PCA dimensionality reduction in different model training.
Machines 13 00969 g006
Figure 7. PU dataset demonstration of t-SNE dimensionality reduction in different model training.
Machines 13 00969 g007
Figure 8. Power spectral density plot for each channel (PU dataset).
Machines 13 00969 g008
Figure 9. Data acquisition platform (ours).
Machines 13 00969 g009
Figure 10. Different fault damage.
Machines 13 00969 g010
Figure 11. Our dataset demonstration of PCA dimensionality reduction in different model training.
Machines 13 00969 g011
Figure 12. Our dataset demonstration of t-SNE dimensionality reduction in different model training.
Machines 13 00969 g012
Figure 13. Power spectral density plot for each channel (our dataset).
Machines 13 00969 g013
Figure 14. Generated data and original data inconsistency fault dimension reduction diagram (PU dataset).
Machines 13 00969 g014
Figure 15. Generated data and original data inconsistency fault dimension reduction diagram (SEU dataset).
Machines 13 00969 g015
Figure 16. Classification confusion matrix (a): PU dataset (b) SEU dataset.
Machines 13 00969 g016
Table 1. Model basic parameters.
Data SourcesDataset
Sequence length48
Windows1
Hidden dim24
Epochs6000
Num heads4
Num layer4
Dropout0.1
Table 2. Models for ablation study.
TypeTime DomainFrequency DomainEnvelopeInstantaneous PHASEDelay Loss
T0××××
T1×××
T2××
T3××
T4×
T5
(In this paper, we refer to T5 as TFT-TimeGAN). √ indicates the module was used; × indicates the module was not used.
Table 3. Training time (1000 iterations) and computational cost (single training run).
MethodPU Dataset Times (s)FLOPs (GM)Our Dataset Times (s)FLOPs (GM)
ABCDABCD
TFT-TimeGAN44.7 ± 1.4744.9 ± 1.68415.2 ± 1.2518.49551.9 ± 0.7051.3 ± 0.69426.6 ± 0.9818.536
T447.4 ± 2.4751.9 ± 0.50395.3 ± 3.6418.49547.8 ± 0.5147.5 ± 0.62411.1 ± 2.5318.536
T340.5 ± 1.3541.8 ± 1.52332.3 ± 1.5213.03639.5 ± 0.4839.6 ± 0.42346.5 ± 1.7813.068
T239.1 ± 1.3241.8 ± 1.55328.9 ± 0.5213.03640.2 ± 0.6440.9 ± 1.38357.1 ± 2.0013.068
T133.2 ± 1.7036.20 ± 0.59289.9 ± 2.4211.84734.5 ± 0.7133.8 ± 1.18295.1 ± 3.9211.871
T033.1 ± 0.6433.9 ± 0.53289.2 ± 1.6511.84734.8 ± 0.9333.6 ± 0.49283.8 ± 1.5711.871
TimeGAN19.9 ± 0.6117.8 ± 0.44165.1 ± 1.973.46620.3 ± 0.8718.5 ± 0.32176.1 ± 0.773.484
C-TimeGAN38.5 ± 0.7538.6 ± 0.36309.2 ± 3.1311.84838.6 ± 1.4237.8 ± 1.50305.8 ± 2.1511.872
Diffusion//235.3 ± 4.236.980//268.1 ± 6.376.991
VAE//1388.8 ± 9.121.173//1846.5 ± 8.571.173
DCGAN//1020.0 ± 5.399.574//1550.0 ± 3.259.586
Table 4. Basic details of the faults selected for the PU dataset.
LabelDamages TypeLoad Torque (N m)Rotational Speed (rpm)Radial Force(N)
KA01OR-EDM0.710001500
KA05OR-Electric Engraver0.74001500
KA04OR-Pitting0.74001500
KI01IR-EDM0.110001500
K003healthy0.710001500
Table 5. Indicators of generated data (PU dataset).
MethodFIDDTWWasserstein DistanceDiscriminate ScorePrediction Score
TFT-TimeGAN0.003 ± 0.0033.292 ± 1.2470.031 ± 0.0090.044 ± 0.0680.067 ± 0.009
T40.006 ± 0.0144.061 ± 2.1180.035 ± 0.0170.139 ± 0.1150.082 ± 0.011
T30.888 ± 0.80050.746 ± 50.2960.344 ± 0.1870.236 ± 0.1760.135 ± 0.012
T20.237 ± 0.33616.257 ± 9.8330.134 ± 0.0590.182 ± 0.1600.098 ± 0.035
T11.556 ± 0.91192.792 ± 63.6210.528 ± 0.1900.325 ± 0.0280.177 ± 0.051
T01.795 ± 0.70597.18 ± 50.3680.618 ± 0.1560.311 ± 0.0190187 ± 0.014
Diffusion1.777 ± 0.903110.231 ± 57.7790.617 ± 0.1910.209 ± 0.0500.105 ± 0.024
C-TimeGAN2.325 ± 1.139105.381 ± 47.7090.707 ± 0.2250.252 ± 0.1070.168 ± 0.025
TimeGAN2.277 ± 1.778102.238 ± 48.1520.631 ± 0.2470.360 ± 0.1820.129 ± 0.016
VAE2.118 ± 1.21097.462 ± 49.8280.741 ± 0.2170.332 ± 0.0340.163 ± 0.049
DCGAN2.403 ± 1.753103.027 ± 45.7310.695 ± 0.2470.457 ± 0.0020.247 ± 0.054
Table 6. Comparison of distributional test metrics (PU dataset).
MethodKSAUCMMD
TFT-TimeGAN0.052 ± 0.0090.570 ± 0.0282.779 ± 0.002
T40.063 ± 0.0040.621 ± 0.0372.877 ± 0.001
T30.176 ± 0.0080.688 ± 0.0392.880 ± 0.002
T20.177 ± 0.0050.689 ± 0.0332.878 ± 0.002
T10.174 ± 0.0090.693 ± 0.0302.880 ± 0.003
T00.197 ± 0.0120.787 ± 0.0262.885 ± 0.003
Diffusion0.074 ± 0.0160.747 ± 0.0352.887 ± 0.006
C-TimeGAN0.185 ± 0.0090.746 ± 0.0162.889 ± 0.001
TimeGAN0.106 ± 0.0090.884 ± 0.0082.899 ± 0.002
VAE0.176 ± 0.0090.719 ± 0.0532.861 ± 0.003
DCGAN0.084 ± 0.0180.996 ± 0.0052.891 ± 0.003
Table 7. Motor specifications used in the experiments.
Motor ModelYE2-100L2-4
Rated Power3 kw
Rated Voltage380 V
Rated Current6.8 A
Rated Speed1420 r/min
Frequency50 Hz
Wiring MethodY
Load25%
Sample Frequency1 Khz
Table 8. Indicators of generated data (our dataset).
MethodFIDDTWWasserstein
Distance
Discriminate ScorePrediction Score
TFT-TimeGAN0.014 ± 0.0227.133 ± 2.6880.039 ± 0.0100.044 ± 0.0440.094 ± 0.024
T40.022 ± 0.0288.077 ± 3.0030.046 ± 0.0120.175 ± 0.0350.125 ± 0.037
T32.139 ± 2.01357.757 ± 21.5970.320 ± 0.1000.311 ± 0.0880.148 ± 0.062
T22.146 ± 2.017100.661 ± 45.4110.350 ± 0.1100.298 ± 0.0550.185 ± 0.066
T12.419 ± 1.982118.497 ± 41.8270.423 ± 0.1100.361 ± 0.0150.195 ± 0.013
T02.348 ± 1.981124.858 ± 42.3680.417 ± 0.1110.374 ± 0.0160.209 ± 0.038
Diffusion2.404 ± 1.330169.122 ± 37.2600.422 ± 0.0920.386 ± 0.0360.187 ± 0.044
C-TimeGAN1.909 ± 0.159122.246 ± 2.42400.331 ± 0.0460.349 ± 0.0230.189 ± 0.067
TimeGAN1.026 ± 2.481136.912 ± 35.4780.486 ± 0.1950.373 ± 0.0580.208 ± 0.014
VAE6.951 ± 3.459160.216 ± 20.4640.819 ± 0.1820.422 ± 0.0180.222 ± 0.039
DCGAN11.487 ± 2.253224.448 ± 21.8220.896 ± 0.0440.474 ± 0.0220.278 ± 0.062
Table 9. Comparison of distributional test metrics (our dataset).
MethodKSAUCMMD
TFT-TimeGAN0.053 ± 0.0050.666 ± 0.0172.839 ± 0.001
T40.086 ± 0.0040.702 ± 0.0212.840 ± 0.002
T30.266 ± 0.0060.795 ± 0.0132.847 ± 0.003
T20.249 ± 0.0040.739 ± 0.0142.869 ± 0.004
T10.263 ± 0.0070.877 ± 0.0152.919 ± 0.003
T00.271 ± 0.0070.964 ± 0.0122.930 ± 0.002
Diffusion0.083 ± 0.0050.774 ± 0.0042.869 ± 0.003
C-TimeGAN0.172 ± 0.0080.851 ± 0.0112.868 ± 0.002
TimeGAN0.128 ± 0.0140.879 ± 0.0082.895 ± 0.006
VAE0.272 ± 0.0080.899 ± 0.0092.983 ± 0.005
DCGAN0.471 ± 0.0120.997 ± 0.0033.009 ± 0.002
Table 10. Basic details of the faults selected for the SEU dataset.
LabelLoad Torque (Nm)Rotational Speed (rpm)Sampling Rate (Hz)
Chipped7.3218005120
Health7.3218005120
MISS7.3218005120
Root7.3218005120
Surface7.3218005120
Table 11. Classification evaluation indicators (PU dataset).
DatasetPU Dataset
TypeK003KA01KA04KA05KI01
Precision0.912 ± 0.0550.928 ± 0.0680.988 ± 0.0090.888 ± 0.0780.996 ± 0.004
Recall0.927 ± 0.0540.871 ± 0.1230.976 ± 0.0220.914 ± 0.0850.999 ± 0.001
F1-score0.917 ± 0.0170.893 ± 0.0680.982 ± 0.0100.895 ± 0.0350.997 ± 0.002
Accuracy0.937 ± 0.018
Table 12. Classification evaluation indicators (SEU dataset).
DatasetSEU Dataset
TypeChippedHealthMissRootSurface
Precision0.882 ± 0.0280.971 ± 0.0640.945 ± 0.0180.984 ± 0.0100.983 ± 0.034
Recall0.996 ± 0.0070.999 ± 0.0010.997 ± 0.0030.954 ± 0.1010.796 ± 0.065
F1-score0.935 ± 0.0120.984 ± 0.0340.970 ± 0.0080.966 ± 0.0540.877 ± 0.026
Accuracy0.948 ± 0.012
Disclaimer/Publisher’s Note: The statements, opinions and data contained in all publications are solely those of the individual author(s) and contributor(s) and not of MDPI and/or the editor(s). MDPI and/or the editor(s) disclaim responsibility for any injury to people or property resulting from any ideas, methods, instructions or products referred to in the content.