Article

A Novel Two-Stage Gas-Excitation Sampling and Sample Delivery Device: Simulation and Experiments

by
Xu Yang
,
Dewei Tang
,
Qiquan Quan
* and
Zongquan Deng
State Key Laboratory of Robotics and System, Harbin Institute of Technology, No. 92, Xidazhi Street, Nangang District, Harbin 150001, China
*
Author to whom correspondence should be addressed.
Machines 2025, 13(10), 958; https://doi.org/10.3390/machines13100958
Submission received: 20 September 2025 / Revised: 8 October 2025 / Accepted: 16 October 2025 / Published: 17 October 2025
(This article belongs to the Section Machine Design and Theory)

Abstract

Asteroids are remnants of primordial material from the early stages of solar system formation, approximately 4.6 billion years ago, and they preserve invaluable records of the processes underlying planetary evolution. Investigating asteroids provides critical insights into the mechanisms of planetary development and the potential origins of life. To enable efficient sample acquisition under vacuum and microgravity conditions, this study introduces a two-stage gas-driven asteroid sampling strategy. This approach mitigates the challenges posed by low-gravity environments and irregular asteroid topography. A coupled computational fluid dynamics–discrete element method (CFD–DEM) framework was employed to simulate the gas–solid two-phase flow during the sampling process. First, a model of the first-stage gas-driven sampling device was developed to establish the relationship between the inlet angle of the gas nozzle and the sampling efficiency, leading to the optimization of the nozzle’s structural parameters. Subsequently, a model of the integrated two-stage gas-driven sampling and sample-delivery system was constructed, through which the influence of the second-stage nozzle inlet angle on the total collected sample mass was investigated, and its design parameters were further refined. Simulation outcomes were validated against experimental data, confirming the reliability of the CFD–DEM coupling approach for predicting gas–solid two-phase interactions. The results demonstrate the feasibility of collecting asteroid regolith with the proposed two-stage gas-driven sampling and delivery system, thereby providing a practical pathway for extraterrestrial material acquisition.

1. Introduction

Asteroid exploration has emerged as a significant research frontier following the investigation of the Moon, Mars, comets, and other celestial bodies. It plays a critical role in advancing our understanding of the origin of the solar system, the evolutionary processes of planets, and the potential pathways for the emergence of life. Moreover, asteroid detection provides valuable insights into the geodynamic mechanisms of asteroid impacts on Earth and underpins the development of planetary defense strategies [1]. As a multidisciplinary endeavor, asteroid detection constitutes a highly integrated systems engineering challenge [2,3], encompassing key technologies such as space propulsion, anchoring mechanisms, sampling and retrieval, and space communication. With the United States, Japan, and Europe having conducted multiple asteroid exploration missions [4], research into asteroid detection technologies has attracted broad and sustained international attention.
Prior to the 1990s, asteroid detection primarily relied on ground-based telescopic astronomical observations and laboratory analyses of meteorites [5]. With the advancement of space technology, however, novel approaches to near-Earth and deep space exploration—such as flybys, orbital missions, in situ investigations, and sample-return missions—were progressively developed [6,7]. In 1991, the United States launched the Galileo Orbiter, which achieved the first close-range asteroid observation. En route to Jupiter, it encountered asteroid Gaspra 951 and executed a flyby at a distance of 1600 km, thereby capturing the first high-resolution images of an asteroid [8]. In 2000, the National Aeronautics and Space Administration (NASA)’s Near Earth Asteroid Rendezvous (NEAR) probe rendezvoused with asteroid Eros, entered orbit, and successfully landed on its surface in 2001, conducting the first dedicated asteroid exploration mission [9]. In 2003, Japan launched the Hayabusa mission [10], which pioneered the first asteroid sample-return endeavor. Its innovative “touch-and-go” landing, sampling, and ascent strategy provided critical insights into the exploration of small bodies with weak gravity. In 2004, the European Space Agency (ESA) launched the Rosetta probe, designed to perform a soft landing on comet 67P, collect both surface and subsurface material, and conduct in situ experimental investigations [11,12]. This marked humanity’s first comet sampling mission. In 2012, China’s Chang’e-2 probe conducted a flyby of asteroid 4179 Toutatis, capturing high-resolution optical images and setting a record for the closest approach by a spacecraft to an asteroid [13,14]. In 2014, Japan initiated the Hayabusa2 mission [15], targeting asteroid 1999 JU3 (Ryugu) [16]. The probe arrived in 2018 and performed two sampling operations in 2019 using the brief “touch-and-go” method [17,18]. In 2016, NASA launched the Origins Spectral Interpretation Resource Identification Security Regolith Explorer (OSIRIS-REx) mission [19], the first spacecraft specifically designed to collect and return samples from an asteroid, targeting the carbonaceous asteroid Bennu (1999 RQ36) [20]. Subsequently, in 2021, NASA launched the Lucy mission to explore a main-belt asteroid along with seven Trojan asteroids [21]. In 2023, NASA deployed the Psyche spacecraft to conduct close-range exploration of Psyche, the largest known M-type asteroid [22]. Most recently, in May 2025, China launched the Tianwen-2 mission to sample and return material from asteroid 2016 HO3 [23].
The aforementioned probes have largely accomplished the sampling missions of extraterrestrial bodies. Sampling collection and return have thus emerged as the prevailing trend in asteroid exploration, representing the only direct means of acquiring mineralogical information about these bodies. Nevertheless, the weak gravitational environment of asteroid surfaces renders traditional approaches—such as borehole drilling and excavation—difficult to implement, thereby imposing unique technical requirements on sampling technologies [24]. Asteroids themselves are highly diverse, and their surface compositions are categorized into 14 distinct types under the Tholen spectral classification system [25]. According to the Tholin spectral classification system, asteroids can be divided into 24 categories, with the three most numerous being C-type (carbonaceous), S-type (silicate), and M-type (metallic) [26]. However, even within the same category, substantial structural and compositional variations exist, making sampling targets inherently uncertain and necessitating highly adaptable sampling devices [27,28]. Moreover, the irregular surface morphology of asteroids, often characterized by steep slopes, ridges, and meteorite craters, further complicates sampling operations [29]. Consequently, sampling devices must be flexibly designed to operate across diverse terrains and enable multiple, repeated, multi-point sampling. Simultaneously, the stringent constraints of energy supply and mass budgets in deep space missions demand simplified structural designs to minimize mass and energy consumption [25,30]. Although current knowledge of asteroid regolith remains limited, considering the difficulties imposed by low gravity on conventional drilling and core extraction techniques, the direct collection of dust and gravel from the regolith appears to be a more feasible approach [29].
Currently, only Hayabusa, Hayabusa2, and OSIRIS-REx have completed sample collection for asteroids. Hayabusa and Hayabusa2 both use sputtering sampling, which has a simple principle and can collect the surface materials of asteroids with different hardness. However, the instantaneous sampling method provides limited sampling force and short sampling time, resulting in less sample acquisition and mostly surface materials. In addition, the detector is in an unstable state during the sampling process, and the mechanical characteristics fluctuate greatly [16]. OSIRIS-REx adopts gas-excitation sampling, with fewer moving parts and no need for motors. It is lightweight, compact, and has a small reaction force. The gas expands in volume in the vacuum environment of asteroids, generating greater energy [19].
Considering the uncertainties of the asteroid environment and its differences from Earth’s conditions [31], conducting the ground-based testing of sampling devices poses significant challenges. The primary methods used to evaluate asteroid sampling devices include numerical simulation approaches, particularly computational fluid dynamics (CFD) and the discrete element method (DEM) [32], which are applied to calculate the effects of different structural parameters of gas-blowing devices on particle motion and collection efficiency. Experimental approaches typically employ air blowers to directly test particles of varying characteristics, thereby enabling functional verification and performance assessment of asteroid sampling devices. Moreover, experimental studies provide direct evaluation of the sampling efficiency and reliability of these devices, underscoring the necessity of such investigations in this research.
In this paper, a gas sampling device was brought out. The gas blowing device consists of a blowing module with a first-stage and second-stage. Afterward, the numerical simulation method is used to optimize the structural parameters with the requirement of an air blower for structural parameters optimization. Based on the optimization of structural parameters, a series of experimental designs are brought out and used to validate the results of numerical simulation. Finally, the feasibility of the air blowing device for sampling the asteroid surface is proved in this research.

2. Collectivity Scheme for the Asteroid Sampling Device

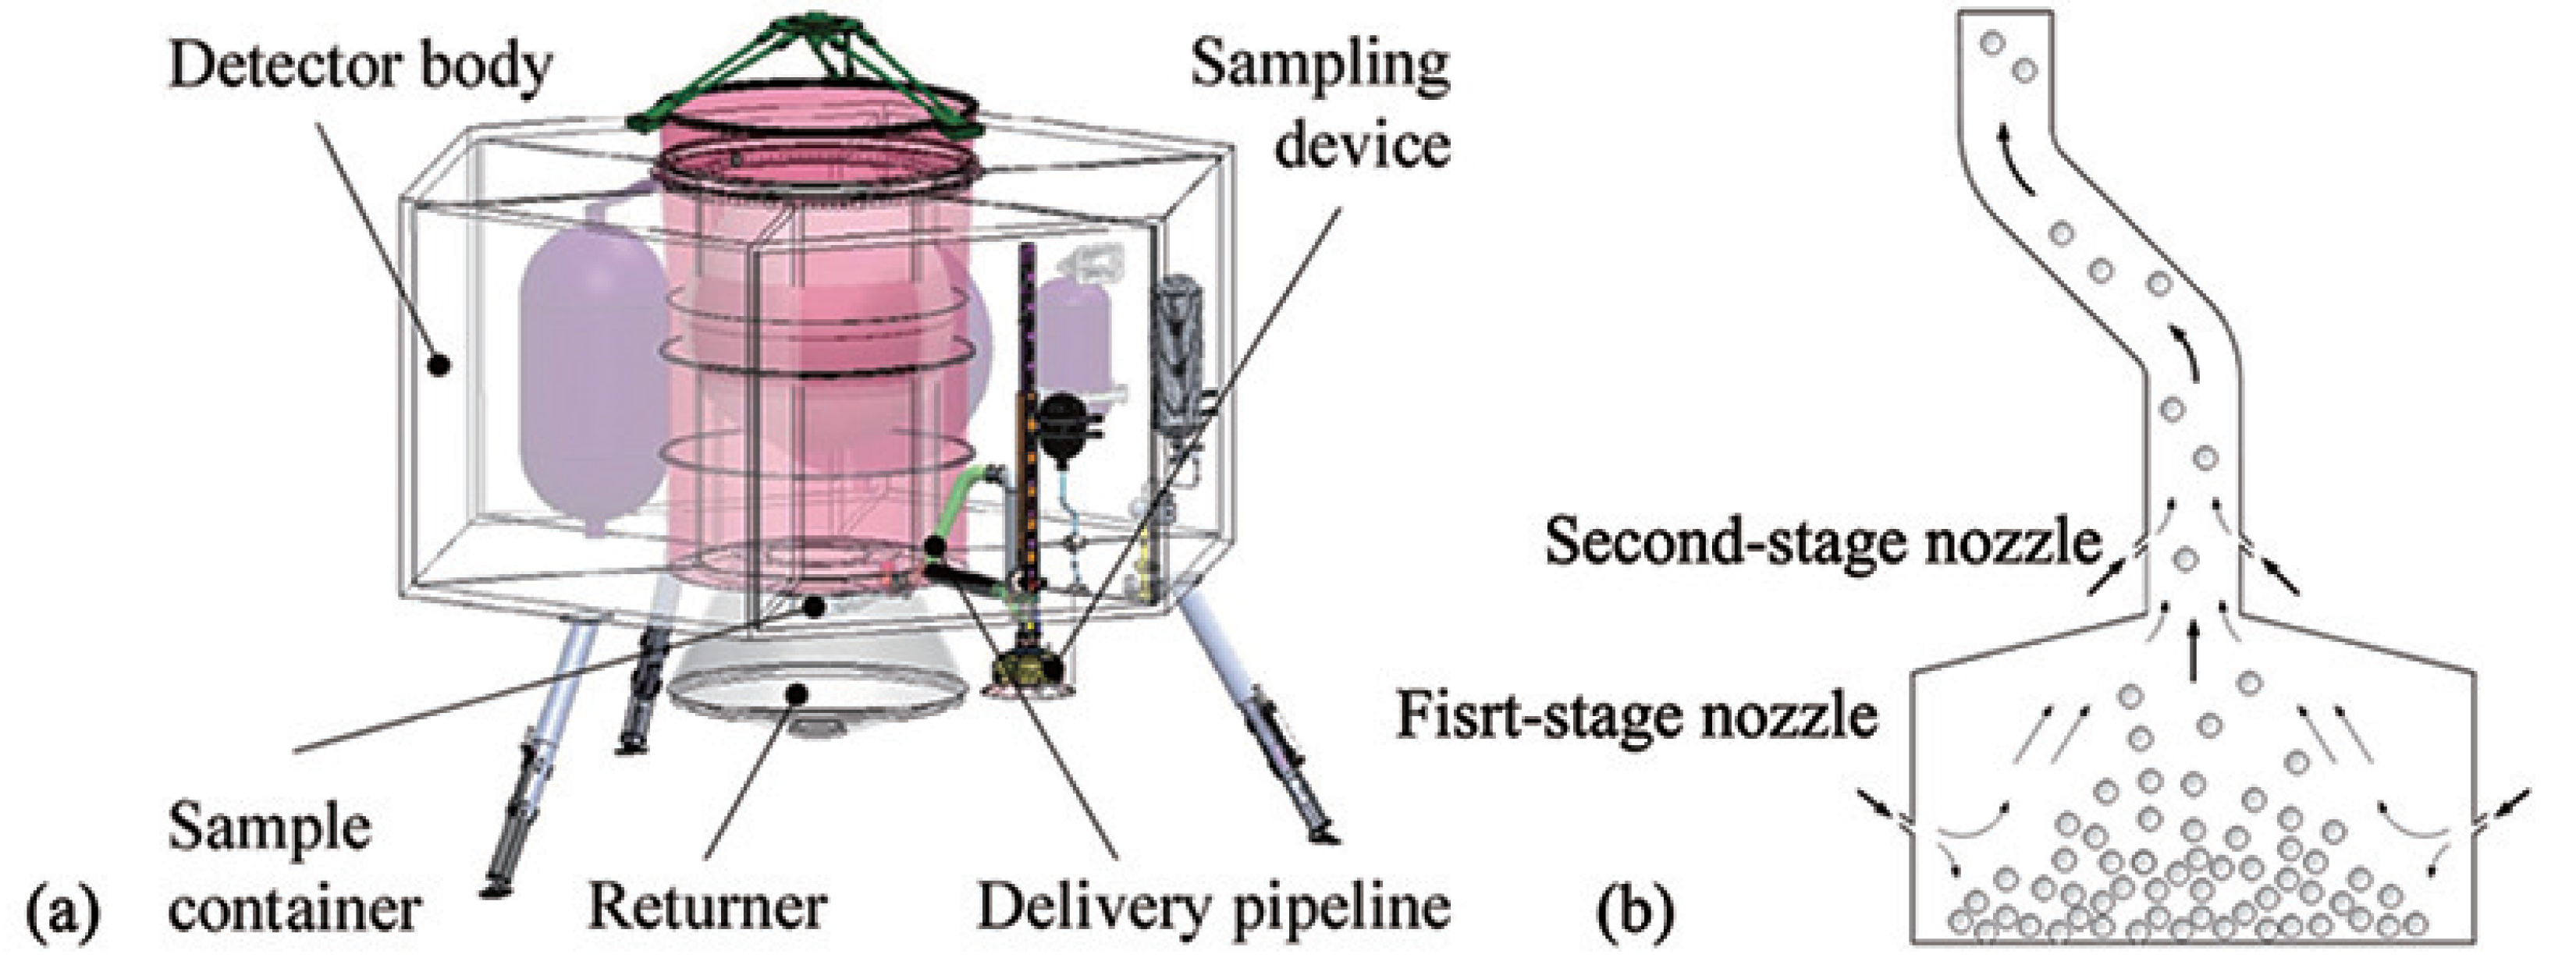
The asteroid sampling system primarily consists of a two-stage gas-excitation sampling and delivery device, a sample container, a sample return capsule, and a delivery pipeline, as illustrated in Figure 1. The two-stage gas-excitation unit is mounted on the inner wall of the asteroid detector, while the sample container is housed within the return capsule. Upon the completion of sampling, the container is detached from the device, hermetically sealed, and subsequently returned to Earth along with the capsule. In comparison with previous missions, the Hayabusa scheme exhibited a high likelihood of failure under vacuum conditions, resulting in a low adoption rate and insufficient reliability and sustainability. Similarly, the OSIRIS-REx scheme demonstrated poor reliability and limited sampling efficiency, as the gas-sampling process required subsequent mechanical arm operations for sample transfer. By contrast, the two-stage gas-excitation sampling and delivery device proposed in this study achieves the integration of sampling and transfer without the need for complex mechanical structures. This integration is realized through sequential first- and second-stage gas-excitation units, thereby simplifying the overall process while enabling sustained, long-term sampling. After the sampling operation, the two-stage gas-excitation device separates from the detector body, and the sealed sample container is returned to the Earth.

3. Numerical Simulation

3.1. Simulation Methodology

This work employs a CFD–DEM gas–solid two-phase flow coupling simulation approach. Using this method, the operational process of the gas-excitation sampling and delivery device, as well as the interphase interaction forces, are numerically investigated. The dynamic description of the fluid phase is based on the volumetric Navier–Stokes equation, where the fluid continuity equation is
ε g ρ g t + · ε g ρ g u g = 0
The momentum conservation equation of fluid is
ε g ρ g u g t + · ε g ρ g u g u g = ε g p S p · ε g τ g + ε g ρ g g
The phase transfer equation is
S p = 1 V cell F d
In these equations, ε g represents the cell void fraction, ρ g represents the fluid phase density, u g represents the fluid velocity vector, p represents the pressure, S p represents the momentum source term generated by the particle, τ g represents viscous stress tensor, g is the acceleration of gravity, V cell represents the computational cell volume, and F d represents the drag force of the fluid relative to the particle, which can be derived with the following equation
F d = 1 8 π d p 2 C D u g u p u g u p
In this equation, d p represents the particle diameter, C D represents the drag coefficient, while u p represents the particle velocity vector.
The description of the motion of particles follows Newton’s second law as following
m p d u p d t = m p g + F d + F c V p p
I p d ω p d t = T p
In this equation, m p represents the mass of a single particle, F c represents the contact force between particles, V p represents the volume of a single particle, I p represents the moment of inertia of the particle, ω p represents the angular velocity vector of the particles, and T p represents the torque applied on the particles.
To mitigate the influence of Earth’s gravity and approximate the low-gravity condition of asteroids, low-density expanded polystyrene (EPS) particles were selected as mechanically equivalent substitutes, with a simplified spherical shape to ensure consistency and controllability in both experiments and simulations. To ensure consistency between the simulated particle parameters and the experimental materials, both intrinsic material properties and fundamental contact parameters of the foam balls must first be established.
The key intrinsic parameters of the material include Poisson’s ratio, shear modulus, and density, which are characteristic of the material itself and can be obtained from the literature and technical manuals. Since the density of EPS foam balls typically falls within a range, it is determined by the expansion ratio of polystyrene particles during molding, generally between 10 40 kg / m 3 . For this study, 4 mm foam balls were selected and screened using a sieve. Given that polystyrene is hydrophobic, the density of the foam balls was measured via the drainage method, yielding a value of 36.6 kg / m 3 .
German scholars Eriksson and Tränk summarized the relationship between the elastic modulus and density of EPS materials in 1991 [33].
E = 0.097 ρ 2 0.014 ρ + 1.8
The elastic modulus of the EPS material is calculated to be E = 14.28 MPa using Equation (7).
The basic contact parameters mainly include the collision recovery coefficient, static friction coefficient, and rolling friction coefficient, which are further divided into particle-to-geometry contact parameters. The shape and humidity of materials usually have a significant impact on such parameters, and there are no manuals or relevant literature available for reference. Therefore, it is usually necessary to calibrate these parameters through “virtual experiments”.
The definition of the recovery coefficient is the ratio of forward and backward velocities, which can be converted into a relationship of height without considering air resistance.
e = v 2 v 1 = 2 g h 2 2 g h 1 = h 2 h 1
In this equation, v 1 is the velocity before the collision, v 2 is the velocity after the collision, h 1 is the height before falling, and h 2 is the maximum height of the rebound after the collision.
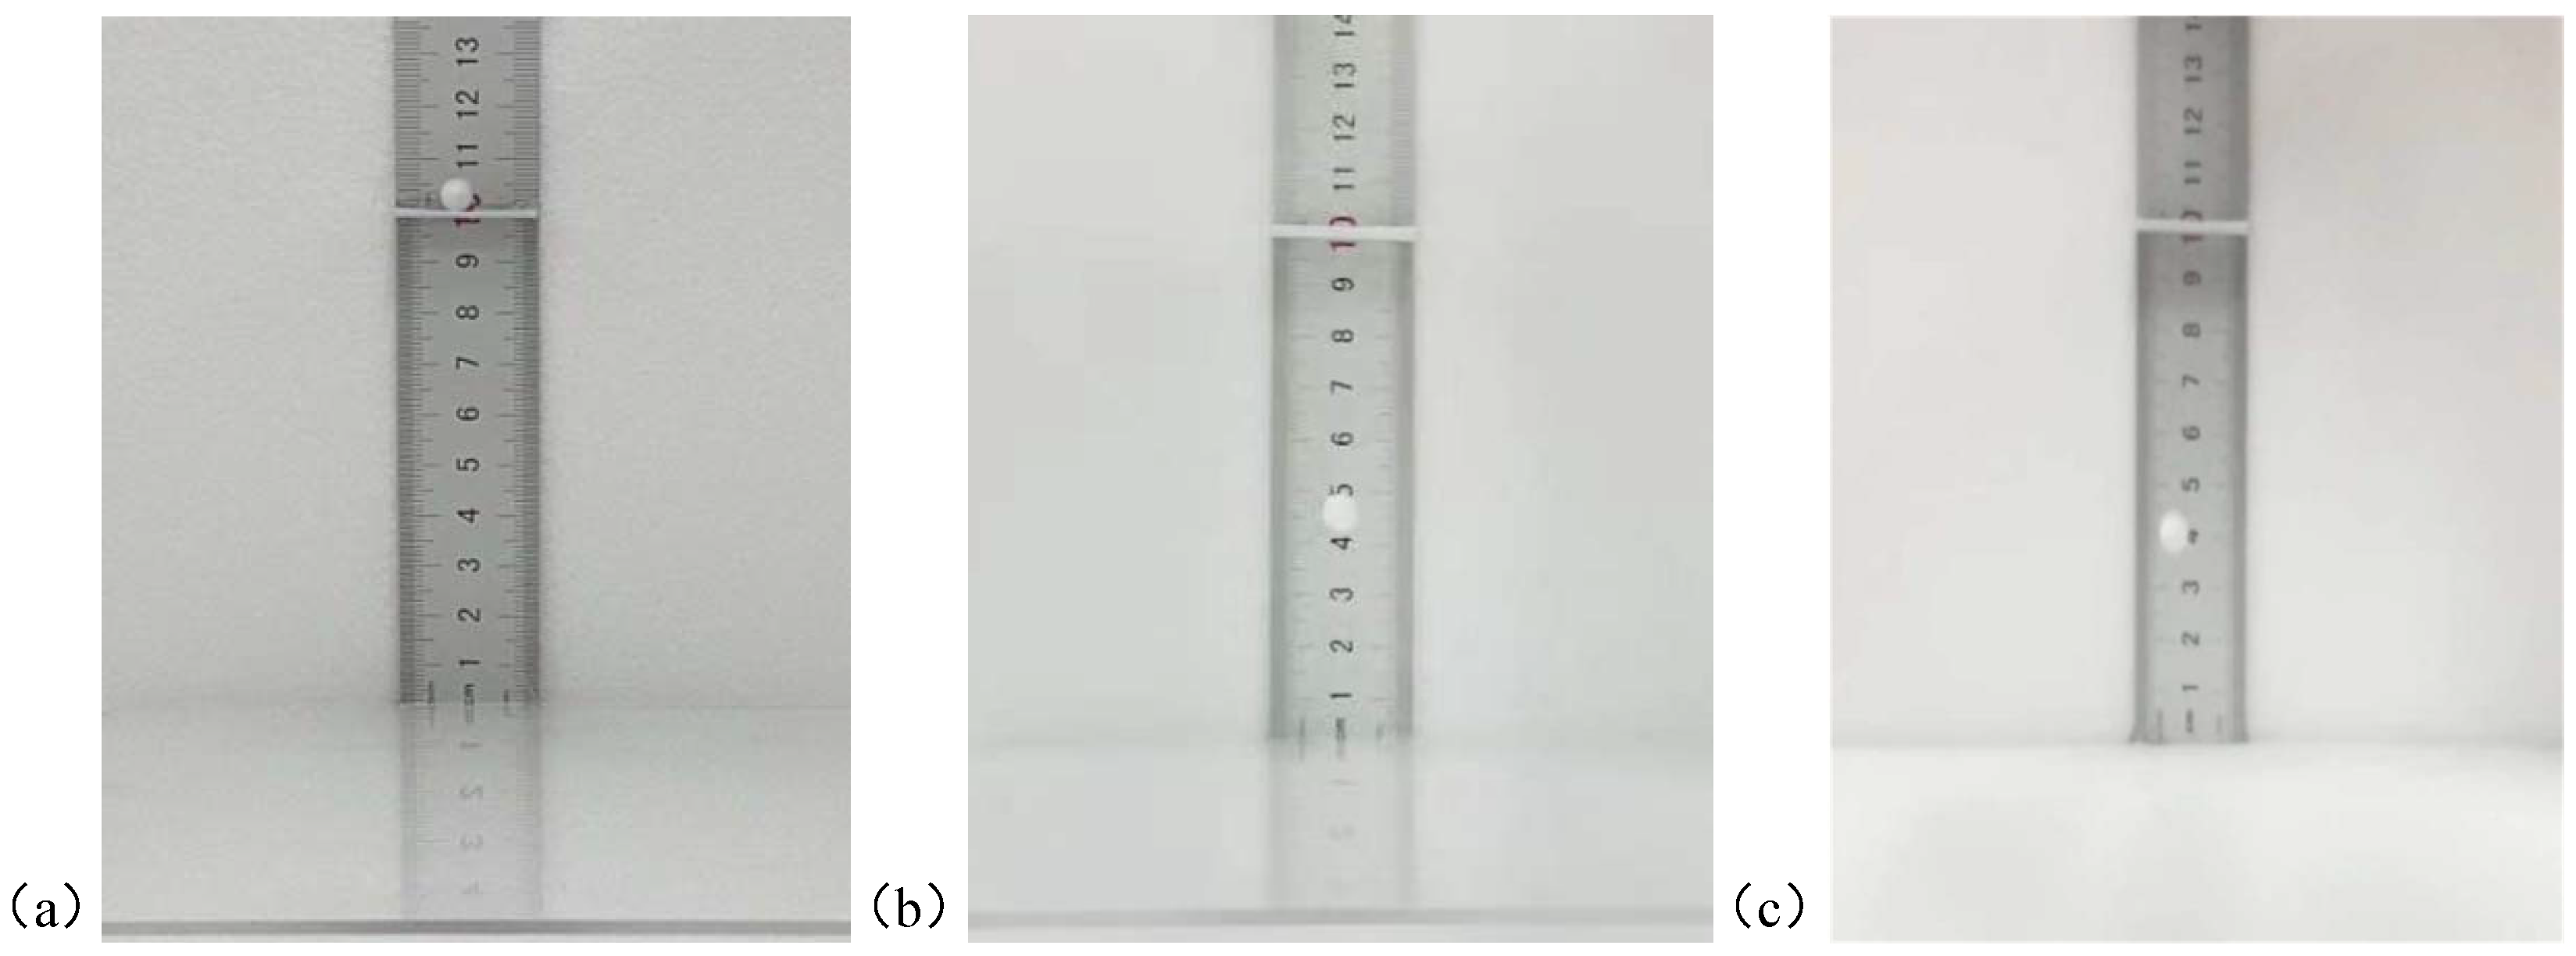
The measurement experiment of the foam ball recovery coefficient is shown in Figure 2. For Figure 2a, the initial height of the foam ball is set to h 1 = 10 cm. According to the bounce height of foam ball in Figure 2b, the recovery coefficient of foam ball and geometry can be calculated as e 1 = 0.636. According to the bounce height of the foam balls in Figure 2c, the recovery coefficient between foam balls is e 2 = 0.604.
The static friction coefficient between the EPS material and the wall is 0.60 by measuring the minimum inclination angle of the EPS material foam block sliding on the geometric material. By measuring the minimum inclination angle of the EPS foam ball material to roll with the geometric material, the rolling friction coefficient between the EPS material and the wall surface was determined to be 0.075.
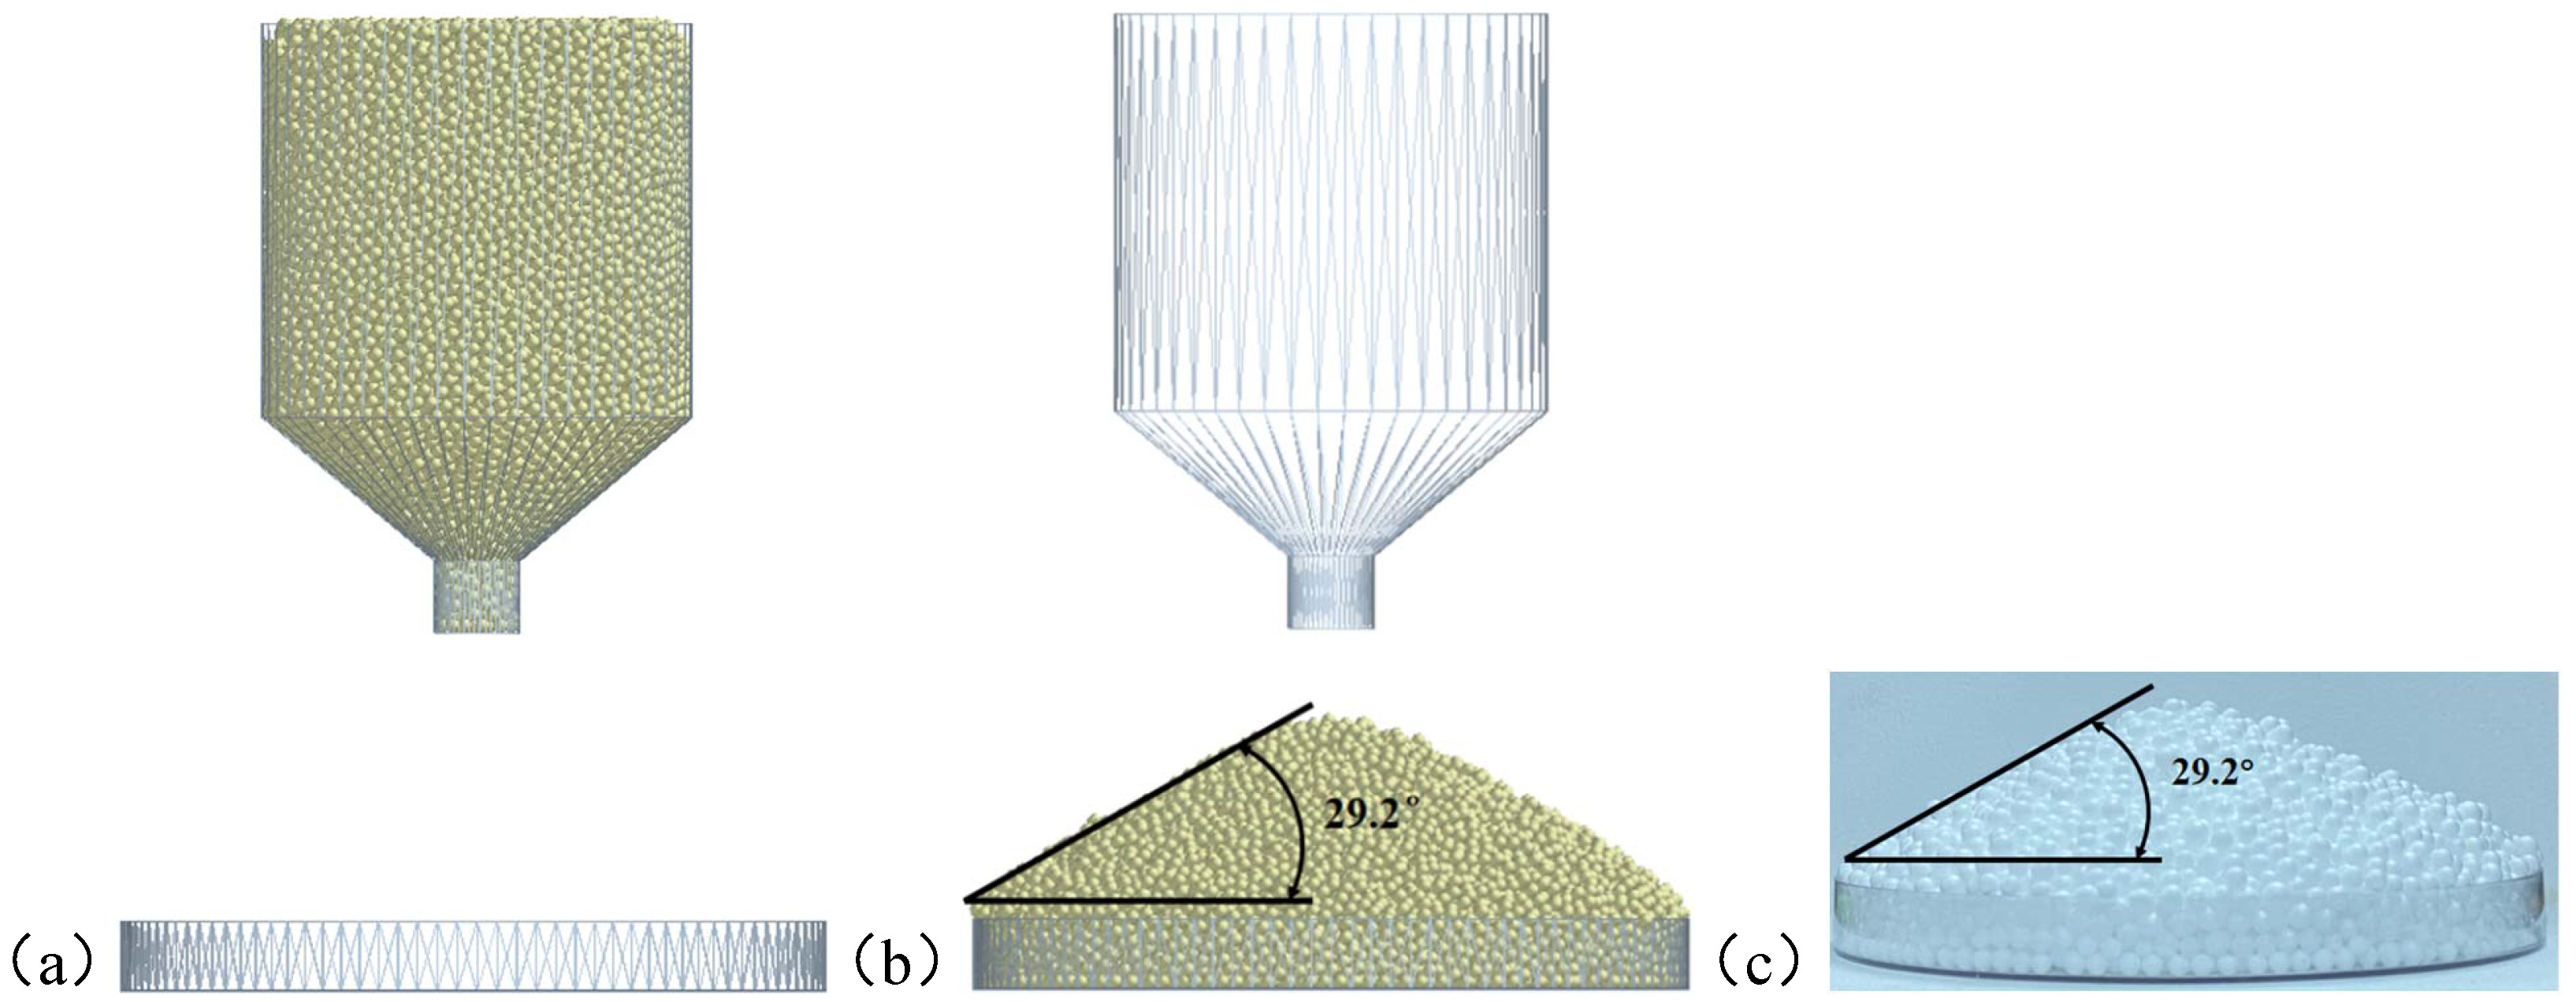
It is difficult to directly measure the particle-to-particle static friction coefficient and rolling friction coefficient. In engineering, the angle between the surface of a stable cone pile formed by the free accumulation of bulk materials under gravity and the horizontal plane, known as the accumulation angle, is measured and compared with the particle-to-particle static friction coefficient and rolling friction coefficient in EDEM simulation software to determine the particle-to-particle contact parameters. In order to measure the static friction coefficient and rolling friction coefficient between particles, virtual calibration experiments were conducted as shown in Figure 3. Figure 3a represents the initial state of the calibration experiment. The particles are stacked through free blanking in the particle factory filled with 4 mm foam balls. This article sets the static friction coefficients between particles to 0.3, 0.4, 0.5, and 0.6, and sets the rolling friction coefficients between particles to 0.02, 0.03, 0.04, and 0.05. A total of 16 virtual calibration experiments were conducted. By comparing with the accumulation angle of the actual foam ball particles in Figure 3c of 29.2°, it is finally determined that the static friction coefficient between particles is 0.5, and the rolling friction coefficient between particles is 0.03.
The other detailed simulation parameters are shown in Table 1.
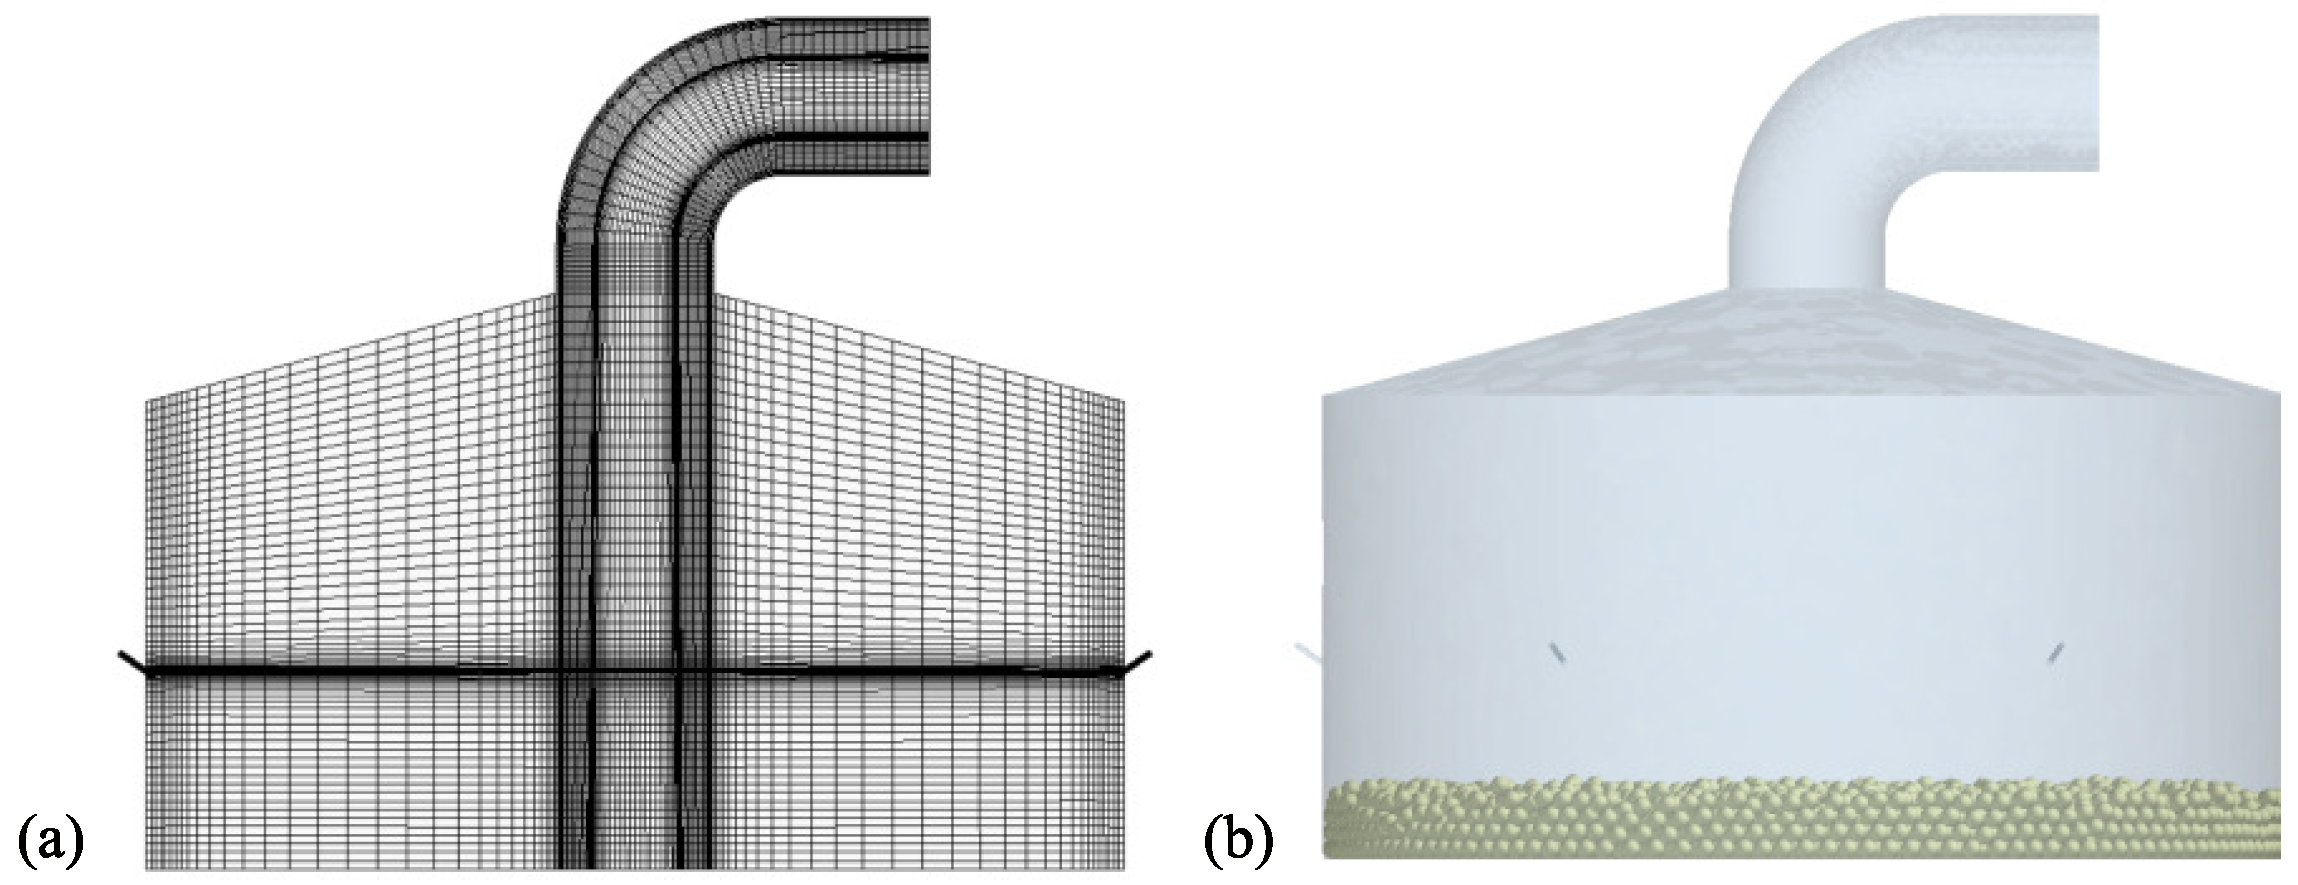
The sampling unit adopts a cylindrical hollow hood design, which forms a sealed space when brought into contact with the asteroid surface. In this configuration, six first-stage gas nozzles, each with a diameter of 1 mm, are installed at the lower section of the hood wall and are uniformly arranged symmetrically along the circumference. These nozzles eject high-pressure gas downward at a specified angle, mobilizing the asteroid regolith particles and directing them toward the hood outlet to accomplish the sampling process. The CFD–DEM gas–solid two-phase flow coupling model of the first-stage gas-excitation unit is illustrated in Figure 4.
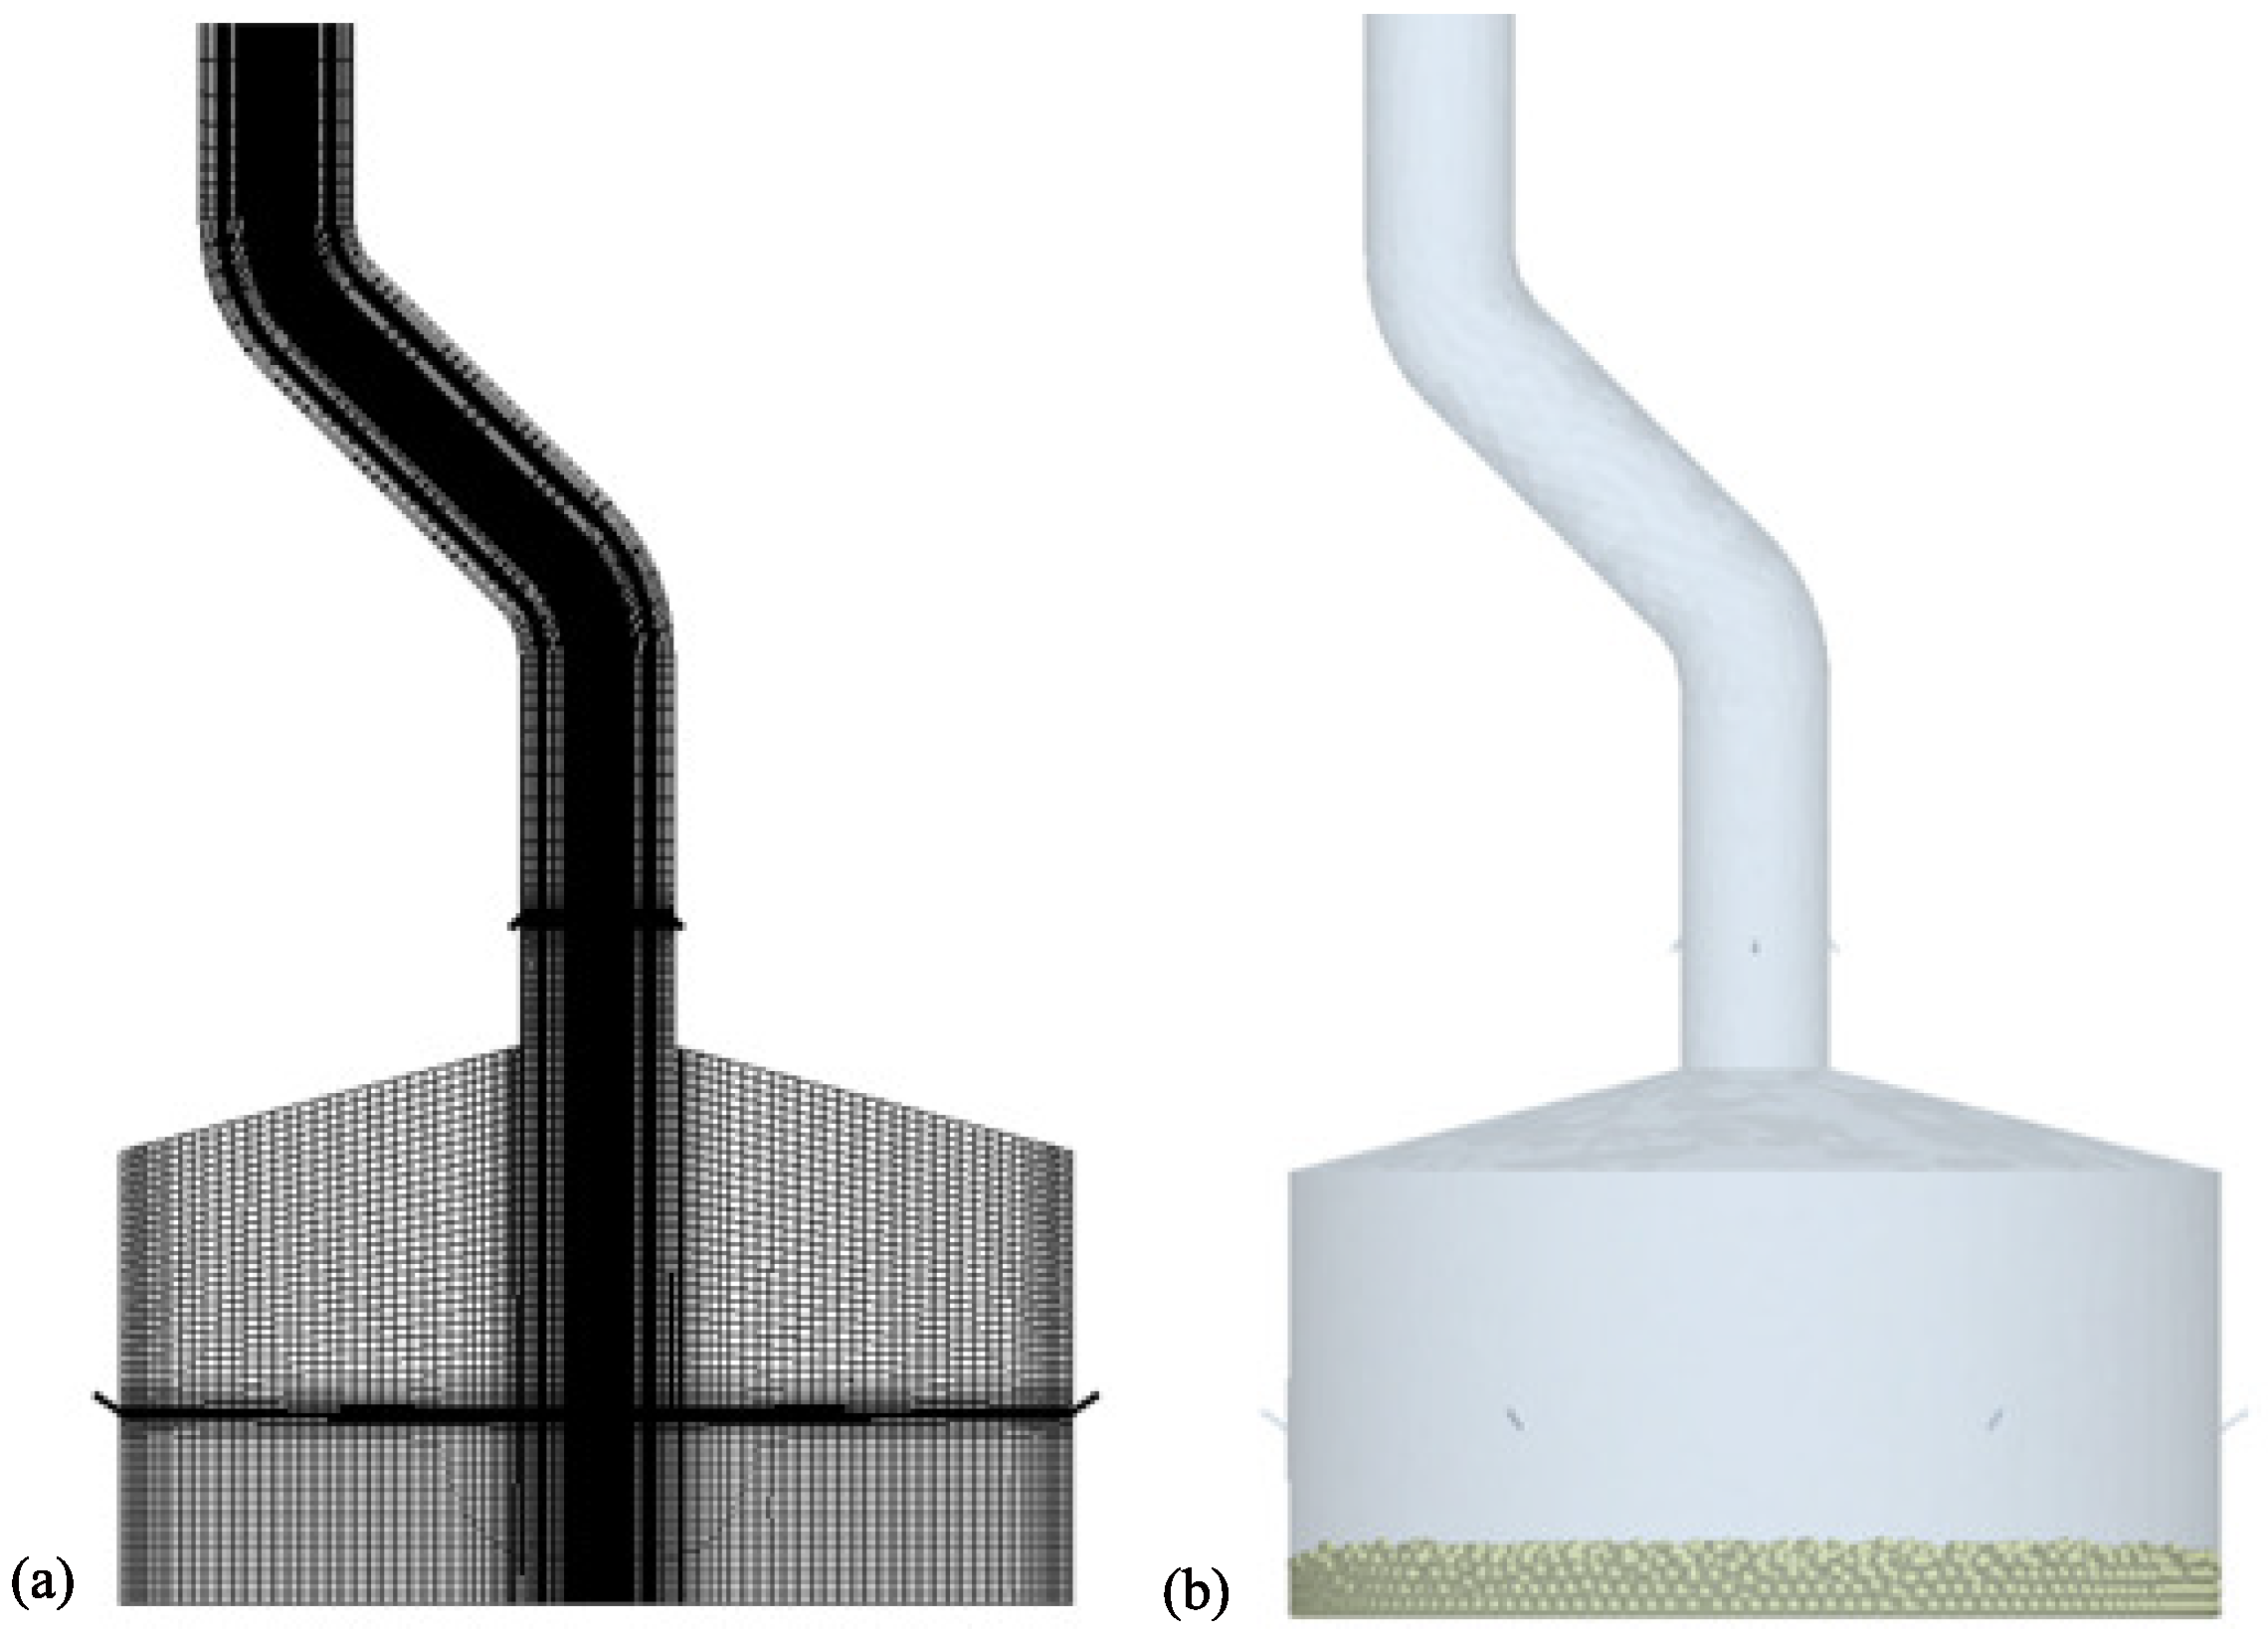
Building upon the first-stage gas-excitation sampling device, a two-stage integrated gas-excitation sampling and delivery system is developed. The outlet of the sampling hood is connected to a vertical sample-conveying pipeline with a height of 880 mm. At the junction between the hood and the pipeline, four second-stage nozzles, each with an upward inclination and a diameter of 1.2 mm, are installed. In this design, the first-stage nozzles eject downward gas to dislodge and transport regolith particles toward the hood–pipeline junction, while the second-stage nozzles eject gas obliquely upward to convey the particles through the pipeline into the sample container, thereby completing the entire sampling and delivery process. The simulation model of the two-stage integrated gas-excitation sampling and delivery device is shown in Figure 5.

3.2. Simulation Results of the First-Stage Gas-Excitation Sampling in the Earth’s Environment

In this simulation, the nozzle angle is defined as the angle between the central axis of the nozzle and the wall of the sampling hood. The nozzle angle was varied within a range of 35°–80° with an increment of 5°. The inlet pressure of the nozzle was set to 0.1 MPa, while the outlet pressure at the pipeline was maintained at 0 MPa. Gravity was modeled at 9.81 m / s 2 , consistent with terrestrial conditions, and the total simulation duration was 10 s. The corresponding results are summarized in Table 2.
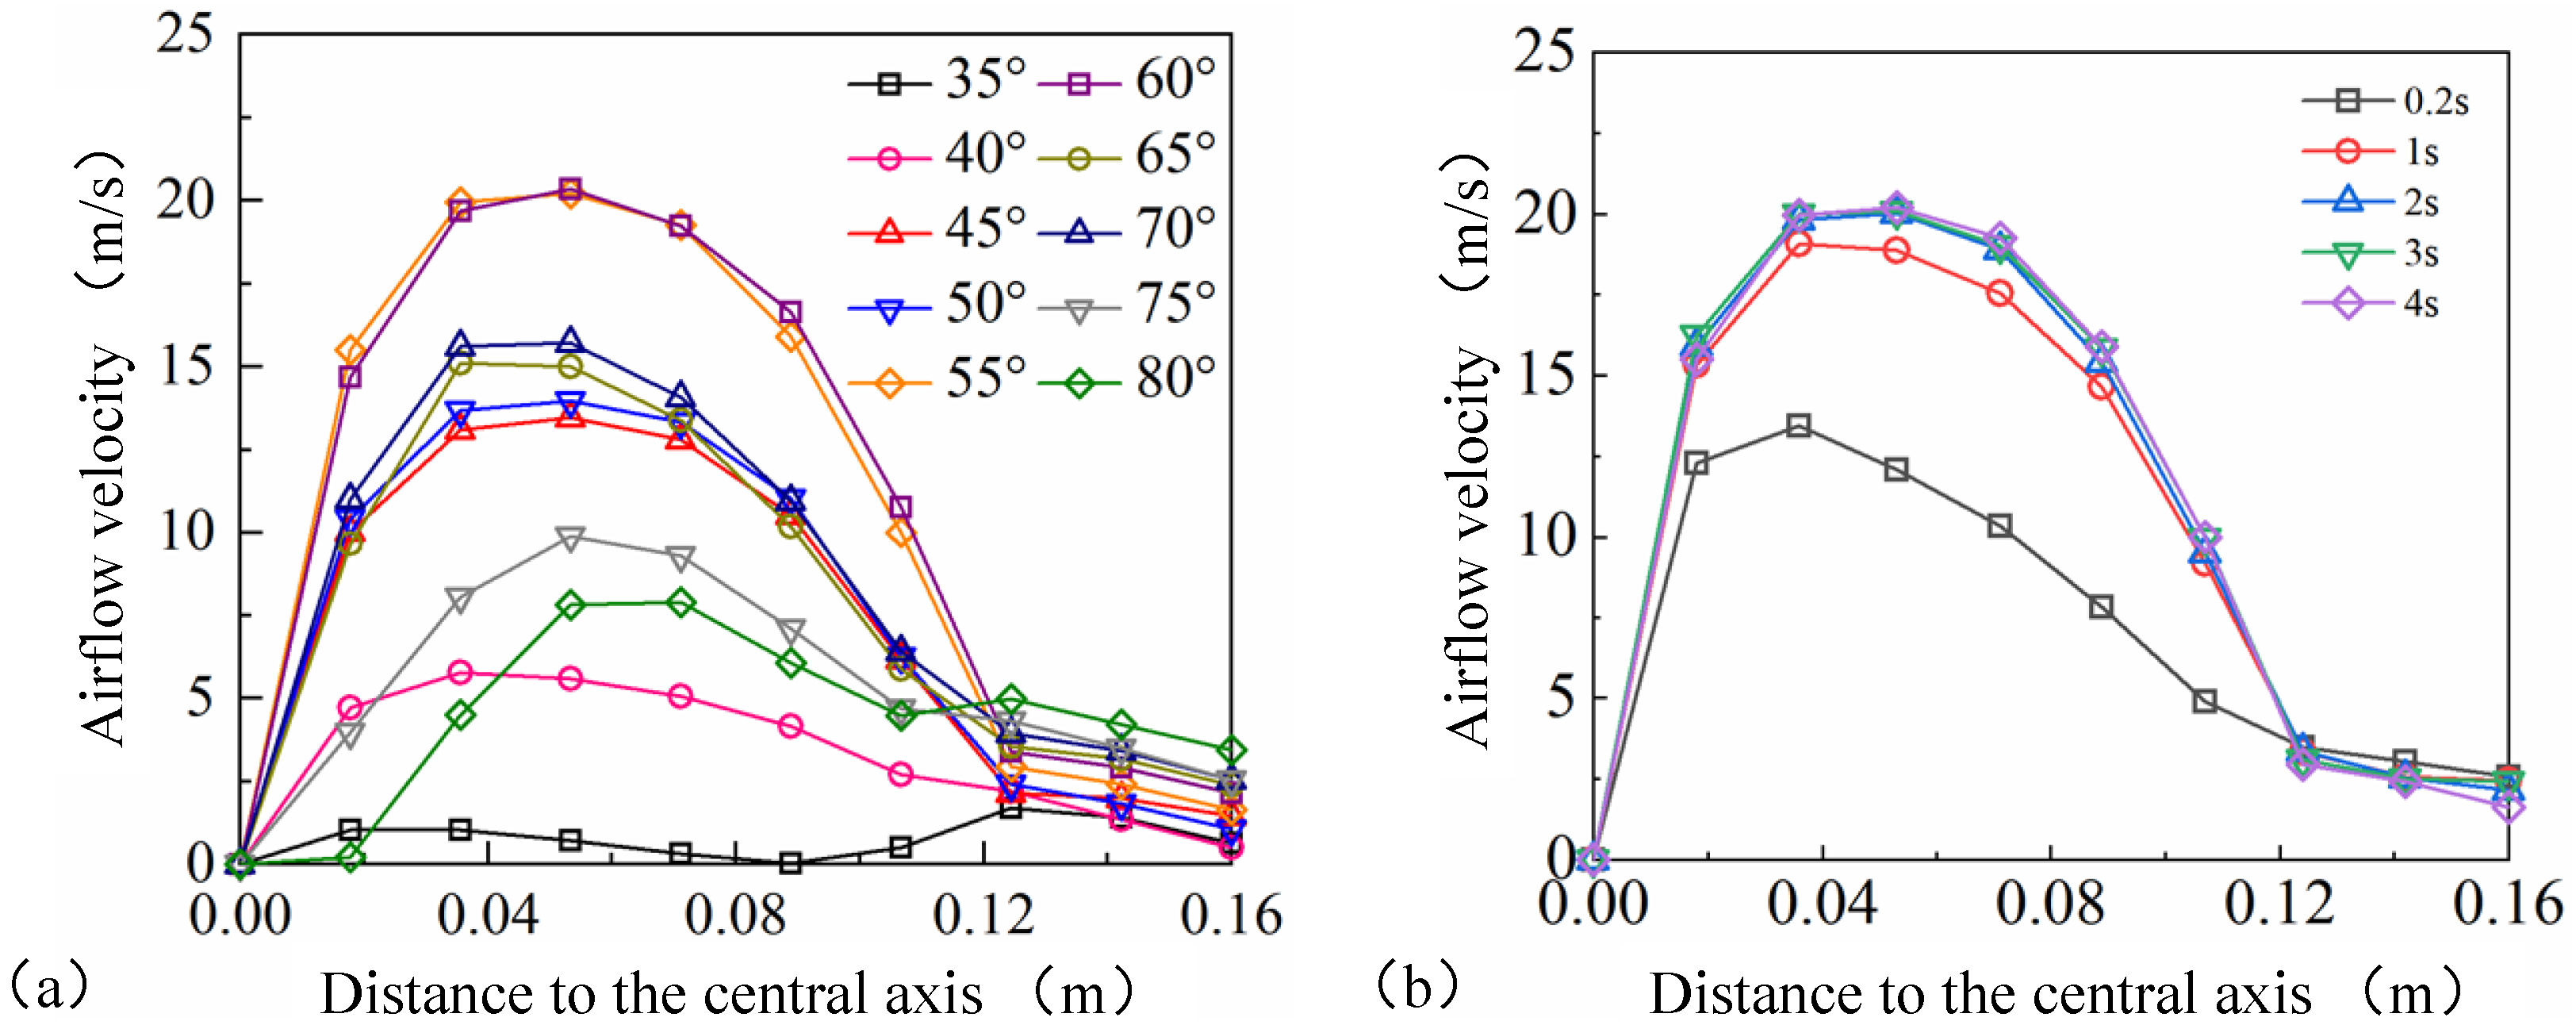
The sampling simulation results show that all 7500 particles in the particle bed have been collected before the simulation time reaches 10 s at the first-stage gas nozzle angles of 45°, 50°, 55°, and 60°. The collection rate of each angle is calculated according to the actual sampling time. The average collection rate of the 55° nozzle is 1834 s 1 , in which situation the sampling effect is the best in the simulation. In the next step, the vertical component data of the airflow velocity was extracted at each point of the central axis, and a curve was drawn to study the influence of the air blowing angle on the velocity component, which is shown in Figure 6. In Figure 6a, at the bottom center of the sampling hood, namely the zero point of the central axis, the airflow velocity is 0 since it has not entered the nozzle air blowing range. As it moves up the central axis, the airflow speed increases rapidly. When the angle of the nozzle jet gases is in a different direction, the airflow focal point is different; the maximum airflow speed point on the central axis is shown in different places in this diagram. When the first-stage nozzle angle stays at 35° and 40°, the air velocity on the center axis about 0.035 m from the bottom of the sampling hood obtains the biggest airflow velocity components. When the nozzles were set within an angle of 45° to 75°, the nozzle air velocity points are shown in the center with a distance of about 0.05 m. At the angle of 55° and 60°, maximum airflow speed can reach more than 20 m / s , which is the most beneficial to collecting the sample particles. The air velocity biggest point of the nozzle with an angle of 80° is higher, which stays at 0.07 m. As the distance from the bottom of the sample cover increases, the influence of the nozzle on the vertical component of the flow velocity is weakened, and the flow velocity decreases. At the outlet of the sampling hood, namely the central axis at 0.12 m, the flow velocity at each nozzle angle gradually approaches 0. Figure 6b shows that for a nozzle angle of 55°, the airflow velocity tends to stabilize after 1 s of the sampling task.
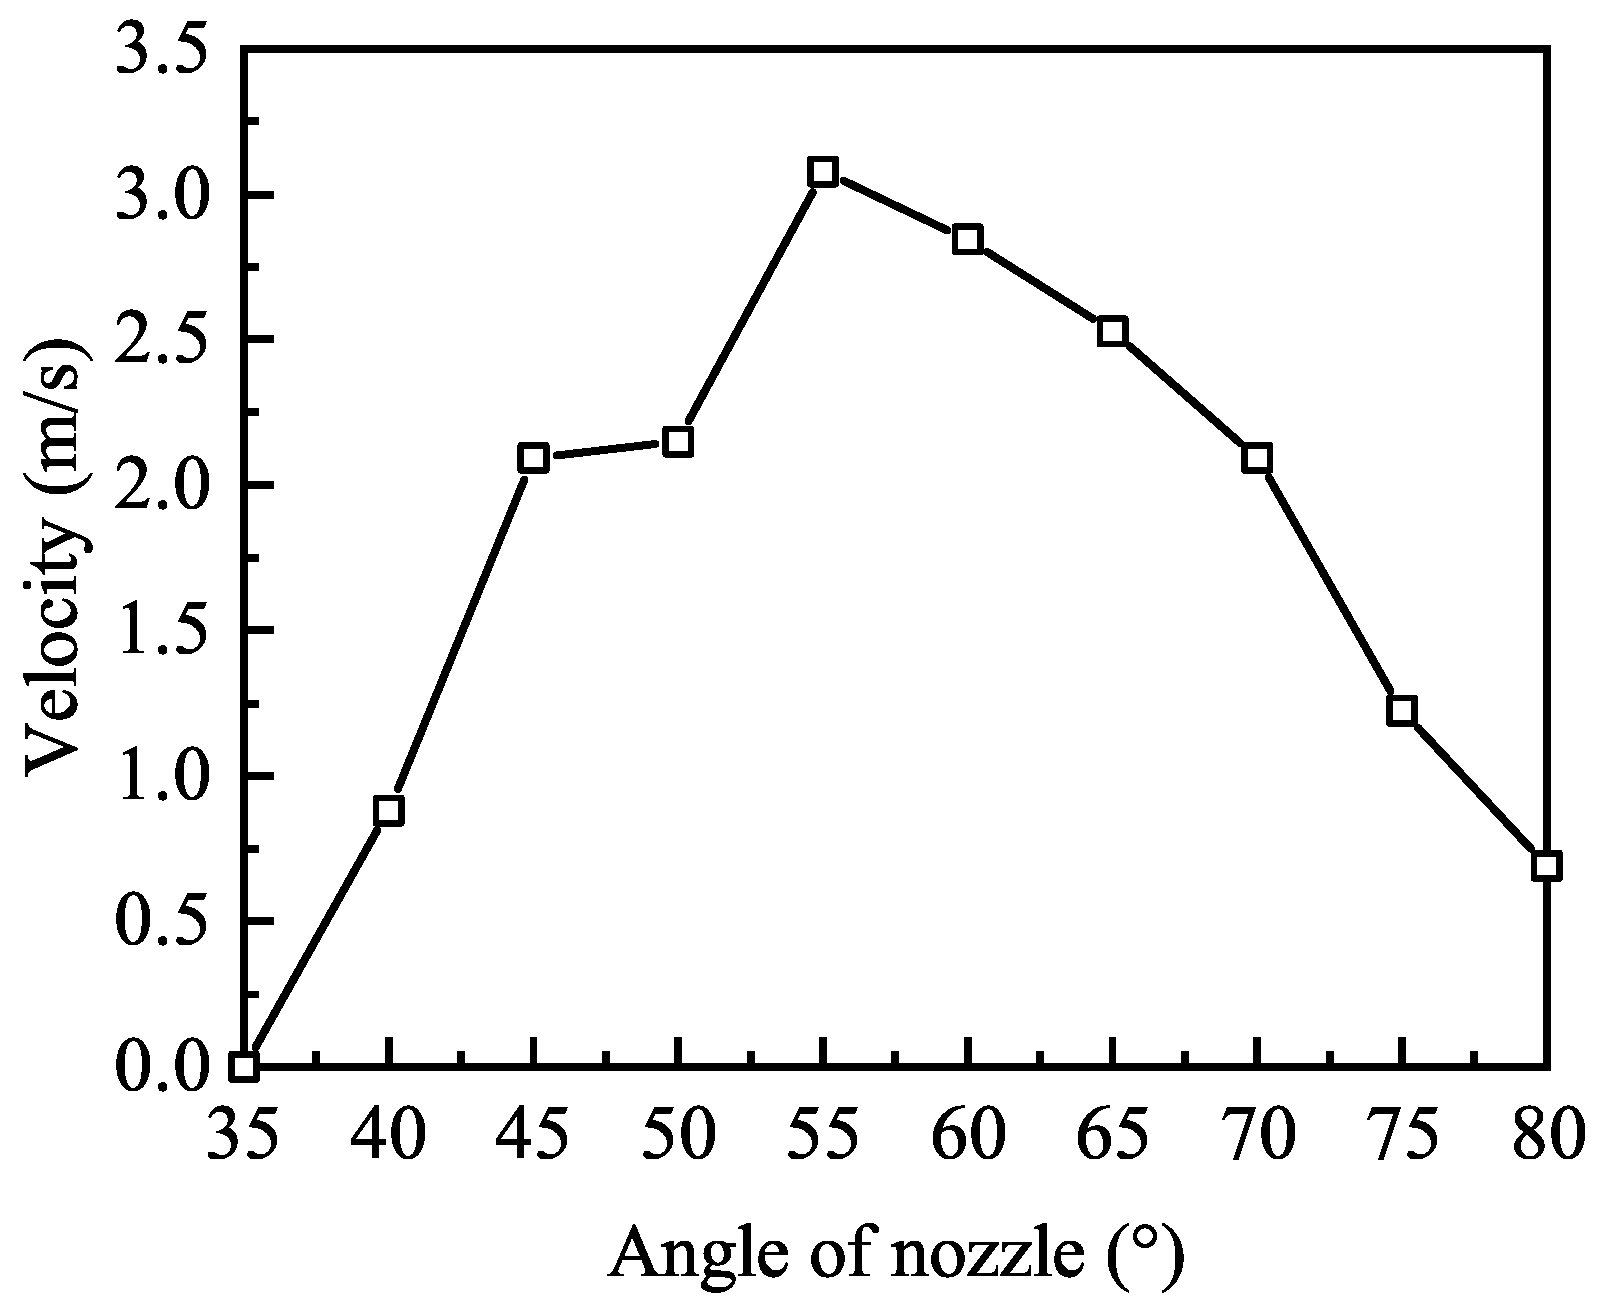
The average vertical velocity of particles along the central axis of the sampling device was extracted from the EDEM software (2025.1) to investigate the effect of the first-stage gas nozzle angle on particle motion. As illustrated in Figure 7, a clear correlation is observed between particle velocity and nozzle inlet angle. When the inlet angle lies within the range of 35°–55°, the particle velocity increases with the angle. At angles below 35°, particles are almost unable to accelerate. When the angle reaches 55°, the vertical velocity attains its maximum, with an average value of 3 m / s . Beyond this point, as the angle increases from 55° to 80°, the particle velocity decreases progressively.
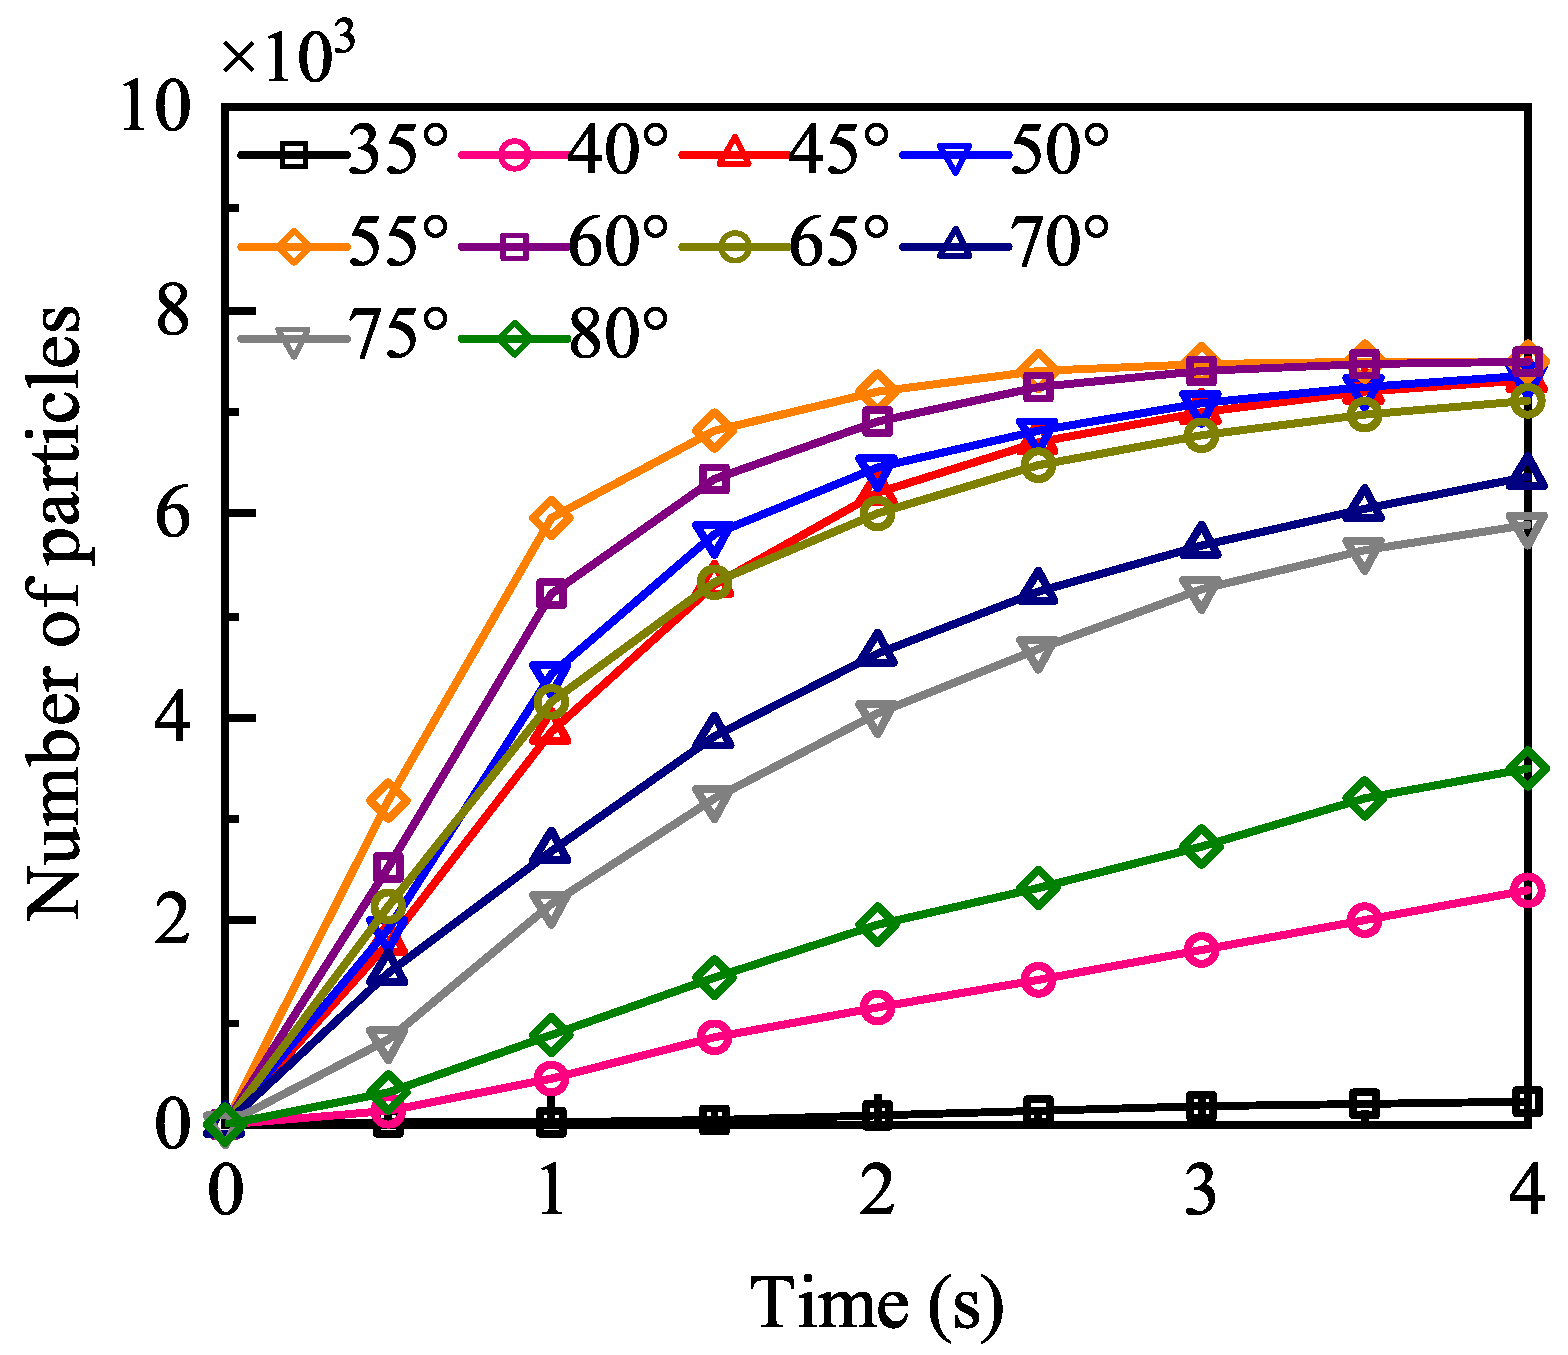
Since the first-stage gas-excitation sampling device with the angle of 55° completed the collection of all sample particles at 4.09 s, the sampling process of 4 s before each nozzle angle was selected for analysis. The comparison of the influence of the first-stage gas nozzle angle on particle collection efficiency is shown in Figure 8. The particle bed was initially affected by the airflow before 1s, and the particle collection volume increased rapidly. The collection rate of the 55° sampling device was the fastest, and 80% of the particle collection was completed at the first second. After 1 s, the collection rate of the nozzle angles of 45°, 50°, 55°, 60°, and 65° continue to decrease and the total particles collected in these sampling devices slowly approach 7500. The sampling device with 55° firstly collects all the particles. The collection rate of the nozzle angles of 35°, 40°, 70°, 75° and 80° are basically unchanged in the first 4s and the number of the particles collected is small.

3.3. Simulation Results of the Two-Stage Gas-Excitation Sampling in the Earth’s Environment

The CFD–DEM coupled simulation was established to examine the effect of the second-stage nozzle angle on delivery efficiency and the overall performance of the sample collection device. The second-stage nozzle angle was varied from 20° to 45° with an increment of 5°. This angle is defined as the inclination between the nozzle’s central axis and the pipeline wall. The inlet pressure of both the first- and second-stage nozzles was set at 0.1 MPa, while the outlet pressure of the pipeline was maintained at 0 MPa. The total simulation time was 10 s. Since the two-stage gas-excitation sampling and delivery device was able to collect nearly all particles within 10 s across all tested angles, direct comparison of collection efficiency over the full simulation was not feasible. Therefore, the simulation results at 6 s were selected for comparative analysis, as presented in Table 3. The results indicate that a second-stage nozzle angle of 40° yields the highest collection rate and provides the most effective sample delivery. To validate the rationality of this optimal angle, the simulation outcomes were further post-processed and analyzed using Fluent and EDEM software (2025.1).
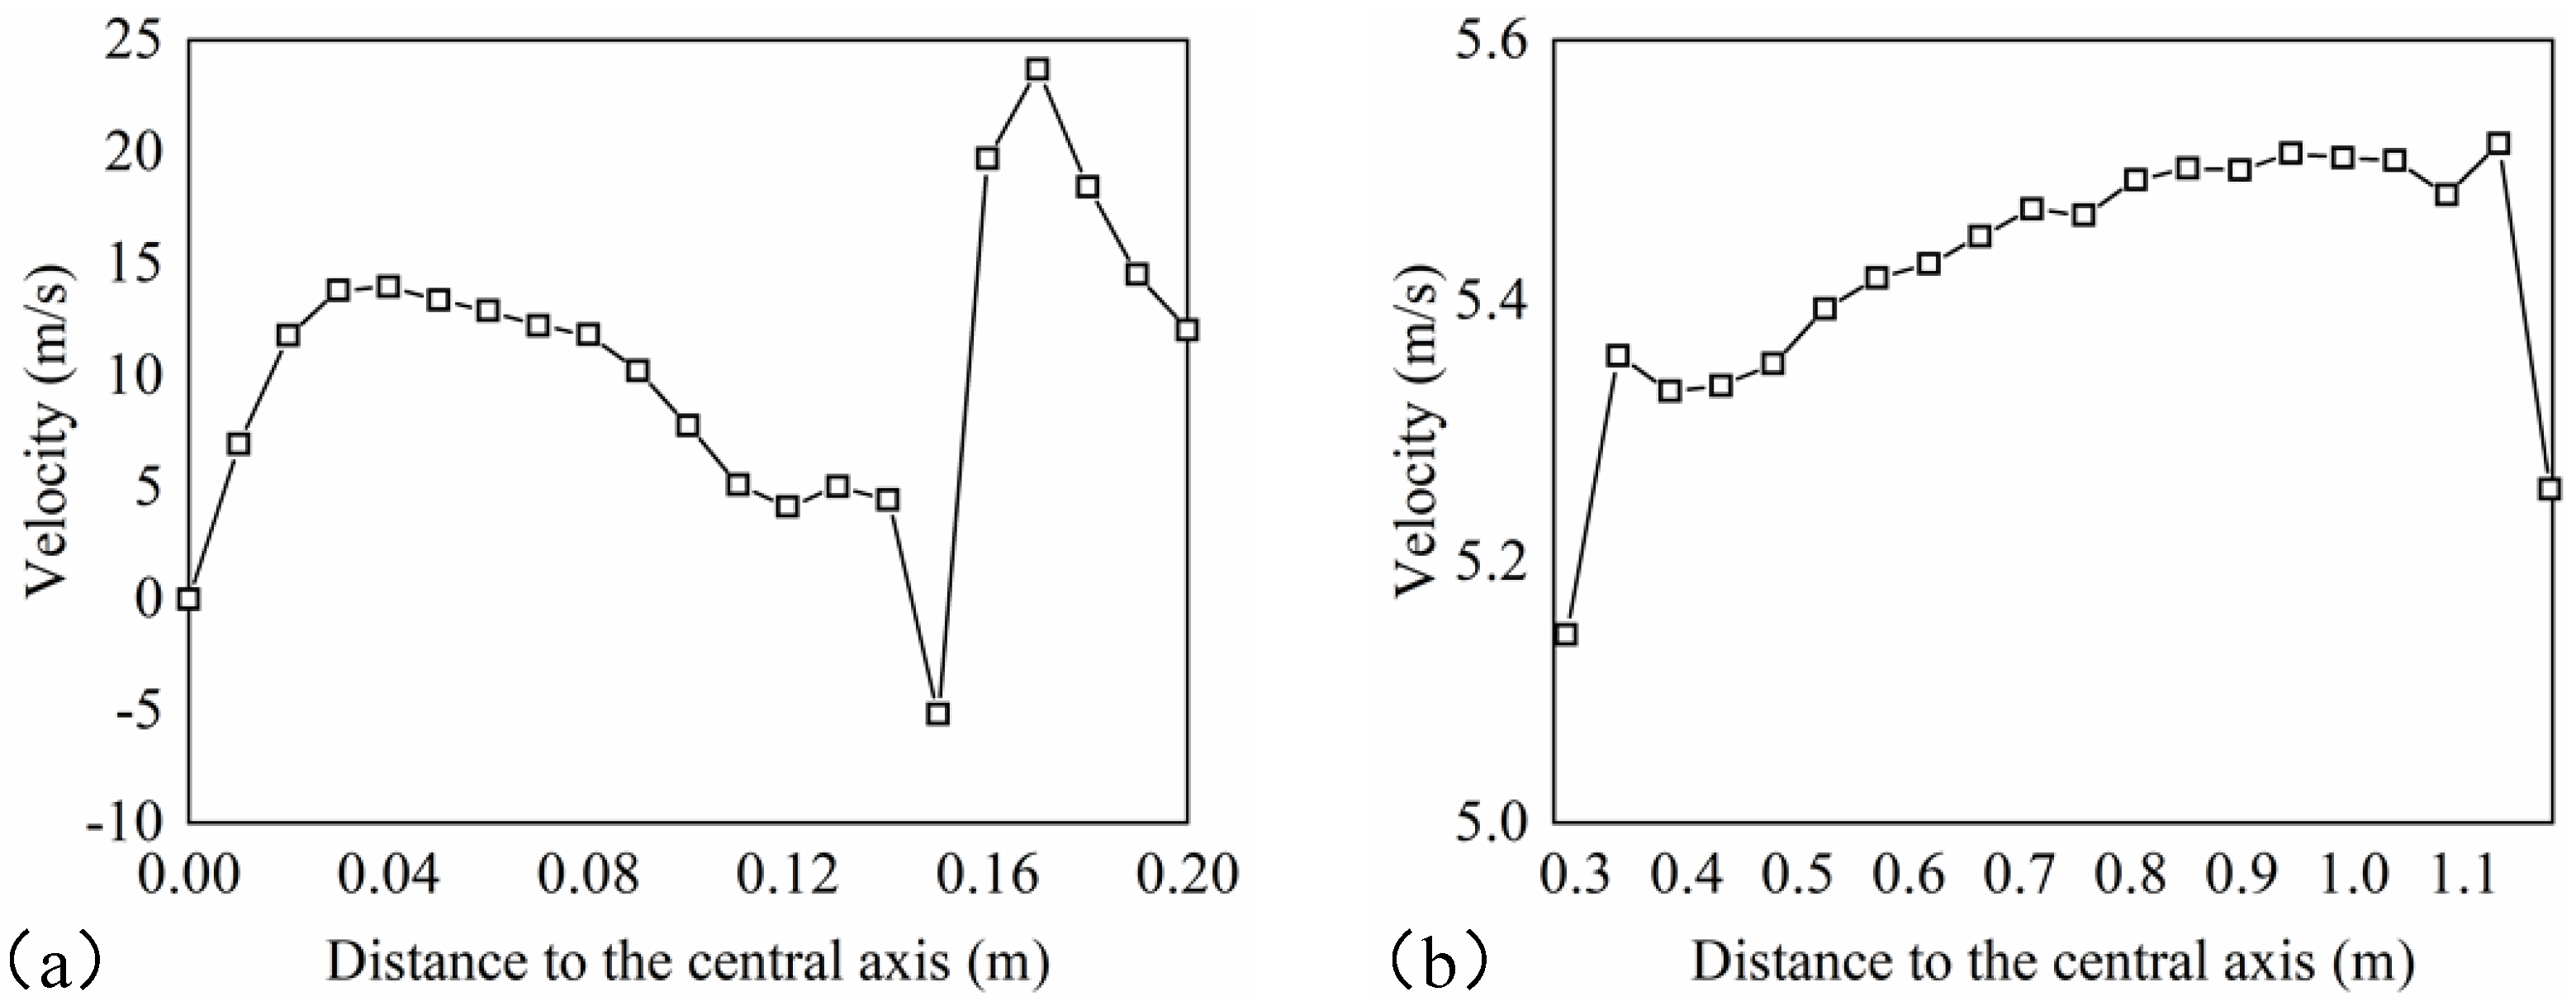
The second-stage nozzle angle of 40° was selected to analyze the vertical component of airflow velocity along the central axis of the sampling device. The section from the bottom of the sampling hood to the pipeline corner, spanning 0–1.18 m, is shown in Figure 9, with 0–0.12 m corresponding to the sampling hood. In this region, the airflow distribution and excitation effect are similar to those of the first-stage unit, both reaching a peak vertical velocity at 0.035 m. However, due to the obstructive influence of the reverse flow generated by the second-stage nozzle, the vertical velocity at each point along the hood’s central axis decreases, with the maximum velocity at 0.035 m reduced from 20 m/s (first-stage only) to 14 m/s. The subsequent 0.12–0.2 m section corresponds to the sample delivery pipeline, where the second-stage nozzle is located at 0.14 m. At 0.15 m, turbulence induces a negative velocity of –5 m/s, which impedes sample transport. Between 0.16 m and 0.2 m, the airflow converges to form a positive velocity field favorable for particle delivery, reaching a maximum of 23.7 m/s at 0.17 m. Beyond this region, in the 0.28–1.18 m section of the pipeline (excluding the corner effect), the vertical velocity component along the central axis remains nearly uniform and minimally influenced by distance from the nozzle. This ensures a stable aerodynamic force to support efficient sample delivery.
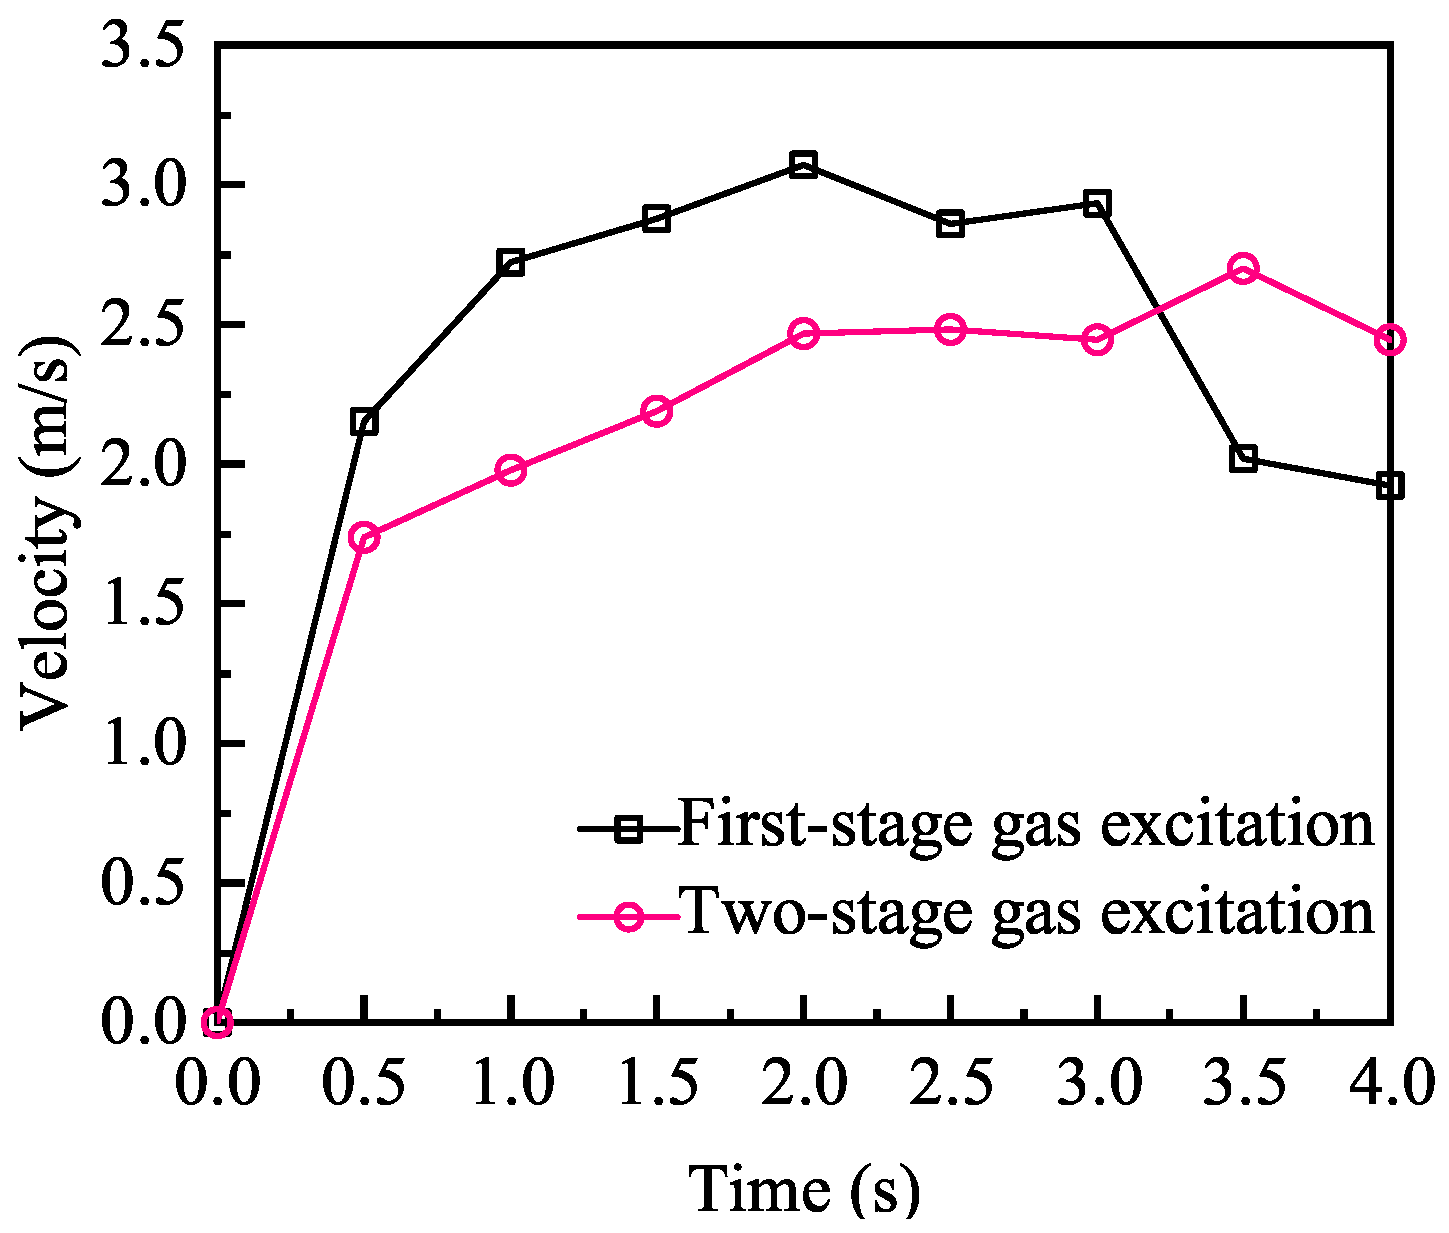
As shown in Figure 10, comparing the average velocity of particles with the first-stage gas-excitation effect and the two-stage gas-excitation combination is conducted individually, because the first-stage gas-excitation sampling device is not installed in vertical gas pipelines, the particle moving distance is short, and there is no second-stage nozzle to generate convection, so the average velocity is higher in the first 3 s. After the process of 3 s, the number of particles that remained in the sampling hood decreases; the particles collide with the walls and the number of collisions is increased while the average velocity decreases. The airflow velocity in the sample pipe of the two-stage combined gas-excitation sampling and sample delivery device is evenly distributed. The average particle velocity is relatively stable, and the particle velocity is higher than that of the first-stage gas-excitation at the later stage of the simulation.
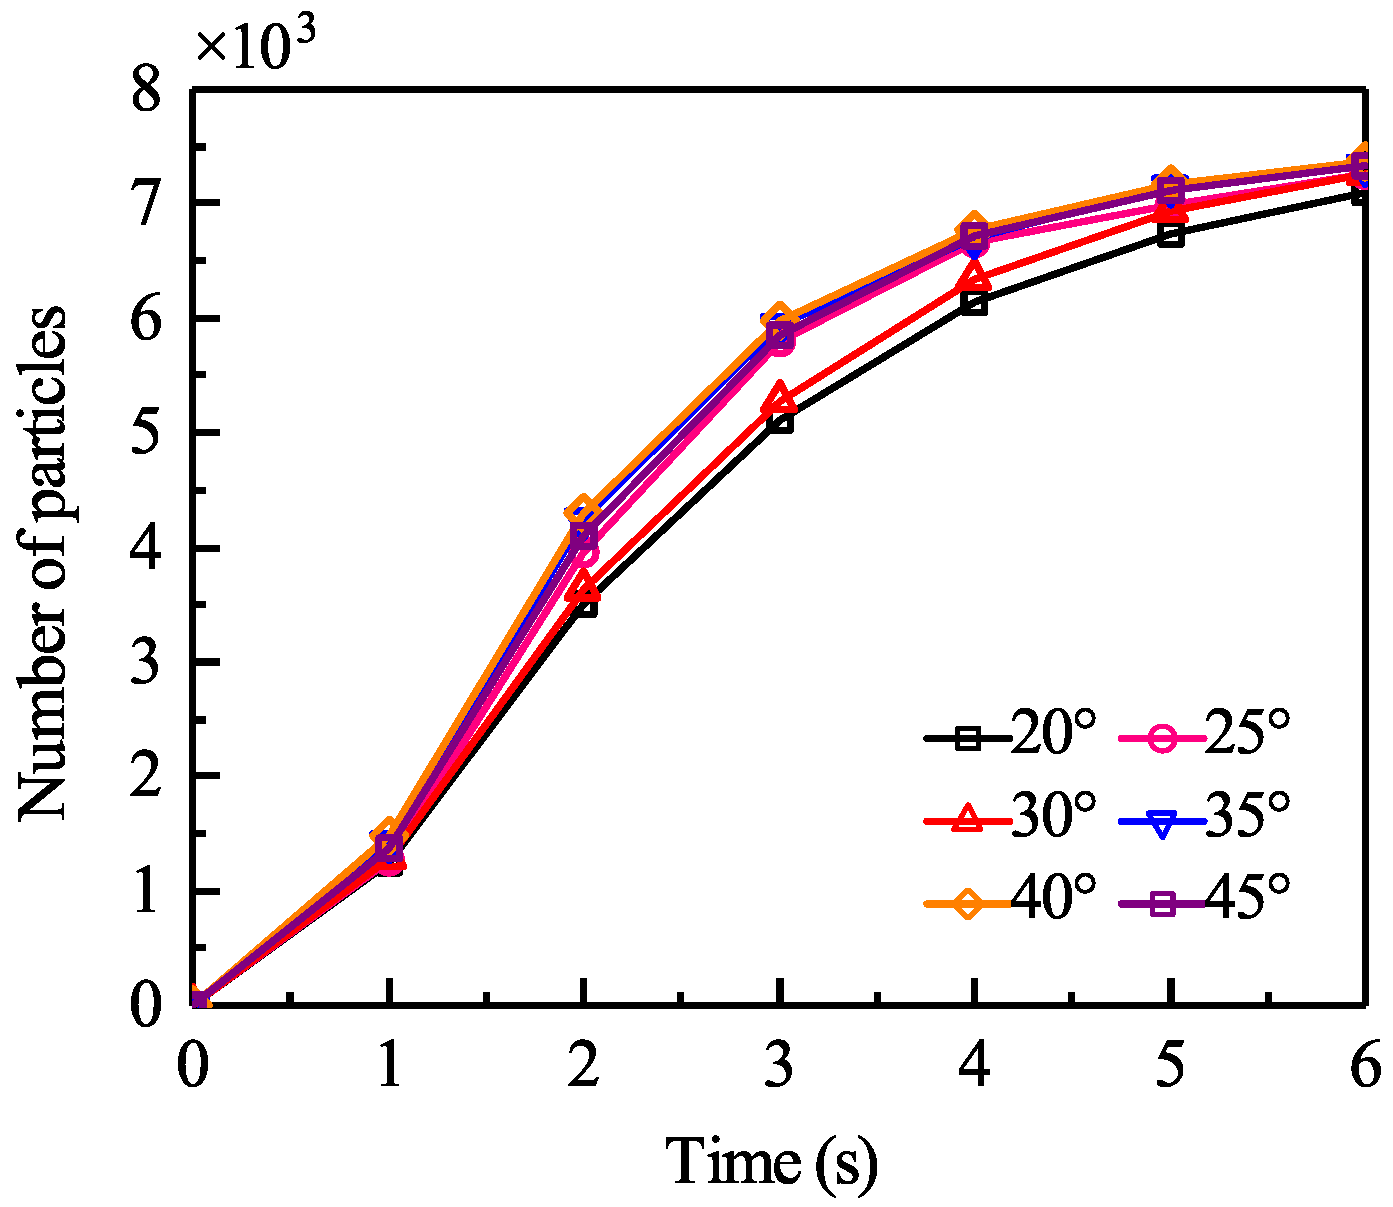
The variation in particle collection with time for different second-stage nozzle angles in the two-stage gas-excitation sampling and delivery device is presented in Figure 11. While the total number of collected particles differs only slightly among the tested angles, collection performance at 25° and 30° is relatively poor compared with the other cases, whereas the device with a nozzle angle of 40° achieves the highest particle yield. At the initial stage of the simulation, sample particles are strongly accelerated by the high-pressure gas, leading to a rapid increase in both particle velocity and collection quantity. For the 40° configuration, approximately 90% of the final collected amount is achieved within the first 4 s. Beyond this point, the accumulation rate gradually decreases, and the growth of total collected particles slows as the simulation progresses. At the end of the simulation, the device with a second-stage nozzle angle of 40° successfully collects a total of 7370 particles.

3.4. Simulation Results of the Two-Stage Gas-Excitation Sampling in the Asteroid Environment

Due to the significant differences between the vacuum and microgravity conditions on the asteroid surface and the terrestrial environment, the CFD–DEM coupled simulation method was employed to numerically model the sample collection process in the asteroid environment after determining the optimal structural parameters of the device. A two-stage combined gas-excitation sampling and delivery device was selected, with the environmental parameters set to absolute vacuum and gravitational acceleration set to one ten-thousandth of that on Earth. Prototype particles corresponding to the asteroid environment were adopted, and simulation results such as airflow velocity and collected particle number were analyzed to functionally validate and evaluate the performance of the gas-excitation-based sampling and delivery device.
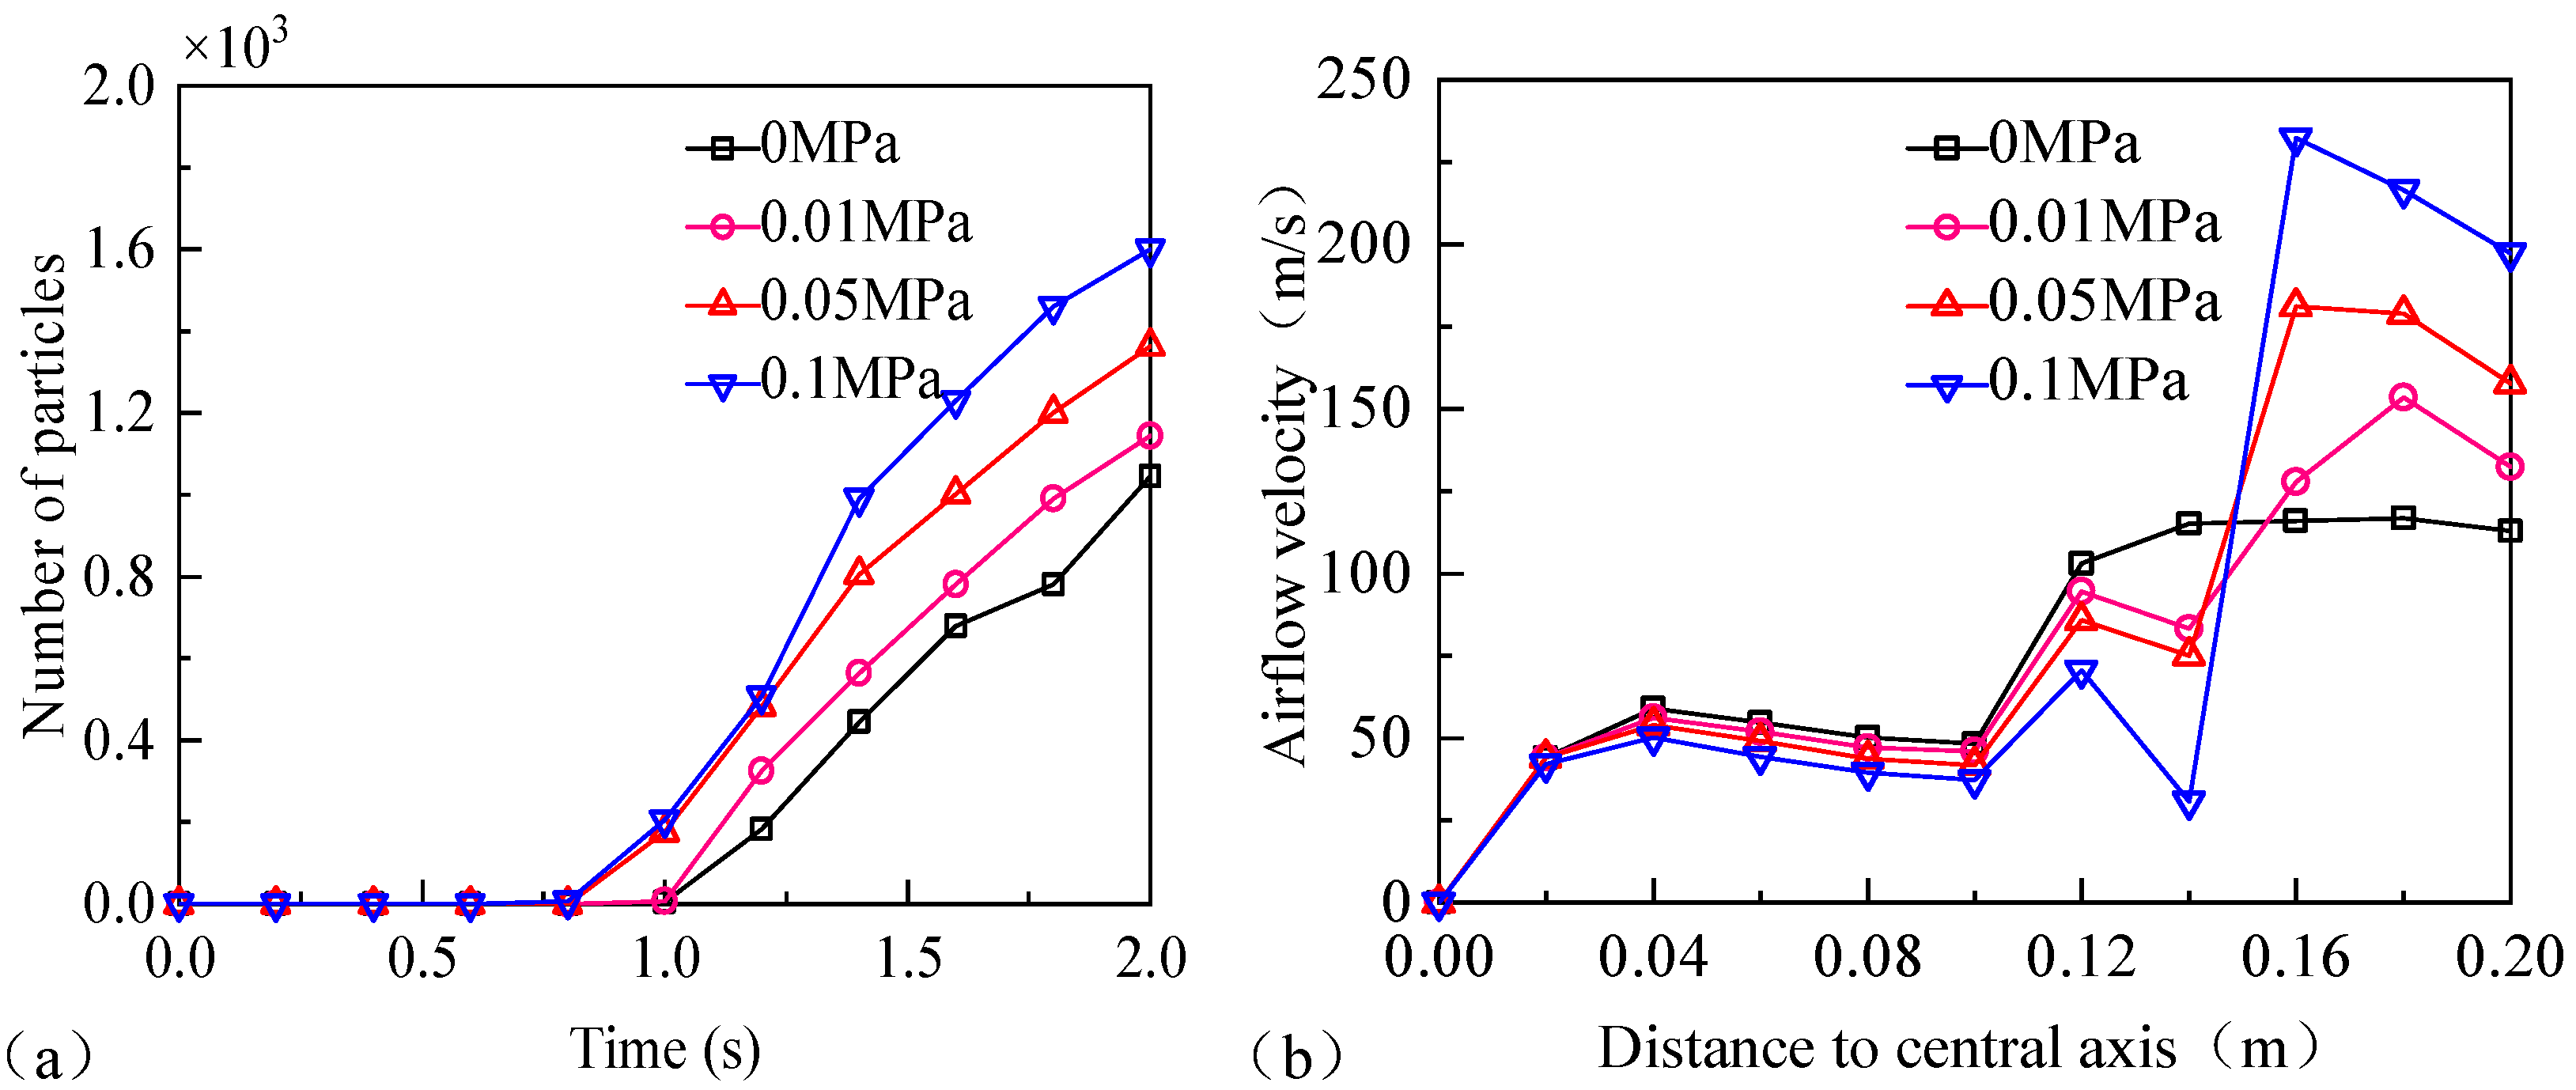
Based on the preliminary simulation results, the inlet angle of the first-stage nozzle was set to 55°, and that of the second-stage nozzle was set to 40°. The particle bed contained 7500 spherical particles with a diameter of 4 mm. According to the parameters of the Hayabusa mission asteroids, the simulation conditions under the asteroid environment were defined, as summarized in Table 4. Four simulation cases were established, with the second-stage inlet pressure set to 0 MPa, 0.01 MPa, 0.05 MPa, and 0.1 MPa, respectively. The reference pressure in Fluent was set to 0 Pa, and the coupling simulation time was set to 2 s.
The simulation results are shown in Figure 12. As illustrated in Figure 12a, under the condition that the first-stage gas pressure is set to 0.1 MPa, the second-stage gas pressure of 0.01 MPa achieves the best collection performance, with a total of 1364 particles collected within 2 s. During the period of 0–0.6 s, no particles pass through the sample delivery pipeline. In the time range of 0.8–1 s, the number of collected particles increases proportionally with the second-stage gas pressure, where 0.1 MPa enables the earliest particle collection and yields higher particle counts than the other pressure levels. After 1 s, although the second-stage nozzle accelerates the airflow, the negative airflow generated in the opposite direction hinders the sampling efficiency, and the hindrance effect becomes more pronounced with higher pressures. At 0.05 MPa and 0.1 MPa, the inhibitory effect outweighs the driving effect, resulting in a lower total number of collected particles compared to 0 MPa. This indicates that inappropriate settings of the second-stage nozzle pressure can significantly reduce collection efficiency. As shown in Figure 12b, the section from 0 m to 0.12 m corresponds to the sampling hood region. Due to the negative airflow induced by the second-stage nozzle, the airflow velocity components along the central axis at 0.01 MPa, 0.05 MPa, and 0.1 MPa are lower than those at 0 MPa. At 0.12 m, at the interface between the sampling hood and the sample pipeline, the flow cross-section decreases and the airflow velocity increases. At 0.14 m, where the second-stage nozzle is installed, turbulence occurs at 0.1 MPa, causing a sharp velocity drop. At 0.01 MPa and 0.05 MPa, the velocity decreases slightly, while at 0 MPa it remains nearly stable. In the section from 0.14 m to 0.2 m, the airflow converges to generate higher velocity, and the positive contribution of the second-stage nozzle pressure becomes evident. Within the pipeline, the velocity components increase with the gas pressure.
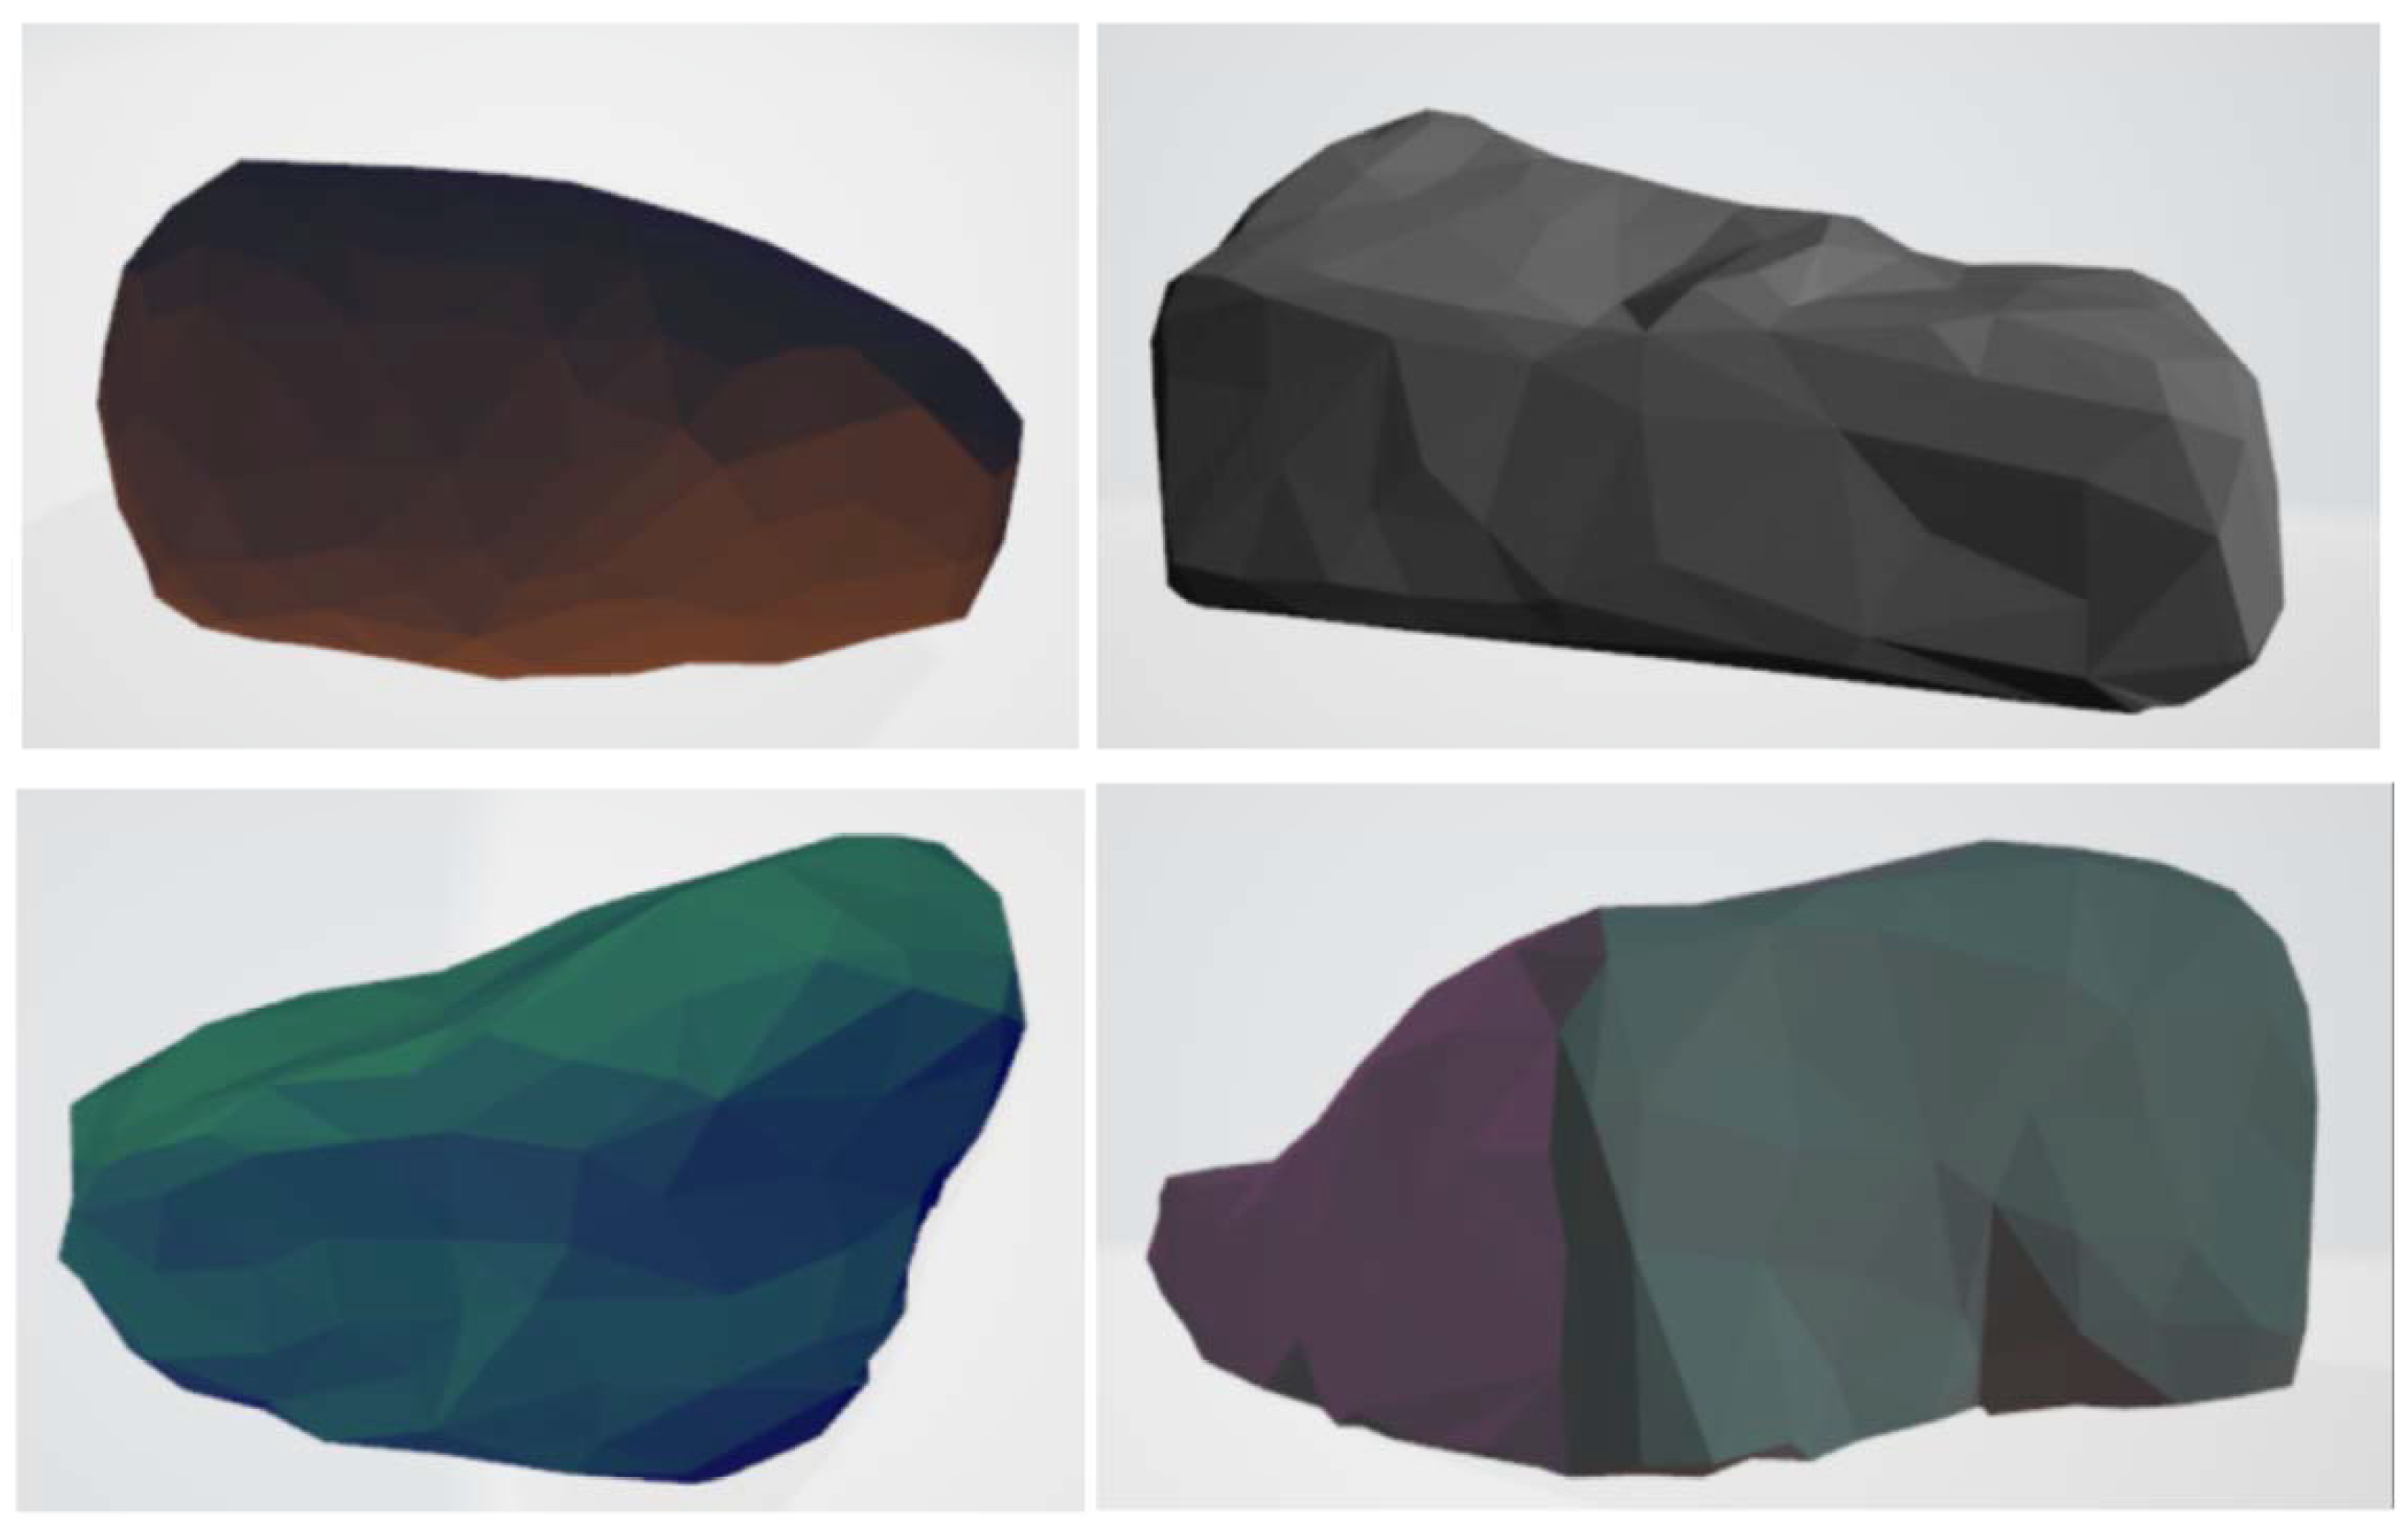
Comprehensive analysis indicates that applying a secondary gas pressure generates a small portion of negative airflow, which reduces the airflow velocity inside the sampling hood. When the pressure is excessively high, turbulence may also occur locally at the secondary nozzle, further impairing the collection efficiency. Meanwhile, the application of secondary pressure enhances the airflow velocity within the sample pipeline, which is beneficial for sample delivery. Therefore, an appropriate pressure ratio between the first-stage and second-stage inlets should be selected to ensure that the driving effect outweighs the hindrance. According to the simulation results, when the first-stage inlet pressure is set to 0.1 MPa, a second-stage pressure of 0.01 MPa is favorable for increasing the total number of collected samples. In reality, asteroid particles exhibit irregular shapes, similar to terrestrial gravel. To capture this characteristic, four types of irregular gravel models were established to simulate the actual particle geometry, as illustrated in Figure 13. The maximum dimension of each particle model was set to 4 mm to satisfy mesh calculation requirements. The model was filled with spherical particles to fit the boundaries, while other physical parameters were kept consistent with those of prototype particles under asteroid conditions.
As shown in Figure 14, an irregular particle bed was constructed in EDEM. Based on the optimized nozzle pressure and structural parameters discussed previously, CFD–DEM coupled simulations were performed on the irregular particle bed with a simulation time of 2 s, yielding a total sampling amount of 1288 particles. Overall, the above results demonstrate that the proposed gas-excitation-based sampling scheme possesses strong collection capability for asteroid regolith with varying particle sizes and shapes.
4. Experimental Results

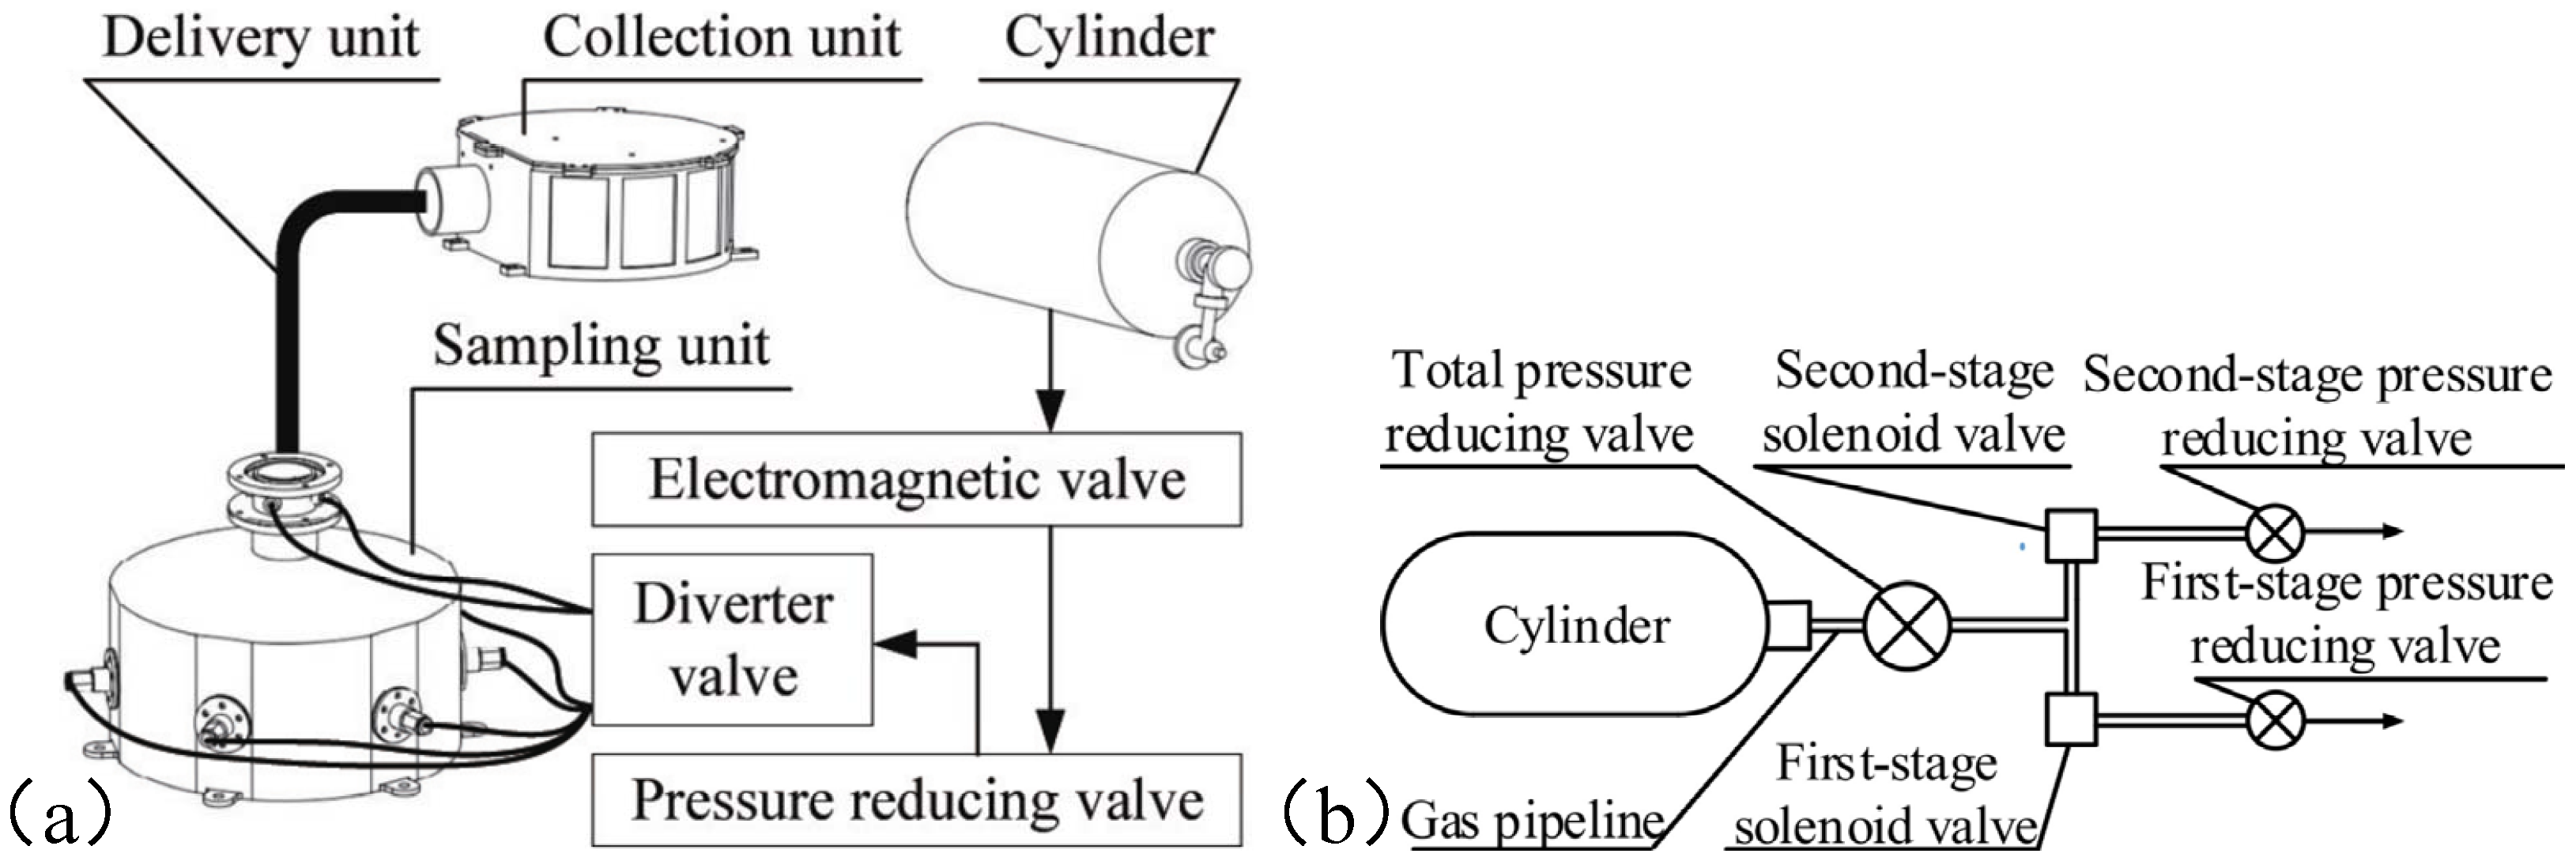
In this work, a gas-excitation-based asteroid sampling and delivery device is proposed. The overall schematic of the system is shown in Figure 15. As illustrated in Figure 15a, the device consists of four main units: a pneumatic unit, a terminal sampling unit, a sample delivery unit, and a sample collection unit. After attachment and anchoring on the asteroid surface, the probe deploys the sampling and delivery system, allowing the terminal sampling unit to fit against the surface and form a sealed space. The pneumatic unit supplies constant-pressure gas and channels it to the terminal sampling unit. Within this unit, the first- and second-stage gas-excitation nozzles are arranged. The first-stage nozzles direct high-pressure gas to sweep regolith material from the asteroid surface and transport it toward the sampling hood outlet. The second-stage nozzles then blow the particles along the transport pipeline, delivering them into the sample collection unit. Finally, the collection unit is sealed and returned to Earth with the re-entry capsule.
As illustrated in Figure 15b, the pneumatic unit comprises a gas cylinder, a pressure-reducing valve, solenoid valves, and a gas pipeline system. The high-pressure gas supplied by the cylinder is first stabilized by the main pressure-reducing valve, with an adjustable outlet pressure range of 0–0.6 MPa and a minimum increment of 0.02 MPa. Two solenoid valves independently control the release of gas to the first- and second-stage nozzles, each with a maximum pressure resistance of 1 MPa. Additional first- and second-stage pressure-reducing valves enable the independent fine-tuning of the gas pressure supplied to the nozzles, with a resolution of 0.01 MPa, ensuring precise control of the excitation process.
The sampling head of the terminal sampling unit is designed as a cylindrical hollow sampling hood with a bottom radius of 100 mm and a wall with a thickness of 3 mm. The two-stage combined gas-excitation sampling scheme installs two layers of gas nozzles in the lower part and top of the sampling hood, respectively. Through the flange connection trachea interface, six first-stage gas inlets are installed in the middle and lower part, while four second-stage gas inlets are installed on the top. The gas channel is consistent with the simulation model design. The first-stage nozzle diameter is 1 mm, while the second-stage nozzle diameter is 1.2 mm. After the gas cylinder is connected, the air pressure of the pressure-reducing valve will be adjusted to the set value, the first-stage nozzle blows up the asteroid surface particles downward and sends them to the sample cover outlet, and the second-stage nozzle continues to blow the gas upward to carry the sample particles through the sample transportation pipeline and send them to the sample container.
The sample collection unit consists of a container frame, container cover, diversion structure, flexible film, and filter screen. The sample collection unit is connected to the sample delivering pipeline. The sample particles are sent to the inlet of the sample container by a two-stage gas-excitation through the sample delivering pipeline. The gas blows away the flexible film at the inlet of the sample container, and the sample enters the container with the gas. The sample container is designed with a spiral sampling structure. After flowing into the container, the gas will normally form a vortex which is affected by the structure. With the help of a vortex, the particles which entered the container can be gathered, and the gas is discharged through the filter screen adhered to the container wall.
In order to facilitate the observation of the particle trajectory during the sampling process, transparent photosensitive resin material is used for the sampling hood and semi-transparent photosensitive resin material for the sample container. For the first-stage gas-excitation sampling device, the device is only equipped with a first-stage gas-excitation nozzle, and the outlet of the sampling hood is equipped with elbows and horizontal pipes. The sampling device is mainly composed of gas cylinders, first-level solenoid valves, and a total pressure-reducing valve, a first-stage pressure-reducing valve, and a shunt valve, and a digital pressure gauge is installed on the tracheal branch to monitor the air pressure value in real-time. The first-stage gas-excitation sampling device is shown in Figure 16.
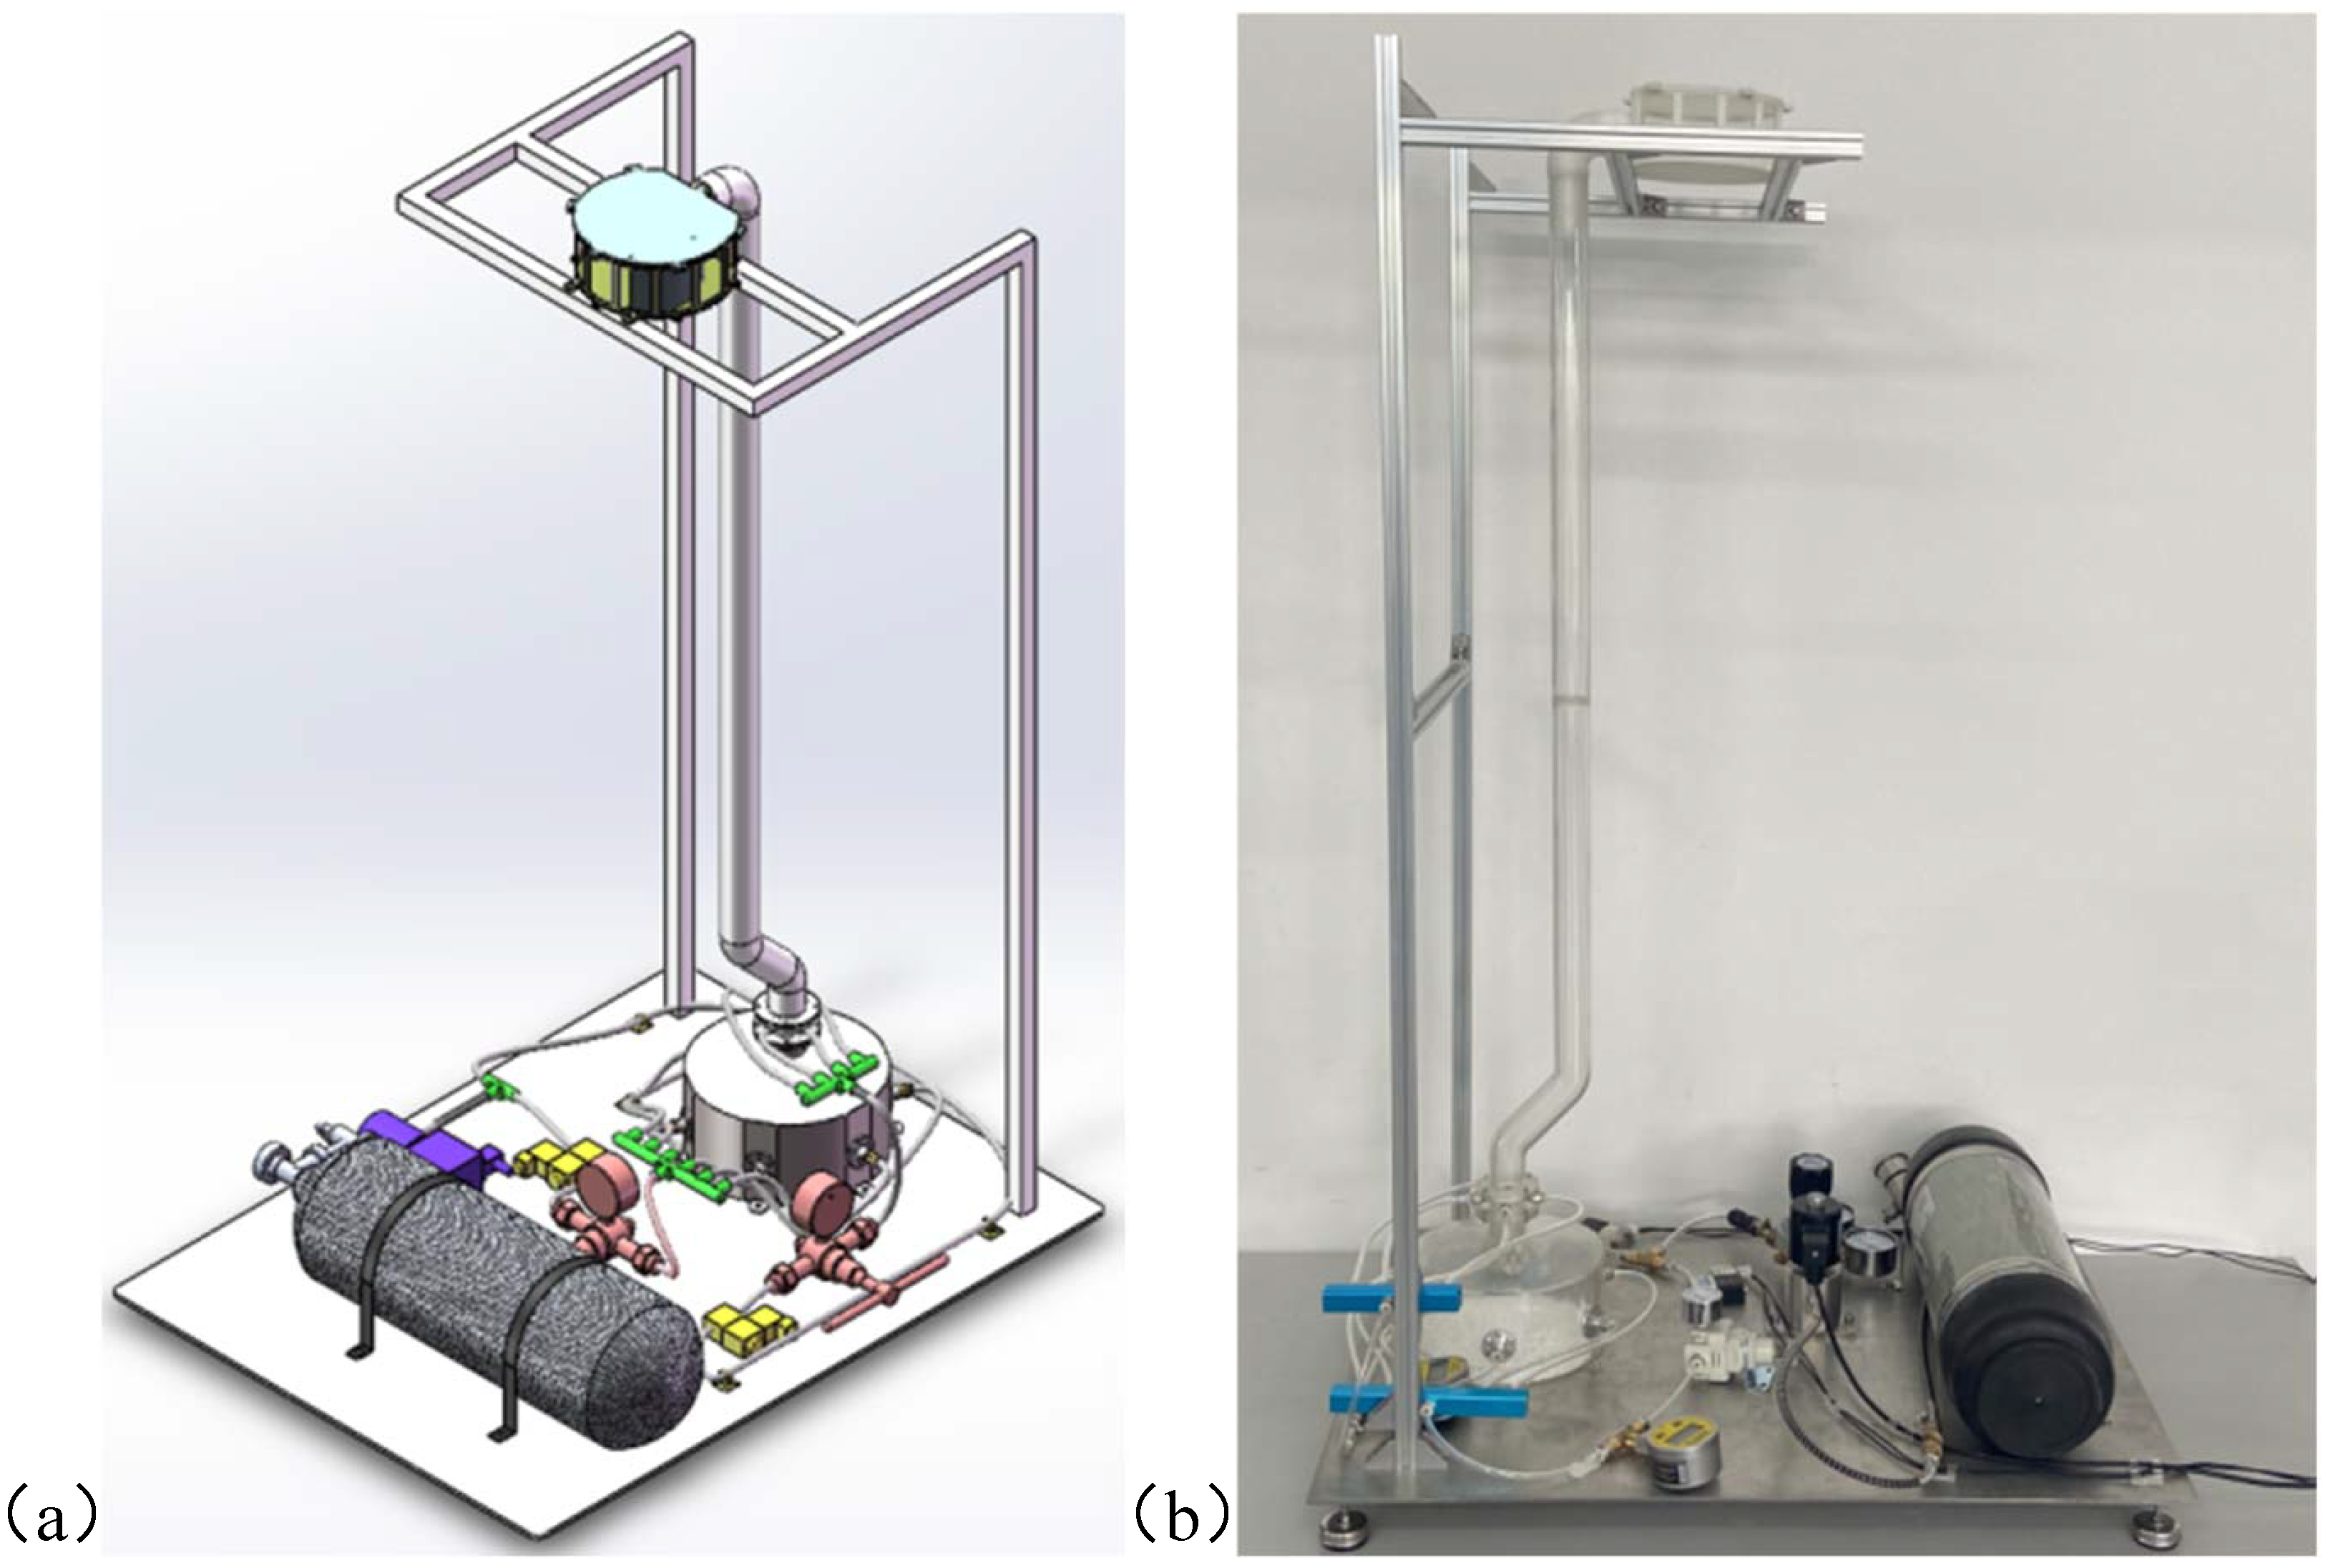
A two-stage combined gas-excitation sampling and sample delivering device was improved on the basis of the first-stage gas-excitation sampling device. Second-stage nozzles are installed at the junction between the sampling hood and the sample delivery pipeline. The first-stage nozzle blows the asteroid particles to the sampling hood outlet, and the second-stage nozzle blows high-pressure gas to continue to carry the particles up the pipeline and deliver them to the sample container. The two-stage combined gas-excitation sampling and sample delivery device is equipped with a vertical sample-conveying pipeline with a height of 880 mm, which can realize sampling and sample delivery activities. The photo of this device is shown in Figure 17.
However, the surface of the asteroid is under a microgravity environment; experiments on the ground cannot overcome the influence of the Earth’s gravity. In this study of the influence of first-stage air blowing angle on sampling efficiency, a circular foam ball with low density, uniform size and shape and a particle size of 4 mm was selected for the experiment. It is consistent with the particle discrete element model of simulation, which reduces the influence of physical quantities such as particle density, particle size, shape and contact parameters on experimental results. Based on the density and volume of granular materials, the simulated loam mass of 7500 granular deposits is about 9.19 g.
The experimental conditions for the first-stage air-blowing tests were configured to match the simulation parameters. The inlet pressure was regulated to 0.1 MPa using a pressure-reducing valve. The nozzle angle was varied from 35° to 80° in increments of 5°. A total of ten groups of experiments were conducted, with each group repeated three times to ensure the reliability and reproducibility of the results.
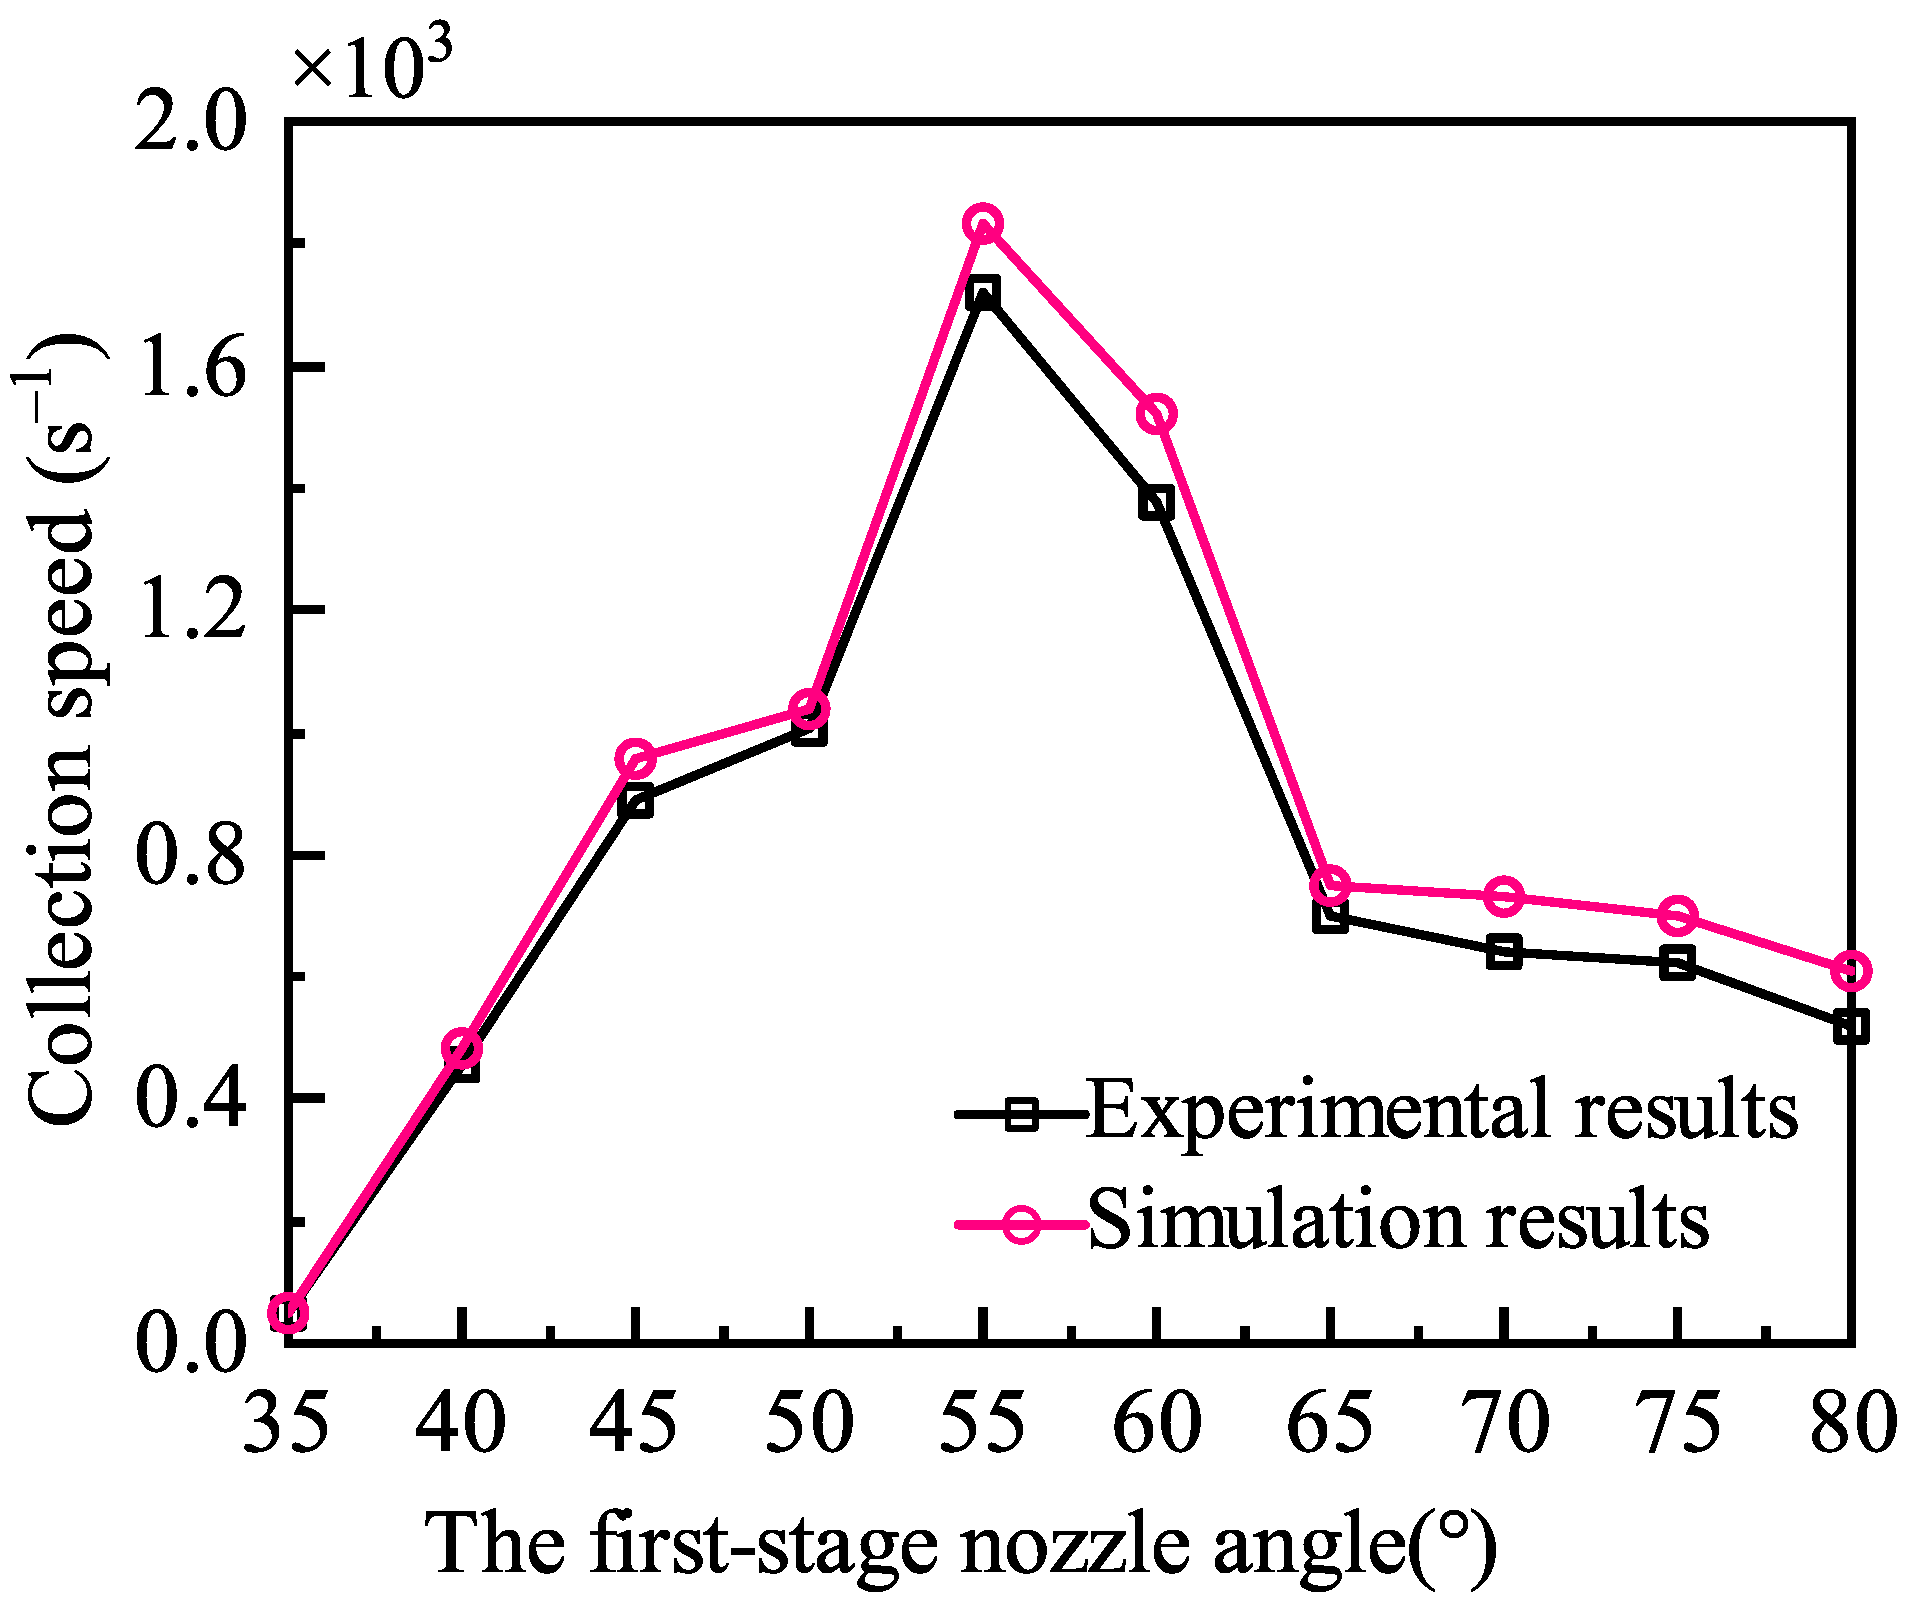
The experimental results indicate that when the inlet angle of the first-stage nozzle is set to 55°, the sampling efficiency reaches its maximum, with an average collection rate of 1718 s 1 . This optimal angle selection is consistent with the simulation results. As shown in Figure 18, the particle collection rate curve obtained from the ground experiment was compared with the simulation results. The curves reveal that the collection rate exhibits an approximately normal distribution with respect to nozzle angle. Moreover, the experimental and simulation curves demonstrate a high degree of agreement, with a maximum deviation of 10.3%. Because the simulation environment is idealized, without factors such as air leakage or electrostatic effects, the simulated particle collection amount is slightly higher than that observed in the ground experiment. Overall, the ground-based gas-excitation experiments confirm both the accuracy of the simulation results and the effectiveness of the proposed gas-excitation sampling scheme.
The experimental conditions of the two-stage combined gas-excitation sampling and sample delivery device were set as same as those of the simulation experiment: the inlet pressure was adjusted to 0.1 MPa by the pressure-reducing valve, the change range of the angle of the second-stage nozzle was set to 20°–45°, and the change gradient was set to 5°. There were six groups of experiments in total, and each group was repeated three times to ensure the reliability of the experimental results.
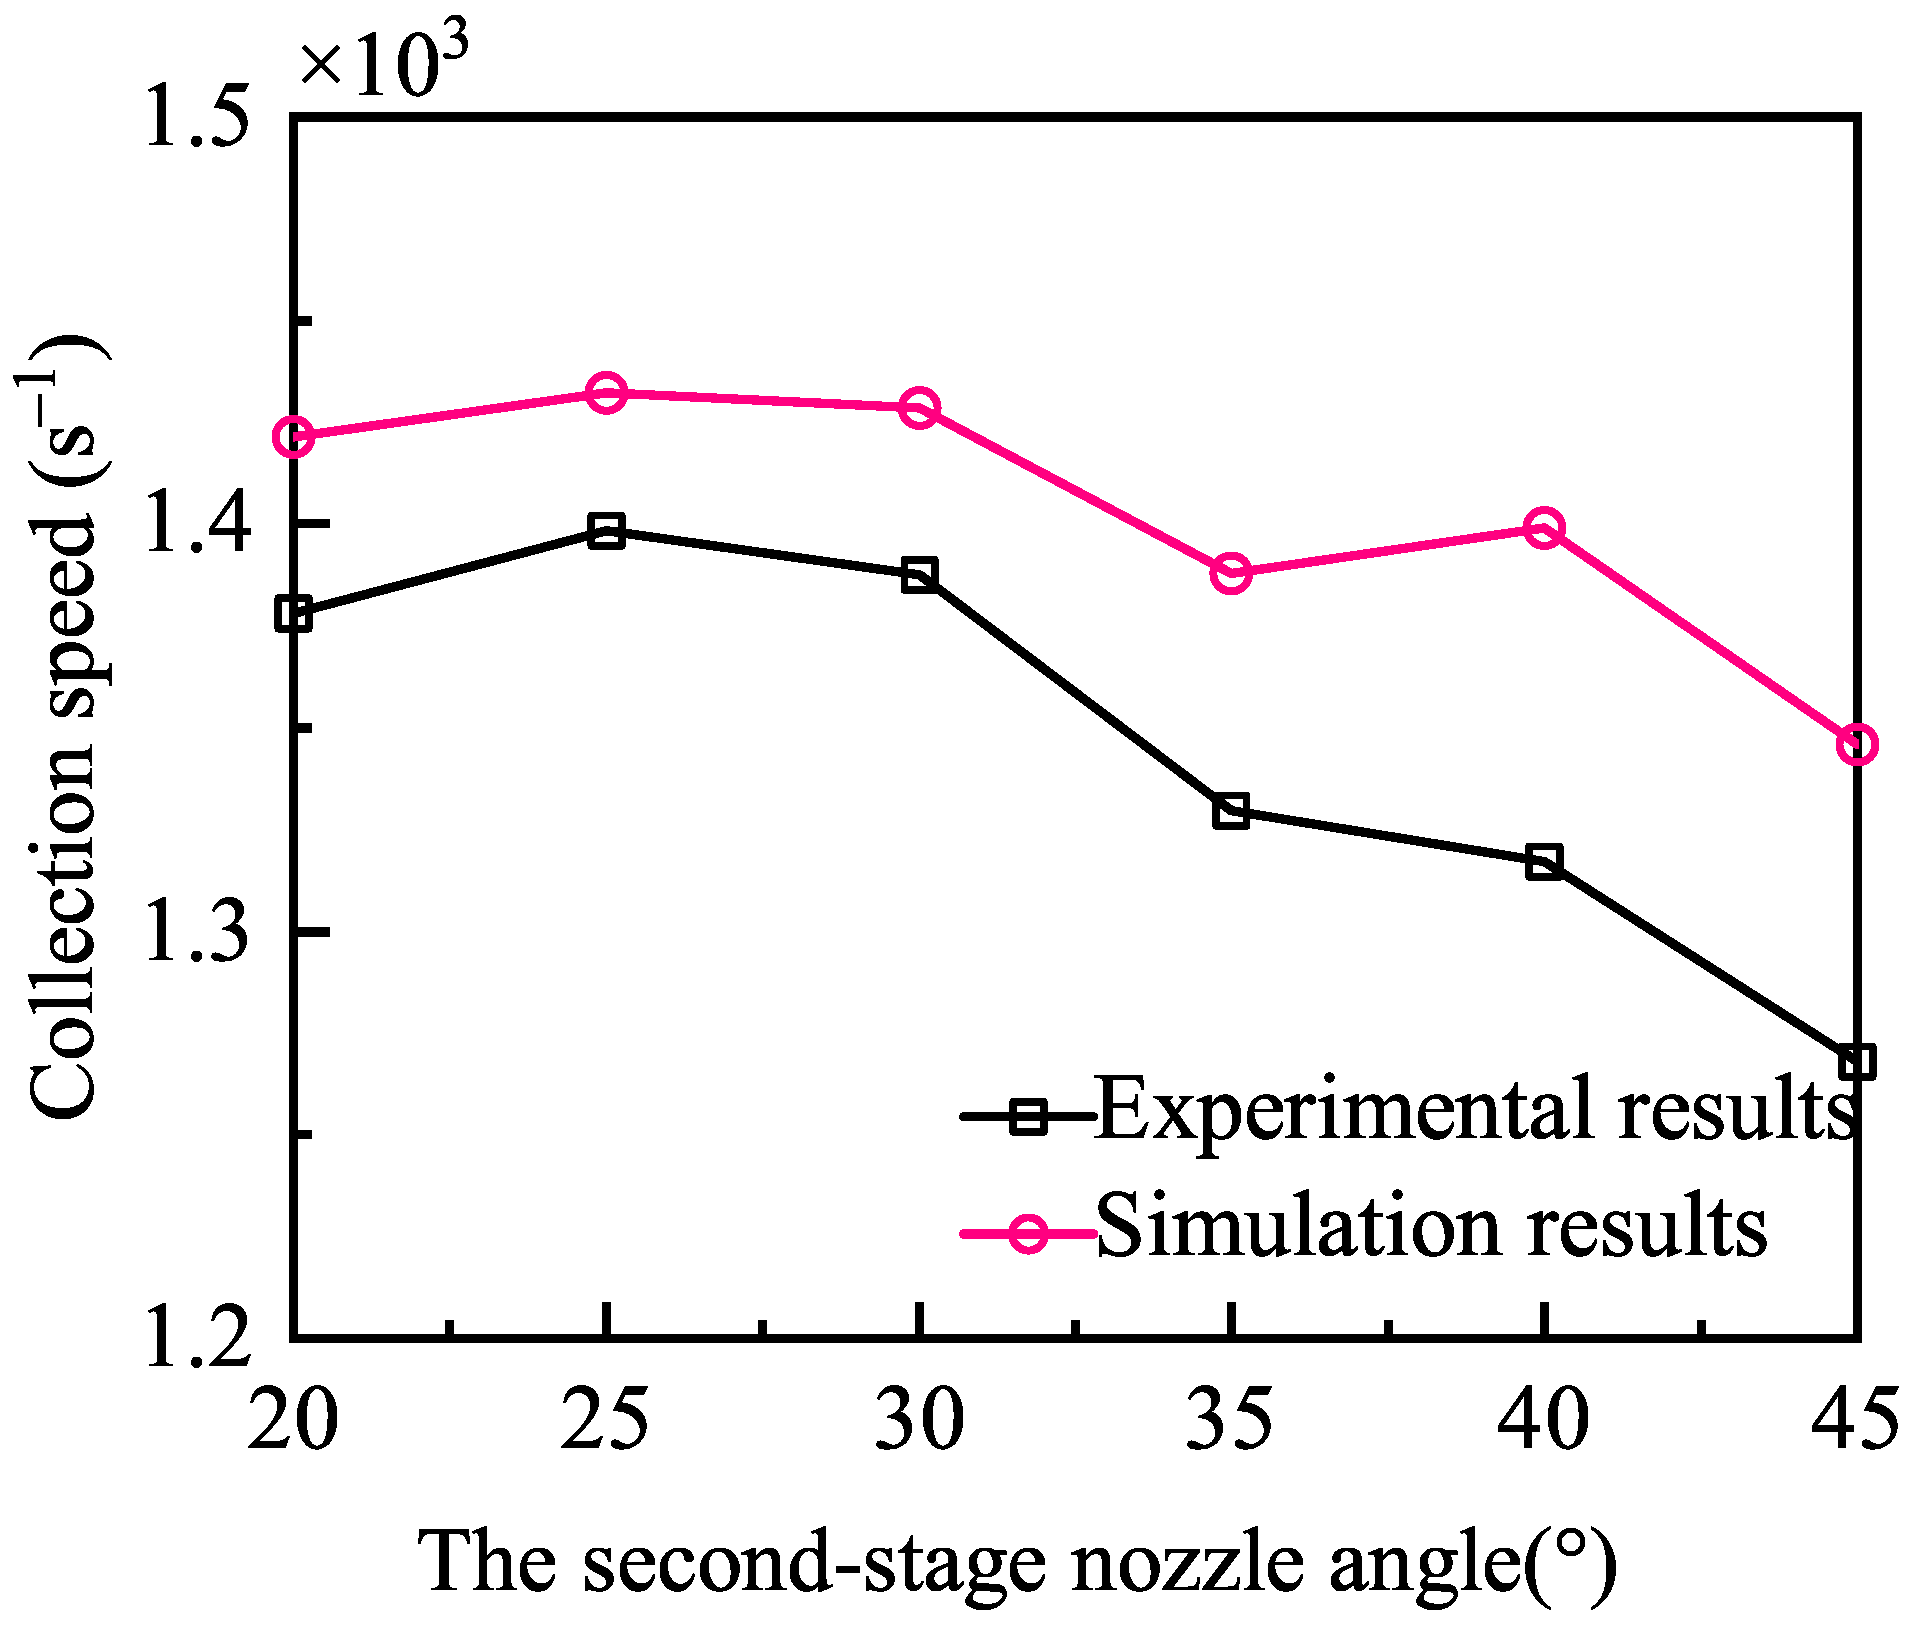
The experimental results show that when the second-stage inlet angle is set at 40°, the sampling efficiency is the highest with an average collection rate of 1399 s 1 . The optimal selection result of the second-stage nozzle angle is the same as the simulation results. As shown in Figure 19, the particle collection rate curve was drawn and compared with the simulation results. The two curves of the ground experiment and simulation experiment have a high degree of coincidence with the maximum deviation at 6.2%. It can be seen that the number of sample particles collected in the simulation experiment is slightly higher than that in the ground experiment. Compared with the first-stage gas-excitation sampling device, the collection efficiency of the two-stage gas-excitation sampling and sample delivery device is slightly reduced, but it can still efficiently complete the sample collection and transportation.

5. Conclusions

This article investigates the current research status of asteroid sampling devices both domestically and internationally. In response to the special environmental requirements of asteroid surfaces, a gas-excited integrated scheme for asteroid sampling and delivery is proposed. This scheme uses high-pressure gas to sample, transfer, and seal the weathered layer particles on the asteroid surface, simplifying the structural design and reducing the weight of the device. The high-pressure gas expands in volume under the vacuum environment, resulting in a better sample collection effect. The scheme also has the characteristics of low energy consumption, small sampling force, and repeatable sampling. Due to the uncertainty of the asteroid environment and its differences from the Earth’s environment, the CFD-EDEM coupled simulation method was used to numerically simulate the sampling and sample delivery process. The influence of the device structural parameters and asteroid physical environment on the collection effect was studied, and a sampling experimental platform was built in the ground environment for simulation comparison experiments to verify the correctness of the simulation method and the feasibility of the sampling and sample delivery scheme. Finally, a complete two-stage joint gas-excitation asteroid sampling and sample delivery integrated device was designed. This article has achieved the following research results:
(1) A CFD-DEM coupled simulation model was constructed based on the theory of continuous and discrete phase numerical simulation.
(2) Simplified models of a first stage gas-excitation sampling device and a two-stage gas-excitation sampling and delivery device were constructed separately. A pre-set CFD-DEM coupled calculation model was used to numerically simulate the sample collection process. The effects of device structure, intake angle, pressure setting, satellite soil model, and sampling and delivery efficiency were comprehensively studied. The simulation experimental results of gas streamline, pressure distribution, particle velocity, etc., were analyzed. The optimal intake angle of the sampling and sample delivery device was proposed and the device was functionally verified.
(3) The accuracy of the CFD-DEM numerical calculation model was verified by comparing the experimental results with the simulation results.
Although this article has conducted a lot of research work, there are still some shortcomings in the research due to time and computational resource limitations. In future research, we will optimize the structural parameters of the sampling and delivery device in asteroid environments based on the successfully validated CFD-DEM coupling method. We will also conduct in-depth research on the sampling effects of asteroid environments with different terrains, such as different particle sizes, adhesion forces, particle shapes, particle densities, etc.

Author Contributions

X.Y. is mainly responsible for paper writing, experimental testing, research on simulation methods, and data processing; Q.Q. is mainly responsible for guiding the entire experiment and simulation process, revising the paper, and polishing the language; D.T. and Z.D. are responsible for providing workspaces, supervising the entire work content, and offering theoretical guidance. All authors have read and agreed to the published version of the manuscript.

Funding

The project is financially supported by the National Natural Science Foundation of China (grant numbers 51975139, 51935005) and the Natural Science Foundation of Heilongjiang Province, China (grant number JJ2018ZR1258).

Data Availability Statement

The original contributions presented in this study are included in the article. Further inquiries can be directed to the corresponding author.

Conflicts of Interest

The authors declare no conflicts of interest.

References

  1. Badescu, V. Asteroids: Prospective Energy and Material Resources; Springer Science & Business Media: Berlin/Heidelberg, Germany, 2013. [Google Scholar]
  2. Bus, S.J.; Binzel, R.P. Phase II of the small main-belt asteroid spectroscopic survey: A feature-based taxonomy. Icarus 2002, 158, 146–177. [Google Scholar] [CrossRef]
  3. Kargel, J.S. Metalliferous asteroids as potential sources of precious metals. J. Geophys. Res. 1994, 99, 21129–21141. [Google Scholar] [CrossRef]
  4. Anthony, N.; Emami, M.R. Asteroid engineering: The state-of-the-art of Near-Earth Asteroids science and technology. Prog. Aerosp. Sci. 2018, 100, 1–17. [Google Scholar] [CrossRef]
  5. Storrs, A.; Weiss, B.; Zellner, B.; Burleson, W.; Sichitiu, R.; Wells, E.; Kowal, C.; Tholen, D. Imaging observations of asteroids with Hubble Space Telescope. Icarus 1999, 137, 260–268. [Google Scholar] [CrossRef]
  6. Wu, W.; Liu, W.; Qiao, D.; Jie, D. Investigation on the development of deep space exploration. Sci. China Technol. Sci. 2012, 55, 1086–1091. [Google Scholar] [CrossRef]
  7. Desai, P.N.; Mitcheltree, R.A.; Cheatwood, F.M. Sample returns missions in the coming decade. J. Astronaut. Sci. 2002, 50, 17–33. [Google Scholar] [CrossRef]
  8. Susorney, H.C.; Barnouin, O.S. The global surface roughness of 433 Eros from the NEAR laser rangefinder. Icarus 2018, 314, 299–310. [Google Scholar] [CrossRef]
  9. Kouji, O.; Jun-Ichi, W.; Mikiya, S.; Takuya, O.; Noboru, E. Spectroscopic Observation of the Re-Entry Capsule of HAYABUSA Spacecraft. In Publications of the Astronomical Society of Japan; Oxford University Press: Northamptonshire, UK, 2011; pp. 987–993. [Google Scholar]
  10. Ambler, G. Leading change: 2-planning. 2012. [Google Scholar]
  11. Minasny, B.; Hopmans, J.; Harter, T.; Eching, S.; Tuli, A.; Denton, M. Neural networks prediction of soil hydraulic functions for alluvial soils using multistep outflow data. Soil Sci. Soc. Am. J. 2004, 68, 417–429. [Google Scholar] [CrossRef]
  12. Di Lizia, P.; Bernelli-Zazzera, F.; Ercoli-Finzi, A.; Mottola, S.; Fantinati, C.; Remetean, E.; Dolives, B. Planning and implementation of the on-comet operations of the instrument SD2 onboard the lander Philae of Rosetta mission. Acta Astronaut. 2016, 125, 183–195. [Google Scholar] [CrossRef]
  13. Liu, L.; Liu, Y.; Cao, J.; Hu, S.; Tang, G.; Xie, J. CHANG’E-2 lunar escape maneuvers to the Sun–Earth L2 libration point mission. Acta Astronaut. 2014, 93, 390–399. [Google Scholar] [CrossRef]
  14. Yang, F.; Xu, Y.; Chan, K.L.; Zhang, X.; Hu, G.; Li, Y. Study of Chang’E-2 microwave radiometer data in the lunar polar region. Adv. Astron. 2019, 2019. [Google Scholar] [CrossRef]
  15. Morota, T.; Sugita, S.; Cho, Y.; Kanamaru, M.; Tatsumi, E.; Sakatani, N.; Honda, R.; Hirata, N.; Kikuchi, H.; Yamada, M.; et al. Sample collection from asteroid (162173) Ryugu by Hayabusa2: Implications for surface evolution. Science 2020, 368, 654–659. [Google Scholar] [CrossRef] [PubMed]
  16. Tsuda, Y.; Saiki, T.; Terui, F.; Nakazawa, S.; Yoshikawa, M.; Watanabe, S.i.; Team, H.P. Hayabusa2 mission status: Landing, roving and cratering on asteroid Ryugu. Acta Astronaut. 2020, 171, 42–54. [Google Scholar] [CrossRef]
  17. Yabuta, H. Arrival, touchdown and sequel to the voyage of Hayabusa2. Nat. Astron. 2019, 3, 287–289. [Google Scholar] [CrossRef]
  18. Sawada, H.; Okazaki, R.; Tachibana, S.; Sakamoto, K.; Takano, Y.; Okamoto, C.; Yano, H.; Miura, Y.; Abe, M.; Hasegawa, S.; et al. Hayabusa2 sampler: Collection of asteroidal surface material. Space Sci. Rev. 2017, 208, 81–106. [Google Scholar] [CrossRef]
  19. Bierhaus, E.; Clark, B.; Harris, J.; Payne, K.; Dubisher, R.; Wurts, D.; Hund, R.; Kuhns, R.; Linn, T.; Wood, J.; et al. The OSIRIS-REx spacecraft and the touch-and-go sample acquisition mechanism (TAGSAM). Space Sci. Rev. 2018, 214, 107. [Google Scholar] [CrossRef]
  20. Lauretta, D.S. An Overview of the OSIRIS-REx Asteroid Sample Return Mission. LPI 2012. [Google Scholar]
  21. Marchi, S.; Vokrouhlick, D.; Nesvorn, D.; Bottke, W.F.; Urech, J.; Levison, H.F. A Pre-flyby View on the Origin of Asteroid Donaldjohanson, a Target of the NASA Lucy Mission; IOP Publishing Ltd.: Bristol, UK, 2025. [Google Scholar]
  22. Goebel, D.M.; Oh, D. Mission to a Metal World: In August, NASA will Launch a Probe to Study a Strange Metallic Asteroid Called Psyche. IEEE Spectr. 2022, 59, 24–29. [Google Scholar] [CrossRef]
  23. Li, W.Z.; Wei, Y.; Li, J.Y.; Yang, W. A promising view to the Moon: Anticipations for Tianwen-2 samples returned from Kamo’oalewa. Earth Planet. Phys. 2025, 9, 782. [Google Scholar] [CrossRef]
  24. Chesley, S.R.; Farnocchia, D.; Nolan, M.C.; Vokrouhlickỳ, D.; Chodas, P.W.; Milani, A.; Spoto, F.; Rozitis, B.; Benner, L.A.; Bottke, W.F.; et al. Orbit and bulk density of the OSIRIS-REx target Asteroid (101955) Bennu. Icarus 2014, 235, 5–22. [Google Scholar] [CrossRef]
  25. Schwartz, S.R.; Michel, P.; Richardson, D.C.; Yano, H. Low-speed impact simulations into regolith in support of asteroid sampling mechanism design I: Comparison with 1-g experiments. Planet. Space Sci. 2014, 103, 174–183. [Google Scholar] [CrossRef]
  26. Gartrelle, G.M.; Hardersen, P.S.; Izawa, M.R.M.; Nowinski, M.C. Illuminating the dark side of the asteroid population: Visible near-infrared (0.7–2.45 µm) surface mineralogy modeling of D-type asteroids using Shkuratov theory. Icarus Int. J. Sol. Syst. Stud. 2021, 354, 114043. [Google Scholar] [CrossRef]
  27. Artemieva, N.; Shuvalov, V. Numerical simulation of high-velocity impact ejecta following falls of comets and asteroids onto the Moon. Sol. Syst. Res. 2008, 42, 329–334. [Google Scholar] [CrossRef]
  28. Carry, B. Density of asteroids. Planet. Space Sci. 2012, 73, 98–118. [Google Scholar] [CrossRef]
  29. Briani, G.; Gounelle, M.; BOUROT-DENISE, M.; Zolensky, M.E. Xenoliths and microxenoliths in H chondrites: Sampling the zodiacal cloud in the asteroid Main Belt. Meteorit. Planet. Sci. 2012, 47, 880–902. [Google Scholar] [CrossRef]
  30. Zhou, F.; Hu, S.; Liu, Y.; Liu, C.; Xia, T. CFD–DEM simulation of the pneumatic conveying of fine particles through a horizontal slit. Particuology 2014, 16, 196–205. [Google Scholar] [CrossRef]
  31. Sandford, S.A.; Aleon, J.; Alexander, C.M.O.; Araki, T.; Bajt, S.; Baratta, G.A.; Borg, J.; Bradley, J.P.; Brownlee, D.E.; Brucato, J.R. Organics Captured from Comet 81P/Wild 2 by the Stardust Spacecraft. Science 2006, 314, 1720–1724. [Google Scholar] [CrossRef]
  32. Synylo, K.; Krupko, A.; Zaporozhets, O.; Makarenko, R. CFD simulation of exhaust gases jet from aircraft engine. Energy 2020, 213, 118610. [Google Scholar] [CrossRef]
  33. Horvath, J.S. Expanded Polystyrene (EPS) geofoam: An introduction to material behavior. Geotext. Geomembr. 1994, 13, 263–280. [Google Scholar] [CrossRef]
Figure 1. Collectivity scheme of the asteroid sampling device. (a) Model of the asteroid sampling device. (b) Schematic of the asteroid sampling device.
Machines 13 00958 g001
Figure 2. Experiment on the determination of the EPS material recovery coefficient. (a) Initial position of the foam ball before collision, (b) the bounce height of the foam ball after collision with the wall material, (c) the bounce height of the foam ball after collision with the EPS material.
Machines 13 00958 g002
Figure 3. Virtual calibration experiment of the EPS foam ball. (a) Initial state of the calibration experiment, (b) stacking angle with a static friction coefficient of 0.5 and a rolling friction coefficient of 0.03 between particles, (c) actual foam ball particle stacking angle.
Machines 13 00958 g003
Figure 4. CFD-DEM gas–solid two-phase flow coupling model of the first-stage gas-excitation unit. (a) Structured mesh of the gas-excitation unit, (b) state of the gas-excitation unit at the initial moment.
Machines 13 00958 g004
Figure 5. Simulation model of the two-stage combined gas-excitation sampling and sample delivery device. (a) Air blowing device structured mesh, (b) state of the air blowing device at the initial moment.
Machines 13 00958 g005
Figure 6. Curve of the vertical component of the flow velocity on the center axis. (a) Airflow velocity corresponding to nozzles at different angles at 4 s, (b) airflow velocity curves at different times when the nozzle angle is 55°.
Machines 13 00958 g006
Figure 7. Curve of the vertical component of particle velocity in the central axis region.
Machines 13 00958 g007
Figure 8. The collection of air-blown particles in the first-stage.
Machines 13 00958 g008
Figure 9. The vertical component curve of the airflow velocity on the central axis at a secondary nozzle angle of 40°. (a) The 0–0.2 m section, (b) the 0.28–1.18 m section.
Machines 13 00958 g009
Figure 10. Particle velocity comparison of first-stage and two-stage gas-excitation.
Machines 13 00958 g010
Figure 11. The total number of particles collected by the two-stage gas-excitation sampling and sample delivery device.
Machines 13 00958 g011
Figure 12. Simulation results under asteroid environment with different nozzle pressures. (a) Variation in particle velocity with time; (b) variation in airflow velocity along the central axis.
Machines 13 00958 g012
Figure 13. Irregular particle models under asteroid environment.
Machines 13 00958 g013
Figure 14. Irregular particle bed under asteroid environment.
Machines 13 00958 g014
Figure 15. Schematic diagram of two-stage gas-excitation sampling and sample delivery device. (a) Mechanical structure schematic diagram, (b) pneumatic schematic diagram.
Machines 13 00958 g015
Figure 16. First-stage gas-excitation sampling device. (a) Theoretical model diagram, (b) physical diagram.
Machines 13 00958 g016
Figure 17. Two-stage combined gas-excitation sampling and sample delivery device. (a) Theoretical model diagram, (b) physical diagram.
Machines 13 00958 g017
Figure 18. Comparison of particle collection rate between the first-stage air-blowing experiment and the simulation.
Machines 13 00958 g018
Figure 19. Comparison of particle collection rate between the two-stage gas-excitation experiment and the simulation.
Machines 13 00958 g019
Table 1. Parameters of the simulation.
ParameterValue
Particle diameter4 mm
Particle contact modelHertz–Mindlin
Viscous modelk-epsilon
Time step for fluid 1 0 5 s
Time step for particle 1 0 7 s
Table 2. Simulation results of first-stage gas-excitation sampling.
No.Nozzle Angle (°)Simulation Time (s)Total NumberGathering Speed ( s 1 )
1351049750
240104818482
3457.837500958
4507.2275001039
5554.0975001834
6604.9375001521
765107497750
870107332733
975107014701
1080106098610
Table 3. Simulation results of two-stage combined gas-excitation sampling and sample delivery.
No.Nozzle Angle (°)Simulation Time (s)Total NumberGathering Speed ( s 1 )
120670951183
225672521209
330672651211
435673361223
540673701228
645673331222
Table 4. Simulation parameters under asteroid environment.
ParameterValue
Particle density ( kg / m 3 )3250
Static friction coefficient (particle-to-particle)0.4
Rolling friction coefficient (particle-to-particle)0.2
Restitution coefficient (particle-to-particle)0.8
Static friction coefficient (particle-to-geometry)0.4
Rolling friction coefficient (particle-to-geometry)0.12
Restitution coefficient (particle-to-geometry)0.7
Gravity ( m / s 2 )9.1× 10 5
Disclaimer/Publisher’s Note: The statements, opinions and data contained in all publications are solely those of the individual author(s) and contributor(s) and not of MDPI and/or the editor(s). MDPI and/or the editor(s) disclaim responsibility for any injury to people or property resulting from any ideas, methods, instructions or products referred to in the content.