Abstract
The conical pick is an essential component of roadheaders used for cutting rock. During the rock-breaking process, these picks interact with the rock, resulting in self-rotation, which enhances the wear uniformity of conical picks, thereby prolonging their service life. Since the phenomenon of self-rotation is generated passively by random contact forces with the rock surface, it is challenging to quantitatively measure the extent of self-rotatory speed. In order to investigate the correlation between the self-rotatory speed of conical picks and wear, this article establishes various self-rotatory speeds for vertical rock-breaking wear experiments involving conical picks. It analyzes the relationship between quantitative parameters, such as the equivalent stress and wear, through simulation. The results of the study indicate that the optimal self-rotatory speed of the conical pick is 16 rpm when it is rotated vertically to break the rock, resulting in minimal wear. When the equivalent stress and Mohr–Coulomb safety factor are optimized, it is essential to consider the changes in normal force and the variation in the area affected by the safety factor. This leads to an increase in wear as the cutting distance increases, indicating that a higher self-rotatory speed does not necessarily improve the wear performance of conical picks.
1. Introduction
A roadheader is a key piece of industrial equipment used in mining, particularly effective for excavating low to moderately hard rocks [1]. The cutting head, which is the primary component of the roadheader used for breaking rock, consists of a pick holder and conical picks arranged in a spiral configuration, as shown in Figure 1. The conical picks are secured to the pick holder via a gap fit with a ring, ensuring that conical picks do not slip out of the holder while allowing them to rotate freely within it. During the interaction between the conical pick and the rock, the conical pick makes random contact with the rock wall, resulting in an unbalanced force that causes it to rotate around its own axis. Since the alloy head and the pick body are in direct contact with the rock, wear is more pronounced. The self-rotation of the conical pick, along with the uniform force applied to the alloy head at various angles, helps to distribute the impact evenly across the pick surfaces. This uniform wear pattern prevents excessive abrasion on any single pick surface, thereby reducing the risk of premature damage to the conical pick and extending its service life [2].
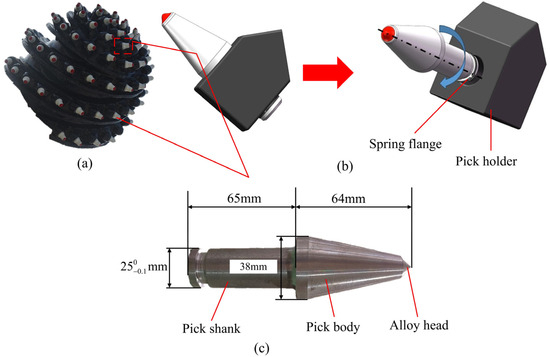
Figure 1.
Roadheader working mechanism. (a) Cutting head; (b) Modeling diagram; (c) Conical pick.
In conical pick wear, normal wear, premature wear, and carbide tip removal account for approximately 75–85% of conical pick failures [3,4]. To improve wear methods, it is essential to understand the underlying causes of wear. Dewangan et al. [5,6] utilized scanning electron microscopy to identify the primary causes of conical pick wear, which include coal rock mixing, plastic deformation, rock channel formation, and crushing and fracture wear; they further proposed seven distinct wear processes. Krauze et al. [7] found a correlation between the material composition of conical picks and their wear rates, influenced by various wear mechanisms, including coal rock mixing wear, plastic deformation wear, rock channel formation wear, and crushing and rupture wear. Consequently, several researchers have investigated methods to enhance the material properties of conical picks. For instance, some have explored carburizing CrMnMo alloys to create a new type of pick material with high wear resistance, thereby improving the mechanical properties of conical picks for rock breaking [8]. Others have employed laser cladding technology to apply nickel-based ultrafine coatings, NiBSiFeWC, to enhance the wear resistance and mechanical properties of conical picks used in coal mining [9]. In addition to advancements in material composition, wear can also be reduced by enhancing the external conditions of the conical pick. This includes the incorporation of water jets during the rock-breaking process [10,11], examining the impact of temperature on the wear of the conical pick [12,13], and employing relevant predictive methods, such as the theoretical model of PCF prediction for conical picks based on fracture mechanics [14]. Furthermore, optimizing pertinent cutting parameters is essential. However, these methods often require significant investment in research costs and time. With the advancement of computer technology, simulation methods have become widely utilized in the study of rock breaking with conical picks; Wang et al. [15] utilized the finite element method to investigate the influence of cutting parameters on cutting force and rock damage, proposing that a positive correlation exists between the volume of rock damage, the extent of rock fracturing, and the cutting force of the conical pick; Fan et al. [16] utilized the smooth finite element method combined with the half-moon cut-off technique for experimental and simulation analysis, determining that this approach is more suitable for studying conical picks; Liu et al. [17] utilized discrete element method software to investigate the influence of rock brittleness on the crushing and cutting performance of rocks. They concluded that the efficiency of rock cutting is greater in brittle rocks compared to less brittle ones; Wang et al. [18] employed discrete element method software to investigate the impact of high ground stress and stress concentration on the cutting force and specific energy required for rock breaking by conical picks under peripheral pressure conditions. In conclusion, compared to experimental methods, simulation techniques can accurately measure rock-breaking parameters and assess conditions over time. While the discrete element method is useful, the finite element method is more suitable for studying conical picks in rock breaking. This is evidenced by the ability of the finite element software LS-DYNA (970) to accurately predict the separation behavior of chips and rock produced during conical pick cutting, as well as to effectively analyze the rock-breaking performance of conical picks [19]. However, it is important to note that simulation results can be influenced by parameter settings, human experience, and other factors, necessitating validation through experimental methods. All of the aforementioned studies aimed to systematically regulate and investigate various cutting conditions of conical picks.
The self-rotation of the conical pick occurs passively due to asymmetric cutting loads, making it challenging to obtain quantitative measurements through human control. Current research primarily focuses on analyzing the underlying causes. For instance, Liu et al. [20,21] proposed that the duration of the contactless load on the pick is a significant factor influencing its self-rotation; Yasar et al. [22] utilized springs to enhance the self-rotation of the conical pick, developing a combination of springs and the conical pick to achieve a greater degree of rotation; Hekimoglu et al. [23] found that the asymmetry between neighboring grooves on the drum coal miner generates lateral forces that induce self-rotation in the conical pick; Akintunde et al. [24] suggested that the free rotation of the conical pick should be assessed prior to operation. Given the complexities of spin, measuring the self-rotatory speed during actual operations proves difficult. Furthermore, the specific self-rotatory speed of the conical pick and its impact on wear have been insufficiently studied, and the correlation between these two factors remains unexplored.
This article investigates the use of vertical rotation for rock fragmentation and examines the wear of conical picks by artificially varying self-rotatory speeds. To further explore the relationship between self-rotatory speed and conical pick wear over a short time period, we employ the finite element software LS-DYNA to analyze the rock fragmentation caused by the conical pick at different self-rotatory speeds. This analysis includes the evaluation of surface equivalent stress, the Mohr–Coulomb safety coefficient, and the associated cutting forces. Based on the experimental results presented in this article, we propose an optimal self-rotatory speed. This research provides valuable insights into the self-rotation dynamics of conical picks.
2. Methods
2.1. Experimental Methods
As shown in Figure 2, the rotary rock-breaking mechanism of the conical pick is consistent with vertical rock breaking in the wear area. Vertical rock breaking is particularly suitable for high-impact crushing experiments, and several researchers have employed this method to investigate the rock-breaking performance of conical picks [25,26,27]. In this study, a lathe clamping device is utilized to drive the conical pick for rock cutting. Due to the limited motor power, vertical rock breaking is more effective for rock fragmentation. This approach also leads to stress concentration, which increases the visibility of wear on the conical pick, thereby reducing both the cost and duration of the experiment. Consequently, vertical rock breaking is adopted for this experiment, and the overall setup is shown in Figure 3.
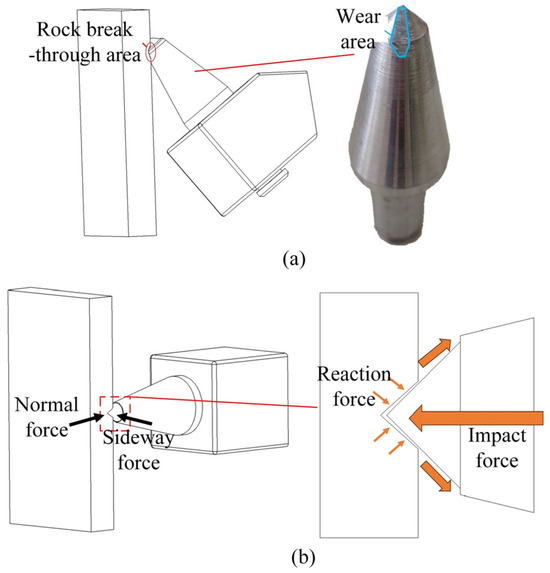
Figure 2.
Rotary and vertical rock breaking. (a) Rotary rock breaker; (b) Vertical rock breaking.
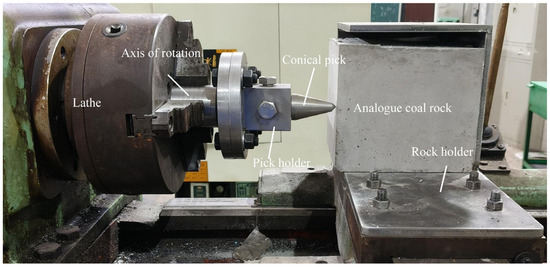
Figure 3.
Experimental device.
A right-angle pick holder is utilized, which is securely attached to the conical pick by screws. This design allows the conical pick to rotate and move in conjunction with the pick holder, thereby artificially controlling its self-rotatory speed. The use of high-alloy conical picks would extend the duration of the experiment and increase costs. To simplify the experiment, low-alloy steel (A3 steel) picks were employed instead of high-alloy steel [28]. The wear of the conical pick was evaluated by measuring the weight change before and after the experiment. The simulated coal rock was created using a mixture of cement and sand, which more accurately replicates the physical characteristics of natural rock. This simulated coal rock exhibits greater homogeneity compared to natural rock, effectively eliminating the influence of secondary factors and enhancing the reliability of the experimental results [29]. The ratio of cement to sand was approximately 1:1.5. Uniaxial compression and brazilian test were conducted after approximately 14 days of curing, as shown in Figure 4. The results of the simulated coal rock tests, along with the material parameters of the conical pick, are shown in Table 1.
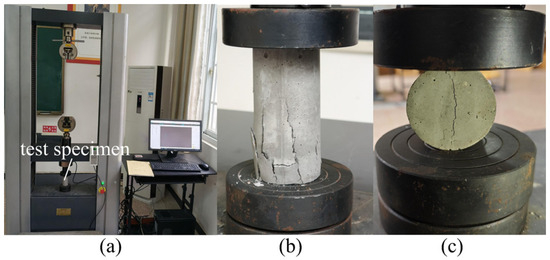
Figure 4.
Rock testing. (a) Rock tester; (b) Splitting test; (c) Brazilian test.

Table 1.
Table of material parameters.
During the experiment, the conical pick was moved along the side of the rock to simulate unilateral wear. As the moving distance increased, as shown in Figure 5a,b, both the wear of the conical pick and the rock intensified. This increased wear caused the rock to exert pressure on the rock holder, potentially damaging the experimental setup. Consequently, after the conical pick cut 30 mm into the side, it was moved 6 mm laterally before continuing to cut an additional 15 mm. This process was repeated until the total cutting distance reached 300 mm, as shown in Figure 5c. Each set of experiments was conducted with three measurements, and the average value was taken as the final wear value.
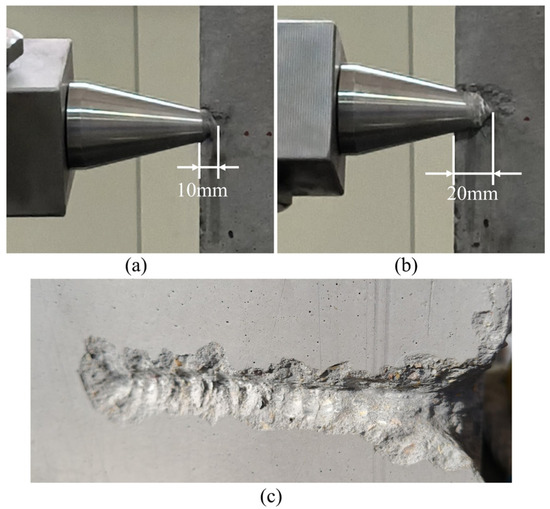
Figure 5.
Figure showing rock breaking at different cutting distances. (a) 10 mm; (b) 20 mm; (c) 300 mm.
2.2. Simulation Methods
The use of finite element software enables more detailed control and observation of conical pick breaking within a short time frame [30,31]. This facilitates further analysis of the correlation between different self-rotatory speeds and conical pick wear.
According to the experimental device shown in Figure 3, three-dimensional modeling was conducted using ANSYS/LS-DYNA (2023R1) software for simulation purposes. The three-dimensional simulation diagram is presented in Figure 6a. Due to the larger size of the simulation model, the simulation time is extended, which may increase the potential for accuracy errors. In the experimental process, the alloy head of the conical pick serves as the primary component for cutting rock; therefore, the simulation model has been simplified, as shown in Figure 6b. In reviewing 21, it is established that the final rotation angle of the conical pick ranges from approximately 60° to 120°. Since the rotation time is not specified in the text, and based on experimental observations, the self-rotatory speed of the conical pick is relatively low. Therefore, the minimum controllable rotational speed of the lathe is set to match the self-rotatory speed, with experimental and simulation speeds of 0, 10, 12.5, 16, and 20 revolutions per minute (rpm). By increasing the lathe speed and utilizing the inertia of the spindle rotation at reduced speeds, the conical pick, which has a self-rotatory speed of 0 rpm (a stationary tool), can achieve an average movement speed of 4.7 mm/s. Consequently, the feed rate (V) is set at 4.7 mm/s. The conical pick and the simulated coal rock materials are shown in Table 1, where the simulated coal rock is modeled using the D-P model [32]. The material of the pick holder is structural steel, which is designated as rigid. As the mesh becomes finer, the simulation time in the LS-DYNA software increases, resulting in greater computational demands but improved simulation accuracy. Therefore, mesh convergence analysis is conducted indirectly by employing the energy balance method and assessing mesh quality. Specific numerical details are provided in the Supplementary Materials.
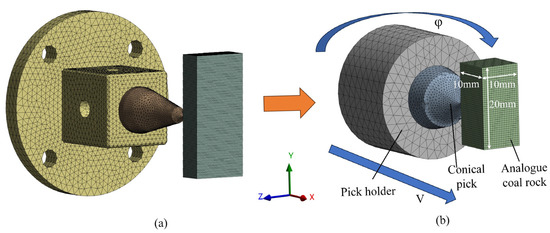
Figure 6.
Simulation models. (a) Original Model; (b) Simplified Model.
When the conical pick breaks through the rock, the rock exerts a reaction force on the conical pick due to mutual compression, as illustrated in Figure 2b. The tip of the alloy head of the conical pick is primarily influenced by this reaction force; however, the force is transmitted throughout the conical pick, which is predominantly reflected in the stress observed in the simulation results. Areas of higher stress indicate regions where conical picks are more susceptible to wear. While stress serves as an indirect measure of pick wear, the factor of safety provides a visual representation of the areas at risk of damage due to wear. Furthermore, increased wear results in a significant rise in the cutting force, making the cutting force a critical factor in assessing the wear of the conical pick. The cutting force comprises both normal and lateral forces. Since this article employs vertical rotation to fracture the rock, the conical pick is primarily influenced by forces along the X direction, specifically the normal force. Therefore, this study focuses on investigating the variations in the normal force of the conical pick at different self-rotatory speeds.
For the effect of stresses in this article, the equivalent stress is mainly used to express the equations as shown below:
Here, is the equivalent stress (MPa); is the maximum principal stress (MPa); is the middle principal stress (MPa); is the minimum principal stress (MPa).
For the safety factor, a safety factor based on the Mohr–Coulomb theory is used with the formula shown below:
Here, is the safety factor; is the material’s tensile limit (MPa); is the material’s compressive limit (MPa). The smaller the safety factor, the more the conical picks are subjected to wear.
3. Results and Discussion
3.1. Qualitative Experimental Analysis of Self-Rotatory Speed and Wear
3.1.1. Weight Loss
During the experiment, the conical picks were weighed every 60 mm of cutting distance, and the change in weight—specifically, the weight loss—was recorded before and after each measurement. By using weight loss as the vertical coordinate and cutting distance as the horizontal coordinate, the results of weight loss at five different self-rotary speeds were documented; a regression curve was plotted using error bars based on the standard deviation, as shown in Figure 7.
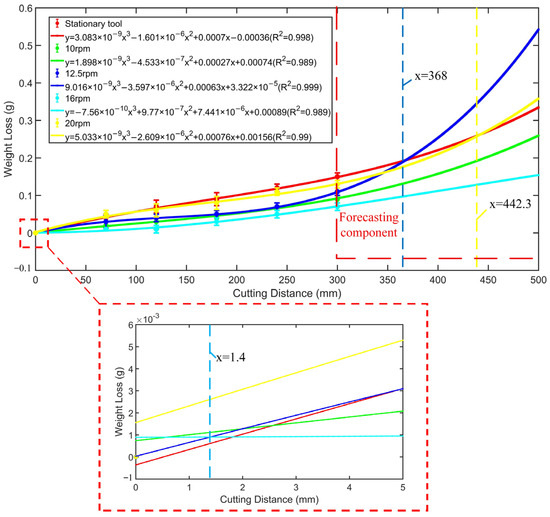
Figure 7.
Figure of weight loss.
As illustrated by the regression curves in Figure 7, the weight loss of the conical pick increases gradually with the cutting distance, initially at a gentle rate and subsequently at a more rapid pace. During the experimental travel distance, the weight loss of the conical pick is greatest when it breaks the rock at the stationary tool, while the weight loss is minimal at the self-rotatory speed of 16 rpm. The regression equation indicates that the weight loss at self-rotatory speeds of 12.5 rpm and 20 rpm surpasses that of the stationary tool at cutting distances of 368 mm and 442.3 mm, respectively. Furthermore, the rate of increase in weight loss progressively accelerates with the increasing distance traveled.
3.1.2. Wear Areas
Figure 8 illustrates the wear patterns at various self-rotatory speeds at the conclusion of the experiment. A comparison of Figure 8a with the other graphs reveals that the conical pick has experienced significant wear at the tip. The surface of the conical pick in Figure 8a appears relatively smooth, with no visible damage. In contrast, the oval area depicted in Figure 8b shows that at the stationary tool, the surface is already defective, exhibiting unilateral damage. This suggests that the movement of the conical pick during the rock-breaking process creates an imbalance, which adversely affects rock-cutting efficiency. When the conical pick undergoes self-rotation, as shown in Figure 8c–f, surface damage occurs; however, the wear is relatively uniform. This uniform wear allows the surface of the conical pick to maintain a more balanced state, thereby reducing the impact on the broken rock. Additionally, this uniform wear helps prevent excessive deterioration of a single surface, mitigating the occurrence of biased wear.
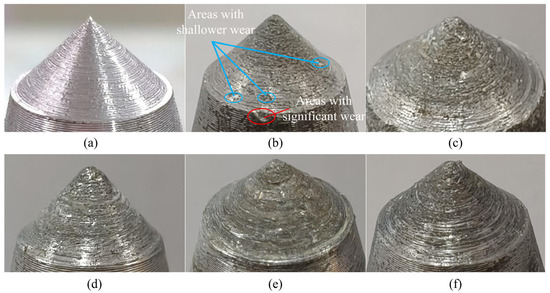
Figure 8.
Figure of conical pick’s wear areas. (a) Primary conical pick; (b) Stationary tool; (c) 10 rpm; (d) 12.5 rpm; (e) 16 rpm; (f) 20 rpm.
Figure 9 illustrates the lateral wear and area of the conical pick. As depicted in the figure, the conical picks experienced varying degrees of wear at their tips under different self-rotatory speeds. In Figure 9a, the lateral wear area is triangular in shape. Figure 9e presents a graph showing the area of this triangular region at different self-rotatory speeds. At the stationary tool, the wear area is the smallest, primarily because the conical pick experiences only unilateral wear, resulting in a smaller wear area compared to when self-rotation occurs. As the self-rotatory speed increases, the wear area at the tip of the pick initially increases, then decreases, and subsequently shows an increasing trend. At a self-rotatory speed of 16 rpm, the wear area is at its minimum, which aligns with the experimental measurements of weight loss. Conversely, at a self-rotatory speed of 20 rpm, the wear area is the largest, indicating that the self-rotation of the conical pick is not conducive to reducing wear when the speed exceeds a certain threshold.
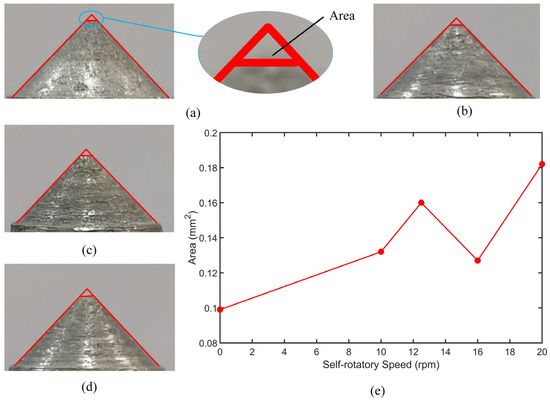
Figure 9.
Side wear and tip wear area of the conical pick. (a) Stationary tool; (b) 12.5 rpm; (c) 16 rpm; (d) 20 rpm; (e) Tip wear area.
3.2. Simulation Analysis of Self-Rotatory Speed and Wear
Since it was not possible to analyze the rock-breaking process of the conical pick during all time periods of the experiment, particularly during the shorter time intervals, simulations were employed for further analysis.
3.2.1. Consistency Analysis Between Simulation and Experiment in the Degree of Rock Fragmentation
The simulation method described in Section 2.2 is employed to set the time duration to 1 s for simulating and analyzing the vertical rock-breaking process of the conical pick. Figure 10 illustrates the graphs of simulated rock breakage under both simulated and experimental conditions when the stationary tool is used. As shown in Figure 10b, when the conical pick engages the rock using a stationary tool, the cutting area generally forms a triangular shape, which aligns with the rock-cutting behavior of the conical pick, as proposed by Evans [33]. This observation indirectly confirms the accuracy of the experiment. Figure 10d,e illustrate the rock-cutting process in the simulation. In this representation, the cutting area is generally depicted as a triangle; however, the apex angle of this triangle is noticeably larger than that observed in the experimental results. This is because the simulation time should not be set excessively long, as that would compromise the accuracy of the simulation results. Only the alloy tip was involved in rock fragmentation, as shown in Figure 10c. In contrast, the experiment took a considerable amount of time, the pick body also contributed to rock breaking, and its inclination angle was significantly smaller than that of the alloy head. This difference in involvement accounts for the variations between the simulation and the experimental outcomes. Furthermore, in Figure 10b, it is evident that the depth of the rock cut is greater in region A, which represents the fully crushed area. In comparison, regions B on both sides are shallower, indicating incompletely crushed areas. In the simulation, regions C and D in Figure 10e align more closely with the experimental findings. This phenomenon can be explained by the fact that the configured rock is composed of brittle materials. When the conical pick breaks the rock, the force generated causes a transfer effect, resulting in broken rock debris that can displace some of the rock material in the uncontacted areas, thereby leading to this observed phenomenon.
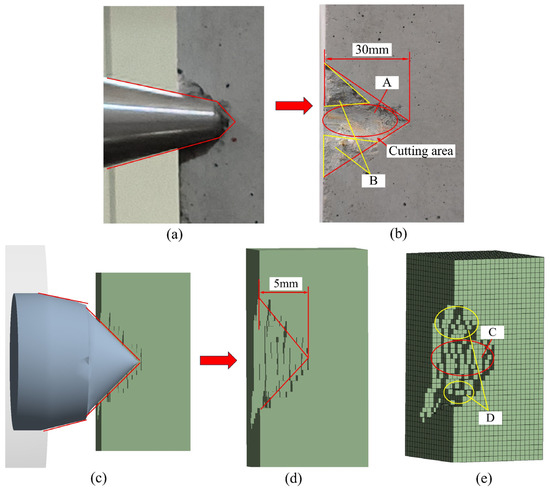
Figure 10.
Rock fragmentation using a stationary tool. (a) Experimental rock breaking; (b) Experimental rock crushing; (c) Simulated rock breaking; (d) Simulated rock crushing; (e) Side simulation rock crushing.
Figure 11 illustrates the rock fragmentation pattern produced by a conical pick while breaking rock at a specific self-rotatory speed. Due to the self-rotation of the conical pick, the rock-cutting zone displays a distinct arc shape, a feature observed in both experimental and simulation results. The figure shows that, at different self-rotatory speeds, both experimental and simulated rock samples exhibit fully fragmented and incompletely fragmented zones, with the distribution of these zones being largely consistent between the two.
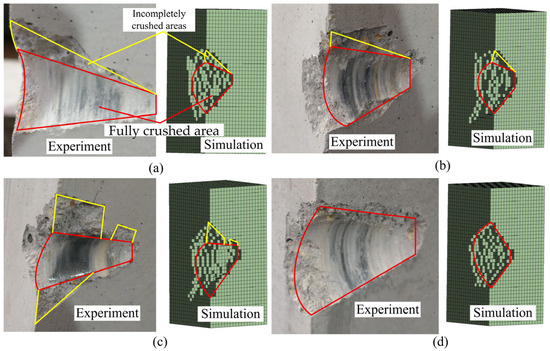
Figure 11.
Rock-breaking figure of conical pick during self-rotation. (a) 10 rpm; (b) 12.5 rpm; (c) 16 rpm; (d) 20 rpm.
Figure 12 illustrates the lateral fragmentation patterns and fragmented areas of various self-rotating rocks. As evident from the diagram, the fully fragmented rock region predominantly forms a trapezoidal shape. Consequently, Image-J (1.52a) software may be employed to determine the corresponding trapezoidal dimensions, thereby enabling calculation of the area within this zone. Similarly, by measuring the dimensions of all delineated regions, the total fragmented area can be ascertained and plotted as depicted in Figure 12d. As can be seen from the diagram, the total area exhibits a trend of first decreasing, then increasing, and finally decreasing again. The area of full fragmentation is greatest at a self-rotatory speed of 20 rpm, while the total fragmented area is largest at 12.5 rpm, followed by 16 rpm. Therefore, the rock-cutting performance of the conical pick at self-rotatory speeds of 12.5 and 16 rpm is superior to that at 20 rpm. Moreover, the generation of self-rotation causes the conical pick to undergo rotational friction with the rock during fragmentation. As illustrated in Figure 11 and Figure 12, the blackened rock areas result from this rotational friction between the conical pick and the rock. This process further disintegrates the rock within the active zone, thereby expanding the area of rock fragmentation. Additionally, it suggests that the induction of self-rotation enhances the effectiveness of the conical pick in facilitating rock breakage.
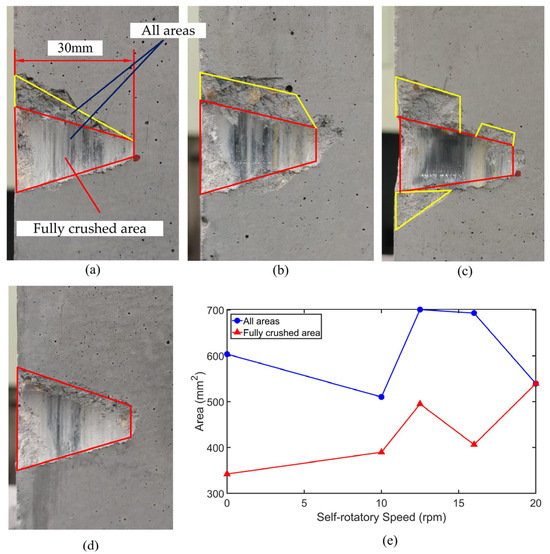
Figure 12.
Experimental rock fragmentation and area. (a) 10 rpm; (b) 12.5 rpm; (c) 16 rpm; (d) 20 rpm; (e) Experimental rock-crushing area.
In summary, the simulation method employed in this study effectively simulates the vertical rotation of rock breaking.
3.2.2. Analysis of the Correlation Between Self-Rotatory Speed and Wear of Conical Pick
Figure 13 illustrates the equivalent stress distribution of the alloy head tip of the conical pick, with Figure 13b–f depicting the stress distribution in the primary cutting area, as shown in Figure 13a. The figure reveals that, regardless of whether the rock is cut at a specific self-rotatory speed, the maximum equivalent stress is concentrated at the tip of the alloy head. This observation indicates that this location is prone to damage, which aligns with the experimental findings. The alloy head is susceptible to damage, as it constitutes only a small portion of the overall structure. This vulnerability arises when the conical pick breaks the rock; the alloy head at the tip is the first point of contact with the fractured rock, which subsequently affects the remaining uncontacted areas. In some cases, this can even lead to the premature destruction of the rock, as shown in Figure 14. Consequently, the tip of the alloy head becomes the primary area of wear for the conical pick. It is important to note that the equivalent stress in the blue area of the alloy head is not zero. This occurs when the conical picks experience the reaction force exerted by the rock, which is transmitted to areas that are not in direct contact with the rock, resulting in a distribution of stress throughout the alloy head.
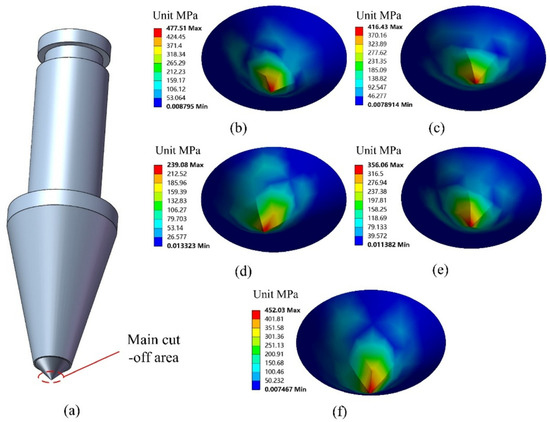
Figure 13.
Equivalent stress of alloy head of conical pick. (a) Conical pick; (b) Stationary tool; (c) 10 rpm; (d) 12.5 rpm; (e) 16 rpm; (f) 20 rpm.
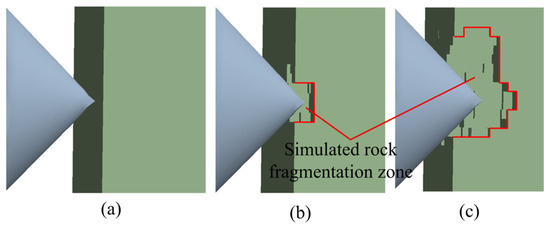
Figure 14.
Rock breaking of conical pick at different moments in time. (a) 0 s; (b) 0.225 s; (c) 0.45 s.
The equivalent stress reaches its maximum value when using the stationary tool and its minimum value when the self-rotatory speed of the conical pick is 12.5 rpm. However, in terms of weight loss, the minimum occurs at a self-rotatory speed of 16 rpm. Furthermore, as indicated by the prediction curve in Figure 7, when the cutting distance is within 5 mm, the weight loss generated by the conical pick at a self-rotatory speed of 16 rpm is generally less than that at a self-rotatory speed of 12.5 rpm. Therefore, the magnitude of the equivalent stress should be considered only as one of the reference standards for assessing the wear of the conical pick, necessitating further analysis.
Both rock fragmentation and the distribution of equivalent stresses are analyzed indirectly in relation to conical pick wear. Figure 15 illustrates the distribution of the safety coefficient on the surface of the conical pick, based on the Mohr–Coulomb theory, along with a corresponding curve diagram. The figure indicates that the safety coefficient at the alloy head of the conical pick is represented in red at the tip, indicating the area of most severe wear. As one moves outward to the surrounding area, the degree of wear gradually decreases, and the shape of the affected area is irregular. Among them, Figure 15d illustrates the distribution of the safety factor at the alloy head of the conical pick when the self-rotatory speed is 12.5 rpm. It can be observed that the red area at the tip of the conical pick occupies a smaller region and is lighter in color. According to Equation (2), the safety coefficient is influenced by stress; at this self-rotatory speed, the equivalent stress is at its lowest, resulting in a smaller area of significant wear. Figure 15c presents the average safety factor alongside the percentage of the wear area at various self-rotatory speeds. The figure indicates that the average safety coefficient initially increases and then decreases with rising self-rotatory speed. Notably, the highest average safety coefficient occurs at a self-rotatory speed of 12.5 rpm, suggesting that the alloy head of the conical pick experiences less wear at this speed. Conversely, the lowest average safety coefficients are observed at the stationary tool and self-rotatory speeds of 20 rpm, indicating that the alloy head of the conical pick is more susceptible to damage from abrasion at these speeds. This observation aligns with the findings derived from the equivalent stress.
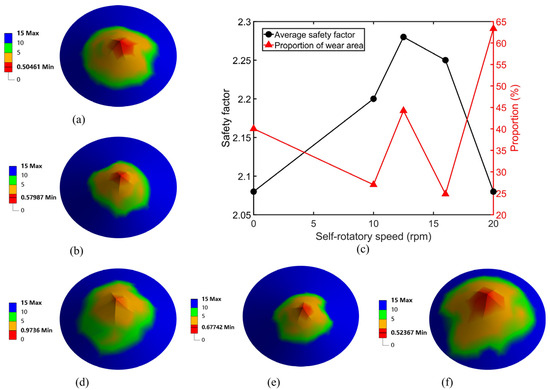
Figure 15.
Alloy head Mohr–Coulomb safety and correlation curves. (a) Stationary tool; (b) 10 rpm; (c) Figure of average safety factor and area share; (d) 12.5 rpm; (e) 16 rpm; (f) 20 rpm.
Since the safety factor is lower than 15, indicating a wear region, the area cannot be effectively quantified. Instead, the ratio of the number of pixel points in this region to the total number of points is utilized for measurement. As illustrated in Figure 15c, the area of the worn region initially increases, then decreases, and subsequently increases sharply again. The wear area is smallest at a self-rotatory speed of 16 rpm. Although the average safety factor is highest at a self-rotatory speed of 12.5 rpm, the surface wear area is significantly larger compared to the stationary tool and to self-rotatory speeds of 10 rpm and 16 rpm. This indicates that at a self-rotatory speed of 12.5 rpm, while wear is less at shorter cutting distances, the surface wear increases with longer cutting distances due to the larger wear area. Consequently, the weight loss is greater than at other self-rotatory speeds, and the rate of weight loss increases most significantly at this speed.
Figure 16 illustrates the normal force exerted by the conical pick and the corresponding change graph. As shown in Figure 16a, the self-rotation of the conical pick can significantly reduce the normal force, particularly at self-rotatory speeds of 10–16 rpm. In this range, the peak normal force decreases by an average of approximately 40%, while the average normal force is reduced by about 34%. Figure 16b depicts the variation in normal force at different self-rotatory speeds over a time interval from 0.1 to 0.225 s, during which the conical pick was in contact with the rock for approximately 0.1125 s in the simulation. At the stationary tool, the normal force initially increases before gradually decreasing to zero. In contrast, at other self-rotatory speeds, the normal force rises to a peak and then decreases sharply to zero. Notably, the peak normal force occurs later at lower self-rotatory speeds compared to higher speeds, indicating that self-rotation is beneficial for reducing the normal force. From Figure 14, it is evident that after applying a certain force to break the rock, there is a period during which the conical pick does not make contact with the rock, resulting in the normal force being reduced to zero. Furthermore, the reduction in the duration of rock breaking leads to a simultaneous decrease in the interaction time between the conical pick and the rock. Consequently, the normal force exerted on the conical pick during its self-rotation is also diminished. When the self-rotatory speed of the conical pick reaches 20 rpm, both the peak normal force and the average normal force increase sharply. This increase is attributed to the excessive self-rotatory speed, which heightens the friction between the conical pick and the rock. This indicates that while a moderate self-rotatory speed can promote uniform wear and effectively extend the service life of the conical pick, exceeding a certain threshold may hinder the breaking efficiency of the conical pick and even accelerate its wear. Therefore, based on a comprehensive analysis, a self-rotatory speed of 16 rpm is optimal for rock crushing, as it minimizes wear and prolongs the service life of the conical pick.
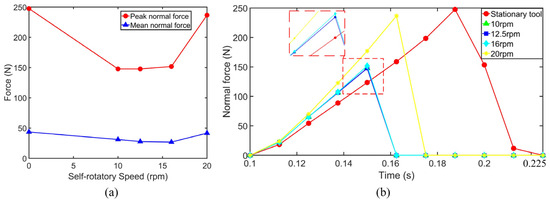
Figure 16.
Normal force of conical pick and corresponding changes. (a) Normal force; (b) Change in normal force.
4. Conclusions
In this article, we employ vertical rotation to fracture rock in order to investigate the impact of varying self-rotatory speeds of conical picks on wear. Through both experimental and simulation methods, we determine that the optimal self-rotatory speed for conical picks is 16 rpm. We also analyze the correlation between different self-rotatory speeds and wear. This study presents a novel approach to understanding the self-rotation of conical picks, contributing to the enhancement of their design and the optimization of their self-rotatory speed. The major conclusions include the following:
Firstly, the weight loss associated with the vertical rotation of the conical pick used for rock breaking gradually increases with the cutting distance. Initially, this increase is gradual, but it accelerates over time. Notably, the conical pick experiences the least weight loss when operating at a self-rotatory speed of 16 rpm.
Secondly, when the self-rotatory speed is 12.5 rpm, both the equivalent stress of the conical pick and the safety factor according to the Mohr–Coulomb theory are at their lowest. However, the maximum area of the safety factor region results in a significant increase in weight loss as the cutting distance increases, indicating that conical picks are more prone to wear inefficiencies.
Lastly, the normal force exerted by the conical pick initially decreases and then increases with an increase in self-rotational speed. Specifically, within the self-rotatory speed range of 10 rpm to 16 rpm, the peak normal force and the average normal force decrease by approximately 40% and 34%, respectively. Furthermore, when the self-rotatory speed reaches 20 rpm, the normal force increases again. This trend is consistent with the changes observed in equivalent stress and the coefficient of safety. Therefore, as the self-rotatory speed of the conical pick increases beyond a certain threshold, it becomes unfavorable for reducing wear.
Supplementary Materials
The following supporting information can be downloaded at: https://www.mdpi.com/article/10.3390/machines13100957/s1. Figure S1: Hourglass Energy of 0rpm; Figure S2: Hourglass Energy of 10rpm; Figure S3: Hourglass Energy of 12.5rpm; Figure S4: Hourglass Energy of 16rpm; Figure S5: Hourglass Energy of 20rpm; Figure S6: Internal Energy of 0rpm; Figure S7: Internal Energy of 10rpm; Figure S8: Internal Energy of 12.5rpm; Figure S9: Internal Energy of 16rpm; Figure S10: Internal Energy of 20rpm; Figure S11: Kinetic Energy of 0rpm; Figure S12: Kinetic Energy of 10rpm; Figure S13: Kinetic Energy of 12.5rpm; Figure S14: Kinetic Energy of 16rpm; Figure S15: Kinetic Energy of 20rpm; Figure S16: Element Quality; Figure S17: Jacobian Ratio (Corner Nodes); Figure S18: Jacobian Ratio (Gauss); Figure S19: Skewness; Figure S20: Parallel Deviation; Figure S21: Aspect Ratio.
Author Contributions
Conceptualization, Y.Z., X.P. and Z.M.; methodology, Y.Z., X.P. and Z.M.; software, Y.Z. and X.P.; formal analysis, Y.Z. and X.P.; investigation, Y.Z. and X.P.; data curation, Y.Z.; writing—original draft preparation, Y.Z., X.P. and Z.M.; writing—review and editing, Y.Z., X.P., Z.M. and F.L.; funding acquisition, Y.Z. and F.L. All authors have read and agreed to the published version of the manuscript.
Funding
This research received National Natural Science Foundation of China with grant number (52175254), Hunan Provincial Innovation Foundation for Postgraduate with grant number (CX20230550).
Data Availability Statement
The datasets supporting this article have been uploaded as part of the electronic Supplementary Materials.
Conflicts of Interest
The authors have no relevant financial or non-financial interests to disclose.
References
- Ergin, H.; Acaroglu, O. The effect of machine design parameters on the stability of a roadheader. Tunn. Undergr. Space Technol. 2007, 22, 80–89. [Google Scholar] [CrossRef]
- Prokopenko, S.; Li, A.; Kurzina, I.; Sushko, A. Improved Operating Performance of Mining Machine Picks. IOP Conf. Ser. Mater. Sci. Eng. 2016, 142, 012115. [Google Scholar] [CrossRef]
- Hoseinie, S.H.; Ataei, M.; Khalokakaie, R.; Ghodrati, B.; Kumar, U. Reliability analysis of drum shearer machine at mechanized longwall mines. J. Qual. Maint. Eng. 2012, 18, 98–119. [Google Scholar] [CrossRef]
- Hoseinie, S.H.; Ataei, M.; Khalokakaie, R.; Kumar, U. Reliability and maintainability analysis of electrical system of drum shearers. J. Coal Sci. Eng. China 2011, 17, 192–197. [Google Scholar] [CrossRef]
- Dewangan, S.; Chattopadhyaya, S.; Hloch, S. Wear Assessment of Conical Pick used in Coal Cutting Operation. Rock Mech. Rock Eng. 2015, 48, 2129–2139. [Google Scholar] [CrossRef]
- Dewangan, S.; Chattopadhyaya, S. Characterization of Wear Mechanisms in Distorted Conical Picks After Coal Cutting. Rock Mech. Rock Eng. 2016, 49, 225–242. [Google Scholar] [CrossRef]
- Krauze, K.; Mucha, K.; Wydro, T.; Pieczora, E. Functional and operational requirements to be fulfilled by conical picks regarding their wear rate and investment costs. Energies 2021, 14, 3696. [Google Scholar] [CrossRef]
- Luo, Y.; Zhang, D.; Wang, Q.; Liu, H.; Cheng, G.; Ge, S. Preparation and properties of a new cutting pick of coal shearers. Int. J. Min. Sci. Technol. 2010, 20, 794–796. [Google Scholar] [CrossRef]
- Eshaghian, O.; Hoseinie, S.H.; Salimi Jazi, H. Effects of Ni-based composite coatings on failure mechanism and wear resistance of cutting picks on coal shearer machine. Eng. Fail. Anal. 2023, 151, 107342. [Google Scholar] [CrossRef]
- Jiang, H.; Meng, D. Experimental Research on the Specific Energy Consumption of Rock Breakage Using Different Waterjet-Assisted Cutting Heads. Adv. Mater. Sci. Eng. 2018, 2018, 3853980. [Google Scholar] [CrossRef]
- Zhou, X.; Guo, C.; Zhang, H.; Liu, Y.; Bai, J.; Wang, F. Experimental and numerical investigation on rock breaking of conical pick assisted by abrasive water jet gridding pre-cutting method. J. Braz. Soc. Mech. Sci. Eng. 2023, 45, 599. [Google Scholar] [CrossRef]
- Sun, Y.; Li, X.S.; Harbers, C.; Williams, D.; Boland, J.N. Wear and cutting temperature of thermally stable diamond composite tipped pick in hard rock cutting. Wear 2023, 523, 204848. [Google Scholar] [CrossRef]
- Zhang, X.; Li, X.; Xu, W.; Gao, K.; Jiang, K.; Wang, X.; Wei, H. Experimental investigation of the failure of conical picks under thermal and abrasive effects. Eng. Fail. Anal. 2024, 156, 107737. [Google Scholar] [CrossRef]
- Li, X.; Wang, S.; Ge, S.; Malekian, R.; Li, Z. A Theoretical Model for Estimating the Peak Cutting Force of Conical Picks. Exp. Mech. 2018, 58, 709–720. [Google Scholar] [CrossRef]
- Wang, Z.; Zeng, Q.; Wan, L.; Lu, Z.; Wang, H. Investigation of the Influence of Cutting Parameters on Conical Pick Cutting Performance and Rock Damage. Machines 2022, 10, 1034. [Google Scholar] [CrossRef]
- Fan, Q.; Chen, C.; Zhang, Q.; Liu, G. A dynamic analysis of a conical pick during rock-cutting process based on the smooth finite element method. Wear 2023, 512–513, 204523. [Google Scholar] [CrossRef]
- Liu, S.F.; Lu, S.F.; Wan, Z.J.; Cheng, J.Y. Investigation of the influence mechanism of rock damage on rock fragmentation and cutting performance by the discrete element method. R. Soc. Open Sci. 2019, 6, 190116. [Google Scholar] [CrossRef]
- Wang, S.; Shi, X.; Wu, Y. DEM-based 2D numerical simulation of the rock cutting process using a conical pick under confining stress. Comput. Geotech. 2024, 165, 105885. [Google Scholar] [CrossRef]
- Menezes, P.L.; Lovell, M.R.; Avdeev, I.V.; Lin, J.S.; Higgs, C.F. Studies on the formation of discontinuous chips during rock cutting using an explicit finite element model. Int. J. Adv. Manuf. Tech. 2014, 7, 635–648. [Google Scholar] [CrossRef]
- Liu, X.; Tang, P.; Li, X.; Tian, M. Self-rotatory performance of conical cutter interacted with rock material. Eng. Fail. Anal. 2017, 80, 197–209. [Google Scholar] [CrossRef]
- Liu, X.; Geng, Q. Effect of contact characteristics on the self-rotation performance of conical picks based on impact dynamics modelling. R. Soc. Open Sci. 2020, 7, 200362. [Google Scholar] [CrossRef]
- Yasar, S.; Odoom, K.; Shepel, T.; Bretschneider, J.; Drebenstedt, C. Rotation Enhancement of Conical Picks Coupled with Springs. Rock Mech. Rock Eng. 2023, 56, 5447–5453. [Google Scholar] [CrossRef]
- Hekimoglu, O.Z. Suggested methods for optimum rotative motion of point attack type drag tools in terms of skew angles. Int. J. Min. Reclam. Environ. 2020, 34, 573–591. [Google Scholar] [CrossRef]
- Akintunde, I.B.; Lindsay, E.E.; Olakanmi, E.O.; Prasad, R.V.S.; Matshediso, B.I.; Motimedi, T.; Botes, A.; Pityana, S.L. Performance evaluation and failure analysis of conical picks used in a Botswana (Ngwato) mine. Eng. Fail. Anal. 2023, 143, 106872. [Google Scholar] [CrossRef]
- Luo, P.; Li, D.; Ru, W.; Gong, H.; Wang, M. Hard rock fragmentation by dynamic conical pick indentation under confining pressure. Int. J. Rock Mech. Min. Sci. 2024, 183, 105932. [Google Scholar] [CrossRef]
- Jiang, H.; Meng, D. 3D numerical modelling of rock fracture with a hybrid finite and cohesive element method. Eng. Fract. Mech. 2018, 199, 280–293. [Google Scholar] [CrossRef]
- Wang, S.; Li, X.; Du, K.; Wang, S. Experimental investigation of hard rock fragmentation using a conical pick on true triaxial test apparatus. Tunn. Undergr. Space Technol. 2018, 79, 210–223. [Google Scholar] [CrossRef]
- Yang, D.; Jianping, L.I.; Zheng, K.; Jiang, H.; Handong, X.U.; Liu, S. High-hardness alloy substituted by low hardness during drilling and cutting experiments of conical pick. Int. J. Rock Mech. Min. Sci. 2017, 95, 73–78. [Google Scholar] [CrossRef]
- Liu, S.; Ji, H.; Liu, X.; Jiang, H. Experimental research on wear of conical pick interacting with coal-rock. Eng. Fail. Anal. 2017, 74, 172–187. [Google Scholar] [CrossRef]
- Zhao, H.; Zhang, L.; Wu, Z.; Liu, A. A new discrete element model for rock-like materials. Comput. Struct. 2022, 261–262, 106730. [Google Scholar] [CrossRef]
- Lu, Z.; Wan, L.; Zeng, Q.; Zhang, X.; Gao, K. Numerical Simulation of Fragment Separation during Rock Cutting Using a 3D Dynamic Finite Element Analysis Code. Adv. Mater. Sci. Eng. 2017, 2017, 3024918. [Google Scholar] [CrossRef]
- Wicaksana, Y.; Jeong, H.; Jeon, S. Numerical simulation of rock cutting process induced by a pick cutter considering dynamic properties of rock at intermediate strain rate. Bull. Eng. Geol. Environ. 2021, 80, 9049–9069. [Google Scholar] [CrossRef]
- Evans, I. A Theory of the Basic Mechanics of Coal Ploughing. In Proceedings of the International Symposium on Mining Research, Columbia, MO, USA, February 1961; Pergamon Press: Oxford, UK, 1962; pp. 761–798. [Google Scholar] [CrossRef]


Disclaimer/Publisher’s Note: The statements, opinions and data contained in all publications are solely those of the individual author(s) and contributor(s) and not of MDPI and/or the editor(s). MDPI and/or the editor(s) disclaim responsibility for any injury to people or property resulting from any ideas, methods, instructions or products referred to in the content. |
© 2025 by the authors. Licensee MDPI, Basel, Switzerland. This article is an open access article distributed under the terms and conditions of the Creative Commons Attribution (CC BY) license (https://creativecommons.org/licenses/by/4.0/).