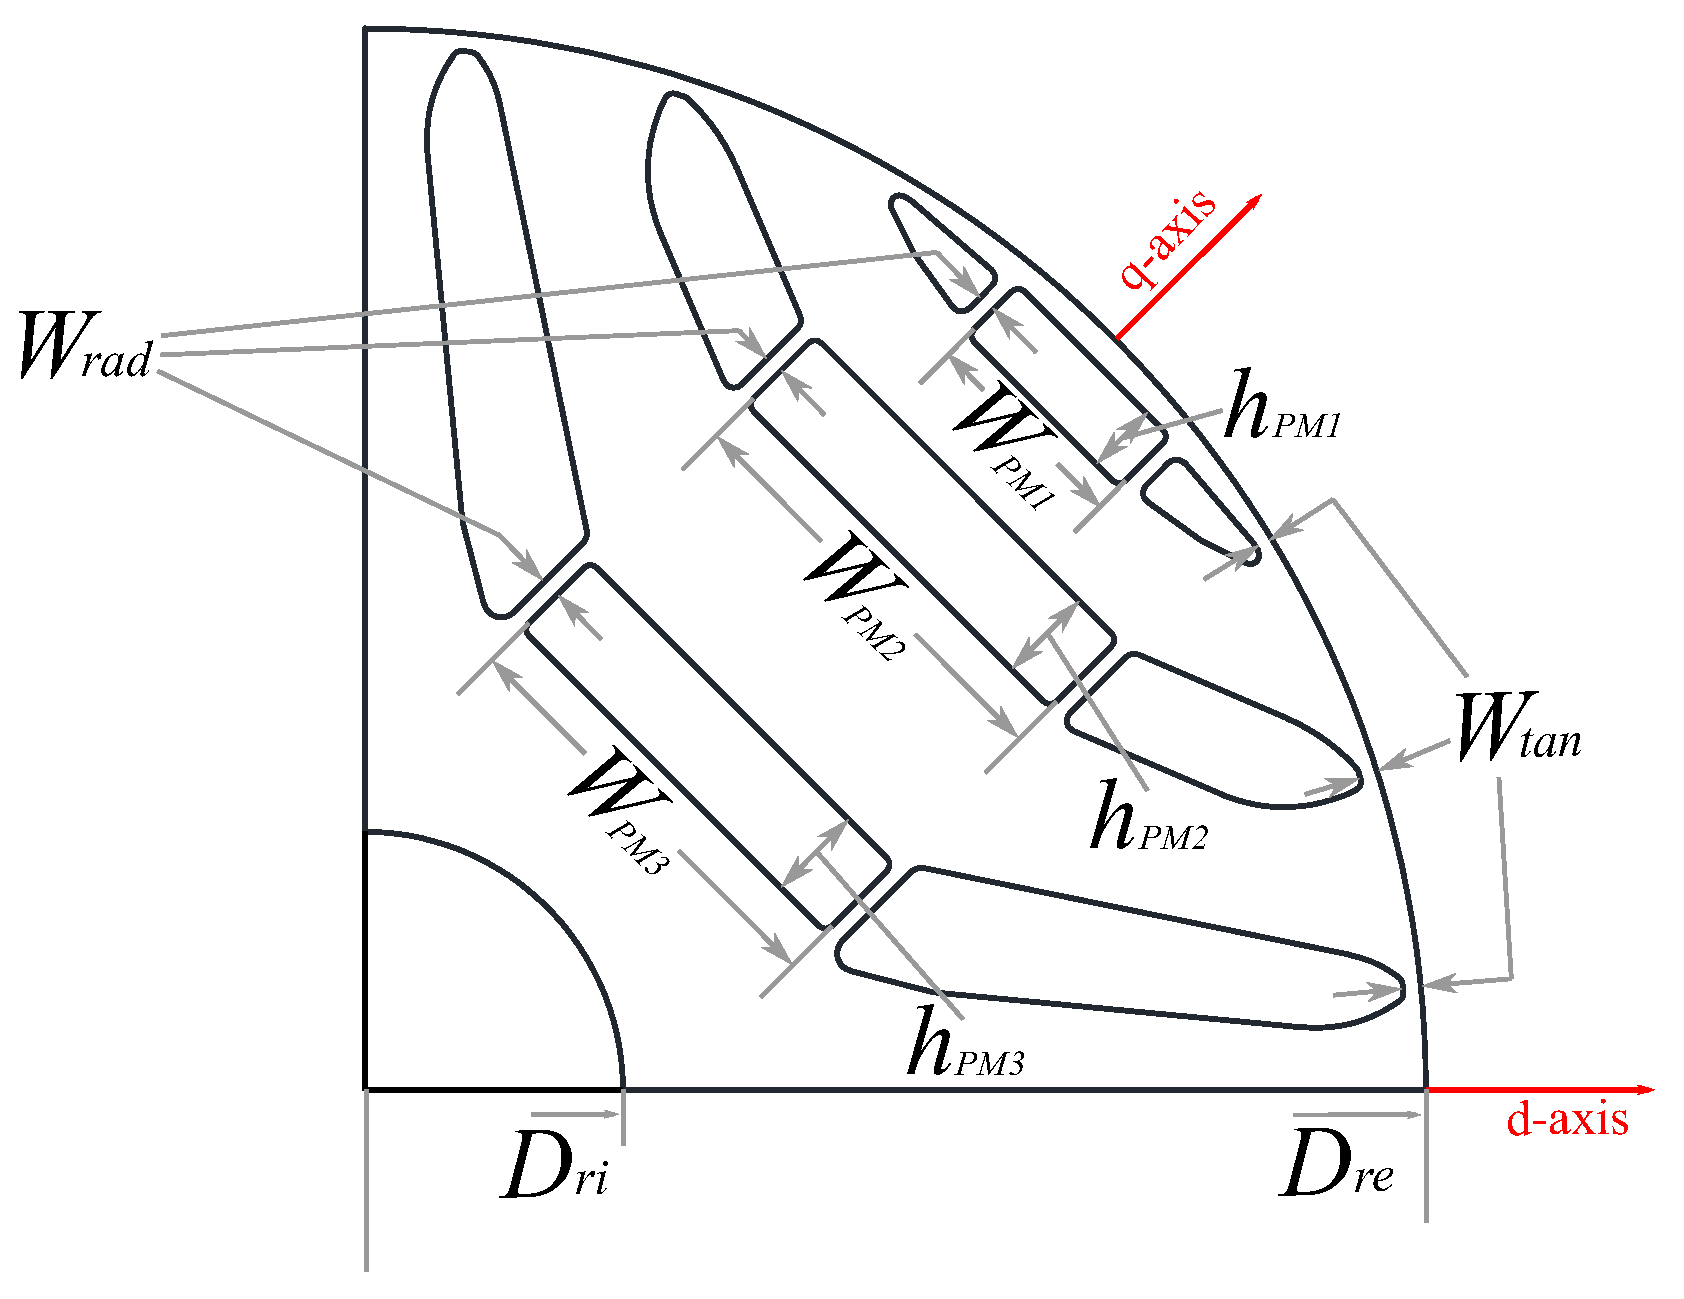
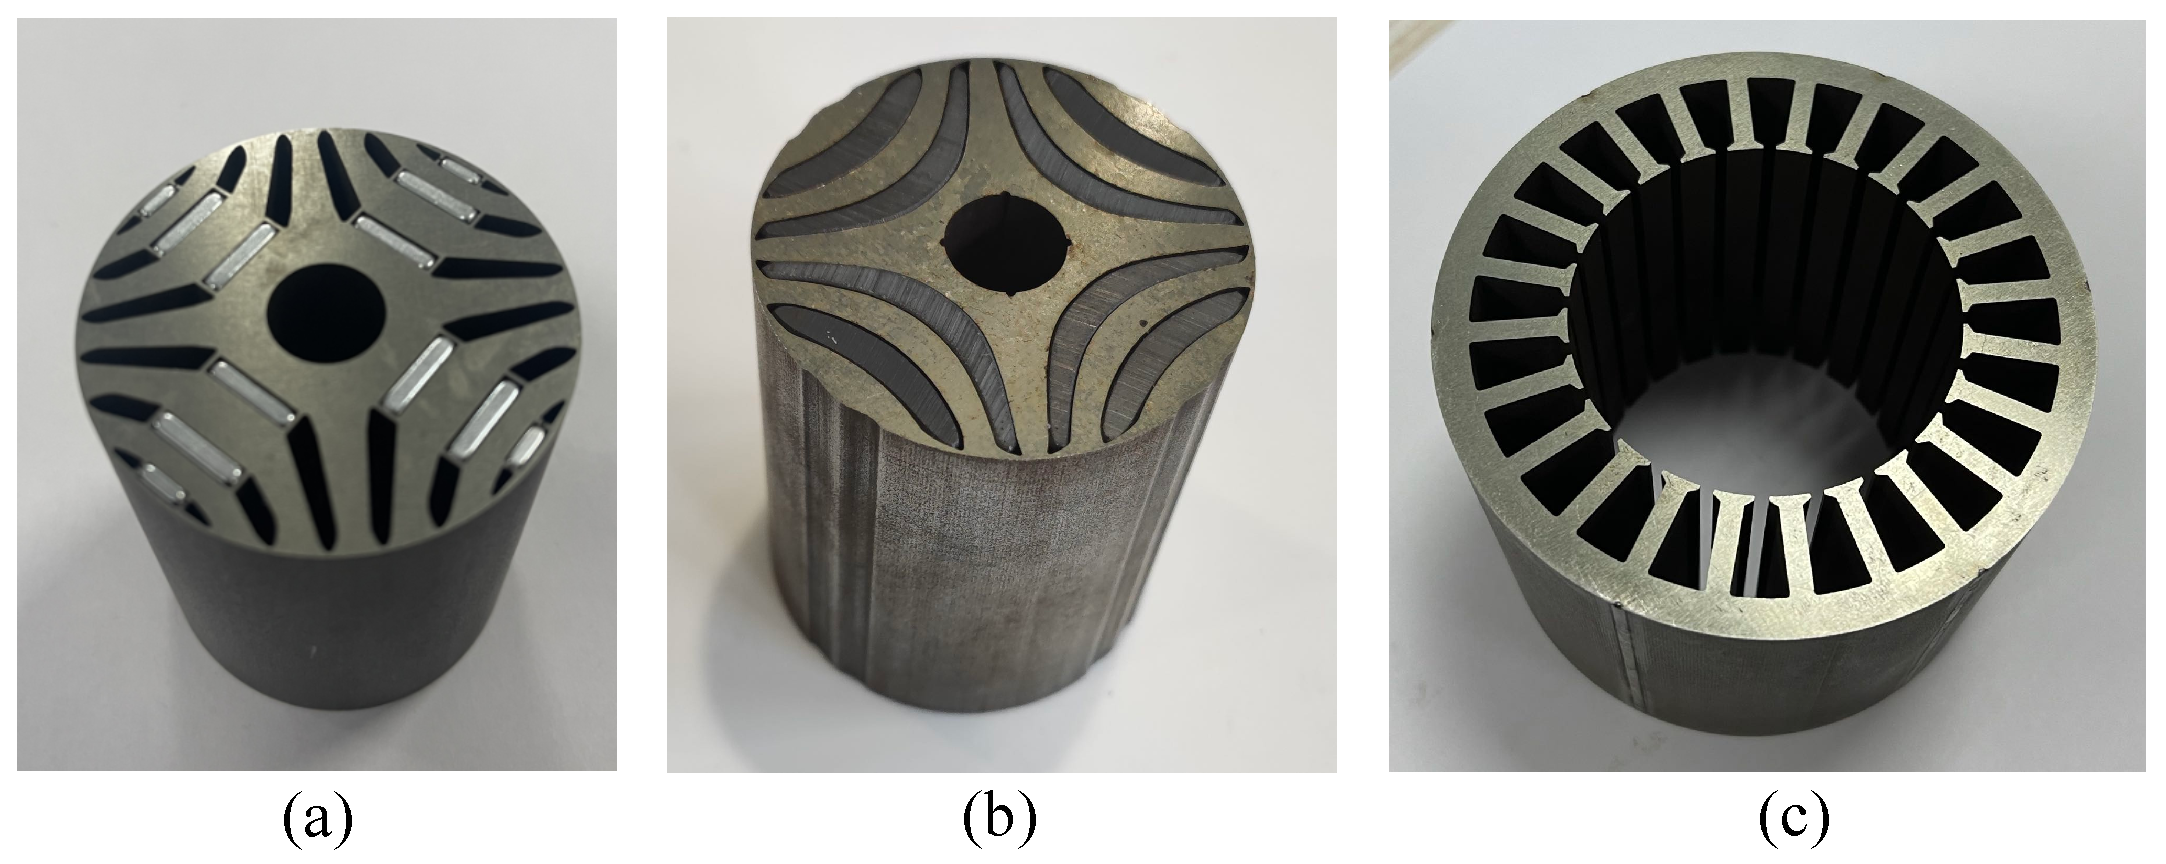
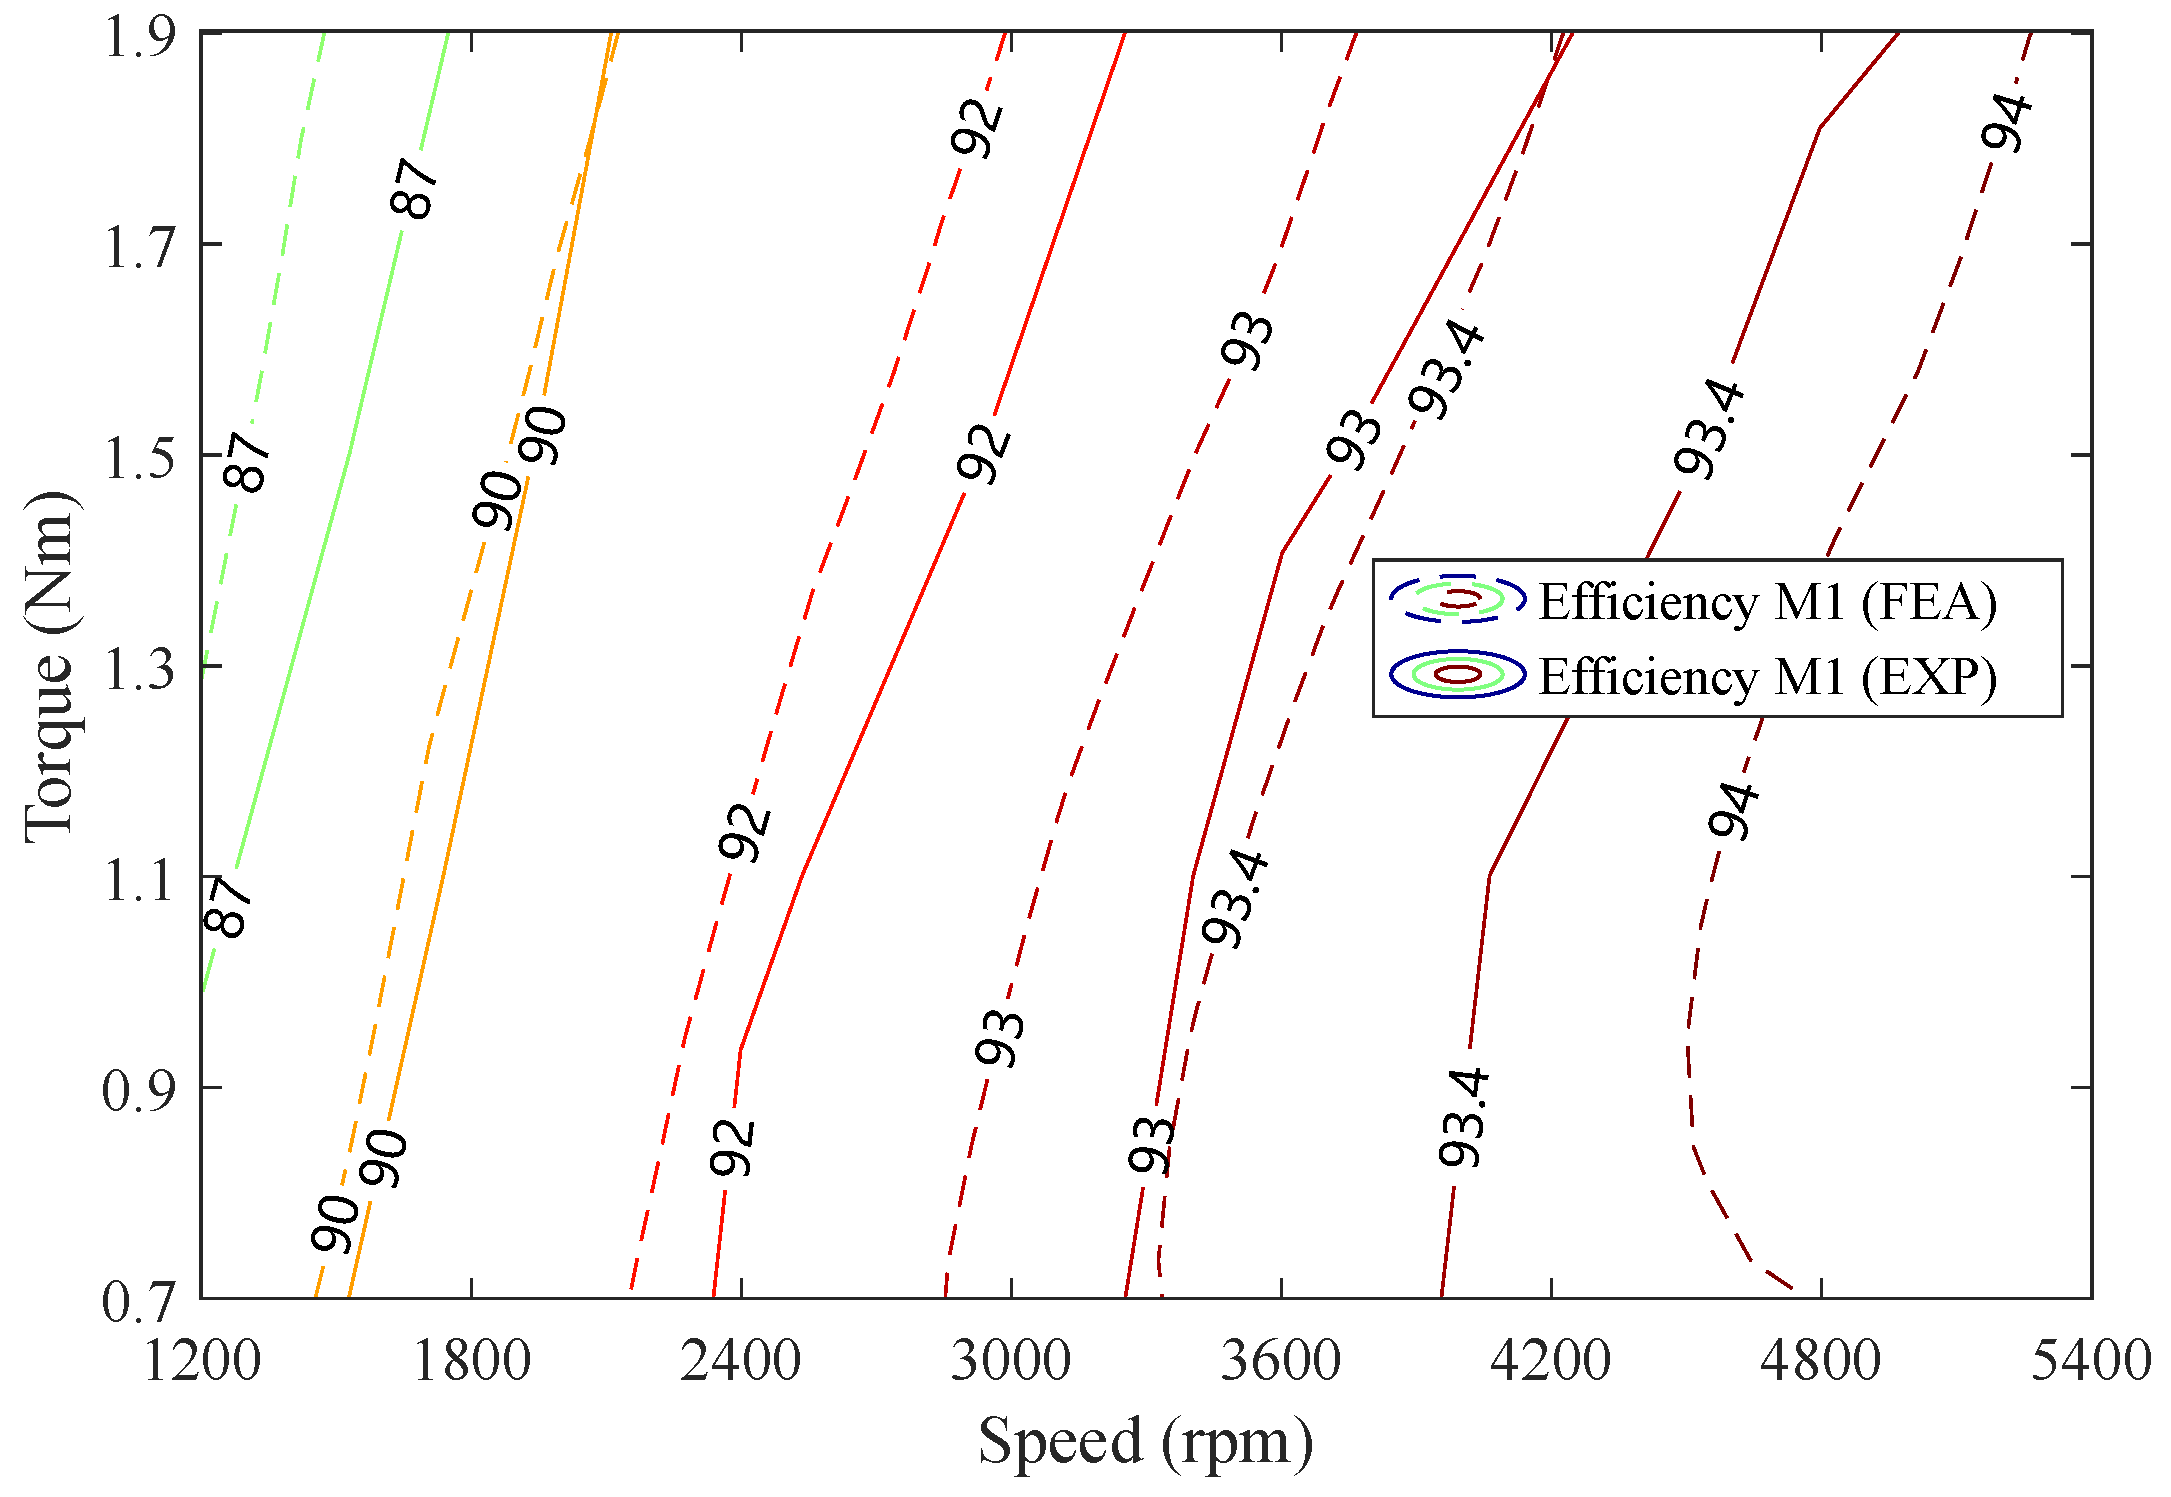
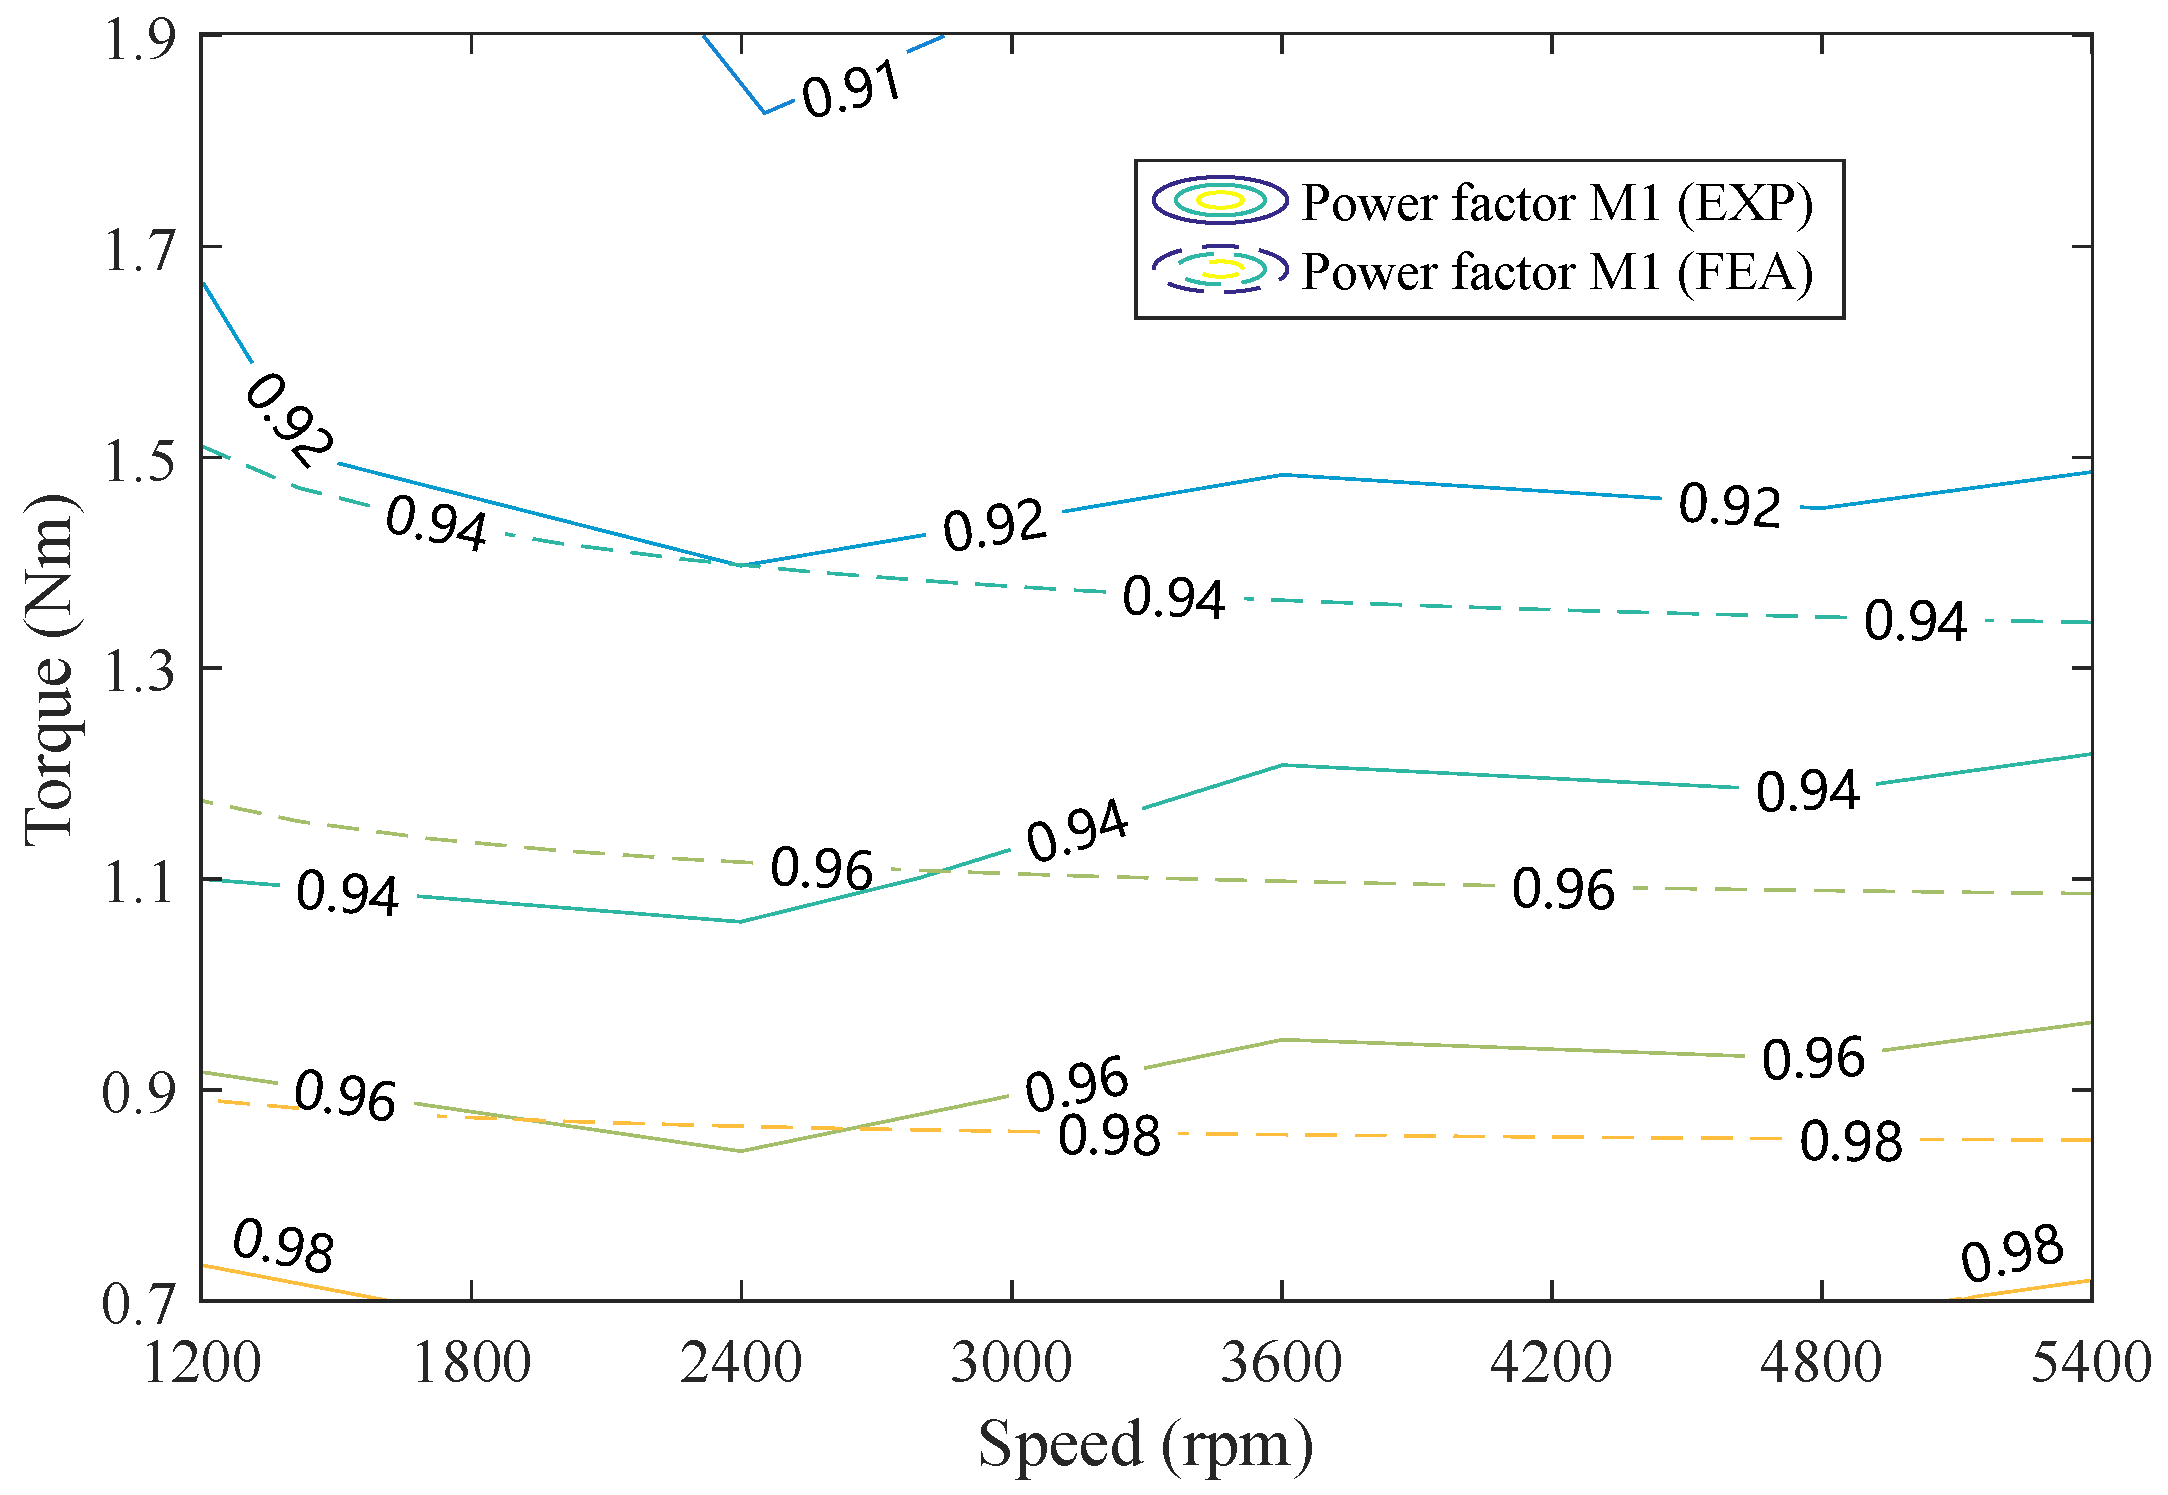
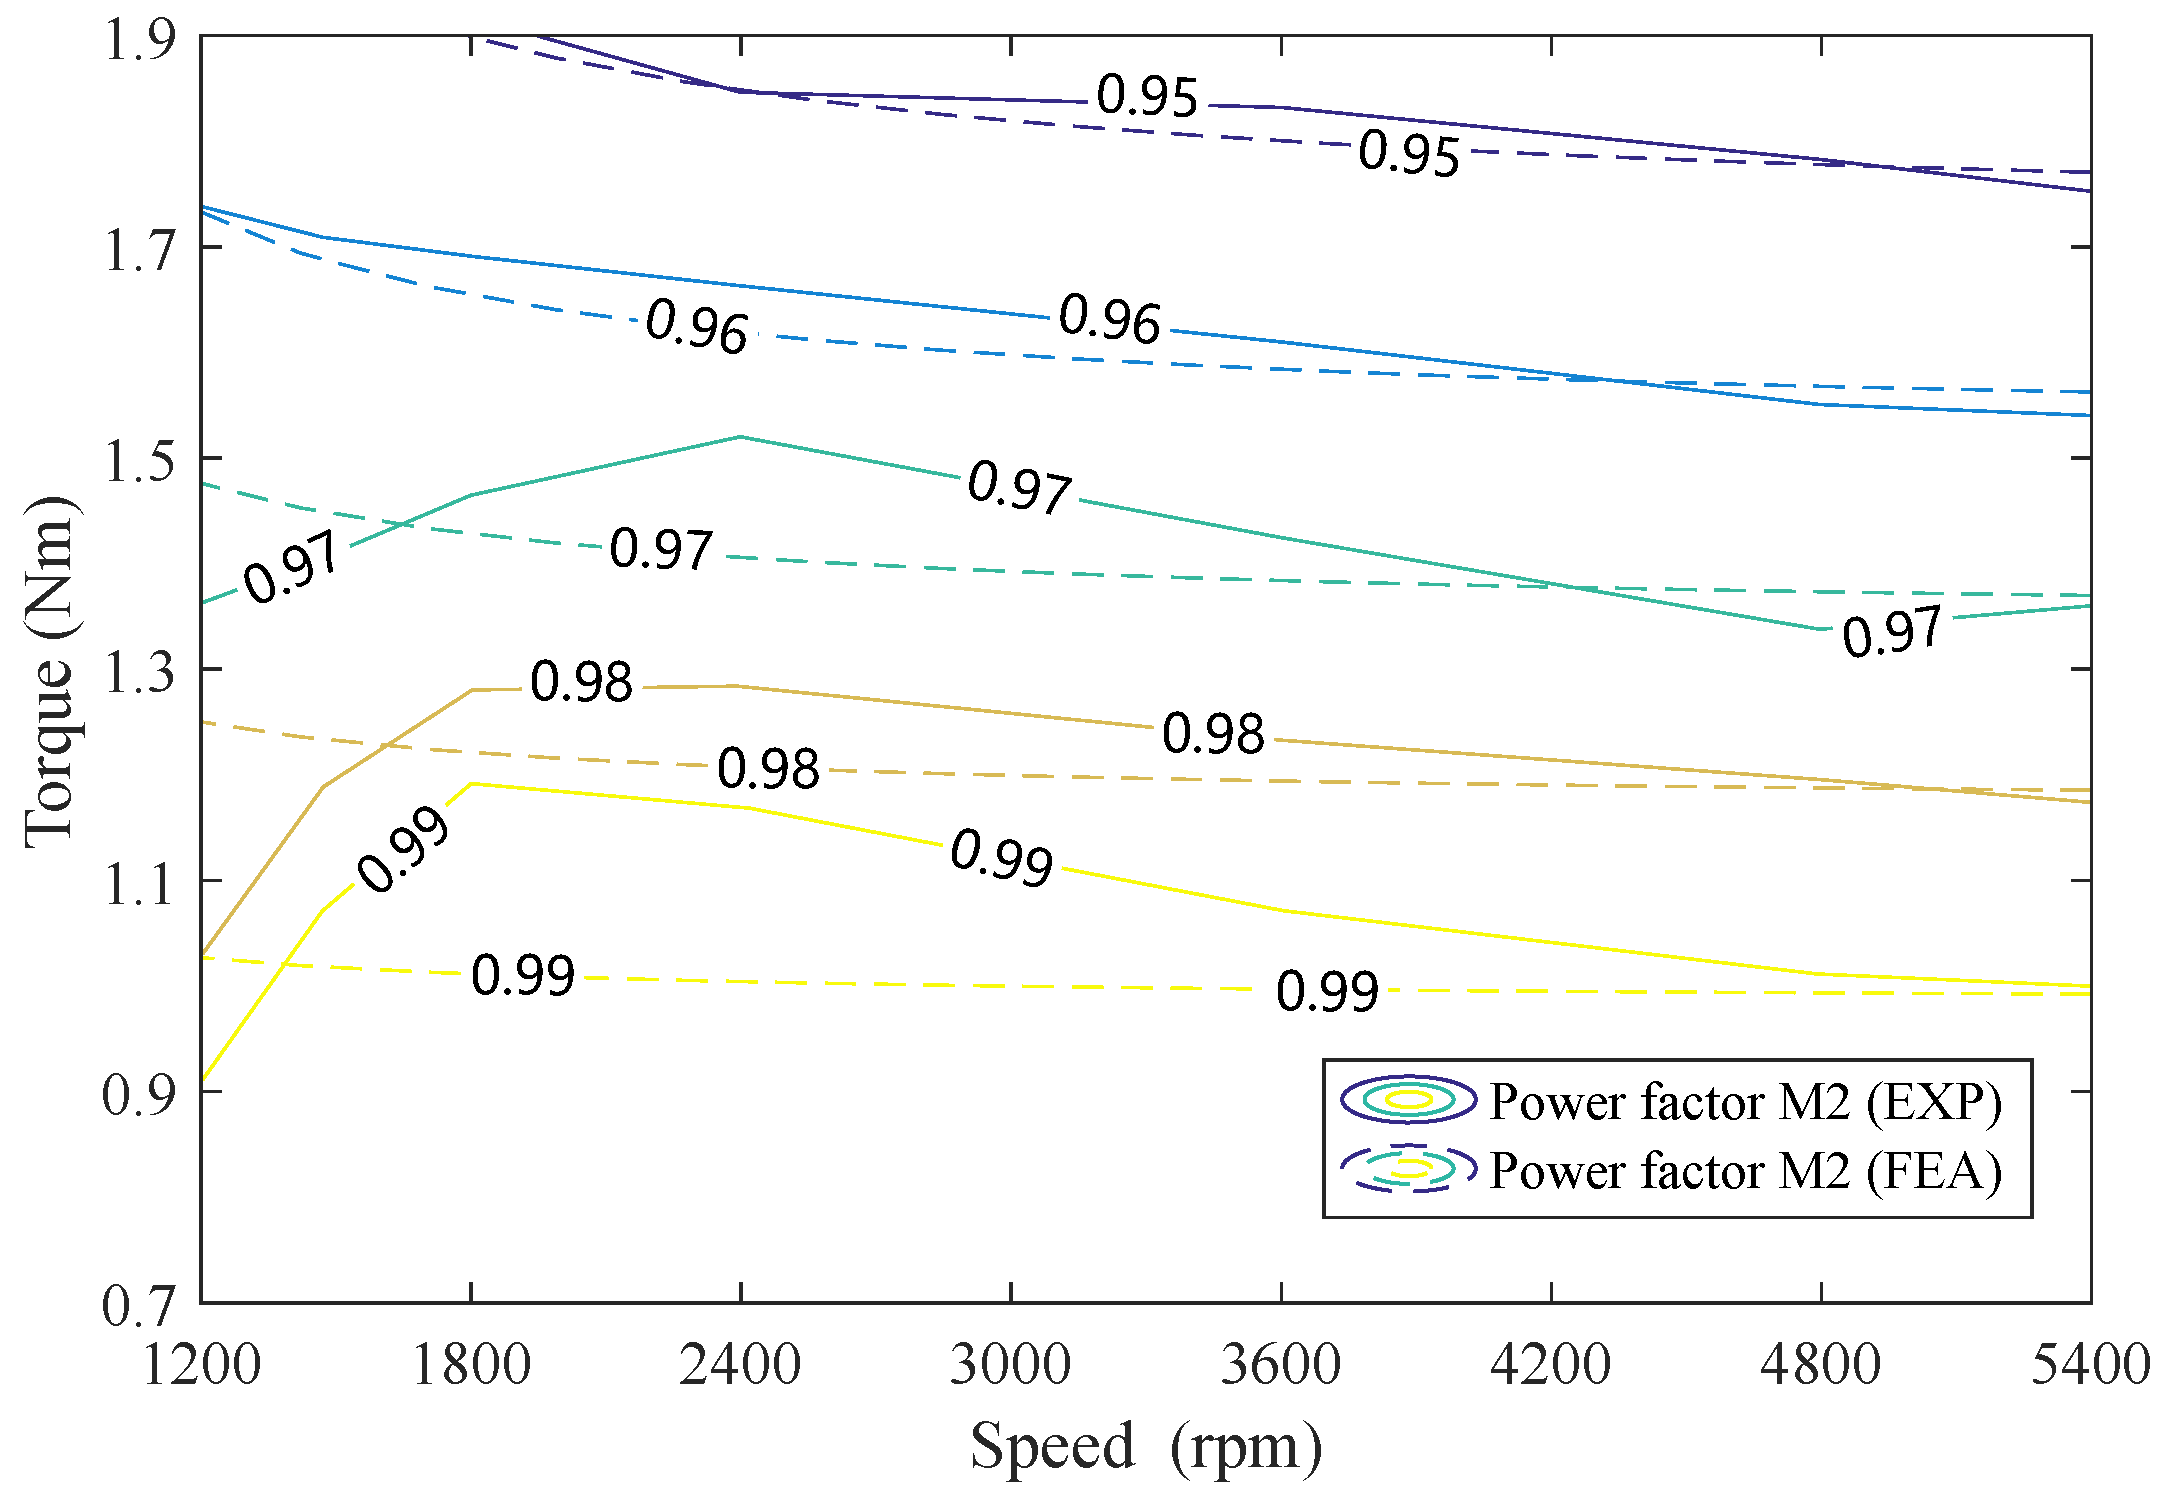
To further improve the motor performance such as power factor and efficiency, the option is either to increase the magnetic torque component or to enhance the reluctance torque component in Equation (
1) so that the motor can exhibit higher overall torque. However, the simple additional insertion of N30H would increase the motor cost. Thus, ferrite is introduced to replace the role of the rare earth PM N30H.
In this section, a ferrite-assisted HP-PMaSynRM M2 is presented, and the exact optimal shape of ferrite to produce the best torque capability is investigated. The motor output results are compared with the conventional M1 in the previous section in order to show the unique advantage of the proposed new HP-PMaSynRM.
3.1. Motor Characterization
In general, M2 shares the same stator, winding configuration, stack length, rotor outer and inner diameters, and iron material with M1. The only difference is ferrite Y-40 is inserted in the rotor barrier in M2 instead of using rare earth PM material N30H in M1.
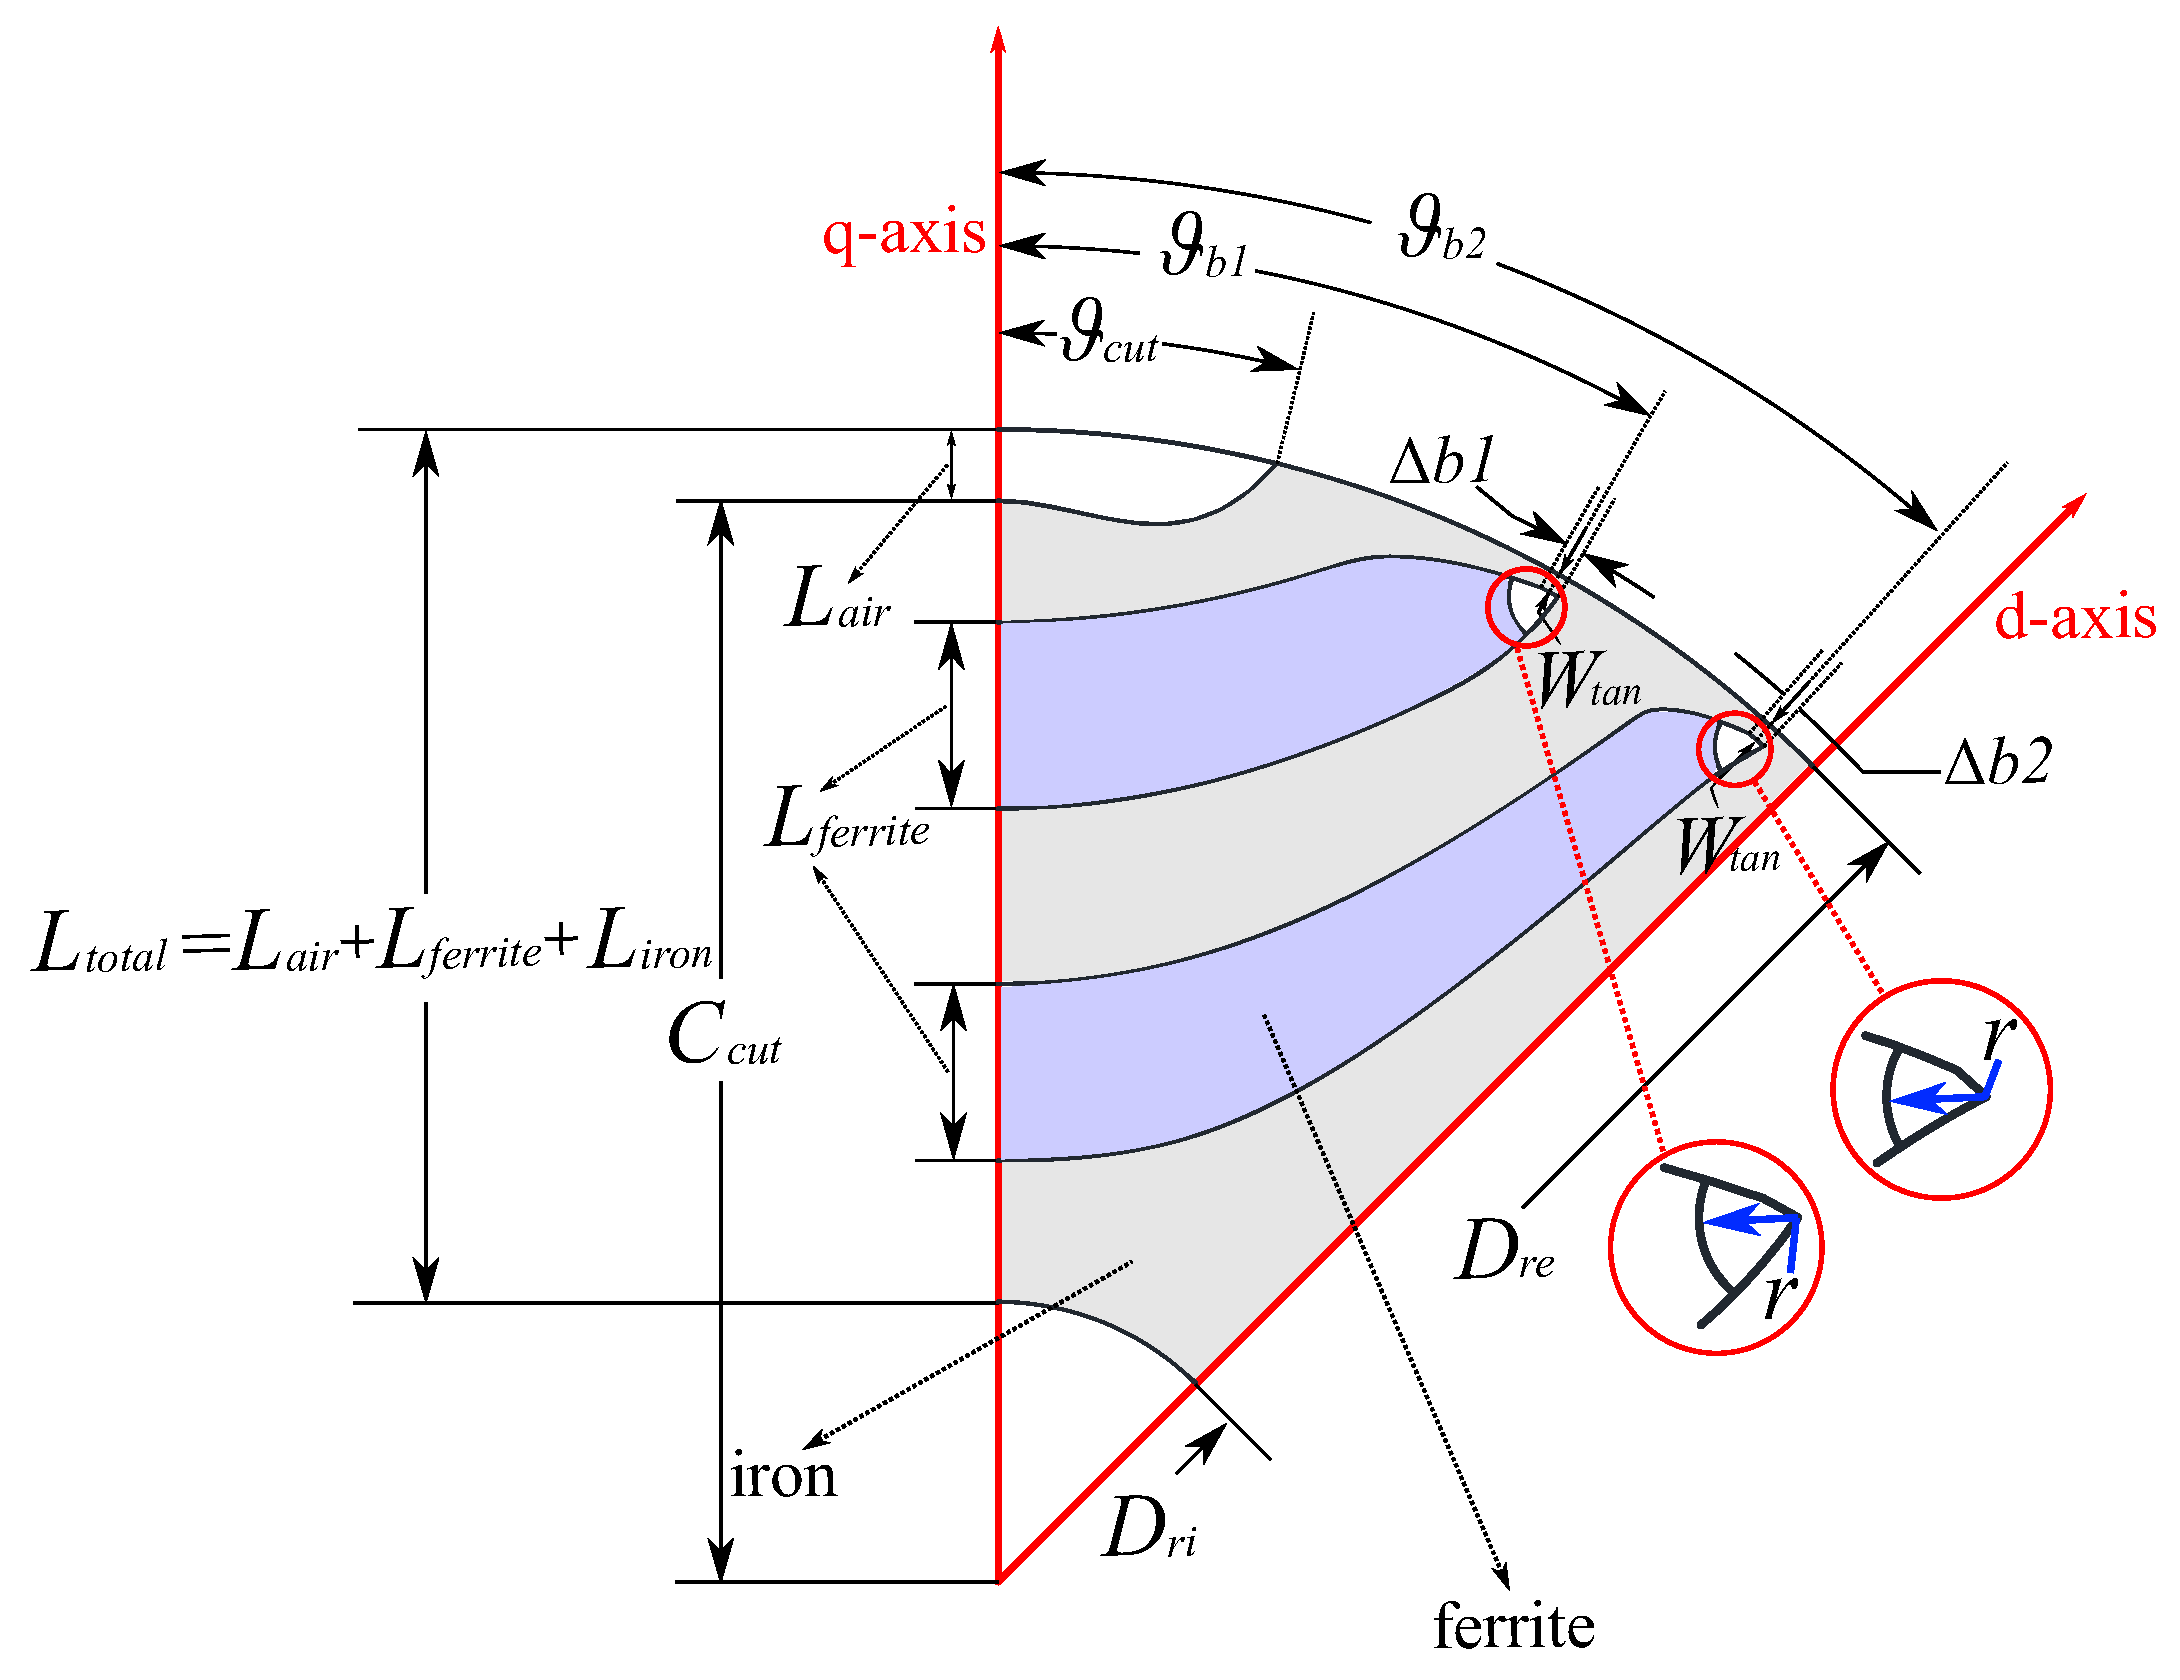
Figure 3 shows half a pole of the M2 rotor. It is characterized by two fluid-shaped flux barriers filled with ferrite magnets. In addition, the M2 rotor also has a cut-off region at the q-axis.
Ferrite in M2 shares the same magnetic flux direction in q-axis. At each flux barrier end of the rotor, there is a small region with air instead of ferrite, which is highlighted in
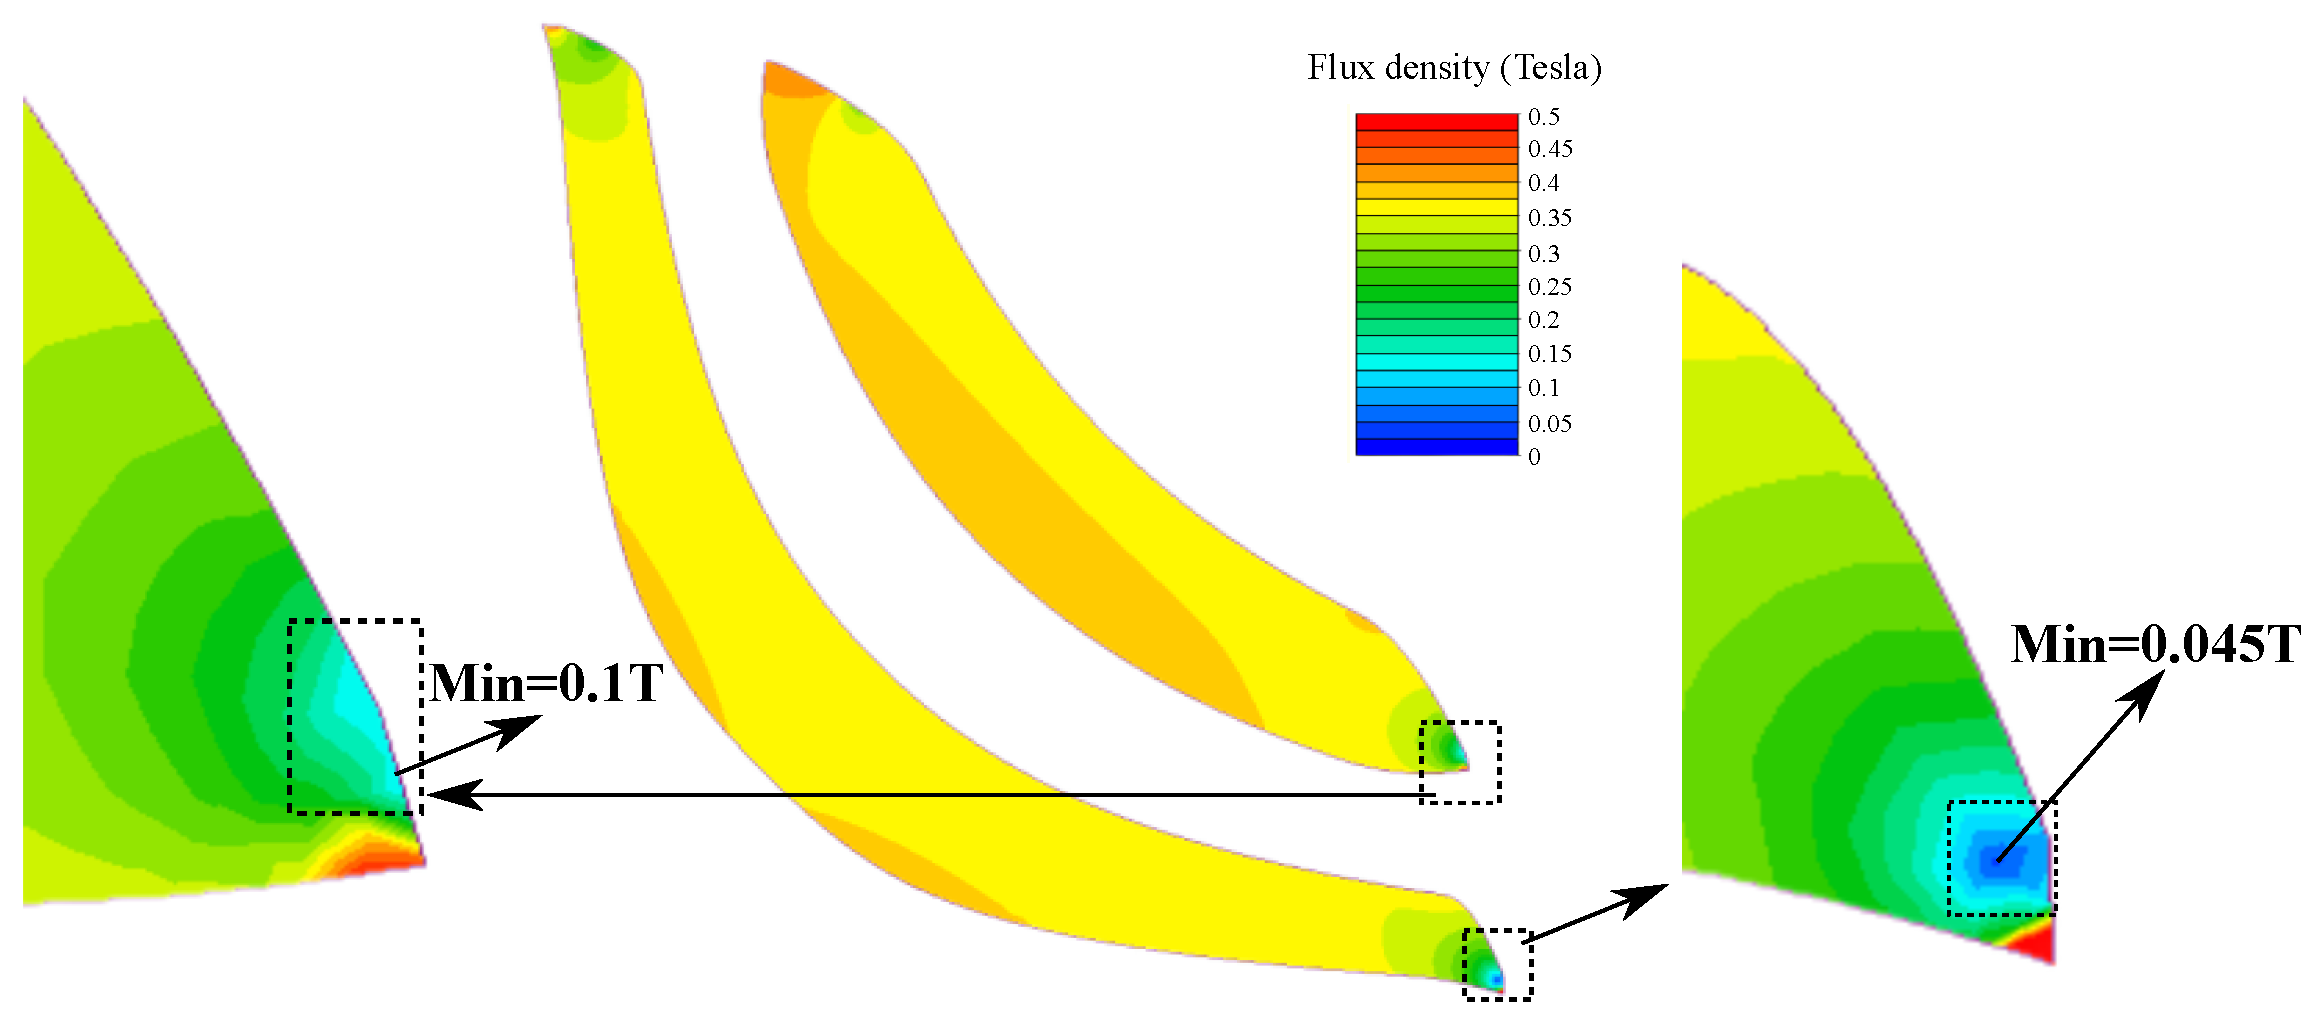
Figure 3. This is mainly for the purpose of avoiding ferrite demagnetization owing to the high saturation level over the tangential rib region. As shown in
Figure 4, the flux density of the ferrite on the barrier end would be below the demagnetization knee value if the air region highlighted in
Figure 3 is not added. However, as illustrated in
Figure 5, the flux density of the ferrite on the barrier end would be safely above the demagnetization knee value according to
Table 2, thanks to the air region. A detailed flux density behavior analysis on the ferrite end during a full electrical cycle is recorded in
Figure 6, showing the minimum value of 0.1789 T, which is above the demagnetization knee value 0.12 T.
The main geometrical parameters considered in
Figure 3 can be summarized below:
and are rotor outer and inner diameters;
and are barrier angles;
is tangential rib thickness;
and are flux barrier end opening angles;
and are ferrite and iron length in q-axis correspondingly, is the total length in q-axis, is the air length in q-axis;
is the length from the center of the cut-off region to the rotor center in q-axis and is the cut-off region angle.
The geometrical dimensions of the M2 rotor in
Figure 3 are summarized in
Table 3, where the parameters with * are optimized values through a MOGA-II genetic algorithm optimization via ModeFrontier [
33]. The method has been well established in [
15]. The two objectives are to minimize the torque ripple and to maximize the average torque in order to have the best torque quality. Since PMaSynRM is originally derived from SynRM, it is logical to define a
representing the insulation level in the q-axis since ferrite has nearly the same permeability as air [
34].
in
Table 3 is defined in Equation (
2) as
As shown in the M2 rotor in
Figure 3, the edges of the two ferrite filled flux barriers are drawn on the basis of the N. E. Joukowski air potential function [
35], which is an applied mathematical model to describe ‘natural flux’. The method was first proposed in [
36], indicating that by applying ‘natural flux’-shaped barriers, reluctance torque could be produced to the maximum extent. The center of each arc lies on the q-axis due to rotor symmetry. Moreover, a cut-off region is introduced in M2. The cut-off curve is modified by a cubic function dominated by two the independent parameters
and
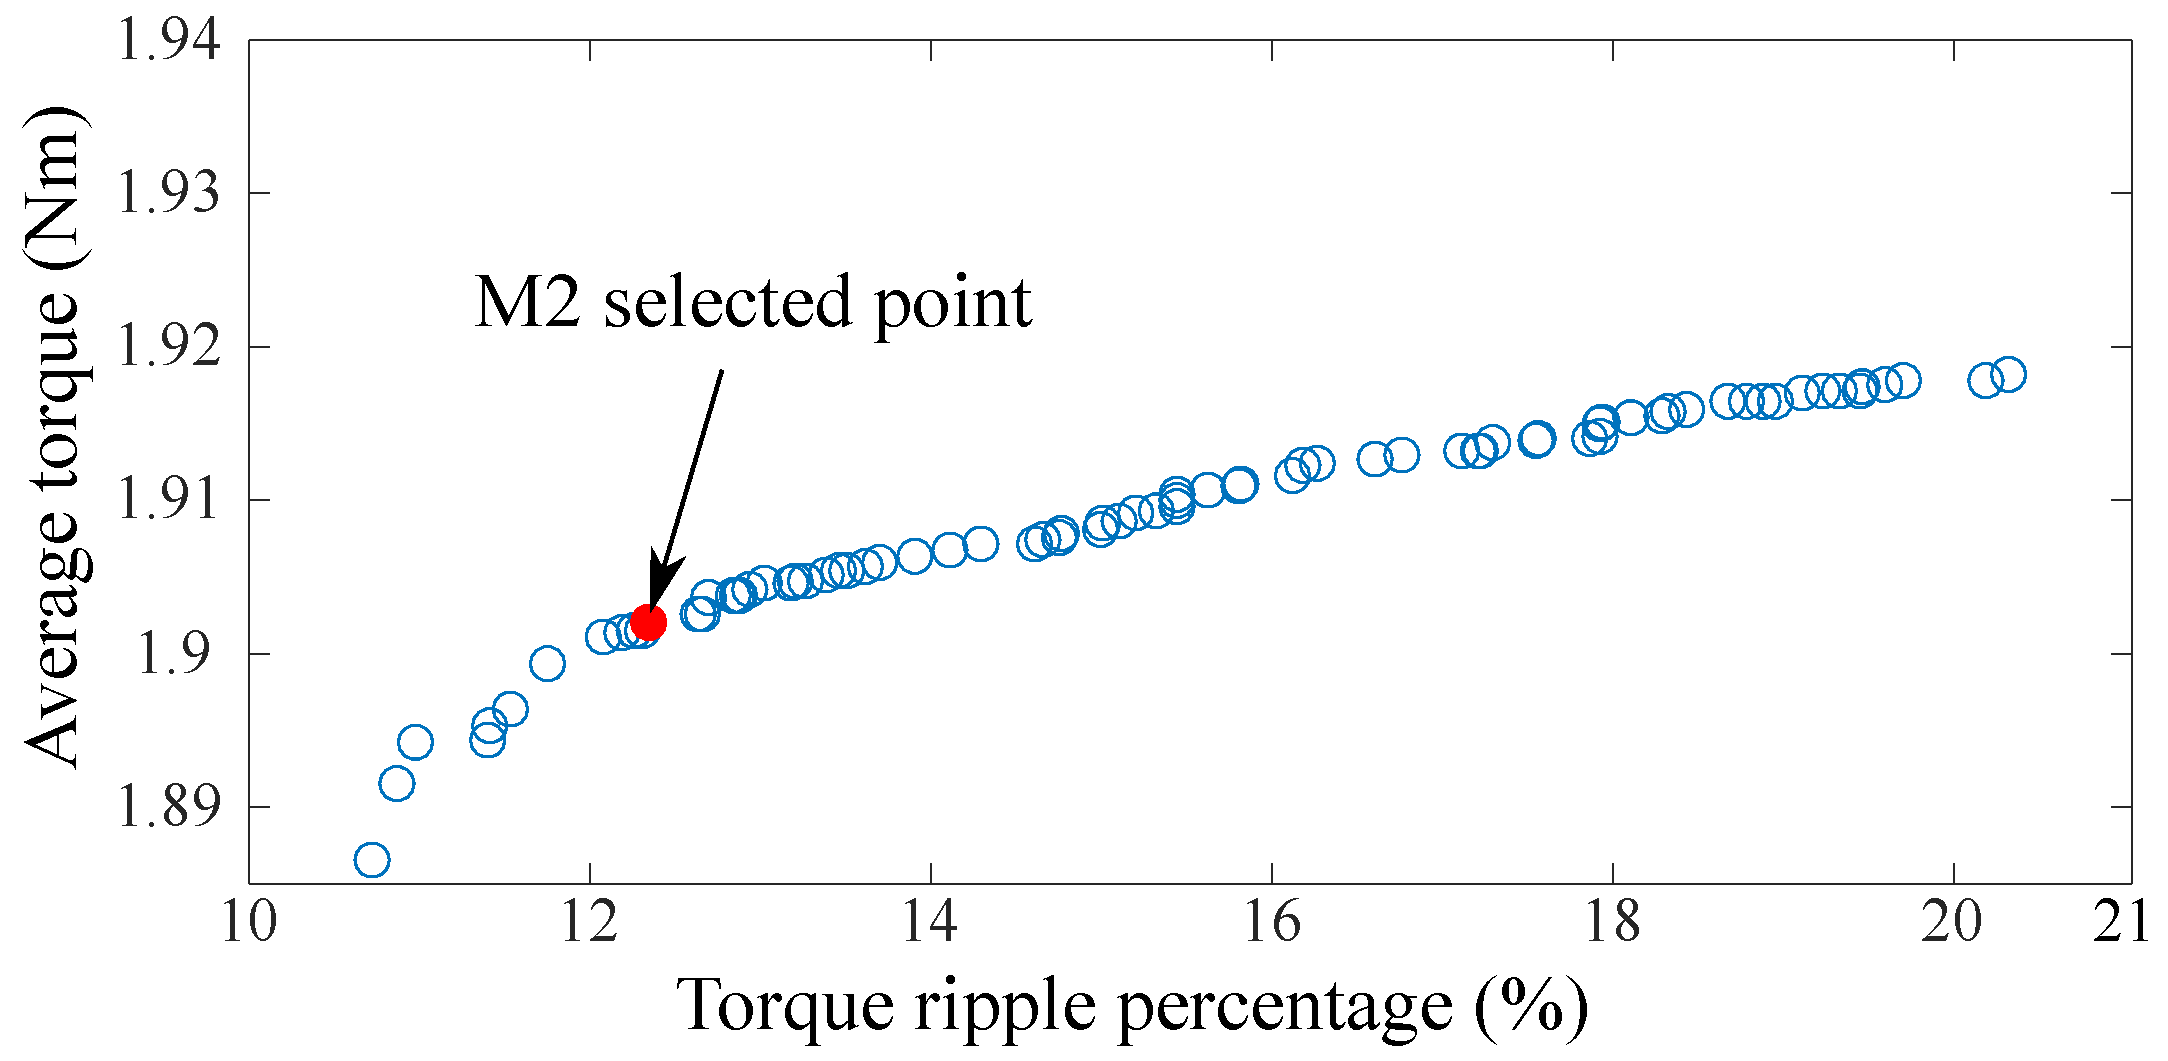
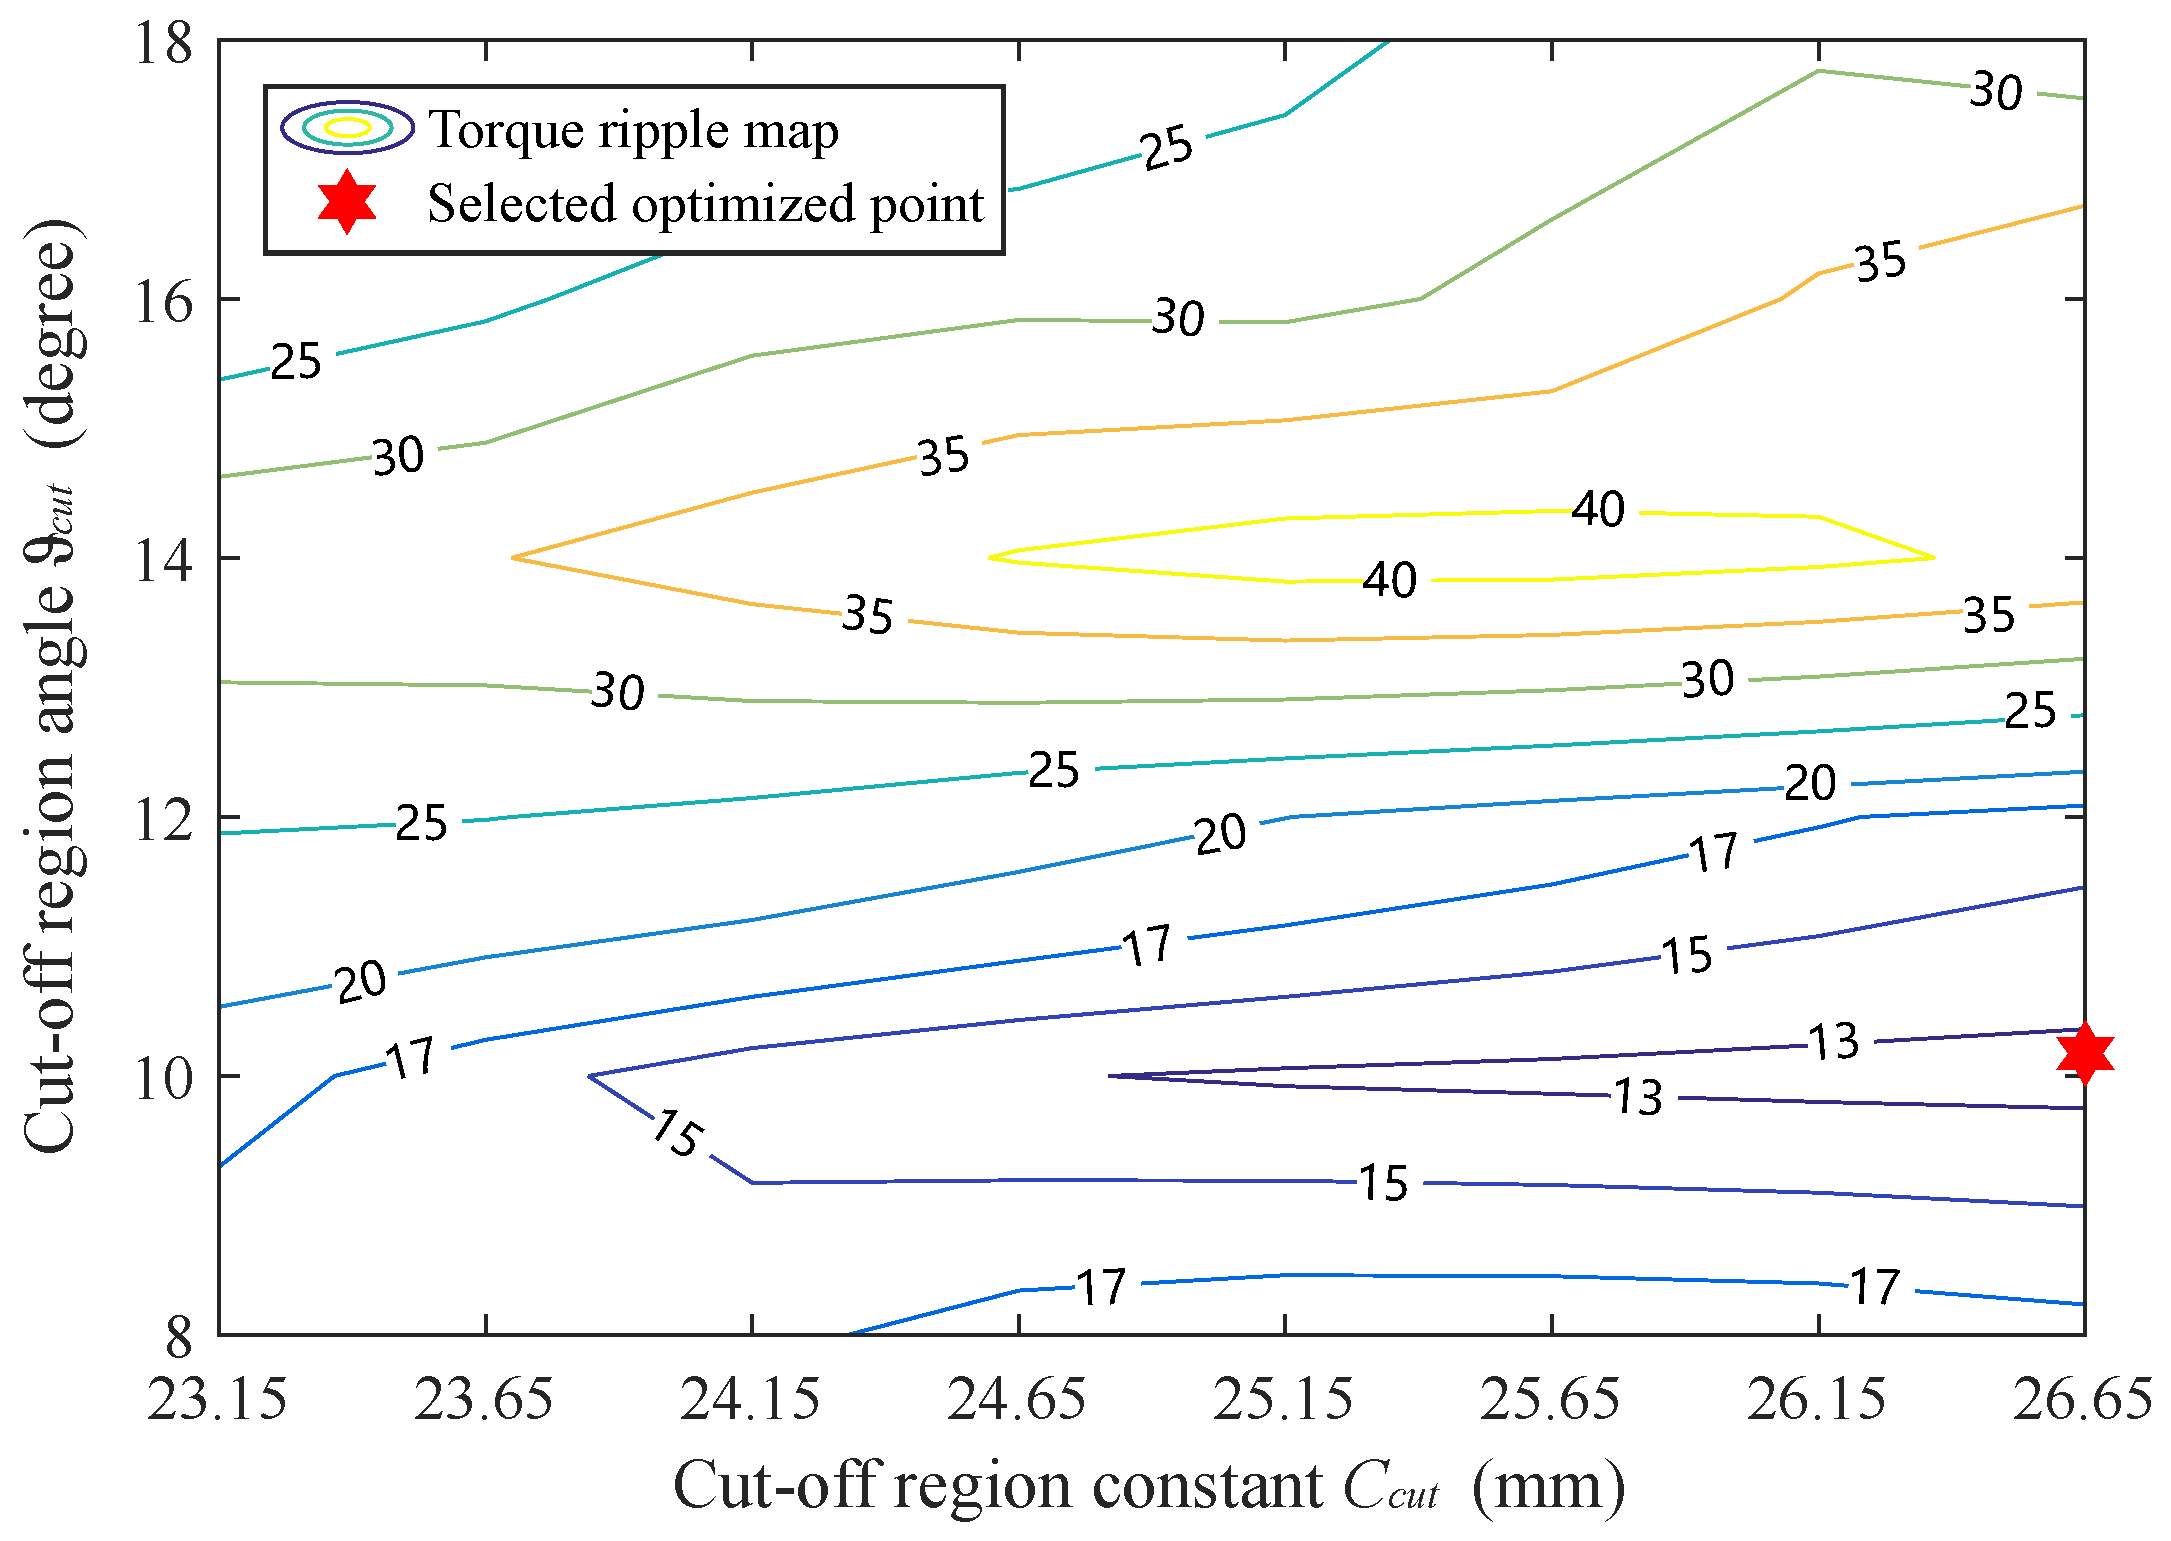
. The purpose of setting this cut-off region is to acquire a desired saturation level in the iron region around the cut-off, in which way the motor would produce a minimized torque ripple. The Pareto front solutions of M2 are shown in
Figure 7. The solutions are all recorded under MTPA (Maximum Torque Per Ampere) mode with the same rated phase current of 3.26 Arms. Among the Pareto front solutions, the final solution is selected, as marked in
Figure 7.
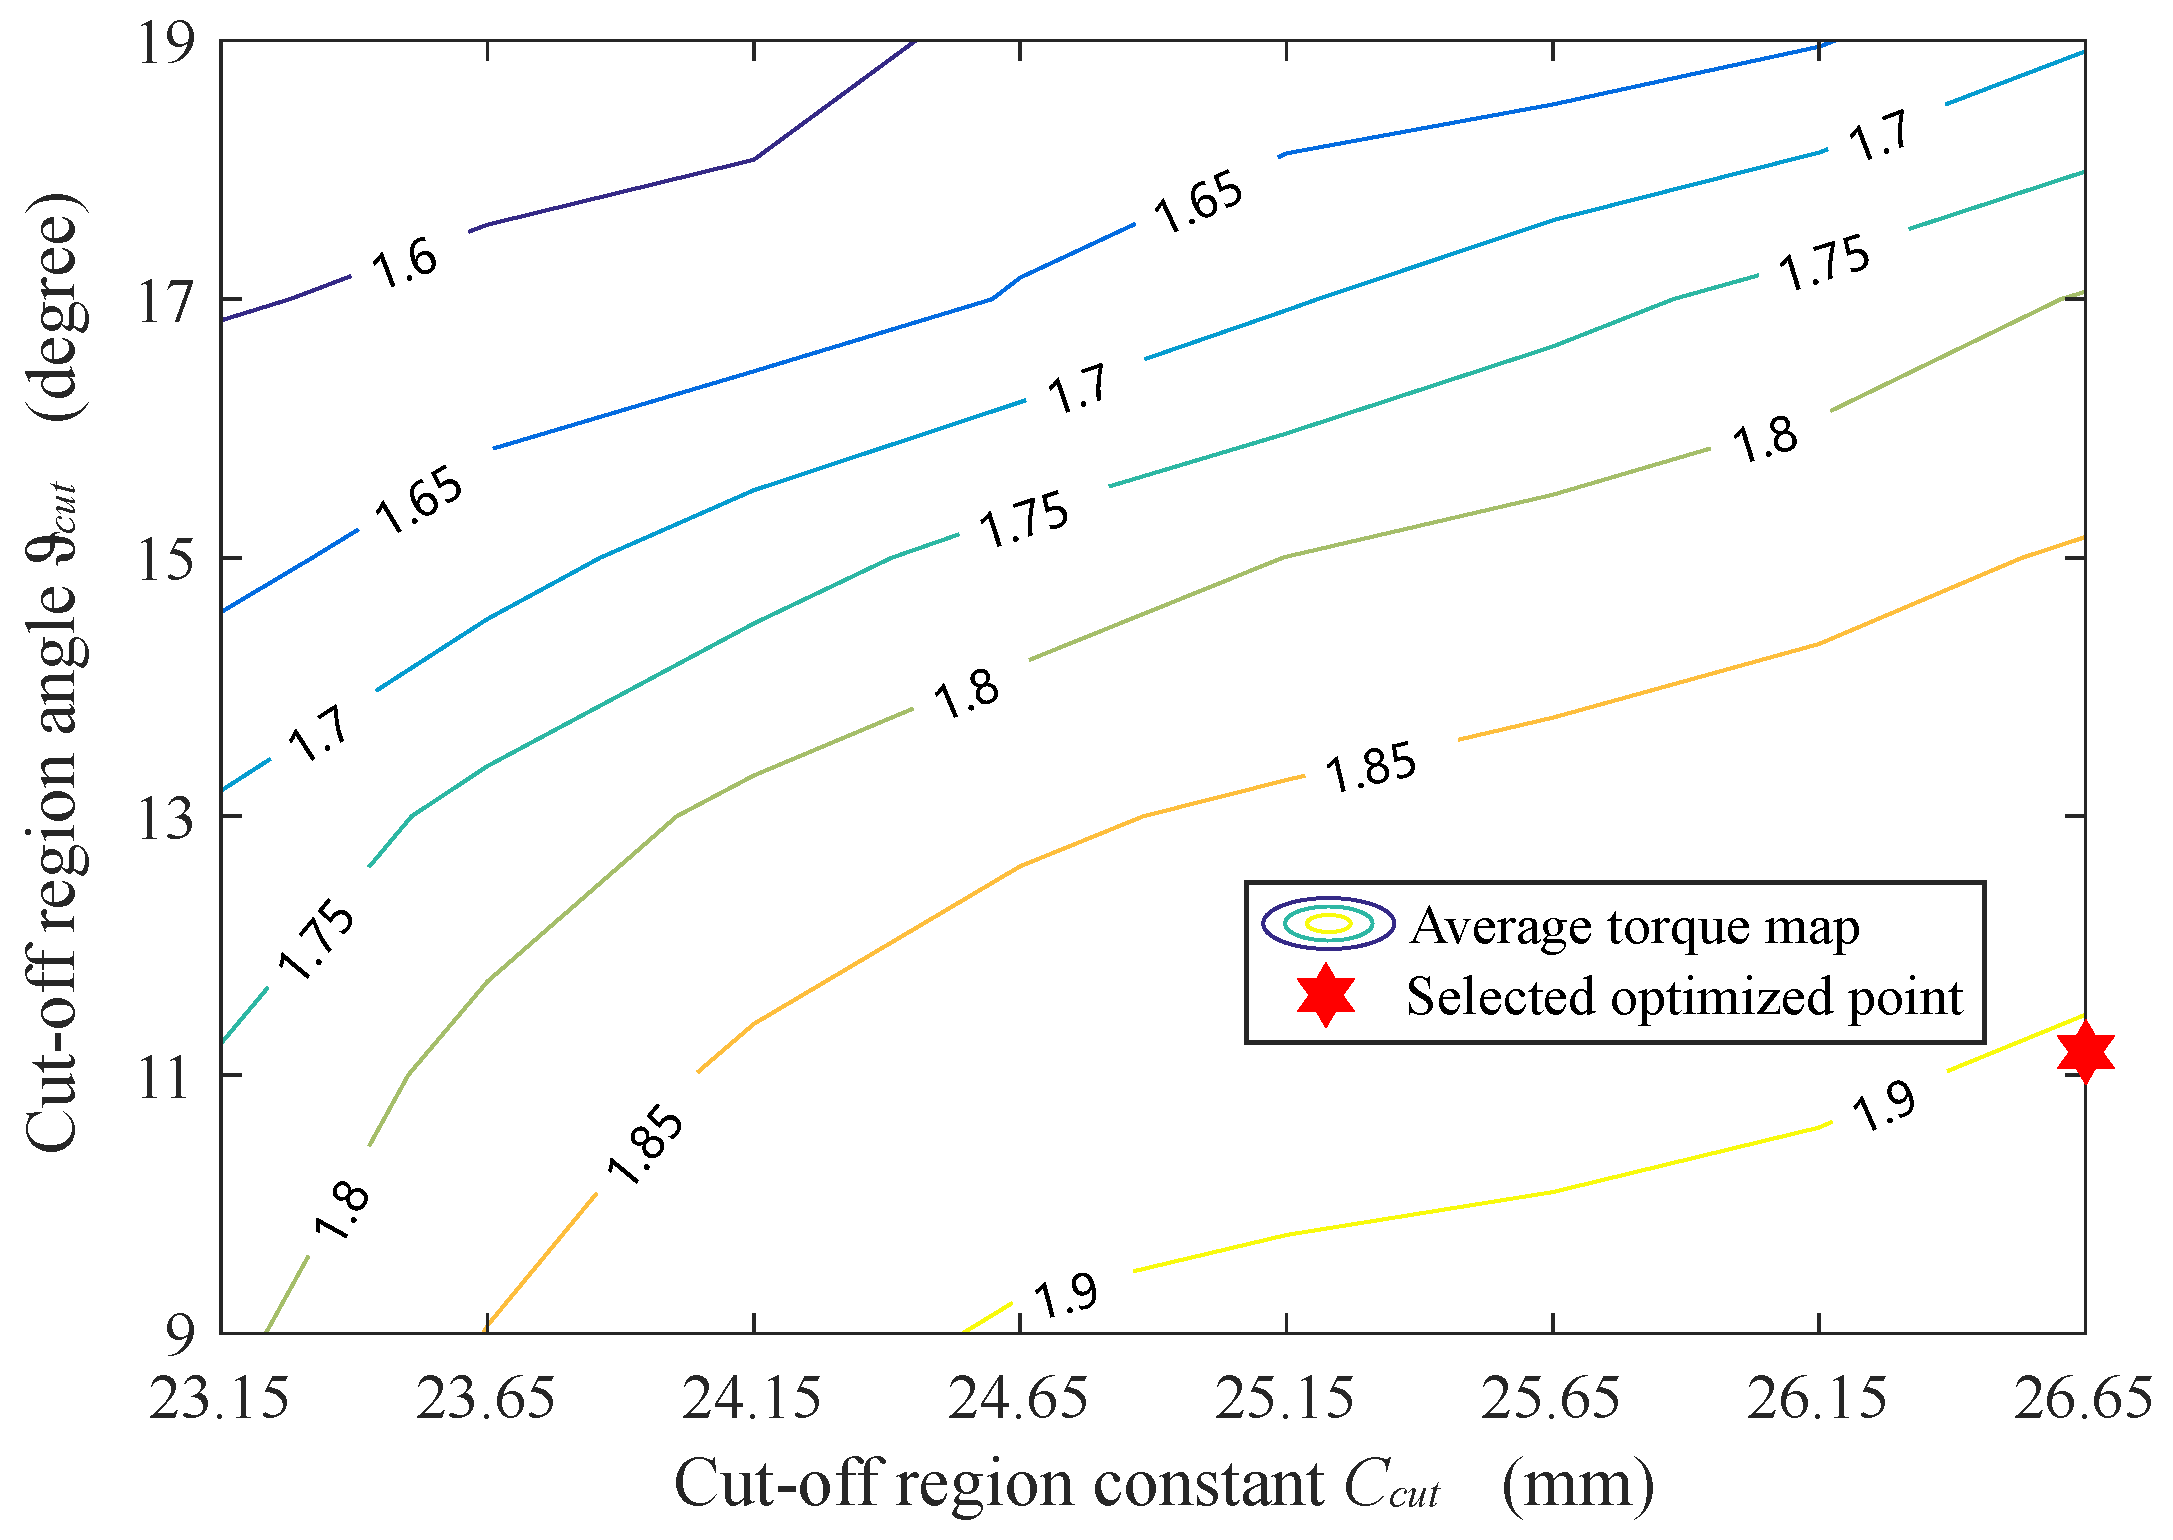
Figure 8 and
Figure 9 elaborate the sensitivity analysis of torque ripple from the cut-off region constant
and the cut-off region angle
. As shown in
Figure 8, the variations of
and
give different effects on the torque ripple. Starting from the selected optimized point with
26.6 mm and
11.15 degrees, further decrease in
would increase the torque ripple from the optimized 12.34% to around 18% and further decrease or increase in
would increase the torque ripple. It is worth noticing that the maximum torque ripple over 40% occurs with
at around 25.5 mm and
at around 14 degrees, which is over three times larger than the optimized torque ripple value at 12.34%. The influence of
and
on average torque is presented in
Figure 9. It can be seen that the average torque is not as sensitive to
and
as torque ripple. Although further decrease in
from the optimized 11.15 degrees to 9 degrees would increase the average torque value from 1.907 Nm to 1.915 Nm, it results in an over 17% torque ripple, which is not preferred. To conclude, the above analysis confirms the importance of selecting suitable cut-off region parameters in order to reduce the torque ripple.
In the next section, the M2 solution is compared and analyzed in detail with respect to the reference M1 regarding average torque, torque ripple, efficiency, etc.
3.2. M1 and M2 Performance and Cost Comparison
In this section, M1 and M2 mentioned in the previous sections are selected for comparison.
Both motors are simulated under the same phase current at 3.26 Arms by means of FE software MagNet (version 2019.1.0.33). The torque results under MTPA mode are shown in
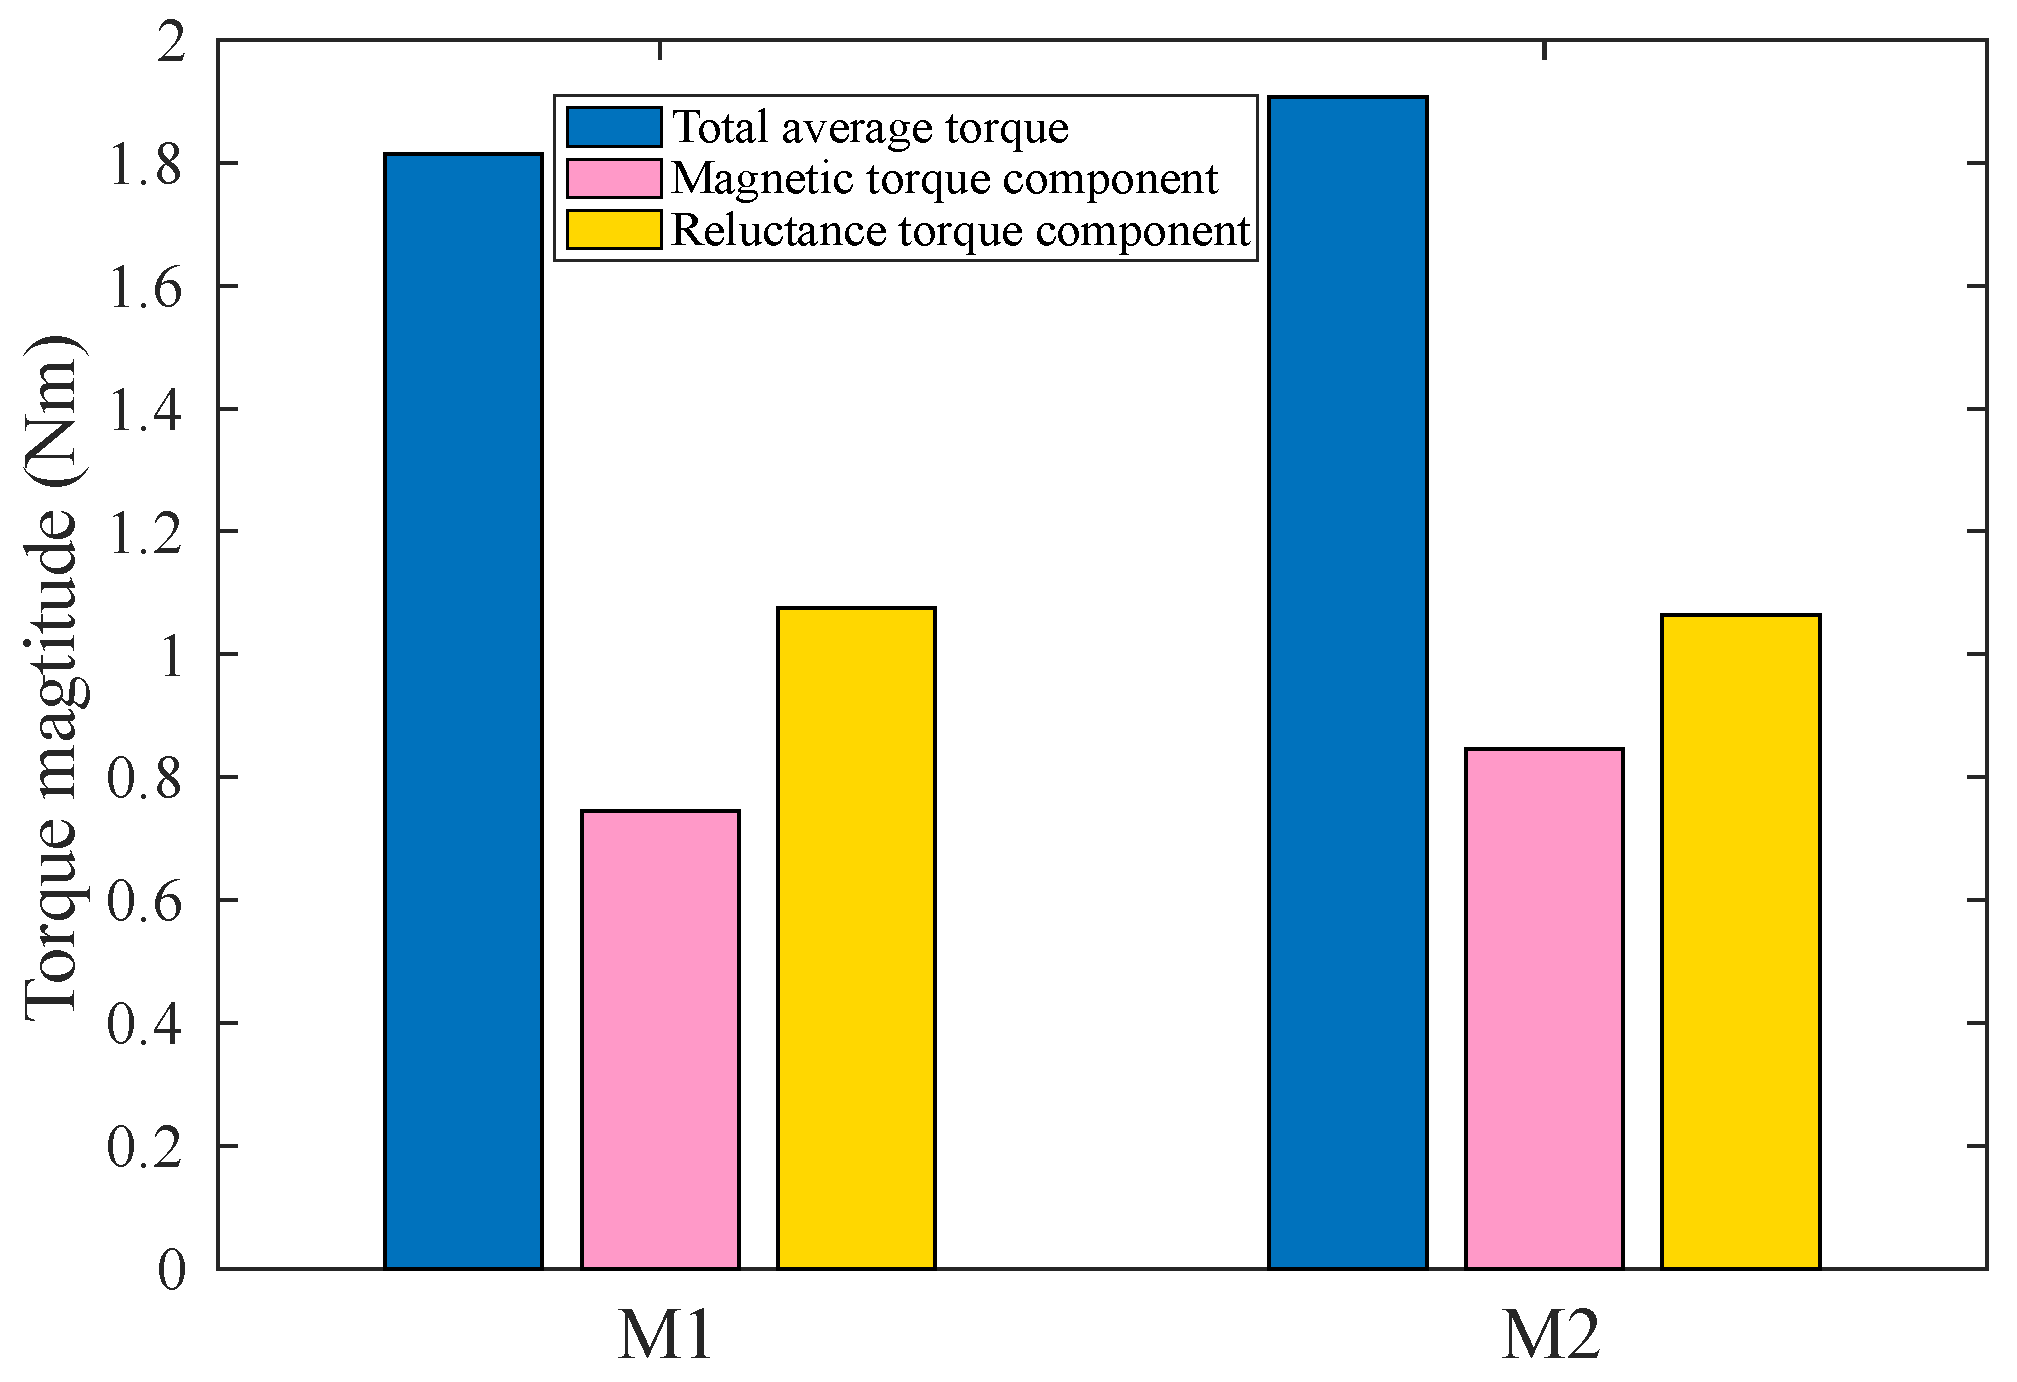
Figure 10. It can be noted that M2 with the insertion of ferrite in a particular flux barrier shape can contribute more average torque compared with M1 with rare earth PM.
The exact torque component values are reported in
Table 4. As shown in
Table 4, the magnetic torque component is increased by 13.15% in M2 compared with M1. Even though the reluctance torque component is decreased very little by 0.56% in M2, the total average torque is improved from 1.815 Nm in M1 by 5.07% to 1.907 Nm in M2, thanks to the increase in the magnetic torque component. It is interesting to notice that both reluctance torque and magnetic torque contribute in relatively the same order of magnitude in M1 and M2.
It has been clearly shown in
Figure 10 and
Table 4 that M2 with ferrite in fluid barrier shape can produce more average torque due to the additional magnetic torque component. Therefore, it is necessary to conclude the exact motor performance of the two motors at a rated condition considering other evaluations such as efficiency and power factor. The performance results of M1 and M2 at a rated condition are summarized in
Table 5, and rotor material cost results are listed in
Table 6. It can be noticed from
Table 5 that iron loss in M1 and M2 has insignificant difference, and the total loss is mainly determined by the copper loss. To summarize, it is clearly indicated that M2 presents the following benefits:
The phase current is reduced by about 4.12% in M2 compared with 3.4 Arms in M1.
The power factor is improved from the original 0.925 in M1 to 0.944 in M2. The increase is about 2.05%.
Copper loss in M2 is reduced compared with M1, thanks to the lower current, which contributes to the eventual efficiency improvement from 94.04% in M1, by 0.23% to 94.27% in M2.
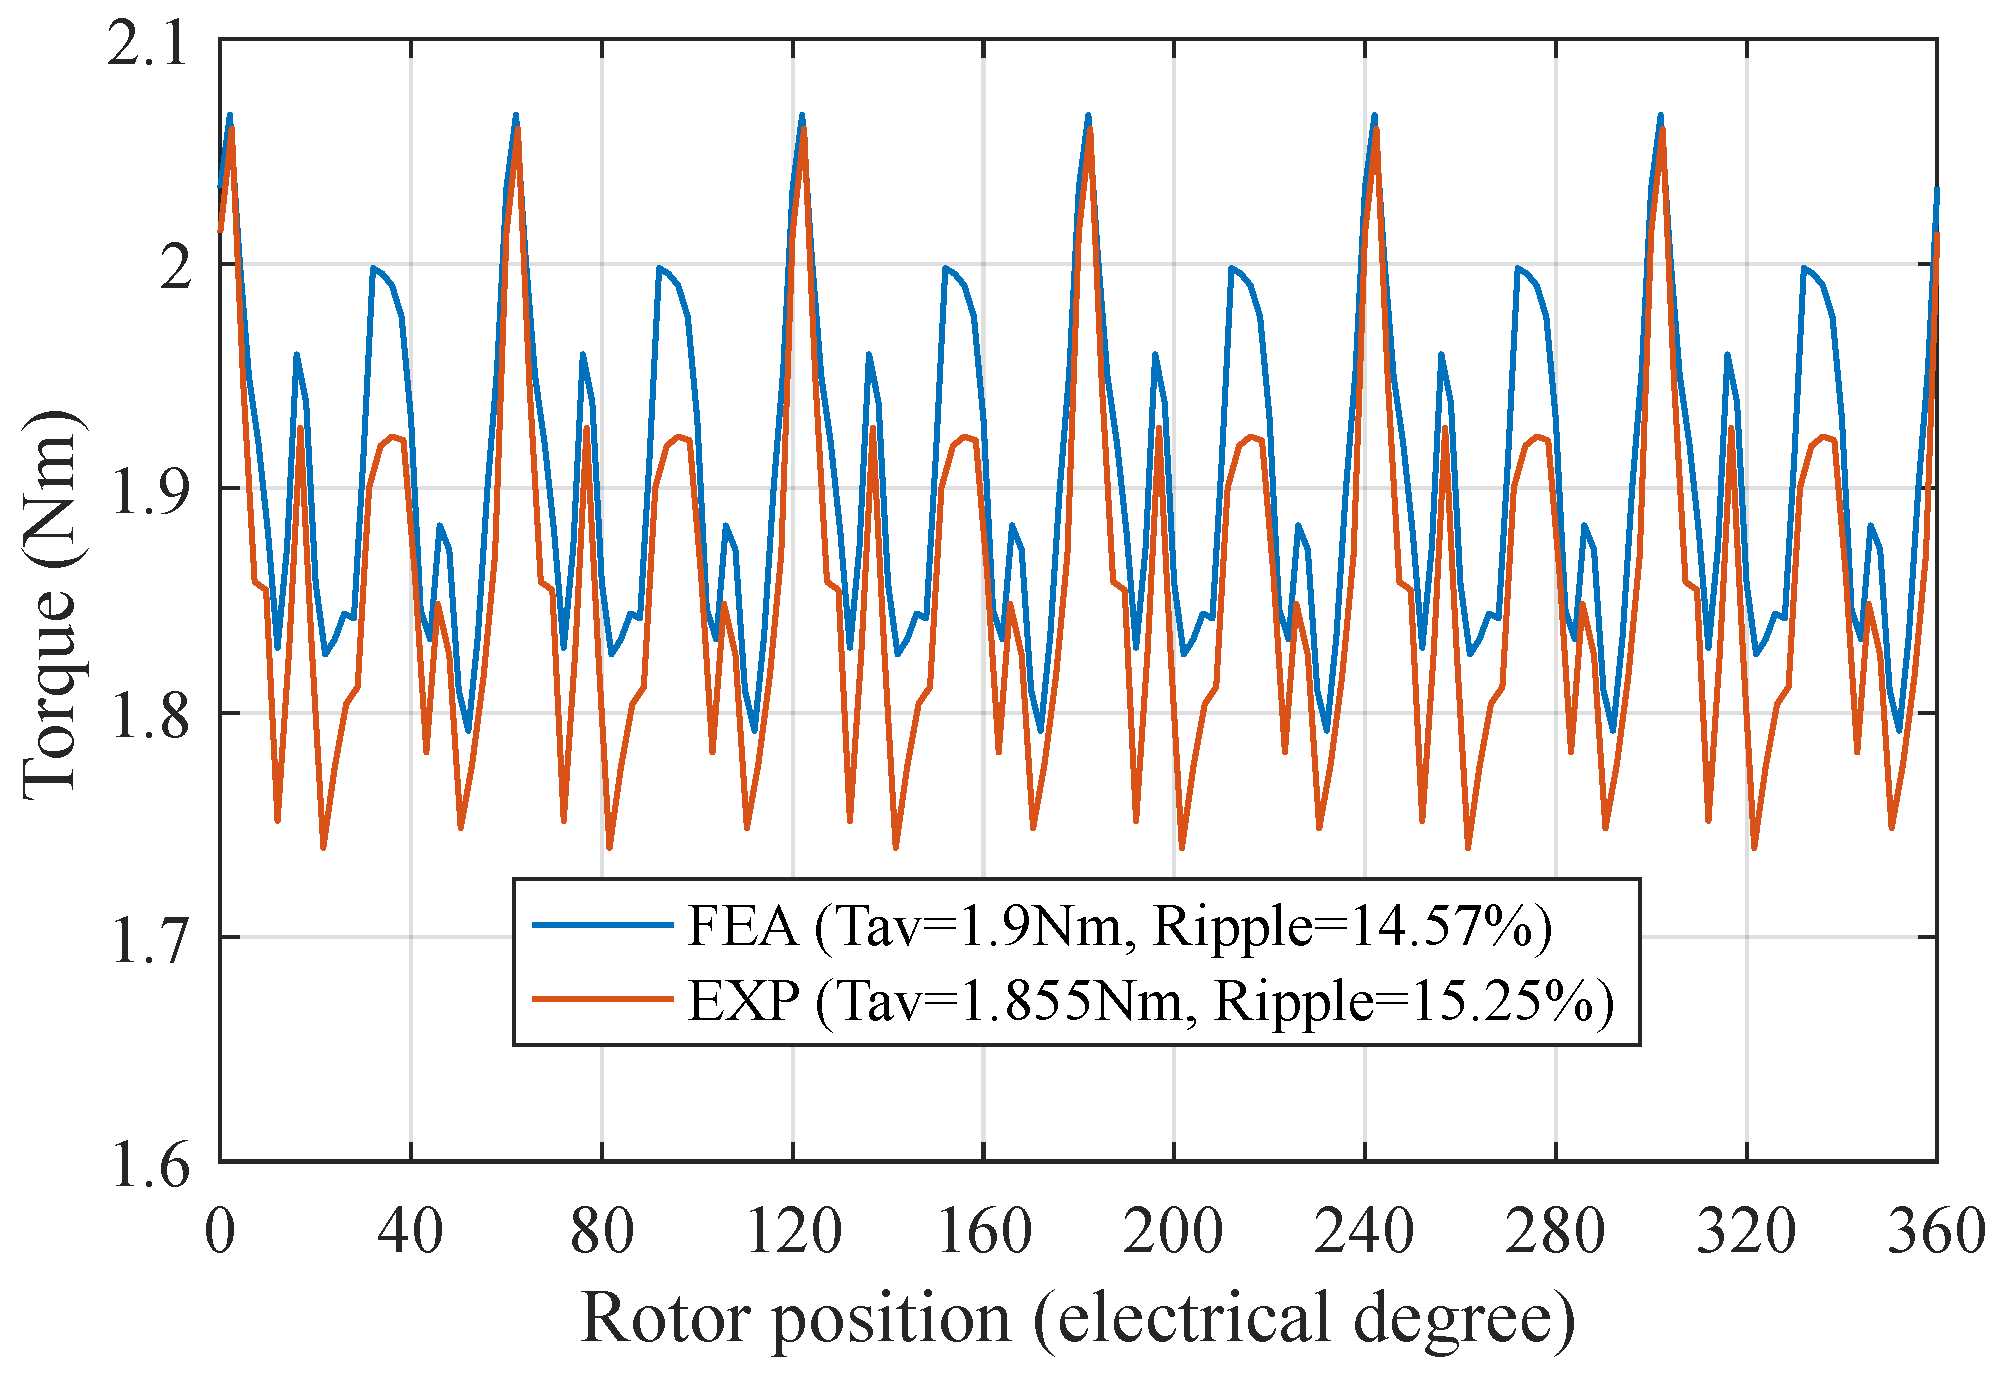
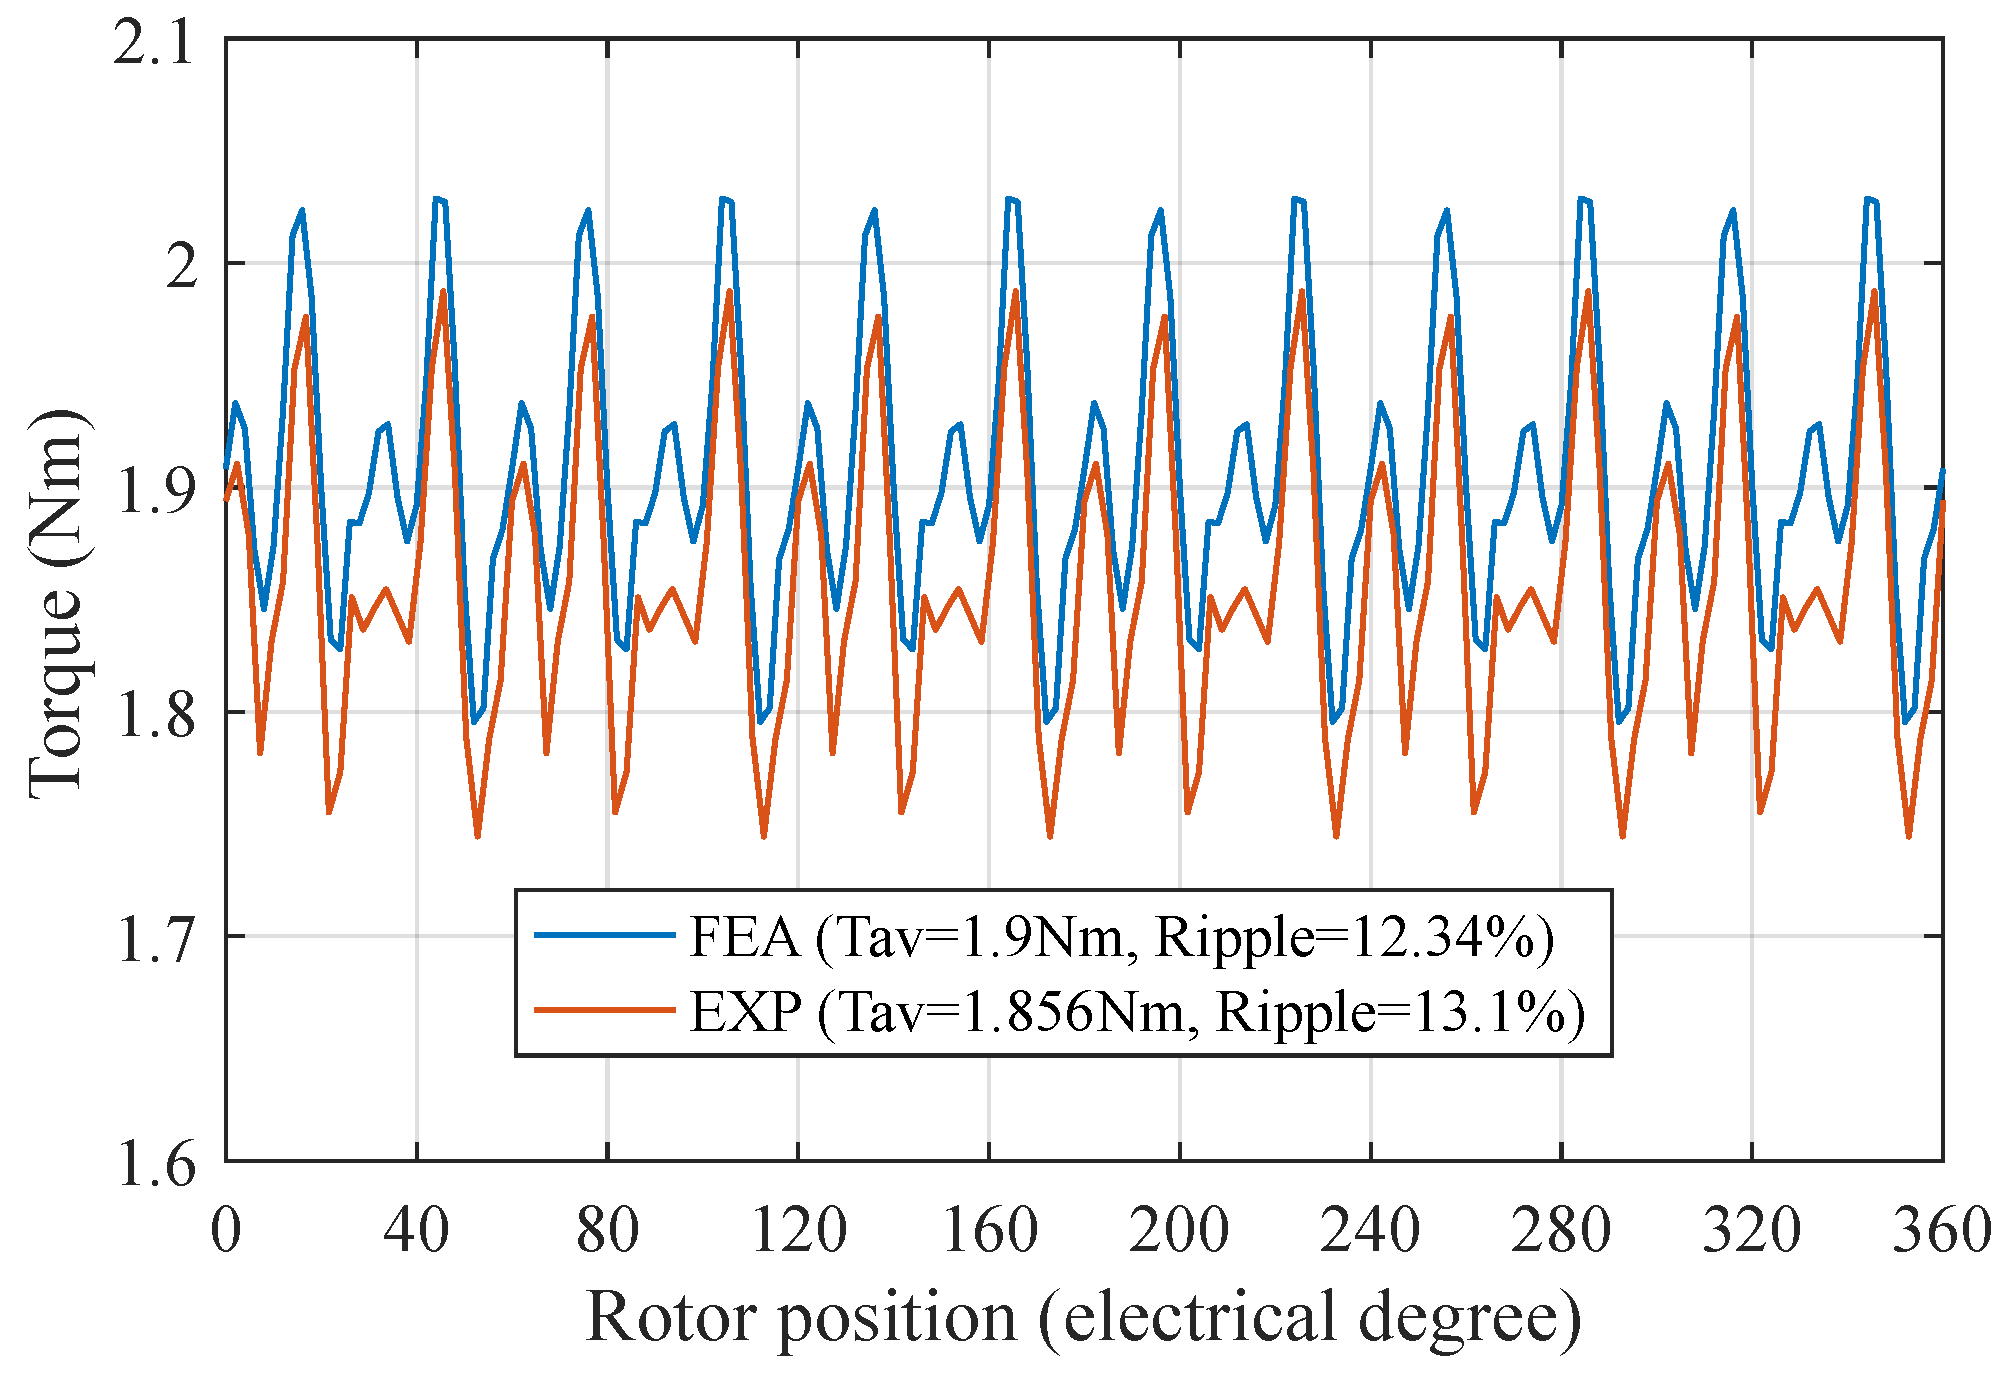
M2 has the lower torque pulsation of 12.34% compared with 14.57% in M1.
The PM cost of M2 is reduced to only 35.6% of M1, thanks to the remarkably cheaper price of ferrite Y-40 compared with rare earth PM N30H. Meanwhile, rotor iron cost is decreased by about 14.7% in M2. Generally, the rotor material cost of M2 is reduced by 59.6% compared with M1, which is an obvious price advantage.
Table 4.
Torque component data under phase current at 3.26 Arms in MTPA.
Table 4.
Torque component data under phase current at 3.26 Arms in MTPA.
| Torque | M1 | M2 | Unit |
|---|
| Total average torque | 1.815 | 1.907 | Nm |
| Improvement | - | +5.07 | % |
| Reluctance torque | 1.07 | 1.064 | Nm |
| Improvement | - | −0.56 | % |
| Magnetic torque | 0.745 | 0.843 | Nm |
| Improvement | - | +13.15 | % |
| Reluctance torque proportion | 58.95 | 55.79 | % |
| Magnetic torque proportion | 41.05 | 44.21 | % |
Table 5.
Motor performance comparison at rated condition.
Table 5.
Motor performance comparison at rated condition.
| Rated Condition | Label | M1 | M2 | Unit |
|---|
| Average torque | | 1.9 | 1.9 | Nm |
| Speed | | 5400 | 5400 | rpm |
| Power | | 1074.4 | 1074.4 | W |
| Torque ripple percentage | | 14.57 | 12.34 | % |
| MTPA phase current | | 3.4 | 3.26 | Arms |
| Current reduction | - | - | 4.12 | % |
| Power factor | | 0.925 | 0.944 | - |
| Power factor increase | - | - | 2.05 | % |
| Copper loss | | 37.89 | 35.01 | W |
| Iron loss | | 30.2 | 30.6 | W |
| Efficiency | | 94.04 | 94.27 | % |
| Efficiency increase | - | - | 0.23 | % |
Table 6.
Rotor cost comparison.
Table 6.
Rotor cost comparison.
| Rotor Material Cost | M1 | M2 | Unit |
|---|
| PM volume | 16,044 | 54,607 | mm3 |
| PM material | N30H | Y-40 | - |
| PM unit price 1 | 68.5 | 10.96 | US$/kg |
| PM cost | 8.24 | 2.93 | US$ |
| Rotor iron volume | 93,925 | 80,275 | mm3 |
| Rotor iron material | M235-35A | M235-35A | - |
| Rotor iron cost | 0.88 | 0.75 | US$ |
| Rotor material cost | 9.12 | 3.68 | US$ |
| Rotor material cost reduction | - | 59.6 | % |
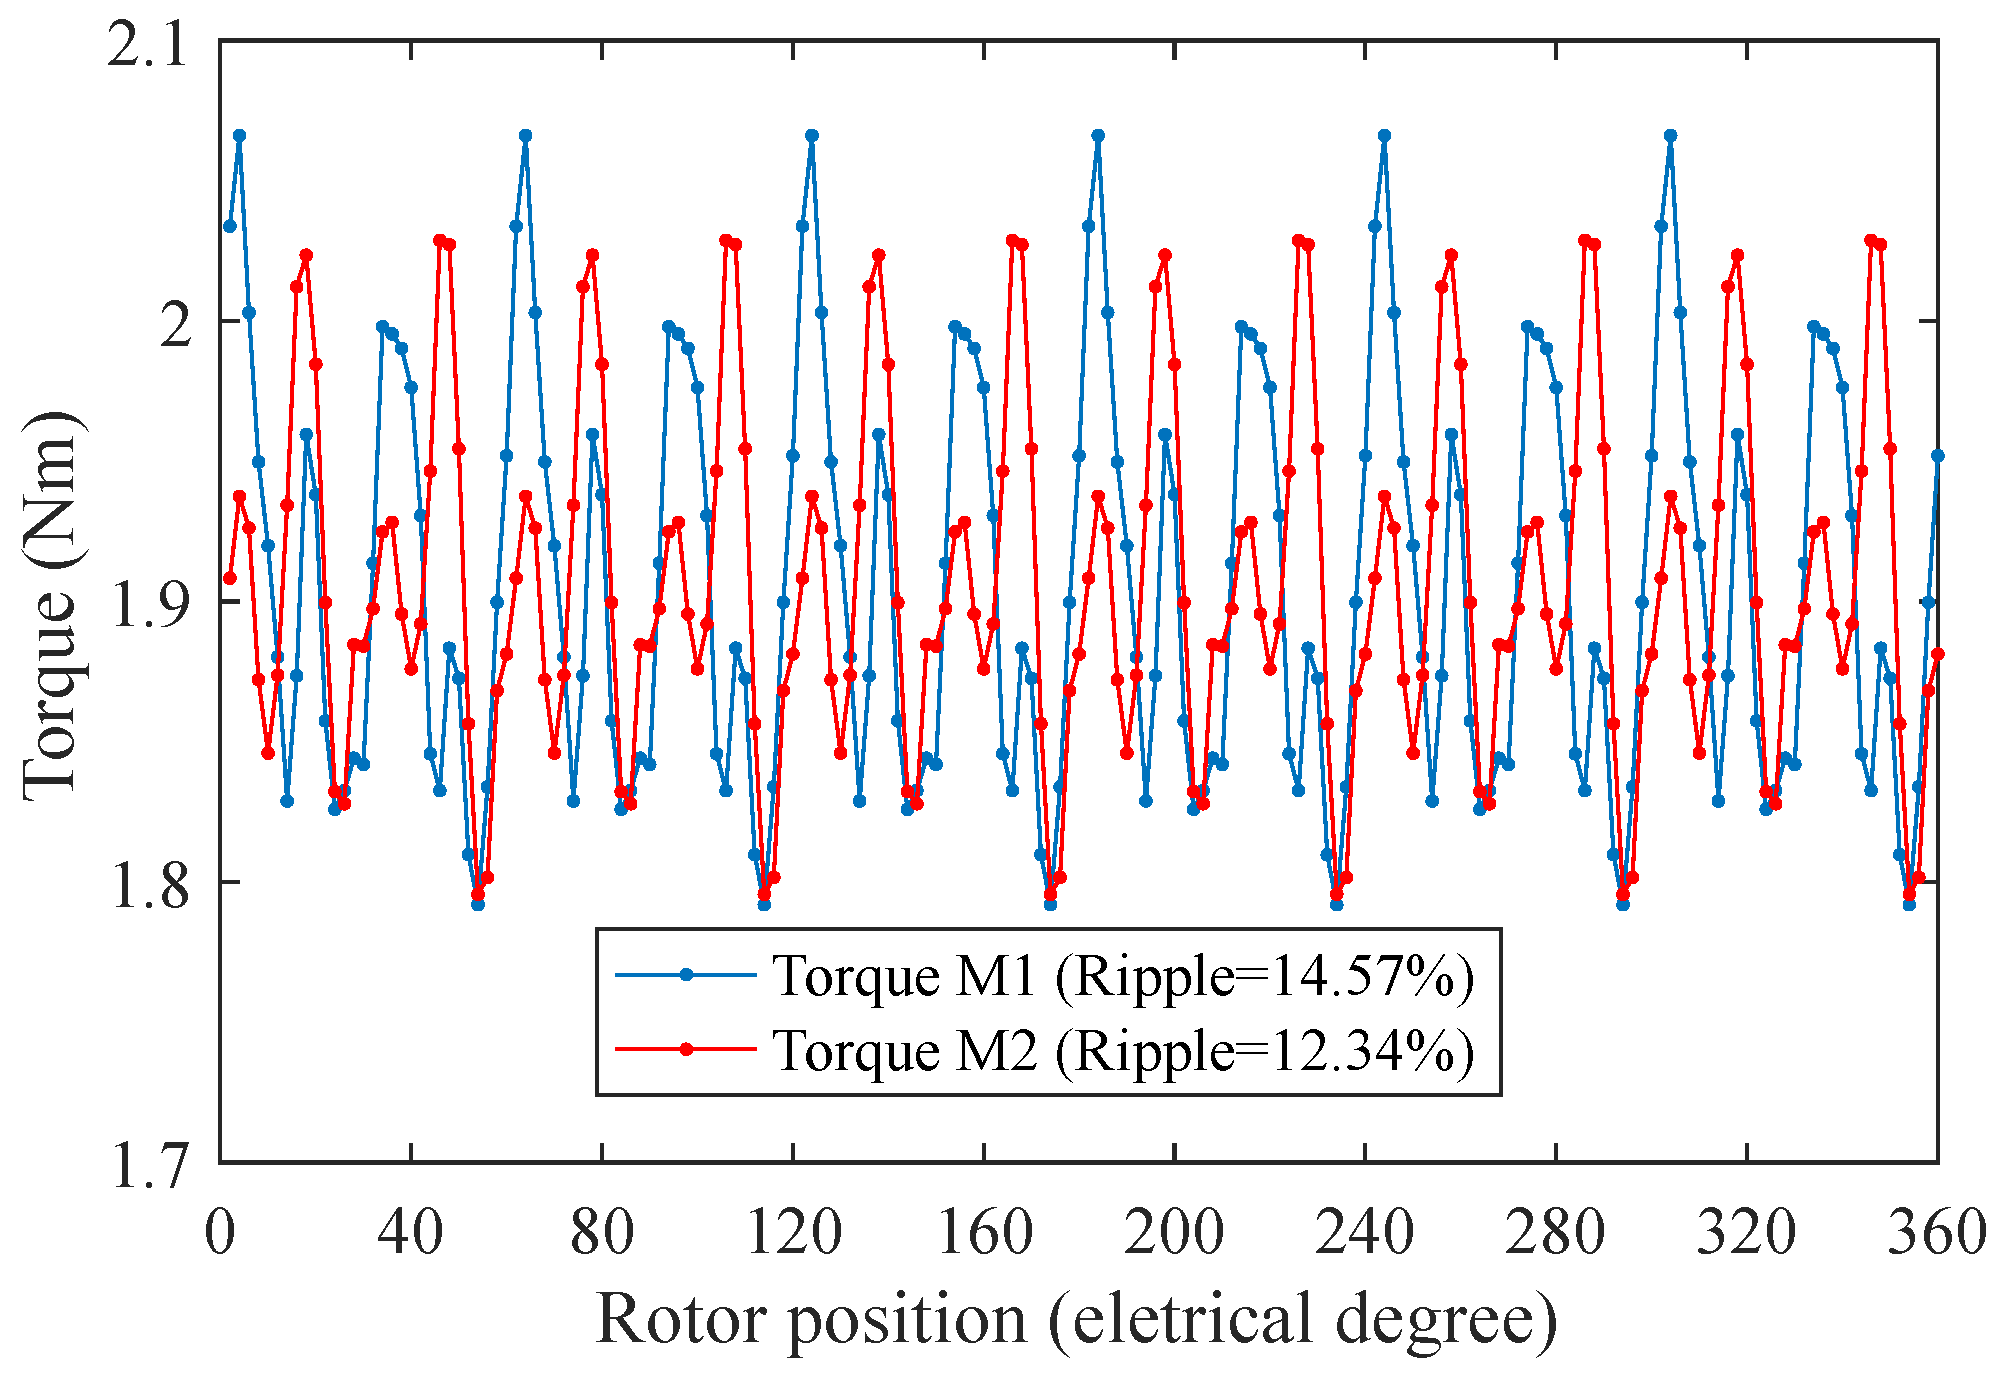
Under a rated condition, M2 exhibits lower torque ripple at 12.34% compared with 14.57% in M1, as reported in
Table 5. The instantaneous torque of the two motors over one electrical period is included in
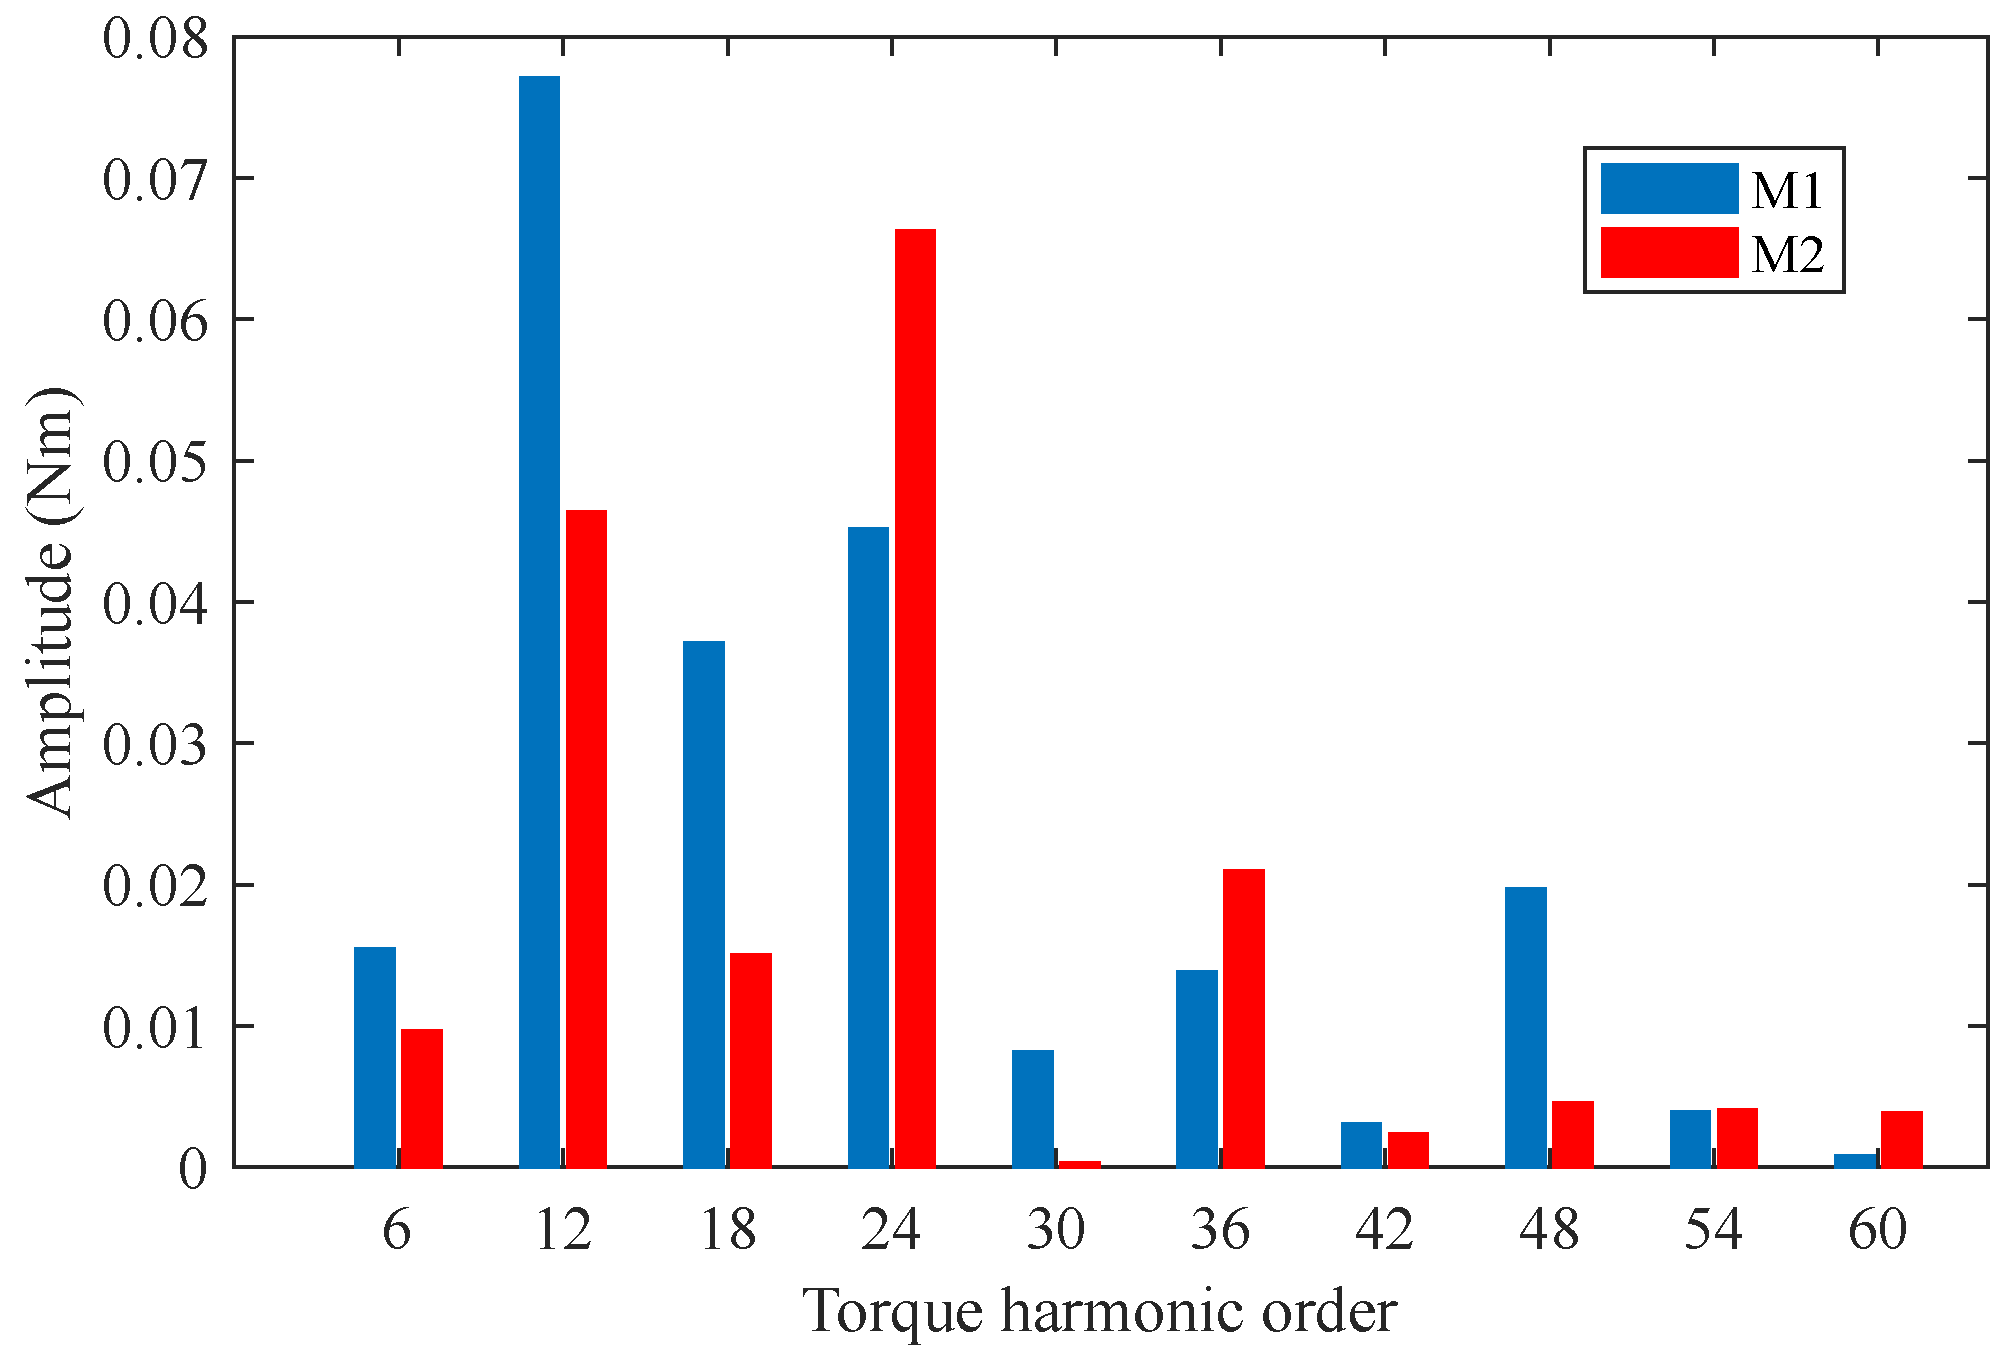
Figure 11, which clearly indicates the instantaneous torque differences. This is because M2 has generally lower torque ripple harmonic amplitudes compared with M1. As shown in
Figure 12, the amplitude of the 6th harmonic order in M2 is only around 63% of that in M1. Compared with M1, M2 also has obviously smaller 12th and 18th harmonic order values. In general, M2 exhibits lower torque ripple harmonic order values compared with M1 apart from the 24th and 36th.
To conclude, M2 exhibits higher efficiency, higher power factor, and lower torque ripple and costs less compared with M1. It is proved that the HP-PMaSynRM with fluid-shaped ferrite PMs could be provided with higher performance and lower price compared with traditional HP-PMaSynRM with rectangular-shaped rare earth PMs. As a result, the following part is to include a deeper comparison study between M2 and M1 to verify the efficiency and power factor advantages of M2 regarding a wide operating speed range.
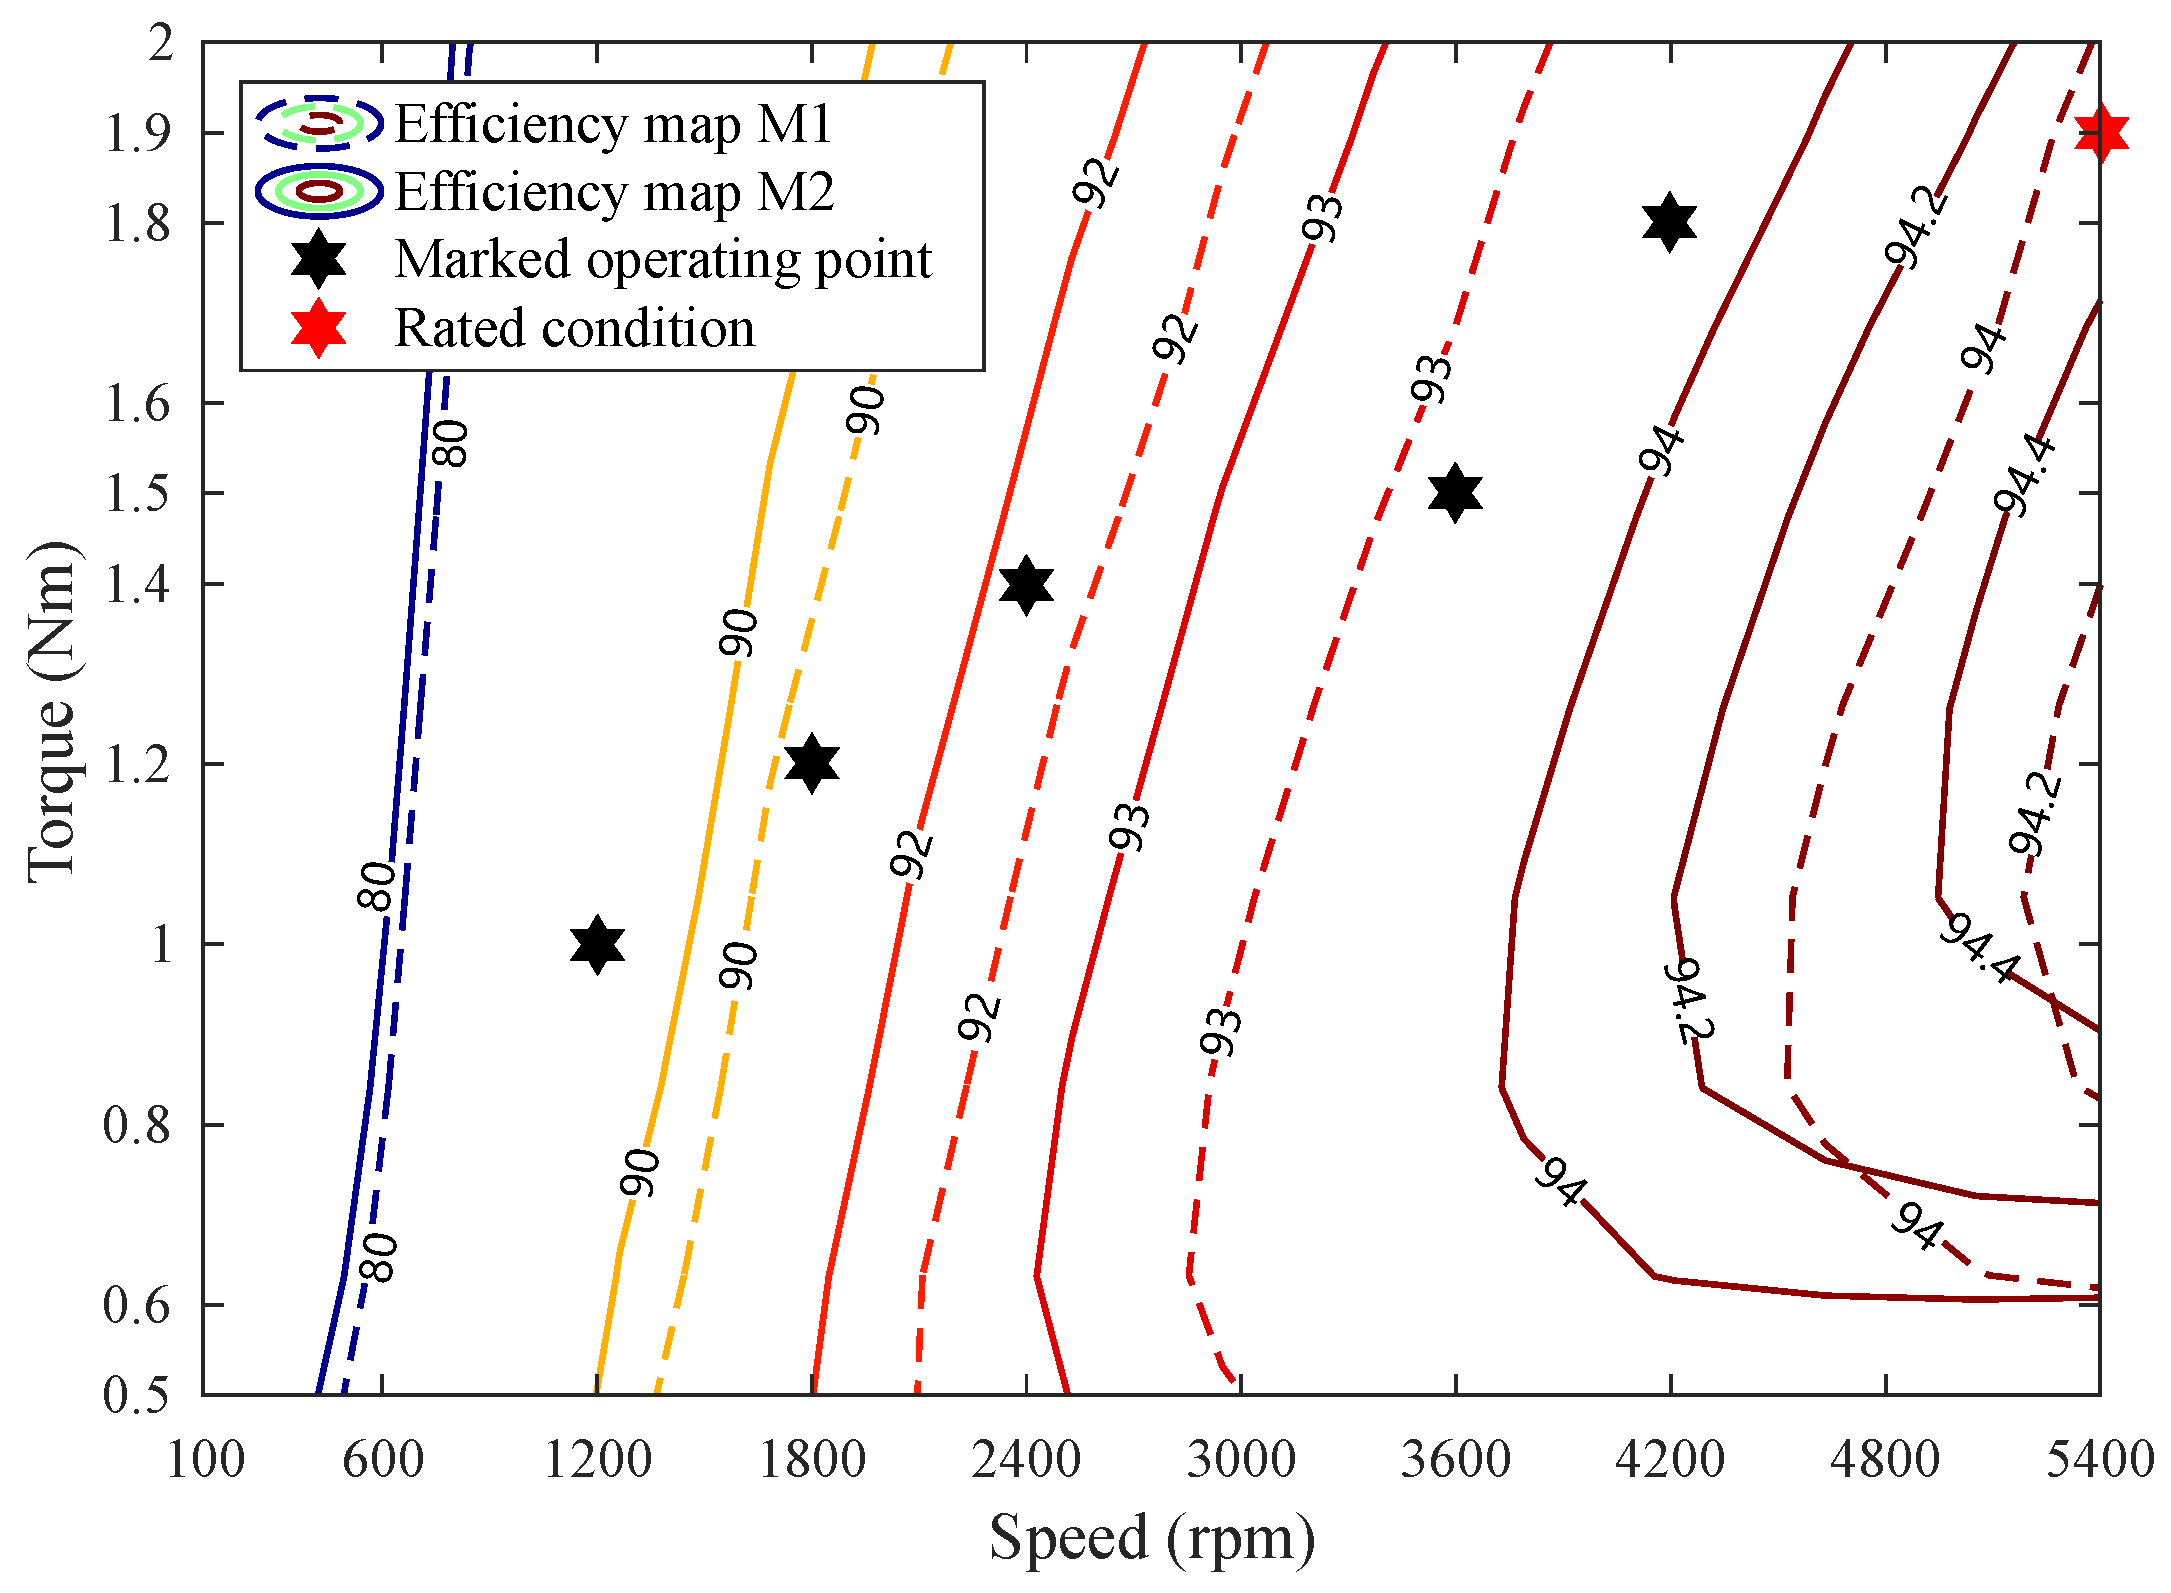
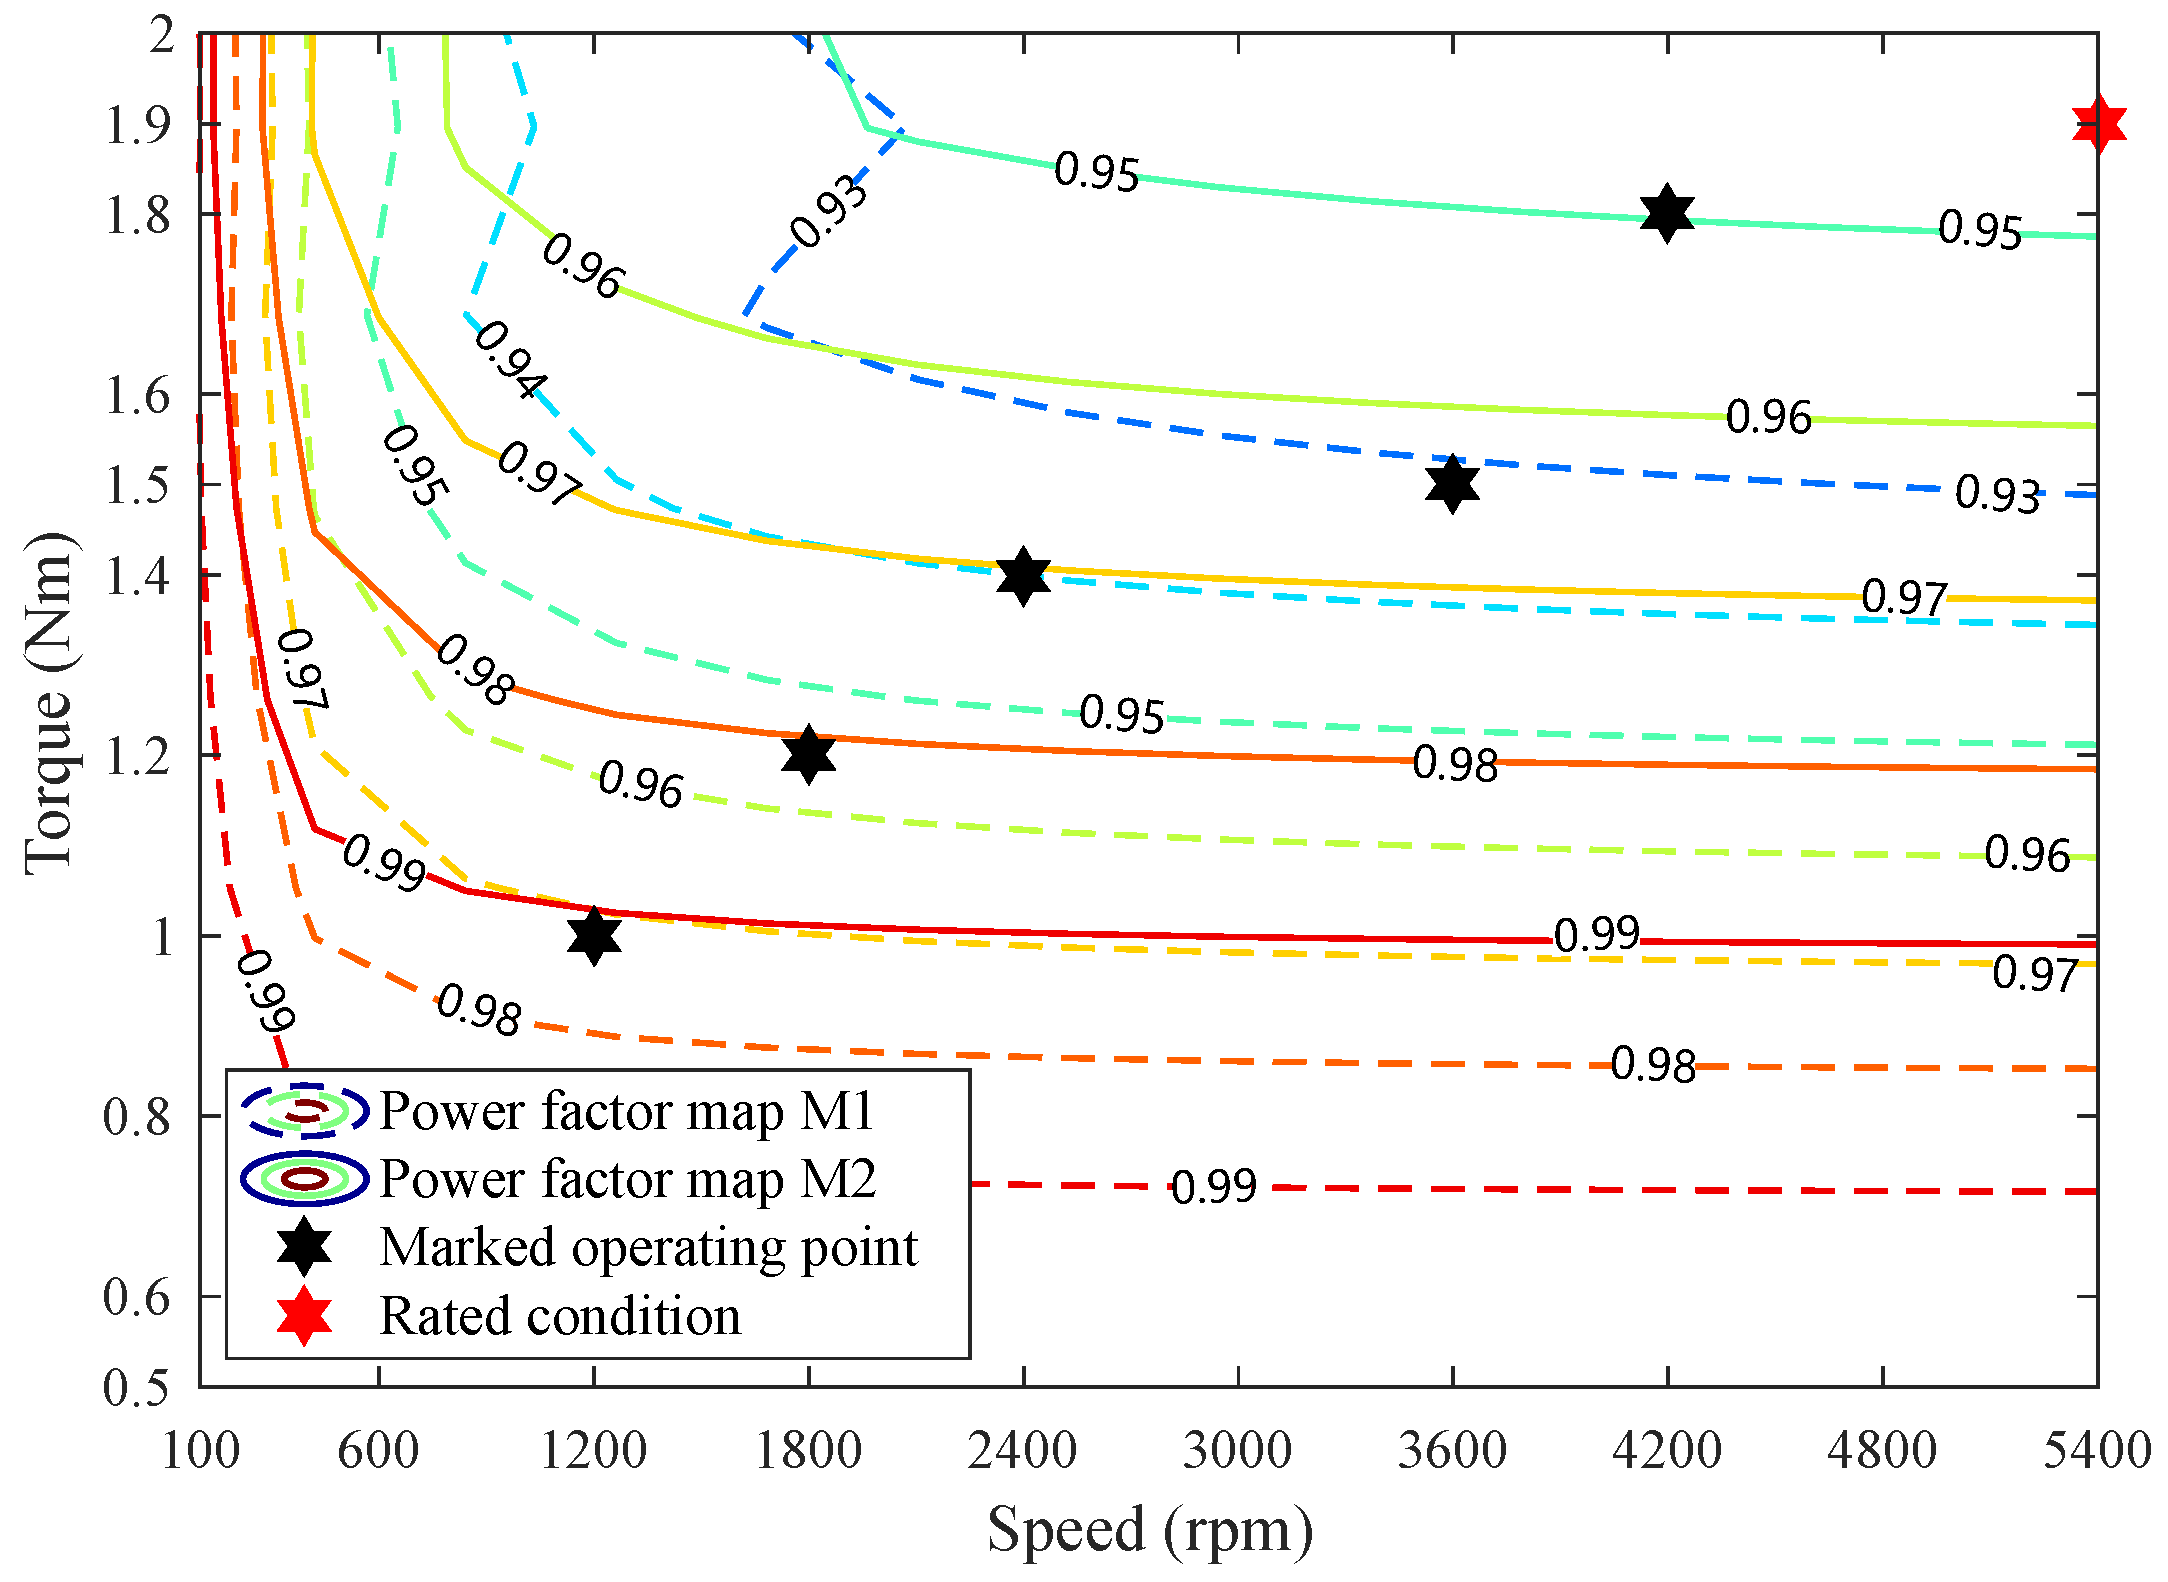
Figure 13 and
Figure 14 report the efficiency and power factor of M1 and M2 over the speed range from 100 rpm to rated 5400 rpm and torque range from 0.5 Nm to 2 Nm (rated 1.9 Nm included). As shown in
Figure 13, M2 is provided with higher efficiency at every operating point within the scope. In M1, the highest efficiency is limited to below 94.2%, whereas in M2, the highest efficiency can reach over 94.4%. Moreover, M2 is provided with an obvious wider range of efficiency over 94% compared with M1. In
Figure 14, it can be evidently indicated that M2 exhibits a higher power factor. Within the speed and torque range, the power factor in M2 is over 0.94 and can reach over 0.99 at torque load conditions below 1 Nm. However, in M1, the power factor is only 0.925 at a rated condition. Moreover, a power factor over 0.96 occupies almost a 75% region in M2, whereas it is only around 50% in M1.
Table 7 reports the detailed values of efficiency and power factor on the marked operating point to show the obvious advantage of M2. As reported in
Table 7, the efficiency and power factor of M2 are apparently higher at the six chosen operating points. The data of the rated operating point is also included in
Table 7, which is also reported specifically in
Table 5.

