Abstract
To address the challenges of weight redundancy, low material utilization, and excessive performance margins in the design of electric cable-hauling machines, this study proposes a novel multi-objective optimization framework. The framework integrates Latin hypercube experimental design, Kriging surrogate modeling, a Non-dominated Sorting Genetic Algorithm III (NSGA-III), and a coupled TOPSIS (Technique for Order Preference by Similarity to Ideal Solution) approach. A high-fidelity finite element model based on extreme operating conditions was established to simulate the performance of the electric towing winch. The Kriging model was employed to replace time-consuming finite element calculations, significantly improving computational efficiency. The NSGA-III algorithm was then utilized to search for the Pareto front, identifying a set of optimal solutions that balance multiple design objectives. Finally, the TOPSIS method was applied to select the most preferable solution from the Pareto front. The results demonstrate a 7.32% reduction in the overall mass of the towing winch, a 7.34% increase in the safety factor, and a 4.57% reduction in maximum structural deformation under extreme operating conditions. These findings validate the effectiveness of the proposed Kriging-NSGA-III-TOPSIS strategy for lightweight design of ship deck winch machinery.
1. Introduction
Maritime transport currently accounts for over 80% of international cargo shipping [1,2]. As the core mechanical equipment of the tugboat, the towing winch plays a crucial role in towing large vessels in ports [3,4]. Lightweight design can effectively reduce production costs and enhance vessel stability, yet achieving this while maintaining safety remains a significant challenge. Therefore, advanced optimization methods are urgently needed to achieve systematic improvements in overall performance.
Extensive research has been conducted to optimize the mechanical properties of deck machinery. Vladimir Solovyov [5] analyzed the effects of drum dimensions, materials, and load-strain accumulation, proposing a barrel-shaped winch design capable of predicting plastic deformation. Haoran Ye et al. [6] optimized the mechanical properties of marine multi-layer winch drums through full-scale experiments. Jin C et al. [7] achieved winch lightweighting and economic efficiency enhancement using multi-objective genetic algorithm (MOGA) optimization algorithms. Concurrently, to address the high costs associated with experiments and simulations, surrogate models have been introduced to establish global performance prediction mechanisms, potentially improving optimization efficiency. Xiaoyu Huang et al. [8] proposed a genetic algorithm based on adaptive Kriging and validated its effectiveness in the engineering application of aircraft engine turbine disks. Rohit Kumar et al. [9] employed stochastic Kriging to simulate semi-submersible floating offshore wind turbine (FOWT) mooring cable tension. Zhou Jiang et al. [10] proposed a multi-objective optimization method based on computational fluid dynamics-artificial neural network-non-dominated sorting genetic algorithm II (CFD-ANN-NSGA-II) for efficient structural parameter optimization of stirred reactors. Feng Liu et al. [11] combined an improved Kriging model with improved non-dominated sorting genetic algorithm II (INSGA-II) to minimize the direct navigation drag and diving drag of autonomous underwater vehicles (AUVs). Ji Lin et al. [12] introduced a dual-risk archiving strategy to enhance the optimization performance of costly multi-objective problems.
Despite significant achievements in local component optimization and specific algorithm applications, existing research exhibits notable shortcomings. First, most studies focus on individual components or a limited number of parameters, lacking a holistic multi-objective collaborative optimization framework for entire systems. This hinders the achievement of global trade-offs under multiple constraints such as strength, stiffness, weight reduction, and cost. Second, algorithm selection lacks unified standards and applicability evaluation mechanisms. The advantages of different algorithms across diverse scenarios remain difficult to systematically grasp, compromising the stability and reliability of optimization results.
To address the aforementioned challenges, this study establishes a novel multi-objective optimization framework that integrates parametric modeling, finite element analysis, and surrogate-based optimization into a holistic workflow. Specifically, we employ the Kriging surrogate model to mitigate the computational cost of simulations and adopt the Non-dominated Sorting Genetic Algorithm III (NSGA-III) coupled with the Technique for Order Preference by Similarity to Ideal Solution (TOPSIS) decision-making method to identify the optimal solution. This integrated approach enables the efficient coordination of strength, stiffness, and weight reduction across the entire machine. The framework not only significantly enhances the performance of the equipment and addresses key design issues but also provides a scalable optimization model for complex engineering systems. This paves a new way for the upgrade of marine engineering equipment and holds important theoretical and practical application value.
2. Multi-Objective Optimization Framework
2.1. Principles of Kriging Interpolation Models
Kriging [13,14] is an unbiased interpolation estimation model that minimizes the estimated variance. The Kriging model can be expressed as:
In the equation, is the basis function of the regression model, is the regression coefficient, is the number of basis functions, and is a random process with a mean of 0, variance of , covariance between and is , where and are any two input sample points, and is the correlation model composed of the samples, representing the correlation between sample points.
In the covariance function of , the Gaussian function [15] is widely adopted in model construction due to its simplicity, flexibility, and infinite differentiability. The model surface fitted by this correlation function exhibits superior smoothness compared to that fitted by linear kernel functions. Therefore, this study employs the Gaussian function as the correlation function, expressed as follows:
In the equation, is a relevant parameter that represents the sensitivity of the function’s output value to the kth input variable.
2.2. NSGA-III Optimization Algorithm
In the multi-objective optimization problem for electric cable-hauling machines, which involves three objectives—strength, stiffness, and weight—along with 28 design variables, the selection of optimization algorithms directly impacts the quality of the solution set and its engineering practicality. To address this, this study evaluates four mainstream multi-objective optimization algorithms: NSGA-II [16], NSGA-III [17], Multiple Objective Particle Swarm Optimization (MOPSO) [18], and Multi-objective Evolutionary Algorithm Based on Decomposition (MOEA/D) [19].
In this study, addressing high-dimensional optimization scenarios, four algorithms were employed to solve the DTLZ/ZDT series test functions [20,21] under identical algorithmic conditions. Specifically, the number of objective functions was set to M = 3, the decision variable dimension to D = 28, the population size to N = 200, and the maximum evaluation count to maxFE = 10,000. For ZDT3, the problem definition itself has the characteristic of M = 2, while in testing the decision variable dimension is elevated to D = 50, while other settings remain unchanged. The corresponding test functions are listed in Table 1.

Table 1.
Test functions.
The basic parameters of each algorithm are set to default values and tested sequentially. To evaluate the comprehensive performance of the algorithms, the inverse gradient descent (IGD) based on the inverse distance composite evaluation metric and the evaluation metric [22] based on the diversity evaluation metric are applied to the obtained Pareto solution sets, as shown in Figure 1. Quantitative analysis is performed on these sets, with the results presented in Table 2.
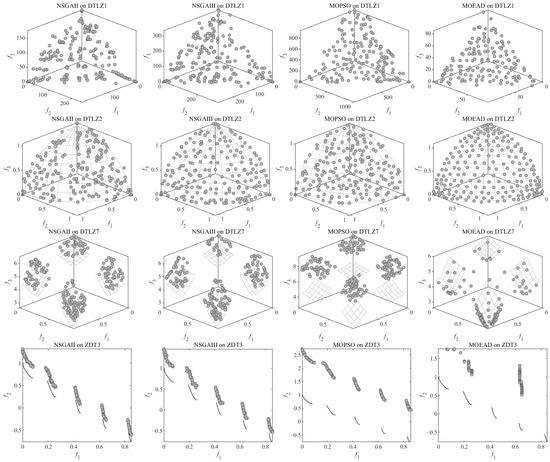
Figure 1.
The Pareto frontier map obtained from the test.
Table 2.
Performance comparison of NSGA-II, NSGA-III, MOPSO and MOEA/D.
The comprehensive index takes into account both the diversity of algorithm optimization results and the degree of approximation to the true Pareto frontier (convergence). is expressed as [23,24]:
In the formula, is the solution set obtained by the algorithm; is the true Pareto frontier; represents the shortest distance from the true frontier point to the algorithm solution set.
The indicator measures the diversity of the solution set distribution, i.e., the degree of dispersion of the Pareto solutions along the Pareto frontier in the objective space. The smaller the value, the more uniform the solution set distribution. is calculated as [25]:
In the formula, represents the shortest distance between the solution and other solutions; represents the average value of all shortest distances.
DTLZ2 specifically evaluates convergence accuracy on continuous problems using IGD as primary metric. DTLZ1 and DTLZ7 assess global search capability through for simple and complex Pareto frontier topologies, respectively. Analysis of the frontier distributions in Figure 1 and the numerical results in Table 2 reveals that the NSGA-II, MOPSO, and MOEA/D algorithms demonstrate outstanding performance when addressing specific problems, enabling more efficient problem-solving and yielding superior results. However, NSGA-III consistently maintains relatively strong performance across various problem types, demonstrating greater versatility and stability. Regardless of the problem’s nature or characteristics, it delivers balanced optimization capabilities.
As an enhanced version of NSGA-II, the NSGA-III algorithm is particularly well-suited for handling optimization problems with numerous objectives and large scales, excelling especially in complex scenarios involving more than three objectives. By incorporating a reference point mechanism and a feedback model, this algorithm significantly enhances its ability to maintain population diversity while improving computational efficiency. Figure 2 illustrates the specific optimization steps of NSGA-III.
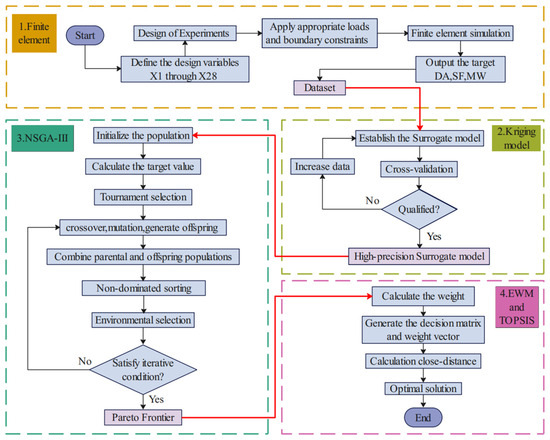
Figure 2.
Flow chart of NSGA-III and TOPSIS.
2.3. EWM and TOPSIS
When addressing multi-objective optimization problems, a traditional approach relies on the opinions of domain experts to merge multiple objectives into a single composite objective function through subjective weighting. Although this method proves intuitive and efficient in certain applications, its weight allocation is inherently subjective. It is susceptible to decision-makers’ cognitive biases and heavily dependent on experts’ personal experience. Consequently, the reproducibility and universality of solutions are severely constrained.
Traditional optimization methods often directly assign weights to optimization objectives based on the subjective preferences of researchers, making the results susceptible to subjective factors. In the multi-objective optimization of this study, the Pareto front generated by NSGA-III contains hundreds of non-dominated solutions. To scientifically select the final implementation plan, this study integrates the Entropy Weight Method (EWM) [26] with TOPSIS [27] to construct an objective decision-making system. EWM, as an objective weighting technique, assigns reasonable weights to each indicator based on rigorous mathematical calculations, providing an objective and scientific basis for constructing a comprehensive index. After determining the weights of the optimization objectives using EWM, the TOPSIS method is employed to calculate the proximity of each alternative solution to the ideal solution and rank all alternative solutions, thereby identifying the optimal solution. EWM and TOPSIS are illustrated in Figure 2, with the specific calculation process as follows.
First, the data is standardized prior to analysis [28]:
In the formula, is the item of the sample, where (number of samples) and (number of indicators).
In the above equation, is the proportion, is the information entropy, and is the weight.
Construct a weighted normalized matrix :
In the formula, represents the weighted value of each term in the matrix.
In the formula, and respectively represent the Euclidean distances from sample i to the positive and negative ideal solutions, and and respectively represent the maximum and minimum values in , that is, the positive and negative ideal solutions.
Finally, the calculation formula of the relative closeness is:
In the formula, represents the satisfaction degree of the scheme. The closer its value is to 1, the better the scheme is.
3. Simulation Experiments and Optimization Models
3.1. Engineering Case Model
This study investigates an electric towing winch, which also functions as an anchoring machine, from a specific enterprise. Figure 3 presents a schematic diagram of the cable-hauling machine, which primarily consists of seven components: the motor, reduction gearbox, main drum, brake, anchor chain wheel, wall frame, and intermediate frame. The relevant technical parameters are detailed in Table 3.
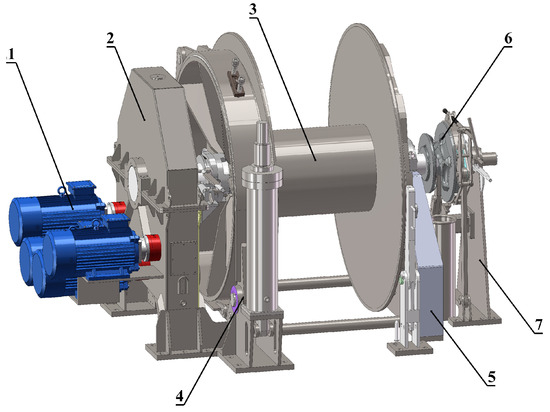
Figure 3.
Engineering model of the electric towing winch. 1—Motor, 2—Reducer, 3—Main drum, 4—Brake, 5—Middle frame, 6—Anchor chain wheel, 7—Wall frame.
Table 3.
The main technical parameters of the main drum and anchor chain wheel.
During actual operation, the towing winch is subject to the following specific forces:
- (1)
- Gravity on the rope on the drum:
In the equation, is the linear density of the cable 44.3 , and is the total length of the cable.
- (2)
- Workload torque on the reel:
In the equation, is the working load and is the diameter of the reel.
- (3)
- Braking torque of the brake on the drum:
- (4)
- The pressure exerted by the cable on the drum.
Radial pressure of the rope loops wound onto the reel on the reel wall:
where is the radius of the reel, is the width of the reel, and is the number of turns per layer.
In the case of multi-layer winding, due to the deformation of the drum wall and the cable rope loops, when the layer of rope loops is wound onto the drum, the tension of the first to layers of rope loops that were wound earlier will all change, thereby causing the pressure on the drum wall to increase disproportionately with the increase in the number of winding layers.
where is the multi-layer winding coefficient, the number of winding layers of the cable is , and .
- (5)
- The pressure exerted by the cable on the flange plate. During layer transition winding (crossover from drum end to new layer), cable wedging generates axial thrust at the transition loop. This force induces flange bending and significant stress concentration at the flange-drum interface. During multilayer winding, every crossover segment applies compressive loading on the flange. Furthermore, crossover segments distribute circumferentially with minimal inter-layer spacing. Consequently, total compressive load is modeled as uniformly distributed flange pressure:
In the equation, is the squeezing force exerted by the cable on the side plate, is the maximum winding diameter of the drum, is the minimum outer diameter of the drum, and is the number of winding layers, taken as 6.
At the same time, the anchor chain wheel experiences analogous types of loads but at significantly lower. Therefore, the primary focus is on the torque impact of the anchor chain wheel during operation.
Based on the above analysis, the model can be preprocessed, loaded, and analyzed to determine the maximum deformation, minimum safety factor, and their relative positions. The results are shown in Figure 4.
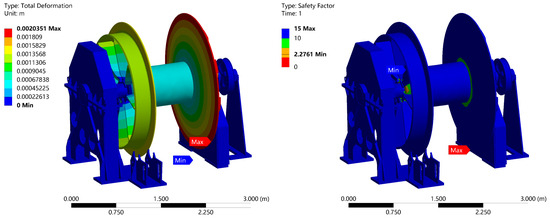
Figure 4.
Maximum deformation, minimum safety factor and their relative positions.
The analysis reveals that the most pronounced deformation in the model occurs at the side flanges, which are susceptible to elastic deformation under cable compression, with a maximum displacement reaching 2.03 mm. Concurrently, significant stress concentrations are observed at the connection points between the drum and the left/right flanges. These areas experience complex alternating stresses during actual operation and represent the lowest safety factor throughout the entire model. In contrast, the gearbox, intermediate frame, and wall frame regions exhibit lower stress levels and minimal deformation, demonstrating structural stability and uniform load distribution. These areas are thus identified as key targets for lightweight design. During subsequent optimization, design variables for these regions should be selected judiciously while ensuring structural strength and stiffness. This approach will not only achieve the overall objective of equipment lightweighting but also contribute to reduced manufacturing costs.
3.2. Establishment of an Optimized Model
This study is dedicated to identifying optimal design solutions through a trade-off strategy that prioritizes weight reduction while ensuring that safety and deformation are maintained within acceptable limits. To ensure that the optimization results deliver both significant performance improvements and practical engineering value, key variables were selected using a combined approach of system decomposition, sensitivity screening, and manufacturability constraints.
Initially, the towing winch structure was decomposed into four core subsystems: the reduction gearbox, intermediate frame, wall frame, and main drum. Within each subsystem, all theoretically variable dimensional parameters were identified based on parametric models. Subsequently, sensitivity-assisted analysis was employed to select 28 critical dimensional parameters, as illustrated in Figure 5. The upper limit of the design variables was set at 130% of the initial dimension, while the lower limit was set at 70% of the initial dimension, as detailed in Table 4.
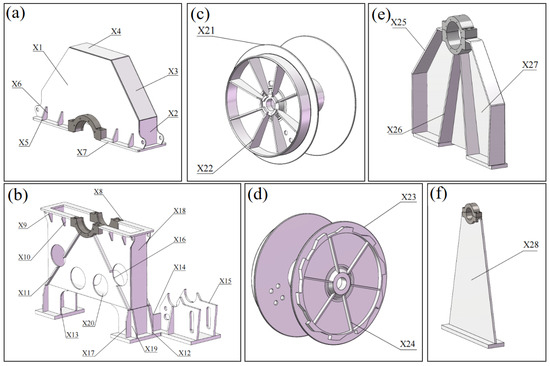
Figure 5.
Towing winch and related parameter model: (a) upper gearbox, (b) Lower gearbox, (c) Reduction flange plate, (d) Ratchet flange, (e) Middle frame, (d) Wall frame.
Table 4.
The original values and upper and lower limits of the 28 size variables.
The 28 parameters listed above are selected as design variables. The optimization objective aims to comprehensively enhance structural performance, specifically manifested as: reducing deformation (DA) to increase stiffness, improving the safety factor (SF) to ensure strength, and reducing weight (MW). Based on corporate technical specifications and actual operating conditions, the following constraints are set: deformation must not exceed 2 mm, and the safety factor must not be less than 2.0. Based on these criteria, the following multi-objective optimization model is constructed:
3.3. DoE Experiment
To ensure the predictive accuracy of the subsequent surrogate model, 400 uniform samples were generated within the parameter space using Latin Hypercube Design (LHD) [29], based on the permissible upper and lower limits of the aforementioned 28 variables. Design of Experiments (DoE) were conducted based on these 400 experimental plans, with the results shown in Figure 6.
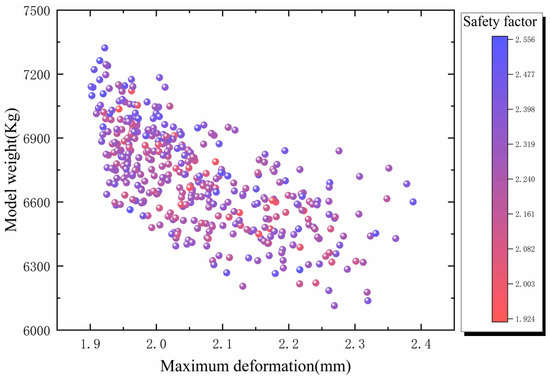
Figure 6.
Sets of DoE experimental schemes.
4. Results Analysis
4.1. Kriging Model Prediction Results
In the evaluation of the predictive accuracy of surrogate models, three key metrics are commonly employed to provide a comprehensive assessment: the coefficient of determination (), relative mean absolute error (), and root mean square error () [30,31]. Specifically, the value closer to 1, along with smaller and values, indicates higher predictive accuracy of the surrogate model. The Kriging model was trained using the dataset derived from the aforementioned 400 sets of DoE experiments. To evaluate the model’s generalization capability and mitigate the risk of overfitting, cross-validation was implemented. The model’s average performance and stability are detailed in Table 5.
Table 5.
Analysis of 10-fold cross-validation results.
The final training results analysis is presented in Figure 7. It is evident that the values of all three models exceed 0.90, while both the and values meet the prediction requirements. Consequently, the three surrogate models trained are deemed to possess high reliability.
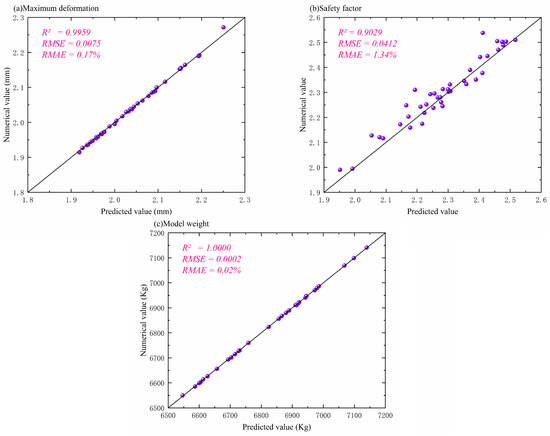
Figure 7.
The comparison between numerical values and predicted values: (a) Maximum deformation, (b) Minimum safety factor, (c) Model weight.
4.2. Sensitivity Analysis
The sensitivity analysis results of the 28 design variables on the three optimization objectives—maximum deformation (DA), safety factor (SF), and weight (MW)—are presented in Figure 8, utilizing the Sobol index. The sensitivity analysis chart reveals that design variables X23 and X28 have the most significant impact on maximum deformation (DA), demonstrating the highest sensitivity. Meanwhile, X3 and X22 are identified as the key factors influencing the safety factor (SF). Regarding weight (MW), X21 and X23 contribute most prominently, with particularly noticeable effects.
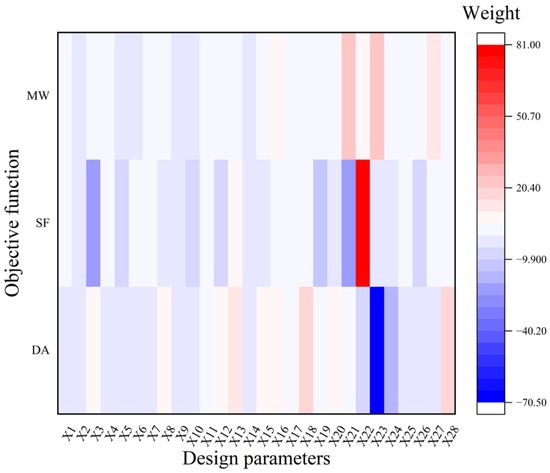
Figure 8.
The sensitivity analysis diagram of the optimization target.
The sensitivity analysis diagram clearly shows that design variables X24 and X27 have the most significant impact on the maximum deformation (DA), with the highest sensitivity, while X3 and X26 play a dominant role in the safety factor (SF), making them key factors in determining safety performance. In terms of weight (MW), X27 and X28 make the most significant contributions, with particularly noticeable effects.
Based on the aforementioned analysis, to more intuitively illustrate the influence of each variable on the objective functions, the two variables with the most significant impact on each objective were selected. Consequently, three sets of response plots were generated: the response plot of X23 and X28 on maximum deformation (DA), the response plot of X3 and X22 on the safety factor (SF), and the response plot of X21 and X23 on weight (MW), as depicted in Figure 9.
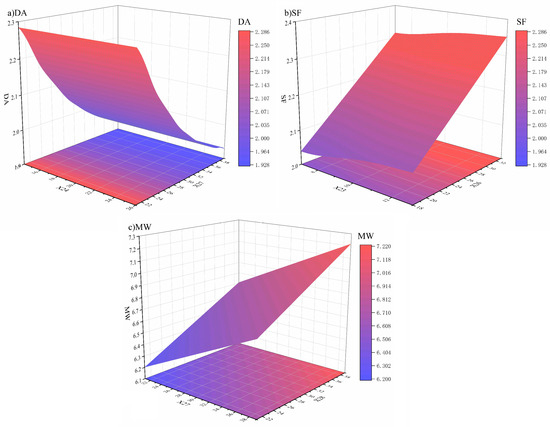
Figure 9.
Three-dimensional response surface characteristics: (a) Response graphs of X28 and X23 to DA, (b) Response graphs of X3 and X22 to SF, (c) Response graphs of X21 and X23 to MW.
4.3. Optimized Solution
Based on the multi-objective optimization model described above, the NSGA-III algorithm was employed to generate solutions. The initial population size was set to 200, with a maximum iteration limit of 1000. The resulting Pareto front is illustrated in Figure 10.
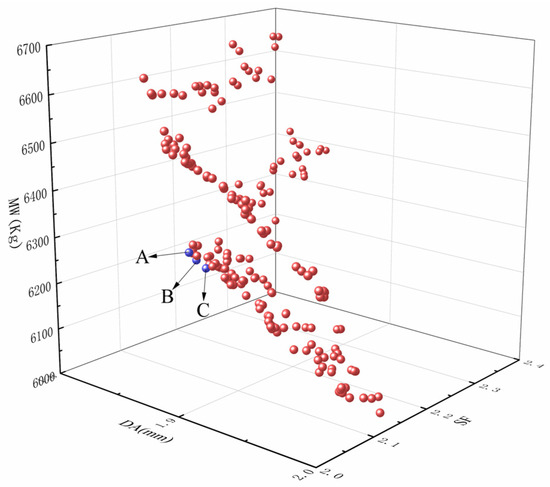
Figure 10.
The Pareto frontiers of DA, SF and MW.
Following the application of the EWM-TOPSIS method to the 200 optimal solutions derived from the Pareto front, the optimal solution A was ultimately identified. Additionally, solutions B and C, which are in the vicinity of solution A, were selected for comparative analysis. The specific results are detailed in Table 6.
Table 6.
The information related to the three plans.
Among the three schemes, Scheme A demonstrated superior overall performance compared to Schemes B and C. As a result, Scheme A was selected for subsequent optimization verification. However, the design variables obtained during the solution process exceeded the company’s actual processing capabilities. Therefore, it was necessary to round the design parameters and conduct scheme verification analysis based on the rounded variables. A detailed comparison of the design parameters before and after rounding is presented in Table 7.
Table 7.
The comparison before and after the adjustment of design variables.
The rounded design parameters were imported into both the predictive model and the finite element model for analysis and solution. The results are presented in Table 8. The prediction results for the three objectives exhibited minimal deviation from the actual solutions, with errors of only 0.51%, 0.29%, and 0.02%, respectively. Compared to the pre-optimization model, the maximum deformation decreased by 4.57%, the safety factor increased by 7.34%, and the weight of the cable-hauling machine was reduced by 7.32%.
Table 8.
Optimization verification analysis.
The optimized design of the towing winch achieved a significant weight reduction of 491 kg for the entire unit. Concurrently, the safety factor increased by 7.34%, and the maximum deformation decreased by 4.57%. These improvements effectively enhance the equipment’s resistance to wind and waves in complex sea conditions, extend its service life, and reduce the risk of failure. This optimization solution not only helps tugboats reduce costs and increase efficiency but also promotes green and low-carbon transformation, providing strong support for the industry’s sustainable development.
5. Conclusions
This study proposes and validates an innovative framework integrating Kriging surrogate modeling, NSGA-III multi-objective optimization, and TOPSIS decision analysis (Kriging-NSGA-III-TOPSIS) to address critical challenges in lightweight structural design for ship electric cable winches. The key findings are summarized as follows:
- High Efficiency and Reliability of the Integrated Framework: By integrating high-precision Kriging modeling, NSGA-III algorithms, and EWM-TOPSIS decision-making, the proposed framework significantly reduces reliance on computationally intensive simulations. This provides a systematic, efficient, and reliable methodology for the co-optimization of lightweighting and reliability in complex three-dimensional structures.
- Significant Optimization Outcomes for Electric Cable Winches: The framework achieved intelligent optimization of critical structural parameters, targeting reinforcement in high-stress zones and rational reduction in low-stress zones. The optimized design, which strictly adheres to corporate technical specifications and operational requirements, achieved a 7.32% weight reduction, a 7.34% increase in the safety factor, and a 4.57% decrease in maximum deformation. These results fully validate the framework’s engineering effectiveness.
- High Industry Value of the Framework: This framework effectively balances conflicting design objectives. The established optimization process provides an efficient, scalable paradigm for intelligent and lean design of marine deck winch machinery. It holds significant practical implications for advancing marine engineering equipment toward high performance, low material consumption, and high reliability.
This study still has certain limitations. Regarding the safety factor metric, the final surrogate model’s coefficient of determination () did not achieve the ultra-high-fidelity threshold of 0.95 or above. Furthermore, manufacturing constraints were not integrated into the optimization cycle. Future research will focus on further enhancing the accuracy and robustness of the surrogate model. It will also explore how to incorporate manufacturing constraints earlier into the framework while maintaining algorithmic exploration efficiency, with the goal of applying this approach to lightweighting practices for other types of deck winch machinery.
Author Contributions
Writing—original draft, writing—review and editing, project administration and supervision, Q.L.; writing—original draft, software, visualization, formal analysis, L.F.; visualization, writing—original draft, Y.W.; conceptualization and methodology, J.L.; resource acquisition, L.Z. All authors have read and agreed to the published version of the manuscript.
Funding
This research was supported by the Zhejiang Provincial Department of Science and Technology Public Welfare Project (No. LGN22E050005) and the Zhoushan Municipal Science and Technology Bureau Key Project of Zhejiang Ocean University (No. 2023C41002).
Data Availability Statement
The original design parameters and finite element models are confidential business information. Some anonymized data can be provided upon authorization. Please contact the corresponding author.
Conflicts of Interest
Author Linsen Zhu was employed by the company Jiesheng Marine Equipment Co., Ltd. The remaining authors declare that the research was conducted in the absence of any commercial or financial relationships that could be construed as a potential conflict of interest.
References
- Xu, M.; Shen, Y.; Zhu, Y.; Hong, L.; Ma, M.; Lü, L.; Li, K.X. Identification of critical sets of ports in cascading failures of global liner shipping network. Transp. Res. Part E 2025, 200, 104184. [Google Scholar] [CrossRef]
- Wang, L.; Yang, Y.; Mei, Q.; Song, R. Generational evolution and spatial distribution characteristics of ports along the belt and road initiative. J. Transp. Geogr. 2025, 128, 104343. [Google Scholar] [CrossRef]
- Carral Couce, L.; Carral Couce, J.C.; Fraguela Formoso, J.A. Operation and Handling in Escort Tugboat Manoeuvres with the aid of Automatic Towing Winch Systems. J. Navig. 2015, 68, 71–88. [Google Scholar] [CrossRef]
- Saito, D.G.H.; Santos, M.V.d.; Souza, C.B. Dynamic modelling, simulation, and control of hybrid power systems for escort tugs and shuttle tankers. J. Energy Storage 2023, 72, 108091. [Google Scholar] [CrossRef]
- Solovyov, V.; Cherniavsky, A. Computational and experimental analysis of trawl winches barrels deformations. Eng. Fail. Anal. 2013, 28, 160–165. [Google Scholar] [CrossRef]
- Ye, H.; Li, W.; Lin, S.; Ge, Y.; Han, F.; Sun, Y. Experimental investigation of spooling test on the multilayer oceanographic winch with high-performance synthetic fibre rope. Ocean Eng. 2021, 241, 110037. [Google Scholar] [CrossRef]
- Jin, C.; Zhu, L.; Liu, Q.; Lin, J. Multi-Objective Optimization of Marine Winch Based on Surrogate Model and MOGA. Comput. Model. Eng. Sci. 2025, 143, 1689–1711. [Google Scholar] [CrossRef]
- Huang, X.; Wang, P.; Wang, Q.; Zhang, L.; Yang, W.; Li, L. An improved adaptive Kriging method for the possibility-based design optimization and its application to aeroengine turbine disk. Aerosp. Sci. Technol. 2024, 153, 109495. [Google Scholar] [CrossRef]
- Kumar, R.; Prasad, K.J.; Keprate, A.; Sen, S. Addressing material uncertainty in reliability analysis of floating offshore mooring through probabilistic meta-model developed with Stochastic Kriging technique. Ocean Eng. 2025, 335, 121697. [Google Scholar] [CrossRef]
- Jiang, Z.; Chen, J.; Xie, S.; Li, X.; Liu, H.; Wang, L.; Hong, C.; Li, G.; Li, H.; Chen, K. Establishment of CFD-ANN-NSGA-II model for stirred reactor design. Chem. Eng. Sci. 2025, 311, 121614. [Google Scholar] [CrossRef]
- Liu, F.; Deng, X. Multi-objective optimization of an autonomous underwater vehicle shape based on an improved Kriging model. Ocean Eng. 2024, 313, 119388. [Google Scholar] [CrossRef]
- Lin, J.; Liu, Q. TRAA: A two-risk archive algorithm for expensive many-objective optimization. Complex Intell. Syst. 2024, 10, 7349–7371. [Google Scholar] [CrossRef]
- Axay, T.; Atin, R.; Subrata, C. Reliability analysis of underground tunnel by a novel adaptive Kriging based metamodeling approach. Probabilistic Eng. Mech. 2022, 70, 103351. [Google Scholar] [CrossRef]
- Zhao, Q.; Duan, J.; Wu, T.; Hong, J. Time-dependent reliability analysis under random and interval uncertainties based on Kriging modeling and saddlepoint approximation. Comput. Ind. Eng. 2023, 182, 109391. [Google Scholar] [CrossRef]
- Park, J. Central Limit Theorem for Multi-Point Functions of the 2D Discrete Gaussian Model at High Temperature. Commun. Math. Phys. 2025, 406, 234. [Google Scholar] [CrossRef]
- Deb, K.; Jain, H. An Evolutionary Many-Objective Optimization Algorithm Using Reference-Point-Based Nondominated Sorting Approach, Part I: Solving Problems With Box Constraints. IEEE Trans. Evol. Comput. A Publ. IEEE Neural Netw. Counc. 2014, 18, 577–601. [Google Scholar] [CrossRef]
- Li, Y.; Xie, H.; Deng, X.; Zhang, J.; Liu, S.; Wang, L. Inventory optimisation based on NSGA-III algorithm. Int. J. Space-Based Situated Comput. 2023, 9, 158–164. [Google Scholar] [CrossRef]
- Chowdhury, S.; Bohre, A.K.; Saha, A.K. Meta-Heuristic Optimization for Hybrid Renewable Energy System in Durgapur: Performance Comparison of GWO, TLBO, and MOPSO. Sustainability 2025, 17, 6954. [Google Scholar] [CrossRef]
- Gu, Q.; Li, K.; Wang, D.; Liu, D. A MOEA/D with adaptive weight subspace for regular and irregular multi-objective optimization problems. Inf. Sci. 2024, 661, 120143. [Google Scholar] [CrossRef]
- Reddy, S.; Dulikravich, G.S. A self-adapting algorithm for many-objective optimization. Appl. Soft Comput. J. 2022, 129, 109484. [Google Scholar] [CrossRef]
- Zhao, T.; Wu, L.; Cui, Z.; Qin, A.K. An adaptive strategy based multi-population multi-objective optimization algorithm. Inf. Sci. 2025, 686, 120913. [Google Scholar] [CrossRef]
- Abdel-Basset, M.; Mohamed, R.; Abouhawwash, M. Balanced multi-objective optimization algorithm using improvement based reference points approach. Swarm Evol. Comput. 2021, 60, 100791. [Google Scholar] [CrossRef]
- Hu, Y.; Peng, J.; Ou, J.; Li, Y.; Zheng, J.; Zou, J.; Jiang, S.; Yang, S.; Li, J. The IGD-based prediction strategy for dynamic multi-objective optimization. Swarm Evol. Comput. 2024, 91, 101713. [Google Scholar] [CrossRef]
- Liu, H.; Wang, C.H. SEAMS: A surrogate-assisted evolutionary algorithm with metric-based dynamic strategy for expensive multi-objective optimization. Expert Syst. Appl. 2025, 265, 126050. [Google Scholar] [CrossRef]
- Ravichandran, S.; Manoharan, P.; Sinha, D.K.; Jangir, P.; Abualigah, L.; Alghamdi, T.A.H. Multi-objective resistance-capacitance optimization algorithm: An effective multi-objective algorithm for engineering design problems. Heliyon 2024, 10, e35921. [Google Scholar] [CrossRef] [PubMed]
- Yin, Y.; Song, C.; Jing, Y.; Zhang, S.; Ye, S.; Wang, Y.; Gao, P. EWMS: A software tool for interactively using entropy weight coefficient method for aggregating sustainability indicators. Environ. Model. Softw. 2025, 191, 106500. [Google Scholar] [CrossRef]
- Liu, H.; Wang, Y. TOPSIS method for ability evaluation of industrial internet platform energizing digital transformation of manufacturing with DHHFLTSs. Int. J. Knowl.-Based Intell. Eng. Syst. 2025, 29, 336–347. [Google Scholar] [CrossRef]
- Du, Y.; Mao, K.; Lei, X.; Ma, W.; Liang, Q.; Tu, J. Multi-objective optimization of process parameters for laser cladding of Cr3C2/15-5PH composite coatings on 20CrMnTi using RSM-CMOPSO-EWM-CV. J. Mater. Res. Technol. 2025, 36, 5632–5645. [Google Scholar] [CrossRef]
- Li, G.; Yang, J.; Wang, W.; Zhang, Z.; Zhang, W.; Wu, Z. Augmented RBF metamodel for global sensitivity analysis enhanced by recursive evolution LHD and efficient K-fold cross-validation. J. Mech. Sci. Technol. 2022, 36, 4127–4142. [Google Scholar] [CrossRef]
- Sengupta, P.; Chakraborty, S. Bayesian model updating in an active Kriging-based metamodeling framework. Appl. Math. Model. 2025, 142, 115981. [Google Scholar] [CrossRef]
- Yuan, Y.; Au, F.T.K.; Yang, D.; Zhang, J. Active learning structural model updating of a multisensory system based on Kriging method and Bayesian inference. Comput.-Aided Civ. Infrastruct. Eng. 2022, 38, 353–371. [Google Scholar] [CrossRef]


Disclaimer/Publisher’s Note: The statements, opinions and data contained in all publications are solely those of the individual author(s) and contributor(s) and not of MDPI and/or the editor(s). MDPI and/or the editor(s) disclaim responsibility for any injury to people or property resulting from any ideas, methods, instructions or products referred to in the content. |
© 2025 by the authors. Licensee MDPI, Basel, Switzerland. This article is an open access article distributed under the terms and conditions of the Creative Commons Attribution (CC BY) license (https://creativecommons.org/licenses/by/4.0/).