Abstract
One of the key measures of cutting tool efficiency in machining processes is tool wear. In recent decades, numerical modeling of this phenomenon—primarily through finite element cutting models—has gained increasing importance. A crucial requirement for the reliable application of such models is the selection of an appropriate friction model, which strongly affects the accuracy of wear predictions. However, choosing the friction model type and its parameters remains a nontrivial challenge. This paper examines the effect of different friction model types and their parameters on the Archard and Usui wear model indicators, as well as on the main cutting process characteristics: cutting force components, temperature in the primary cutting zone, contact length between the tool rake face and the chip, shear angle, and chip compression ratio. To evaluate their impact on predicted tool wear—expressed qualitatively through the wear indicators of the aforementioned models—several widely used friction models implemented in commercial FEM software were applied: the shear friction model, Coulomb friction model, hybrid friction model, and constant tau model. The simulated values of these cutting process characteristics were then compared with experimental results.
1. Introduction
At the core of modern machine and mechanism production lies the manufacturing industry, whose foundation is built upon a variety of machining methods, with particular emphasis on cutting processes employing edge tools. The desire to improve the quality and competitiveness of manufactured products necessitates the creation of new cutting processes and the optimization of existing ones [1]. To implement this, physical and numerical modeling of cutting processes is widely used [2], reinforced by artificial intelligence methods that have been rapidly developing over the last decade [3]. Recently, significant progress has been achieved in the numerical modeling of various cutting processes [4]. This ensures the possibility of simulating and determining the physical and mechanical characteristics of deformation and subsequent fracture of the machined material when a tool is penetrated into it [5], as well as assessing the impact of the cutting process on the characteristics of the machined subsurface layers of the products [6]. The combination of performed studies contributed to the creation of the basis for modeling tool wear mechanisms—one of the most important indices of cutting process efficiency when machining construction and difficult-to-machine materials [7], in particular nickel and titanium alloys [8].
The ability to adequately predict the cutting tool wear through numerical simulation, in particular through finite element models of the cutting process, is largely determined by the correct choice of the model for the contact interaction between the tool and the machined material, often referred to as the friction model [9]. The type of friction model has a significant impact on tool wear, as friction is one of the main factors determining the wear rate of cutting tools [10]. There are different types of friction: abrasive, adhesive, deformation, fatigue, etc. Refs. [11,12] have different effects on the tool’s cutting surfaces, leading to different types and rates of wear. Choosing the right friction model when simulating the cutting process allows for more accurate prediction of tool wear and optimization of machining conditions to increase tool life [13].
This paper presents an analysis of the effect of friction model types used in the software environment for developing numerical cutting models on the main characteristics of the machining process. The impact of the friction model type is assessed by determining wear indicators based on local characteristics of the contact interaction between the tool and the machined material, such as pressure, relative sliding speed, and temperature in the contact zone.
2. Tool Wear and Contact Interaction Characteristics Between the Tool and the Machined Material
One of the most common and widely used characteristics for evaluating the effectiveness of cutting materials and the machinability of various materials is the wear of cutting tool elements, which has been the subject of many thousands of different studies [1,2]. These studies, carried out over many decades, have been analyzed and structured according to the used methods, model types, machined materials, etc., and are presented in numerous reviews [2,14,15,16,17,18,19,20,21]. The review by Dogra et al. [14] is devoted to the analysis of wear in tools equipped with cutting elements from cubic boron nitride, as well as the analysis of the mechanical characteristics of subsurface layer during the machining of hardened steels. Lin and colleagues [15] reviewed numerous publications devoted to the patterns of tool wear mechanisms when machining difficult-to-machine materials. The research development in the field of analytical and numerical modeling of tool wear is presented in Li’s analysis [16], while Yan and colleagues [17] focus on the analysis of current developments in the field of wear research using finite element modeling with the Archard wear model. Delaney with colleagues [18] also devoted their work to analyzing the application of the widely used Archard model for predicting tool wear. The review by Zhang et al. [19] systematically summarizes trends in tool wear research based on the application of physical models and the results of numerous experimental data evaluations. An analysis of existing wear models, perspectives, and potential directions for further research is presented in the review by Springis and Boiko [20]. A comprehensive analysis of current research into tool wear mechanisms and their simulation using empirical, analytical, and numerical models, as well as hybrid wear models combining the interaction of the aforementioned models, is presented in a review by Khadka et al. [21].
Most studies carried out on cutting tool wear can be thematically divided into experimental studies of the wear mechanism or its physical modeling, tool wear modeling, mainly for the purpose of its prediction, and wear prediction using relatively new methods, such as the application of artificial intelligence, machine learning, etc. Special issues are also devoted to similar studies (see, e.g., [22]). Through experimental studies of the machining process of martensitic and supermartensitic steels, Corrêa et al. established the mechanisms of prevailing wear of carbide cutting elements separately for each type of machined material [23]. A physical model of tool wear during face milling of Inconel 182, which predicts the wear of carbide cutting elements with an accuracy of up to 10%, was presented by Wang and colleagues [24]. Using an experimental test stand to model the frictional thermal wear in contact between a loading indenter imitating the tool cutting element and flat workpieces from steel 316 L and aluminum 5A06, Sun and Zheng optimized the Archard model for further prediction of wear values [25]. The study by Pérez-Salinas et al. shows the significant influence of wear on the clearance face of the tool cutting elements on the regularities of segmented chip formation during the cutting of nickel alloy Inconel 718 [26]. Wear minimization of carbide inserts by optimizing cutting conditions during turning of Inconel 718 alloy is the subject of a study by Khan and colleagues [27]. To predict the wear of tool cutting elements, Zhao and his colleagues developed a model of thermodynamic frictional contact between the milling cutter and the machined material [28]. The study by Kovač et al. is devoted to experimental investigations of the relationship between cutting forces and machining conditions in face milling of steel AISI 1060 [29]. This relationship was represented by correlation dependencies. An empirical model for predicting the wear of end mill cutters when machining stainless steel 304 was developed by Wang et al. [30]. Özlü and colleagues performed a series of experimental studies of various characteristics of the process of milling titanium alloy Ti6Al4V with end cylindrical mill cutters. At the same time, the main regularities in the wear of the clearance faces of the cutter’s cutting elements were established [31]. An empirical wear model for the rear face of carbide inserts during the turning of Inconel 718 is presented in a study by Bloul et al. [32].
A common trend in researching the mechanism of cutting tool wear and predicting it is the use of numerical models, in particular finite element cutting models. A study by Clavier et al. [33] is devoted to numerical modeling of the relationship between the tool’s geometric parameters, which change during wear, and the tribological parameters in contact between the tool and the machined material, with the wear value of the clearance face of the cutting elements during orthogonal cutting of steel 15-5PH. Cappellini and Abeni developed a procedure for empirically determining tool wear on its rake and clearance faces and its implementation in the numerical simulation of turning hardened steel AISI 52100 [34]. Using a finite element model of the orthogonal cutting process of nickel alloy GH416, Zhai and colleagues studied the wear mechanism of ceramic cutting elements with the aim of subsequent optimization of cutting modes [35]. Wei et al. performed experimental and numerical studies of the types and mechanisms of wear in ball-disc friction pairs for 30CrNi2MoVA steel [36]. To simulate the wear, they used a modified Archard model. Hu and colleagues [37,38] have studied the wear resistance of cutting elements with structured surfaces when turning steel GH4169. Research has determined the optimal structural morphology that ensures the lowest wear. Studies by Jamali et al. [39] and Li et al. [40] are devoted to studying the wear of cutters with various designs using spatial numerical models of the cutting process. To predict the wear of face milling cutters, Jamali et al. used the Grey-Box methodology, which combines a finite element cutting model with empirical dependencies of the kinetic and thermal characteristics of the machining process [39]. Li and colleagues developed a three-dimensional numerical model for predicting the wear and ball-end milling cutters when machining titanium alloys [40]. Using a two-dimensional FEM cutting model, Veerappan et al. identified the machining conditions that minimize tool wear when turning AISI 4340 steel with a multilayer-coated tool [41]. Using a finite element model developed for the cutting process of tool steel and WC carbide inserts, Maeng and colleagues determined the structure morphology on the surfaces of the tool’s cutting elements, stabilizing the built-up edge at the tool tip [42]. This ensured protection of the tool rake and clearance face from significant wear.
The rapid development of machine learning and artificial intelligence applications for improving cutting operations has led to the use of these methods for predicting the wear of cutting tools. Shabana et al. developed a machine learning model that predicts wear and friction parameters for samples with coatings. This significantly reduced the number of experimental tests required [43]. A methodology for predicting the wear patterns of high-entropy alloy coatings using machine learning was developed by Sivaraman and Radhika [44]. The application of this methodology will enable the prediction of wear on coated cutting elements. Munaro and colleagues used machine learning techniques to develop models for predicting the wear of carbide tools during the drilling of AISI 9840 steel [45]. Bouchama and colleagues developed a methodology for predicting cutting tool wear by combining image analysis of chips generated during the cutting of 316 L stainless steel with machine learning [46]. The concept of digital image analysis developed by Mia et al. can be a significant support for evaluating the chips generated during the cutting process [47]. Karimi and colleagues studied the possibility of using artificial intelligence in conjunction with monitoring the tool’s working surfaces to further predict the wear of these surfaces [48].
An analysis of the performed studies indicates the predominant use of original, often empirical and hybrid, dependencies or the Archard model [49] and the Usui model [50] for evaluation and prediction of cutting tool wear. Herewith, experimental research and modeling of cutting tool wear are mainly accompanied by studies of the regularities of contact interaction between the tool and the chip and the workpiece (the regularities of friction in the corresponding cutting zones).
Basic information about frictional contact between solid bodies is presented in numerous publications (see, for example, the monograph by Bowden and Tabor [11], as well as the monograph by Bhushan [51]). The regularities of the mechanics of frictional contact interaction between machine parts are presented in Goryacheva’s monograph [52]. Generalized regularities and features of the contact interaction between the tool and the chips and the workpiece are presented in Astakhov’s monograph [53]. By means of numerical simulations, Özel systematically investigated the influence of various friction models (Coulomb, shear friction, Zorev’s variable models) on the behavior of contact characteristics at the chip-tool interface. He quantitatively showed that normal and friction stresses, temperature, and tool wear depend significantly on the choice of friction model [54]. In their review, Maranhão and Davim highlight the significance of friction parameters for simulation results, similar to the yield strength of the machined material. They point to an increase in contact length and plastic deformation zone with an increase in the friction coefficient, which leads to an increase in shear and normal forces and an increase in tool temperature [55]. A comparative study of various friction models: Zorev’s friction model, velocity-dependent friction model, and temperature-dependent friction model, performed by Yi et al., showed that the model choice significantly affects the predicted contact length, temperature distribution, and tool load. In particular, temperature-dependent models provide a much more realistic representation of thermal load compared to classical Coulomb models [56]. The study by Priesta et al. shows that a change in shear stress in a deformation-dependent friction model leads to a shift in the areas of adhesion and sliding in the secondary cutting zone. As the friction coefficient increases, the boundary of the adhesion area shifts toward the tool’s cutting edge, leading to a local increase in pressure and temperature [57]. Dirikolu and colleagues pointed out the key role in understanding the pressure distribution in the contact zone when separating static and dynamic friction. It has also been shown that high friction coefficients lead to a significant expansion of the static friction zone and, consequently, to a significant increase in the maximum contact pressure near the tool’s cutting edge [58]. Das et al. developed a simplified model for predicting cutting force using the characteristics of tribological contact in the secondary cutting zone [59]. Based on experimental studies of cutting forces and relative sliding velocity in contact between the tool and the machined material, and their influence on the tribological characteristics of this contact, Saxena et al. developed a methodology for machine learning algorithms that optimize the cutting process [60]. Using physical modeling of friction pairs under conditions of significant plastic deformation of AISI 1045 steel, Bejjani and Al Fleety established a relationship between the friction coefficient and the relative sliding velocity and normal contact force [61]. To calculate the actual friction coefficient under conditions of intermittent contact between the milling cutter and the machined material, Wu and his colleagues developed a friction model that makes it possible to determine tribological characteristics at various levels of tool wear [62]. Using pin-on-bar tests, Zhang et al. established the prevailing impact of relative sliding velocity and lubrication conditions in the contact between the tool and the machined material on the friction coefficient [63]. Applying the pin-on-disk tribometer, Villanueva et al. developed a method for estimating the material wear rate based on the area under the friction coefficient curve [64]. This method is most appropriate for use in the early stages of wear. Ventura and colleagues’ research focuses on determining tangential and normal stresses in the secondary cutting zone when machining aluminum alloy AA1085 and pure copper UNS C12000 [65]. The authors have established the need to limit the length of the tool rake face in order to reduce the friction coefficient. Mathews and colleagues used the full-field photoelasticity method to evaluate the stress distribution, tribological parameters, and relative displacement velocity in contact between the tool rake face and the chip [66]. Based on this, the authors proposed a new scheme for dividing the contact areas. Using high-speed imaging of the orthogonal cutting process of AISI 4140 steel, Denkena et al. determined the relationship between the contact length of the tool rake face with the chip and local friction coefficients, which were subsequently used to model the specified contact interaction [67]. Holey et al. developed and determined the parameters of a friction model taking into account the actual contact area of rough tool and chip surfaces for a finite element model of quasi-orthogonal cutting of AISI 4140 steel [68]. The research group Ning et al. compared the conventional approach to determining the tribological characteristics of self-lubricating copper/aluminum-graphite composites with methods for studying these characteristics using various machine learning algorithms [69]. The use of the latter ensures the possibility of predicting the friction characteristics with a significantly smaller number of tests. An interactive friction model with elements of friction parameter evolution for a spatial finite element model of tool steel AISI H13 cutting was developed by Mia and colleagues [70]. The application of this model provides for changes in cutting characteristics in alignment with changes in friction parameters during the cutting process. In their study, Zhang et al. evaluated the behavior of such physical parameters of temperature-dependent friction models as contact pressure, relative sliding velocity, and temperature, as well as their influence on cutting process characteristics [71]. The effectiveness of using the Coulomb friction model is indicated. Malakizadi and colleagues analyzed the application of various friction models in the Deform, Abaqus, and AdvantEdge software environments for orthogonal cutting of AISI 1045 and AISI 1080 steels [72]. As a result, it was determined that sliding-sticking and pressure-dependent shear friction models provide the best results when simulating cutting characteristics. Wolf et al. used a pin-on-disk test to determine local friction coefficients in tool-chip contact for local values of normal pressure and relative sliding velocity in the specified contact [73]. Using these results, local friction coefficients along the length of the tool-chip contact were predicted by applying a Grey-Box model in conjunction with an artificial intelligence algorithm.
Summarizing the analysis of studies on the tribological characteristics of the contact interaction between the tool and the machined material, the following conclusions can be stated: both experimental and numerical studies clearly indicate that with an increase in friction parameters, the local pressure, temperature and relative sliding velocity values in the specified contact change disproportionately. This indicates that the friction model has a predominant influence on the cutting process and, in particular, on the amount of tool wear. Thus, the choice of friction model plays a key role in predicting cutting tool wear.
3. Materials and Methods
The contact interaction between the cutting tool, and the chip and workpiece occurs in the secondary and tertiary cutting zones and is defined as the ratio of the tangential stress t to the normal stress s acting on the contact surfaces of the tool and the machined material within the respective cutting zone [74,75]. The specified contact interaction is divided into three areas: elastic contact area I, plastic area III, and transition zone II between them, as shown in Figure 1 (see the left diagram) [76]. The normal and tangential pressure epuries are indicated by sn and tn, respectively, and the epurie of the change in the movement speed of the machined material in different cutting zones is indicated by Vm. The length of the transition zone is usually negligible, especially in the tertiary cutting zone. Therefore, when analyzing the contact interaction between the tool and the machined material, only two areas are considered: the plastic and elastic contact areas, as shown in the middle diagram in Figure 1. In the vast majority of studies analyzing this contact interaction, the contact between the tool and the chip is considered [9,77,78], as well as the contact between the rounded area of the tool’s cutting part and the machined material [2,13]. In numerical models of the cutting process created in such common software environments as LS-Dyna, Abaqus, AdvantEdge, and DEFORM, the contact interaction between the tool and the machined material is extended to all contact zones and areas, namely the secondary and tertiary cutting zones, as well as the transition area of the cutting edge rounding (see Figure 1) [2,77].
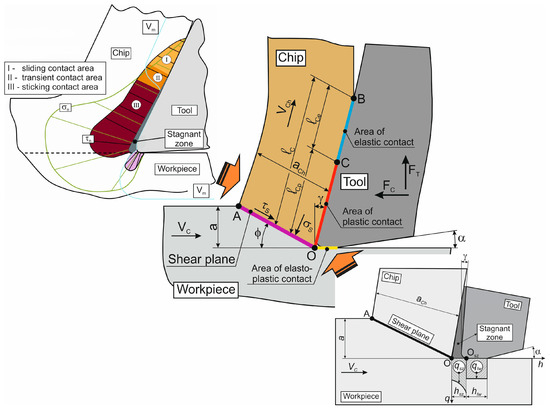
Figure 1.
Scheme for determining the contact interaction parameters between a cutting tool, chips, and a workpiece.
This contact interaction is described by various types of friction models (see Section 2), which are either built into the above-mentioned software environments or specially created by users and integrated into the general simulation algorithm of the numerical cutting model [2,4,13]. To implement various conditions of contact interaction between the tool and the machined material (various friction conditions), friction windows with different friction model parameters are used in separate areas of the cutting zones [76]. The study employs the DEFORM software environment [79] in which a finite element cutting model was developed and the required simulations were carried out. The most common friction—shear friction model (SFM), Coulomb friction model (CFM), hybrid friction model (HFM), and constant-tau model (CTM)—are integrated into DEFORM software environment and were selected for the subsequent simulations of the studied cutting process.
To evaluate the impact of different friction models on tool wear, a simulation-based approach was developed, in which wear is derived from local process parameters. The main idea is to analyze the values affected by friction models, in particular pressure, sliding velocity, and temperature in the contact between the tool rake face and the chip. These local values are used to determine wear indicators in conjunction with the wear models used, such as the Archard wear model [49] and the Usui wear model [50]. To evaluate the impact of these friction models on the predicted tool wear during cutting, a special methodology was developed, the flowchart of which is shown in Figure 2.
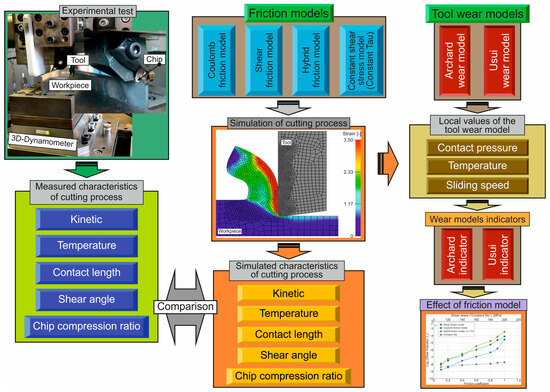
Figure 2.
Methodology scheme for determining the effect of the friction model type on the wear model indicators.
In the cutting process, orthogonal cutting is used, which provides the possibility of reliable and stable determination of the main characteristics of the cutting process during the thermo-mechanical contact interaction of the tool with the machined material [2,80,81,82]. The first stage of the developed methodology is devoted to the experimental determination of the main characteristics of the cutting process. The following characteristics were considered: cutting force Fx and thrust force Fz, cutting temperature in the primary cutting zone TI, total contact length of the rake face of the tool cutting edge with the chip L, shear angle f, and chip compression ratio Ka. The next step involved simulating the specified characteristics of the orthogonal cutting process using a developed two-dimensional finite element cutting model and comparing the simulated and experimentally measured characteristics of the cutting process. Simulation of the main characteristics of the cutting process was performed for various types of friction models, as shown in the flowchart in Figure 2. The third stage of the developed methodology was devoted to the simulation-based determination of local values included in the dependence for determining the tool wear value. The well-known and proven Archard wear model [49] and Usui wear model [50] were used as tool wear models. These models are often used in finite element cutting models to simulate cutting process characteristics, taking into account the tool wear [2,13,77]. The contact pressure in the secondary cutting zone (in the contact area between the tool rake face and the chip), the temperature at this contact, and the relative sliding velocity between the tool rake face and the chip were used as local variables to determine the tool wear according to the Archard wear model and Usui wear model. In the fourth and final stage of the methodology for estimating the impact of the friction model type on tool wear, based on local values simulated during the third stage, wear indicators for the used tool wear models were determined. These indicators were determined for each friction model (see stage two). As a result of carrying out these four stages, which together constitute a methodology for evaluating the influence of friction models on the predicted tool wear during the cutting process, the influence of the used models was determined.
3.1. Materials
Experimental studies of the above-mentioned main characteristics of the machining process were carried out on a special test stand that implements the orthogonal cutting process [82,83]. The cutting process was performed dry, and the cutting depth was a = 0.2 mm for all performed tests. The cutting speed VC varied across five levels and was 48 m/min, 72 m/min, 96 m/min, 144 m/min, and 192 m/min. The steel AISI 1045 was used as the machined material, the mechanical and thermal properties of which are shown in Table 1.

Table 1.
Mechanical and thermal properties of the steel AISI 1045 and carbide inserts [83,84,85].
Pre-annealed and normalized workpieces with a hardness of HBW 180 and dimensions of 150’60’3 mm were clamped in a Kistler dynamometer model 9121, which ensures the measurement of the following cutting force components: cutting force FX and thrust force FZ. The measurement error of the cutting force components ranged from 9% to 11%. Carbide cutting inserts SNMG 15 06 12-SM from Sandvik Coromant were used as cutting elements. When assembled with the tool body, these cutting inserts formed a tool rake angle of the cutting wedge of the tool g = 0° and a rear angle a = 8°. The rounding radius of the cutting edge was 20 µm. These geometric parameters of the tool were used for all experimental studies. The geometric parameters of the carbide cutting inserts were achieved through preliminary and subsequent finish grinding of the clearance face of the cutting wedge using tools equipped with superhard materials [86]. In parallel with the measurements of the cutting forces, the temperature measurement of the machined material in the primary cutting zone TI was performed during orthogonal cutting. The specified temperature TI was measured using a high-speed pyrometer IGA-740 LO by LumoSense on the outer side of the chips in the area where the workpiece material transitions into chips, according to the methodology described in [84,87]. Individual temperature measurements for each cutting speed value were repeated at least five times. The calculated measurement error did not exceed 11%.
Along with measurements of the cutting forces and temperature of the machined material in the primary cutting zone, the total length of contact L between the tool rake face and the chip (see lC in Figure 1) was also measured using a special camera, according to the method described in [88]. Each individual test was repeated at least 5 times, and the results obtained were averaged. The measurement error of the contact length ranged from 8% to 10%, with higher error values observed at high cutting speeds VC. During each experimental test, chips formed during the cutting process were collected. Each set of chips was prepared in the form of a metallographic slice in accordance with the method described in [89]. The metallographic slices were used to measure the chip thickness aCh using a Carl Zeiss Axio Observer optical microscope (see [89]). Each chip thickness measurement was performed at least three times, and the measurement error did not exceed 8%. The chip compression ratio Ka was determined based on the chip thickness aCh and cutting depth a using the known equation [74,75,80]:
The shear angle f of the conditional shear plane was determined by direct measurements on metallographic slices of chip roots, in coincidence with the methodology described in a previously published paper [90]. Each shear angle f measurement was repeated at least five times for every cutting speed value. As a result, the measurement error of the shear angle f did not exceed 11%.
3.2. Methods
In accordance with the developed methodology (see above), two well-known wear models are used to assess the effect of the friction model type on the prediction of cutting tool wear: the Archard wear model [49] and the Usui wear model [50]. The tool wear value in coincidence with the Archard wear model is determined by the following dependence, either in linear form [49]:
or in the local differential form [49]:
where Vwear ist the total volume of tool material wear, hwear is the local linear wear, k is the material- and system-dependent empirical factor, t is the time, Fn is the normal force on the contact surface, s is the total sliding distance, p is the local compression stress at the contact surface, Vs is the relative velocity between workpiece and tool at the contact surface, H is the hardness of the tool material.
The tool wear value in accordance with the Usui wear model is determined by the following linear relationship [49]:
where k0 is the experimentally determined material parameter, Q is the activation energy for wear (Q lies within the range of 40 to 300 kJ/mol for metallic materials), R is the universal gas constant R = 8.314 J/(mol⋅K), T is the local temperature at the contact surface.
Based on dependencies (3) and (4), the generalized tool wear value of the tool cutting elements for the two wear models used can be determined by the following function:
where C is the scaling factor.
Parameter C is unknown, but it is a constant factor. The value of this parameter is necessary to determine the specific tool wear value. Consequently, parameter C only affects the numerical value of wear. The regularities of tool wear changes are determined by the thermomechanical characteristics of the cutting process, which are included in Equation (5): pressure p, relative sliding velocity Vs, and temperature T at the contact surface between the tool and the machined material. Therefore, parameter C can be omitted, and the assessment of the impact of various types of friction models on the wear of tool cutting elements is further performed by analyzing the function f(p, Vs, T), which for the Archard wear model takes the following expression:
and for the Usui wear model:
The following statements are postulated for the specified analysis:
- ➢
- The analysis of the effect of contact interaction model type between the tool and the machined material (friction model) is performed using a wear indicator, which is a function of the effect of local thermomechanical characteristics of the cutting process on tool wear:where ℜ is the existence space of cutting process states (conditions), SC is the cutting process state, SCn is the final state of the cutting process, SC1 is the initial state of the cutting process.
- ➢
- The analysis of the effect of friction model type using the Archard wear model is performed using the Archard indicator:
- ➢
- The analysis of the effect of friction model type using the Usui wear model is performed using the Usui indicator:
These wear indicators are subsequently used to analyze the effect of the friction model type on the predicted cutting tool wear. To do this, the average values of pressure pave, relative sliding velocity vs. ave, and temperature Tave at the contact between the rake face of the cutting tool and the chip are determined by simulating the orthogonal cutting process (see description of methodology, step 3). The Archard indicator value is then presented in absolute terms:
and normalized value, relative to the maximum values of pressure pmax and relative sliding velocity vs. max:
This ensures relative comparability of the effect of the friction model on potential wear when using the Archard wear model. Thus, the analysis performed remains relatively comparative, without claiming absolute accuracy of predictions. The numerical values of the wear indicator according to the Usui model are very small in magnitude, since the exponent takes rather large negative values. When calculating the wear indicator according to the Usui model, the activation energy for wear Q was taken to be 150 kJ/mol. Taking into account these absolute results, in order to analyze the effect of the friction model type on tool wear, the numerical value of the Usui indicator is presented below in logarithmic form:
Determination of the effect of friction model type on the main characteristics of the orthogonal cutting process (cutting force FX and thrust force FZ, temperature of the machined material in the primary cutting zone TI, total contact length L (lC in Figure 1) between the tool rake face and the chip, chip compression ratio Ka and shear angle f), as well as on the local average and maximum values of pressure p, relative sliding velocity Vs, and temperature Tave in contact between the rake face of the tool cutting wedge and the chip, were determined by simulating the cutting process using various types of friction models built into the finite element software environment: Constant Shear, Coulomb, Hybrid, and Constant Tau (Tau shear stress). To simulate the cutting process, a 2D finite element model of the orthogonal cutting process was used, developed on the basis of an updated implicit Lagrangian formulation method. Its geometric model, mesh, and boundary conditions are shown in Figure 3. The material of the tool’s cutting part (carbide insert) was chosen to be absolutely rigid, and the type of workpiece material (machined material) was chosen to be isotropic plastic. The workpiece was rigidly fixed in all directions along the X and Y coordinate axes. The tool was given a working movement with the cutting speed VC in the negative direction of the X coordinate axis. The feed, which in the orthogonal cutting process is also the cutting depth a, was 0.2 mm. The tool movement in the direction of the Y-axis was rigidly fixed. The initial thermal conditions with room temperature Tr were set at the bottom of the workpiece and on the right and top tool sides.
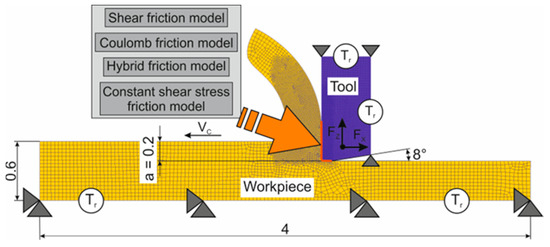
Figure 3.
Geometry of the cutting tool and workpiece, as well as mesh and boundary conditions of the FE model for the orthogonal cutting process.
The fundamental part of the finite element model of cutting, which significantly determines the simulation process and its results, is a triad of component models: the material model [91], the damage model of the machined material [92], and the model of contact interaction between the cutting tool, chips, and workpiece (friction model). The Johnson-Cook constitutive equation [93] is used as the model of the machined material (AISI 1045 steel):
where σs is the yield point, A is the initial yield stress, B is the stress coefficient of strain hardening, n is the power coefficient of strain hardening, C is the strain rate coefficient, m is the power coefficient of thermal softening, ε is the strain, is the strain rate, is the reference value of the strain rate, T is the actual temperature, T0 is the reference or room temperature, and Tm is the melting temperature of the machined material.
The parameters of the Johnson–Cook constitutive equation for subsequent simulations are taken from previously published studies [84,88] and are presented in Table 2.
Table 2.
Constitutive equation parameters.
The damage model of the machined material [92,94] is typically used in finite element models of cutting processes when machining difficult-to-machine materials, such as titanium and nickel alloys, austenitic steels, etc., during which shear band chips are generated [74,75]. For numerical modeling of the cutting process of structural steels, which include the AISI 1045 steel used in this study, the damage model of the machined material is not applied in the vast majority of cases. Therefore, this component of the model was not used in the finite element cutting model. As mentioned above, four different friction models built into the DEFORM software environment were used [79,91]: SFM, CFM, HFM, and CTM. The action of these friction models extended to the secondary and tertiary cutting zones, as well as to the transition area of the tool cutting edge rounding between them (see Figure 3).
Subsequently, the finite element model of orthogonal cutting described above was used for numerous simulations of the main characteristics of the cutting process and the local characteristics of the contact between the tool and the machined material.
4. Results
The first research stage is devoted to experimental studies of the main characteristics of the orthogonal cutting process, as indicated in the developed methodology (see Section 3). Figure 4 shows the dependencies of the cutting force components: cutting force FX and thrust force FZ on the cutting speed.
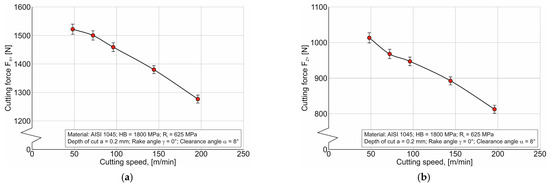
Figure 4.
Dependence of cutting force components on cutting speed: (a) cutting force FX; (b) thrust force FZ.
As the cutting speed increases from 48 m/min to 192 m/min, the cutting force components decrease monotonically. This is explained by the prevailing effect of isothermal softening of the machined material with an increase in cutting temperature in contact between the tool and the chip and the workpiece over the adiabatic hardening of this material due to its plastic deformation, as well as over the high-speed hardening of the machined material [74,75].
Figure 5 demonstrates a monotonic increase in the temperature of the chip’s outer side in the area where the machined material transitions into a chip, taken as the temperature in the primary cutting zone [87], with an increase in cutting speed. This cutting temperature behavior is fully consistent with numerous previous studies (see, for example, [10,78,81]) and is due to an increase in plastic deformation work when the cutting wedge is penetrated into the machined material [74,80] and an increase in the contribution of friction in the contact between the tool cutting element and the chip and workpiece at significant cutting speeds [75,84].
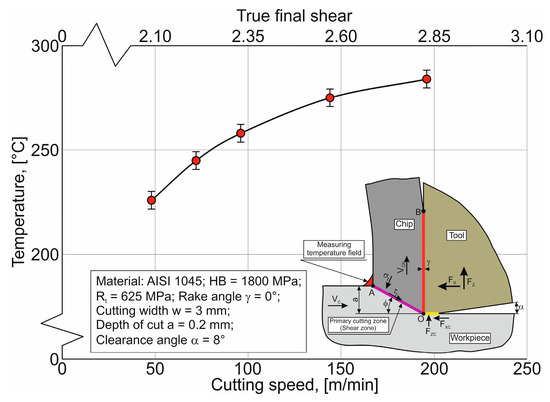
Figure 5.
Change in temperature in the primary cutting zone with an increase in cutting speed.
With an increase in cutting speed from 48 m/min to 144 m/min, the contact length of the tool rake face with the chip monotonically decreases, and with a further increase in cutting speed to 192 m/min, this characteristic increases slightly—Figure 6. The monotonous decrease in contact length with increasing cutting speed can be explained by the interaction of thermomechanical phenomena in the cutting zones [81,82]. As the cutting speed increases, the rate of plastic deformation of the machined material increases significantly, resulting in this deformation occurring in a narrower area in front of the tool’s cutting wedge [75].
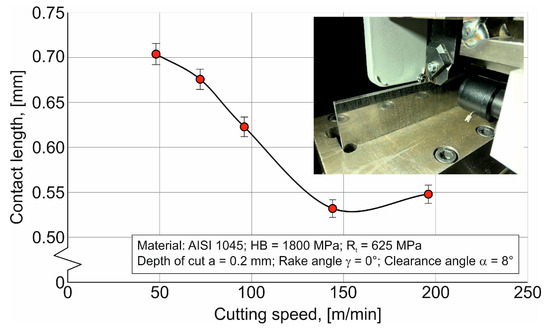
Figure 6.
Dependence of chip contact length with the tool rake face on cutting speed.
This causes a reduction in the contact length between the tool and the chip. Simultaneously with the change in the behavior and shape of the plastic deformation of the machined material, there is an intense increase in temperature in the cutting zones. On the one hand, this leads to a further reduction in the plastic area [74] and, consequently, to an additional reduction in the contact length, and on the other hand, it contributes to a significant acceleration of heat removal from the cutting zones together with the chips [87]. The latter contributes to the fact that high cutting temperatures in the local area do not have time to spread over the entire contact length, which also contributes to a reduction in contact length. In addition, an increase in cutting speed leads to a reduction in the chip curling radius and, as a result, to a reduction in contact length. A slight increase in contact length when the cutting speed is increased to 192 m/min is explained by inertial phenomena, as a result of which the chips are pressed against the tool rake face under the action of inertial forces, thereby increasing the contact length [88].
The effect of cutting speed on the shear angle f is shown in Figure 7. An increase in cutting speed within the range studied causes a monotonic increase in the shear angle from approximately 21° to almost 35°. The increase in the shear angle is due to a change in the plastic deformation nature of the machined material when the tool’s cutting wedge is penetrated into it and the form of this deformation (see above). More intense plastic deformation of the machined material causes an increase in the inclination angle of the primary cutting zone and, as a result, a corresponding increase in the shear angle f.
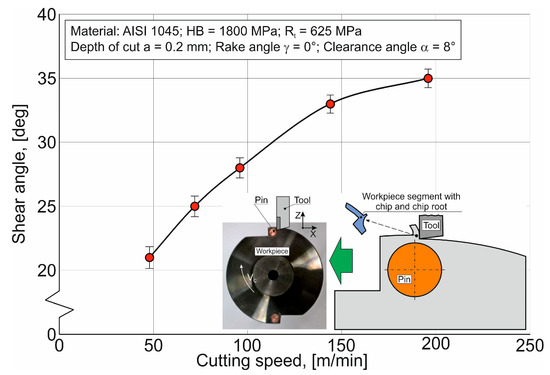
Figure 7.
The effect of cutting speed on the shear angle.
The relationship between chip compression Ka and cutting speed VC is shown in Figure 8. As the cutting speed is increased, chip compression monotonically decreases according to a hyperbolic law.
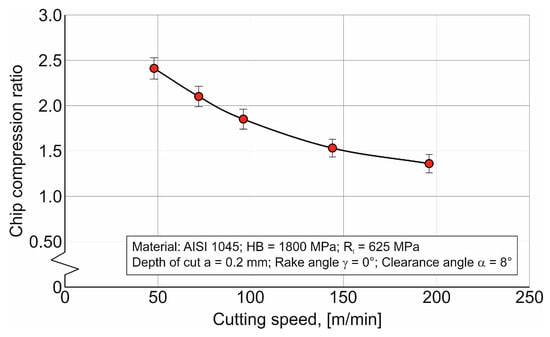
Figure 8.
Relationship between the chip compression ratio and the cutting speed.
The reason for this relationship is a change in the deformation mechanism of the machined material [75,81]. At low cutting speeds (up to approximately 30 m/min for structural steels), the strain rate in the primary shear zone is relatively low. Under these conditions, the material deforms more slowly, which promotes localized fracture rather than continuous shearing. As a result, the separation of the workpiece material occurs in successive spalling events, i.e., discontinuous or fragmented chips are formed. This mechanism is accompanied by large plastic strains and thus leads to a high chip compression ratio [74,78]. As the cutting speed increases, the strain rate rises, continuous shearing becomes dominant, and flow-type chips are generated. Such a change in the deformation mechanism of the machined material reduces the overall plastic strain and consequently decreases the chip compression ratio [75,78,81]. This effect is particularly pronounced in more ductile materials such as steels.
According to the developed research methodology, in the second stage, the main characteristics of the orthogonal cutting process (see Section 3) were simulated, the experimental studies of which were the subject of the first stage. Numerical simulations of these characteristics were performed for various friction models mentioned earlier using the developed finite element cutting model (see Figure 3). Figure 9 shows the influence of friction model parameters used for numerical simulation of the main characteristics of the cutting process on the cutting forces FX and FZ. For comparison, these figures also show the experimental value of the cutting force components at a cutting speed of VC = 96 m/min, at which the numerical simulations were also performed (see Figure 9a,b). The experimental values of the main characteristics of the orthogonal cutting process shown in the following diagrams also correspond to the specified cutting speed.
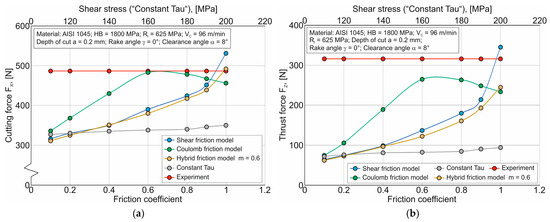
Figure 9.
Dependence of cutting force components on friction coefficient and shear stress: (a) cutting force FX; (b) thrust force FZ.
It should be noted that when using a two-dimensional finite element cutting model in the DEFORM software environment, the thickness of the machined workpiece is automatically assumed to be 1 mm. At the same time, the actual workpiece thickness was 3 mm (see Section 3.1). Therefore, in order to compare the simulated cutting force components with the corresponding experimental values, the latter were recalculated for a workpiece thickness of 1 mm. For this, the values of the FX and FZ components were divided by 3. In addition, the considered diagrams, as well as the subsequent ones, use two abscissa axes: one representing the friction coefficient µ for the curves obtained with SFM, CFM, and HFM, and the other representing the shear stress for the curve obtained with the CTM friction model. It should also be noted that the results of simulating the main cutting process characteristics (see Figure 9, Figure 10, Figure 11, Figure 12 and Figure 13) obtained with SFM correspond to a parameter value of m = 0.6.
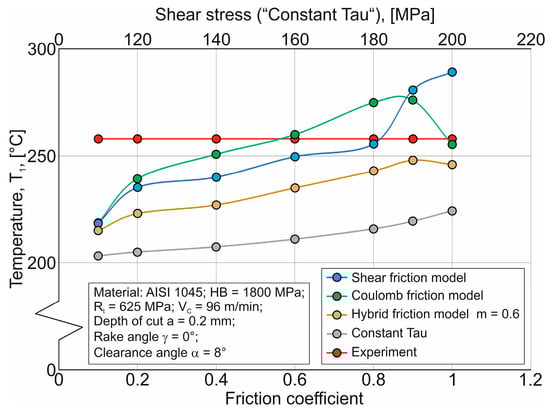
Figure 10.
Change in temperature in the primary cutting zone with an increase in friction coefficient and shear stress.
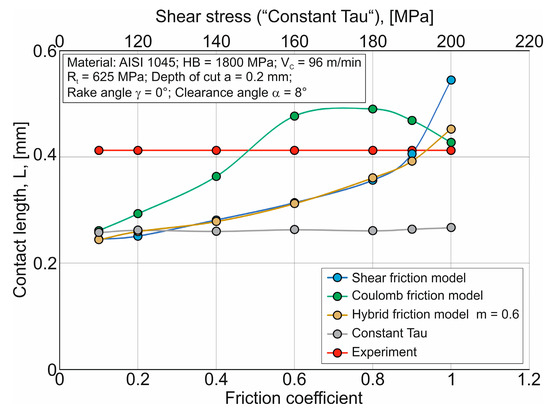
Figure 11.
Dependence of chip contact length with the tool rake face on friction coefficient and shear stress.
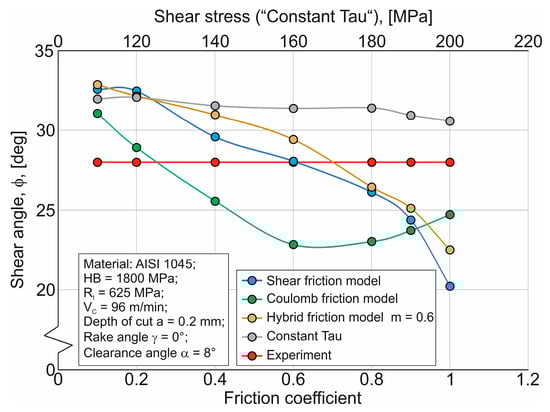
Figure 12.
The effect of friction coefficient and shear stress on the shear angle.
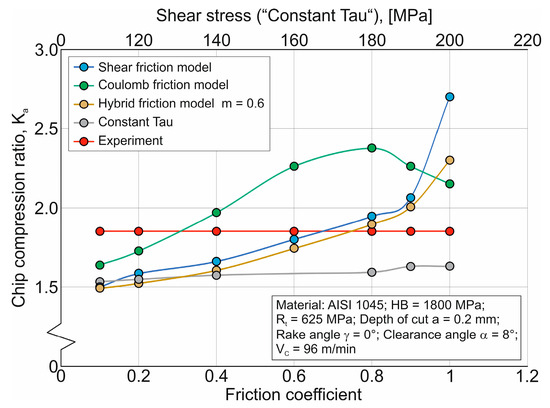
Figure 13.
Relationship between the chip compression ratio and the friction coefficient as well as shear stress.
With an increase in the friction coefficient µ and shear stress in the contact between the tool cutting part and the machined material, the simulated cutting force FX also increases when using the SFM, HFM, and CTM friction models (see Figure 9a). When using the CFM, the force FX increases, and at friction coefficient µ » 0.7 decreases slightly. Comparing the simulated cutting force values FX and its experimentally determined value, it can be stated that significant values of the friction coefficient µ when using the SFM and HFM friction models provide fairly good opportunities for predicting the force FX. Similar results can be observed when using the CFM with friction coefficient values µ ranging from approximately 0.6 to 0.7 (see Figure 9a). The smallest effect on the cutting force FX is caused by a change in shear stress within the studied range from 100 MPa to 200 MPa when using the CTM friction model. At the same time, the simulated values of the cutting force FX differ significantly from its experimental value (see Figure 9a). The friction coefficient µ and shear stress in contact between the tool cutting part and the machined material have a similar effect on the thrust force FZ when using all studied friction models (see Figure 9b). However, only the SFM friction model provides the possibility of satisfactory prediction of thrust force FZ when using the maximum value of the coefficient µ = 1.
An increase in the friction coefficient µ and shear stress at the contact between the tool cutting element and the machined material results in an increase in the simulated temperature of the primary cutting zone TI across the whole range of changes in the specified coefficient and shear stress for all studied friction models (see Figure 10). Only when using the maximum values of the coefficient µ for the CFM and HFM do the values of the simulated temperature TI decrease slightly. Comparing the simulated values of temperature TI and its experimental value, it can be assumed that the use of the SFM, HFM, and CFMs has quite good potential for predicting the specified temperature. For using the CTM friction model to predict the temperature TI, it is also necessary to apply the effect potential of the constitutive equation parameters (material model parameters) on the cutting temperature simulation process.
The effect of the friction coefficient µ on the simulated contact length L of the tool rake face with the chip when using SFM, HFM, and CFM is qualitatively similar to this effect on the cutting force components and temperature in the primary cutting zone: as the coefficient µ increases, the simulated value of the contact length L increases—Figure 11. The use of SFM, HFM, and CFM ensures good possibility of predicting the length L, as evidenced by the intersection of simulated values of contact length curves with their experimental value. The influence of shear stress on length L when using the CTM friction model is practically absent, and the absolute values of the simulated contact length in this case are significantly less than the experimentally measured value of L (see Figure 11).
An increase in the friction coefficient µ and shear stress at the contact between the tool cutting element and the machined material leads to a decrease in the simulated shear angle f values when using the SFM, HFM, and CTM friction models—Figure 12. The effect of the coefficient µ on the simulated values of the angle f when using the CFM friction model has an extreme character, with a break occurring at friction coefficient values ranging from approximately 0.6 to 0.7. Similarly to the effect of the friction coefficient µ on other basic characteristics of the cutting process, the use of SFM, HFM, and CFM has good potential for predicting the shear angle. The simulated shear angle f values obtained with the CTM friction model are significantly lower than the measured values across the entire range of shear stress variation at the tool–machined material contact (see Figure 12).
The simulated chip compression ratio Ka when using the SFM, HFM, and CTM friction models increases with an increase in the friction coefficient µ and shear stress at the contact between the tool cutting part and the machined material (see Figure 13). The increase in the value of Ka is particularly pronounced at maximum values of the friction coefficient µ when using the SFM and HFM friction models. The nature of the effect of changes in the coefficient µ on the chip compression ratio when using the CFM friction model is extremely similar to the effect of this coefficient on other basic characteristics of the studied cutting process (see Figure 9, Figure 10, Figure 11 and Figure 12). For certain values of the friction coefficient µ, when using the SFM, HFM, and CFM friction models, the curves of the simulated chip compression ratio Ka values intersect the line representing the experimental value of Ka (see Figure 13). This indicates a stable ability to predict the value of Ka. The curve of simulated chip compression ratio values obtained using the CTM friction model lies significantly below the experimental value Ka for all shear stress values. Thus, in order to predict the chip compression ratio, in addition to the CTM friction model parameters, the material model parameters must also be determined, unlike the parameters used in the case for other friction models. It is quite possible that when simulating the cutting process of difficult-to-machine materials, in order to predict the value of Ka, it is necessary to add the determination of the parameters of the damage model of the machined material to the above.
The above analysis of the coefficient µ’s effect on the simulated values of the main characteristics of the orthogonal cutting process when using the HFM friction model was performed at a friction factor m = 0.6. Figure 14 shows the results of the simultaneous effect of the friction coefficient µ and friction factor m on the analyzed main characteristics of the cutting process. Analysis of these diagrams suggests that it is possible to predict these main characteristics using the HFM friction model. The only exception is the effect of the coefficient µ and factor m on thrust force FZ (see Figure 14b). If it is necessary to predict this component of the cutting force using the HFM friction model, it is also necessary to connect the process of determining the parameters of the material model and, possibly, the damage model of the machined material (see above). It should also be noted that to predict the cutting force FX, the temperature of the machined material in the primary cutting zone TI, and the contact length L of the tool rake face with the chip, it is necessary to use the maximum value of the friction factor m (see Figure 14a, Figure 14c, and Figure 14d, respectively). To predict the shear angle f and chip compression ratio Ka, it is also possible to use significantly smaller values of factor m (see Figure 14e and Figure 14f, respectively).
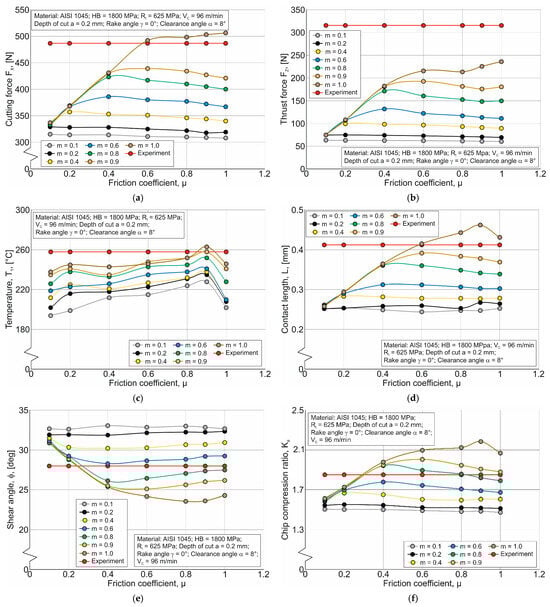
Figure 14.
Effect of hybrid friction model parameters on the fundamental characteristics of the cutting process: (a) cutting force FX; (b) thrust force FZ; (c) temperature in the primary cutting zone TI; (d) chip contact length with the tool rake face L; (e) shear angle f; (f) chip compression ratio Ka.
The next step in studying the effect of friction model type on potential cutting tool wear, according to the developed methodology, was the simulation-based determination of the local values required to calculate wear indicators in the Archard and Usui models. These included the tool wear value, the average and maximum contact pressure between the tool’s cutting surface and the workpiece, the average and maximum relative sliding velocity between the tool and the workpiece, as well as the average contact temperature. Based on these values, the corresponding wear indicators were subsequently determined (see Section 3).
The effect of the friction coefficient µ and shear stress in contact between the tool cutting part and the machined material on the absolute and normalized Archard model wear indicator is shown in Figure 15. With an increase in the coefficient µ and shear stress, both the absolute value of the wear indicator IArch and its normalized value IArch norm decrease monotonically over most of the curve (see Figure 15a,b).
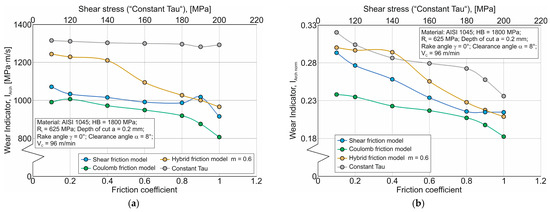
Figure 15.
Effect of friction coefficient and shear stress of the tool cutting edge with the machined material on wear indicators using the Archard model: (a) absolute value of the wear indicator IArch; (b) normalized wear indicator value IArch norm.
Figure 16 shows the effect of the friction coefficient µ and shear stress at the contact between the tool cutting part and the machined material on the logarithm of the Usui model wear indicator log10(IUs) (see Equation (13)). An increase in the friction coefficient µ and shear stress at the contact between the tool cutting part and the machined material results in an increase in the predicted wear according to the Usui model. The degree of this increase is approximately the same for the SFM, HFM, and CFM friction models, with the highest predicted wear expected when using the HFM (see Figure 16).
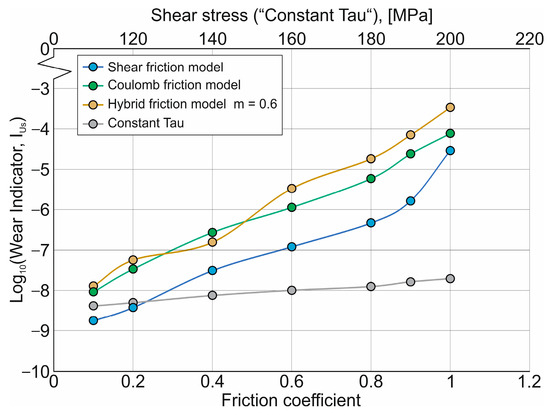
Figure 16.
Effect of friction coefficient and shear stress of the tool cutting edge with the machined material on wear indicators using the Usui model.
5. Discussion
In accordance with the developed methodology for analyzing the effect of the contact interaction type between the tool and the machined material (see Section 3) and with the formulated main (see Equation (8)) and additional postulates (see Equations (9) and (10)) for the specified analysis, the absolute and normalized wear indicators of the Archard model (see Equation (11) and Equation (12), respectively) and the wear indicator of the Usui model (see Equation (13)) are used.
An analysis of the local thermomechanical characteristic effect on the cutting process has determined that as the coefficient µ and the shear stress increase, the Archard wear indicator decreases (see Figure 15). It should be noted that the type of friction model has a more pronounced effect on the normalized wear indicator IArch norm. The gradient of the friction model parameters’ effect on the normalized wear indicator IArch norm is approximately the same (see Figure 15b). At the same time, the highest value of IArch norm, and, consequently, the highest predicted wear value, is observed when using the CTM friction model, and the lowest when using the CFM friction model. This nature of the friction model’s effect on the normalized wear indicator IArch norm is explained by the local and maximum pressure values at the contact between the tool cutting part and the machined material, and the relative sliding velocity between the machined material and the tool, as well as the interaction of these values in the equation for determining the normalized wear indicator (see Equation (12)). Figure 17 demonstrates the change in the aforementioned local thermomechanical characteristics depending on the parameters of the studied friction models: the coefficient µ and shear stress in the contact between the tool and the machined material. The average and maximum values of contact pressure monotonically increase to varying degrees with an increase in the friction coefficient µ and shear stress when using the discussed friction models (see Figure 17a,c,e,g). At the same time, the average and maximum values of the relative displacement velocity of the tool cutting part and the machined material decrease almost monotonically to varying degrees when using practically all the studied friction models (see Figure 17b,d,f,h). In all likelihood, the effect of the numerical value of the average sliding velocity, as a multiplier in the equation for determining the absolute value of the wear indicator according to the Archard model (see Equation (11)), prevails over the effect of the numerical value of the average contact pressure. Therefore, with increasing µ and shear stress, the absolute value of the wear indicator IArch decreases (see Figure 15a). Naturally, when using different friction models, the degree of this reduction also differs from one another (see above). At the same time, the nature of the change in normalized pressure values in contact between the tool and the machined material is unique for each considered friction model. When using the SFM, the normalized pressure value decreases monotonically as the friction coefficient µ increases to a value of 0.8, and then increases sharply for the maximum values of this coefficient (see Figure 17a). At the same time, the normalized value of the relative velocity decreases with an increase in the coefficient µ, and the degree of this decrease increases in the region of maximum values of this coefficient (see Figure 17b). When using the CFM friction model, the normalized pressure increases across the entire range of friction coefficient increases (see Figure 17c), while the normalized value of the relative displacement velocity decreases monotonically (see Figure 17d). The change in the normalized pressure value with an increase in the coefficient µ when using the HFM friction model is similar to the change in the corresponding pressure when using the SFM (see Figure 17e). At the same time, the change in the normalized value of the relative displacement velocity decreases slightly with an increase in the friction coefficient to a value of 0.4, and then the degree of this decrease increases significantly with a subsequent increase in the coefficient µ (see Figure 17f). Finally, when using the CTM friction model, both the normalized pressure value and the normalized relative displacement velocity decrease almost monotonically with increasing shear stress at the contact between the tool cutting part and the machined material (see Figure 17g and Figure 17h, respectively). There is no doubt that the nature of the change in the pressure normalized values and relative displacement velocity is due to the different effects of the used friction model on the local and maximum values of pressures and relative displacement velocities. However, despite the differences in the nature of the changes in the considered normalized values, the wear indicator IArch norm decreases almost monotonically with an increase in the friction coefficient µ and shear stress (see Figure 15b). In all likelihood, the differences in the nature of the change in the pressure normalized values and the relative displacement velocity compensate each other, leading to a fairly pronounced change in the IArch norm wear indicator.
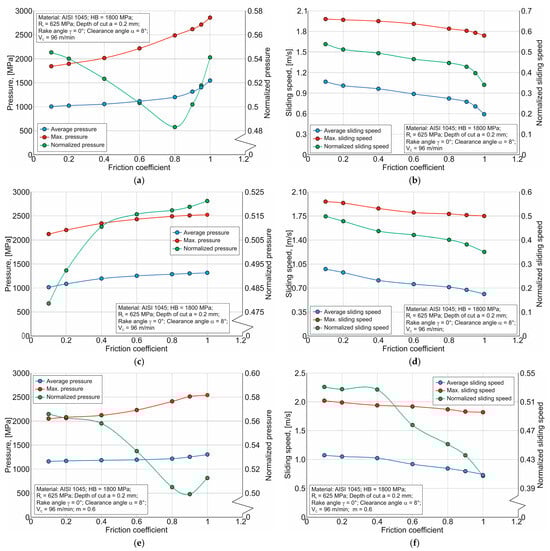
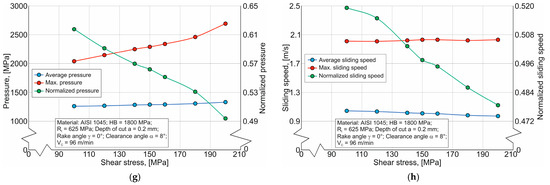
Figure 17.
Average and maximum local components, as well as their ratios, of the wear indicators in the Archard and Usui models: (a) pressure p for the shear friction model; (b) sliding speed VC for the shear friction model; (c) pressure p for the Coulomb friction model; (d) sliding speed VC for the Coulomb friction model; (e) pressure p for the hybrid friction model; (f) sliding speed VC for the hybrid friction model; (g) pressure p for the Constant Tau friction model; (h) sliding speed VC for the Constant Tau friction model.
As mentioned earlier (see Section 4), mutual changes in the local thermomechanical characteristics of the cutting process lead to a significant increase in the wear indicator according to the Usui model with an increase in the friction coefficient µ and shear stress. The degree of this increase is approximately the same for the SFM, HFM, and CFM friction models, with the highest predicted wear expected when using the HFM (see Figure 16). The friction model parameter (shear stress) has the least effect when using the CTM. When using this friction model, the least wear, as determined by the Usui model, should be expected. This effect of friction model parameters on the value of predicted wear according to the Usui model is explained by the interaction of local values of average pressure at the contact between the tool cutting part and the machined material, the relative displacement speed, and the average temperature in the specified contact. In this interaction, the greatest effect is caused by the temperature TII in the secondary cutting zone, whose dependence on the friction coefficient µ and shear stress for the considered friction models is shown in Figure 18.
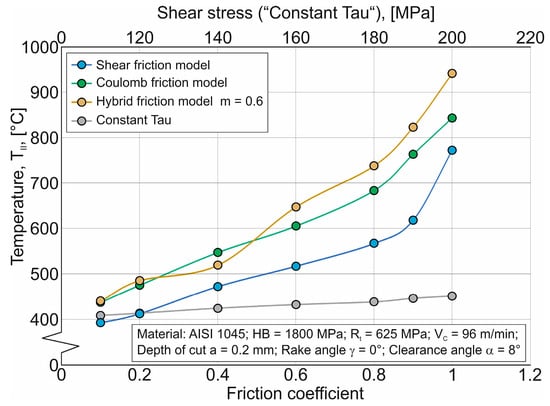
Figure 18.
Average temperature, as well as their ratios, of the Usui-model wear indicator.
In all likelihood, the predominant effect of temperature in the contact between the tool cutting part and the machined material in determining the wear indicator IUs of the Usui model is explained by the morphology of the equation for determining this indicator (see Equations (4), (10) and (13)), in which the temperature value is included as a number degree.
6. Conclusions
This study examined the effect of friction models in finite element simulations of cutting on predicted tool wear. Four friction laws commonly implemented in commercial software were considered: shear, Coulomb, hybrid, and constant shear stress (constant tau). To evaluate their influence, a methodology was developed in which tool wear is assessed through wear indicators defined by the Archard and Usui models. The friction coefficient µ, the friction factor m, and the shear stress at the tool–workpiece interface (for the constant tau model) were used as friction model parameters.
In the Archard approach, wear indicators were determined from averaged local and normalized values of contact pressure and sliding velocity. In the Usui approach, they were derived from averaged local values of pressure, sliding velocity, and contact temperature.
The results showed a strong dependence of wear indicators on friction parameters. According to the Archard model, wear indicators decrease almost monotonically with increasing µ and shear stress, with the highest values predicted for the constant tau model and the lowest for the Coulomb model. In contrast, the Usui model predicts increasing wear indicators with rising µ and shear stress, with similar growth trends across the shear, Coulomb, and hybrid models. The highest wear was predicted for the hybrid model, while the constant tau model yielded the lowest values. The increase predicted by the Usui model is mainly explained by the dominant role of contact temperature compared with pressure and sliding velocity.
The developed methodology for analyzing the effect of tool–workpiece contact interaction can be applied to other cutting process characteristics. It may therefore be used to improve the reliability of tool wear predictions, supporting both the development of new machining strategies and the optimization of existing ones.
Author Contributions
Conceptualization, M.S.; methodology, M.S.; software, M.S.; validation, M.S., O.M. and Y.S.; formal analysis, M.S.; investigation, M.S., O.S., A.G. and O.V.; resources, M.S., O.M. and Y.S.; data curation, M.S., A.G. and O.V.; writing—original draft preparation, M.S.; writing—review and editing, M.S.; visualization, M.S., O.S., A.G. and O.V.; project administration, M.S. and O.M.; funding acquisition, Y.S., O.M. and M.S. All authors have read and agreed to the published version of the manuscript.
Funding
This research was supported by the university’s ongoing funding. No additional grants were received to carry out or supervise this particular study.
Data Availability Statement
The authors confirm that the data used to support the findings of this study are included within the article.
Acknowledgments
The authors gratefully acknowledge the support of the Zhytomyr Polytechnic State University, which is sincerely appreciated.
Conflicts of Interest
The authors declare no conflicts of interest. The funders had no role in the design of the study; in the collection, analyses, or interpretation of data; in the writing of the manuscript; or in the decision to publish the results.
References
- Jawahir, I.S.; Attia, H.; Dix, M.; Ghadbeigi, H.; Liao, Z.; Schoop, J.; Shokrani, A. Revisiting machinability assessment: Towards total machining performance. CIRP Ann. 2025, 74, 817–842. [Google Scholar] [CrossRef]
- Attia, H.; Sadek, A.; Altintas, Y.; Matsubara, A.; Umbrello, D.; Wegener, K.; Eisseler, R.; Ducobu, F.; Ghadbeigi, H. Physics based models for characterization of machining performance—A critical review. CIRP J. Manuf. Sci. Technol. 2024, 51, 161–189. [Google Scholar] [CrossRef]
- Ullrich, K.; von Elling, M.; Gutzeit, K.; Dix, M.; Weigold, M.; Aurich, J.C.; Wertheim, R.; Jawahir, I.S.; Ghadbeigi, H. AI-based optimisation of total machining performance: A review. CIRP J. Manuf. Sci. Technol. 2024, 50, 40–54. [Google Scholar] [CrossRef]
- Arrazola, P.J.; Özel, T.; Umbrello, D.; Davies, M.; Jawahir, I.S. Recent advances in modelling of metal machining processes. Ann. CIRP 2013, 62, 695–718. [Google Scholar] [CrossRef]
- Sagapuram, D.; Udupa, A.; Viswanathan, K.; Mann, J.B.; M’Saoubi, R.; Sugihara, T.; Chandrasekar, S. On the Cutting of Metals: A Mechanics Viewpoint. ASME J. Manuf. Sci. Eng. 2020, 142, 110808. [Google Scholar] [CrossRef]
- Guo, Y.; Saldana, C.; Compton, W.D.; Chandrasekar, S. Controlling deformation and microstructure on machined surfaces. Acta Mater. 2011, 59, 4538–4547. [Google Scholar] [CrossRef]
- Pedroso, A.F.V.; Sousa, V.F.C.; Sebbe, N.P.V.; Silva, F.J.G.; Campilho, R.D.S.G.; Sales-Contini, R.C.M.; Jesus, A.M.P.A. Comprehensive Review on the Conventional and Non-Conventional Machining and Tool-Wear Mechanisms of INCONEL. Metals 2023, 13, 585. [Google Scholar] [CrossRef]
- Pedroso, A.F.V.; Sebbe, N.P.V.; Costa, R.D.F.S.; Barbosa, M.L.S.; Sales-Contini, R.C.M.; Silva, F.J.G.; Campilho, R.D.S.G.; de Jesus, A.M.P. INCONEL® Alloy Machining and Tool Wear Finite Element Analysis Assessment: An Extended Review. J. Manuf. Mater. Process. 2024, 8, 37. [Google Scholar] [CrossRef]
- Melkote, S.N.; Grzesik, W.; Outeiro, J.; Rech, J.; Schulze, V.; Attia, H.; Arrazola, P.-J.; M’Saoubi, R.; Saldana, C. Advances in material and friction data for modelling of metal machining. Ann. CIRP 2017, 66, 731–754. [Google Scholar] [CrossRef]
- Kano, S.A. Short Review: Tribology in Machining to Understand Conventional and Latest Modeling Methods with Machine Learning. Machines 2025, 13, 81. [Google Scholar] [CrossRef]
- Bowden, F.P.; Tabor, D. The Friction and Lubrication of Solids; Oxford University Press: Oxford, UK, 2001; 424p. [Google Scholar] [CrossRef]
- Bowden, F.P.; Moore, A.J.W.; Tabor, D. The Ploughing and Adhesion of Sliding Metals. J. Appl. Phys. 1943, 14, 80–91. [Google Scholar] [CrossRef]
- Abouridouane, M.; Bergs, T.; Schraknepper, D.; Wirtz, G. Friction behavior in metal cutting: Modeling and simulation. Procedia CIRP 2021, 102, 405–410. [Google Scholar] [CrossRef]
- Dogra, M.; Sharma, V.S.; Sachdeva, A.; Suri, N.M.; Dureja, J.S. Tool wear, chip formation and workpiece surface issues in CBN hard turning: A review. Int. J. Precis. Eng. Manuf. 2010, 11, 341–358. [Google Scholar] [CrossRef]
- Lin, G.; Shi, H.; Liu, X.; Wang, Z.; Zhang, H.; Zhang, J. Tool wear on machining of difficult-to-machine materials: A review. Int. J. Adv. Manuf. Technol. 2024, 134, 989–1014. [Google Scholar] [CrossRef]
- Li, B. A review of tool wear estimation using theoretical analysis and numerical simulation technologies. Int. J. Refract. Met. Hard Mater. 2012, 35, 143–151. [Google Scholar] [CrossRef]
- Yan, L.; Guan, L.; Wang, D.; Xiang, D. Application and Prospect of Wear Simulation Based on ABAQUS: A Review. Lubricants 2024, 12, 257. [Google Scholar] [CrossRef]
- Delaney, B.C.; Wang, Q.J.; Aggarwal, V.; Chen, W.; Evans, R.D. A Contemporary Review and Data-Driven Evaluation of Archard-Type Wear Laws. ASME. Appl. Mech. Rev. 2025, 77, 022101. [Google Scholar] [CrossRef]
- Zhang, H.; Jiang, S.; Gao, D.; Sun, Y.; Bai, W. A Review of Physics-Based, Data-Driven, and Hybrid Models for Tool Wear Monitoring. Machines 2024, 12, 833. [Google Scholar] [CrossRef]
- Springis, G.; Boiko, I. Comparative Analysis of Wear Models for Accurate Wear Predictions. Lubricants 2025, 13, 100. [Google Scholar] [CrossRef]
- Khadka, S.; Rashid, R.A.R.; Stephens, G.; Papageorgiou, A.; Navarro-Devia, J.; Hägglund, S.; Palanisamy, S. Predicting cutting tool life: Models, modelling, and monitoring. Int. J. Adv. Manuf. Technol. 2025, 136, 3037–3076. [Google Scholar] [CrossRef]
- Liu, G.; Huang, C.; Wang, X.; Zhao, B.; Ji, M. Friction and Wear of Cutting Tools and Cutting Tool Materials. Lubricants 2024, 12, 192. [Google Scholar] [CrossRef]
- Corrêa, J.G.; Schroeter, R.B.; Machado, Á.R. Tool Life and Wear Mechanism Analysis of Carbide Tools Used in the Machining of Martensitic and Supermartensitic Stainless Steels. Tribol. Int. 2017, 105, 102–117. [Google Scholar] [CrossRef]
- Wang, C.; Ming, W.; Chen, M. Milling tool’s flank wear prediction by temperature dependent wear mechanism determination when machining Inconel 182 overlays. Tribol. Int. 2016, 104, 140–156. [Google Scholar] [CrossRef]
- Sun, Q.; Zheng, D. Experimental Analysis and Wear Prediction Model Based on Friction Heat for Dry Sliding Contact. Coatings 2024, 14, 742. [Google Scholar] [CrossRef]
- Pérez-Salinas, C.; de Lacalle, L.N.L.; del Olmo, A.; Kumar, C.S. The relationship between the cutting-edge, tool wear, and chip formation during Inconel 718 dry cutting. Int. J. Adv. Manuf. Technol. 2024, 132, 6001–6017. [Google Scholar] [CrossRef]
- Khan, M.A.; Ahmad, R.; Jaffery, S.H.I.; Butt, S.I.; Khan, M.S.; Zahid, D. Sustainability analysis of tool wear, energy efficiency, surface quality, and energy during dry, MQL, and wet turning of Inconel 718. Int. J. Sustain. Energy 2025, 44, 2515447. [Google Scholar] [CrossRef]
- Zhao, P.; Ma, C.; Jiang, B.; Chu, S.; Dong, P. A novel approach for assessing the wear status of a milling tool flank based on the entropy generation of friction and thermal conduction. Int. J. Adv. Manuf. Technol. 2025, 137, 1497–1521. [Google Scholar] [CrossRef]
- Kovač, P.; Savković, B.; Dudić, B. Modeling of Cutting Force Relationship as a Function of Cutting Conditions and Tool Wear. Adv. Eng. Lett. 2025, 4, 31–36. [Google Scholar] [CrossRef]
- Wang, C.; Li, Y.; Gao, F.; Wu, K.; Yin, K.; He, Y.; Xu, Y. Milling-Force Prediction Model for 304 Stainless Steel Considering Tool Wear. Machines 2025, 13, 72. [Google Scholar] [CrossRef]
- Özlü, B.; Ulaş, H.B.; Kara, F. Investigation of the Effects of Cutting Tool Coatings and Machining Conditions on Cutting Force, Specific Energy Consumption, Surface Roughness, Cutting Temperature, and Tool Wear in the Milling of Ti6Al4V Alloy. Lubricants 2025, 13, 363. [Google Scholar] [CrossRef]
- Bloul, B.; Chanal, H.M.M. Study of the influence of cutting parameters on tool wear and the state of the machined surface. Adv. Mech. Eng. 2024, 16, 1–8. [Google Scholar] [CrossRef]
- Clavier, F.; Valiorgue, F.; Courbon, C.; Rech, J.; Van Robaeys, A.; Masciantonio, U.; Brosse, A.; Dorlin, T. Numerical analysis of the tribological and geometrical impacts of tool wear on the thermomechanical loadings induced by 15-5PH steel turning. Procedia CIRP 2021, 102, 411–416. [Google Scholar] [CrossRef]
- Cappellini, C.; Abeni, A. Development and implementation of crater and flank tool wear model for hard turning simulations. Int. J. Adv. Manuf. Technol. 2022, 120, 2055–2073. [Google Scholar] [CrossRef]
- Zhai, Y.; Zhang, G.; Zhang, H. Simulation of machining parameters and tool wear mechanism of high-speed turning of superalloy GH4169 with ceramic tool. J. Braz. Soc. Mech. Sci. Eng. 2025, 47, 308. [Google Scholar] [CrossRef]
- Wei, A.; Li, Y.; Feng, L.; Feng, Y.; Xie, Z. Frictional Study on 30CrNi2MoVA Steel Based on Experiments and Finite Element Simulation: Wear Prediction. Coatings 2024, 14, 265. [Google Scholar] [CrossRef]
- Hu, J.; Wei, J.; Feng, X.; Liu, Z. Research on Wear of Micro-Textured Tools in Turning GH4169 during Spray Cooling. Lubricants 2023, 11, 439. [Google Scholar] [CrossRef]
- Hu, J.; Liu, J.; Liu, Z.; Feng, X. Research on the Effect of Micro-Pit Parameters on Tool Wear in Turning GH4169. Coatings 2025, 15, 543. [Google Scholar] [CrossRef]
- Jamali, A.; Kashyap, A.; Schneider, J.; Stueber, M.; Schulze, V. Grey-box modelling for tool wear prediction in milling: Fusion of finite element insights, time-resolved cutting signals and metaheuristic feature selection. Wear 2025, 580–581, 206292. [Google Scholar] [CrossRef]
- Li, R.; He, H.; Ye, C.; Liu, X.; Xu, Y.; Wang, Y.; Liu, X. A Model for Predicting 3D Wear Morphology of Ball-End Milling Tools: Development and Validation. Coatings 2025, 15, 394. [Google Scholar] [CrossRef]
- Veerappan, G.; Logesh, K.; Chaturvedi, R.; Ravichandran, R.; Mohanavel, V.; Hossain, I.; Kannan, S.; Alotaibi, M.A.; Seikh, A.H. Experimental and numerical analysis on the cutting force, cutting temperature, and tool wear of alloy steel (4340) during turning process. AIP Adv. 2024, 14, 115121. [Google Scholar] [CrossRef]
- Maeng, S.; Ahn, J.H.; Min, B.K. Effect of the Built-Up-Edge on Tool Wear in Machining of STAVAX. Int. J. Precis. Eng. Manuf. 2024, 25, 1375–1384. [Google Scholar] [CrossRef]
- Shabana, S.; Jatavallabhula, J.K.; Kumar, R.N.; Chinthalapudi, R.; Pappula, B. Towards Intelligent Tribology: Predicting Wear and Friction in WC–Co Coatings with Machine Learning. J. Bio- Tribo-Corros. 2025, 11, 88. [Google Scholar] [CrossRef]
- Sivaraman, S.; Radhika, N. Predictive analytics of wear performance in high entropy alloy coatings through machine learning. Phys. Scr. 2024, 99, 076014. [Google Scholar] [CrossRef]
- Munaro, R.; Attanasio, A.; Abeni, A.; Cappellini, C.; Tavormina, P.; Venturelli, F. A New Architecture Paradigm for Tool Wear Prediction during AISI 9840 Drilling Operation. Procedia Comput. Sci. 2024, 232, 1617–1625. [Google Scholar] [CrossRef]
- Bouchama, R.; Cherfia, A.; Chikh, Y. Cutting tool wear prediction based on chip features extracted from image processing and AutoML. Int. J. Adv. Manuf. Technol. 2025, 137, 4603–4629. [Google Scholar] [CrossRef]
- Mia, M.; Zhang, L.; Anwar, S.; Liu, H. Development of digital characteristics of machining based on physics-guided data. J. Manuf. Syst. 2023, 71, 438–450. [Google Scholar] [CrossRef]
- Karimi, E.; Schindler, F.A.; Schulze, V. On-Machine Flank Wear Analysis in Cutting Tools Using Artificial Intelligence. In Production at the Leading Edge of Technology; Drossel, W.G., Ihlenfeldt, S., Dix, M., Eds.; WGP, Lecture Notes in Production Engineering; Springer: Cham, Switzerland, 2025; pp. 30–38. ISBN 978-3-031-86893-1. [Google Scholar] [CrossRef]
- Archard, J.F. Contact and Rubbing of Flat Surfaces. J. Appl. Phys. 1953, 24, 981–988. [Google Scholar] [CrossRef]
- Usui, E.; Shirakashi, T.; Kitagawa, T. Analytical prediction of cutting tool wear. Wear 1984, 100, 129–151. [Google Scholar] [CrossRef]
- Bhushan, B. Introduction to Tribology; John Wiley & Sons, Ltd.: Hoboken, NJ, USA, 2013; 711p, ISBN 978-1-119-94453-9. [Google Scholar]
- Gorjacheva, I.G. Mechanics of Friction Interaction; Science: Moscow, Russia, 2001; 478p, ISBN 5-02-002567-4. (In Russian) [Google Scholar]
- Astakhov, V.P. Tribology of Metal Cutting; Elsevier Science: London, UK, 2006; Volume 52, 425p, ISBN 9780444559081. [Google Scholar]
- Özel, T. The influence of friction models on finite element simulations of machining. Int. J. Mach. Tools Manuf. 2006, 46, 518–530. [Google Scholar] [CrossRef]
- Maranhão, C.; Davim, J.P. The role of flow stress and friction coefficient in fem analysis of machining: A review. Rev. Adv. Mater. Sci. 2012, 30, 184–188. Available online: https://www.researchgate.net/publication/264853766 (accessed on 17 January 2012).
- Yi, F.; Zhong, R.; Zhu, W.; Zhou, R.; Guo, L.; Wang, Y. Comparative Study of Friction Models in High-Speed Machining of Titanium Alloys. Lubricants 2025, 13, 113. [Google Scholar] [CrossRef]
- Priest, J.; Ghadbeigi, H.; Ayvar-Soberanis, S.; Liljerehn, A. Effects of coefficient of friction coupled with a deformation dependent friction model in cutting simulations. Procedia CIRP 2021, 102, 429–434. [Google Scholar] [CrossRef]
- Dirikolu, M.H.; Childs, T.H.C.; Maekawa, K. Finite Element Simulation of Chip Flow in Metal Machining. Int. J. Mech. Sci. 2001, 43, 2699–2713. [Google Scholar] [CrossRef]
- Das, A.; Mundu, A.R.S.; Bajpai, V. Prediction of friction angle and cutting force considering sticking friction in machining process. Sādhanā 2023, 48, 261. [Google Scholar] [CrossRef]
- Saxena, M.; Sharma, A.K.; Singh, M. Tribological analysis and data-driven modeling of graphitic carbon nitride/molybdenum disulfide nanocomposite coatings: Experimental insights and predictive optimization. J. Braz. Soc. Mech. Sci. Eng. 2025, 47, 374. [Google Scholar] [CrossRef]
- Bejjani, R.; Al Fleety, A. Investigating the tribological properties under severe contact conditions using an extreme pressure tribo-device. Int. J. Adv. Manuf. Technol. 2024, 135, 4731–4748. [Google Scholar] [CrossRef]
- Wu, B.; Xiao, H.; Zhang, M.; Zhao, B.; Ding, W. Tribological behavior of tool-workpiece interface during milling of ultra-high strength steel under different cooling conditions. Front. Mech. Eng. 2025, 20, 25. [Google Scholar] [CrossRef]
- Zhang, Y.; Outeiro, J.C.; Nouveau, C.; Marcon, B.; Dengiur, L.A. Tribological Analysis of Several Coatings under Flood and Cryogenic Cooling Conditions. Appl. Sci. 2023, 13, 11743. [Google Scholar] [CrossRef]
- Villanueva, E.; Albizuri, J.; Caballero, P.; Guraya, T.; Vicario, I. Prediction of Wear Rate by a New Direct Method Using the Friction Coefficient Curve. J. Manuf. Mater. Process. 2025, 9, 6. [Google Scholar] [CrossRef]
- Ventura, C.E.H.; Gregorio, A.V.L.; Fernandes, L.S.M.; Abrão, I.A.M.; Rosa, P.A.R.C. Revisiting the Influence of Contact Length and Surrounding Medium on Metal Cutting Tribology. Lubricants 2023, 11, 342. [Google Scholar] [CrossRef]
- Mathews, J.T.; Chawla, H.; Sagapuram, D. On the Nature of Contact Friction and Stress Distribution in Cutting: In situ Photoelastic Study. Tribol. Lett. 2025, 73, 95. [Google Scholar] [CrossRef]
- Denkena, B.; Bergmann, B.; Schenzel, J. Modeling of friction in the presence of cooling lubricants. Procedia CIRP 2025, 133, 43–48. [Google Scholar] [CrossRef]
- Holey, H.; Sauer, F.; Ganta, P.B.; Mayrhofer, L.; Dienwiebel, M.; Schulze, V.; Moseler, M. Multiscale Parametrization of a Friction Model for Metal Cutting Using Contact Mechanics, Atomistic Simulations, and Experiments. Tribol. Lett. 2024, 72, 113. [Google Scholar] [CrossRef]
- Ning, H.; Chen, F.; Su, Y.; Li, H.; Fan, H.; Song, J.; Zhang, Y.; Hu, L. Modeling and prediction of tribological properties of copper/aluminum-graphite self-lubricating composites using machine learning algorithms. Friction 2024, 12, 1322–1340. [Google Scholar] [CrossRef]
- Mia, M.; Anwar, S.; Yang, X. Finite element modeling of machining with interactive friction model based evolutionary friction. J. Manuf. Process. 2025, 148, 61–74. [Google Scholar] [CrossRef]
- Zhang, N.; Klippel, H.; Kneubühler, F.; Afrasiabi, M.; Kuffa, M.; Wegener, K. Investigation of friction modeling on numerical Ti6Al4V cutting simulations. Int. J. Mech. Sci. 2024, 274, 109231. [Google Scholar] [CrossRef]
- Malakizadi, A.; Hosseinkhani, K.; Mariano, E.; Ng, E.; Del Prete, A.; Nyborg, L. Influence of friction models on FE simulation results of orthogonal cutting process. Int. J. Adv. Manuf. Technol. 2017, 88, 3217–3232. [Google Scholar] [CrossRef]
- Wolf, J.; Bandaru, N.K.; Dienwiebel, M.; Möhring, H.-C. A novel grey-box based friction model for a wide range of machining conditions. Wear 2025, 580–581, 206295. [Google Scholar] [CrossRef]
- Kushner, V.; Storchak, M. Determining mechanical characteristics of material resistance to deformation in machining. Production Engineering. Res. Dev. 2014, 8, 679–688. [Google Scholar] [CrossRef]
- Kushner, V.; Storchak, M. Determination of Material Resistance Characteristics in Cutting. Procedia CIRP 2017, 58, 293–298. [Google Scholar] [CrossRef]
- Storchak, M.; Möhring, H.-C.; Stehle, T. Improving the friction model for the simulation of cutting processes. Tribol. Int. 2022, 167, 107376. [Google Scholar] [CrossRef]
- Heisel, U.; Krivoruchko, D.V.; Zaloha, W.A.; Storchak, M.; Stehle, T. Thermomechanical exchange effects in machining. ZWF Z. Fuer Wirtsch. Fabr. 2009, 104, 263–272. [Google Scholar] [CrossRef]
- Zorev, N.N. Interrelationship Between Shear Processes Occurring Along Tool Face and on Shear Plane in Metal Cutting. In Proceedings of the International Production Engineering Research Conference, Pittsburgh, PA, USA, 9–12 September 1963; pp. 42–49. [Google Scholar]
- Fluhrer, J. DEFORM-User Manual DEFORM, Version 12.0; SFTC: Columbus, OH, USA, 2019.
- Zorev, N.N. Metal Cutting Mechanics; Pergamon Press: Frankfurt am Main, Germany, 1966; p. 526. ISBN 978-0080107233. [Google Scholar]
- Oxley, P.L.B. Development and Application of a Predictive Machining Theory. Mach. Sci. Technol. 1998, 2, 165–189. [Google Scholar] [CrossRef]
- Tsekhanov, J.; Storchak, M. Development of analytical model for orthogonal cutting. Prod. Eng. Res. Dev. 2015, 9, 247–255. [Google Scholar] [CrossRef]
- Heisel, U.; Storchak, M.; Eberhard, P.; Gaugele, T. Experimental studies for verification of thermal effects in cutting. Production Engineering. Res. Dev. 2011, 5, 507–515. [Google Scholar] [CrossRef]
- Filatov, Y.D.; Sidorko, V.I.; Filatov, O.Y.; Yaschuk, V.P.; Heisel, U.; Storchak, M. Surface quality control in diamond abrasive finishing. In Optical Measurement Systems for Industrial Inspection VI, Proceedings of the SPIE Europe Optical Metrology, Munich, Germany, 14–18 June 2009; Proceeding SPIE 7389, 73892O; SPIE: Bellingham, WA, USA, 2009. [Google Scholar] [CrossRef]
- Storchak, M.; Kushner, V.; Möhring, H.-C.; Stehle, T. Refinement of temperature determination in cutting zones. J. Mech. Sci. Technol. 2021, 35, 3659–3673. [Google Scholar] [CrossRef]
- Storchak, M.; Stehle, T.; Möhring, H.-C. Determination of thermal material properties for the numerical simulation of cutting processes. Int. J. Adv. Manuf. 2021, 118, 1941–1956. [Google Scholar] [CrossRef]
- Material Property Data. Available online: http://www.matweb.com (accessed on 19 April 2019).
- Storchak, M.; Drewle, K.; Menze, C.; Stehle, T.; Möhring, H.-C. Determination of the Tool–Chip Contact Length for the Cutting Processes. Materials 2022, 15, 3264. [Google Scholar] [CrossRef] [PubMed]
- Storchak, M. Determination of Chip Compression Ratio for the Orthogonal Cutting Process. J. Manuf. Mater. Process. 2024, 8, 190. [Google Scholar] [CrossRef]
- Storchak, M.; Stehle, T.; Möhring, H.-C. Determination of the Shear Angle in the Orthogonal Cutting Process. J. Manuf. Mater. Process. 2022, 6, 132. [Google Scholar] [CrossRef]
- Heisel, U.; Krivoruchko, D.V.; Zaloha, W.A.; Storchak, M.; Stehle, T. Thermomechanical material models in the modeling of cutting processes. ZWF Z. Fuer Wirtsch. Fabr. 2009, 104, 482–491. [Google Scholar] [CrossRef]
- Heisel, U.; Krivoruchko, D.V.; Zaloha, W.A.; Storchak, M.; Stehle, T. Breakage models for the modeling of cutting processes. ZWF Z. Fuer Wirtsch. Fabr. 2009, 104, 330–339. [Google Scholar] [CrossRef]
- Johnson, G.R.; Cook, W.H. A constitutive model and data for metals subjected to large strains, high strain and high temperatures. In Proceedings of the 7th International Symposium on Ballistics, The Hague, The Netherlands, 19–21 April 1983; pp. 541–547. [Google Scholar]
- Hejazi, M.; Haji, A.F. Assessment of Various Ductile Damage Criteria in Numerical Simulations of Machining Processes. Int. J. Precis. Eng. Manuf. 2024, 25, 131–139. [Google Scholar] [CrossRef]
Disclaimer/Publisher’s Note: The statements, opinions and data contained in all publications are solely those of the individual author(s) and contributor(s) and not of MDPI and/or the editor(s). MDPI and/or the editor(s) disclaim responsibility for any injury to people or property resulting from any ideas, methods, instructions or products referred to in the content. |
© 2025 by the authors. Licensee MDPI, Basel, Switzerland. This article is an open access article distributed under the terms and conditions of the Creative Commons Attribution (CC BY) license (https://creativecommons.org/licenses/by/4.0/).