Article

An Autonomous Mobile Measurement Method for Key Feature Points in Complex Aircraft Assembly Scenes

1
State Key Laboratory of High-performance Precision Manufacturing, School of Mechanical Engineering, Dalian University of Technology, Dalian 116024, China
2
Institute of Aeronautical Manufacturing Technology, COMAC Shanghai Aircraft Manufacturing Co., Ltd., Shanghai 200120, China
*
Author to whom correspondence should be addressed.
Machines 2025, 13(10), 892; https://doi.org/10.3390/machines13100892
Submission received: 27 August 2025 / Revised: 17 September 2025 / Accepted: 26 September 2025 / Published: 30 September 2025
(This article belongs to the Section Automation and Control Systems)

Abstract

Large-scale measurement of key feature points (KFPs) on an aircraft is essential for coordinated movement of locators, which is critical to the final assembly accuracy. Due to the large number and wide distribution of KFPs as well as line-of-sight occlusion, network measurement of laser trackers (LTs) is required. Existing approaches rely on operational experience for the configuration of stations, sequences and station transitions of LTs, which compromises both efficiency and automation capability. To tackle this challenge, this article presents an autonomous mobile measurement method for KFPs in complex scenes of aircraft assembly, incorporating path self-planning and self-positioning capabilities, thereby substantially diminishing temporal expenditure. Firstly, a simultaneous self-planning method of measurement stations and tasks is proposed to determine the minimum number of stations, optimal locations, and their specific KFPs at each station. Secondly, considering obstacles and turning time, a path planning model of mobile LTs combining coarse and fine localization is established to realize automatic station transitions. Finally, an optimal sequence of series of KFPs with a wide spatial distribution is generated to minimize total distance. Aircraft component assembly experiments validated the method, cutting measurement error by 37% and total measurement time by over 50%.

1. Introduction

1.1. Background

Driven by large-scale measurement, the posture alignment of aircraft components represents a mainstream technology for achieving in situ high-efficiency assembly of aircraft [1]. During the posture alignment and assembly process, it is crucial to accurately obtain the three-dimensional coordinates of key feature points (KFPs) on the components [2,3]. This information is essential for determining the current pose of the components, calculating their deviations from the target pose, and subsequently computing the motion parameters for each numerically controlled locator. These steps are necessary to achieve precise posture alignment and assembly between aircraft components [4,5,6]. Therefore, the large-scale measurement accuracy of KFP coordinates directly determines the accuracy and efficiency of component assembly [7,8]. However, these aircraft components, such as the fuselage and wings, are often large and complex in structure. These components exhibit dozens of KFPs that are sparsely distributed over ranges of 30 to 60 m. Moreover, the line-of-sight for series of KFPs is easily occluded. Consequently, network measurement of laser trackers (LTs) involving multiple stations is required [9]. In the aircraft assembly sites, workers often use LTs at multiple stations to measure KFPs on the aircraft. The configuration of the number, position, and measurement tasks of each station of LT is heavily dependent on operational experience. Moreover, measurement stations are frequently added on a temporary basis in response to line-of-sight occlusion or insufficient accuracy, which leads to substantial increases in time required for measurement. Meanwhile, the measurement of numerous KFPs is carried out on a point-by-point basis through manual beam aiming, and the transition between stations of LT also requires implementation via manual dragging. Evidently, there is an urgent need to enhance the efficiency and automation level of KFP measurement in large-scale scenarios.
The measurement system of mobile laser tracker (MLT), which integrates an Automated Guided Vehicle (AGV) with LT, offers flexible station transitions without the need for manual dragging. This system serves as a valuable reference for enhancing the efficiency of KFPs measurement in large-scale scenarios [10]. On the basis of this idea, to further improve the automation and intelligence level of KFP measurement, this article proposes an autonomous mobile station transition measurement method with path planning considering on-site line-of-sight occlusion. Through the optimal planning of measurement stations, movement paths, and measurement sequences, manual intervention is greatly reduced, and both the station transition time and the measurement time of the LT are significantly shortened. In this method, the core aspects include measurement station layout optimization, rapid localization of the measurement system, and mobile path planning.

1.2. Related Work

Regarding the above key points, many scholars have carried out extensive studies, providing valuable references for this study. In terms of measurement station planning, Sheng et al. [11] established a planning method based on the measurement range constraints of the LT and the incidence angle constraints of the spherically mounted retroreflector (SMR), and employed an improved genetic algorithm to solve for the optimal station distribution in space. Zou et al. [12] introduced a measurement error model of KFPs and established planning constraints by considering the effective angular and distance ranges of LT measurement. The optimal station layout was then obtained by solving with a sequential quadratic programming (SQP) algorithm. Xu et al. [13] proposed a spatial accuracy-driven adaptive station planning method. Their approach maximizes the number of target points covered while minimizing the number of stations, thus improving overall efficiency. The above methods optimized measurement station planning from different perspectives; however, none of them comprehensively considered both line-of-sight occlusion and optimal task allocation under complex on-site scenes.
In terms of mobile measurement system localization, technologies such as ultra-wideband (UWB), simultaneous localization and mapping (SLAM), and inertial measurement units (IMU) are commonly used for the localization of mobile platforms [14,15]. Wang et al. [16] fused the measurement data from three drawstring displacement sensors and an IMU, and achieved indoor localization of the AGV. Chung et al. [17] improved the robustness of mobile robot localization by combining two-dimensional laser information, rangefinder data, and an improved Adaptive Monte Carlo Localization (AMCL) algorithm, enabling the robot to localize itself even in complex scenes. Ren et al. [18] addressed the problem of low global localization accuracy of the AMCL algorithm in dynamic scenarios by adding reflective columns as landmarks in the scene. However, complex aircraft assembly requires simultaneous localization of both the AGV and the onboard LT. The intricate relationships among multiple coordinate systems make online positioning of the mobile measurement system challenging with existing methods.
For measurement path planning, traditional algorithms mainly include the rapidly exploring random tree [19], the artificial potential field method [20], and the A-star (A*) algorithm [21]. Among them, the A* algorithm has been widely applied due to its high efficiency and low spatiotemporal complexity. Kabir et al. [22] proposed an adaptive cost function to enhance the performance of the A* algorithm, and employed robot motion block units to store surrounding node information, thereby improving the search speed. Martins et al. [23] proposed an improved multi-objective A* algorithm that surpasses the classic version in search speed, smoothness, and length, and performs well in large-scale environments. Wang et al. [24] accelerated A* search and reduced turns by labeling occupied nodes and backtracking turning nodes. Existing studies based on the traditional A* algorithm have mainly focused on optimizing search speed, path smoothness, and the number of turning points, while neglecting the overall time cost of the path. In addition, deep reinforcement learning methods have recently been explored for robotic path planning [25,26,27]; however, they demand large amounts of training data. In the low-volume context of aircraft manufacturing, data acquisition is costly. Moreover, stability during deployment is hard to guarantee, limiting their near-term applicability.
In summary, the measurement efficiency of discrete KFPs for the assembly of large-scale aircraft components still has room for further improvement. Therefore, this article proposes an autonomous mobile station transition measurement method with path planning that considers line-of-sight occlusion. Compared with previous studies, the main contributions of this article can be summarized in three aspects. First, considering line-of-sight occlusion and minimizing measurement distance, an optimal measurement layout is planned, obtaining the minimum number of stations and their optimal locations, and assigning measurement tasks to each station. Second, the onboard LT is precisely localized through a combination of coarse and fine measurements, and the station transition path is planned considering complex on-site obstacles, achieving the minimum movement time between stations. Third, with the objective of minimizing the total measurement path of a series of KFPs under a single station, the optimal measurement sequence is planned, and efficient automated measurement is achieved by integrating LT automatic pointing.
The rest of this article is organized as follows. Section 2 introduces the overall framework of the proposed method and presents the key operational procedures and derivation process of the autonomous mobile measurement approach for KFPs in complex aircraft assembly scenes. Section 3 presents the experimental process and analyzes the key data to verify the effectiveness of the proposed method. Finally, Section 4 concludes the article.

2. Methodology

2.1. Overall Architecture of the Proposed Method

In the assembly process of large aircraft components, a series of discrete KFPs need to be measured with high accuracy to provide precise pose information for component posture alignment. As shown in Figure 1, the KFPs to be measured include posture control points on the components and the enhance reference system (ERS) points under the global coordinate system. To address the demand for high-precision and high-efficiency measurement of KFPs, this article proposes an autonomous mobile station transition measurement method with path planning that considers line-of-sight occlusion. By planning measurement stations, measurement tasks, and the shortest station transition path, the proposed method significantly reduces the measurement time of large numbers of discrete KFPs.
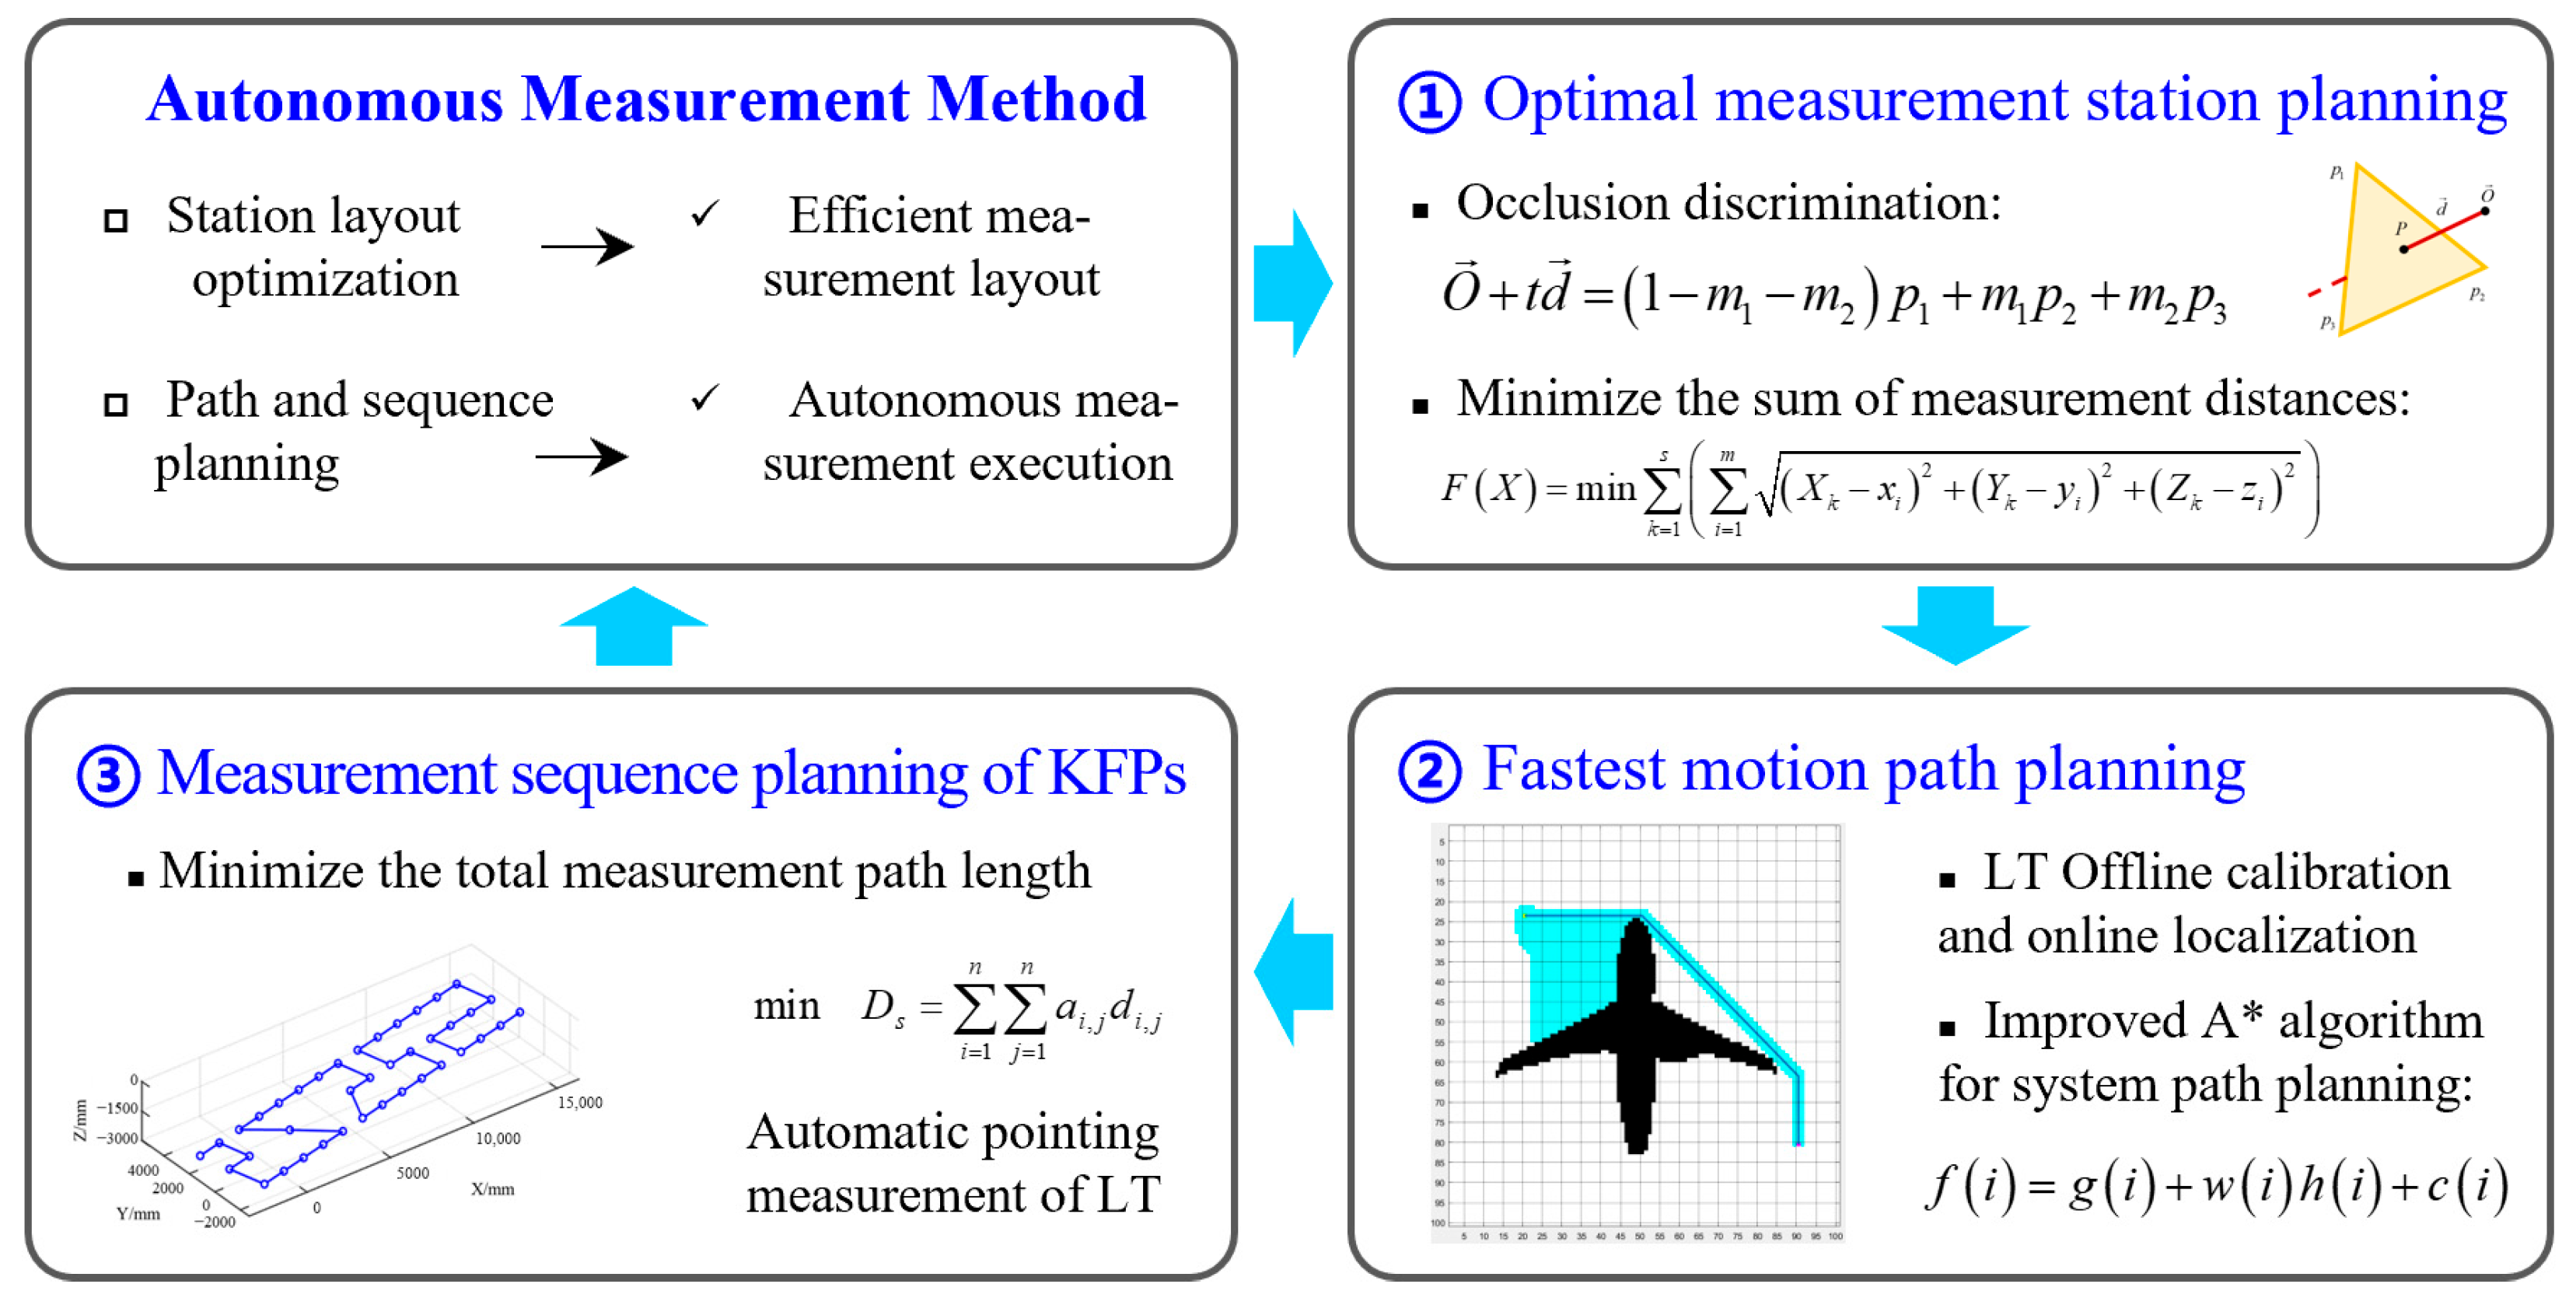
The overall architecture of the proposed method is illustrated in Figure 2. First, by comprehensively considering line-of-sight occlusion and the nearest measurement point-station distance, the minimum number of stations and the optimal station layout are planned, and measurement tasks are assigned to each station. Second, an online localization method combining radar-based coarse positioning and laser-based fine positioning is proposed. A station transitions path planning model that considers both movement time and turning time is established, and the shortest-time station transfer path is obtained, enabling automated transfer between stations. Finally, for large-scale series KFP measurement tasks, a measurement path planning method is formulated to minimize the total path length among measurement points. Through automatic pointing and sequential measurement with the LT, automatic measurement of KFPs under a single station is achieved, thereby ensuring measurement efficiency.

2.2. Measurement Station Planning Considering Line-of-Sight Occlusion

For complex assembly scenes, station planning must consider the occlusion problem between measurement stations and measurement points. In this article, line-of-sight occlusion is determined based on a ray–triangle model. As shown in Figure 3, the 3D models of components and tooling in the measurement control field are first converted into the .obj format, in which the surfaces of the 3D models are represented as mesh models composed of triangular facets. The measurement laser is abstracted as a spatial ray, and occlusion determination is performed by evaluating the positional relationship between the ray and the triangular surfaces.
A ray originating from point O , the laser emission point of the LT, intersects the triangle. Any point P on the ray can be expressed in terms of the origin O and the unit direction vector d from O to the KFP as follows:
P = O + t d
where t is the distance from O to P .
The triangle is defined by its three vertices p 1 , p 2 , p 3 , and any point on the triangle can be expressed as:
P = 1 m 1 m 2 p 1 + m 1 p 2 + m 2 p 3 m 1 0 , m 2 0 , m 1 + m 2 1
where m 1 , m 2 specify the position of the intersection point P within the triangle plane. Therefore, solving the intersection of the ray and the triangle is equivalent to:
O + t d = 1 m 1 m 2 p 1 + m 1 p 2 + m 2 p 3
Which can be written as:
d p 2 p 1 p 3 p 1 t m 1 m 2 = O p 1
By solving the above linear equations, the barycentric coordinates m 1 , m 2 and the distance t from the ray origin to the intersection point can be obtained. When these parameters satisfy t 0 , m 1 0 ,   m 2 0 ,   m 1 + m 2 1   , the ray intersects with the triangle and the intersection point lies within the triangle; otherwise, the ray does not intersect with the triangle. Based on this algorithm, it is possible to determine whether the laser path from a station to a measurement point is occluded, and thereby whether the point can be measured from that station.
To ensure all KFPs remain measurable, we minimize both station count and total point-to-station distance under range, angle and region constraints. The requirements of the planning method are as follows:
(1)
A single measurement station should cover as many measurement points as possible: that is, under the premise of satisfying measurement requirements, the number of stations should be minimized to reduce coordinate transformation errors, while fewer station transitions can also improve measurement efficiency.
(2)
The vertical angle range for single-point measurement is 0~145°, and the distance range is within 10 m: this corresponds to the effective measurement range of the LT, where the measurement distance can be user-defined according to the LT performance and accuracy requirements.
(3)
The total distance between each measurement station and its corresponding measurement points should be minimized as much as possible.
(4)
Occlusion determination should be performed during the planning process to ensure measurement accessibility and full coverage. If any point proves non-measurable under the current layout, the station count is incremented and the layout is re-planned; when defining the feasible region for each additional station, priority is given to guaranteeing line-of-sight access to the previously occluded point.
According to the above requirements, the nonlinear constraints for station planning are established, as expressed in Equation (5):
c 1 = X k x i 2 + Y k y i 2 + Z k z i 2 10000 0 c 2 = arccos z i Z k / X k x i 2 + Y k y i 2 + Z k z i 2 145 0 i = 1 , 2 n ;  k = 1 , 2 s ;
where n is the number of KFPs, s is the number of stations, X k , Y k , Z k denotes the coordinates of the stations to be optimized, the number of decision variables is 3s, and x i , y i , z i represents the coordinates of KFPs.
The station planning is carried out with the objective of minimizing the total distance between each measurement station and its corresponding target points, while also considering the occlusion problem between stations and measurement points. The objective function is expressed in Equation (6):
F X = min k = 1 s i = 1 n X k x i 2 + Y k y i 2 + Z k z i 2 W k i + C occ M W k i = 1 The   i - th   point   is   closest   to   the   the   k - th   station 0 Others
where the decision variable X denotes the three-dimensional coordinates of the measurement stations, represented as a 3s × 1 array; W k i is a Boolean array of size n × 1 that assigns each KFP to its nearest measurement station, with s groups in total, used to assign target points to each station according to the principle of minimum distance. C occ is the penalty factor, with an initial value of 0. If all station positions fail to effectively measure a certain KFP due to occlusion, point-station distance, or vertical angle exceeding the constraints, the value of C occ is increased by one and multiplied by a large constant M (the magnitude of which can be determined based on the estimated average distance from the KPPs to the LT; set to M = 10000 in this article). This penalty is added to the objective function F X , and because C occ M is large, this layout is heavily penalized, so the optimization keeps looking for a layout that can measure all KFPs.

2.3. Localization of the Measurement System and Mobile Path Planning

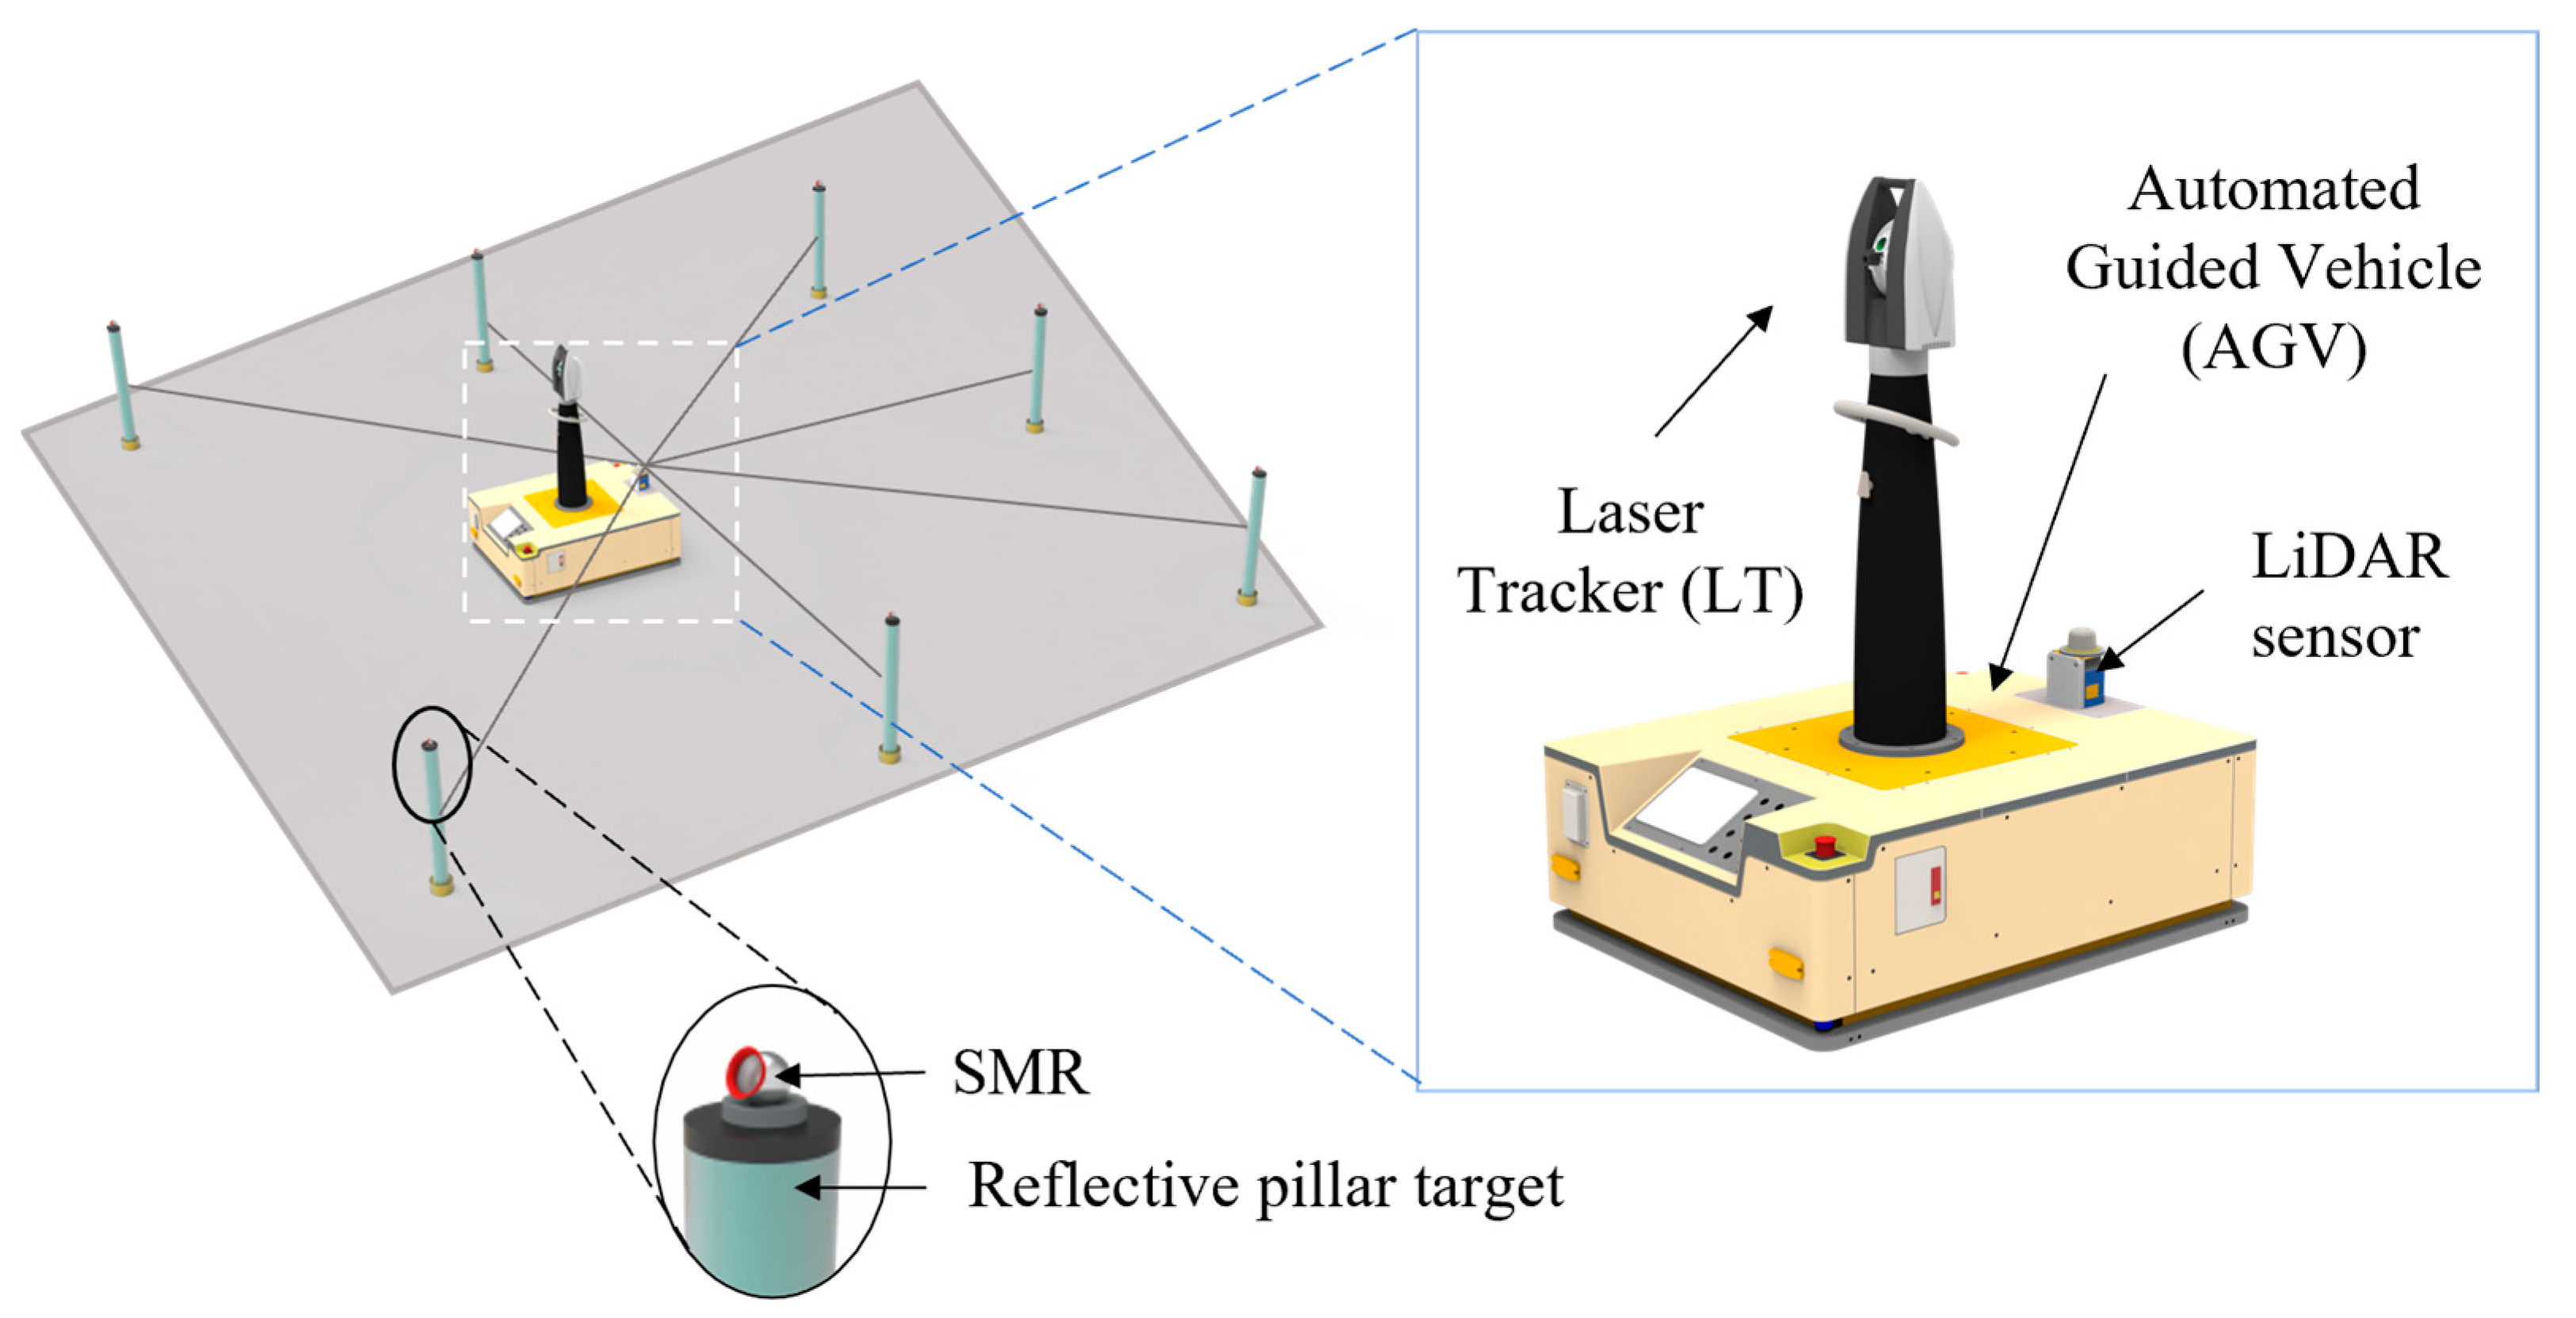
After the measurement stations are planned, the transfer between stations is accomplished through the movement of the AGV. As shown in Figure 4, the measurement system mainly consists of an AGV and an LT, operating in laser navigation mode. The LiDAR mounted on the AGV emits laser beams and receives the reflected signals from the reflective pillar target to determine the AGV’s position and orientation in the map coordinate system, and then follows the planned path to reach the designated station.
In the mobile localization scenario, multiple coordinate systems are involved, including the control network three-dimensional coordinate system (global coordinate system) O X G Y G Z G , the LT measurement coordinate system O X L Y L Z L , the two-dimensional map coordinate system (where the reflective pillar targets are located) O X M Y M , the LiDAR coordinate system O X D Y D , and the AGV coordinate system O X A Y A . As shown in Figure 5a, the relationships among these coordinate systems are first calibrated offline. Then, through a composite online localization method that combines radar-based coarse positioning and laser-based fine positioning (Figure 5b), the pose of the onboard laser tracker in the global coordinate system is determined, thereby enabling it to point to the KFP for measurement.
The path planning needs to account for the AGV’s position and size through coordinate system A, and LiDAR’s coordinate system D is required to obtain the AGV/LT position in the two-dimensional map; since the relative position between the LiDAR and the AGV is fixed and determined, the transformation relationship between their coordinate systems is also constant. As shown in Figure 6, after the LiDAR measures multiple reflective pillar targets, its current pose x D M , y D M , β D in the two-dimensional map coordinate system can be directly obtained. Based on the AGV body structure and assembly relationship, the pose of the AGV in the map coordinate system can then be derived as:
x A M = x D M L cos β A y A M = y D M L sin β A β A = β D
Then, the relationship between the onboard LT and the AGV coordinate systems is calibrated. Using the map coordinate system as a bridge, the transformation between the onboard laser tracker and the AGV coordinate systems is derived by simultaneously determining their poses in the two-dimensional map coordinate system. The main steps are as follows:
(1)
Construct the two-dimensional map coordinate system.
The initial position of the LiDAR is taken as the origin of the map coordinate system, with the 0° scanning direction defined as the positive X-axis, and counterclockwise relative to the X-axis defined as the positive rotation direction. The onboard LiDAR of the AGV then scans the surrounding reflective pillar targets to obtain their coordinates p M , i = x M , i y M , i ρ M , i T in the map coordinate system.
(2)
Measure the two-dimensional equivalent centers of the reflective pillar targets using the laser tracker.
An auxiliary hollow ring capable of mounting an SMR is designed at the top of each reflective pillar (hollow cylinder) to ensure that the sphere center of the reflector coincides with the axis of the hollow cylinder. The laser tracker sequentially measures the SMR to obtain the coordinates of the top circle centers of all reflective pillars. The horizontal and vertical coordinates of each circle center are then taken as the two-dimensional equivalent centers of the reflective cylinders, yielding the following sequence set.
Q L = q L , 1 q L , 2 q L , n , q L , i = x L , i y L , i T
(3)
Calibration between the map coordinate system and the onboard LT coordinate system.
Based on the above two-dimensional equivalent circle center coordinates, multiple sets of common points acquired in the current static state are used to solve for the rotation matrix R M _ L and the translation vector T M _ L between the two-dimensional map coordinate system and the LT measurement coordinate system, as expressed in Equation (9).
R M _ L T M _ L = min i = 1 n q L ,   i R M _ L p M , i + T M _ L 2
(4)
Calibration between the onboard LT coordinate system and the AGV coordinate system.
Based on the AGV pose x A M y A M ρ A M T in the map coordinate system and the transformation relationship between the map coordinate system and the current onboard LT coordinate system ( R M _ L and T M _ L ), the AGV coordinates in the onboard LT coordinate system are calculated using Equation (10). The difference in the Z-direction between the two coordinate systems can be determined from the height difference between the XOY plane of the onboard LT and that of the AGV coordinate system.
x A , i L y A , i L = R M _ L x A , i M y A , i M + T M _ L
where x A L y A L T represents the AGV coordinates in the onboard LT coordinate system.
Through the above derivation, the transformation relationship between the AGV coordinate system and the onboard LT coordinate system is determined. Subsequently, the two-dimensional map coordinate system is registered to the global coordinate system via the LT coordinate system using the common-point best-fit method, following the same principle as in Equation (9) and thus not repeated here.
After the calibration of the transformation relationships among multiple coordinate systems, LiDAR and LT measurements are fused to enable online global localization of the mobile measurement system.
First, by combining the calibrated information with the AGV localization information x A M , y A M , ρ A M T in the map coordinate system, the instantaneous pose matrix of the onboard LT in the map coordinate system, R L _ M and T L _ M , is obtained:
R L _ M = R A _ M R L _ A = cos ρ A M sin ρ A M sin ρ A M cos ρ A M w a R L _ A T L _ M = R A _ M T L _ A + T A _ M = R A _ M t L _ A , x t L _ A , y + x A M y A M
Using the calibration between the map and the global coordinate systems, the pose matrix of the onboard LT in the global coordinate system is calculated as:
R L _ G = R M _ G R L _ M T L _ G = R M _ G T L _ M + T M _ G
The two-dimensional transformation matrix is extended to a three-dimensional transformation matrix, as shown in Equation (13).
R L _ G = R L _ G 0 0 1 , T L _ G = R M _ G T L _ M + T M _ G d L T
where R L _ G and T L _ G are the three-dimensional rotation matrix and translation vector, respectively, and d L denotes the height of the origin of the onboard LT coordinate system relative to the XOY plane of the global system.
Based on the estimated pose of the onboard LT in the measurement control network, the coordinates of the control points in the onboard LT coordinate system are obtained, thereby accomplishing coarse localization of the LT. Subsequently, by applying the LT’s pointing search measurement technique together with vision-assisted guided measurement, multiple control point coordinates are observed to accurately solve the current pose of the onboard LT. The measurement of all KFPs in the onboard LT coordinate system is then completed, and their coordinates are transformed into the global coordinate system.
To ensure the safe operation of the mobile measurement system in complex measurement scenes, this article considers not only the occlusion caused by complex obstacles but also the additional time consumed during the deceleration-stop-turning phases of AGV steering. A motion path turning determination method based on three-point iterative backward recursion is proposed, in which the slopes of consecutive line segments are compared to determine whether the path involves a turn. A time-optimal and efficient path planning model for mobile measurement is then constructed with high-efficiency movement as the objective. The specific algorithmic procedure is summarized in Algorithm 1.
Algorithm 1: Path Planning Based on the Shortest Running Time
Input: start, goal
Output: Path and its total cost
1open ← {start}, closed ←
2g ← 0, h = h(start), c = 0, f[start] = g + h + c
3while open ≠ do
4   n ← node in open with minimal f
5   if n = goal then return reconstruct-path (parent, n), f[n]
6   end if
7   for all neighbor v of n do
8      g′ ← g[n] + cost (n, v)
9      h′ ← h(v)
10      if closed = then c′ ← 0
11         else c′ ← turn (parent[n], n, v)
12      end if
13      f′ ← g′ + h′ + c
14      if v open then
15         if f′ < f[v] then update g, h, f, parent[v]
16         else insert v into open with g′, h′, f′, parent[v]
17      end if
18   end for
19   move n from open to closed
20end while
21Return path and its total cost
Compared with straight-line motion, AGV turning requires deceleration, stop, and steering phases, which significantly increase the motion time and may lead to situations where the traveled distance is short but the operation time is long. However, in measurement scenarios, operation time is often of greater concern. The conventional A* algorithm uses the shortest distance as the evaluation function, whereas in this article, operation time is adopted as the evaluation function. By incorporating a turning time penalty term, an optimization objective of minimizing the total operation time is constructed. The evaluation function is expressed as:
f i = g i + h i + c i
where f i denotes the estimated total time from the start node to the target node via node i ; g i records the actual time already consumed from the start node to node i , accumulated from the travel time of each path segment; h i estimates the theoretical shortest time from node i to the target by dividing the Euclidean distance by the maximum travel speed, serving as the heuristic term; and c i is an additional penalty introduced to suppress frequent turns, adding a positive cost whenever the heading angle changes. By minimizing f i , the algorithm achieves the shortest path while reducing unnecessary turns, thereby improving measurement efficiency.
The implementation procedure is as follows. The implementation procedure is as follows. (1) Reconstruction of the two-dimensional scene map. The complex three-dimensional scene is projected into two dimensions to obtain a two-dimensional representation containing obstacles. The map is then binarized and gridded, with one additional grid cell expanded outside the obstacle grid boundaries as a safety margin. The grid size is set equal to the area of the AGV, resulting in a two-dimensional grid map of the measurement site. (2) Perform iterative optimization of the path nodes based on the evaluation function to obtain all nodes of the motion path, and then backtrack to derive the complete path. (3) Simplify all nodes according to the start-end path sequence, that is, multiple nodes lying on the same straight-line motion path are reduced to only the first and last nodes.
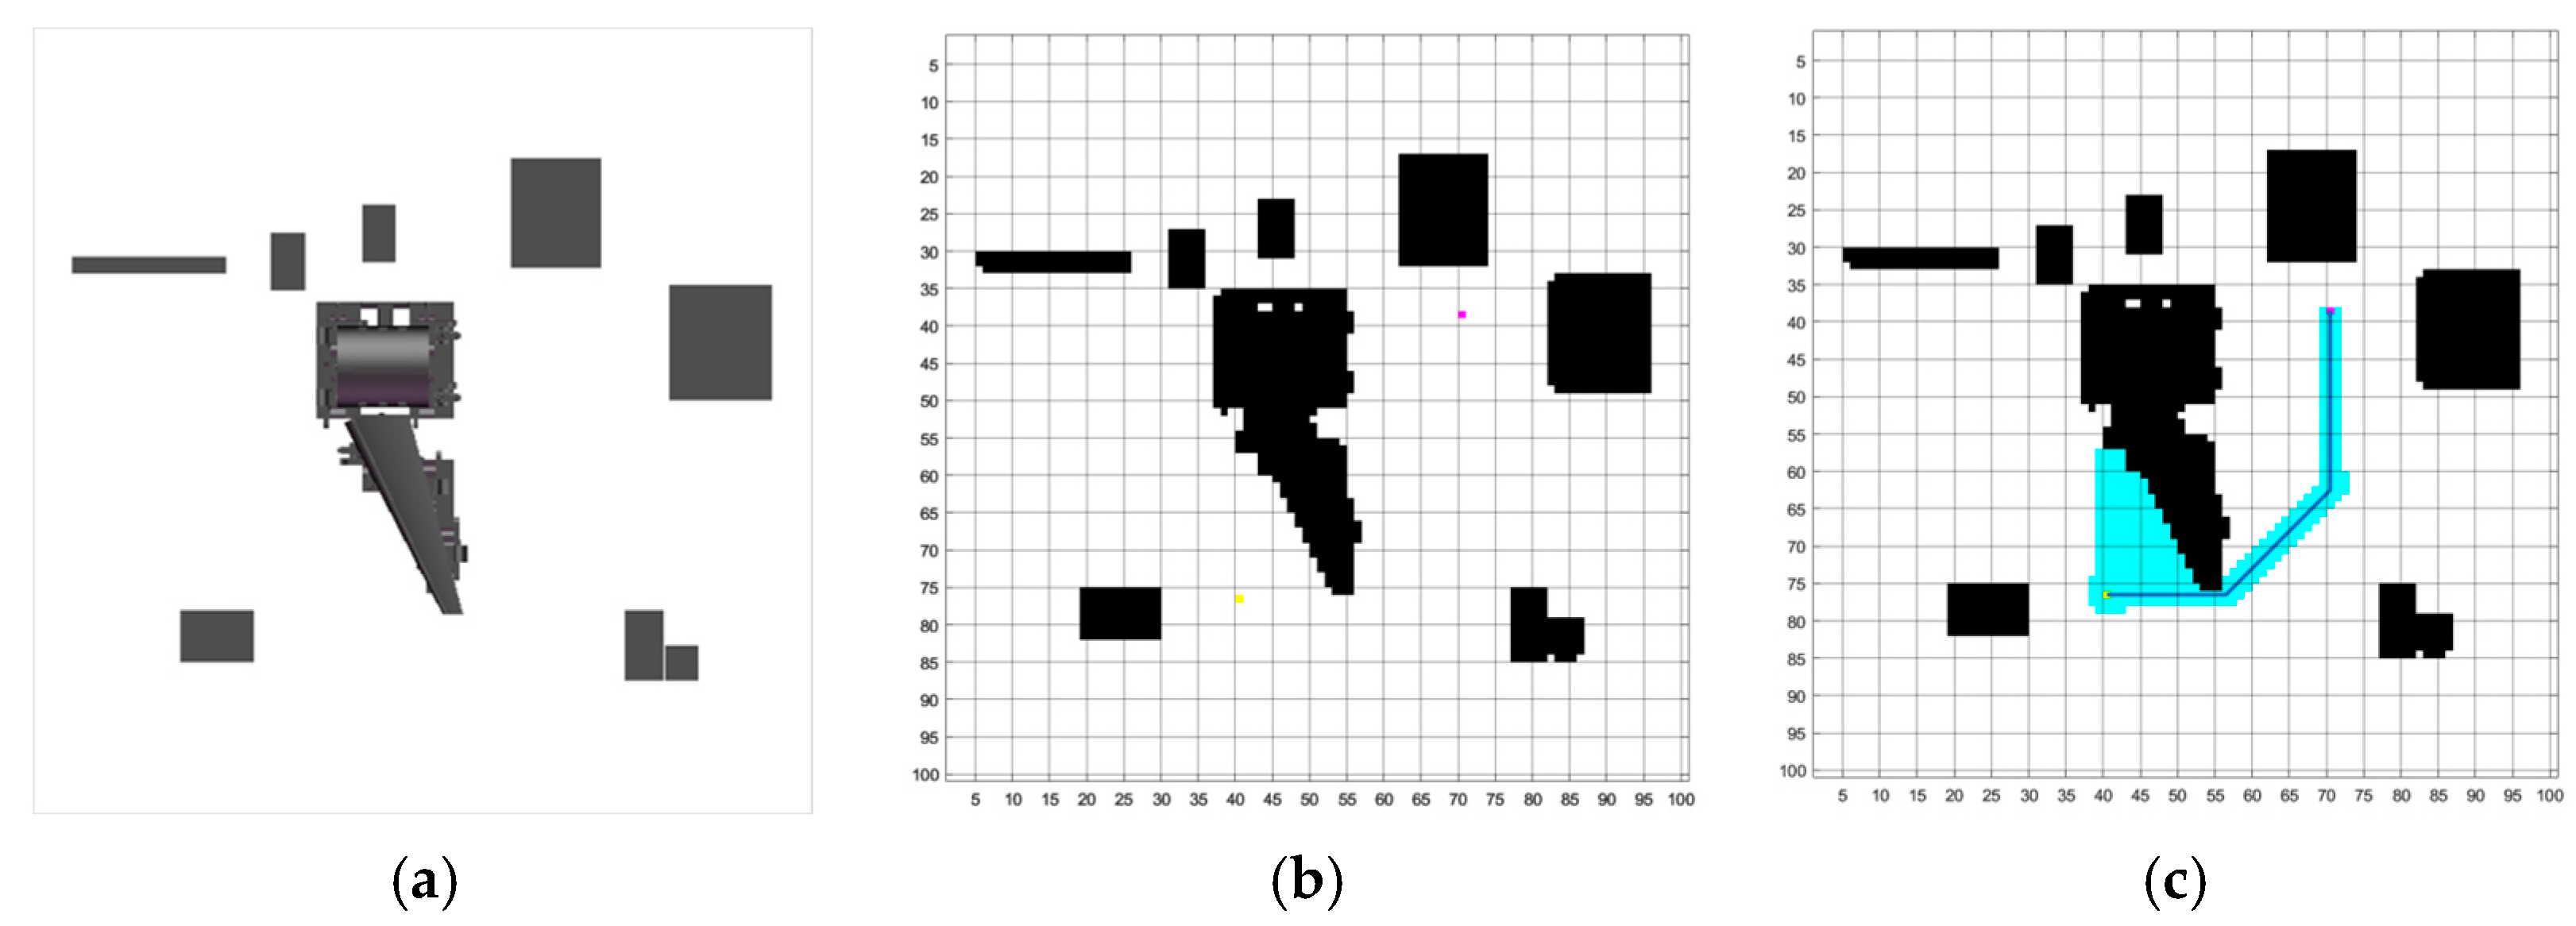
Taking the LT mobile station transition path planning in a wing–fuselage assembly experimental scenario (Figure 7a) as an example, the two-dimensional scene is first reconstructed to obtain the 2D map, as shown in Figure 7b. Then, the path nodes are optimized based on the evaluation function, and the discrete collinear paths are simplified. It should be noted that, because the omni-directional AGV used in this article is restricted to eight principal movement directions (forward, backward, left, right, and the four 45° diagonals), which is also one of the path planning constraints. Finally, the mobile path of the laser tracker is obtained, as illustrated in Figure 7c.

2.4. Measurement Sequence Planning of Discrete KFPs

To improve the measurement efficiency at each LT station, it is necessary not only to reasonably allocate the measurement points among the stations but also to plan the measurement sequence of multiple points within each station; since the LT turning time is positively correlated with the distance between two successive points, the overall measurement efficiency is in this study simplified to minimizing the total measurement path distance.
Let G = V , D be a weighted graph, V = 1 , 2 , , n the set of vertices, n the number of points to be measured under a single station, and D the set of edge lengths, with the distance between vertices denoted as d i , j d i , j > 0 ,   i , j V . The optimization model is formulated as Equation (15).
min D s = i = 1 n j = 1 n a i , j d i , j j = 1 n a i , j = 1 , i V i = 1 n a i , j = 1 , j V i , j s a i , j S 1 , S V ,   2 S n 1 a i , j 0 1
where d i , j denotes the distance between the i -th and j -th measurement points, a i , j indicates the path selection: a i , j = 1 if the path includes the segment from point i to point j, and 0 otherwise, S represents all non-empty subsets of V , and S denotes the total number of vertices in the vertex set V of the weighted graph G .
The traditional exhaustive search method for measurement point sequences requires calculating the total path distance of n 1 ! possible sequences, which results in enormous computational cost. To improve computational efficiency, this article develops a measurement sequence planning model based on an improved genetic algorithm, where heuristic search is employed to reduce optimization time. The final measurement sequence is obtained, and the specific steps are illustrated in Figure 8.
The specific procedure is as follows:
(1)
Population initialization based on a combination of the nearest-neighbor method and the random method. Assume the number of measurement points is n and the population size is N To avoid excessive duplicate individuals during initialization, one measurement point is selected as the first point in the sequence, and the nearest-neighbor method is applied to generate one sequence (i.e., one individual). By taking each measurement point as the first point and performing sorting once, n individuals are generated in total. The remaining N n individuals are then generated using the random method, thereby completing the initialization of all N individuals in the population.
(2)
Offspring generation based on order crossover. A portion of the measurement point sequence is copied from one parent to the offspring, and then the remaining measurement points are copied from the second parent to the offspring while preserving their relative order from the second parent.
(3)
Generate offspring through mutation. A combined mutation operation consisting of inversion, insertion, and swapping is employed. Specifically, inversion reverses the order of measurement points between two randomly selected positions. Insertion moves the measurement point at position i to immediately follow position j . Swapping exchanges the measurement points at positions i and j .
(4)
Design the fitness function. The total distance of each measurement point sequence is calculated, and the reciprocal of the total distance is taken as the fitness function. The smaller the total distance, the better the fitness value.
(5)
Select suitable individuals to retain as parents. The roulette wheel method is employed for selection.
By applying the improved genetic algorithm described above, an optimized measurement sequence is obtained, which reduces the measurement time for a single station and thereby improves the overall measurement efficiency.

3. Experimental Validation and Discussion

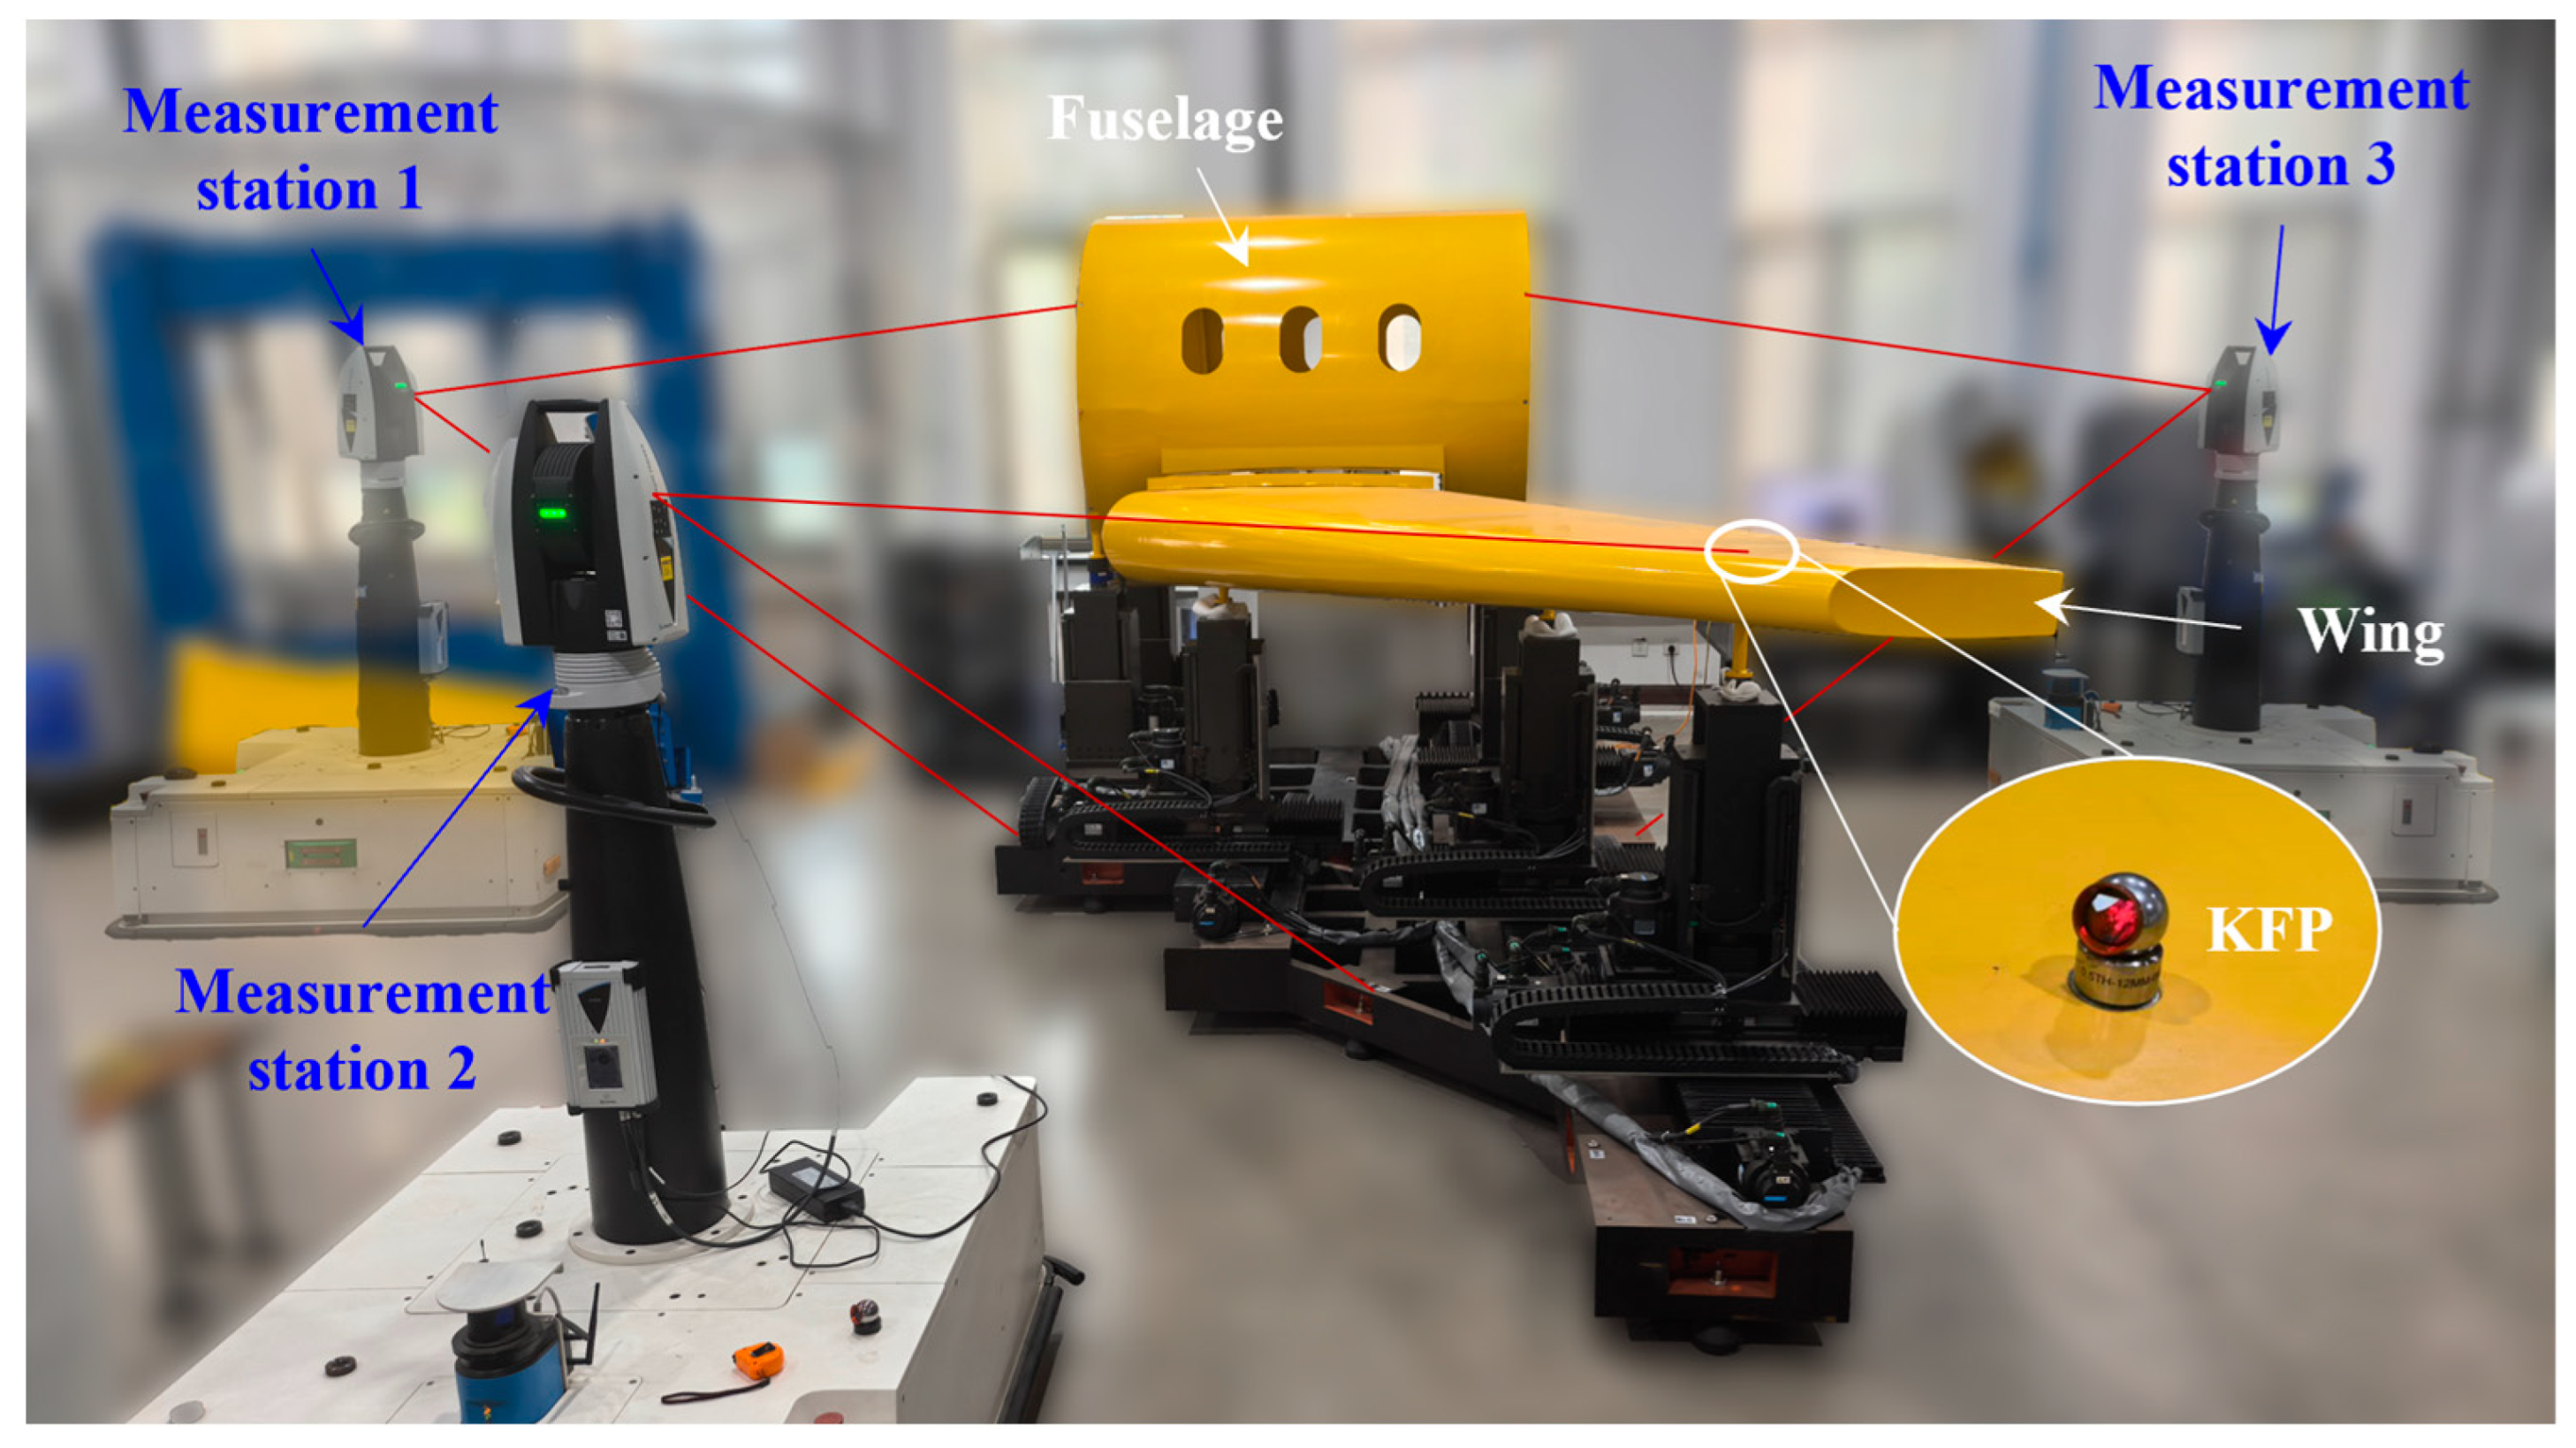
The wing-fuselage assembly process is a canonical complex aircraft assembly scene [28,29]; therefore, a validation experiment was conducted on a simulated wing-to-fuselage assembly to verify the effectiveness of the proposed method. Figure 9 presents a view of the on-site measurement experiment, the LT used was a Leica ATS600 (Hexagon AB, Stockholm, Sweden), with a maximum measurement error of ±(15 μm + 6 μm/m), mounted on an AGV equipped with a LiDAR sensor. The assembly system consisted of a fuselage and a wing, supported by four and three numerical controlled locators, respectively. The KFPs to be measured included 8 posture control points (p1~p8) on the fuselage, 10 posture control points (p9~p18) on the wing, and 21 ERS points (p19~p39), distributed within a spatial volume of 5000 mm × 2000 mm × 1500 mm. All computations for the experiments were performed on a computer with a 20-thread processor (3.50 GHz), 32 GB of RAM, a GPU with 8 GB of VRAM, and a 480 GB SSD.
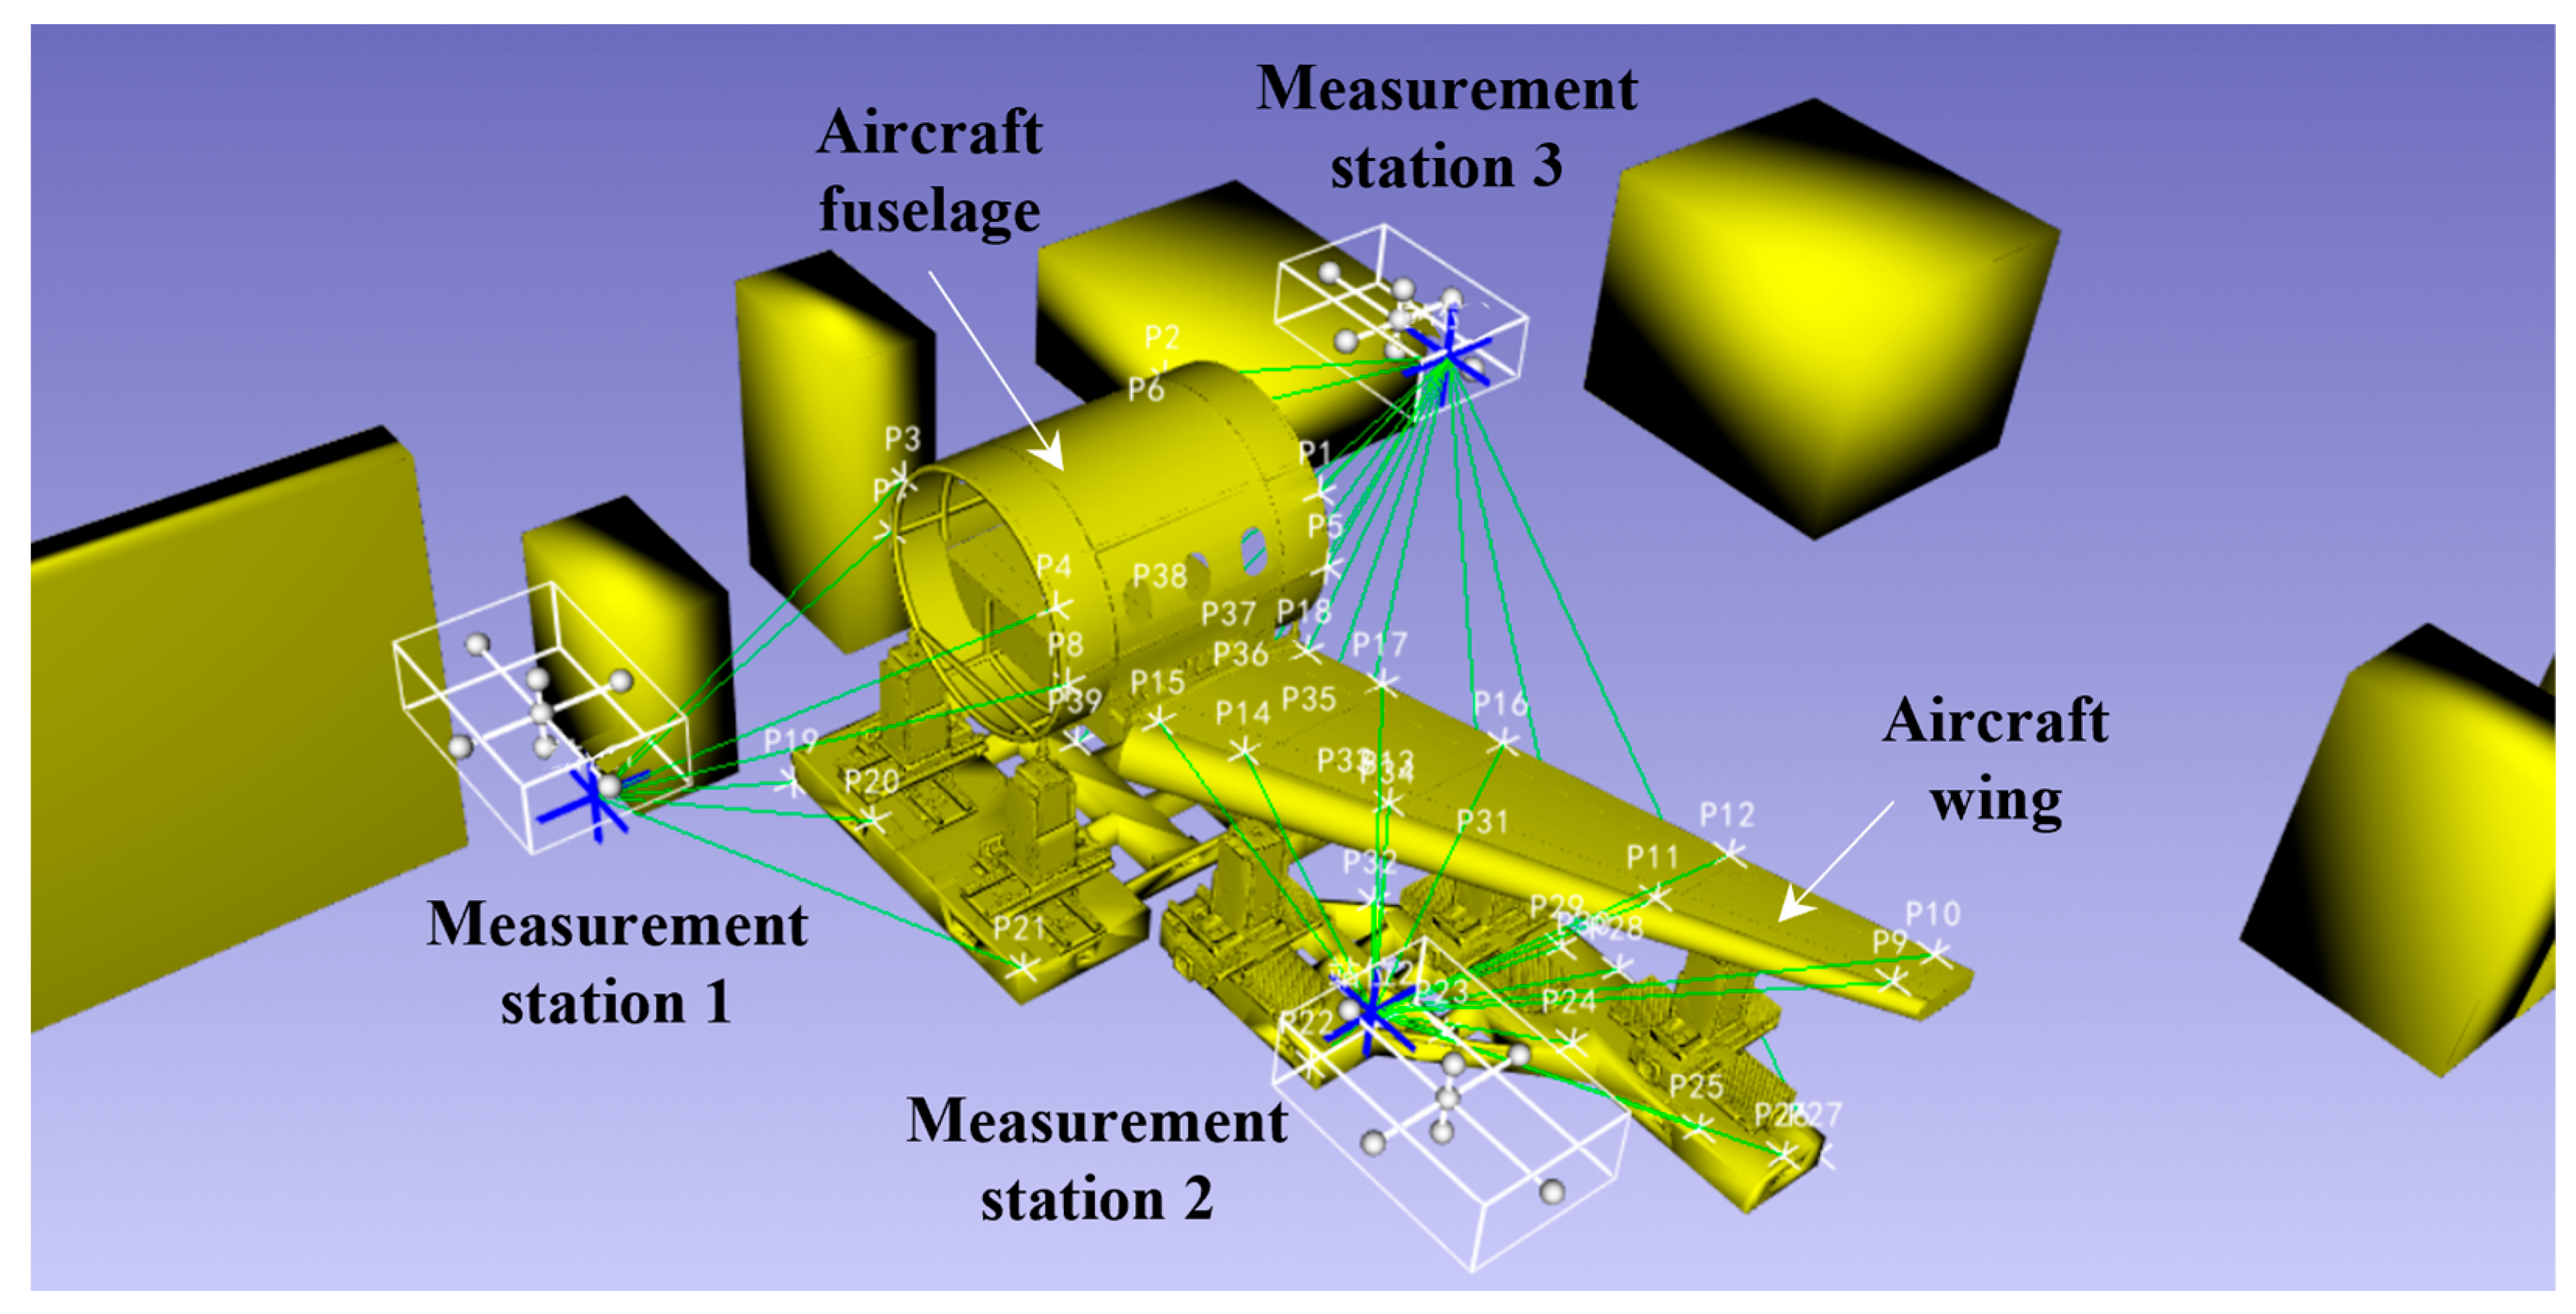
Two approaches were adopted for the arrangement of measurement stations: (i) In the empirical method, station positions are manually assigned by visually examining the observability of each KFP and iteratively adjusted throughout repeated experiments, yielding an experience-based layout. (ii) In the proposed method, station positions are optimized in advance using the proposed station planning method, and the optimization results are then used to guide on-site station placement. To apply the proposed method, the CAD models of the wing, fuselage, jigs, fixtures, and surrounding equipment are rapidly retrieved from the model library according to their on-site layout positions and assembled into a virtual scene that replicates the real environment. This composite scene is then converted into a triangulated .obj format, and the set of 39 KFPs to be measured is imported. Based on the practically measurable space, feasible station placement regions are defined for each station. The proposed algorithm is then applied to plan the stations, yielding the optimized station positions and their assigned measurement tasks (i.e., which points each station measures), as shown in Figure 10. Finally, three station layout results are obtained, and the reference position and measurement tasks of each station are listed in Table 1.
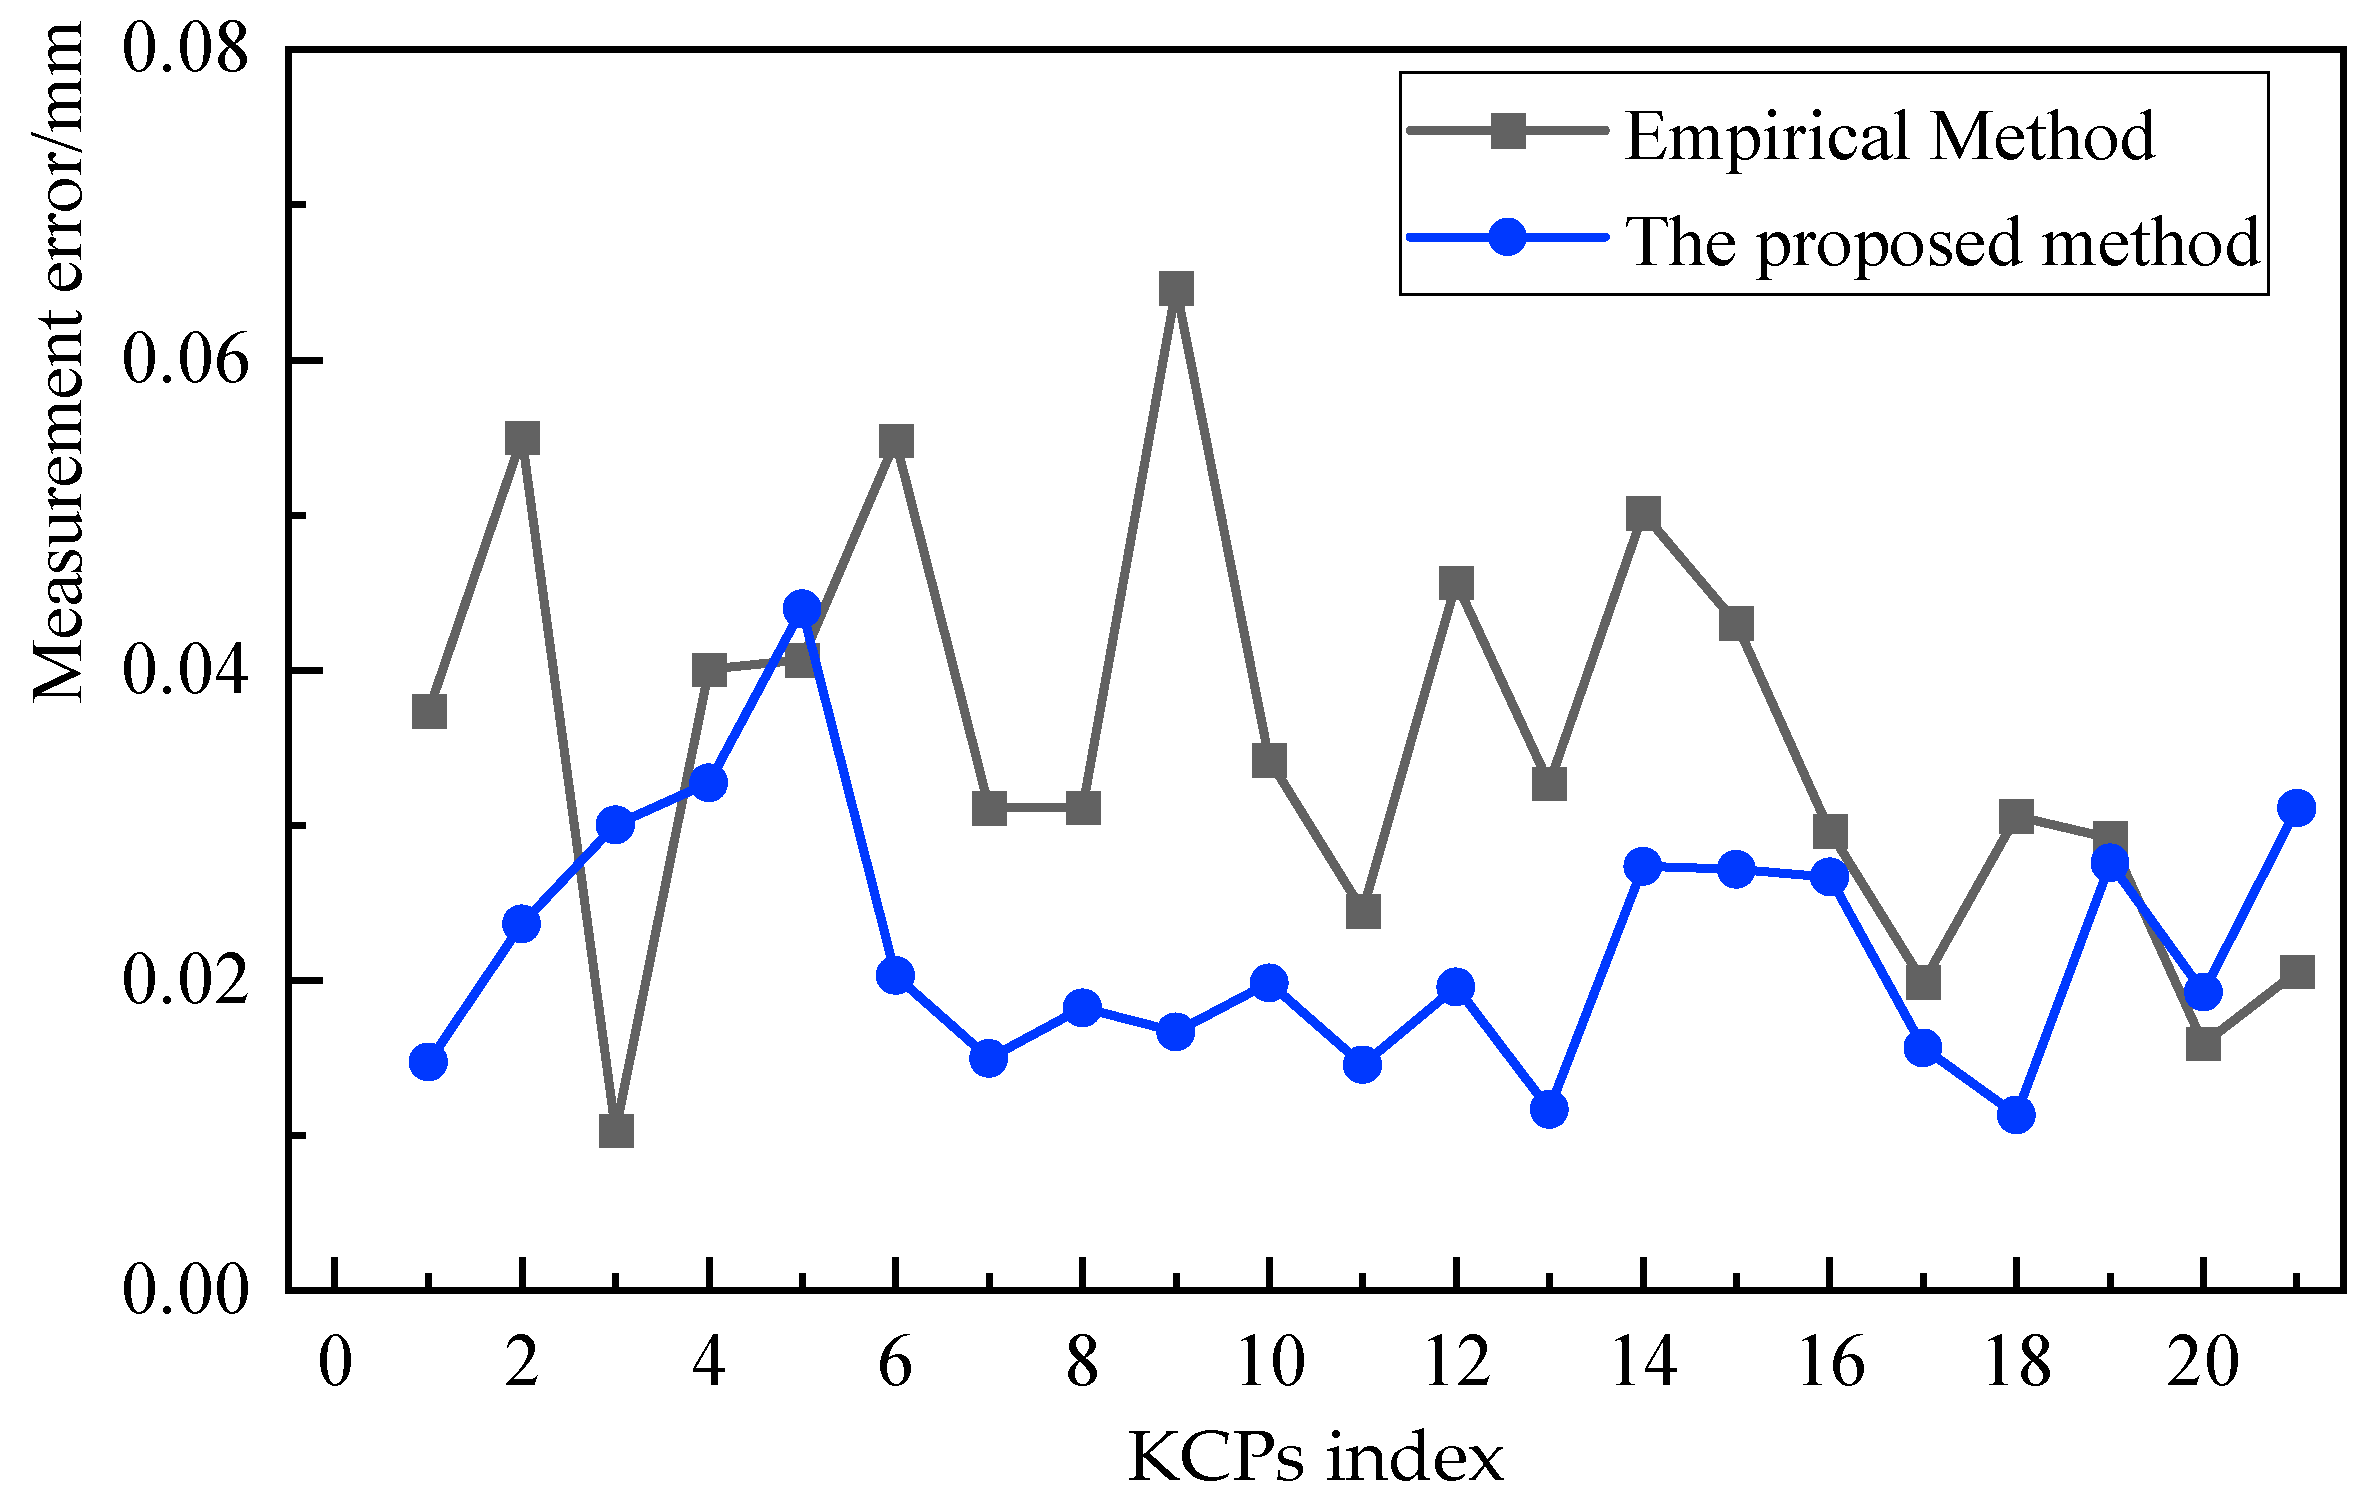
First, we determined the ground-truth coordinates of each KFP by averaging repeated measurements taken with the LT in stable mode under the global coordinate system. In the empirical method, the LT was placed at three stations determined by visual observation to cover all measurement points. In contrast, based on the proposed station planning method, the optimal LT station coordinates under the three-station scheme were obtained and used to guide station layout. Subsequently, the KFPs were measured from each station under both layouts. Using rigid constrained coordinate transformation, we registered the point clouds obtained from each station into the global coordinate system by minimizing the residuals of the common points. For every KFP, its transformed coordinate was then compared with the corresponding ground-truth value acquired in the LT stable mode; the Euclidean distance between the two was taken as the individual measurement error. The results are shown in Figure 11. After station optimization, the average measurement error of the proposed planning method was reduced from 0.035 mm with manual empirical planning to 0.022 mm, a 37% decrease, thereby demonstrating the effectiveness of the proposed method.
During measurement at each station, the proposed method was used to determine the measurement sequence with the shortest total distance. The LT was then rapidly localized by combining coarse and fine localization, and all measurement points at a single station were quickly measured through pointing measurement.
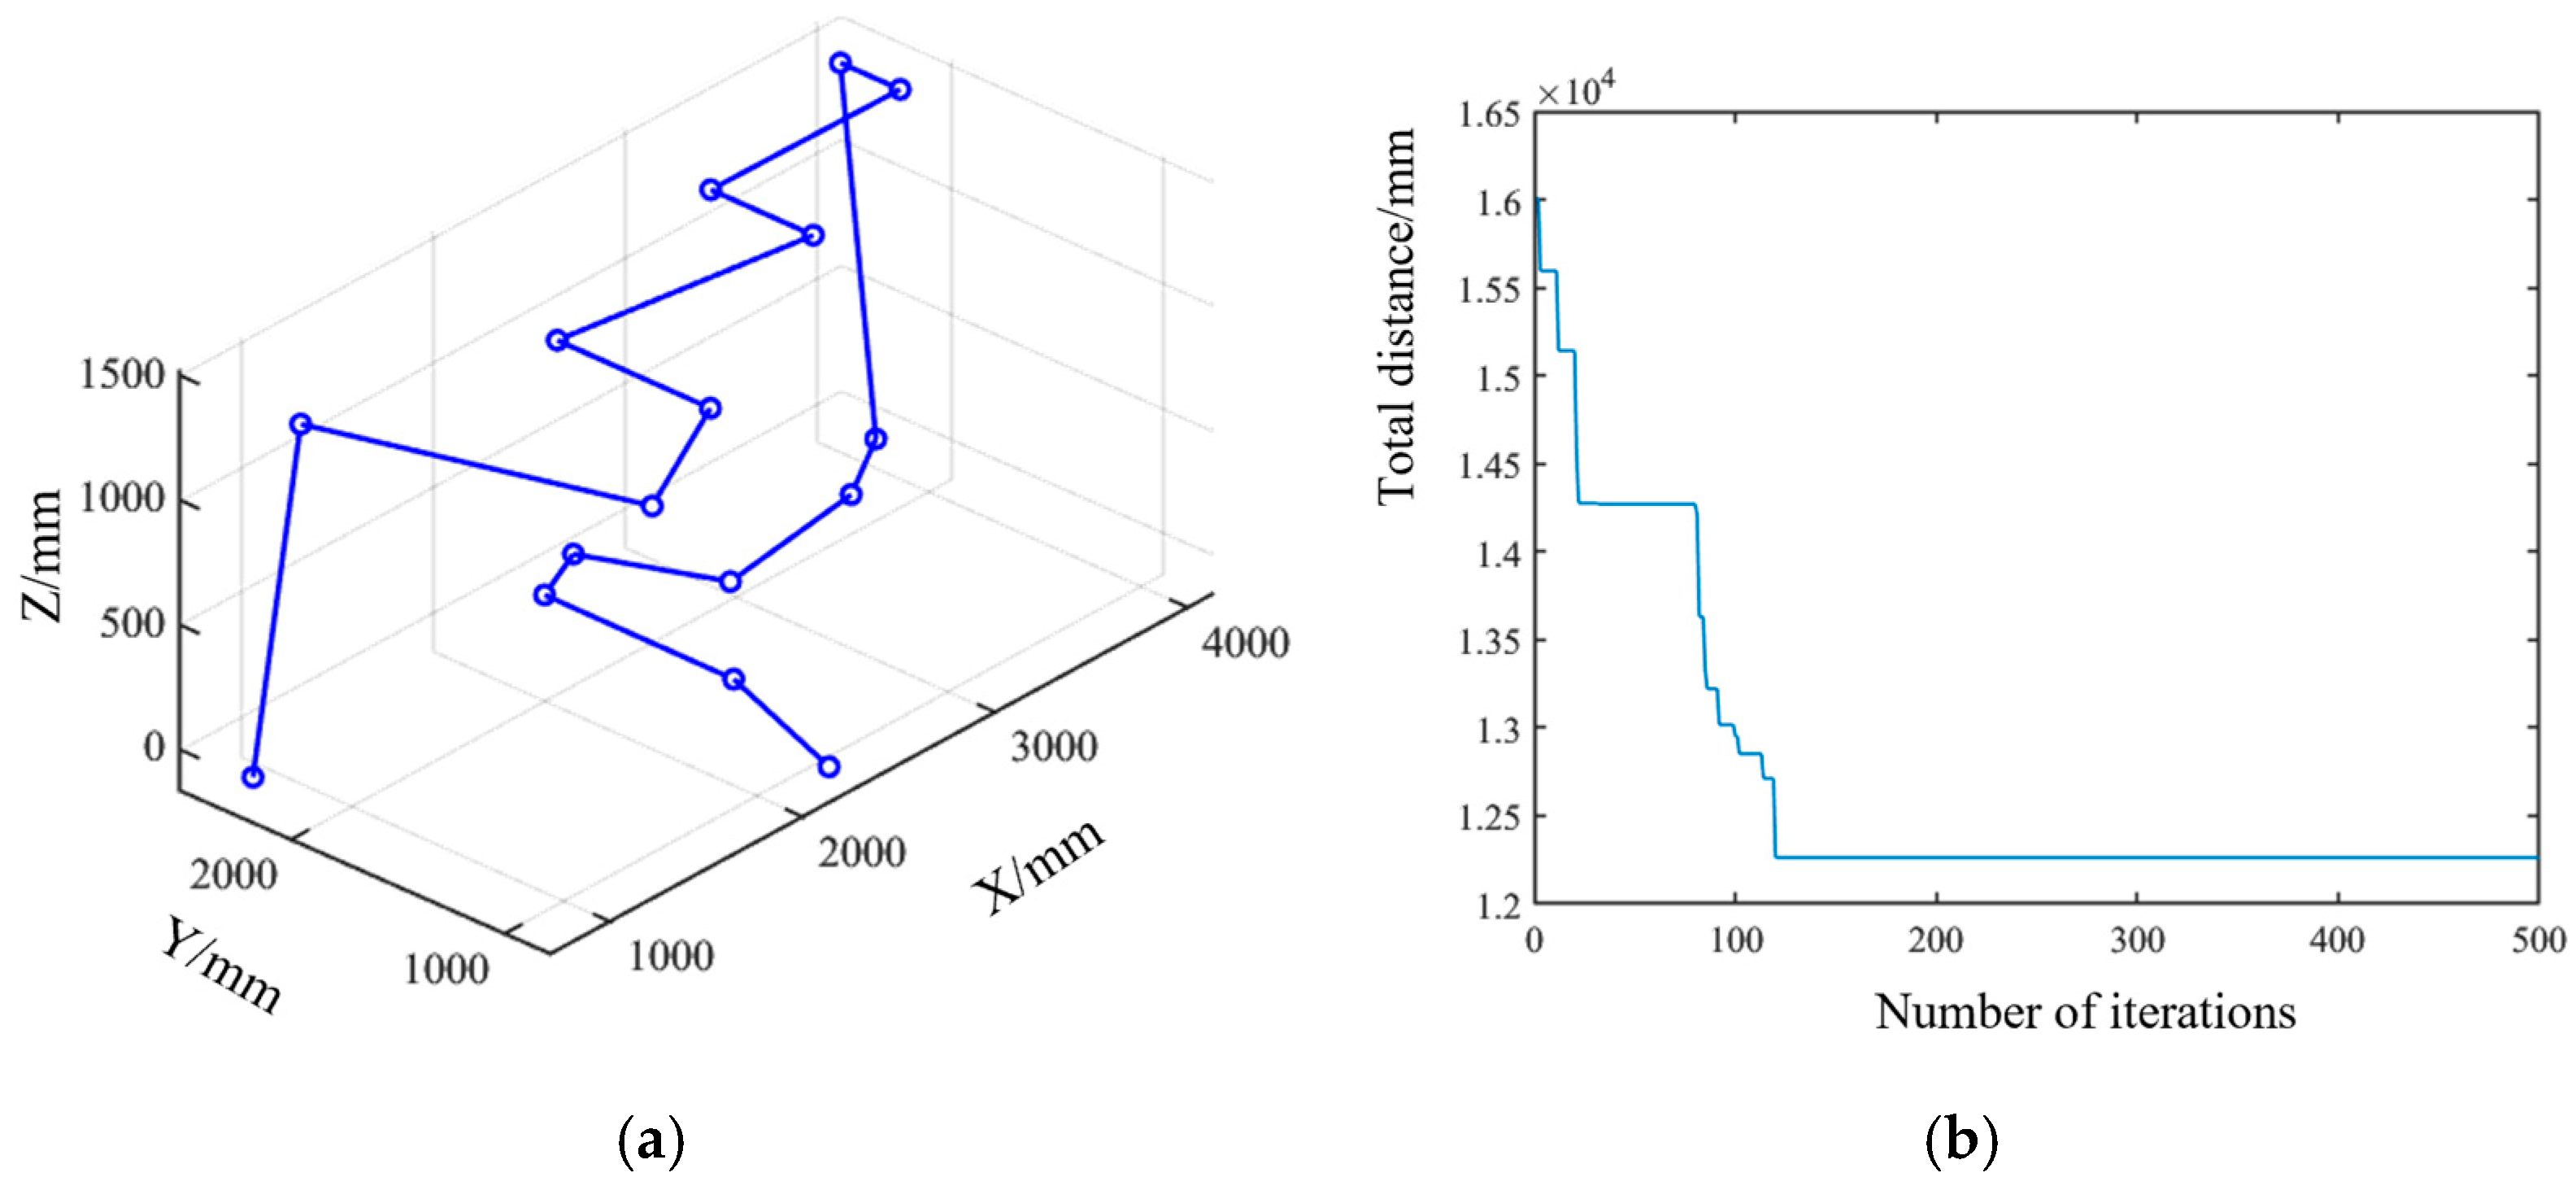
Taking the second station as an example, this station required the measurement of 8 posture control points on the fuselage and wing, as well as 8 ERS points, for a total of 16 points. The coordinates of some KFPs are listed in Table 2. With the objective of minimizing the total distance of the measurement sequence, the parameters were set as follows: population size of 1000, maximum number of iterations of 500, crossover probability of 0.8, mutation probability of 0.2, swapping probability of 0.2, inversion probability of 0.5, and insertion probability of 0.3. Through iterative optimization, the measurement sequence was obtained as shown in Figure 12 In the optimized sequence, the measurement paths neither overlap nor intersect, and the total distances before and after optimization were 16,005.305 mm and 12,261.601 mm, respectively.
Through the proposed studies on online rapid localization of the mobile measurement system, motion path planning, and automatic LT measurement, the overall measurement efficiency of large-scale discrete KFPs was ensured. Experimental results showed that the total measurement time was cut from one hour to within 25 min, representing a reduction of more than 50%.

4. Conclusions

This article proposes an autonomous mobile measurement method for complex aircraft assembly scenes. Considering the issue of line-of-sight occlusion in complex on-site scenes, a measurement station layout is planned to obtain the configuration with the minimum number of stations and the minimum total distance from stations to measurement points, while assigning KFPs measurement tasks to each station. Then, a calibration model was constructed to establish the transformation relationships among multiple on-site coordinate systems. The mobile measurement system was automatically localized through a combined coarse and fine localization approach. Meanwhile, a motion path planning method was developed under complex obstacles, taking both motion time and turning time into account, and the shortest-time path was obtained. Finally, a measurement sequence planning method was developed to minimize the total path length for multiple KFPs over a large area. The resulting automatic measurement sequence ensured non-overlapping and non-intersecting paths. Experimental results show that, compared with manual empirical measurement, the proposed station planning method reduced the average measurement error from 0.035 mm to 0.022 mm, yielding a 37% decrease. Furthermore, the planning and automated execution of motion paths and single-station measurement sequences reduced the measurement time from one hour to within 25 min, representing a reduction of more than 50%. Therefore, the proposed method provides effective guidance for efficient KFPs measurement in complex assembly scenarios of large-scale aircraft components.
In certain aircraft assembly scenarios, multiple instruments may be deployed simultaneously to improve measurement efficiency; however, this article does not address such multi-device coordination. Future work will therefore focus on the optimal scheduling of a fleet of mobile measuring devices and on the development of a fully automated “measurement–planning–control” software platform to further enhance measurement efficiency in aircraft assembly.

Author Contributions

Supervision, Y.Z. and Y.L.; Conceptualization, and methodology, Y.Z. and C.G.; data curation and writing—original draft preparation, C.G.; visualization, S.S. and X.G.; writing—review and editing, Y.S. and W.L. All authors have read and agreed to the published version of the manuscript.

Funding

This research was funded in part by the National Natural Science Foundation of China under Grant 52275519, and in part by the Young Elite Scientists Sponsorship Program by CAST under Grant YESS20220165.

Data Availability Statement

The original contributions presented in this study are included in the article. Further inquiries can be directed to the corresponding author.

Conflicts of Interest

Author Xiao Guan was employed by the company COMAC Shanghai Aircraft Manufacturing Co., Ltd. The remaining authors declare that the research was conducted in the absence of any commercial or financial relationships that could be construed as a potential conflict of interest.

References

  1. Cao, T.; Huang, X.; Li, S.; Hou, G. Multi-Source Error Coupling and Tolerance Optimization for Improving the Precision of Automated Assembly of Aircraft Components. Machines 2025, 13, 736. [Google Scholar] [CrossRef]
  2. Gai, Y.; Zhang, J.; Guo, J.; Shi, X.; Wu, D.; Chen, K. Construction and Uncertainty Evaluation of Large-Scale Measurement System of Laser Trackers in Aircraft Assembly. Measurement 2020, 165, 108144. [Google Scholar] [CrossRef]
  3. Li, Y.; Liu, W.; Lu, H.; Liu, R.; Gao, C.; Chen, Q.; Zhang, Y. Workspace-Based Hybrid Force Position Posture Alignment for High Quality Aircraft Assembly of Large-Scale Components. Chin. J. Aeronaut. 2025, 103414. [Google Scholar] [CrossRef]
  4. Wang, Y.; Liu, Y.; Chen, H.; Xie, Q.; Zhang, K.; Wang, J. Combined Measurement Based Wing-Fuselage Assembly Coordination via Multiconstraint Optimization. IEEE Trans. Instrum. Meas. 2022, 71, 1–16. [Google Scholar] [CrossRef]
  5. Chu, W.; Li, G.; Li, S.; Huang, X. Posture Adjustment Method of Large Aircraft Components Based on Multiple Numerical Control Positioners. Int. J. Adv. Manuf. Technol. 2023, 126, 2159–2174. [Google Scholar] [CrossRef]
  6. Sun, Z.; Wang, H.; Zhao, B.; Wang, S.; Xue, Y. Docking Pose Analytical Calculation Method for Large Components Based on Draw-Wire Displacement Sensors. Measurement 2025, 242, 116072. [Google Scholar] [CrossRef]
  7. Lu, Y.; Liu, W.; Zhang, Y.; Li, J.; Sun, S.; Cui, J.; Zeng, T. Accurate Construction Method of Sensor Measurement Network System for In-Situ Manufacturing of Large Aerospace Component. IEEE Trans. Instrum. Meas. 2023, 72, 1–11. [Google Scholar] [CrossRef]
  8. Zhehan, C.; Fuzhou, D.; Xiaoqing, T. Research on Uncertainty in Measurement Assisted Alignment in Aircraft Assembly. Chin. J. Aeronaut. 2013, 26, 1568–1576. [Google Scholar] [CrossRef]
  9. Lu, Y.; Liu, W.; Zhang, Y.; Xing, H.; Li, J.; Liu, S.; Zhang, L. An Accurate Calibration Method of Large-Scale Reference System. IEEE Trans. Instrum. Meas. 2020, 69, 6957–6967. [Google Scholar] [CrossRef]
  10. Brillinger, C.; Susemihl, H.; Ehmke, F.; Staude, T.; Deutmarg, K.; Klemstein, M.; Boehlmann, C.; Hintze, W.; Wollnack, J. Mobile Laser Trackers for Aircraft Manufacturing: Increasing Accuracy and Productivity of Robotic Applications for Large Parts; SAE International: Warrendale, PA, USA, 2019. [Google Scholar]
  11. Sheng, Y.; Wang, Y.; Liu, S.; Wang, C.; Xi, J. Large-Scale Measurement Layout Optimization Method Based on Laser Multilateration. Machines 2022, 10, 988. [Google Scholar] [CrossRef]
  12. Zou, L.; Luo, C.; Zhang, G.; Zhang, Q.; He, Y. Method of High-Precision Measurement Station Optimization and Layout Deviation Compensation for Laser Tracker. IEEE Trans. Instrum. Meas. 2025, 74, 1–13. [Google Scholar] [CrossRef]
  13. Xu, S.; Huang, X.; Li, S.; Hou, G. The Research on Spatial Accuracy-Driven Adaptive Measurement Station Planning for Laser Trackers Based on Monte Carlo Simulations and GA-BP Neural Networks. Meas. Sci. Technol. 2025, 36, 065007. [Google Scholar] [CrossRef]
  14. Zhou, S.; Cheng, G.; Meng, Q.; Lin, H.; Du, Z.; Wang, F. Development of Multi-Sensor Information Fusion and AGV Navigation System. In Proceedings of the 2020 IEEE 4th Information Technology, Networking, Electronic and Automation Control Conference (ITNEC), Chongqing, China, 12–14 June 2020; Volume 1, pp. 2043–2046. [Google Scholar]
  15. Verde, P.; Díez-González, J.; Álvarez, R.; Perez, H. Characterization of AGV Localization System in Industrial Scenarios Using UWB Technology. IEEE Trans. Instrum. Meas. 2023, 72, 1–13. [Google Scholar] [CrossRef]
  16. Wang, S.-Y.; Li, C.-M.; Liong, S.-T.; Sheng, Y.-T.; Huang, Y.-C.; Liong, G.-B.; Gan, Y.-S. AGV Indoor Localization: A High Fidelity Positioning and Map Building Solution Based on Drawstring Displacement Sensors. J. Ambient. Intell. Hum. Comput. 2024, 15, 2277–2293. [Google Scholar] [CrossRef]
  17. Chung, M.-A.; Lin, C.-W. An Improved Localization of Mobile Robotic System Based on AMCL Algorithm. IEEE Sens. J. 2022, 22, 900–908. [Google Scholar] [CrossRef]
  18. Ren, J.; Li, W.; Ou, J.; Shi, J.; Jia, K.; Hou, M.; Zhou, J.; Huang, P.; Fu, Z.; Liu, J.; et al. ALEL-AMCL: An Artificial Landmark Enhanced Localization of Mobile Robotic System Based on AMCL Algorithm. Meas. Sci. Technol. 2025, 36, 056311. [Google Scholar] [CrossRef]
  19. Xu, T. Recent Advances in Rapidly-Exploring Random Tree: A Review. Heliyon 2024, 10, e32451. [Google Scholar] [CrossRef] [PubMed]
  20. Agirrebeitia, J.; Avilés, R.; de Bustos, I.F.; Ajuria, G. A New APF Strategy for Path Planning in Environments with Obstacles. Mech. Mach. Theory 2005, 40, 645–658. [Google Scholar] [CrossRef]
  21. Warren, C.W. Fast Path Planning Using Modified A* Method. In Proceedings of the 1993 IEEE International Conference on Robotics and Automation, Atlanta, GA, USA, 2–6 May 1993; Volume 2, pp. 662–667. [Google Scholar]
  22. Kabir, R.; Watanobe, Y.; Islam, M.R.; Naruse, K. Enhanced Robot Motion Block of A-Star Algorithm for Robotic Path Planning. Sensors 2024, 24, 1422. [Google Scholar] [CrossRef] [PubMed]
  23. Martins, O.O.; Adekunle, A.A.; Olaniyan, O.M.; Bolaji, B.O. An Improved Multi-Objective a-Star Algorithm for Path Planning in a Large Workspace: Design, Implementation, and Evaluation. Sci. Afr. 2022, 15, e01068. [Google Scholar] [CrossRef]
  24. Wang, X.; Lu, J.; Ke, F.; Wang, X.; Wang, W. Research on AGV Task Path Planning Based on Improved A* Algorithm. Virtual Real. Intell. Hardw. 2023, 5, 249–265. [Google Scholar] [CrossRef]
  25. Brunton, S.L.; Nathan Kutz, J.; Manohar, K.; Aravkin, A.Y.; Morgansen, K.; Klemisch, J.; Goebel, N.; Buttrick, J.; Poskin, J.; Blom-Schieber, A.W.; et al. Data-Driven Aerospace Engineering: Reframing the Industry with Machine Learning. AIAA J. 2021, 59, 2820–2847. [Google Scholar] [CrossRef]
  26. Sun, H.; Zhang, W.; Yu, R.; Zhang, Y. Motion Planning for Mobile Robots—Focusing on Deep Reinforcement Learning: A Systematic Review. IEEE Access 2021, 9, 69061–69081. [Google Scholar] [CrossRef]
  27. Zhu, Y.; Wan Hasan, W.Z.; Harun Ramli, H.R.; Norsahperi, N.M.H.; Mohd Kassim, M.S.; Yao, Y. Deep Reinforcement Learning of Mobile Robot Navigation in Dynamic Environment: A Review. Sensors 2025, 25, 3394. [Google Scholar] [CrossRef]
  28. Deng, Z.; Huang, X.; Li, S.; Xing, H. On-Line Calibration and Uncertainties Evaluation of Spherical Joint Positions on Large Aircraft Component for Zero-Clearance Posture Alignment. Robot. Comput.-Integr. Manuf. 2019, 56, 38–54. [Google Scholar] [CrossRef]
  29. Wu, D.; Du, F. A Multi-Constraints Based Pose Coordination Model for Large Volume Components Assembly. Chin. J. Aeronaut. 2020, 33, 1329–1337. [Google Scholar] [CrossRef]
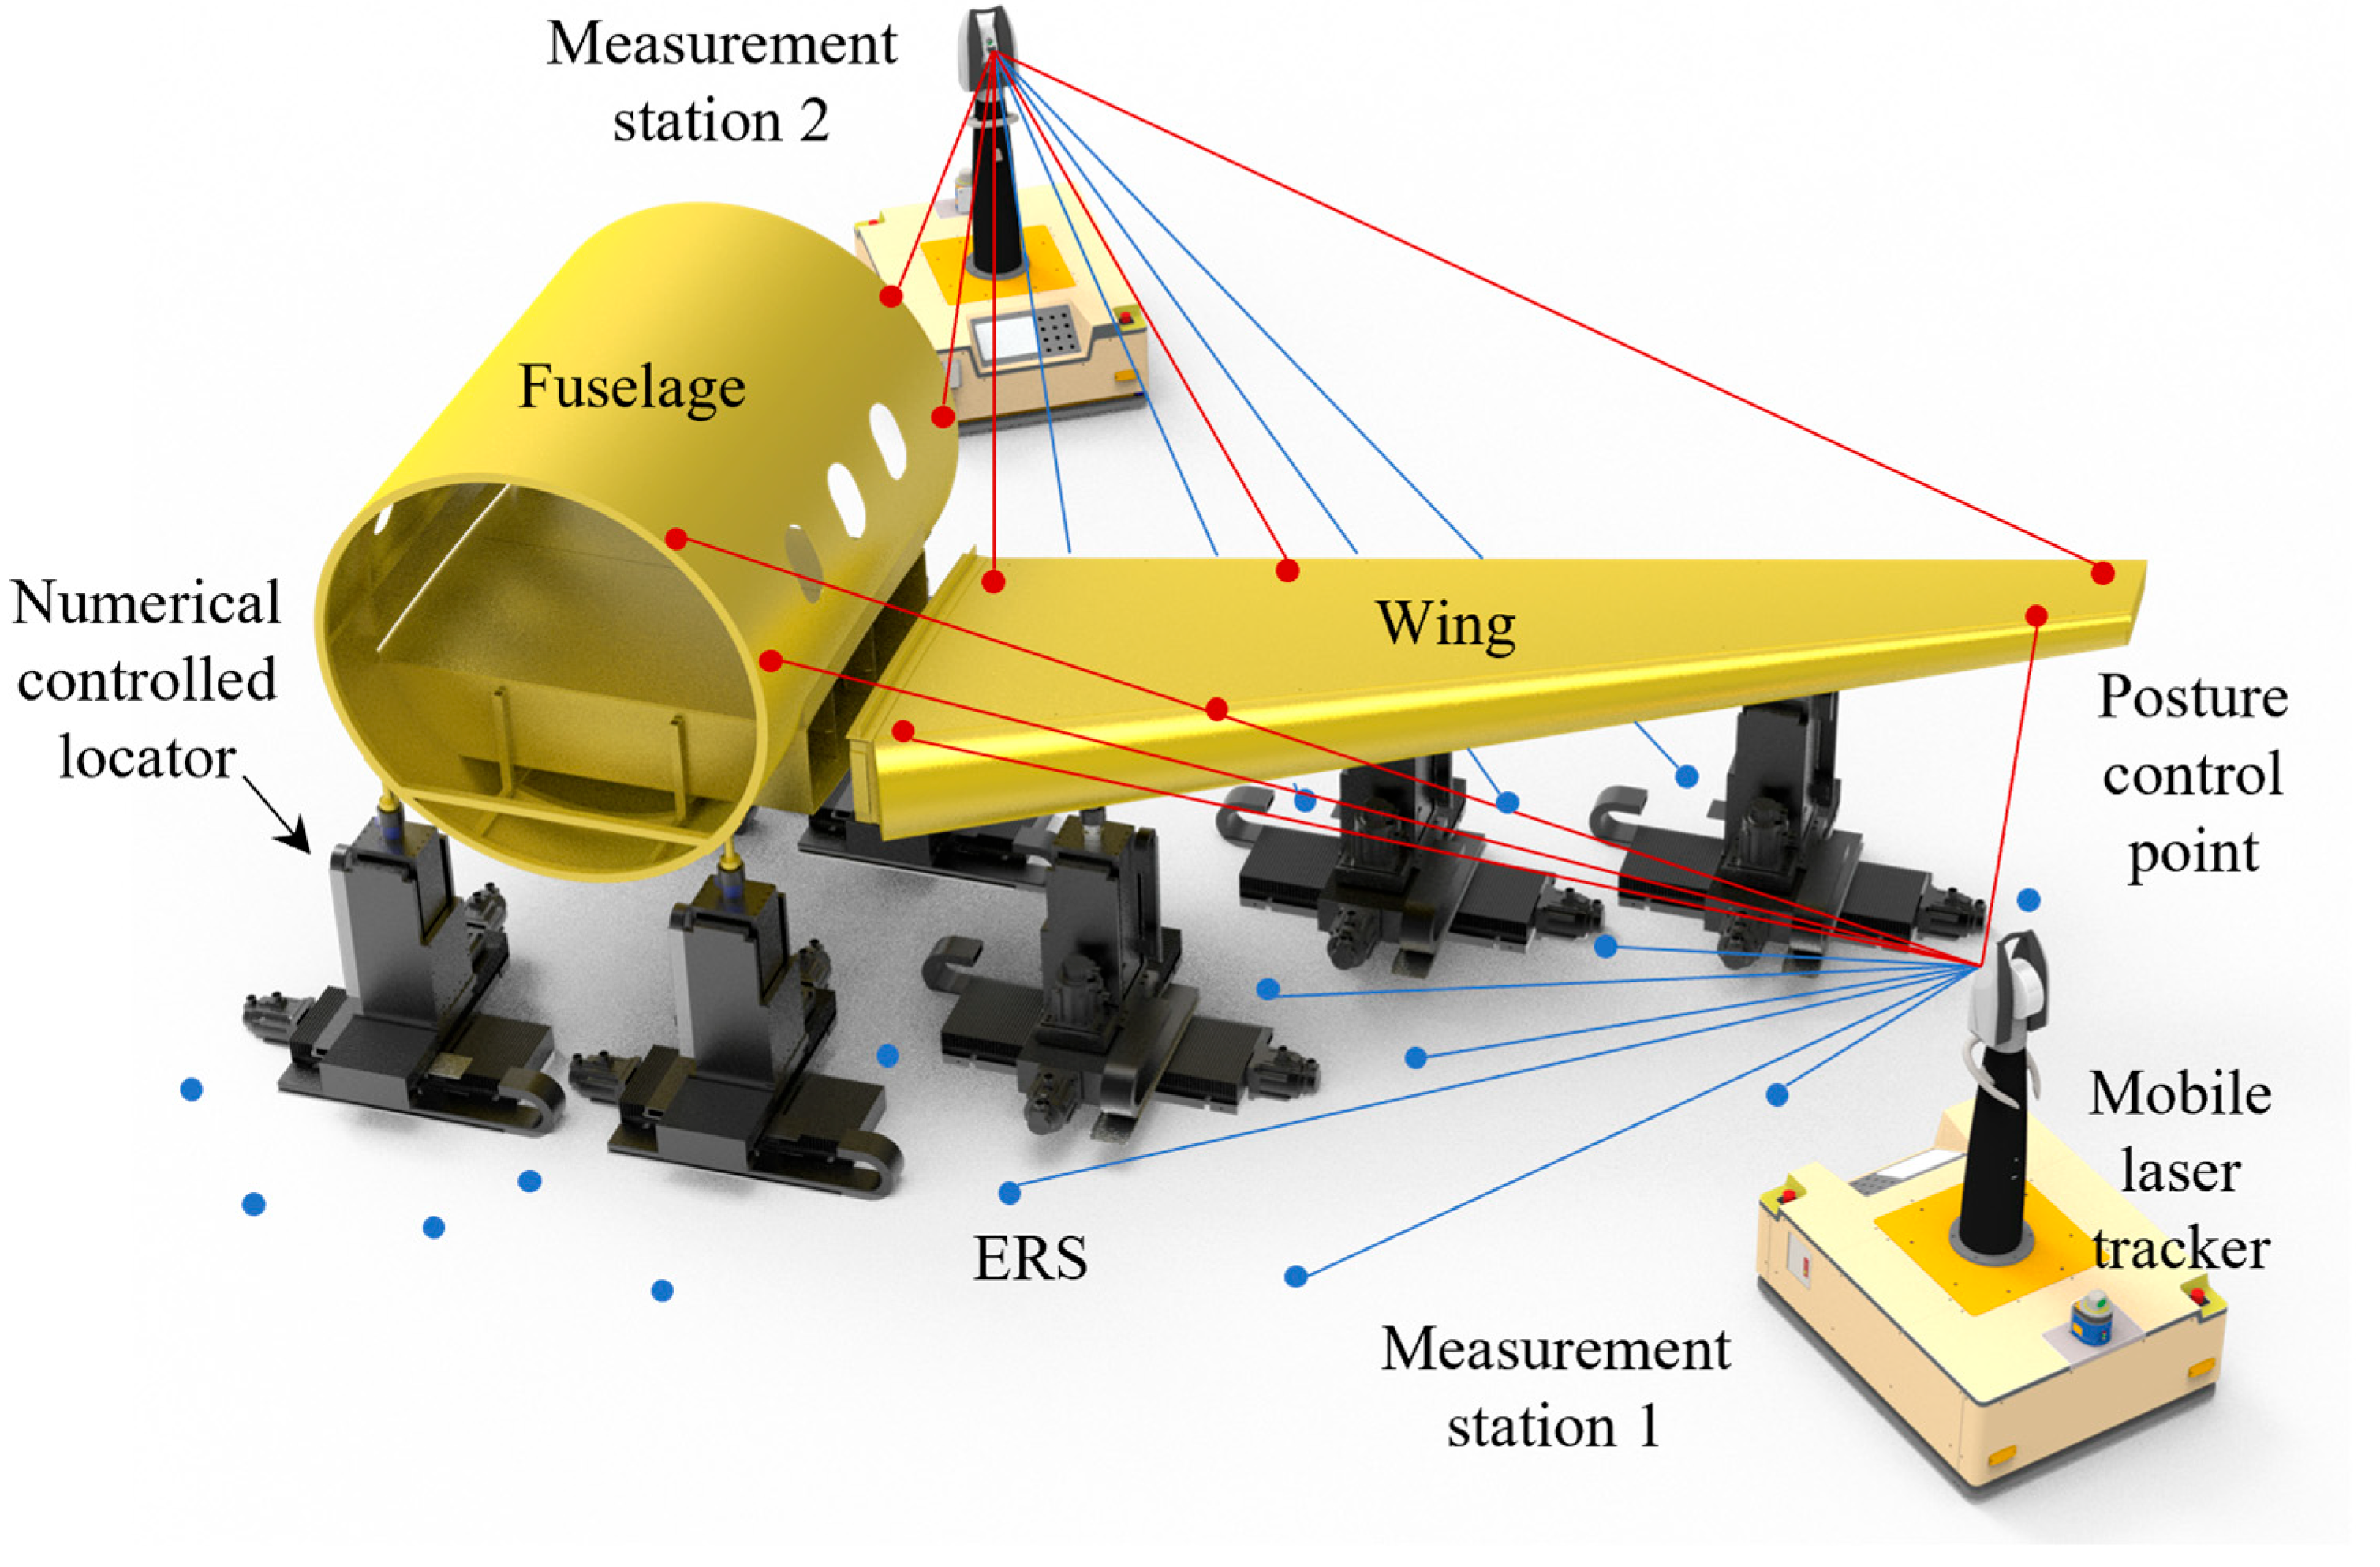
Figure 1. Measurement of KFPs in the assembly process of large-scale aircraft components.
Machines 13 00892 g001
Figure 2. Overall architecture of the autonomous measurement method for KFPs.
Machines 13 00892 g002
Figure 3. Occlusion determination method based on the ray–triangle model.
Machines 13 00892 g003
Figure 4. Composition of the mobile measurement system and its moving scenario.
Machines 13 00892 g004
Figure 5. Illustration of multi-coordinate system calibration and online localization. (a) Schematic of offline calibration. (b) Online localization combining coarse and fine positioning.
Machines 13 00892 g005
Figure 6. Localization of the AGV in the two-dimensional map.
Machines 13 00892 g006
Figure 7. Mobile path planning results based on time optimization. (a) Wing–fuselage assembly site. (b) Grid map of the site. (c) Result of mobile path planning.
Machines 13 00892 g007
Figure 8. Sequence planning of measurement points based on the improved genetic algorithm.
Machines 13 00892 g008
Figure 9. Experiment of measuring station planning with LT.
Machines 13 00892 g009
Figure 10. Calculation results of station planning.
Machines 13 00892 g010
Figure 11. Comparison of measurement errors for each point.
Machines 13 00892 g011
Figure 12. Measurement sequence planning results based on the genetic algorithm. (a) Measurement path of 39 points. (b) Iterative computation process.
Machines 13 00892 g012
Table 1. Reference position and measurement tasks of each station.
Station NameReference Position of StationMeasurement Tasks
X/mmY/mmZ/mm
Station 1−422.352−1669.2651371.717p3, p4, p7, p8, p15, p19, p20, p21, p22, p39
Station 24060.940−85.0441482.281p5, p9, p10, p11, p12, p13, p14, p16, p23, p24, p25, p26, p27, p28, p29, p34
Station 3−633.6453843.3051319.160p1, p2, p6, p17, p18, p30, p31, p32, p33, p35, p36, p37, p38
Table 2. Three-dimensional coordinates of the series of test points.
Point NameX/mmY/mmZ/mm
P5699.0001947.1901555.386
P9694.081362.0781552.166
P104060.5662248.5821357.038
P282584.7082388.40338.779
P292303.7042270.35737.910
P34923.4432394.333−159.615
Disclaimer/Publisher’s Note: The statements, opinions and data contained in all publications are solely those of the individual author(s) and contributor(s) and not of MDPI and/or the editor(s). MDPI and/or the editor(s) disclaim responsibility for any injury to people or property resulting from any ideas, methods, instructions or products referred to in the content.