Article

From Sensors to Insights: Interpretable Audio-Based Machine Learning for Real-Time Vehicle Fault and Emergency Sound Classification

1
Department of Computer Science and Information, Applied College, Taibah University, Medinah 42353, Saudi Arabia
2
King Salman Center for Disability Research, Riyadh 11614, Saudi Arabia
3
Department of Computers and Control Systems Engineering, Faculty of Engineering, Mansoura University, Mansoura 35516, Egypt
4
Department of Communications and Electronics Engineering, Faculty of Engineering, Mansoura University, Mansoura 35516, Egypt
5
Department of Computer Science, College of Computer Science and Engineering, Taibah University, Yanbu 46421, Saudi Arabia
6
Department of Computer Science, Faculty of Computers and Information, Assiut University, Assiut 71516, Egypt
7
Department of Computer Science, Faculty of Science, Tanta University, Tanta 31527, Egypt
8
Department of Electrical Engineering, College of Engineering, Taif University, P.O. Box 11099, Taif 21944, Saudi Arabia
9
Department of Information Systems, College of Computer Science and Engineering, Taibah University, Yanbu 46421, Saudi Arabia
*
Author to whom correspondence should be addressed.
Machines 2025, 13(10), 888; https://doi.org/10.3390/machines13100888
Submission received: 19 August 2025 / Revised: 22 September 2025 / Accepted: 25 September 2025 / Published: 28 September 2025
(This article belongs to the Section Vehicle Engineering)

Abstract

Unrecognized mechanical faults and emergency sounds in vehicles can compromise safety, particularly for individuals with hearing impairments and in sound-insulated or autonomous driving environments. As intelligent transportation systems (ITSs) evolve, there is a growing need for inclusive, non-intrusive, and real-time diagnostic solutions that enhance situational awareness and accessibility. This study introduces an interpretable, sound-based machine learning framework to detect vehicle faults and emergency sound events using acoustic signals as a scalable diagnostic source. Three purpose-built datasets were developed: one for vehicular fault detection, another for emergency and environmental sounds, and a third integrating both to reflect real-world ITS acoustic scenarios. Audio data were preprocessed through normalization, resampling, and segmentation and transformed into numerical vectors using Mel-Frequency Cepstral Coefficients (MFCCs), Mel spectrograms, and Chroma features. To ensure performance and interpretability, feature selection was conducted using SHAP (explainability), Boruta (relevance), and ANOVA (statistical significance). A two-phase experimental workflow was implemented: Phase 1 evaluated 15 classical models, identifying ensemble classifiers and multi-layer perceptrons (MLPs) as top performers; Phase 2 applied advanced feature selection to refine model accuracy and transparency. Ensemble models such as Extra Trees, LightGBM, and XGBoost achieved over 91% accuracy and AUC scores exceeding 0.99. SHAP provided model transparency without performance loss, while ANOVA achieved high accuracy with fewer features. The proposed framework enhances accessibility by translating auditory alarms into visual/haptic alerts for hearing-impaired drivers and can be integrated into smart city ITS platforms via roadside monitoring systems.

1. Introduction

Identifying emergencies and mechanical faults through sound plays a vital role in vehicle safety [1], particularly for individuals who are deaf or hard of hearing. Traditional warning systems often rely on auditory cues such as alarms, engine knocks, or squealing brakes. However, these signals may be inaccessible to drivers with hearing impairments or masked in vehicles with advanced sound insulation. Modern cars increasingly employ onboard diagnostic (OBD) and sensor-based systems to monitor performance and reliably capture early signs of faults. Nevertheless, specific issues manifest primarily through acoustic patterns, such as suspension anomalies, belt slippage, or exhaust leaks. In such cases, sound-based diagnostic systems can serve as a complementary, non-intrusive approach to existing OBD methods, offering additional early-warning cues [2]. By analyzing and translating these sounds into visual or haptic feedback, vehicles can be made more inclusive and intelligent, enhancing safety and reducing costly repairs.
Although modern vehicles include built-in maintenance reminders and service schedules, unexpected issues can still occur between these planned intervals [3]. For example, sudden belt slippage, brake wear, or exhaust leakage may not immediately trigger electronic alerts, yet they often produce distinctive acoustic cues. In such cases, sound analysis can provide an additional, non-intrusive channel for early detection, supporting both drivers and technicians in identifying problems before they escalate into more serious failures. This supplementary role enhances road safety and helps reduce the likelihood of costly, unscheduled repairs.
Machines generate vibrations and sound signals during operation, which can be analyzed to assess their condition. Each sound signal carries energy, has a wavelength, and provides information about the source’s location and state. These signals have multiple attributes with varying values, which help distinguish different types of faults over time.
Engine or vehicle component sounds—such as those from the transmission, brake pads, or other attachments—can indicate mechanical issues [4]. For example, degraded engine oil fails to lubricate the piston properly, producing a harsh sound that signals an oil fault. A loosely fixed timing chain vibrates, altering the engine sound. Crank faults can damage the oil ring or piston rings. At the same time, pressure deviations of 5°–10° in valve timing can cause significant changes in engine noise.
Diagnostic systems can be broadly categorized into OBD and Non-OBD Systems [5]. OBD systems are integrated systems within a vehicle that continuously monitors engine performance, emissions, and system faults. In contrast, Non-OBD systems rely on external tools such as remote sensors, sound analysis, and AI-driven monitoring. As vehicle technology advances, integrating both approaches could lead to more comprehensive and intelligent diagnostic solutions, improving reliability and reducing maintenance costs. Non-OBD systems [6,7] rely on external tools and technologies to assess vehicle health without direct access to the OBD system. These methods use advanced sensors, remote monitoring, and AI-driven analysis for fault detection. Figure 1 illustrates several prominent types of non-OBD systems.
Emergency sound detection is a critical application of Acoustic Source Identification (ASI) in smart cities, enabling rapid response to life-threatening situations. Using AI-powered acoustic sensors and machine learning (ML), smart systems can detect and classify sirens, gunshots, alarms, and distress calls [8]. ASI enhances urban infrastructure by supporting real-time noise monitoring, optimizing traffic flow, and improving public safety [9,10]. In vehicles, ASI enables early detection of mechanical issues like misfires or bearing failures through sound analysis [11], supporting predictive maintenance and fleet optimization. Emergency signal recognition further improves safety by allowing vehicles to detect sirens from ambulances, police, and fire services, facilitating faster response times and compliance with traffic laws [12]. In autonomous cars, integrating ASI with V2X communication and edge computing ensures safe operation in dynamic environments, advancing the future of smart mobility.
Despite its promise, the adoption of sound-based vehicle diagnostics and emergency signal recognition faces several critical challenges. These include background noise interference, acoustic signature variability, and real-time processing constraints. AI models must address false positives, high computational overhead, and seamless integration with existing automotive systems. Furthermore, concerns regarding data privacy, cybersecurity, and implementation costs hinder large-scale deployment. Overcoming these obstacles requires advanced AI training strategies, efficient sensor fusion techniques, and robust cybersecurity frameworks. Addressing these factors will enhance acoustic intelligence’s reliability, scalability, and practicality in modern transportation systems.
This study introduces three curated datasets—VAFD, UEASD, and IVESD—designed to capture diverse vehicle faults, emergency sounds, and environmental noises. Full details of dataset composition, labeling, and class distribution are provided in Section 4.1.
As artificial intelligence becomes increasingly integrated into high-stakes decision-making domains, such as healthcare, finance, and autonomous systems, the demand for interpretability and transparency has grown substantially. Understanding which features influence model predictions—and to what degree—is critical for building trust and ensuring accountability. However, many traditional ML models operate as opaque “black boxes,” offering limited insight into their internal reasoning processes. Addressing this challenge requires the integration of robust feature selection and explainability techniques.
This study leverages Boruta, a statistically grounded feature selection algorithm [13], in conjunction with SHAP (Shapley Additive exPlanations), a model-agnostic interpretability method based on cooperative game theory [14]. Boruta identifies relevant features by comparing them to randomized counterparts, ensuring statistical robustness [15]. SHAP complements this by providing global and local explanations of feature contributions, quantifying their impact on individual predictions and overall model behavior. Combined, these techniques form a comprehensive framework for developing AI models that are not only highly accurate but also inherently explainable and reliable. This study presents a comprehensive framework for interpretable, sound-based diagnostics in Intelligent Transportation Systems (ITSs), with the following key contributions:
  • Pioneers audio-based diagnostics in ITSs by introducing an interpretable machine learning framework that complements vision-based systems and enhances accessibility, such as providing auditory-to-visual or haptic alerts for drivers with hearing impairments.
  • Provides three novel, curated datasets of vehicle fault sounds, emergency sirens, and urban environmental noises—filling a critical gap in publicly available resources for sound-driven ITS research.
  • Advances model interpretability in acoustic ITSs by systematically comparing SHAP, Boruta, and ANOVA feature selection and employing SHAP to provide global and local explanations of model predictions.
  • Contributes to urban mobility and smart city integration by enabling real-time auditory-to-visual translation of critical events (e.g., sirens, vehicle faults), supporting accessibility for hearing-impaired users, and providing compatibility with intelligent transportation infrastructures such as roadside monitoring and connected vehicle systems.
The remainder of this paper is structured as follows: Section 2 provides background information on sound-based diagnostics and their relevance within intelligent transportation systems (ITSs). Section 3 reviews related work in acoustic event classification, fault detection, and inclusive ITS applications. Section 4 details the proposed methodology, including dataset construction, preprocessing, feature extraction, and experimental design. Section 5 presents the experimental results and performance evaluation across multiple models and feature selection strategies. Section 6 comprehensively discusses the findings, including a comparative analysis with state-of-the-art methods. Finally, Section 7 concludes the paper and outlines future research directions.

2. Background

The rise of intelligent transportation systems (ITSs) has driven a growing demand for real-time, data-driven diagnostic and decision-making capabilities. Among the various modalities explored, acoustic analysis presents a unique opportunity: it enables non-intrusive, cost-effective monitoring of vehicles and environments by leveraging sound signals. In parallel, recent research in smart cities has emphasized the role of structural health monitoring, where case studies on pedestrian landscape bridges demonstrate how monitoring frameworks can proactively regulate traffic flow, assess infrastructure performance, and support urban safety management [16]. Together, these perspectives highlight that whether monitoring vehicles or infrastructure, signal-driven intelligence is central to ensuring safety, resilience, and efficiency in smart city ecosystems. This section introduces the key components that underpin the proposed sound-based classification framework. It covers machine learning (ML) models suited for audio classification, explores the importance of feature selection in balancing accuracy and efficiency, and emphasizes the critical role of explainability techniques in safety-critical domains like ITSs.

2.1. Machine Learning for Audio Classification

Machine learning (ML) models are crucial in processing and classifying acoustic signals in intelligent transportation systems. This work focuses on three widely adopted algorithms: Extra Trees Classifier, Gradient Boosting models, and Multi-layer Perceptrons (MLPs), each offering unique strengths in handling high-dimensional, noisy, and non-linear audio data. The Extra Trees Classifier (Extremely Randomized Trees) is an ensemble learning method based on randomized decision trees. Unlike Random Forests, which optimize split thresholds during training, Extra Trees introduces additional randomness by choosing thresholds at random [17]. Each tree in the ensemble produces a prediction, and the final output is determined by majority voting across all trees. Formally, given an ensemble of M trees { h 1 x , h 2 x , . . . , h M ( x ) } , the predicted class y ^ is obtained as in Equation (1).
y ^ = arg max c C i = 1 M I ( h i x = c )
where i is the indicator function, and C is the set of class labels.
Gradient Boosting models build predictive models sequentially, including implementations like LightGBM [18] and XGBoost [19]. Each new model is trained to correct the errors made by the ensemble so far by minimizing a specified loss function. At iteration mmm, the algorithm computes pseudo-residuals using the negative gradient of the loss function concerning the model’s output, as in Equation (2). A weak learner h m ( x ) is then trained on these residuals, and the model is updated using a learning rate γ m described in Equation (3). This process allows the ensemble to reduce errors and handle complex feature interactions effectively, iteratively.
r i m = L y i , F x i F x i F = F m 1
F m x = F m 1 x + γ m h m ( x )
Multi-layer Perceptrons (MLPs) are deep learning models with multiple layers of fully connected neurons [20]. Each layer transforms its input via a linear operation followed by a non-linear activation. If a l 1 is the input to layer l , the transformation is defined in Equation (4).
z ( l ) = W ( l ) a ( l 1 ) + b ( l ) ,       a ( l ) = ( z l )
where W ( l ) and b ( l ) are the weights and biases of layer l , and is the activation function (e.g., R e L U ). The final output is computed through a forward pass across all layers. MLPs are trained using gradient descent and backpropagation, minimizing classification loss over the dataset. These models form the core of our audio classification framework. They are later evaluated for accuracy, robustness, and interpretability on multiple acoustic datasets.

2.2. Feature Extraction for Acoustic Signals

Audio signals must be converted into structured numerical representations before ML algorithms can process them. The most common techniques include:
  • Mel Spectrograms represent sound energy over time and frequency in a perceptually relevant scale, making them suitable for capturing vehicle and emergency sounds’ tonal and temporal characteristics [21].
  • Mel-Frequency Cepstral Coefficients (MFCCs) describe the spectral envelope of an audio signal. They are widely used for distinguishing between different sound sources.
  • Chroma Features extract pitch class information, particularly useful when the timbre and tonal structure are essential for classification.
These features form the input vector that models learn from, and the quality of these representations directly affects the classifier’s ability to generalize. The feature extraction process is described in detail in Section 4.3.

2.3. Feature Selection for Model Efficiency and Interpretability

High-dimensional audio data often contains irrelevant or redundant features that can degrade model performance. Feature selection is essential for reducing dimensionality, improving generalization, and accelerating inference. For example,
  • Boruta is an all-relevant feature selection method based on Random Forests or Extra Trees, which iteratively removes irrelevant features by comparing them with randomized shadow features [22]. While accurate, Boruta is computationally intensive and often selects a large feature subset.
  • ANOVA (Analysis of Variance) evaluates each feature’s ability to discriminate between classes using statistical F-tests. It is fast and interpretable, making it well-suited for real-time applications, although it may overlook non-linear dependencies [23,24].
  • SHAP (SHapley Additive exPlanations) assigns importance scores to features by quantifying their contribution to the model’s output. Based on cooperative game theory, SHAP provides global and local interpretability, allowing users to understand model behavior even in black-box classifiers like MLPs [25,26].
Combining feature selection with sound classification enables the construction of lightweight, interpretable models ideal for deployment in ITS applications.

2.4. Model Interpretability and the Need for Explainable AI

In domains like Intelligent Transportation Systems (ITSs), where diagnostic accuracy directly impacts safety, explainable AI (XAI) is essential, not optional. To foster trust, accountability, and compliance with regulatory standards, stakeholders such as engineers, researchers, and policymakers must understand the rationale behind system predictions. Explainability bridges the gap between high performance and model transparency, particularly in critical applications like vehicle fault detection and emergency sound classification. SHapley Additive exPlanations (SHAP) have gained widespread adoption among the various XAI techniques due to their strong theoretical foundation and practical applicability. Rooted in cooperative game theory, SHAP assigns each feature an importance value based on its marginal contribution to a given prediction. It provides local and global interpretability, ensuring consistency and fairness in the explanations. SHAP’s model-agnostic nature makes it especially valuable for complex ensemble or neural network models typically considered “black boxes.”
This study uses SHAP to enhance interpretability and trust in the audio classification pipeline. It identifies the most influential audio features, guiding model validation and refinement [27]. Moreover, SHAP visualizations offer intuitive insights for domain experts, making it easier to diagnose errors, optimize feature selection, and justify the model’s behavior in real-world applications. To better highlight the comparative advantages and trade-offs among these machine learning and feature selection techniques, the next section will explore related work that informs the design choices of this system.

3. Related Work

Engine sound is crucial in assessing a vehicle’s performance, indicating whether the engine is operating normally or experiencing issues. Automobile manufacturers increasingly use sound analysis to examine engine noises and detect potential faults. Several studies have explored various methodologies to enhance fault detection accuracy, including machine learning (ML), deep learning, and signal processing techniques.

3.1. Sound-Based Fault Detection in Vehicles

Machine learning (ML) advancements have greatly improved the effectiveness of acoustic signal analysis in intelligent vehicle fault detection systems. The acoustic profile of a vehicle has proven to be a valuable indicator for distinguishing between normal and faulty operational states [28]. Building on this principle, an Android-based diagnostic application was developed using Fourier transformations and spectral power density analysis to identify engine problems and suggest corrective actions [29]. Expanding this line of work, ML frameworks have incorporated Mel-Cepstrum, Fourier, and wavelet features to assess issues such as air filter contamination using data captured from smartphones and stationary microphones [5].
Sensor fusion has further strengthened diagnostic precision. An intelligent device integrating multiple sensors and a microcontroller applies an adaptive Kalman filter to process sound signals and classify vehicle operating conditions [30]. Similarly, Nasim et al. developed an ML-based system that extracts features across time, frequency, and time-frequency domains, enabling earlier fault detection [31]. Hamad et al. complemented these efforts by introducing a rule-based ML approach that remains robust under noisy environments [32].
Other researchers have explored feature engineering and hybridization. Akbalik et al. combined MFCCs, DWT-based features, and classification via an Extreme Learning Machine (ELM) to improve diagnostic accuracy [33], while Boztas et al. designed a hybrid feature extraction method combining handcrafted texture descriptors with statistical features [5]. Integrating Fourier, wavelet, and Mel-Cepstrum analysis has become a recurring strategy to enhance sensitivity and precision in fault detection [34,35]. To further refine the results, Wang et al. proposed a supervised learning model that leverages adaptive fault band extraction and a frequency band attention module for acoustic signal analysis [29]. In addition, deep ML-based extensions have been applied: Hameed et al. used ML for real-time engine knocking detection with improved classification accuracy [36], while Yuan et al. employed wavelet transforms and SVMs to reliably detect engine defects for new energy vehicles [37].
With the rise of deep learning (DL), fault diagnosis research has achieved greater accuracy, robustness, and noise resilience. Convolutional Neural Network (CNN)-based frameworks integrating scalograms and spectrograms have substantially enhanced diagnostic reliability [38]. Similarly, Yun and Jeong combined DFMT and MFCC features with a Long Short-Term Memory Autoencoder (LSTM-AE), producing effective classification even in complex acoustic environments [39]. Hybrid deep models, such as the VAE-CNN, have demonstrated improved robustness for rolling bearing fault detection under varying acoustic conditions [30].
The application of DL extends across domains. Khan et al. benchmarked DL methods against traditional ML for robotic manipulator fault detection, showing the advantages of data-driven architectures in dynamic industrial contexts [40]. Zhao et al. [41] further advanced the field by developing the Time-Frequency Self-Similarity Enhancement Network (TFSSEN), capable of resolving intricate nonstationary signals and handling overlapping or transient fault features in wind turbines, thus enabling high-resolution fault diagnostics. Complementary innovations include Kim et al.’s deep denoising autoencoder, which filters industrial noise for more precise anomaly detection [42], and Naryanto et al.’s ANN-CNN framework for diesel engine classification under noisy conditions [43].
Chu et al. extended DL approaches with a CNN-attention hybrid model emphasizing critical acoustic components for diesel engine diagnosis [44], while Lee et al. integrated LSTM autoencoders with graph convolution-based self-attention to detect bearing failures [45]. Spadini et al. also introduced a generalized DL framework for rotating machinery that accurately identifies multiple defect types [46].
Beyond conventional ML and DL models, several innovative frameworks have been developed to address real-world challenges in industrial fault diagnosis. Qiao et al. [47] proposed the Multi-Scale and Soft-Threshold Denoising (MSTD) framework, which effectively suppresses noise while capturing fault features across multiple scales, ensuring robust performance under variable operating conditions. Hao et al. [48] introduced the Gradual Adversarial Domain Adaptation (GAGA) framework, which generates intermediate domains to bridge source and target distributions, reducing negative transfer and improving fault diagnosis adaptability in dynamic environments.

3.2. Sound-Based Emergency Detection and Situational Awareness

Sound-based analysis has emerged as a critical component of intelligent systems, enabling enhanced situational awareness and emergency detection in domains such as automotive environments, smart homes, railways, and industrial machinery. Researchers have advanced diagnostic accuracy, noise resilience, and real-time responsiveness by leveraging the acoustic profile of environments and systems.
Efforts to improve vehicular safety and support hearing-impaired drivers have led to the development of sound-based emergency recognition systems. An early automated assistance framework employed speech recognition to detect emergency cues and provide visual alerts for drivers with hearing impairments [49]. Building on this, SirenNet, a CNN-based architecture integrating WaveNet and MLNet streams, was designed to accurately distinguish sirens from ambient traffic noise, thereby improving driver responsiveness in urban traffic scenarios [50]. Expanding beyond detection alone, Banchero et al. [51] introduced an AI-powered system that couples siren recognition with precise localization, enhancing situational awareness for both human drivers and autonomous vehicles.
Complementary to these advances, datasets play a pivotal role in training robust models. Asif et al. [52] developed a large-scale dataset of emergency sirens and road noises, addressing prior limitations of scale and variability. This dataset provides a foundation for designing noise-resilient recognition systems to improve emergency vehicle awareness and road traffic safety.
Sound recognition has also been applied in smart home environments to improve safety and accessibility. Deep learning-based methods for voice command recognition and emergency sound detection have been optimized for low-power platforms, enabling real-time responses [53,54]. A CNN model leveraging log-scaled mel-spectrogram features was introduced for speech emotion recognition (SER), classifying indoor sounds as normal or emergency-related [55]. To improve sound localization and classification, a perception sensor network (PSN) combining Kinect cameras with microphone arrays was proposed [56]. Additionally, Google’s pre-trained YAMNet model has been repurposed to detect critical auditory cues and provide real-time visual alerts, particularly benefiting users with hearing impairments [57].
Beyond the automotive and home domains, railway and industrial systems have benefited significantly from sound-based fault detection. Li et al. developed a diagnostic system for railway turnout switch machines using eigenmode decomposition and ReliefF-based feature selection with SVM classification [35]. Kreuzera et al. applied MFCCs with multilayer perceptrons (MLPs) to detect railway bearing defects via aerial acoustic data [58]. In industrial contexts, Shajie et al. employed modified ResNet and CNN architectures on NASA’s bearing datasets for engine ball-bearing fault detection [59], while Senanayaka et al. utilized 1D-CNN-based source isolation for precise machinery diagnostics [60]. Gantert et al. advanced this further with a binary model fusion strategy, enabling multiclass anomaly detection from industrial sound datasets [61].
Early contributions by Dobre et al. [62] emphasized low-computational acoustic event detection, particularly for emergency sirens. Their foundational method introduced the “Siren Vector”, which combined fundamental frequency (F0) estimation with the zero-crossing rate (ZCR) to achieve real-time detection on resource-constrained devices. This pragmatic alternative to computationally intensive models such as Hidden Markov Models demonstrated the feasibility of deploying acoustic detection on embedded platforms.
Building on this, Dobre and Dumitrascu [63] refined their approach into a driver-assistance system optimized for the “Yelp” siren pattern. Key advancements included integration with visual alert mechanisms, thereby addressing the human–machine interface by providing clear warnings to drivers. While effective, the system’s performance remains influenced by environmental noise and signal-to-noise ratios, and its lack of localization capabilities limits awareness of the emergency vehicle’s direction. This progression illustrates the trade-offs between algorithmic efficiency, robustness, and functionality in real-world safety applications.
Collectively, these studies demonstrate how sound-based systems—spanning vehicles, homes, railways, and industrial machinery—have evolved from lightweight detection algorithms to advanced AI-powered recognition and localization solutions. By leveraging machine learning, deep learning, and signal processing, these systems now provide higher diagnostic accuracy, resilience to noise, and improved human–machine interaction. The current study builds on this trajectory and extends the earlier work of Amr Rashed et al. [12], which introduced sound-based diagnostics into intelligent transportation systems (ITSs). Their contributions included a novel vehicle fault and siren dataset, a comprehensive preprocessing pipeline, advanced feature extraction techniques (Mel spectrograms, MFCCs, Chromatograms), and the development of the Bayesian-Optimized Weighted Soft Voting with Feature Selection (BOWSVFS) model, which achieved 91.04% accuracy on the DB1 car fault dataset. This foundation underpins ongoing advancements toward safer, more accessible, and more reliable sound-driven diagnostic and emergency response systems.
What sets the new version apart from the earlier version is its significant expansion in scope, technical sophistication, and practical applicability as follows:
  • Expanded and Structurally Enhanced Datasets: While the earlier study focused on a single car fault dataset, the current work introduces two more curated datasets: one dedicated to emergency and environmental sounds and another combining vehicle and emergency audio classes. This comprehensive dataset design enables broader generalization and reflects more realistic ITS audio scenarios, paving the way for improved multi-context classification performance.
  • Integration of Interpretable Feature Selection Techniques: A significant enhancement in this version is using multiple feature selection approaches—ANOVA, Boruta, and SHAP—to evaluate feature relevance and model interpretability. SHAP, in particular, is used to provide transparent, global, and local explanations for the influence of each feature on the model’s decisions. This step ensures the system is high-performing and explainable, aligning with the growing demand for interpretable AI in safety-critical domains like ITSs.
  • Deployment of Advanced Ensemble Classifiers: The previous version evaluated standard machine learning models such as neural networks, logistic regression, and random forests. In contrast, the current study adopts advanced ensemble classifiers—XGBoost, LightGBM, and Extra Trees—achieving classification accuracies exceeding 91% and AUC values above 0.99 across all datasets. These models offer improved generalization, robustness, and scalability compared to traditional classifiers.
  • Focused Emphasis on Real-Time Applicability and Inclusivity: The updated framework is explicitly designed for real-time ITS deployment, with practical features including auditory-to-visual conversion mechanisms and real-time alerts. This enhances the system’s relevance for users with hearing impairments and those operating in noise-insulated environments, thereby contributing to more inclusive urban transportation systems.
  • Stronger Alignment with Smart City Objectives: The current study is more deeply integrated into the broader vision of smart city development. It emphasizes scalability, interpretability, and inclusivity. It offers a data-driven, non-intrusive solution that supports predictive maintenance, emergency detection, and safe mobility—key pillars of intelligent urban infrastructure.
In summary, while the earlier work established a valuable proof-of-concept, the present study transforms that foundation into a comprehensive, interpretable, and deployable acoustic diagnostic system. It extends the technical framework, enhances model transparency, broadens dataset representation, and strengthens the connection to real-world ITS and smart city applications, marking a significant evolution in our research trajectory.

3.3. Identified Research Gaps

The reviewed studies, as summarized in Table 1, reveal several critical gaps that currently limit the advancement and real-world applicability of sound-based diagnostic and emergency recognition systems:
  • Inconsistent Feature Extraction and Selection Practices: There is substantial variability in the audio features extracted across studies, ranging from MFCCs [33,58] and spectrograms to wavelet and cepstral features [5,33,34]. However, the importance of these features is rarely evaluated systematically, leading to poor reproducibility and hindering meaningful comparisons between models. Moreover, the relationship between the number of selected features and model performance is often overlooked [35], leaving the identification of optimal feature subsets unresolved.
  • Lack of Robustness in Feature Representations: Many existing approaches rely heavily on classical audio features—particularly MFCCs and Mel spectrograms—without adequately accounting for their sensitivity to noise or variation in operating conditions. This compromises the robustness of models, especially in real-world environments characterized by high acoustic variability. Limited Real-World Generalization [42,43,48]: A significant number of studies [5,28,32,35,56] utilize custom-built datasets that lack environmental diversity, limiting the models’ ability to generalize beyond controlled settings. Additionally, several models are trained on small-scale or narrowly scoped datasets [28,35,40,57], which reduces their effectiveness in detecting rare or previously unseen fault conditions.
  • Underutilization of Temporal Modeling: Despite the sequential nature of acoustic signals, temporal dynamics are often underexploited. Few studies adopt architectures such as LSTM, GRU, or attention-based models, which can capture the evolving structure of acoustic events over time. Notable exceptions include [38,44,45], which suggest that incorporating temporal dependencies can improve recognition, accuracy, and reliability.
  • Insufficient Focus on Inclusivity and Accessibility: Most sound-based ITS solutions do not address the needs of users with disabilities. For example, visual alert systems [63] for hearing-impaired individuals are rarely integrated into proposed frameworks [64], which address this need explicitly.
  • Scalability and Deployment Constraints: Another recurring limitation is the lack of optimization for real-time, low-power deployment. Many models are not designed with embedded or IoT platforms in mind, which impedes their integration into smart vehicles, smart homes, and broader smart city infrastructures.
Table 1. Comparison of Reviewed Sound-Based Diagnostic and Emergency Recognition Studies.
Ref.ApplicationTechniqueDataset UsedSizeAccuracyKey ContributionLimitations
[28]Vehicle type classificationZero Crossing Signature (ZCS)Custom417F1 = 0.86Introduced the time-domain method for classifying engine types (diesel/gasoline)Limited dataset generalizability
[29]Acoustic fault diagnosisTransformer + AFECWRU100F1 = 0.95Proposed adaptive feature enhancement in transformer architectureComputationally expensive
[5]Industrial automationDCSLBP + MLMIMII (noisy)510195%Developed a lightweight model for machine malfunction detectionFocused on structured lab settings
[30]Bearing fault diagnosisVAE + CNNCWRU204896.62%Combined generative and discriminative models for noise robustnessRequires large datasets for VAE training
[31]Vehicle fault detectionHybrid MLReal-car dataset35192%Built an early fault detection system using multiple sound-domain featuresIt may not scale easily across different car models
[32]Automotive diagnosticsRule-based MLReal vehicle audio55598.6%Cognitive-inspired system using expert rule integrationRule-based models lack flexibility for unseen faults
[33]Engine fault detectionMFCC + MLLocal dataset28092.17%Applied classical ML to structured audio features for engine classificationThe dataset is not publicly available.
[34]Bearing fault diagnosisAcoustics + VibrationCWRU + synthetic50098.75%Merged vibration and acoustic features for improved detectionThe fusion system increases complexity
[35]Railway turnout faultsSound + SVMCustom160098%Diagnosed turnout switch issues using time–frequency signal featuresNeeds real-time implementation testing
[36]Engine knock detectionML + LSTMEngine recordings15390%Compared traditional and deep models for knock detectionLimited generalization across engine types
[37]NEV fault classificationWavelet + SVMSimulated NEV dataN/A90%Separated battery/mechanical noise for new energy vehiclesNeeds real-world NEV recordings
[38]Multi-view vehicle diagnosticsCNN + Spectrogram + ScalogramReal engine recordings31195%Integrated multiple views of audio for higher feature coverageRequires computationally intense preprocessing
[39]EPS motor anomaly detectionMFCC + LSTM-AEMotor testbed29,75999.2%Preserved waveform structure during dimensionality reductionMay overfit small datasets
[40]Robotic manipulator faultsCNN + MLCustom18192.34%Evaluated ML and DL for robotic sound diagnosticsLacks transfer learning for similar machines
[42]Industrial anomaly detectionDeep Denoising AutoencoderMIMII510196.31%Improved generalization in noisy environments using denoisingStruggles with rare event classes
[43]Diesel engine classificationANN, CNNDEFault3500 99.37%Benchmarked performance across noise levelsThe dataset may not reflect real-world complexity
[44]Diesel engine diagnosticsCNN + AttentionReal engine dataN/A98.17%Built a full-cylinder diagnostic model from single-cylinder dataScalability to multi-class real-time settings has not been tested
[45]Bearing fault detectionLSTM-AE + GCNCWRUN/A97.3%Integrated temporal and spatial graph structuresModel complexity increases training cost
[46]Low-bit-depth signalsMLPMaFaulDa195199.34%Achieved fault type/severity classification in low-quality signalsLimited to low-res sensor environments
[49]Emergency signal detectionDSP + Visual AlertsSiren datasetN/A99%Developed a visual emergency alert system for the hearing-impairedExperimental, no large-scale deployment
[50]Emergency siren detectionCNNReal-world~300098.24%Built a CNN model for distinguishing sirens and hornsThe model’s robustness in high-noise traffic has not been proven
[53]Smart home emergenciesVoice/audio-basedA3Novelty, ITAAL~450095%Integrated voice command and emergency detection in an embedded systemLimited hardware support
[54]SPH safety monitoringDeep learning + sound recognitionIndoor acoustics~200090.86%Monitored behavioral patterns in single-person homesThe dataset may not cover all critical events
[55]Indoor emergency detectionCNN + SERCollected from the web692F1 = 77.32Used sound events to identify threats in indoor environmentsLacks real noise scenarios
[56]Emergency in multi-person spaces perception sensor networkLab recordingsN/A85%Used audio-visual fusion for localized scream detectionConstrained to controlled testbeds
[57]Emergency alert interfaceYAM NetCustom siren dataset~800 93.68%Built a driver-aid alert system for emergency signalsEvent diversity limited
[58]Railway bearing diagnosticsMFCC + MLPReal-world airborne data25,00097.04Demonstrated reliability of airborne audio under real rail conditionsDeployment requires consistent field conditions
[59]Engine ball bearing faultCNN + ResNetNASA bearing946391%Detected bearing flaws using spectral analysisLimited generalization due to specific component training
[60]Industrial sound fault isolationSound separation + 1D-CNNMixture dataset60 stem files99.58%Proposed a fault-isolation pipeline for overlapping audio eventsHigh processing overhead for source separation
[61]Industrial machinery diagnosisIntegrated binary + multi-class modelMIMII, ToyADMOS5101
N/A
93%
98%
Achieved general-purpose classification across fault typesRequires fine-tuning per machinery setup
[12]Smart city diagnosticsBOWSVFS + Ensemble ML (LR, MLP, AdaBoost)DB1, DB2, DB3 (custom)1164DB1: 91.04%, DB2: 88.85%, DB3: 86.85%Proposed an inclusive ML framework for sound-based fault and emergency detection; introduced three curated datasets; addressed accessibility with visual feedback.Limited real-world validation; segmentation may miss finer temporal details
[65]Engine fault detectionMultimodal (acoustic + vibration) + Deep LearningInternal dataset264383%Proposed fine-grained engine fault detection using multimodal signalsThe dataset is limited to specific engine types
[66]Vehicle sound profilingNeural Networks (CNN, RNN)Real-world recordings625586.8%Built an AI-based mechanic system for acoustic vehicle characterizationLimited performance in high background noise conditions
[67]Environmental sound classificationCNN + Data AugmentationESC-50 dataset873289.5%Demonstrated data augmentation benefits for environmental sound classificationLimited to environmental rather than mechanical faults
In light of these gaps, there is a clear need for a unified, interpretable, and scalable framework incorporating robust feature extraction, effective feature selection, temporal modeling, and accessibility support, while remaining suitable for deployment in real-world intelligent transportation and urban systems.

4. Methodology

This section outlines a comprehensive and structured methodological framework for detecting vehicle faults and emergency sound events using machine learning techniques. The proposed approach is organized into two main phases, each designed to systematically evaluate classification performance and optimize model accuracy and interpretability. The process begins with designing and curating three diverse, labeled audio datasets encompassing vehicle fault sounds, emergency sirens, and urban environmental noises. These datasets are sourced from real-world acoustic environments to ensure relevance and generalizability. A multi-step preprocessing pipeline is employed to prepare the data for model training, comprising normalization, resampling, duration alignment, and segmentation into fixed-length audio clips. This ensures data consistency and quality across all samples. Next, feature extraction is performed using three widely adopted acoustic representations: Mel Spectrograms, Mel-Frequency Cepstral Coefficients (MFCCs), and Chroma features, effectively transforming raw audio signals into numerical vectors suitable for machine learning.
In Phase 1, two baseline experiments are conducted to evaluate the raw classification performance of various models and explore the impact of initial feature selection. Models are assessed using 10-fold cross-validation to ensure robustness. The results highlight the presence of significant feature redundancy and confirm the strong performance of multi-layer perceptron (MLP) and tree-based ensemble classifiers. Based on these findings, Phase 2 introduces three experiments that apply advanced feature selection techniques—namely, Boruta, SHAP (SHapley Additive Explanations), and ANOVA—to refine the input feature sets. This phase aims to enhance model performance and interpretability by identifying the most relevant and informative features.
Throughout the methodology, classifiers are trained and evaluated using a comprehensive set of metrics, including accuracy, precision, recall, F1-score, and AUC. In addition, pseudocode is provided to promote reproducibility and transparency. This structured and iterative framework facilitates the development of a scalable, accurate, and interpretable audio classification system explicitly tailored for deployment in intelligent transportation systems (ITS) applications.

4.1. Dataset Description

A well-designed dataset is the foundation of any supervised machine learning task. This study compiled three purpose-built datasets to reflect real-world acoustic conditions. These datasets were carefully curated to capture a variety of vehicle fault sounds, emergency sirens, and environmental noise, ensuring diversity and domain relevance. This section details the content and structure of each dataset. It outlines their significance in evaluating the system’s robustness across different sound categories.
In this study, we extended and refined the structure of two previously developed datasets—the Vehicular Acoustic Fault Dataset (VAFD) and Urban Emergency and Ambient Sound Dataset (UEASD)—originally introduced in our prior work [12], to enhance their coverage, balance, and suitability for machine learning-based sound classification tasks, as shown in Table 2.
Vehicular Acoustic Fault Dataset (VAFD): VAFD contains 29 classes of vehicle-related sounds covering engine and powertrain anomalies, suspension and steering issues, exhaust and fuel system faults, braking irregularities, belt and accessory wear, and miscellaneous mechanical problems. To improve realism, this work introduced two additional categories: General Vehicle Sounds, representing normal, healthy operation, and Timing Chain Noise, a distinct but critical mechanical fault often overlooked in existing datasets.
Urban Emergency and Ambient Sound Dataset (UEASD): UEASD represents urban and environmental acoustic scenarios relevant to intelligent transportation systems. It includes emergency vehicle sirens, animal sounds, general transportation noise, construction and industrial sounds, and weapon- or explosion-related noises. To expand coverage, this work introduced Weather Sounds (rain, thunder), Fire Alarms, Forest Fire Sounds, and Snake Sounds.
Integrated Vehicle and Environmental Sound Dataset (IVESD): IVESD is a structured integration of VAFD and UEASD, combining selected classes into ten broad categories. Unlike a simple merge, IVESD was constructed to balance both vehicular and environmental/emergency classes, replicating real-world ITS scenarios in which vehicles simultaneously encounter internal mechanical faults and external urban noise events.
Dataset Transparency and Validation: New signals were obtained from three primary sources:
  • Field recordings from operational vehicles under real driving conditions.
  • Controlled recordings of specific mechanical faults were collected in collaboration with automotive workshops.
  • Publicly available audio repositories for environmental and emergency sounds (e.g., sirens, animal calls, weather events).
To ensure label accuracy, all audio samples were independently reviewed by three experts (two automotive engineers and one acoustics specialist). A majority voting scheme was used for validation, and any ambiguous samples were discarded to preserve data integrity.
New signals were obtained from three main sources: field recordings captured from operational vehicles in real driving conditions, controlled recordings of specific mechanical faults in collaboration with automotive workshops, and publicly available audio repositories containing environmental and emergency sounds. Three domain experts independently reviewed all audio samples to ensure label accuracy—two automotive engineers and one acoustics specialist. Labels were assigned using a majority voting scheme, and any ambiguous or disputed samples were removed to maintain dataset integrity. Following this procedure, Table 3 presents the final, validated distribution of samples across the three datasets (VAFD, UEASD, and IVESD), providing a transparent overview of the data used in this study.

4.2. Audio Preprocessing

Raw audio data often contains inconsistencies in sampling rates, amplitude levels, and errors in sampling rates, amplitude levels, and durations, which can hinder effective feature extraction and classification. Preprocessing ensures that all audio samples conform to a standardized format. The pipeline adopted in this study followed the sequence below:
  • Normalization and Standardization
All recordings were amplitude-normalized to ensure uniform levels across the dataset, eliminating volume-related inconsistencies. Each audio file was resampled to 16,000 Hz [64], a widely used sampling rate for MFCCs, spectrograms, and wavelet-based analysis for audio feature extraction methods.
2.
Duration Alignment
To achieve uniformity, each file was adjusted to 10 s. Files shorter than 10 s were extended by repeating the signal and then trimmed, while longer recordings were truncated. This standardization reduces variability and ensures models learn from time-aligned input.
3.
Segmentation into Fixed-Length Clips
Each 10 s audio file was divided into non-overlapping 2.5 s clips [68]. This duration was chosen to ensure that each segment retained sufficient temporal and spectral content for meaningful feature extraction. Any leftover segments shorter than 2.5 s were discarded.
4.
Sliding Window Consideration
A non-overlapping approach was adopted to avoid data redundancy [69]. Although this ensures distinct, clean samples, future work could explore overlapping windows to capture subtle transitions or transient audio events for greater sensitivity.
This preprocessing strategy guarantees that all audio inputs are consistent, uniformly segmented, and suitable for extracting MFCCs, Mel spectrograms, and Chroma features. As a result, the dataset is optimized for capturing both temporal and spectral characteristics essential for robust classification of vehicle fault and emergency sounds.

4.3. Feature Extraction

Once preprocessing was complete, each 2.5 s audio clip was transformed into numerical features suitable for machine learning models. The process began by loading the normalized and segmented audio and verifying its format (16 kHz, mono, 2.5 s duration). We then computed three complementary feature families that capture spectral, cepstral, and tonal information: Mel spectrogram statistics, MFCCs (Mel-Frequency Cepstral Coefficients) [70,71], and Chroma features [72].
  • Mel Spectrograms—The mean and standard deviation of energy across Mel frequency bands were computed for each clip, yielding 2 descriptors that summarize spectral energy distribution.
  • MFCCs—Thirteen MFCCs were extracted per clip, and both mean and standard deviation were calculated for each, resulting in 26 descriptors. These coefficients are widely used for capturing the spectral envelope of sound and remain highly effective in distinguishing acoustic categories [70,71].
  • Chroma Features—Audio energy was mapped to the 12 pitch classes of the musical octave, capturing harmonic and pitch-related content. Each class’s mean and standard deviation were computed, producing 24 descriptors [72].
All descriptors were then flattened and concatenated into a single 52-dimensional feature vector for each 2.5 s clip (2 Mel + 26 MFCC + 24 Chroma). These vectors were compiled into a structured DataFrame (rows = audio clips, columns = features) that served as the direct input to subsequent machine learning models.
Figure 2 visualizes the composition of this handcrafted feature set, illustrating the balance across the three feature families. By combining spectral (Mel), cepstral (MFCC), and tonal (Chroma) descriptors, the representation preserves complementary acoustic characteristics, enhancing the model’s ability to discriminate between diverse vehicle fault and emergency sound classes.
Feature Extraction (Algorithm 1: Compact 52-Dimensional Representation): Each standardized audio segment is transformed into a structured feature vector after preprocessing. The 52-dimensional vector captures various acoustic characteristics, balancing computational efficiency with rich signal representation.
Algorithm 1: Compact Feature Representation (52 features)
Compute each feature’s mean and standard deviation to create a concise representation suitable for machine learning.
-
Mel Spectrogram: Mean & Standard Deviation
-
MFCC: Mean & Standard Deviation
-
Chromagram: Mean & Standard Deviation
Compact Representation:
  • Mel Spectrogram: Mean & Std
  • MFCCs (13 coefficients): Mean & Std for each
  • Chromagram (12 pitch classes): Mean & Std for each
Full List of 52 Features:
  • Mel Spectrogram (2 Features):
    • mel_spectrogram_mean: Mean of the Mel Spectrogram in the Dataset.
    • mel_spectrogram_std: Standard deviation of the Mel Spectrogram in Datastet.
  • MFCCs (26 Features):
    • 13 Mean Features (1 per coefficient):
      mfcc_mean_0, mfcc_mean_1, …, mfcc_mean_12
    • 13 Standard Deviation Features (1 per coefficient):
      mfcc_std_0, mfcc_std_1, …, mfcc_std_12
  • Chromagram (24 Features):
    • 12 Mean Features (1 per pitch class):
      chromagram_mean_0, chromagram_mean_1, …, chromagram_mean_11
    • 12 Standard Deviation Features (1 per pitch class):
      chromagram_std_0, chromagram_std_1, …, chromagram_std_11
Breakdown of the Features:
  • Mel Spectrogram:
    Time-frequency representation of energy in different frequency bands (2 features).
  • MFCCs:
    Capture spectral features related to the timbre of audio (26 features).
  • Chromagram:
    Represent intensity in each of the 12 pitch classes (24 features).
When combined, these features total 52 distinct attributes extracted per audio file.

4.4. Experimental Design

This study employed a two-phase experimental design to systematically evaluate and optimize machine learning models for sound-based classification in intelligent transportation systems (ITSs). Phase 1 focused on baseline performance assessment and feature redundancy analysis, while Phase 2 investigated the effectiveness of advanced feature selection techniques, with a particular emphasis on improving both model accuracy and interpretability. The experimental workflow is organized into two phases: baseline evaluation and advanced feature selection. Table 4 summarizes the six experiments’ objectives, methods, and key findings.

5. Results and Discussion

This section comprehensively evaluates the proposed sound classification framework and feature selection strategies across multiple datasets. All analyses were conducted in Python (v3.12) using Jupyter Notebook v7 and Spyder 5.5.6 IDE, on a workstation equipped with an Intel Core i7 processor and 16 GB RAM. The audio processing pipeline relied on widely used libraries, including Librosa (v0.10.1) and Pydub (v0.25.1), together with standard machine learning and data science toolkits. To ensure transparency and reproducibility, we have publicly made all datasets, source code, and documentation available in our GitHub repository. This open-access resource enables independent replication, facilitates further research, and supports community-driven benchmarking in intelligent transportation systems.
The experiments were designed to assess model performance, interpret feature relevance, and compare the effectiveness of different feature selection methods. Three real-world audio datasets were used, each encompassing various sound categories relevant to vehicle fault detection and emergency recognition. Performance was measured using standard classification metrics, including accuracy, precision, recall, and F1-score. We explored three distinct scenarios: (a) the application of Boruta-based feature selection with 15 traditional machine learning models, (b) SHAP-based feature ranking combined with MLP classifiers to enhance model interpretability, and (c) ANOVA-based feature evaluation integrated with MLPs for performance benchmarking. These experiments highlight the predictive capabilities of different models and provide insights into the interpretability and robustness of the selected features under varying evaluation schemes.
Three purpose-built datasets were utilized to evaluate the proposed audio classification system under realistic conditions, each targeting a distinct acoustic domain relevant to intelligent transportation systems (ITSs): mechanical faults, emergency scenarios, and a combined setting.
  • Dataset 1: Vehicular Acoustic Fault Dataset (VAFD) focuses on sounds associated with vehicular anomalies (e.g., engine, powertrain, suspension, steering).
  • Dataset 2: Urban Emergency and Ambient Sound Dataset (UEASD) includes emergency sirens, environmental sounds, animal calls, and construction-related noise.
  • Dataset 3: Integrated Vehicle and Environmental Sound Dataset (IVESD) merges VAFD and UEASD to increase classification complexity and assess system robustness in multi-domain contexts.
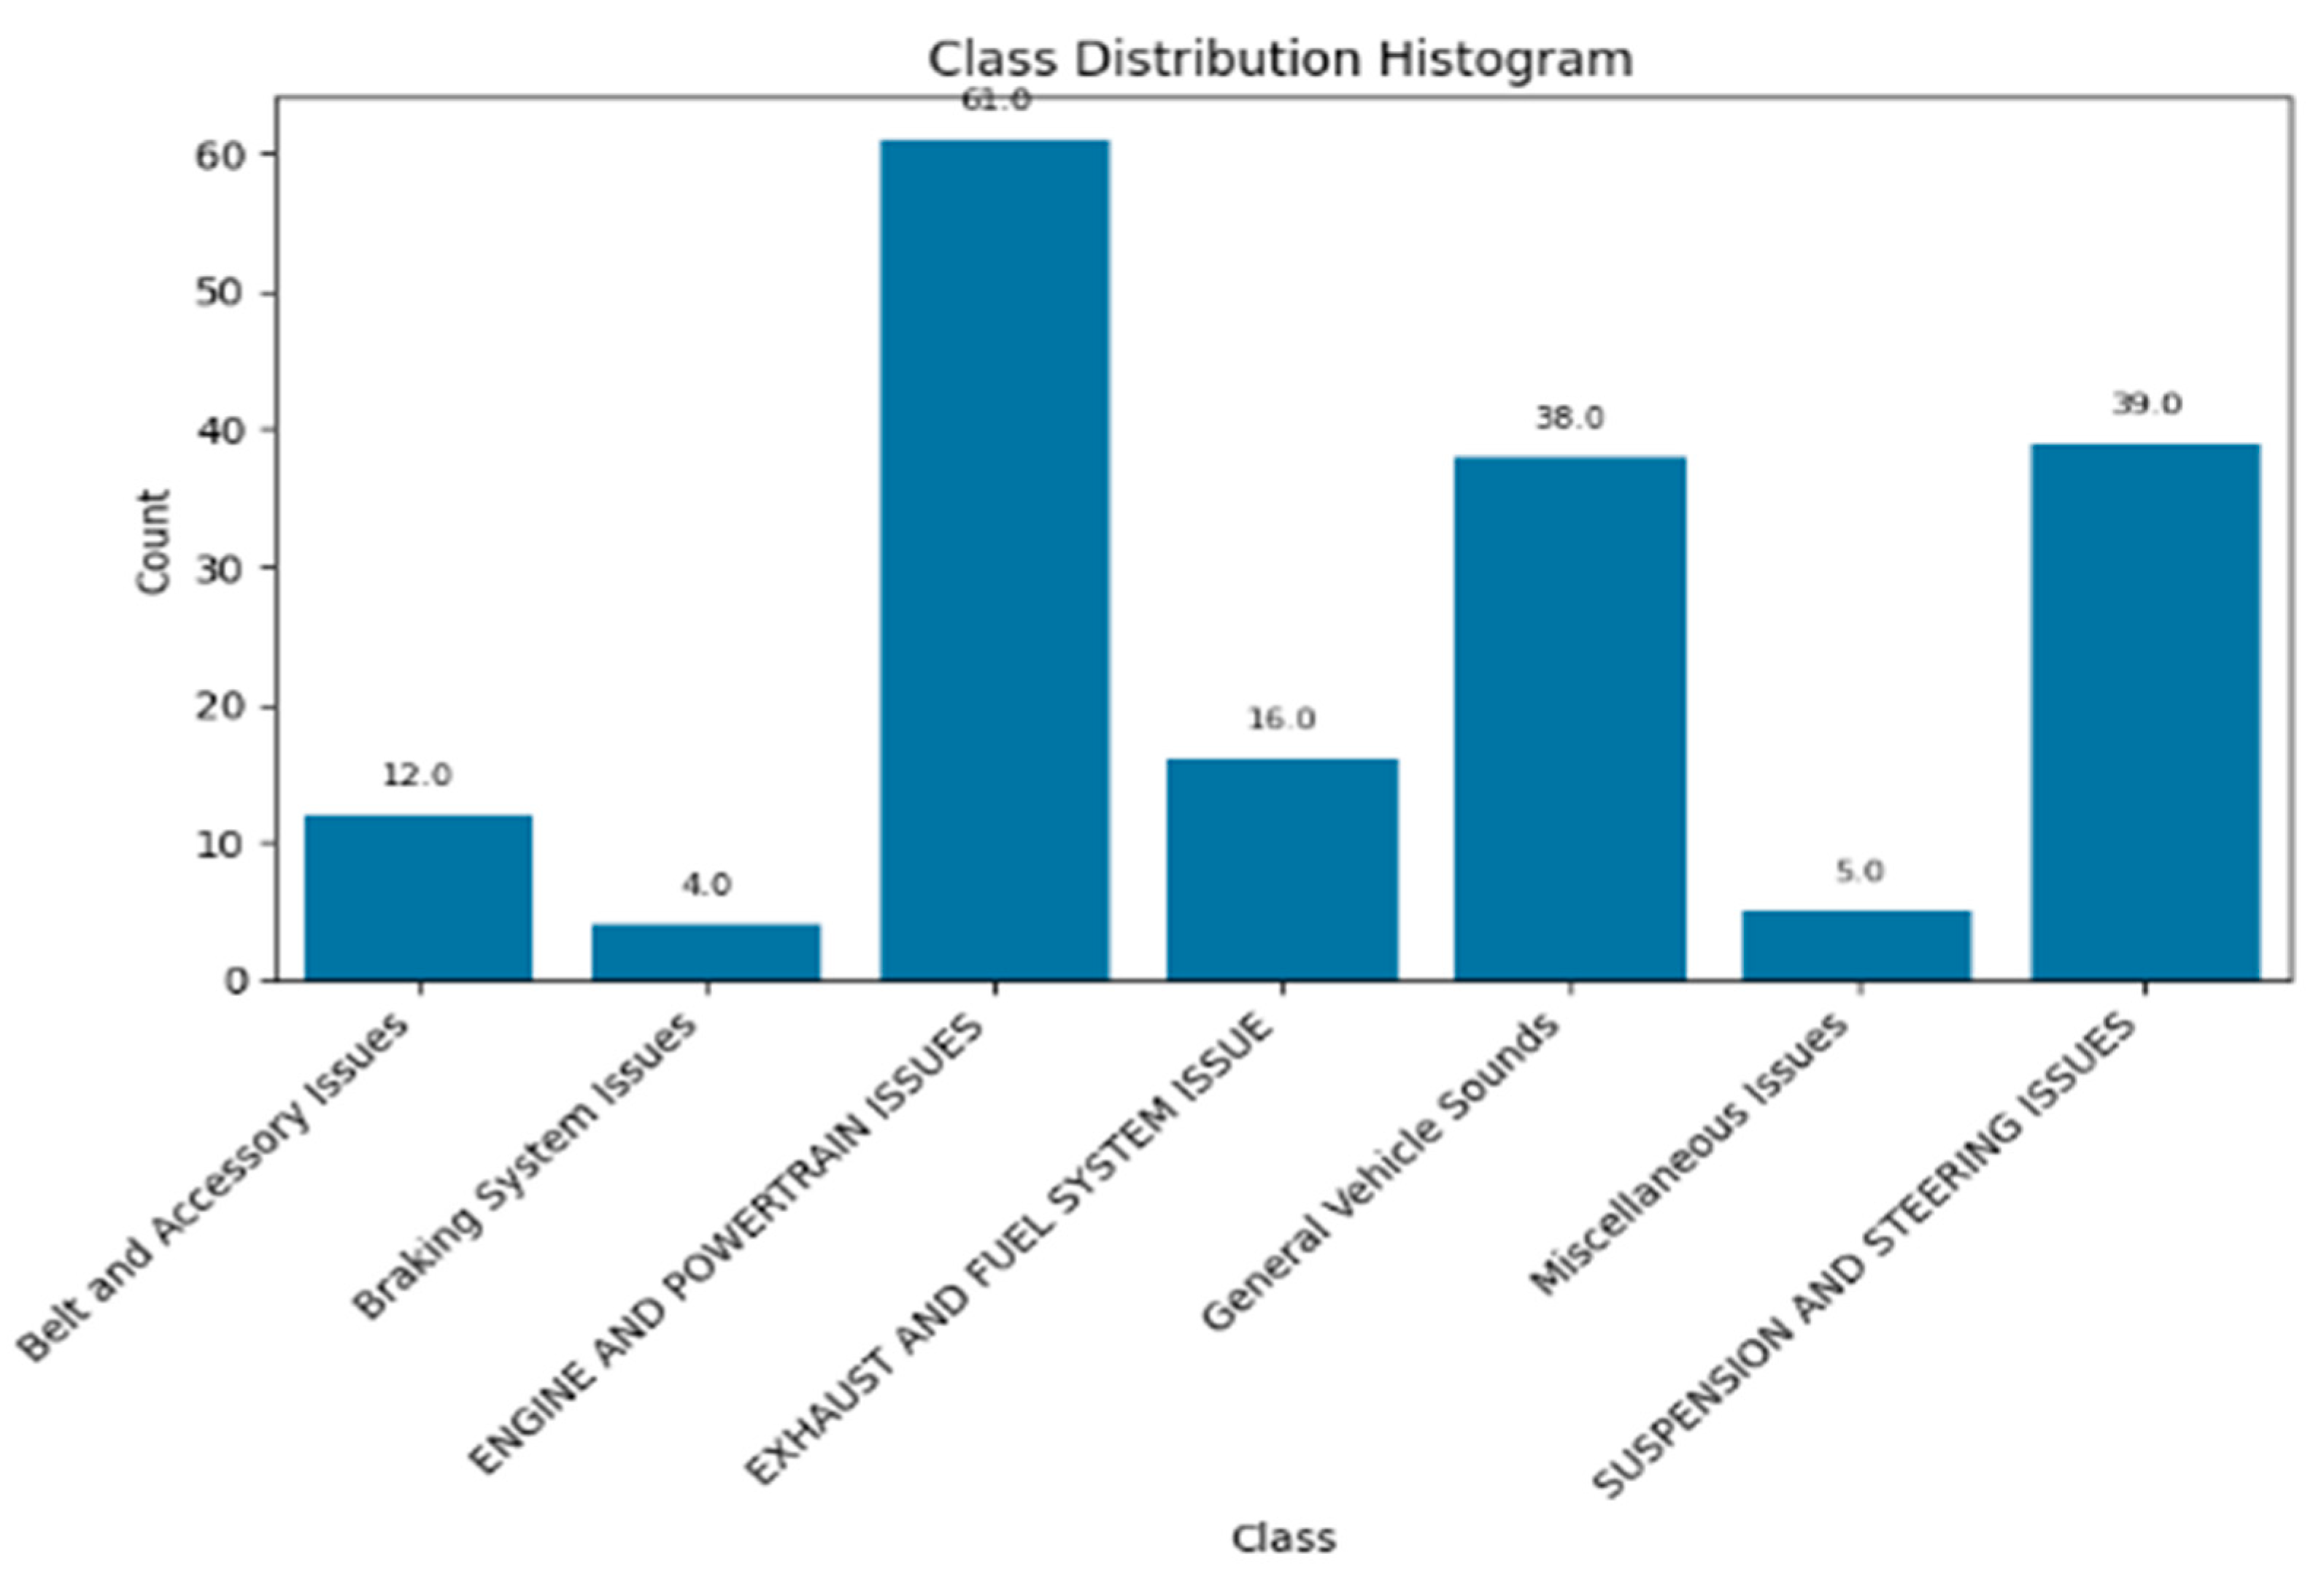
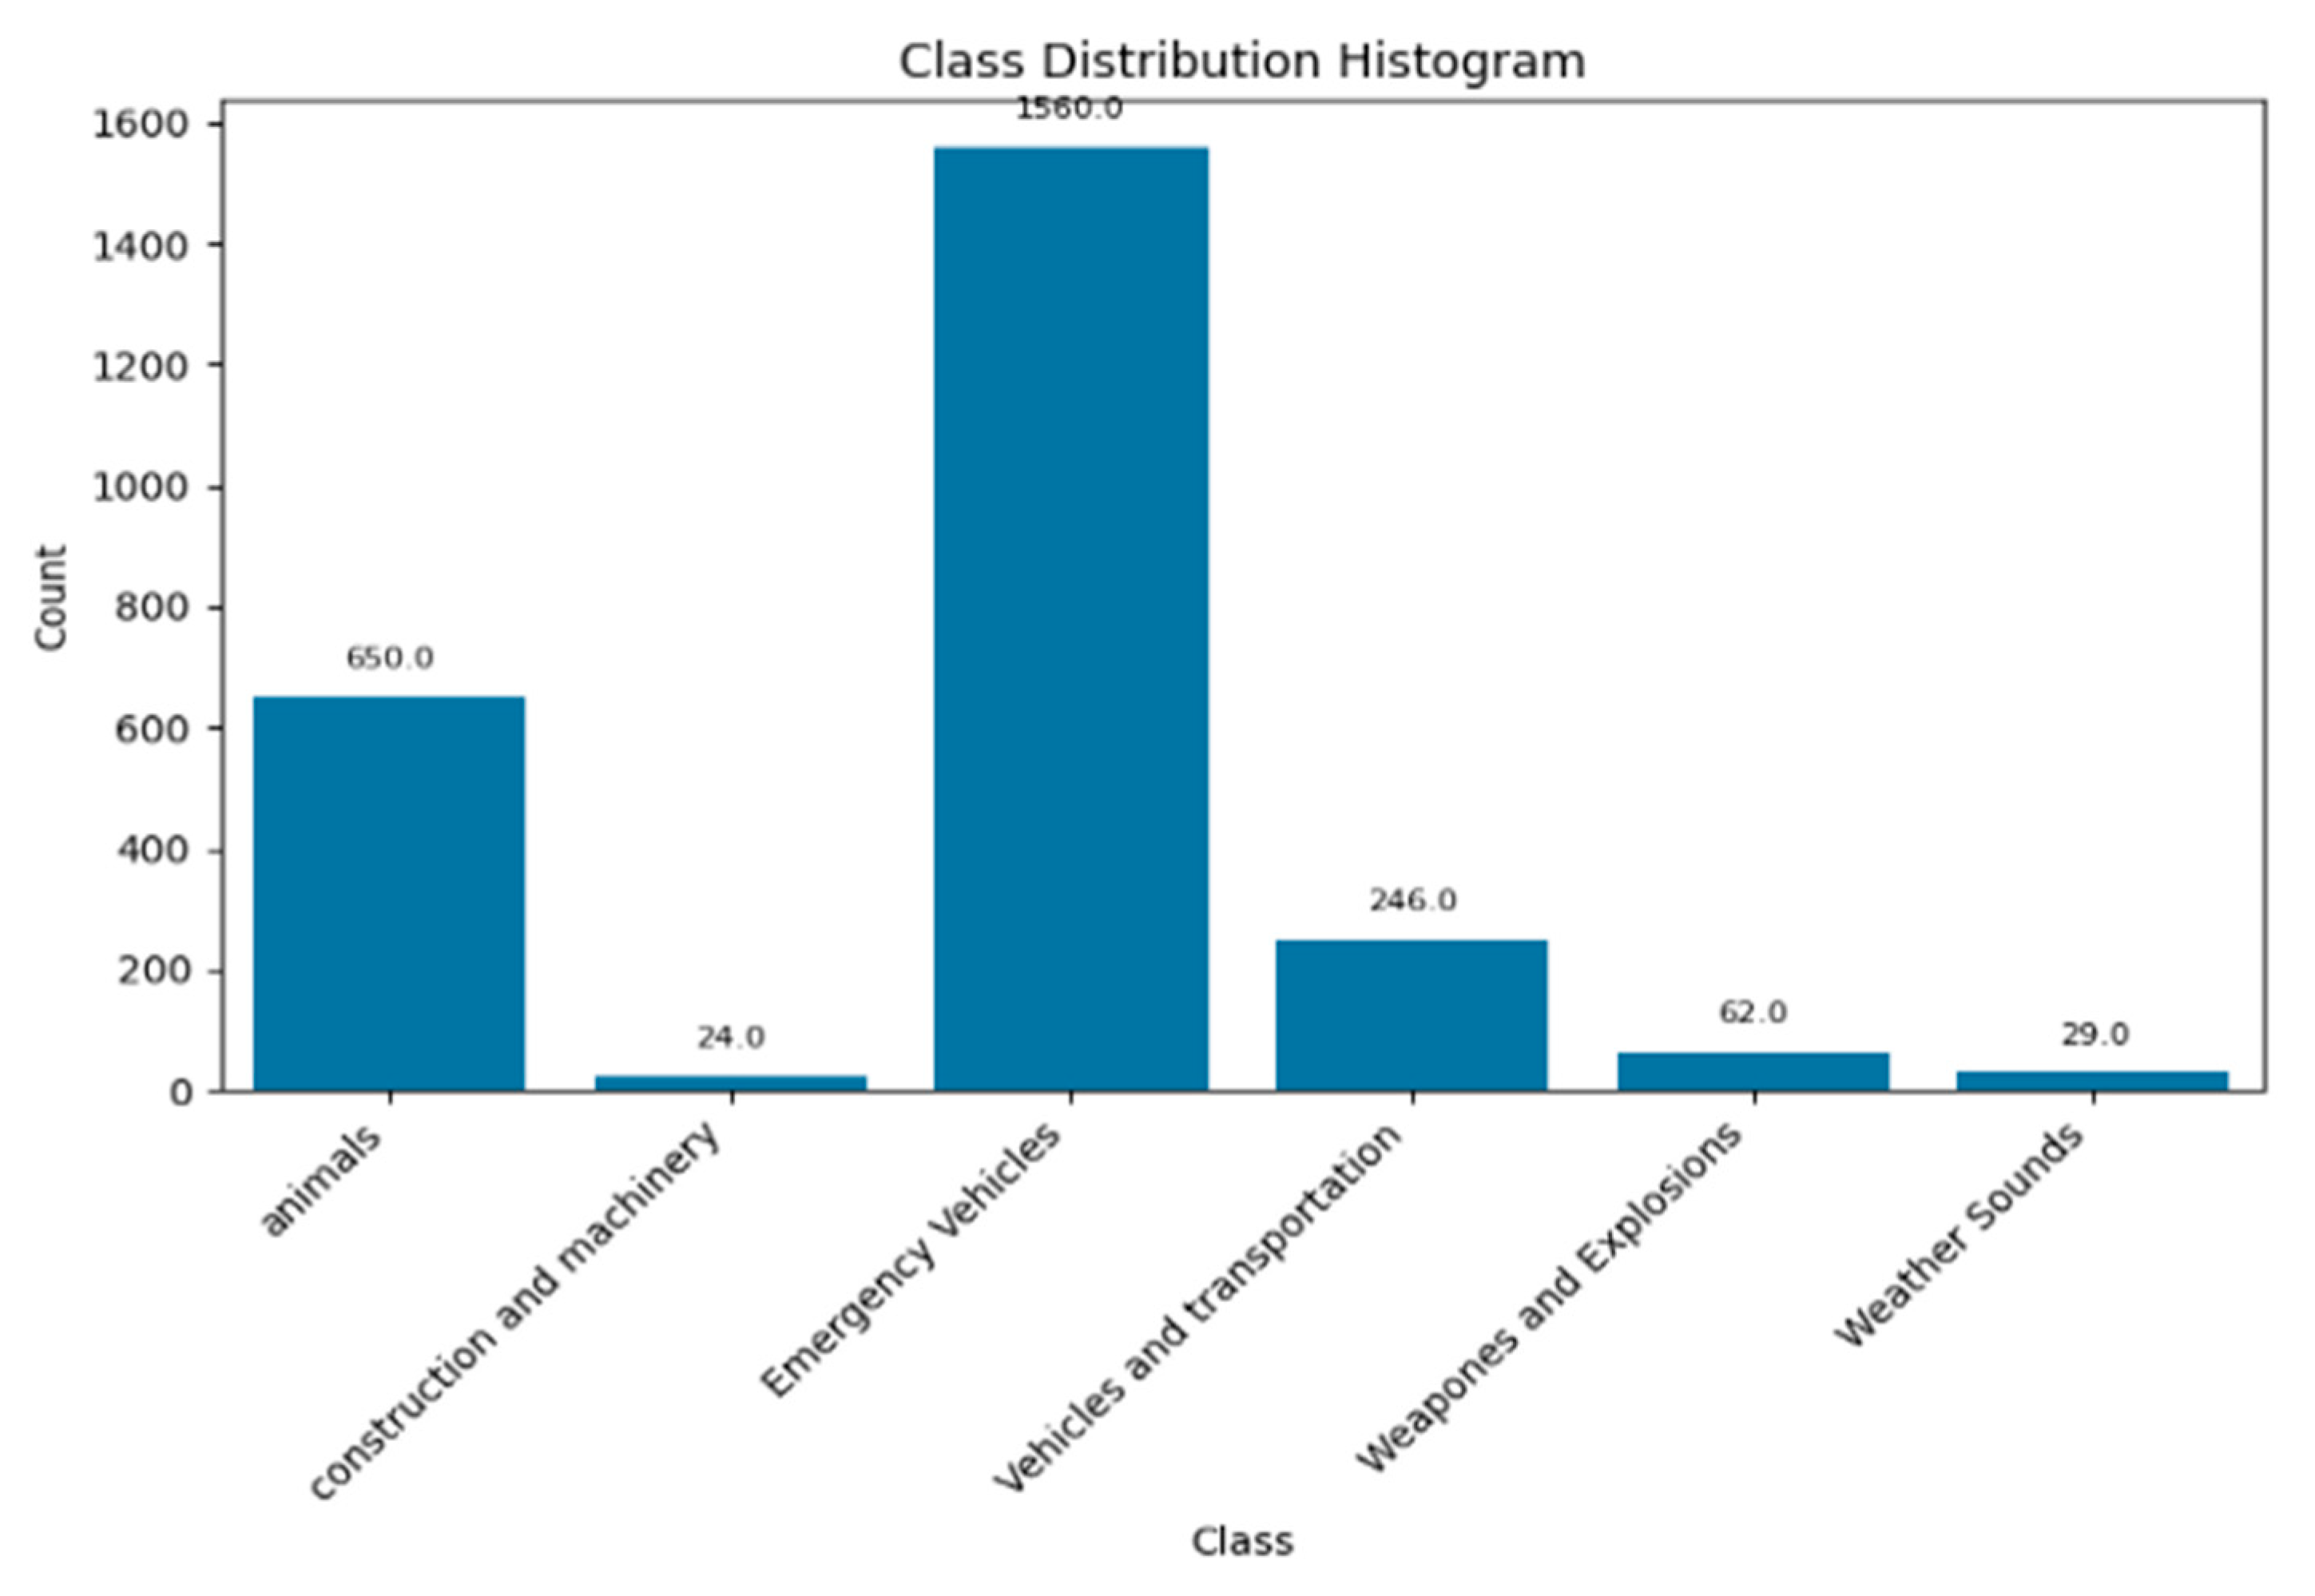
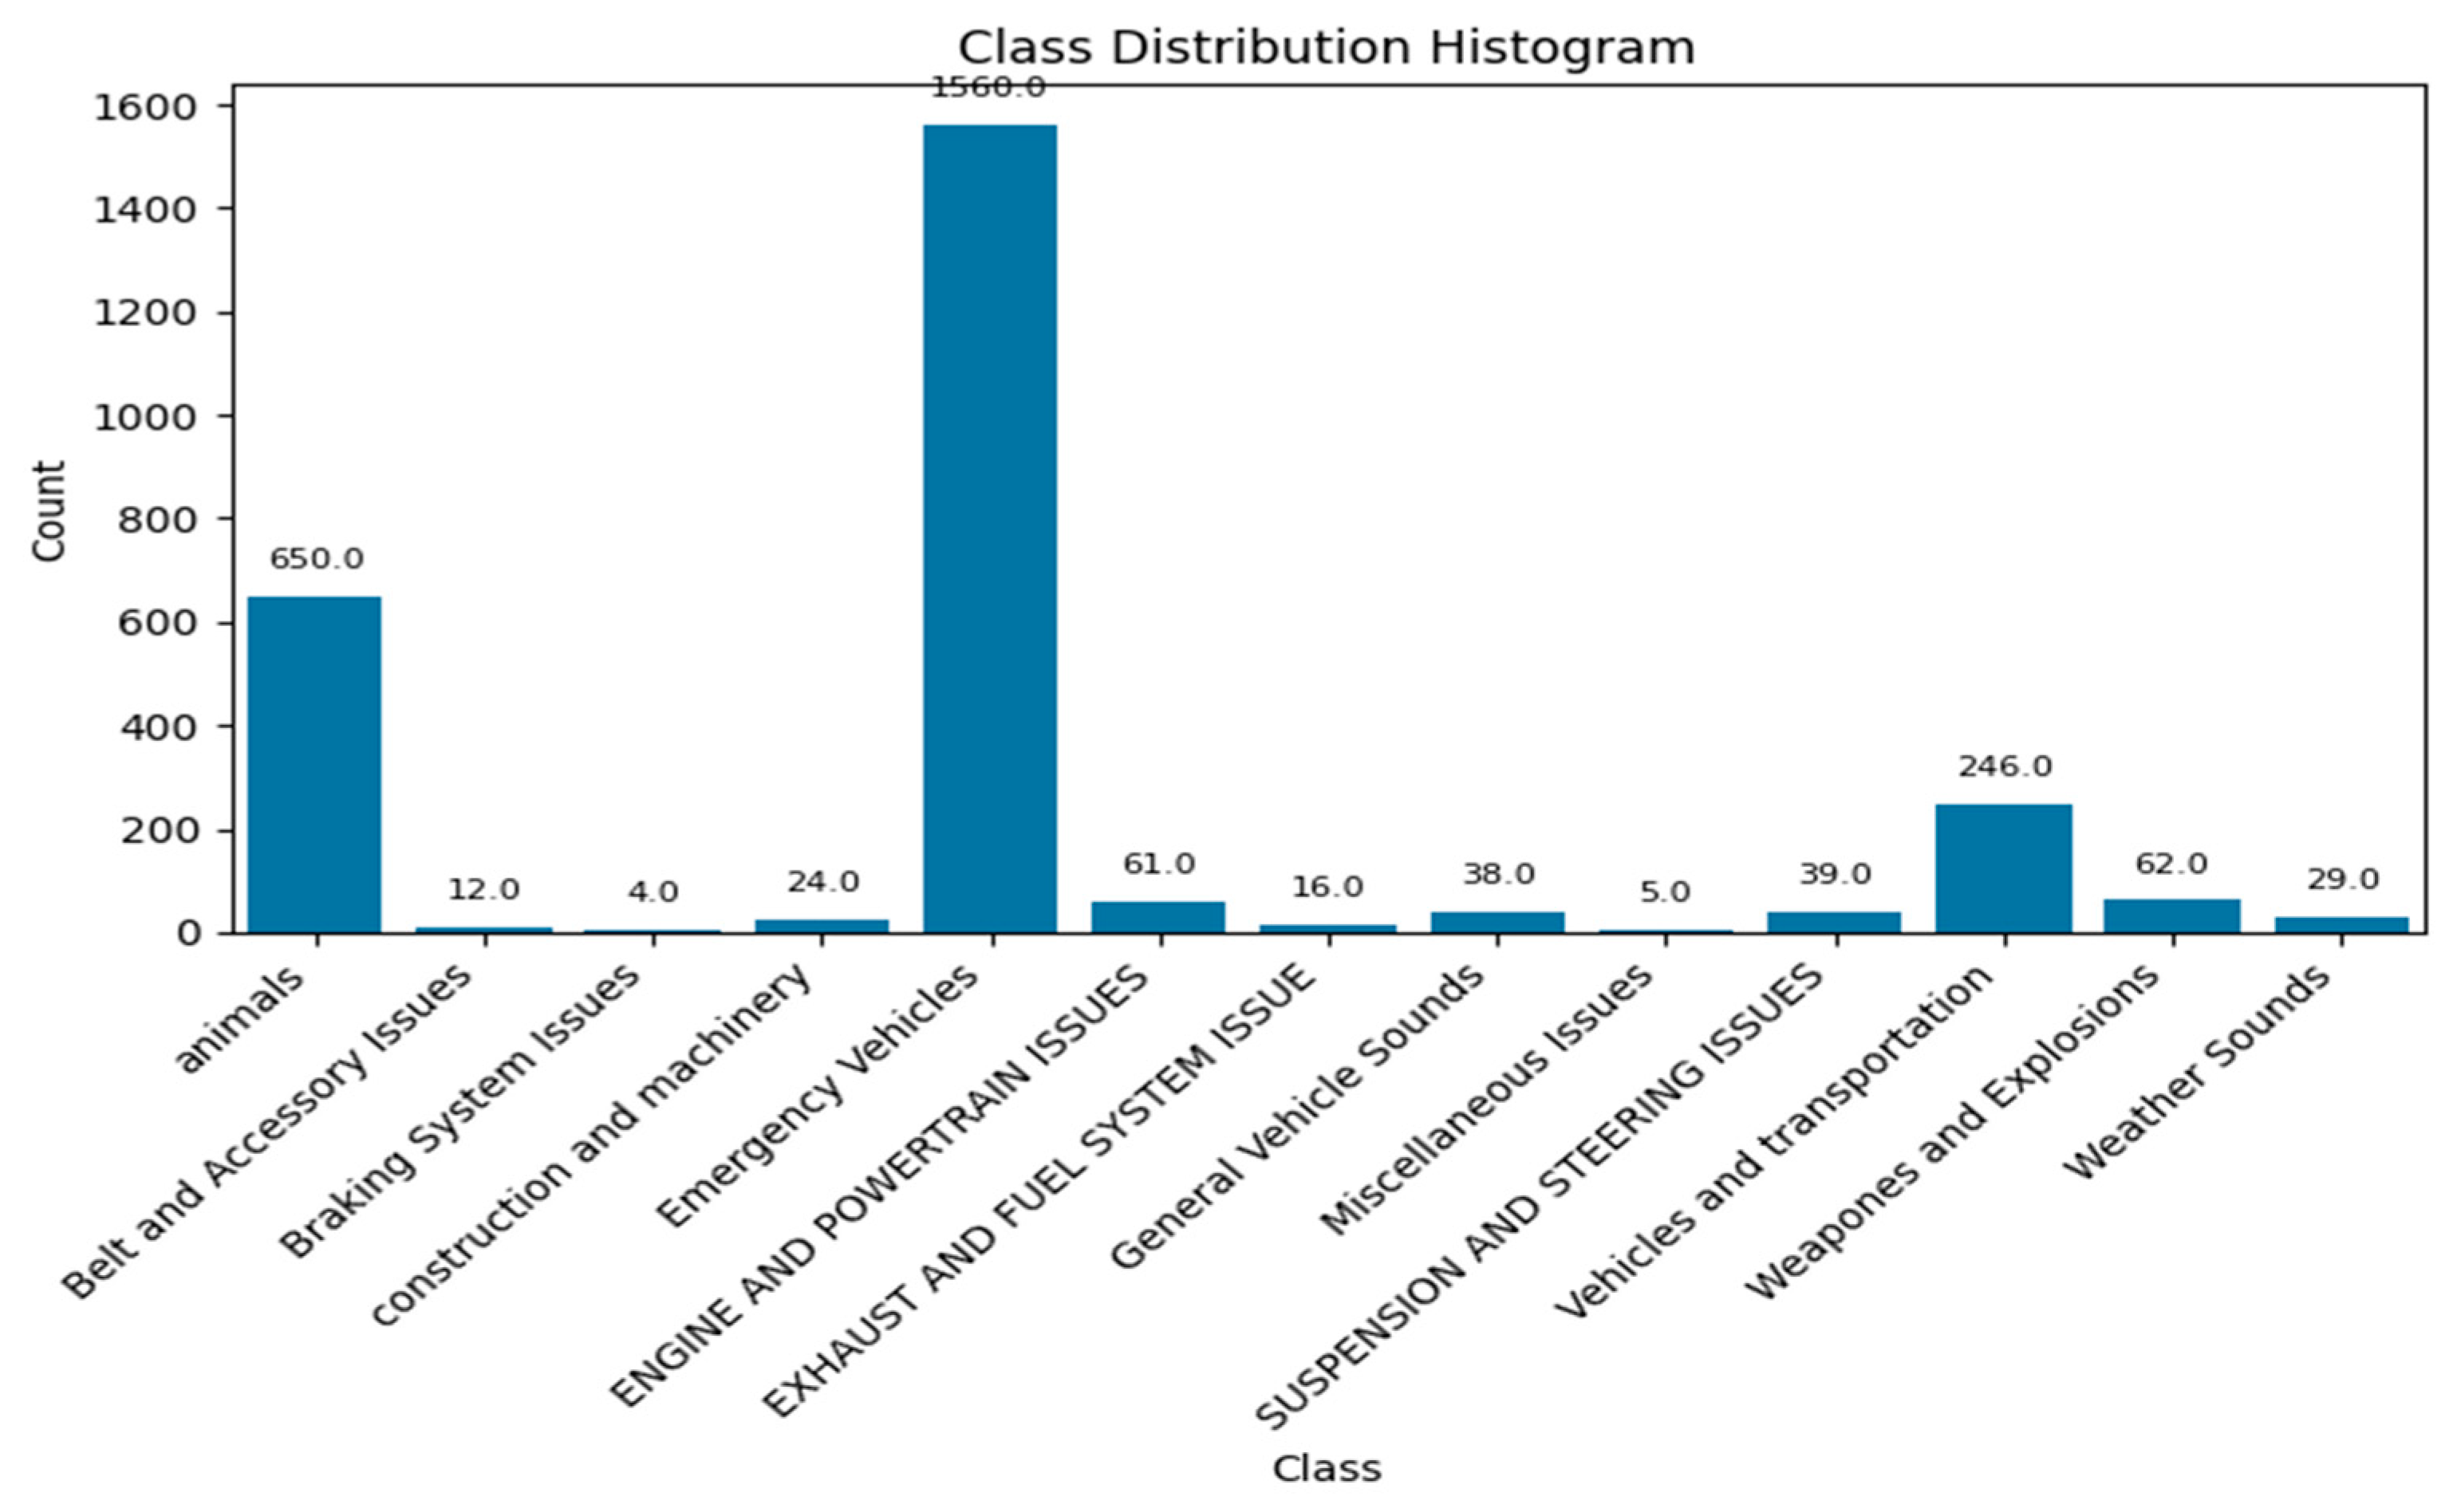
The class distributions for VAFD, UEASD, and IVESD are presented in Figure 3, Figure 4 and Figure 5, respectively.

5.1. Performance Metrics

A set of well-established metrics was employed to evaluate the classification models’ performance. These metrics provide a multifaceted view of model behavior, which is particularly important for high-stakes applications such as vehicle fault detection and emergency sound recognition in Intelligent Transportation Systems (ITSs).
Specifically, performance was assessed using accuracy, precision, recall, F1-score, specificity, Matthews Correlation Coefficient (MCC), logarithmic loss (LogLoss), Cohen’s Kappa, and the Area Under the Receiver Operating Characteristic Curve (AUC-ROC). Each of these metrics provides complementary insights:
  • Accuracy reflects overall correctness, but can be misleading with imbalanced datasets.
  • Precision emphasizes the cost of false alarms, while recall (sensitivity) highlights the importance of capturing all critical events.
  • F1-score balances precision and recall.
  • Specificity measures the ability to avoid false alarms in non-critical cases.
  • MCC provides a balanced evaluation even under class imbalance.
  • LogLoss captures the confidence of probabilistic predictions.
  • Cohen’s Kappa measures agreement beyond chance.
  • AUC-ROC evaluates the trade-off between sensitivity and specificity across thresholds.
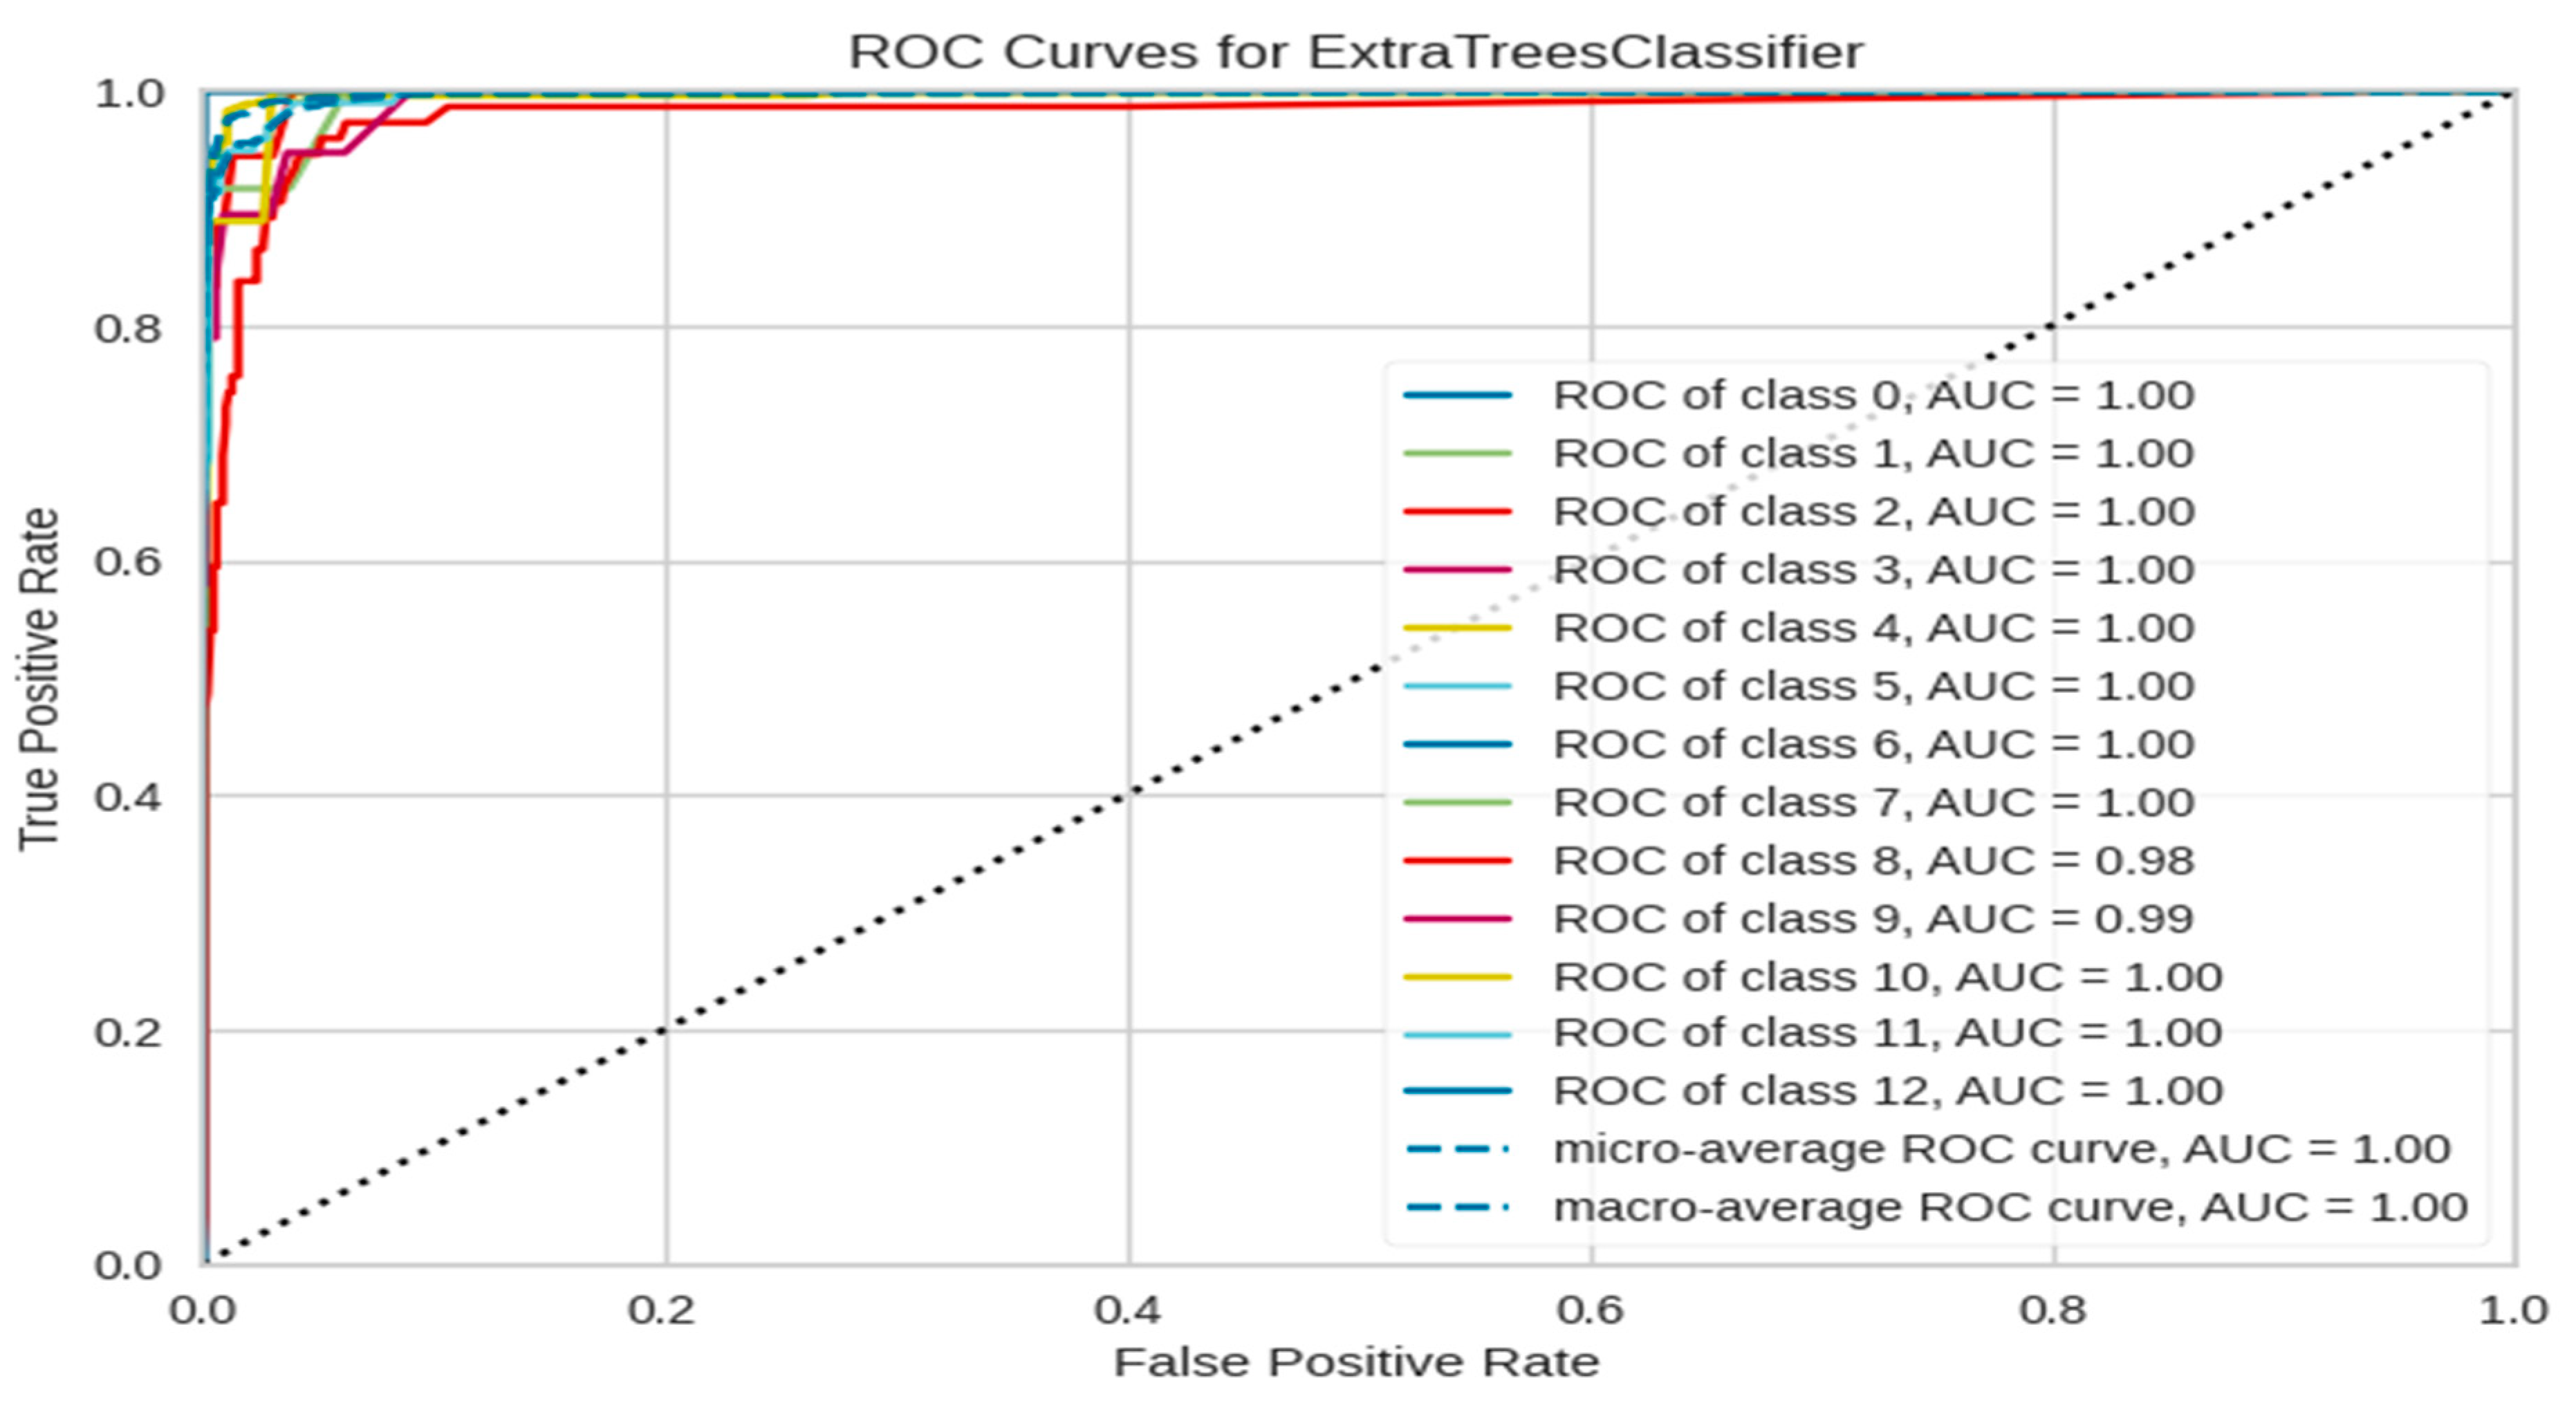
Formal definitions of these metrics are standard and can be found in widely used references [73,74]. Together, these metrics provide a robust foundation for evaluating model effectiveness, interpretability, and readiness for deployment in real-world ITS environments. They were used throughout the experiments to compare classification performance, assess feature selection strategies, and validate model reliability across diverse acoustic datasets. In addition to classification metrics, this study evaluated the impact of feature selection techniques—SHAP, Boruta, and ANOVA—on interpretability, relevance, and computational efficiency, respectively. A comprehensive analysis of 15 ML models’ performance across all datasets is provided in Table 5, Table 6 and Table 7, with supporting visualizations, including learning curves, ROC curves, and confusion matrices, presented in Figure 6, Figure 7, Figure 8, Figure 9, Figure 10 and Figure 11.

5.1.1. Phase 1—Experiment 1: Performance Analysis on VAFD

VAFD comprises various vehicle fault sound classes and was used to evaluate the baseline performance of 15 machine learning models using the optimal subset of 38 features selected via ANOVA—the evaluation employed stratified 10-fold cross-validation to ensure robust assessment across all classes. The results are summarized in Table 5, with supporting visuals in Figure 10 (Learning Curve) and Figure 11 (Confusion Matrix).
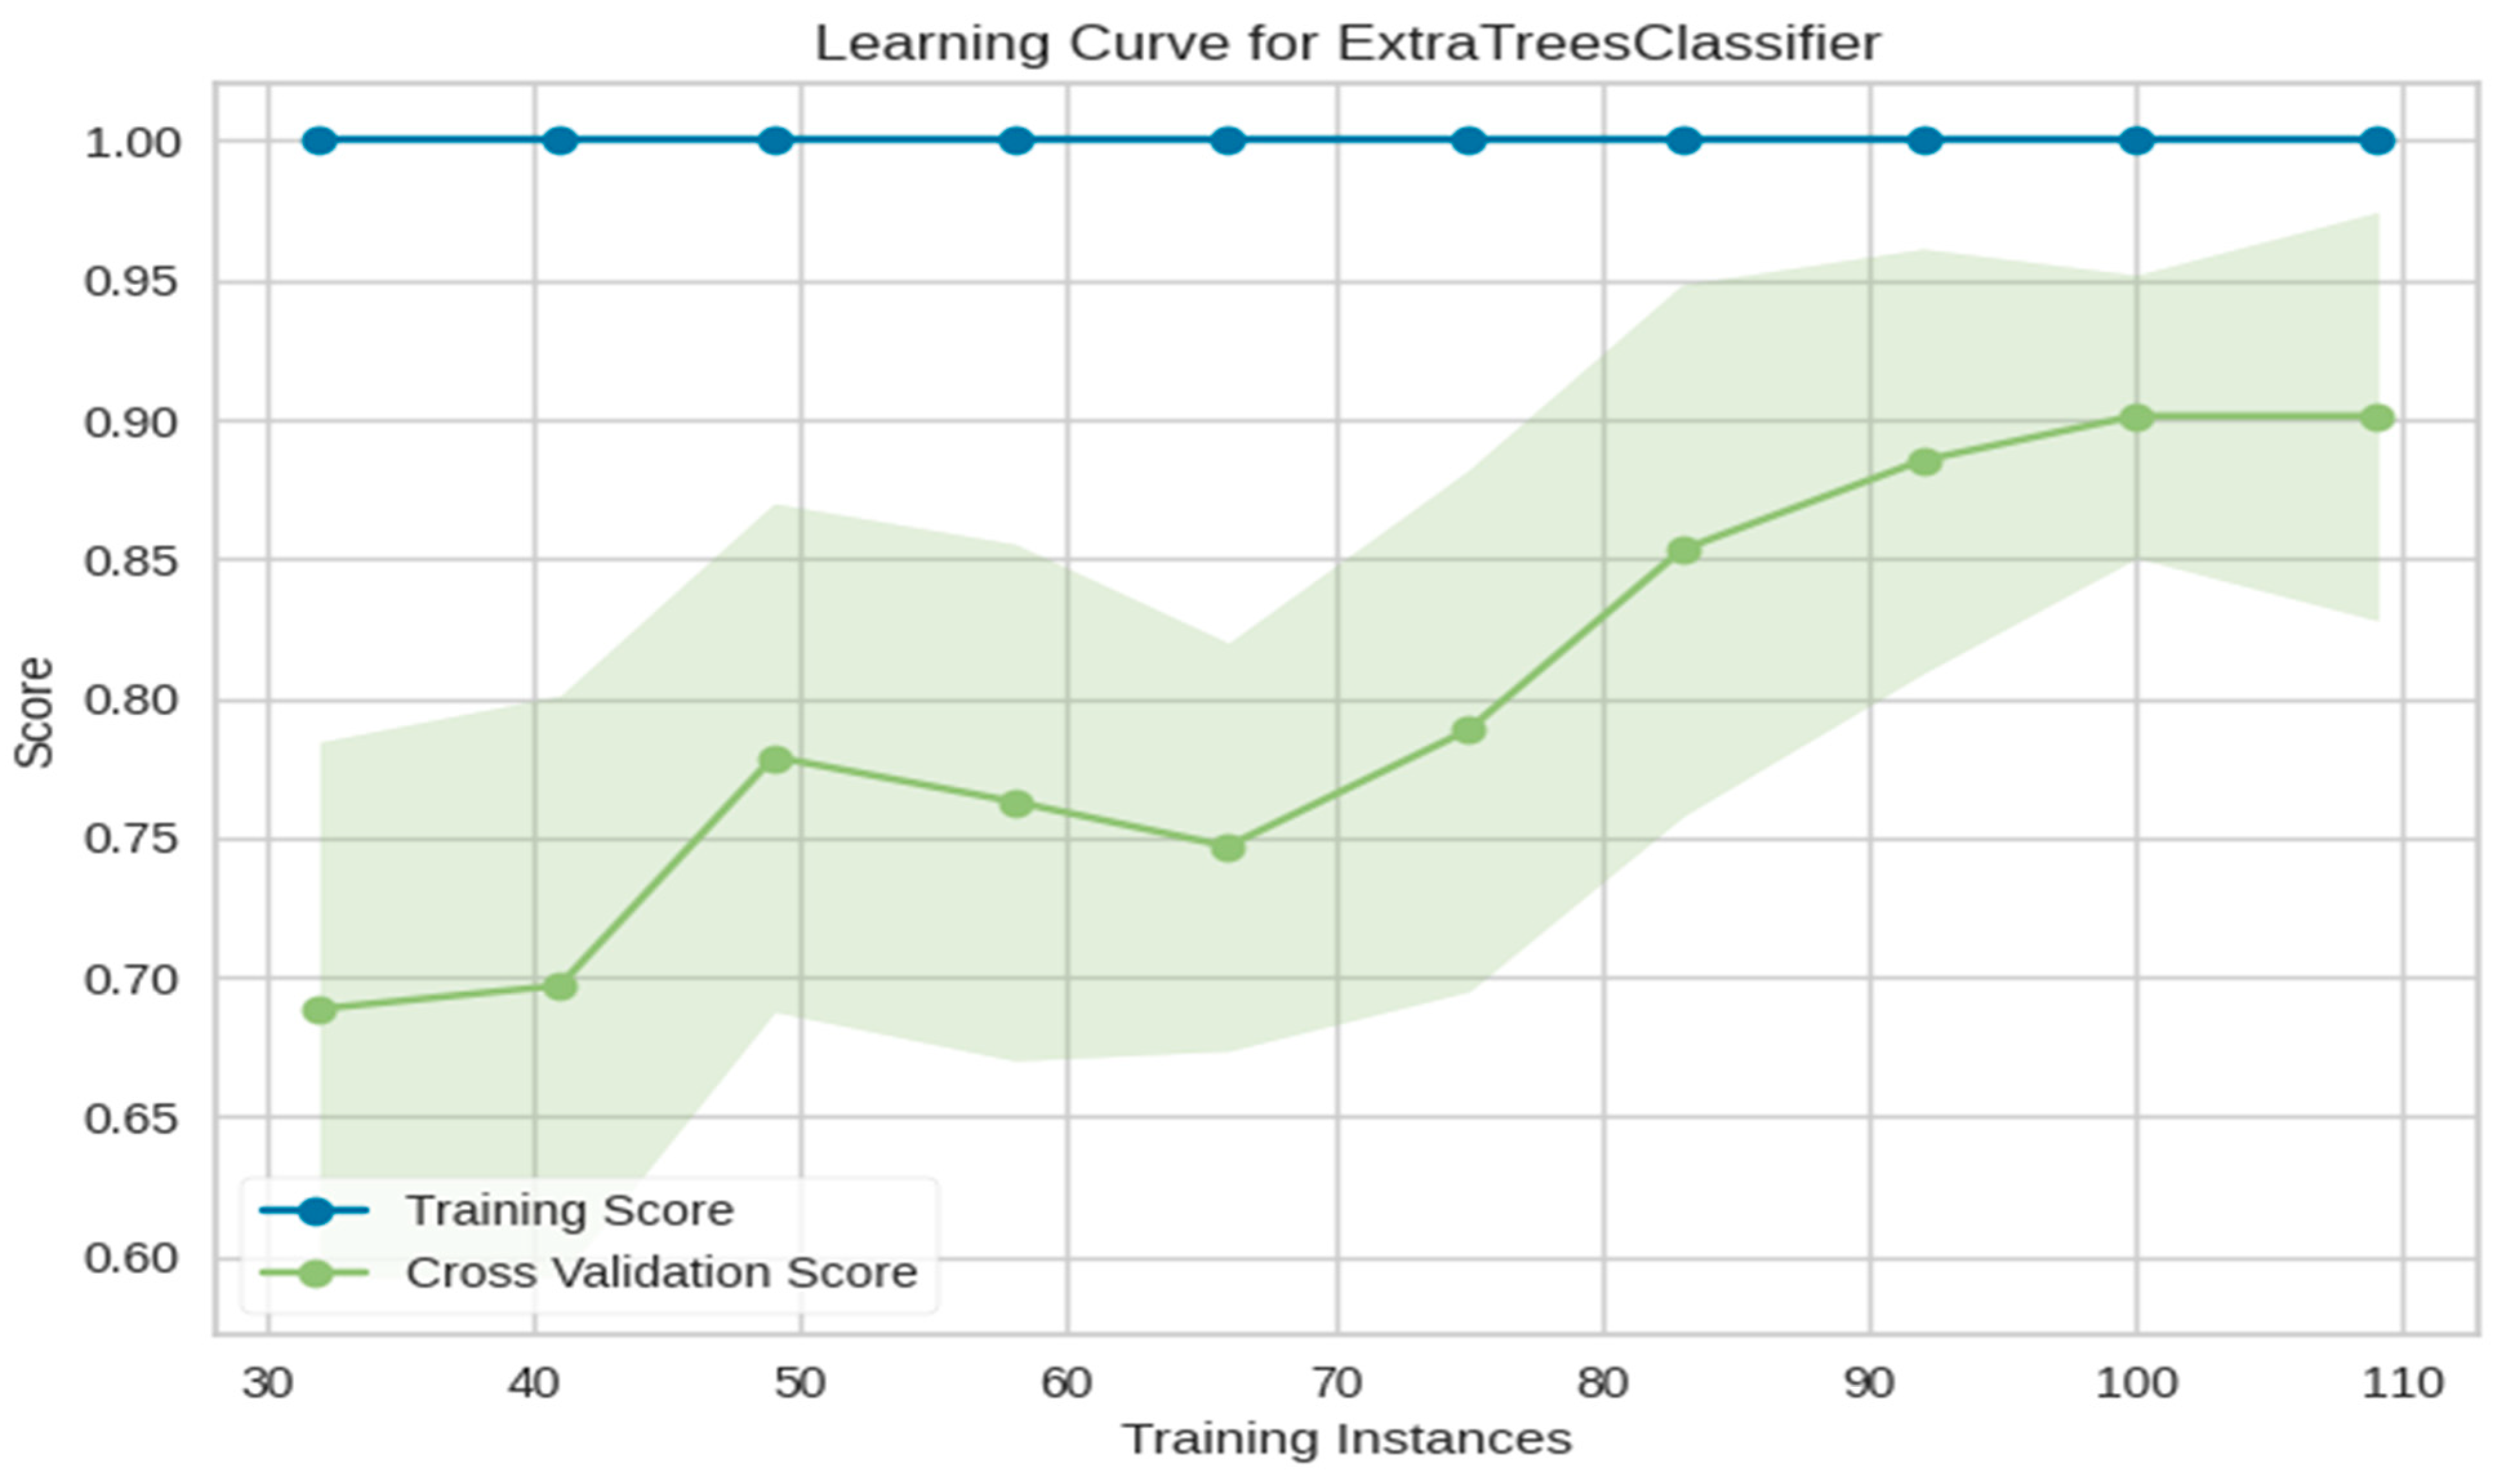
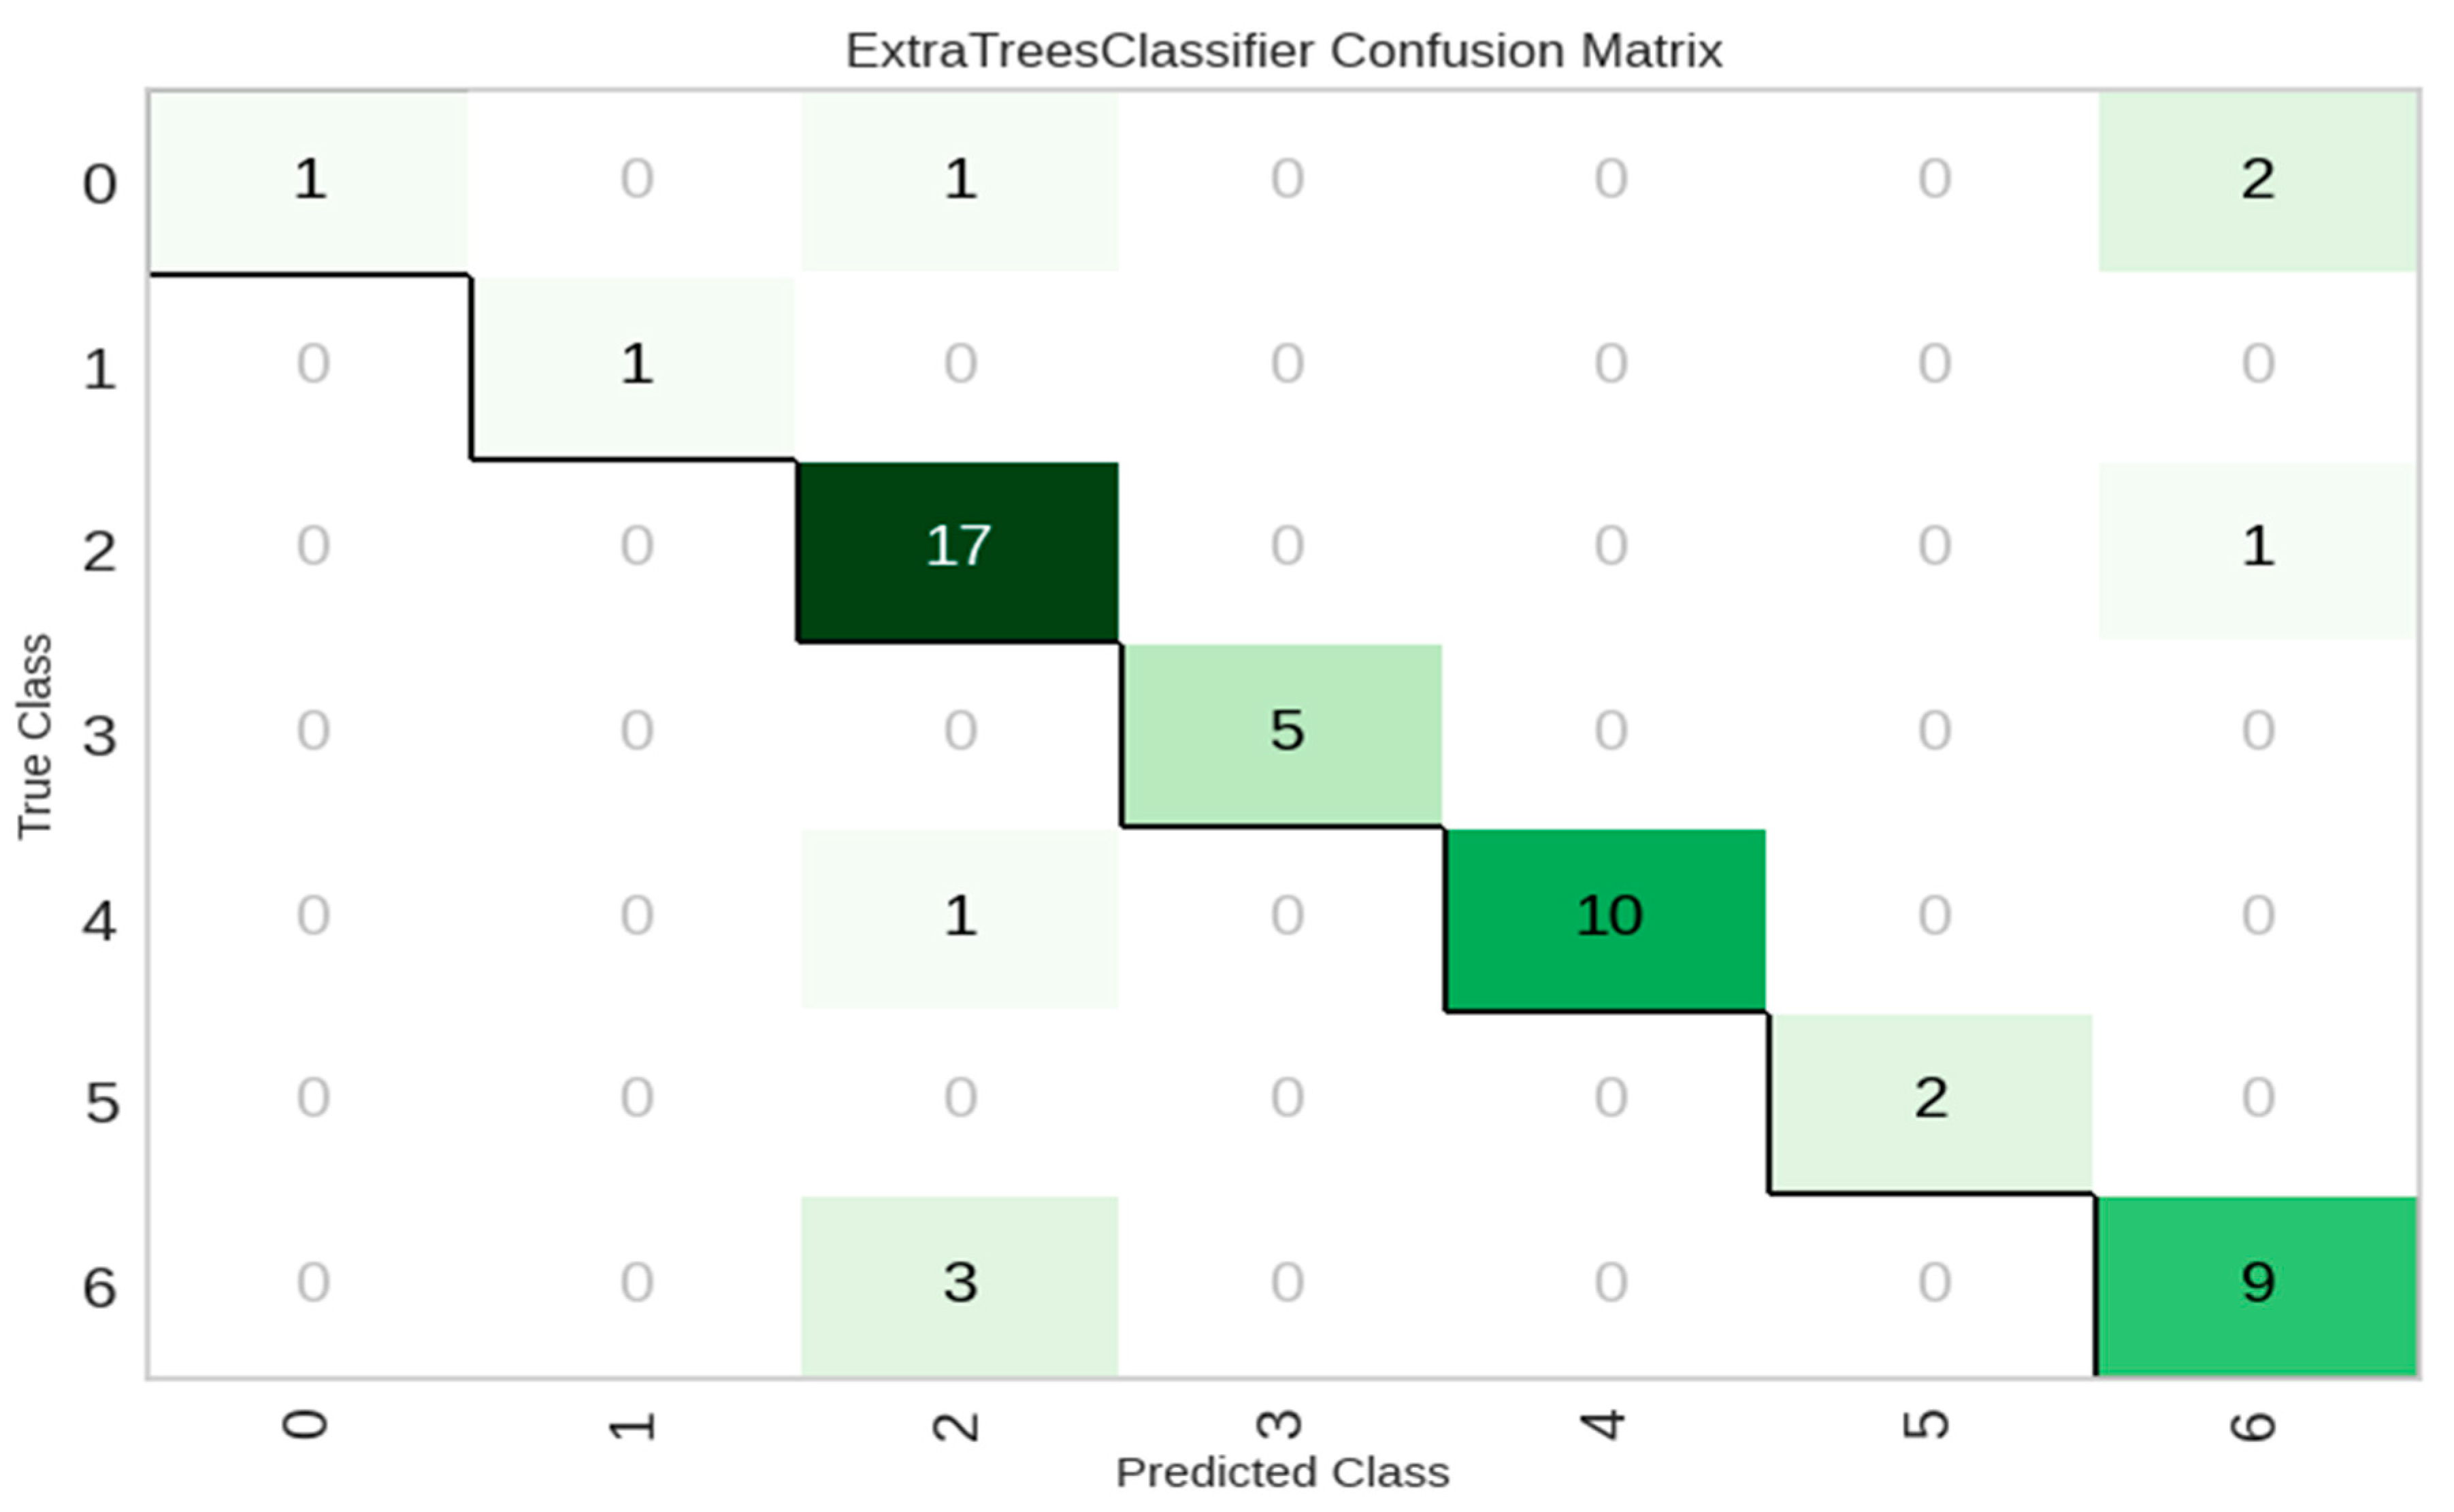
As shown in Table 5, the Extra Trees Classifier achieved the highest classification accuracy of 90.13%, outperforming all other models. It also recorded the strongest scores in precision (0.8811), recall (0.9013), F1-score (0.8655), and Matthews Correlation Coefficient (MCC = 0.8783), highlighting its capability to deliver high-fidelity predictions in distinguishing between subtle acoustic patterns of mechanical faults. Random Forest and LightGBM followed with 84.36% and 82.76% accuracy, respectively, but with a noticeable drop in MCC, indicating reduced consistency across classes. Traditional classifiers such as SVM, Logistic Regression, and Naïve Bayes performed significantly lower, suggesting their limited suitability for this complex audio-based classification task. The learning curve for the Extra Trees Classifier, displayed in Figure 6, reveals a steady increase in cross-validation score as the number of training instances increases. The narrowing gap between training and validation curves indicates strong generalization and minimal overfitting. This further supports the model’s stability and effectiveness across different training splits. The confusion matrix in Figure 7 demonstrates class-wise prediction performance. Most sound classes, including “Engine and Powertrain Issues” and “Suspension and Steering Issues,” were classified correctly. However, minor confusion was observed in acoustically similar categories. For instance, 3 samples from Class 6 were misclassified as Class 2, and two Class 0 samples were misclassified as Class 6. These misclassifications highlight the acoustic overlap among certain fault types, which could potentially be mitigated through advanced augmentation or feature engineering in future work.
Overall, the results validate that combining ANOVA-based feature selection and ensemble models, particularly Extra Trees, is highly effective for identifying complex vehicle fault sounds in real-world scenarios. The high precision and recall further emphasize the system’s reliability in minimizing false alarms and missed detections—a critical requirement for deployment in intelligent vehicle diagnostics.

5.1.2. Phase 1—Experiment 1: Performance Analysis of UEASD

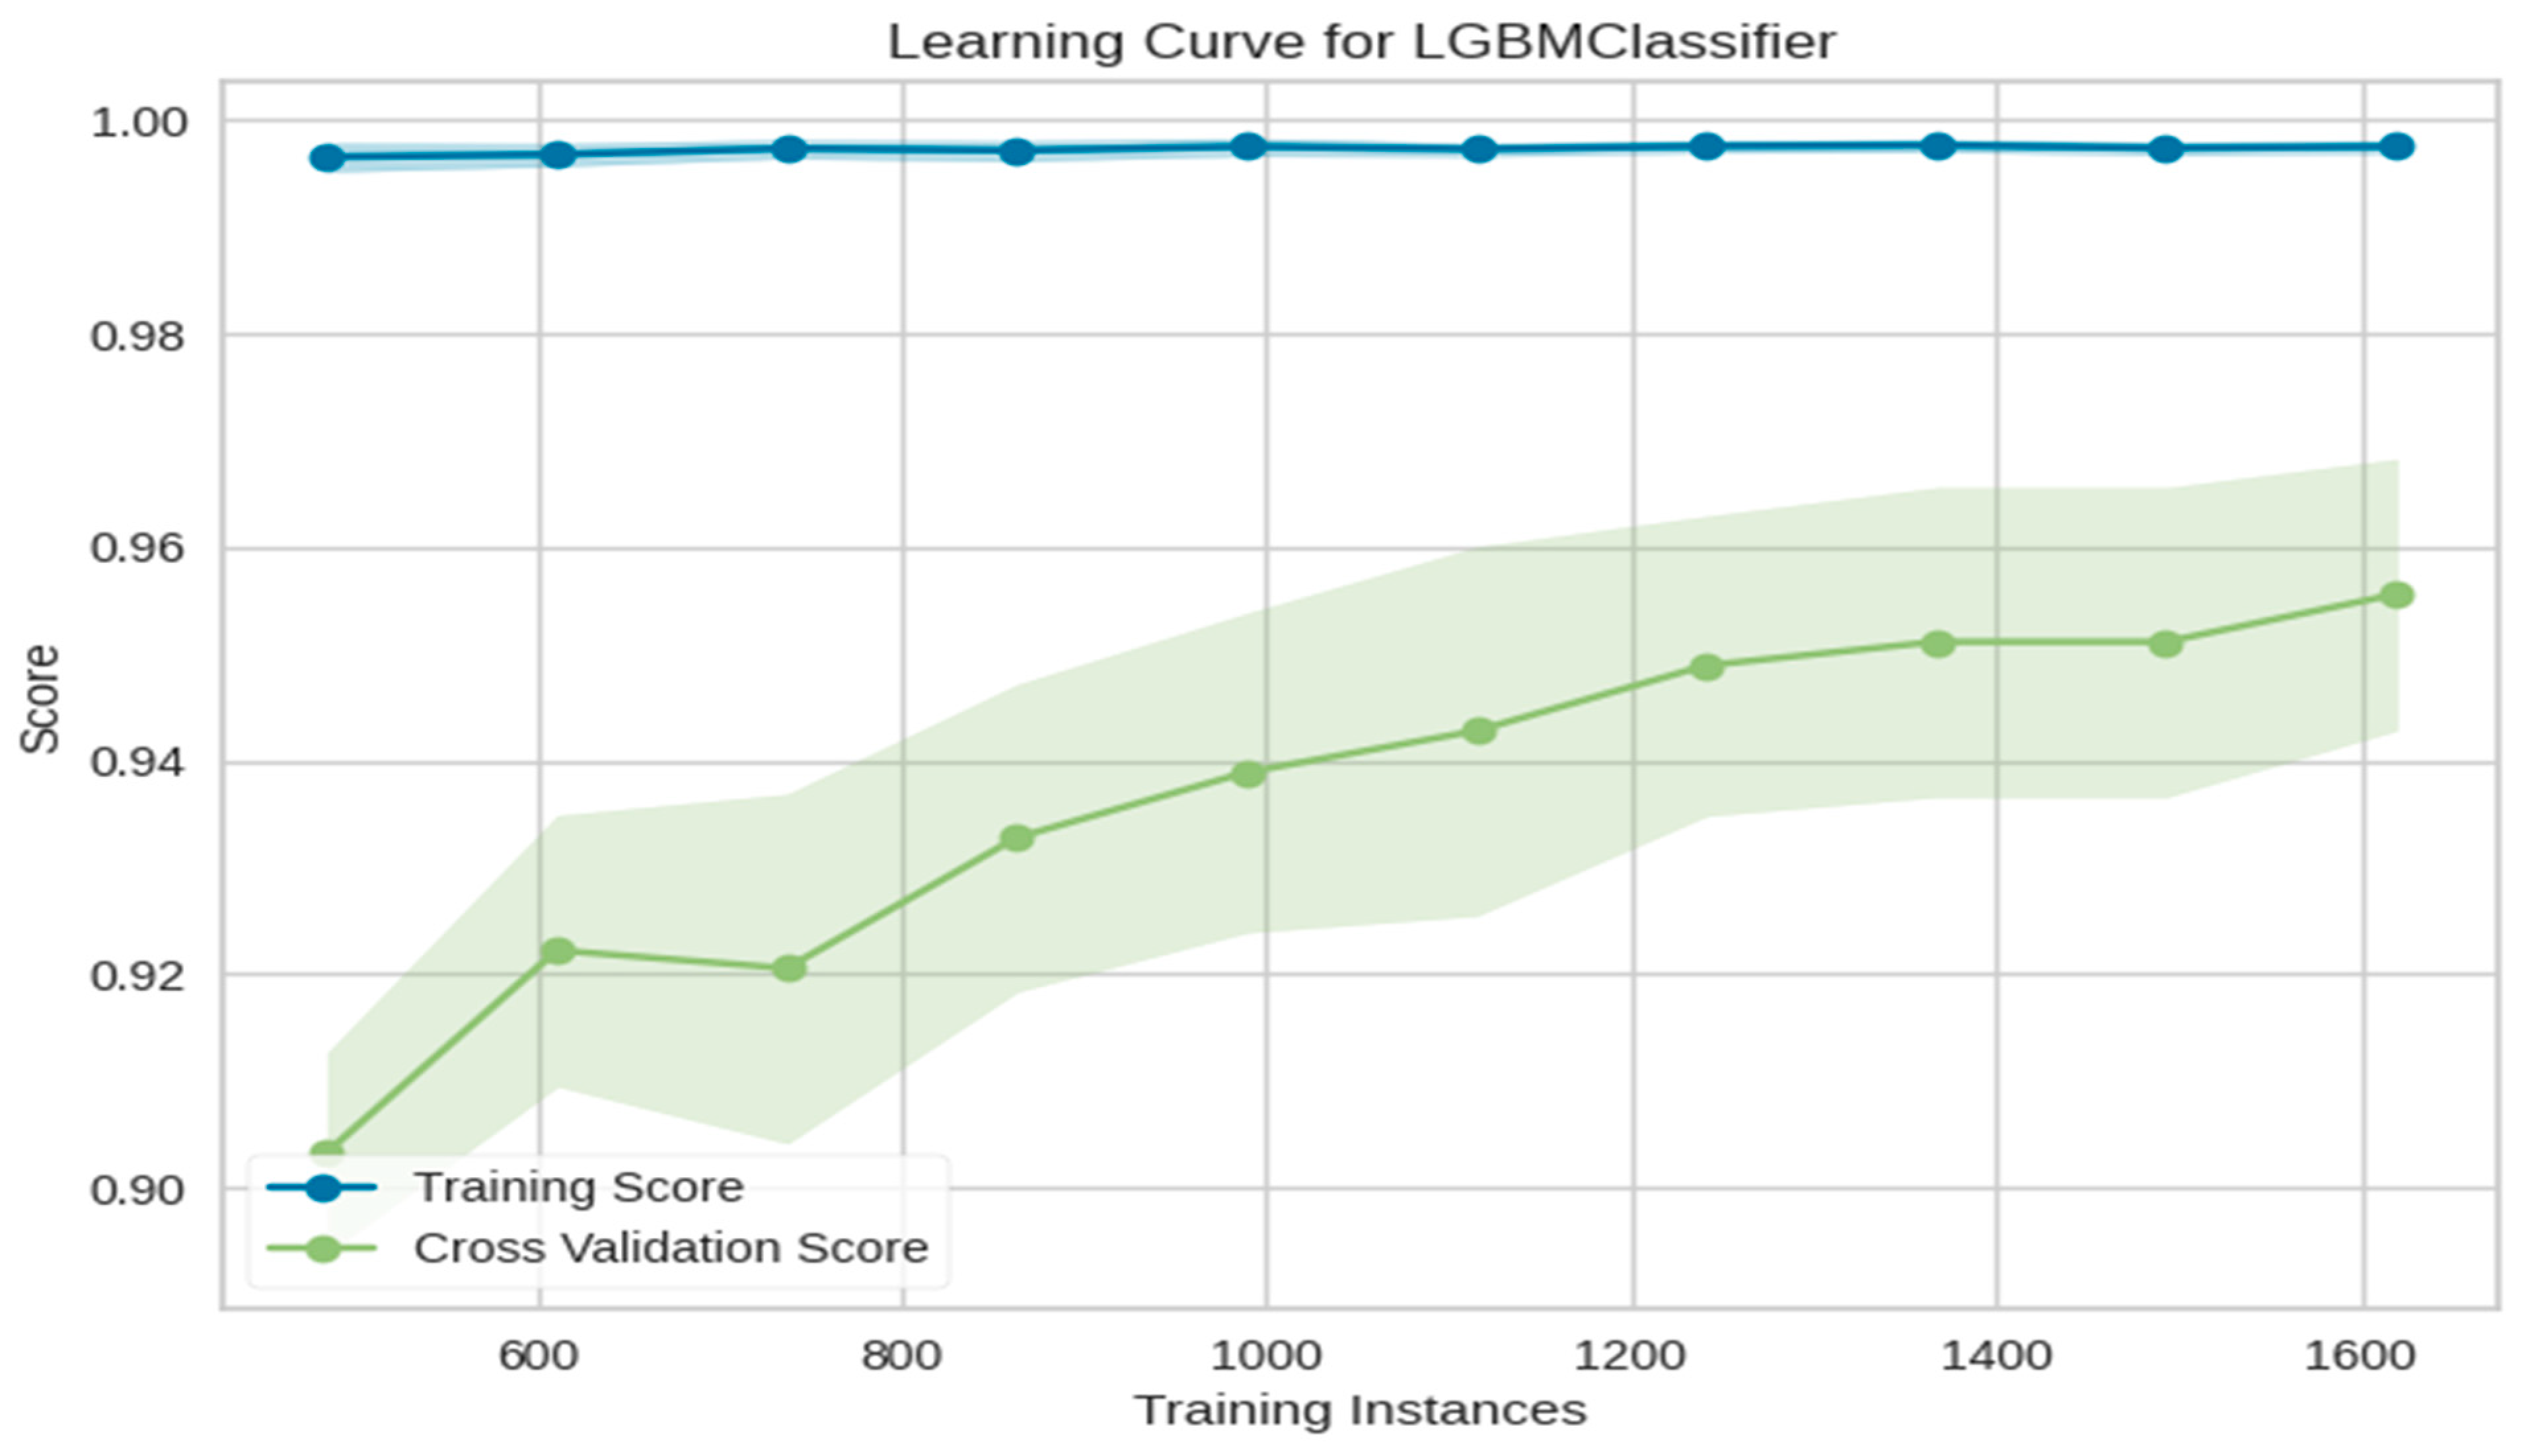
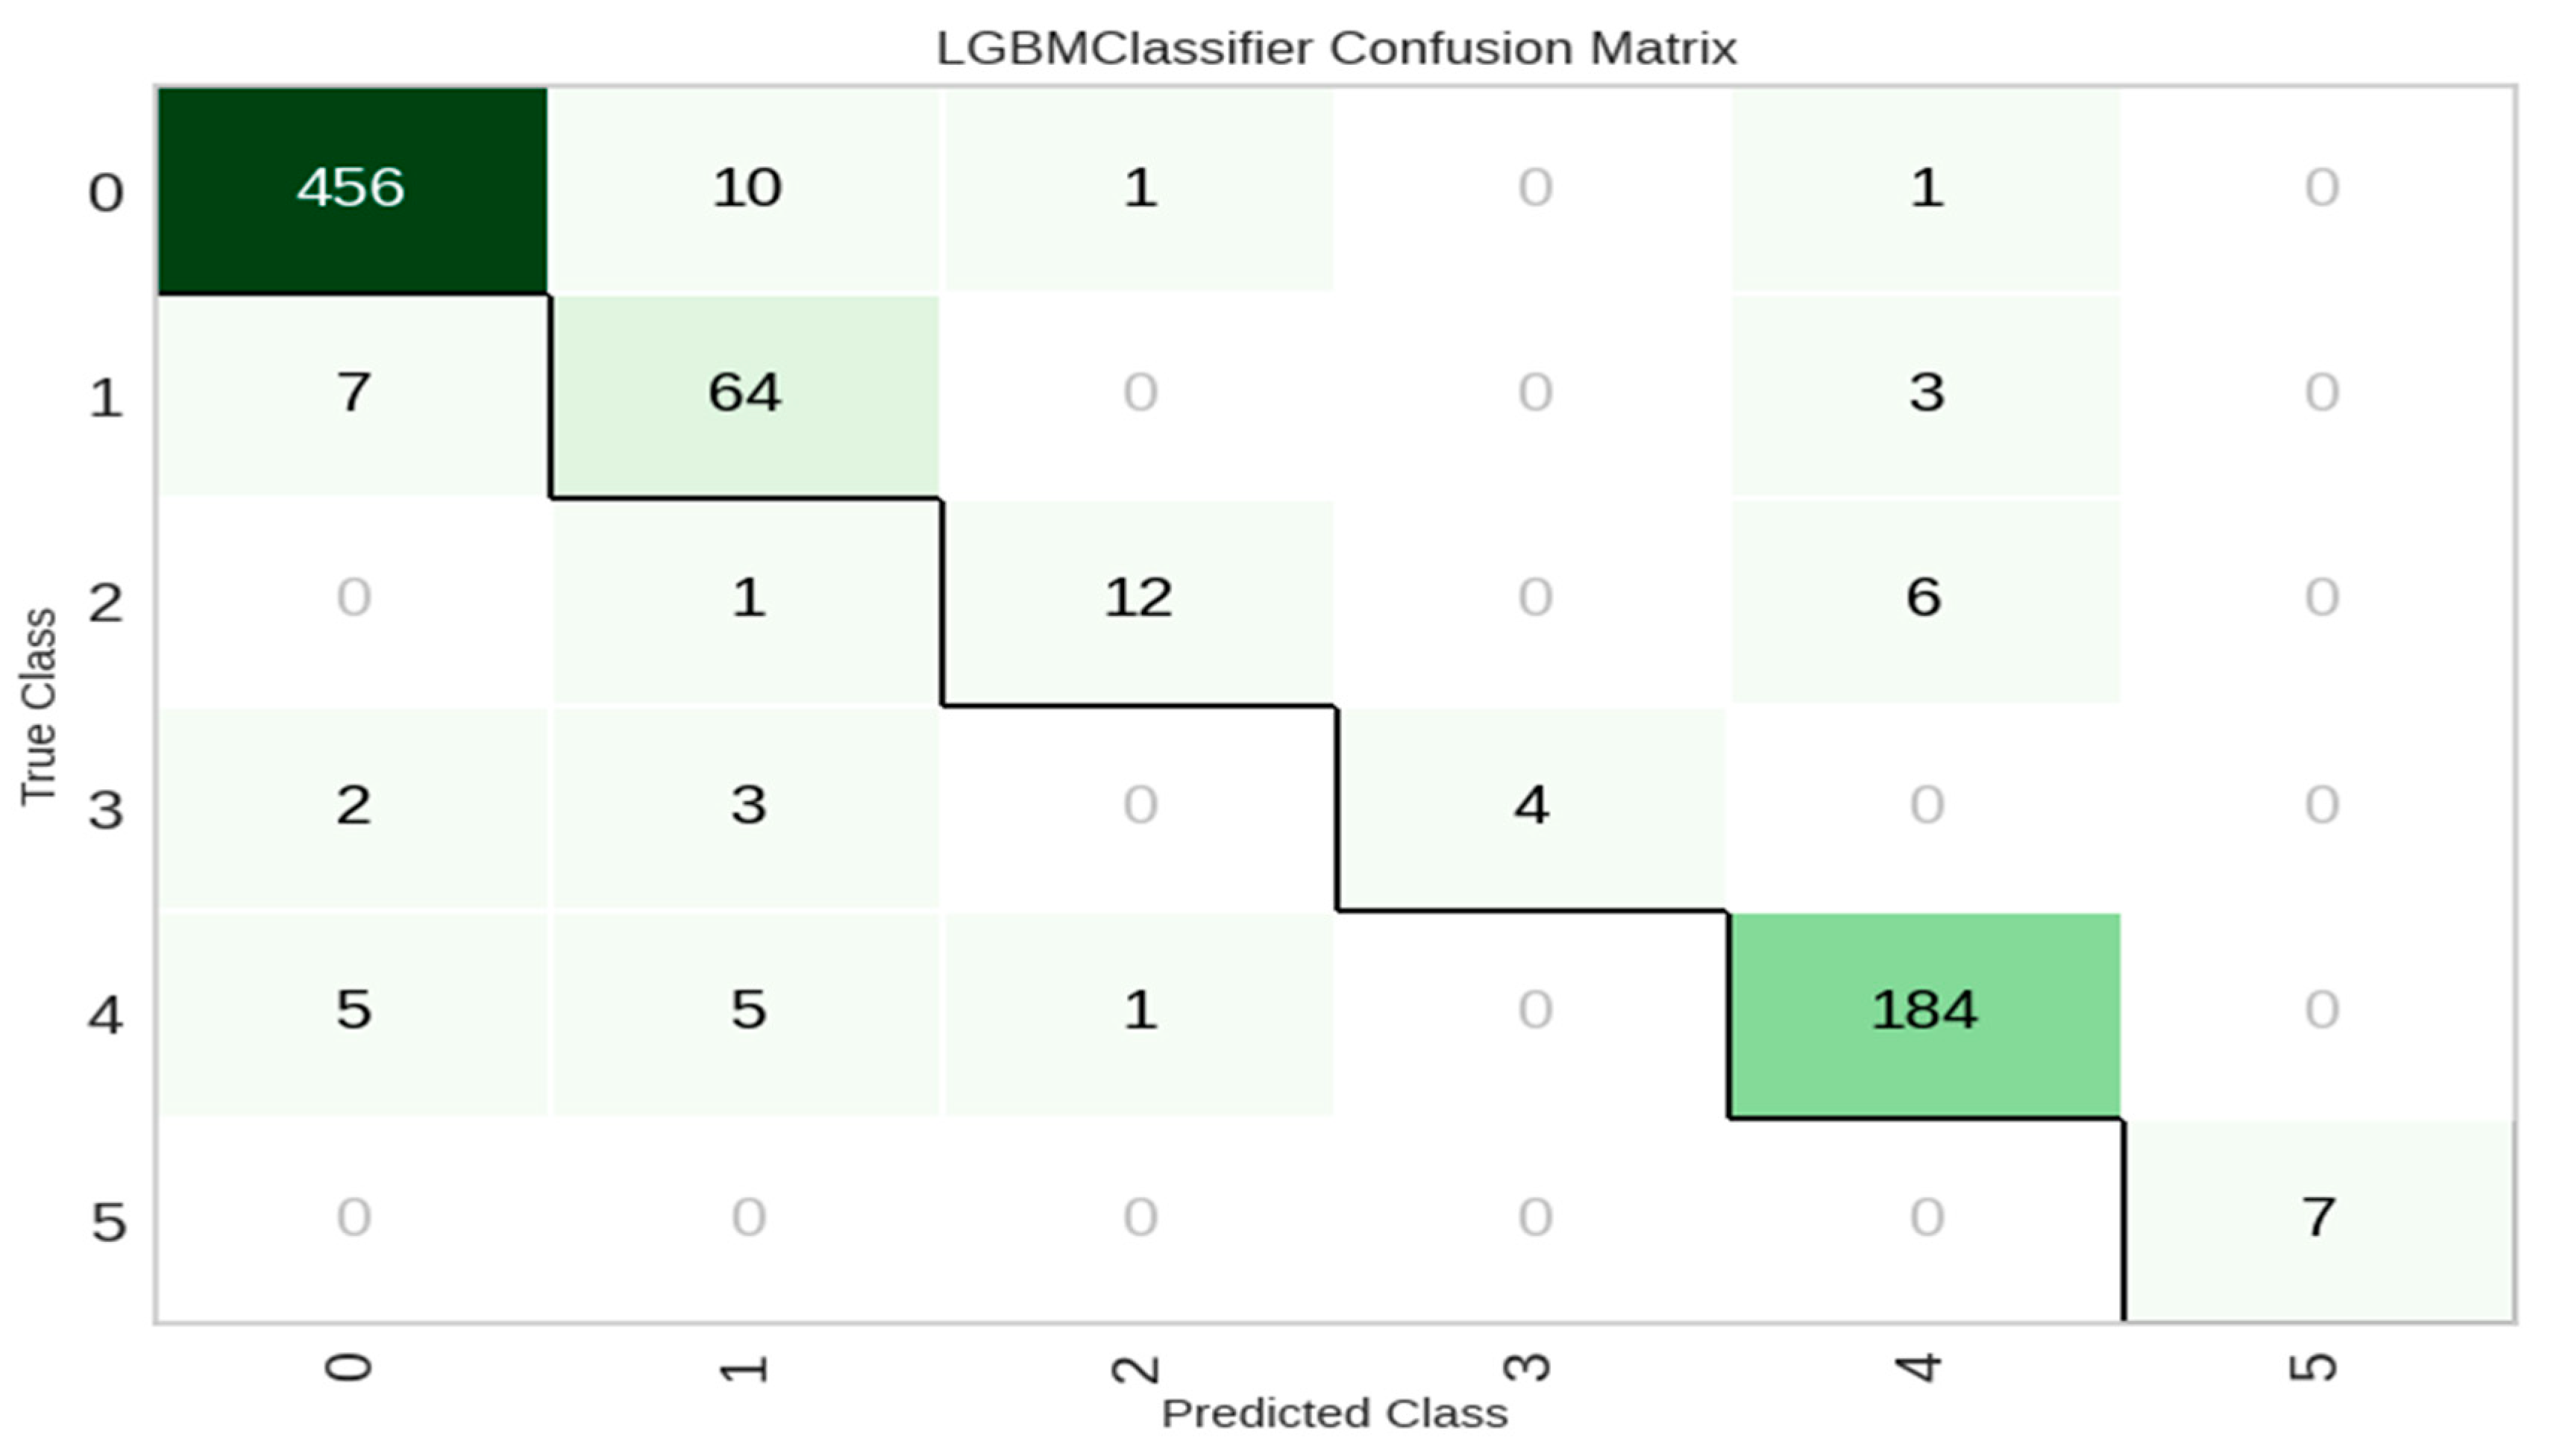
UEASD was tested using 15 machine learning models trained on features selected via ANOVA to evaluate the classification of emergency sound events. The model’s performance is summarized in Table 6, using accuracy, precision, recall, F1-score, AUC, MCC, and training time (TT) as evaluation metrics. The Extreme Gradient Boosting (XGBoost) model outperformed others, achieving the highest accuracy of 95.50%, a near-perfect AUC of 0.9948, and an F1-score of 0.9512, confirming its robustness in high-stakes audio recognition. Among the top-performing models, LightGBM and Extra Trees Classifier also demonstrated competitive results, reaching accuracies of 95.28% and 95.05%, respectively. Notably, these ensemble models consistently delivered strong generalization capabilities with high F1-scores (above 0.94) and relatively short training times, reinforcing their suitability for real-time ITS deployment.
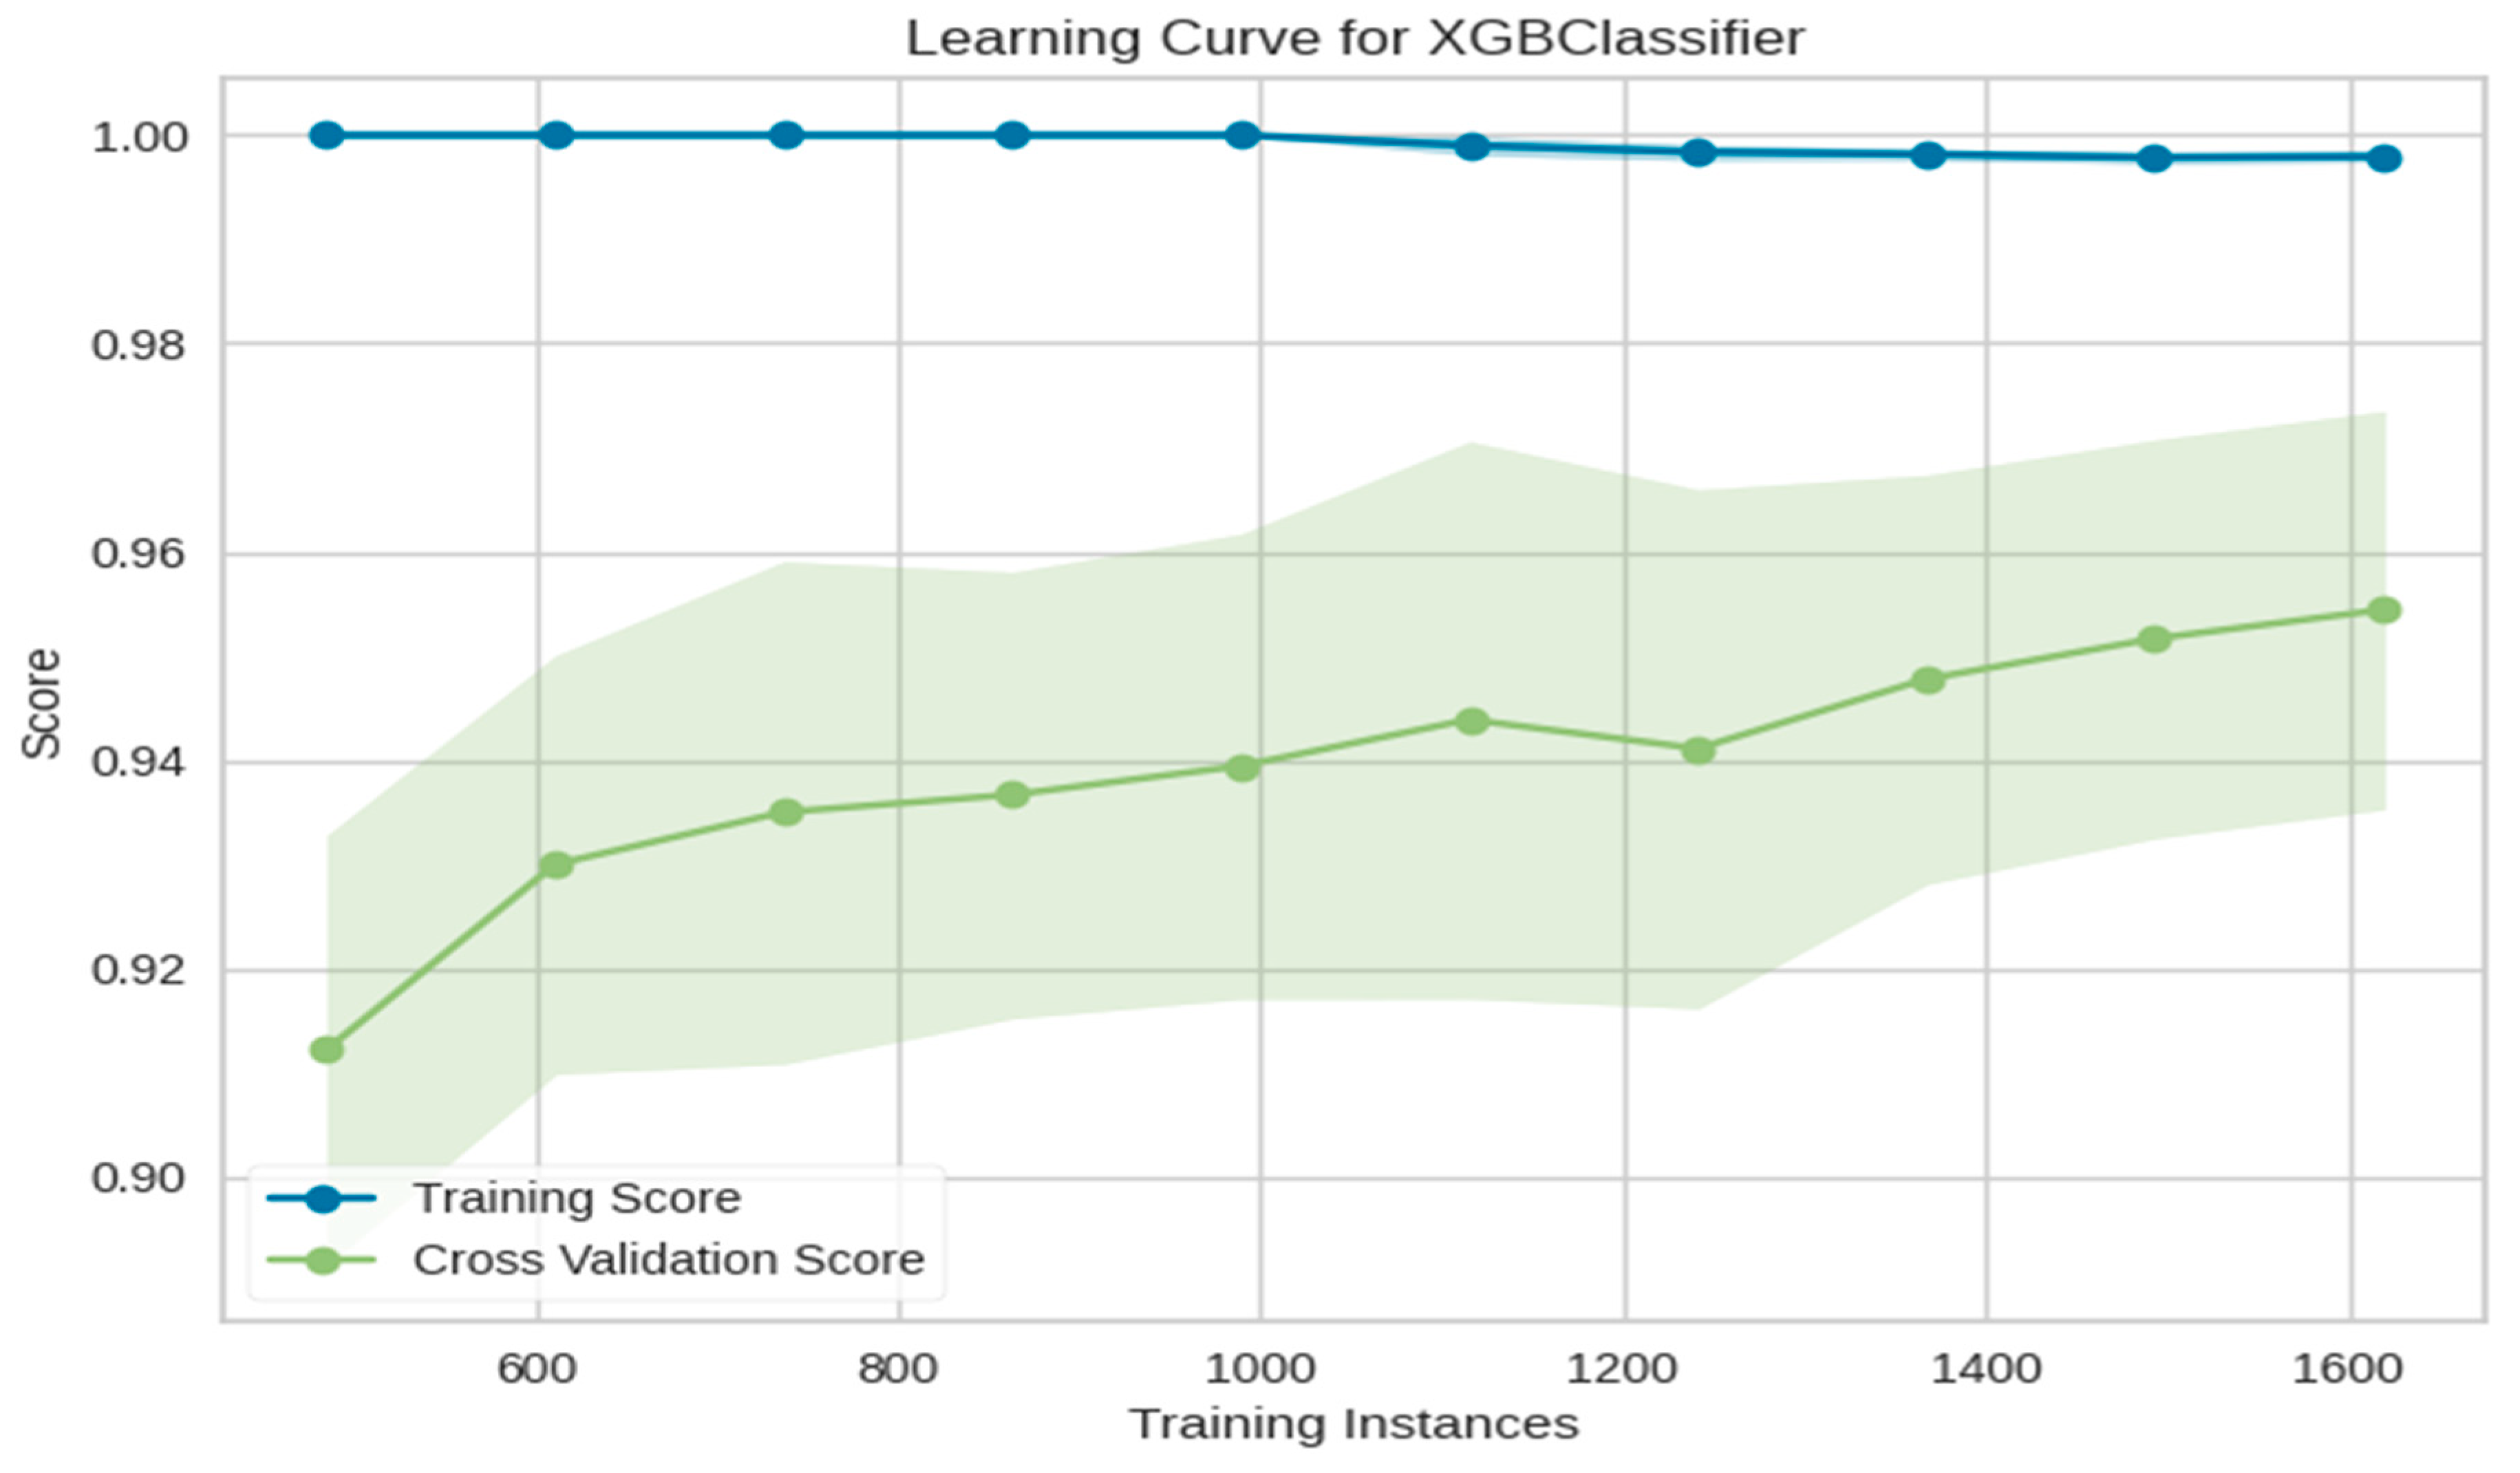
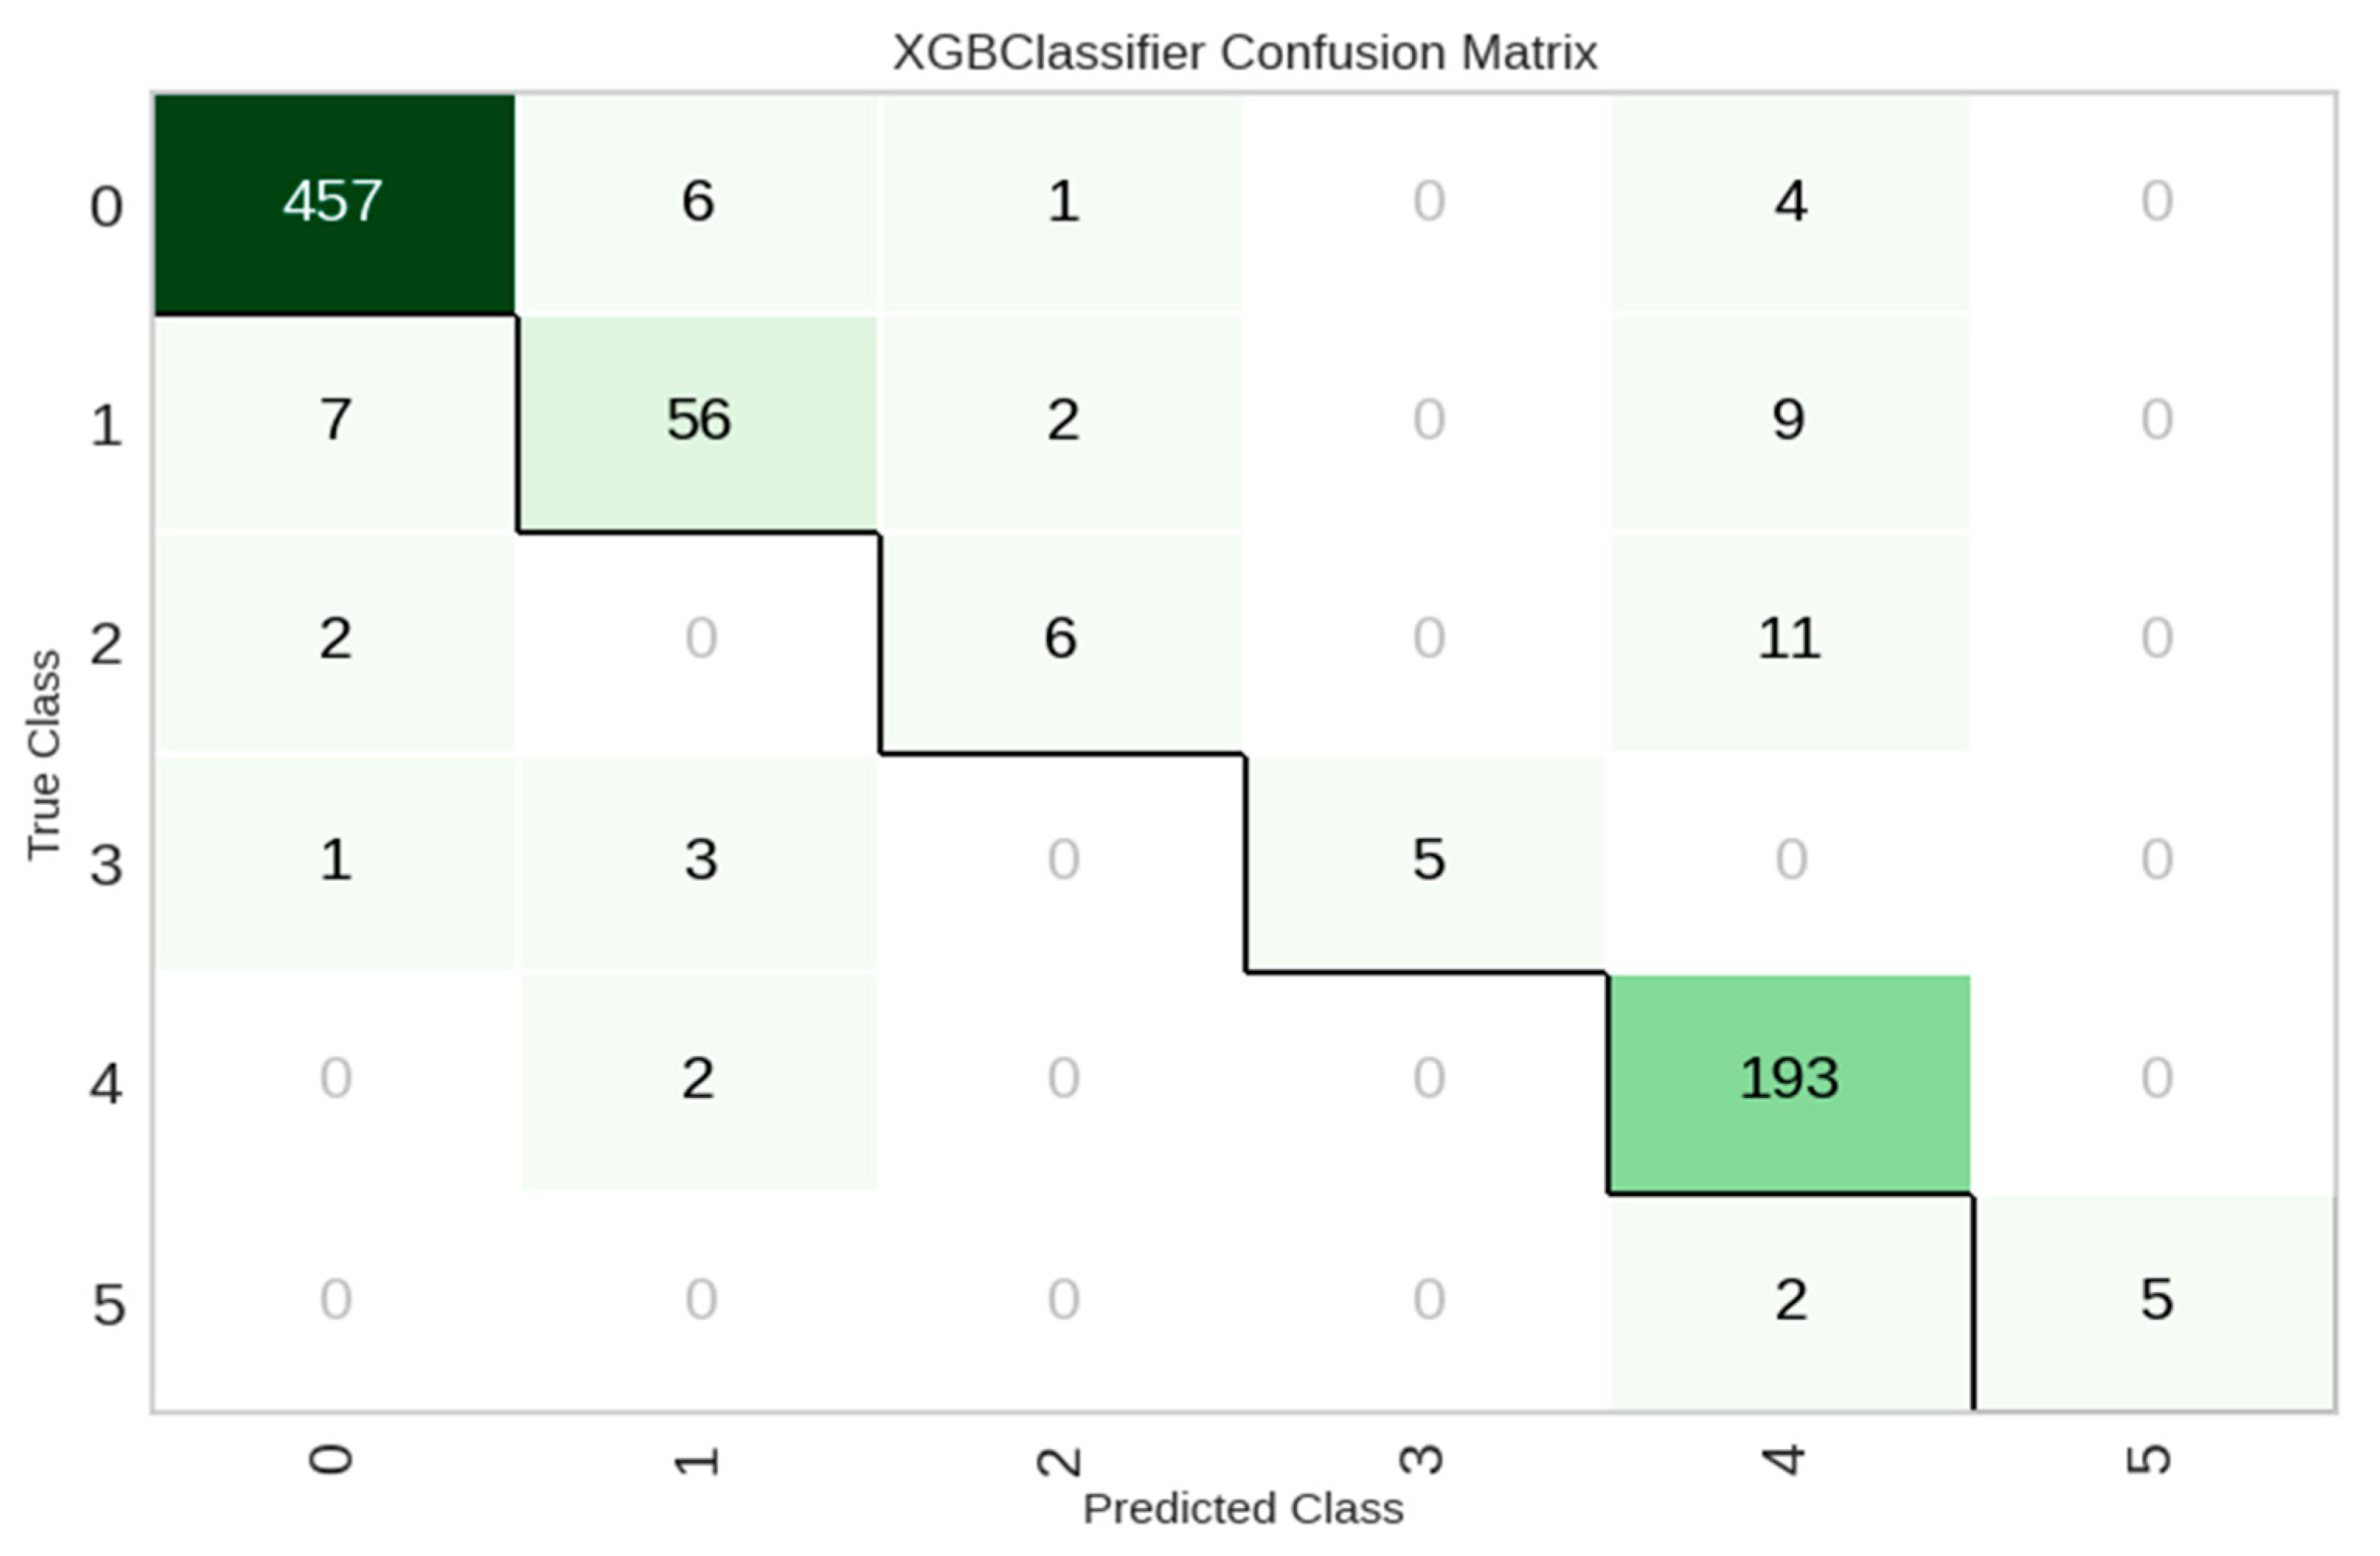
The learning curve in Figure 8 illustrates the performance of the XGBoost classifier on training and validation sets as the number of training instances increases. The training score remains consistently near 1.0, indicating a strong fit on the training data. The cross-validation score gradually improves with more data, reaching approximately 0.955, with a narrowing confidence interval, which suggests improved generalization. The gap between the training and validation curves indicates slight overfitting. However, the model still demonstrates robust generalization performance across folds. This result reinforces the suitability of XGBoost for classification tasks involving the selected audio features. The confusion matrix in Figure 9 summarizes the classification performance of the XGBoost model across six classes. The diagonal cells represent correctly classified instances, while off-diagonal cells indicate misclassifications. The model performs exceptionally well for Classes 0 and 4, correctly predicting 457 and 193 instances, respectively. Some misclassifications occur, particularly between Class 2 and Class 4, and between Classes 1 and 4, suggesting partial overlap in feature distributions among these classes. Despite these, the model achieves high accuracy with strong generalization, reinforcing the effectiveness of the selected features and the XGBoost classifier.
The results highlight that when paired with robust ensemble classifiers like XGBoost and LightGBM, ANOVA-selected features can deliver highly accurate and efficient emergency sound recognition. These models offer low latency and excellent predictive performance, making them ideal candidates for real-time audio-based decision support in Intelligent Transportation Systems.

5.1.3. Phase 1—Experiment 1: Performance Analysis of IVESD

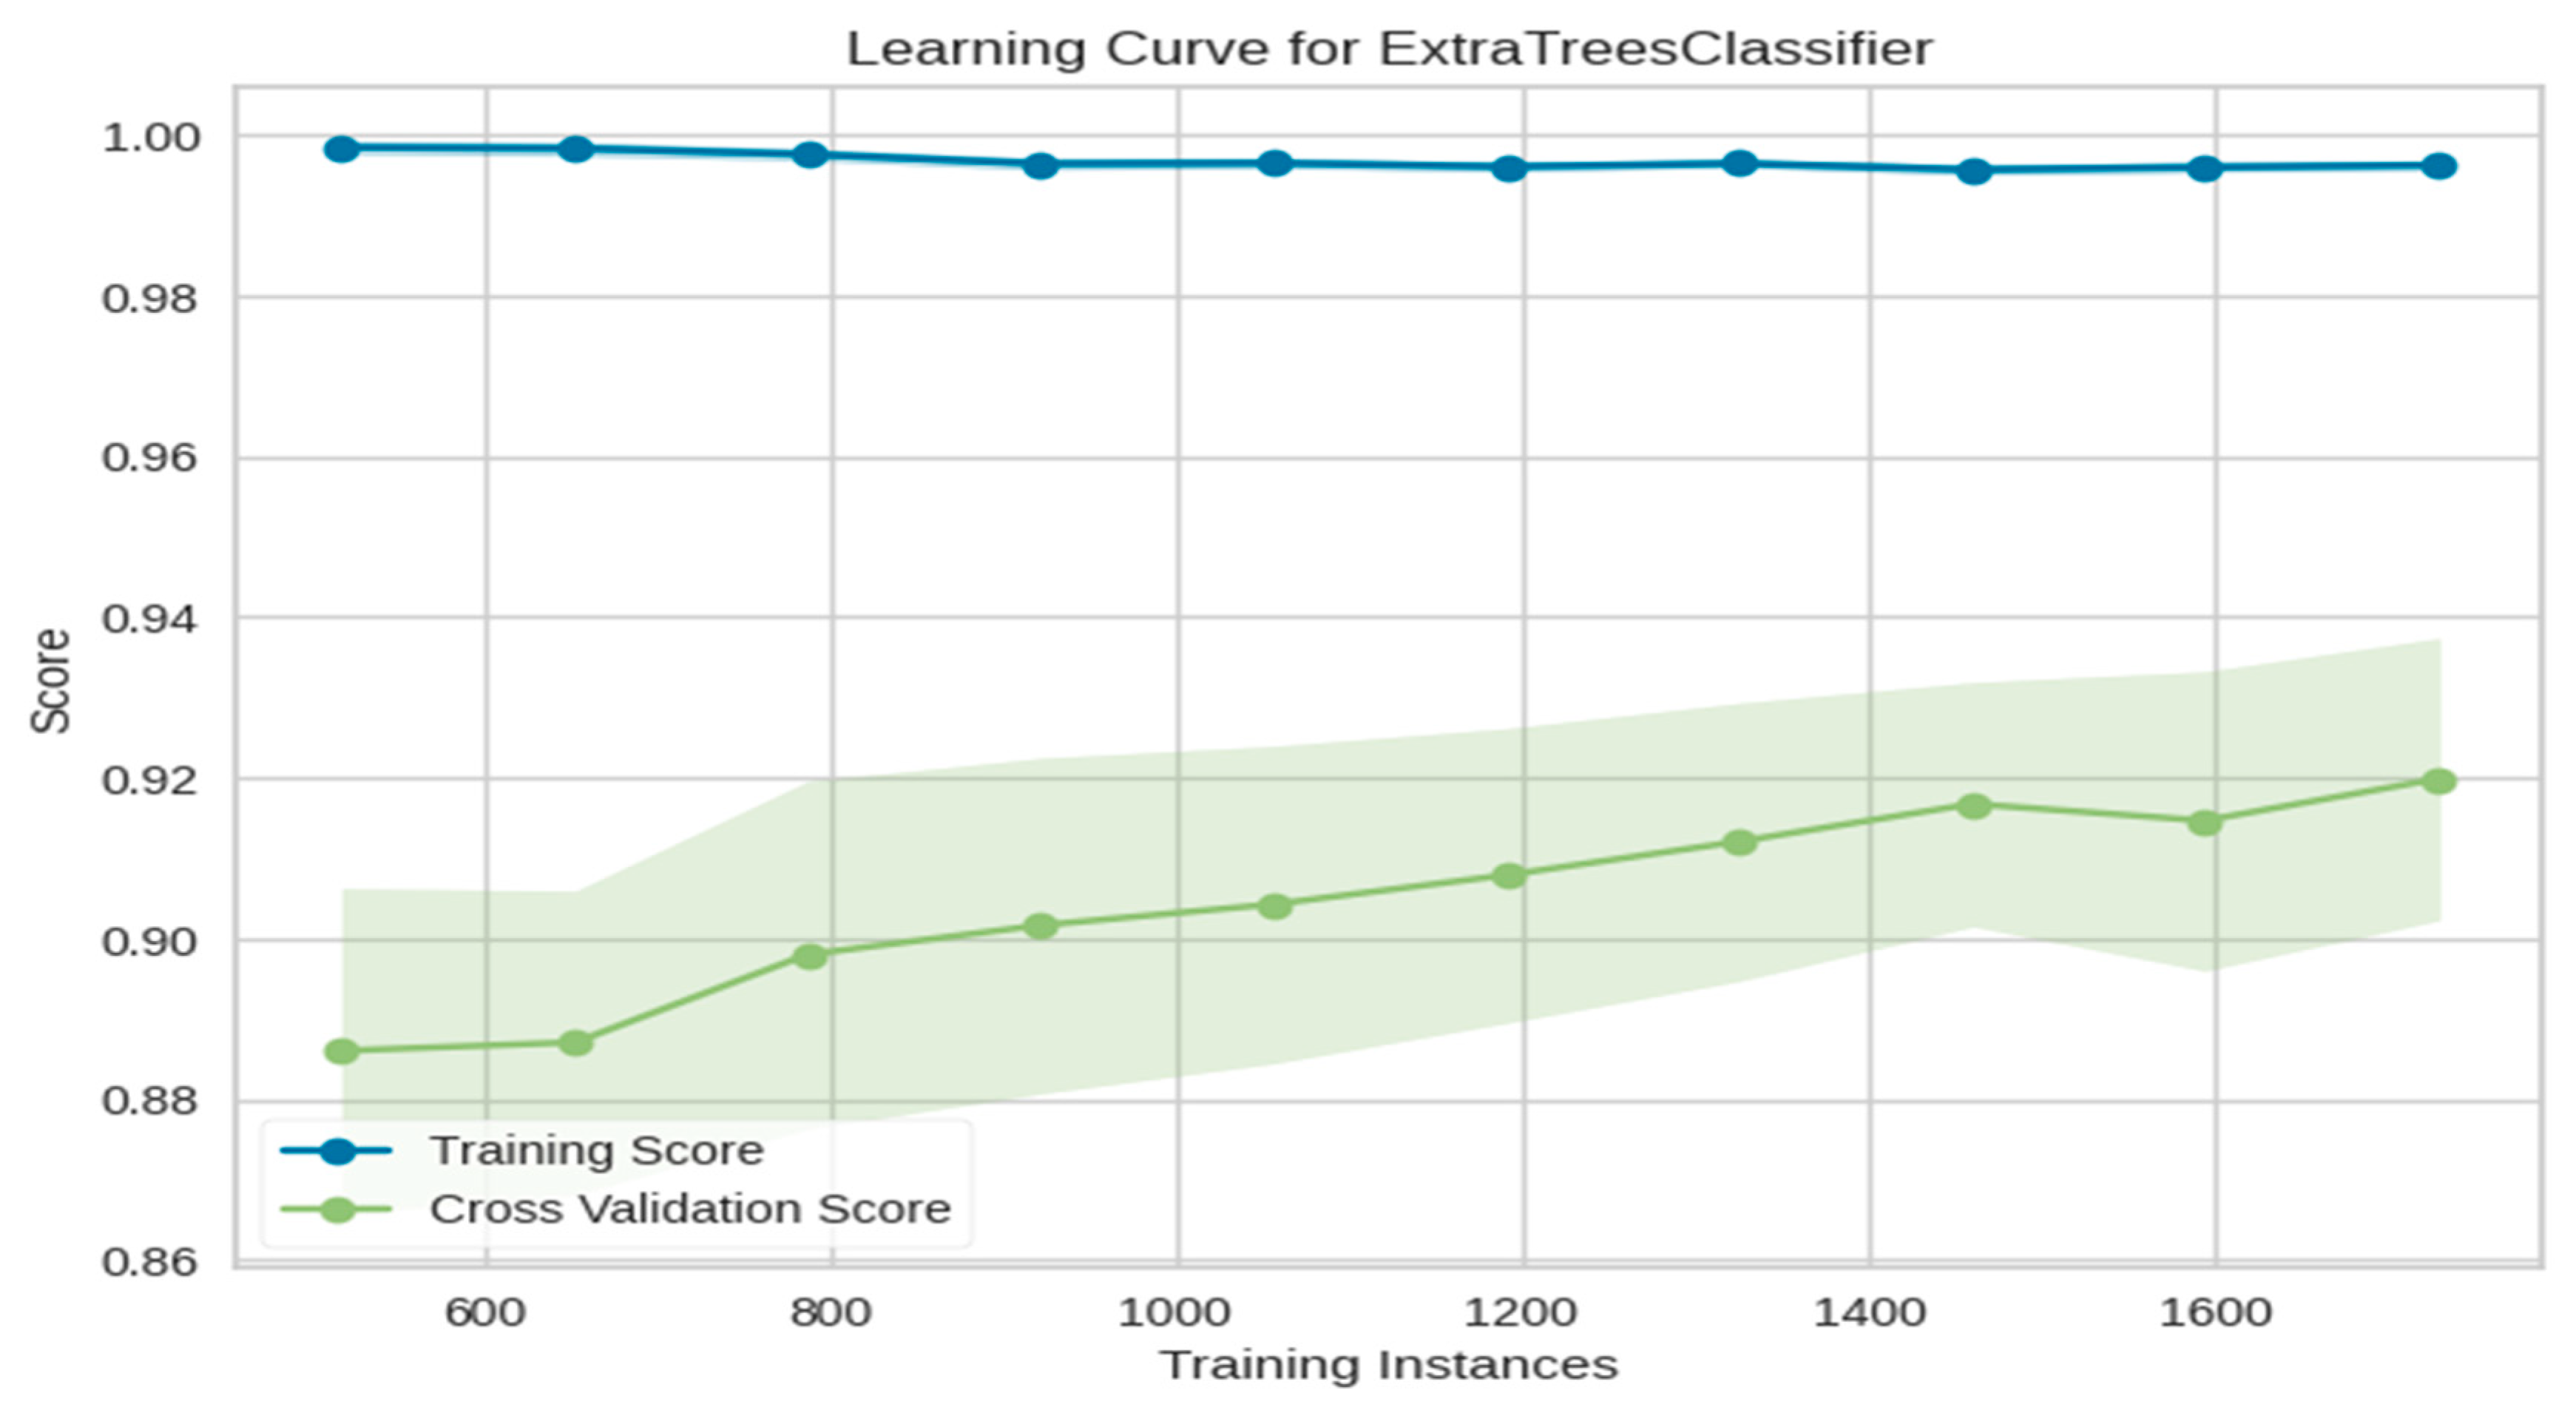
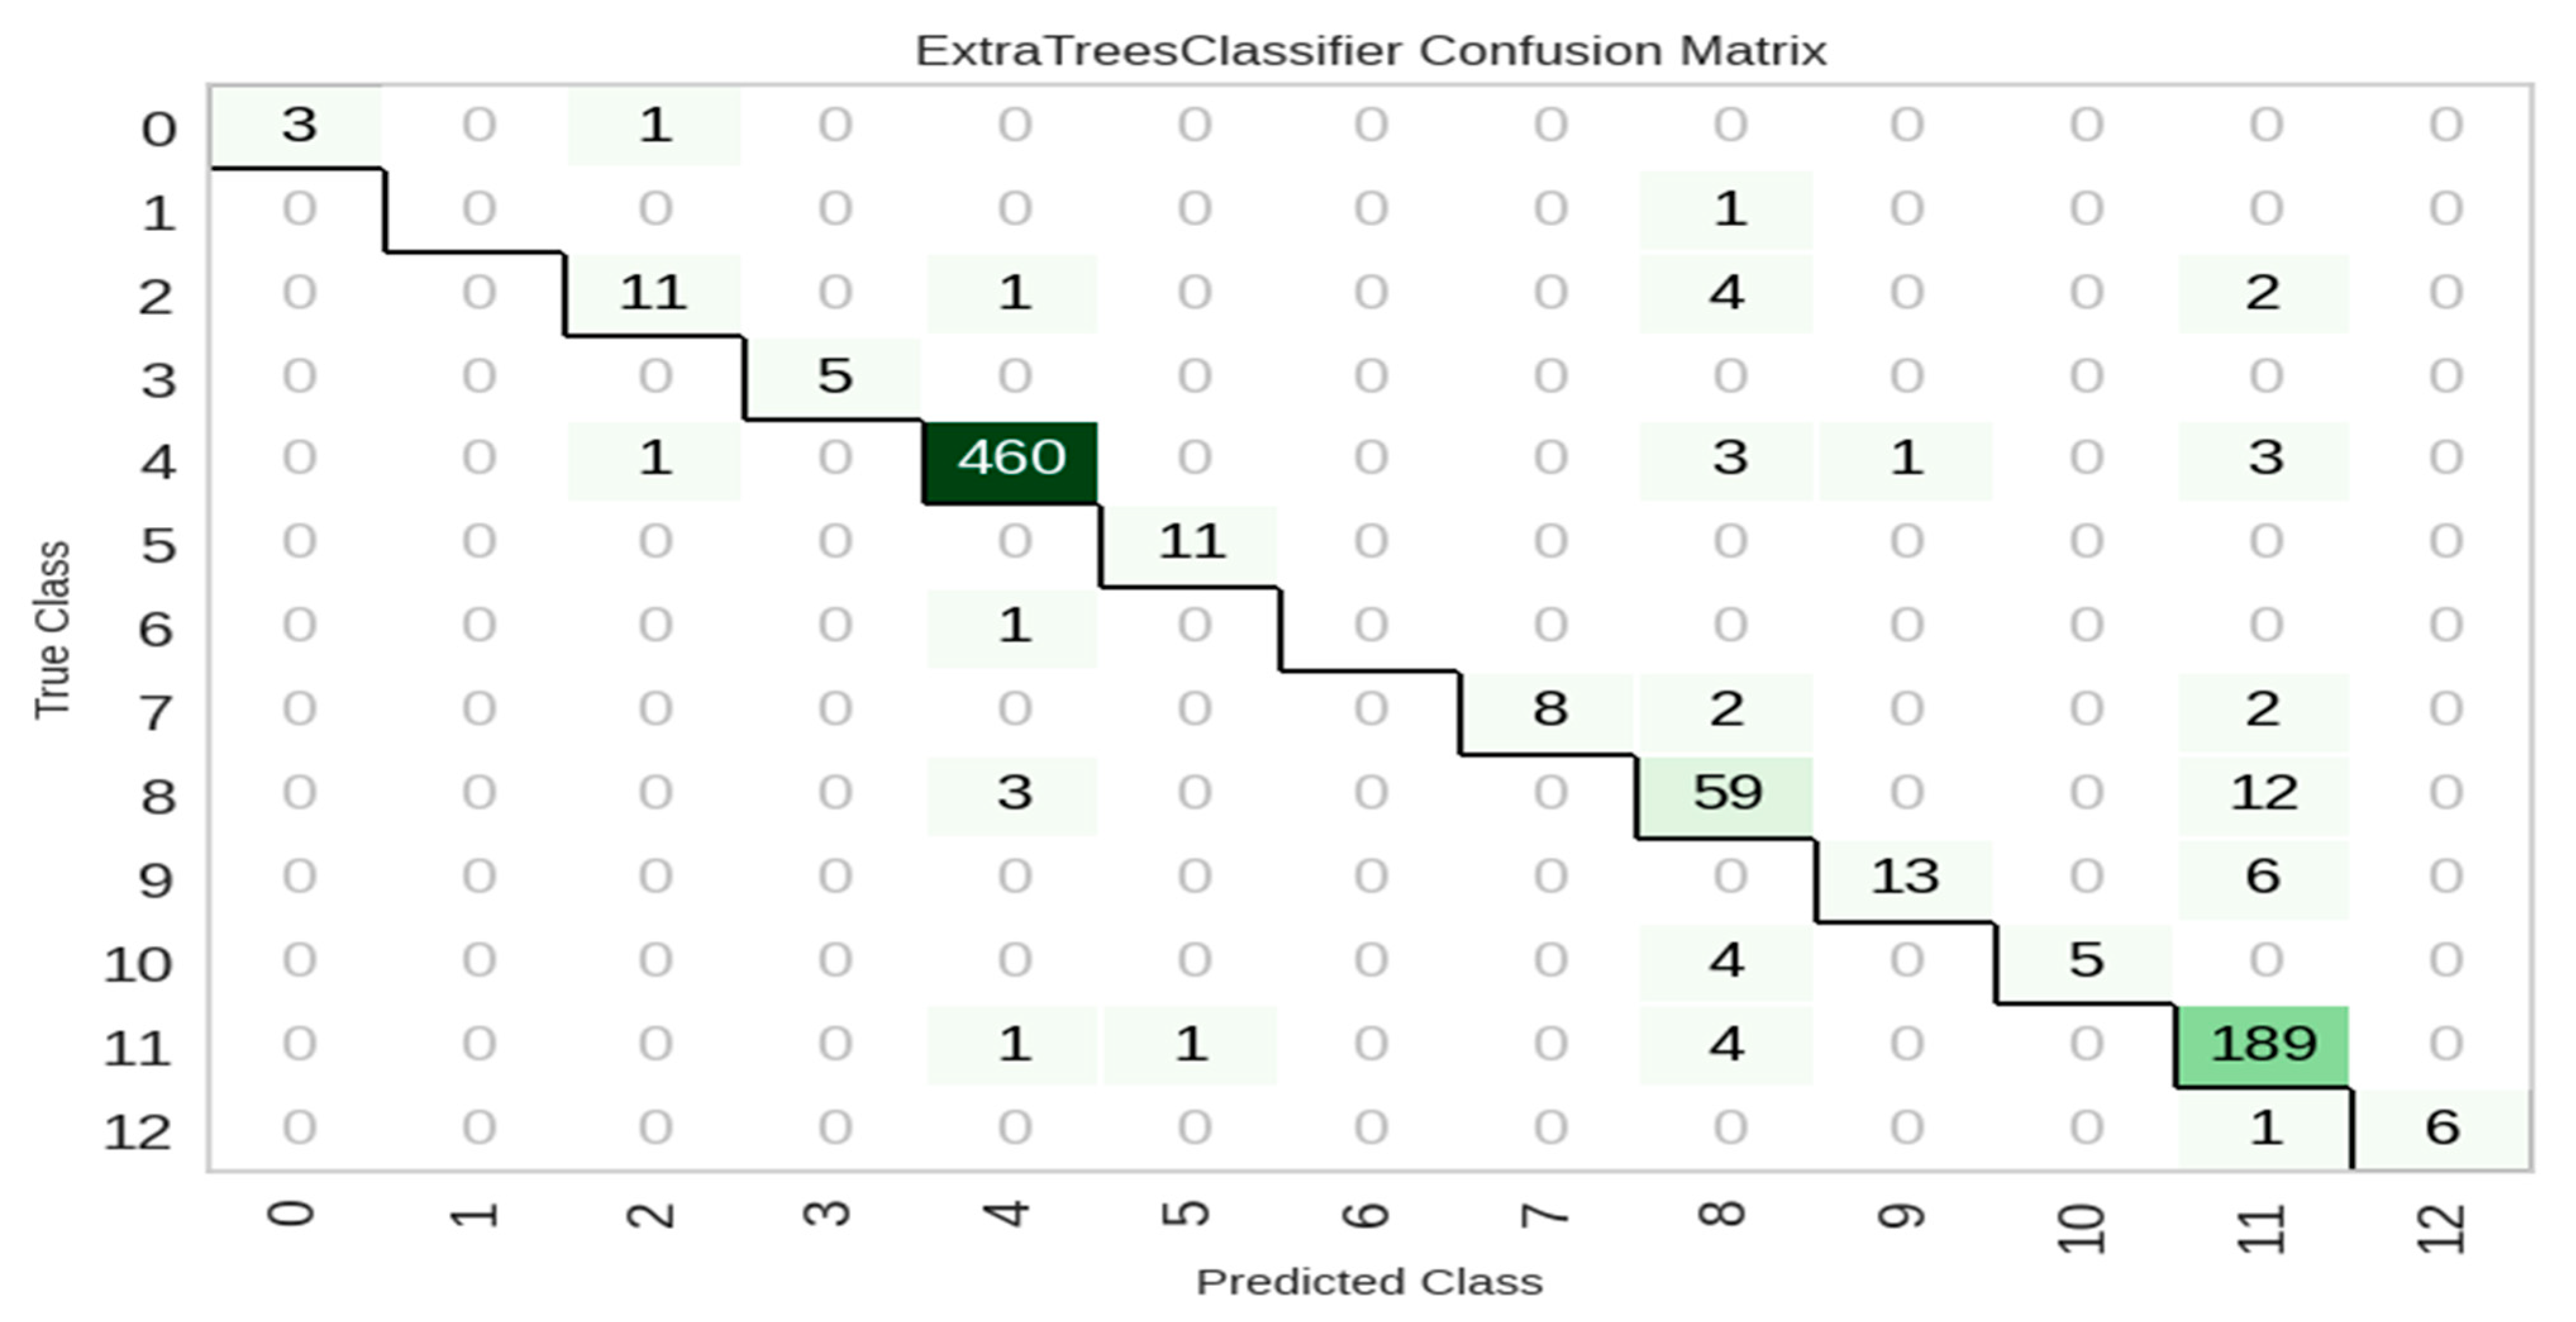
To assess the model’s ability to handle complex acoustic environments, IVESD was constructed by combining vehicle fault sounds and emergency sound events. The classification results, based on ANOVA feature selection with 31 top-ranked features, are summarized in Table 7, while corresponding learning and confusion trends are depicted in Figure 10 and Figure 11, respectively. The Extra Trees Classifier achieved the highest accuracy of 92.66%, along with strong scores in precision (92.65%), recall (92.66%), and F1-score (92.04%), indicating well-balanced and robust predictions across mixed sound categories.
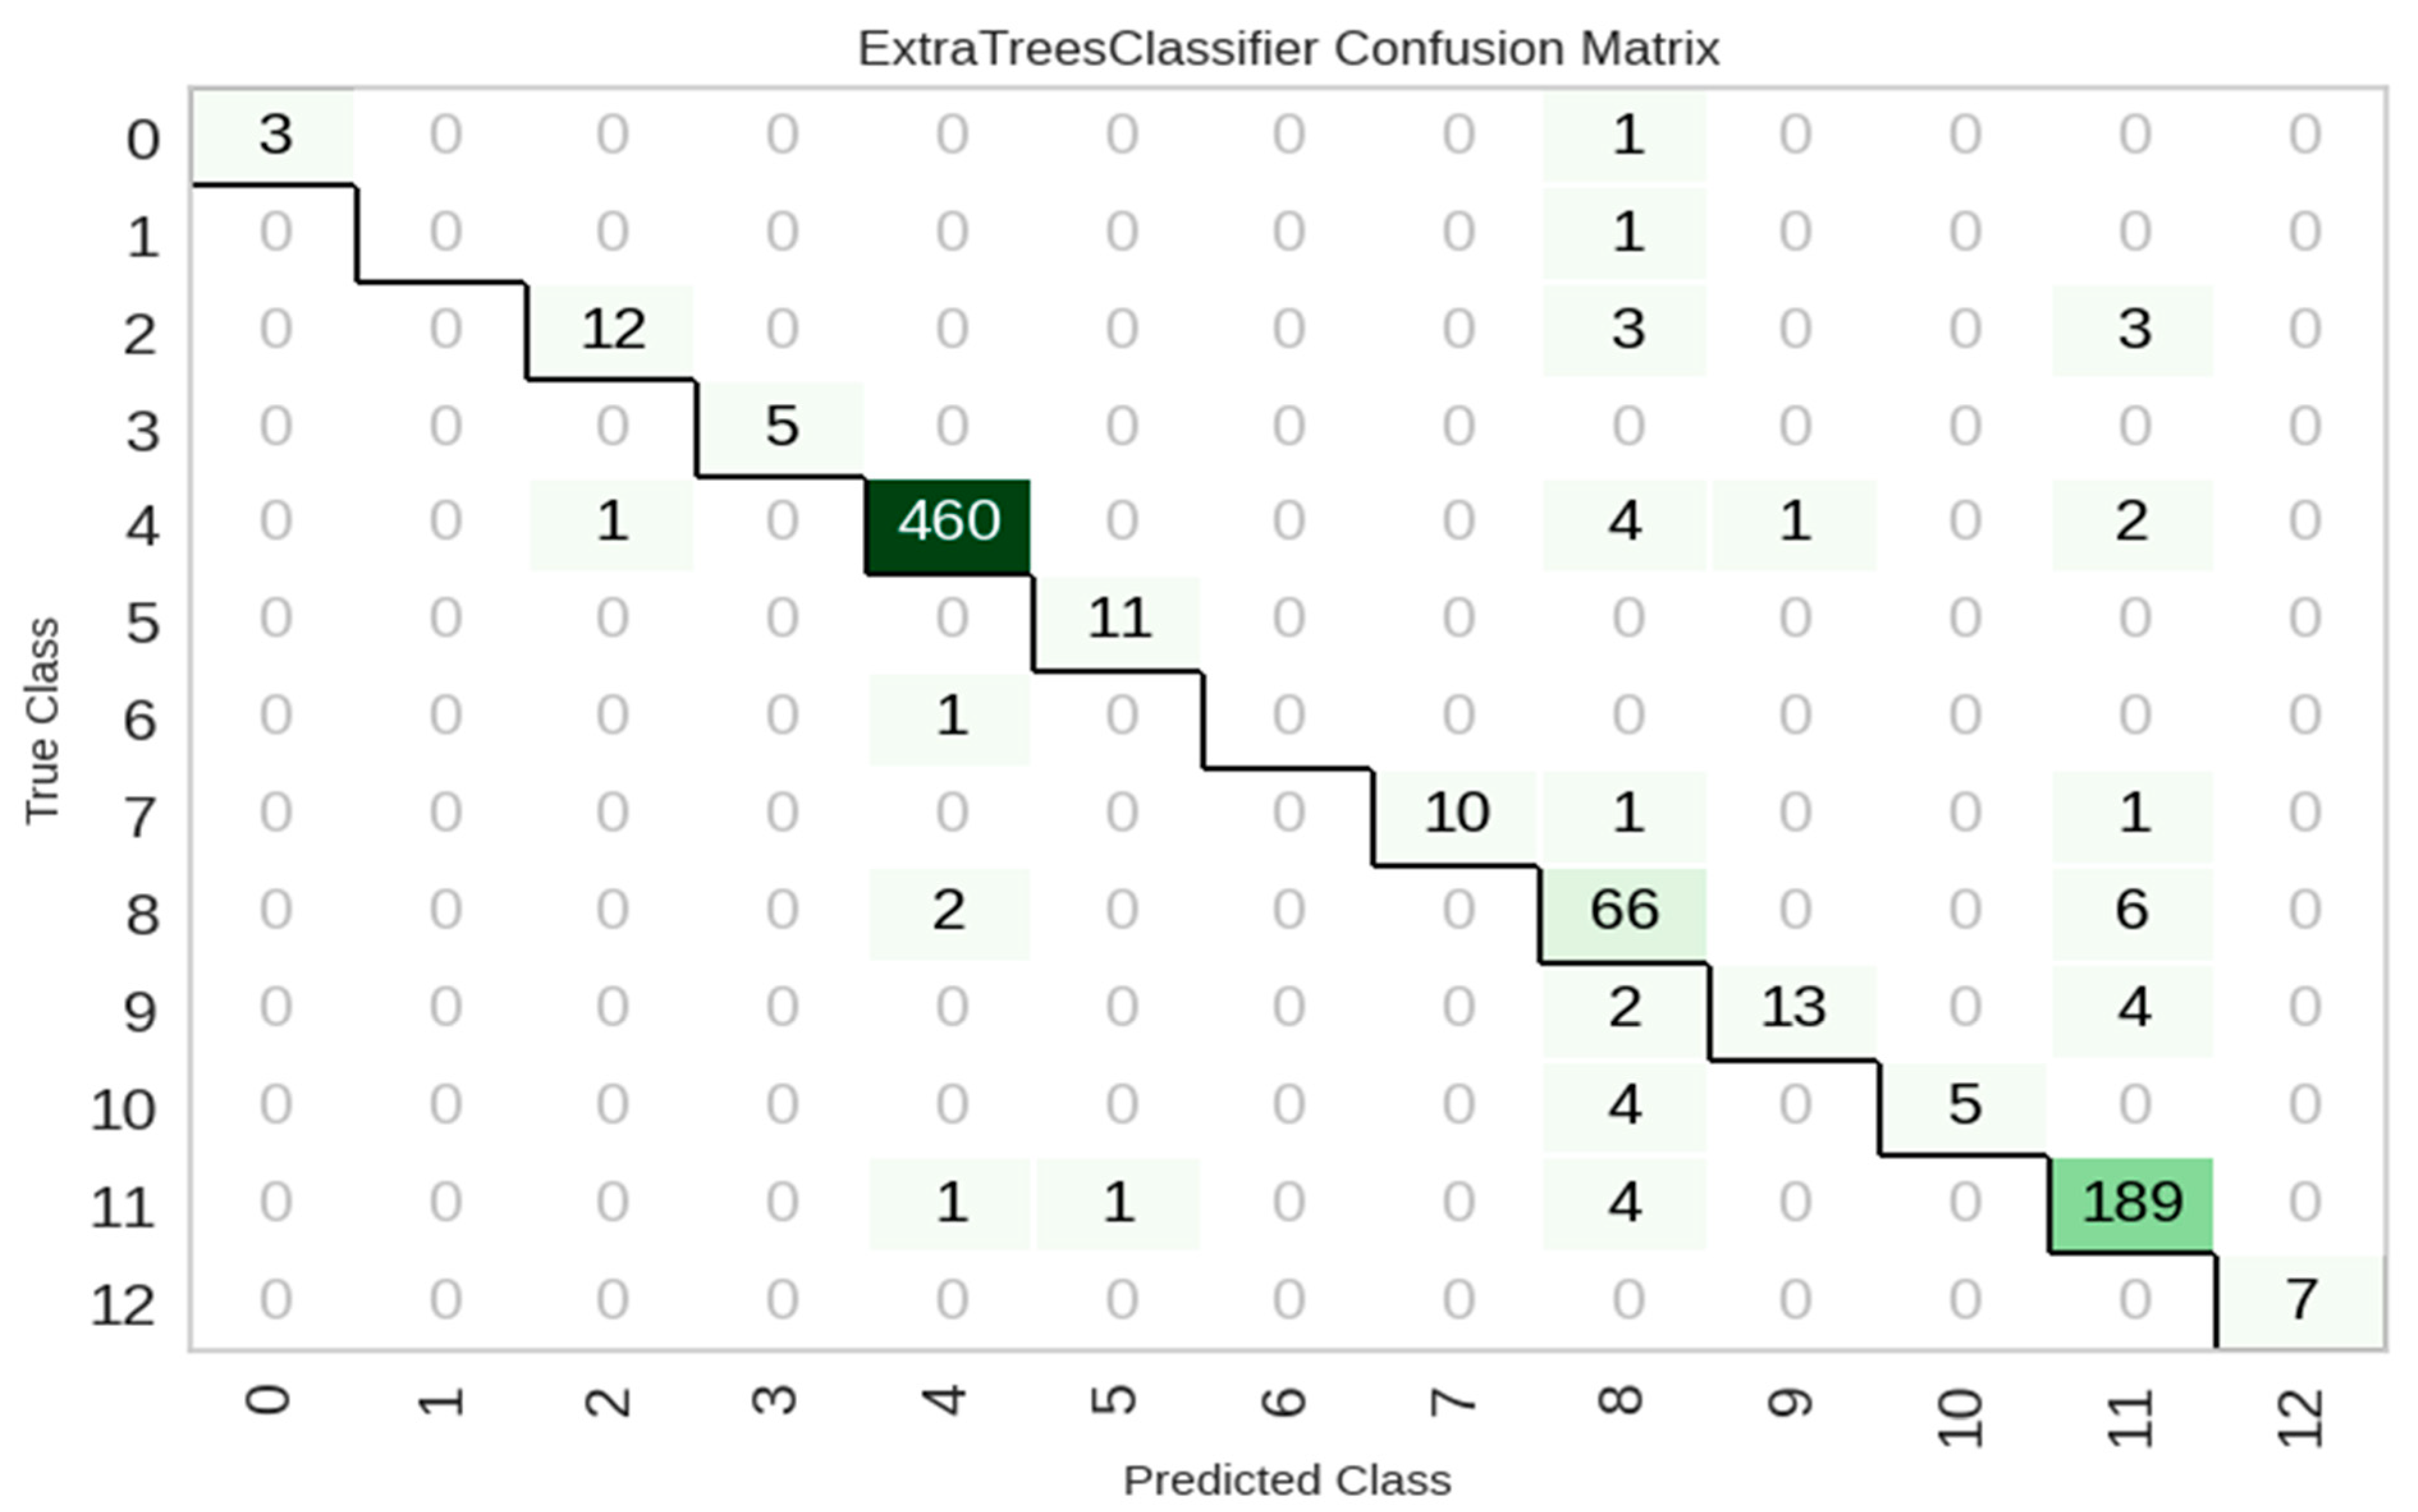
These performance values also translated into a Matthews Correlation Coefficient (MCC) of 0.8800 and a Kappa score of 0.8791, reflecting excellent agreement between predicted and actual classes. Compared to other ensemble models such as LightGBM (92.45%) and XGBoost (91.83%), Extra Trees showed superior generalization with moderate training time (0.384 s), making it highly suitable for real-time applications. Traditional classifiers such as Logistic Regression and Naïve Bayes exhibited notably lower performance, reinforcing the advantage of tree-based models in capturing non-linear and high-dimensional audio patterns. The learning curve for Extra Trees Classifier in Figure 10 reveals consistently high training performance (~99.9%) and a steadily improving cross-validation score, suggesting the model benefits from larger training sets without overfitting. This demonstrates that the model generalizes well even as data complexity increases. The confusion matrix in Figure 11 shows strong diagonal dominance, particularly in major classes such as class 4 (460 correct predictions) and class 11 (189 correct predictions). A few misclassifications were noted among acoustically similar classes, such as 8 and 9, but the errors remained marginal. This highlights the classifier’s capability to differentiate between a broad spectrum of vehicle faults and emergency scenarios.

5.2. Phase 1—Experiment 2: Feature Selection Evaluation: Accuracy vs. Number of Selected Features

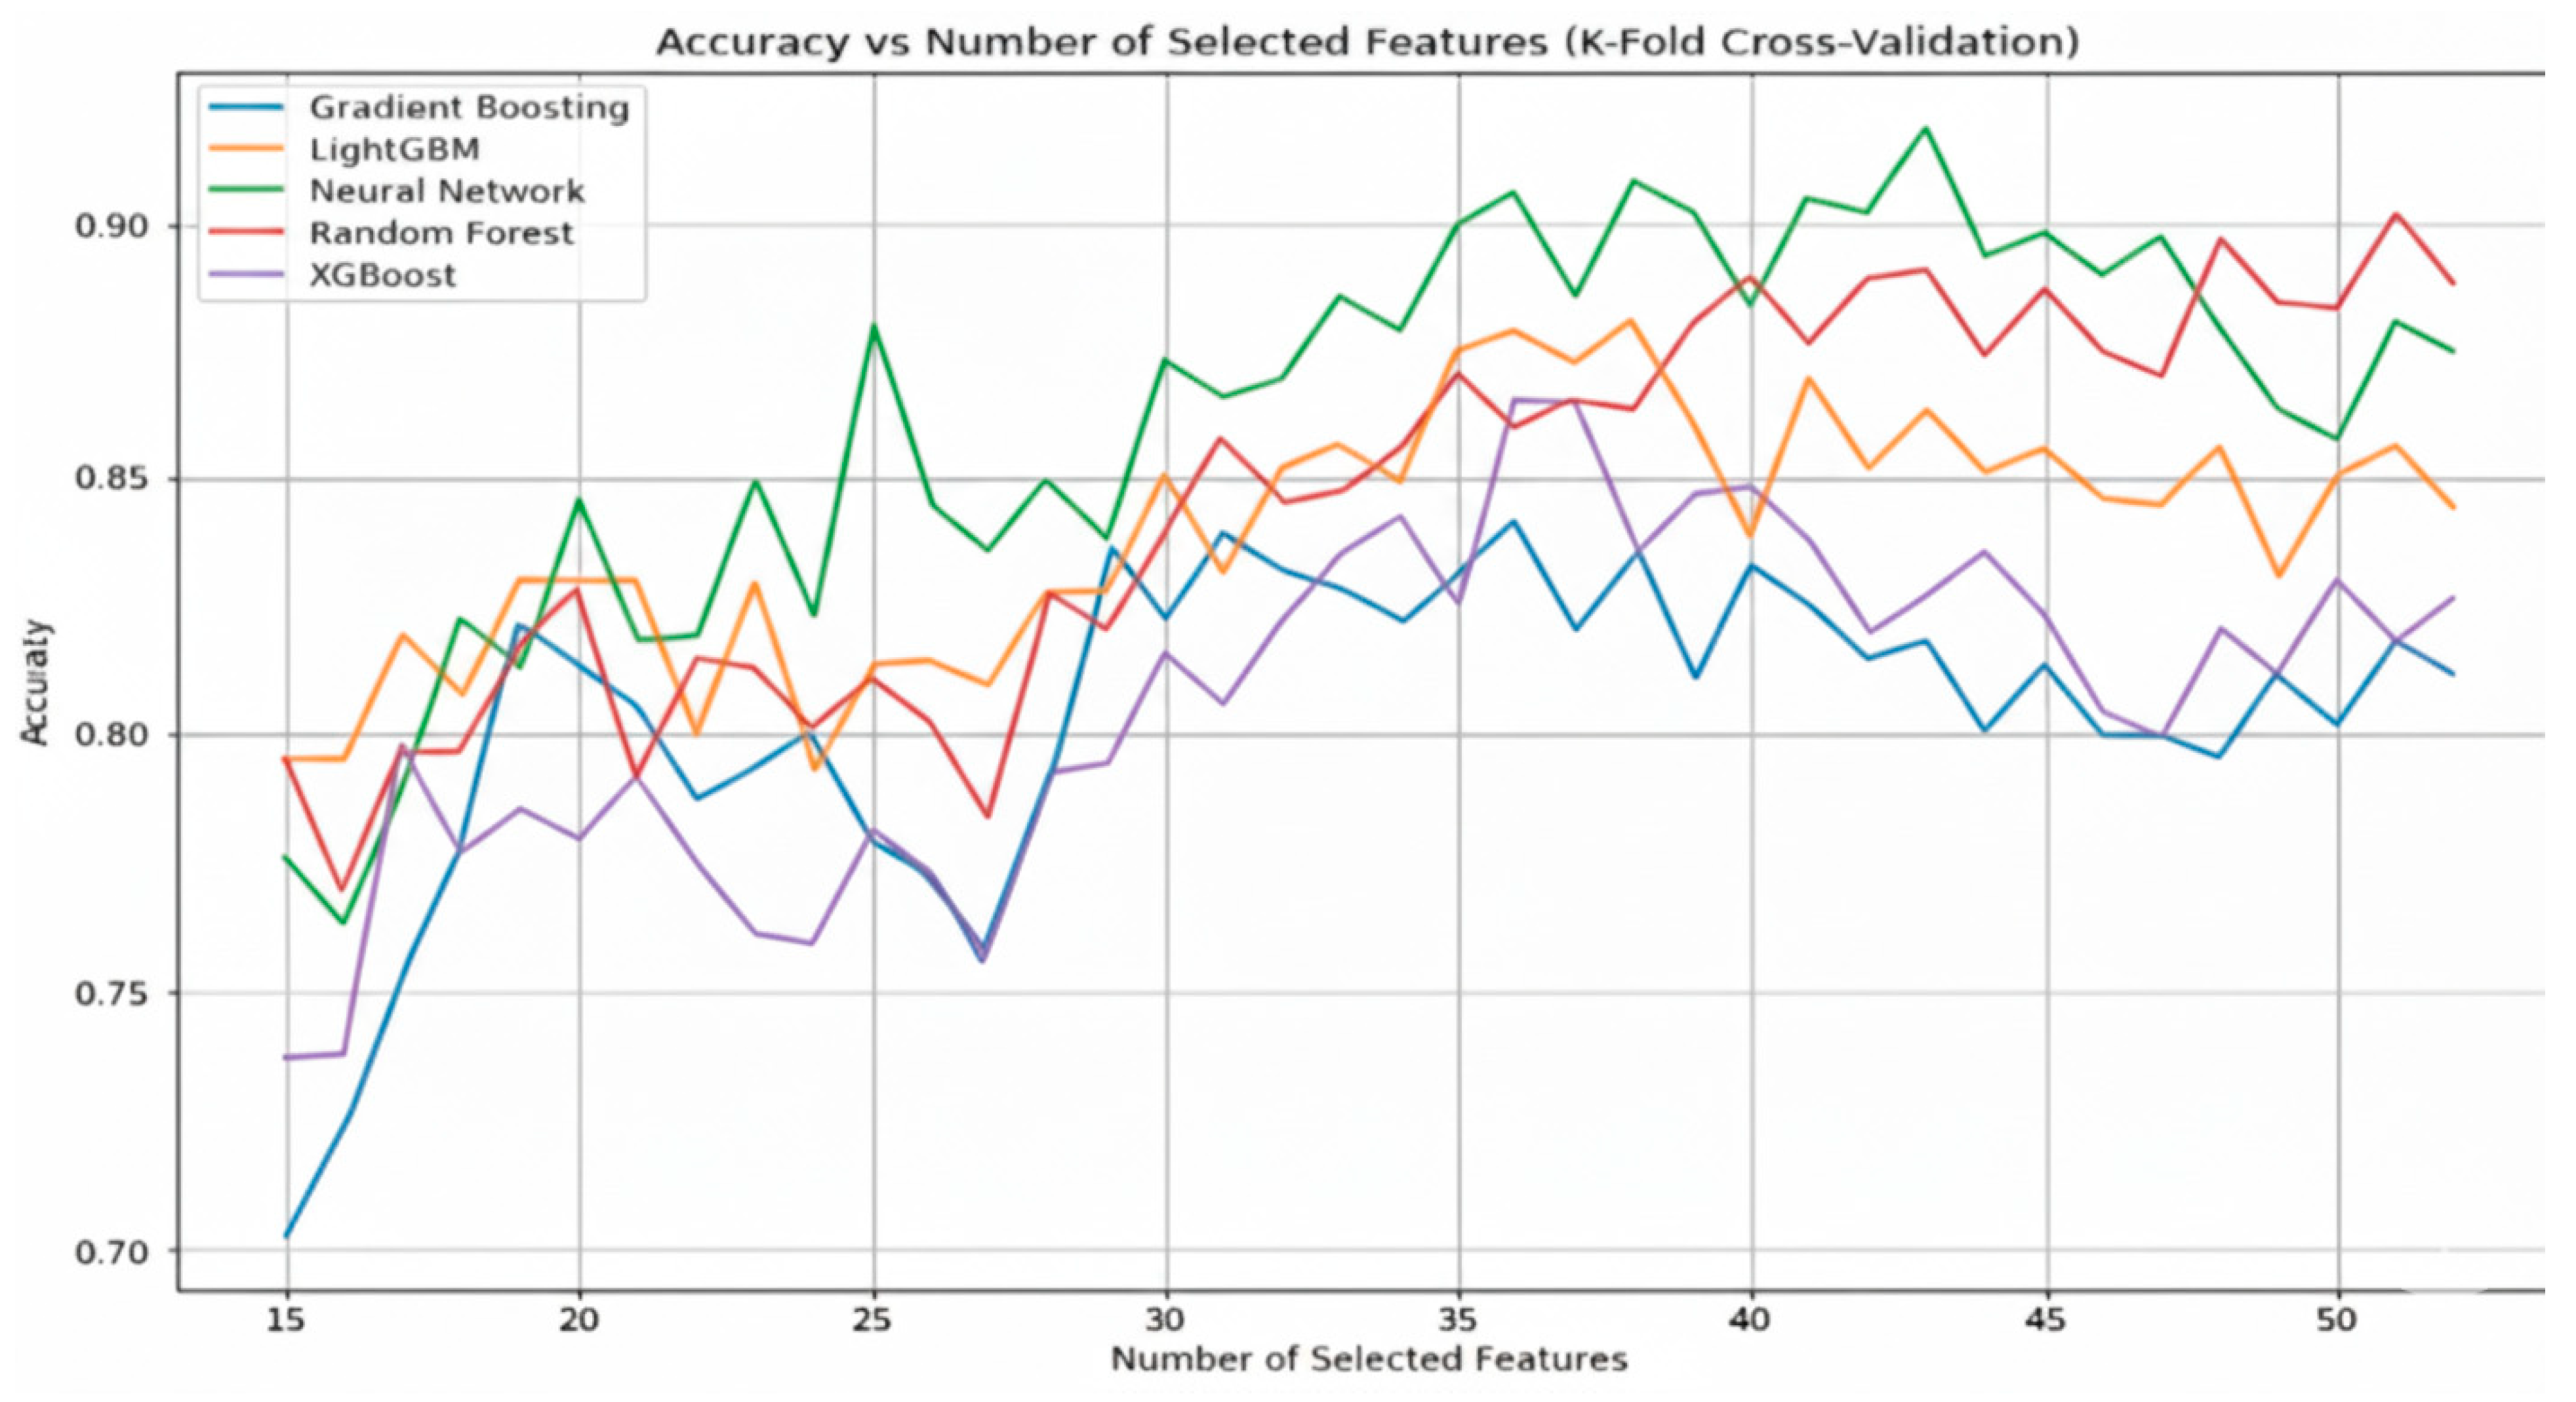
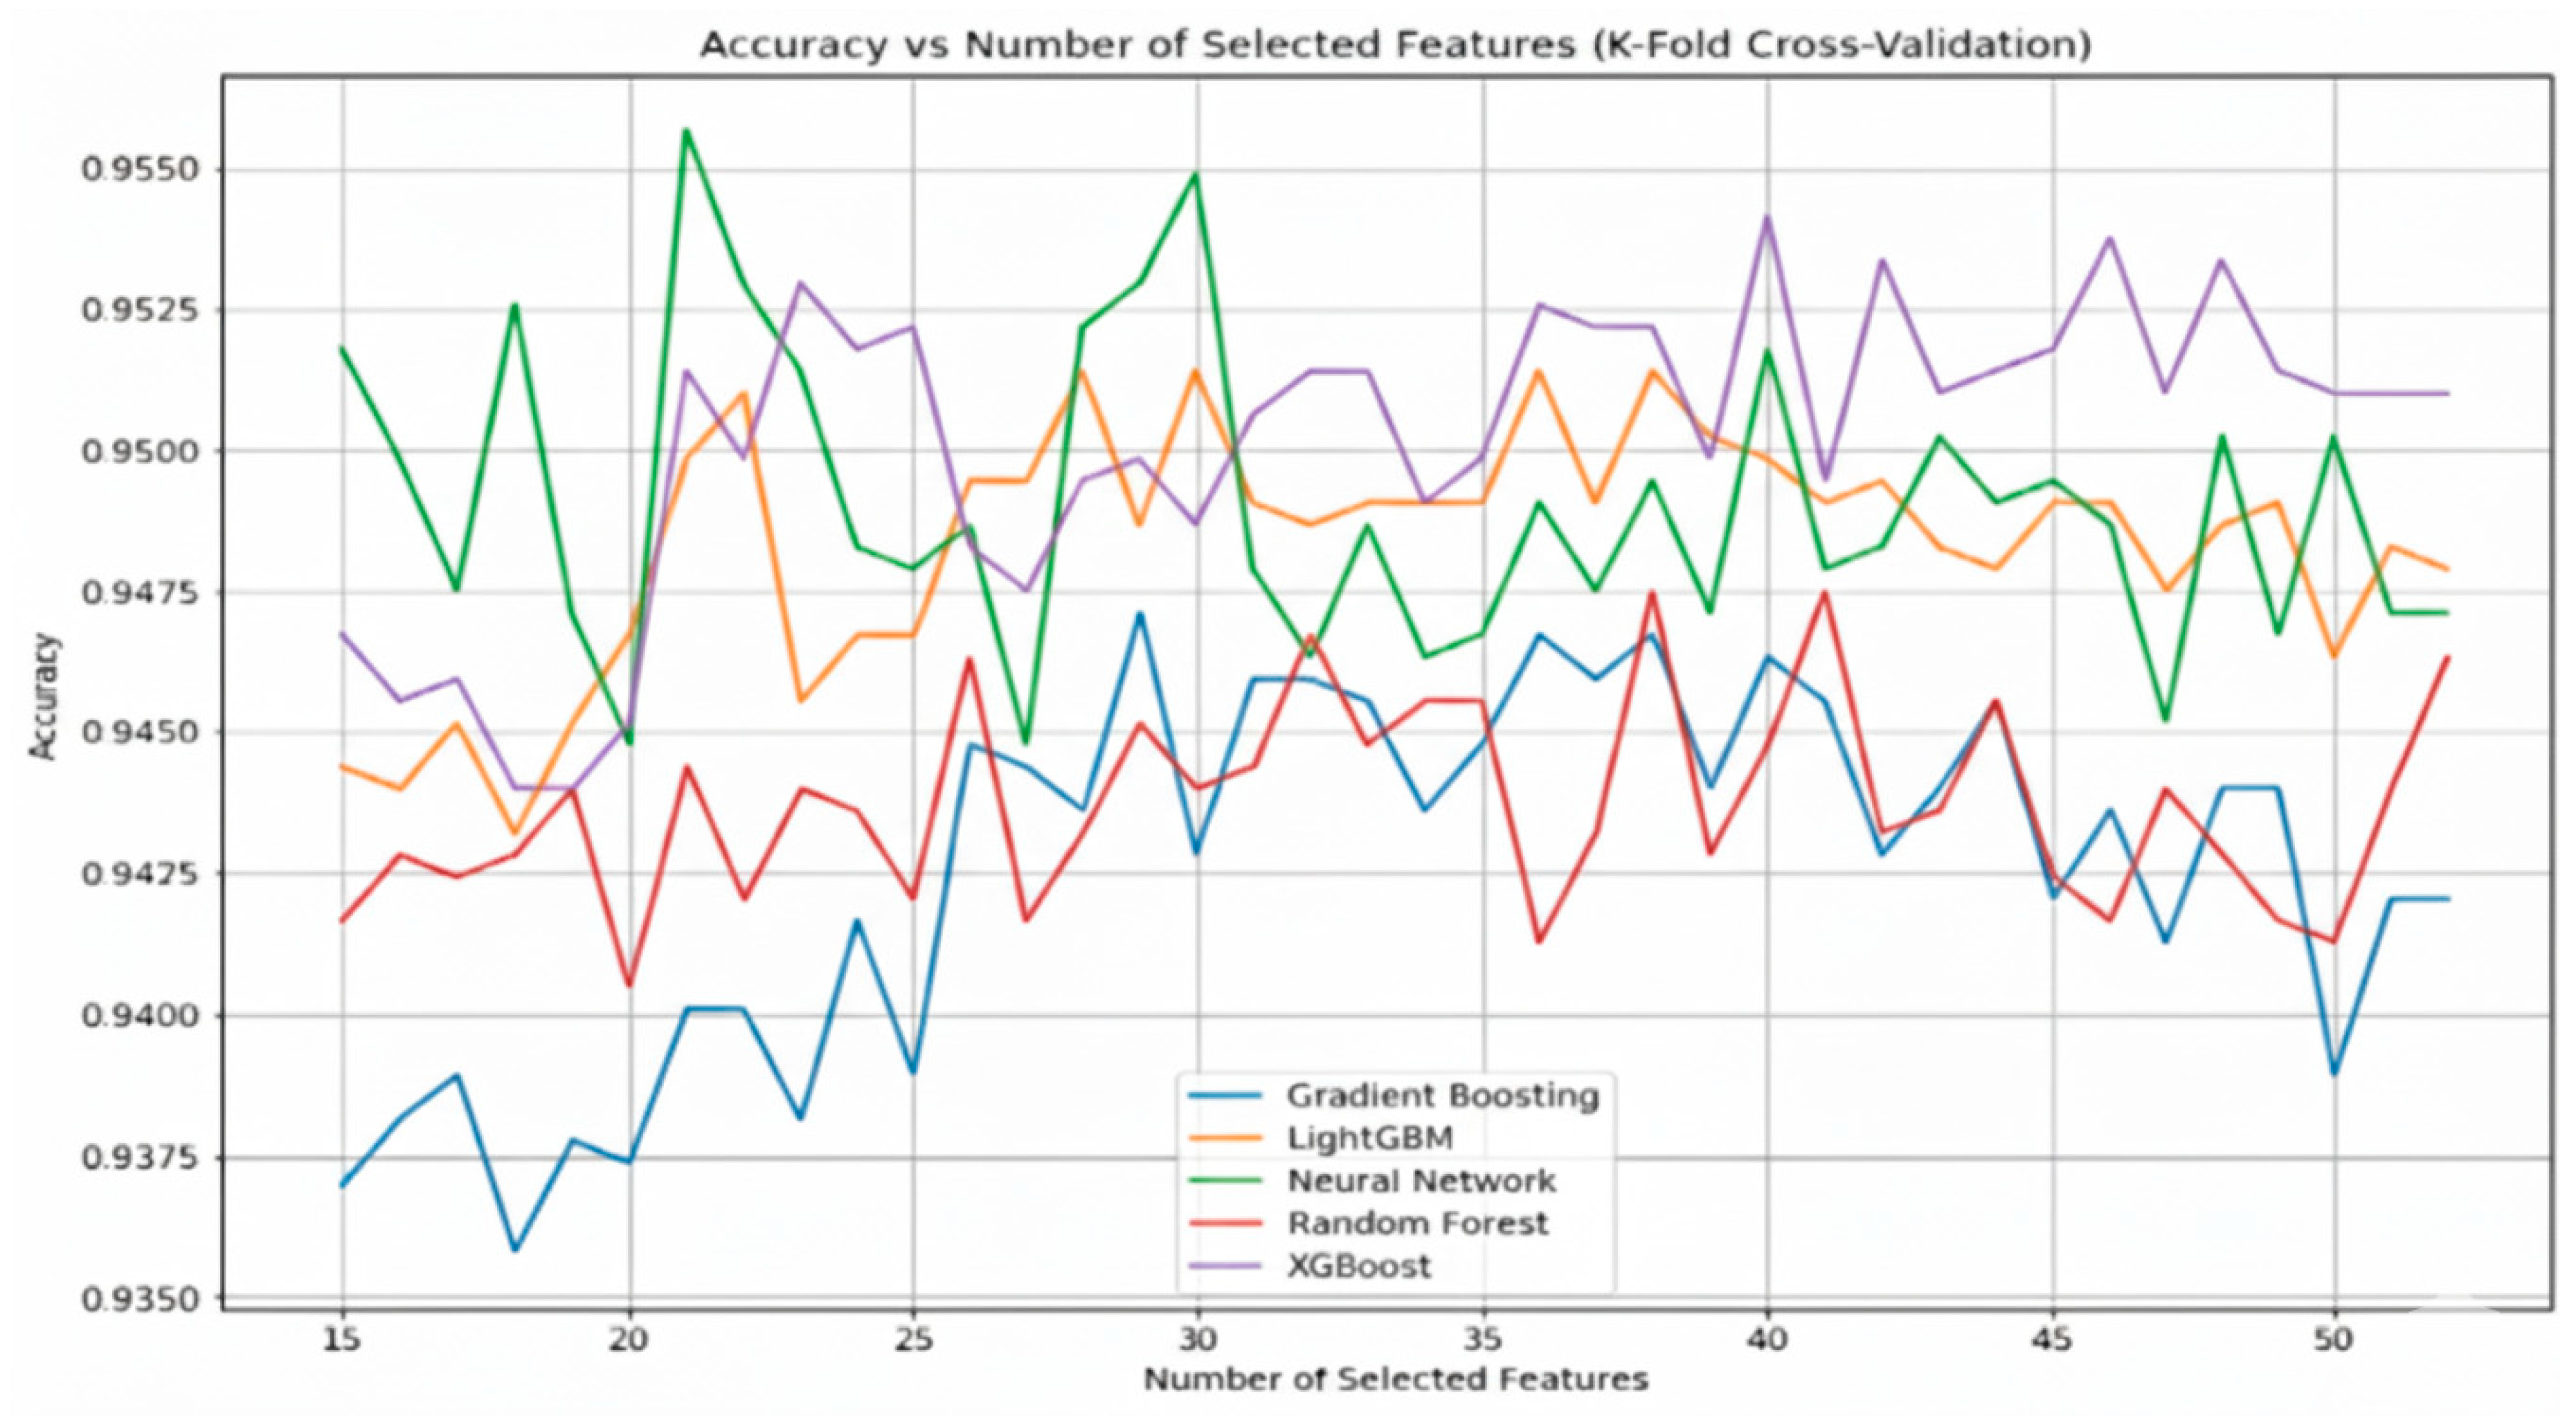
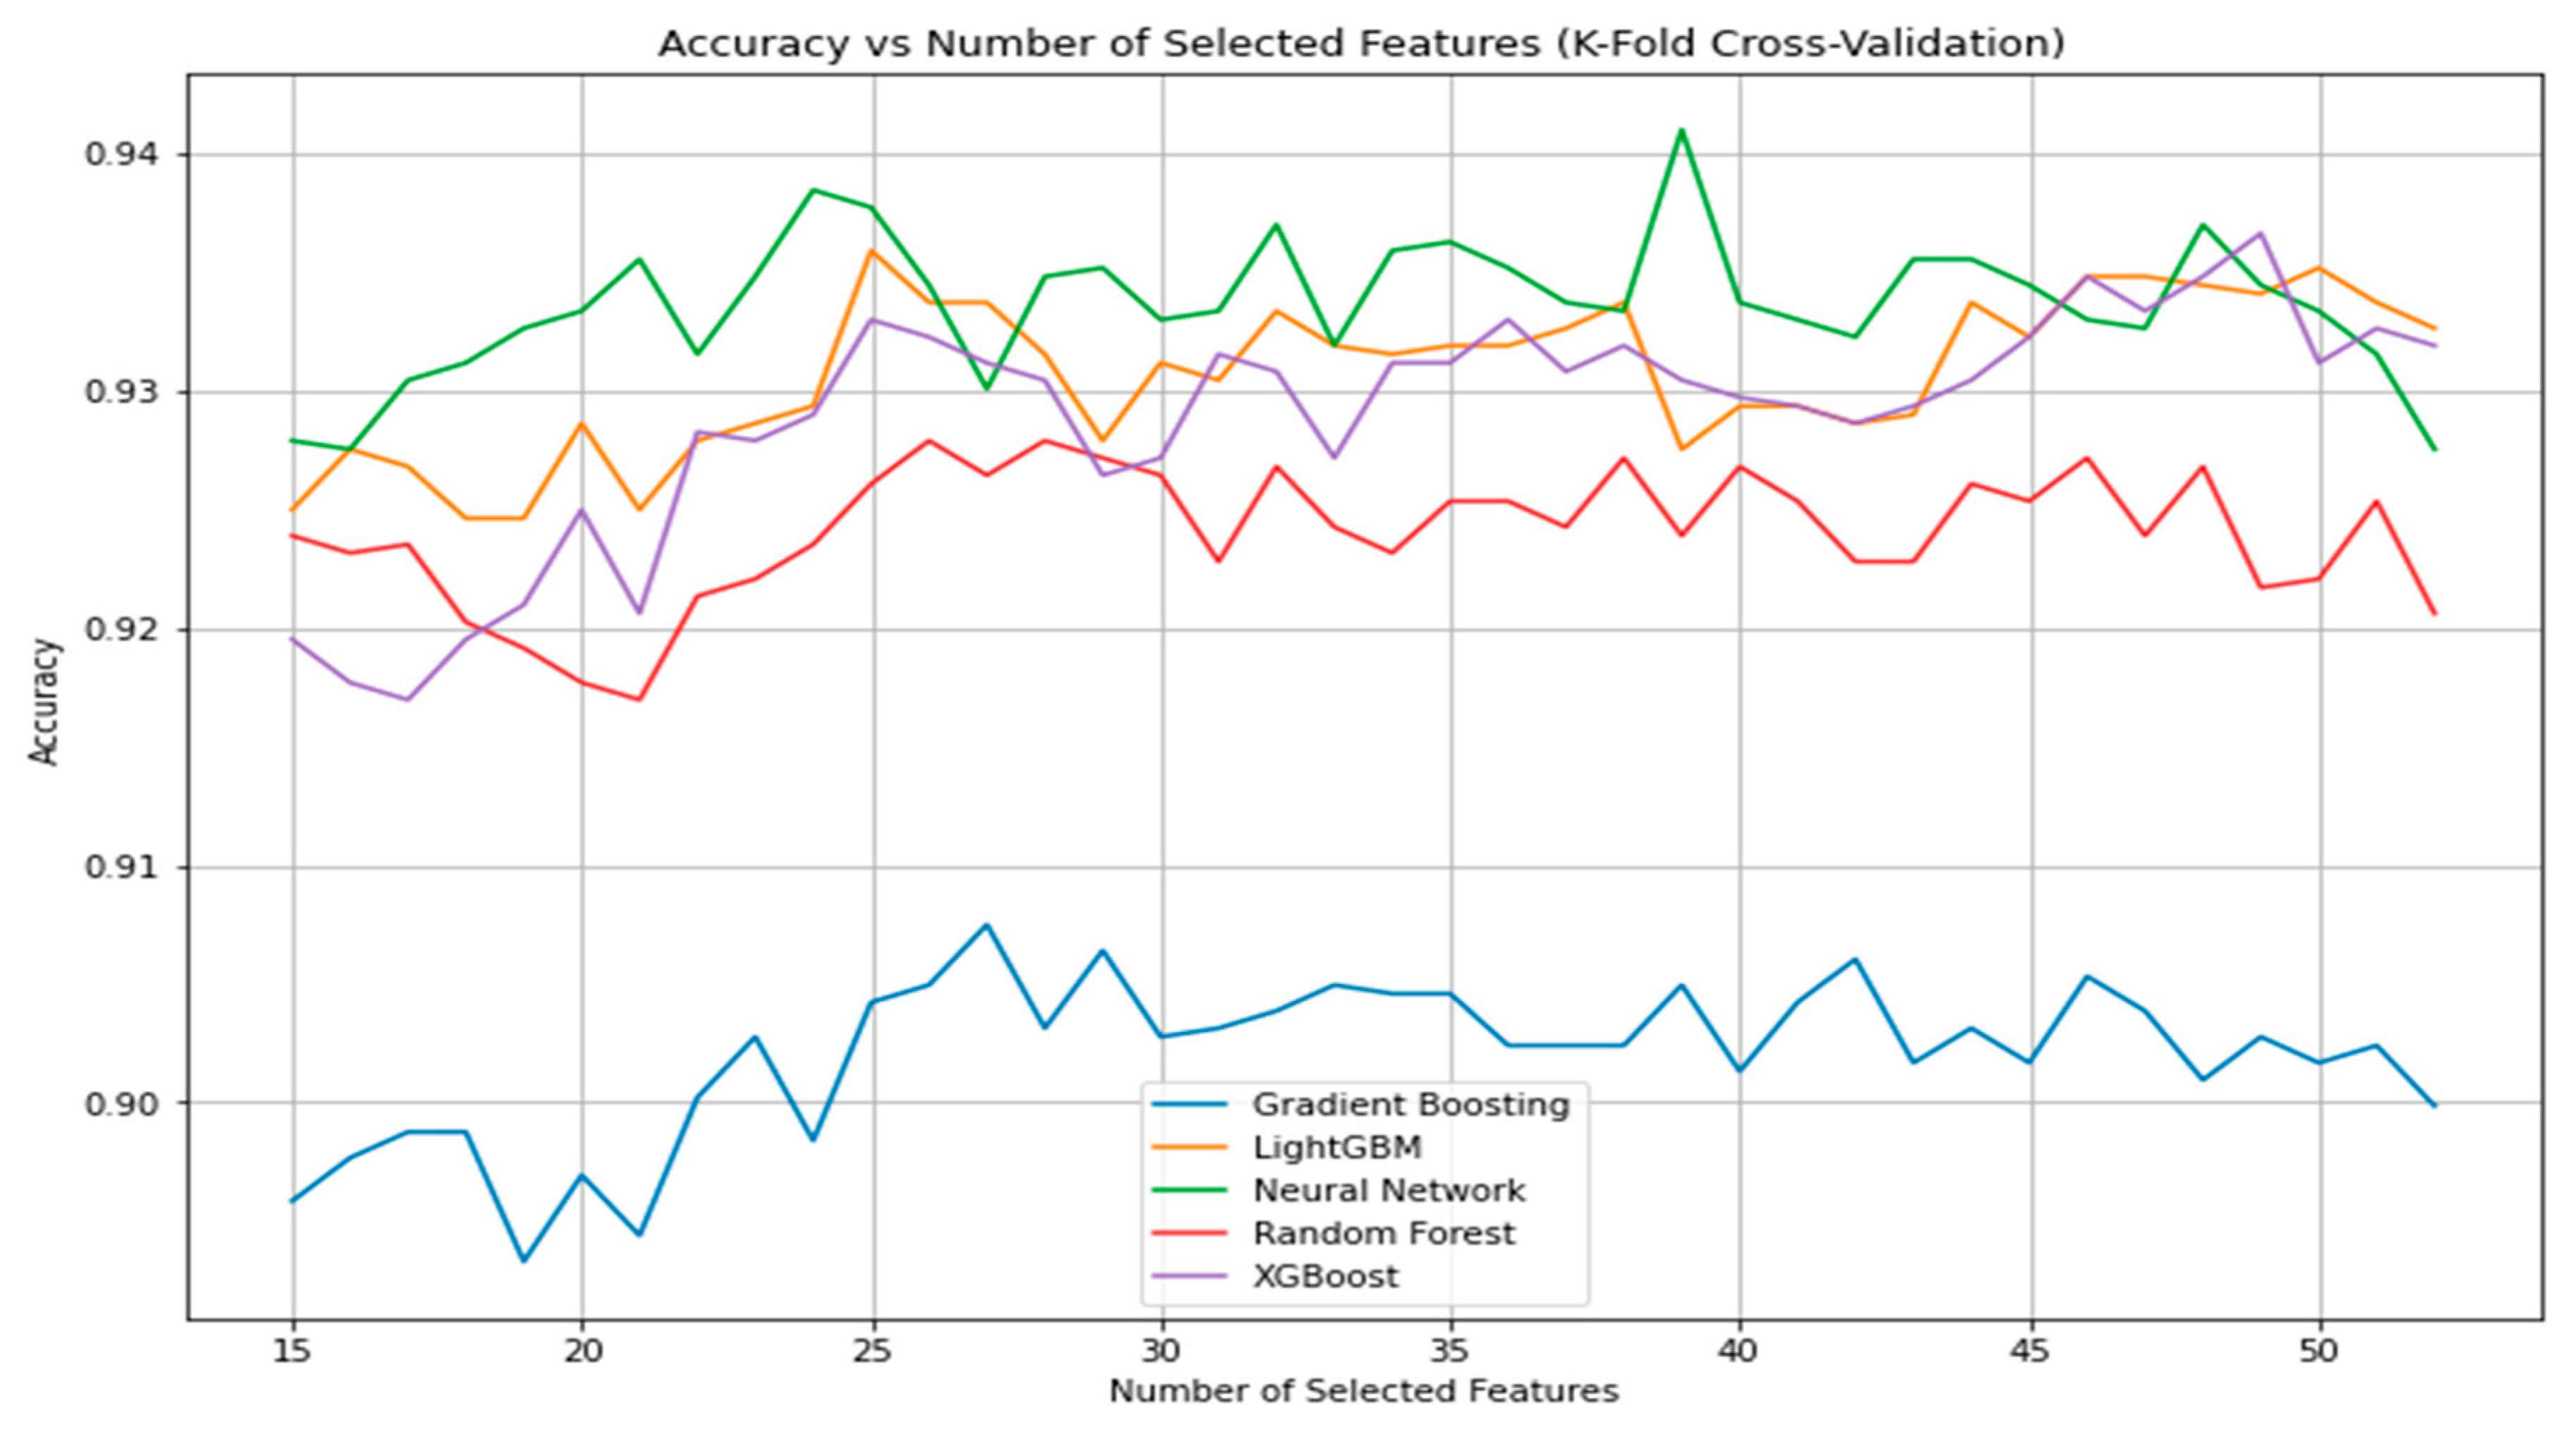
To assess the impact of feature selection on model performance, this study conducted a comparative evaluation across five machine learning models—Gradient Boosting, LightGBM, Neural Network (MLP), Random Forest, and XGBoost—using ANOVA-based feature ranking. For each model, classification accuracy was measured using 10-fold cross-validation across a range of selected feature counts (from 15 to 52 features). The objective was to identify the optimal number of features that balances performance and model simplicity.
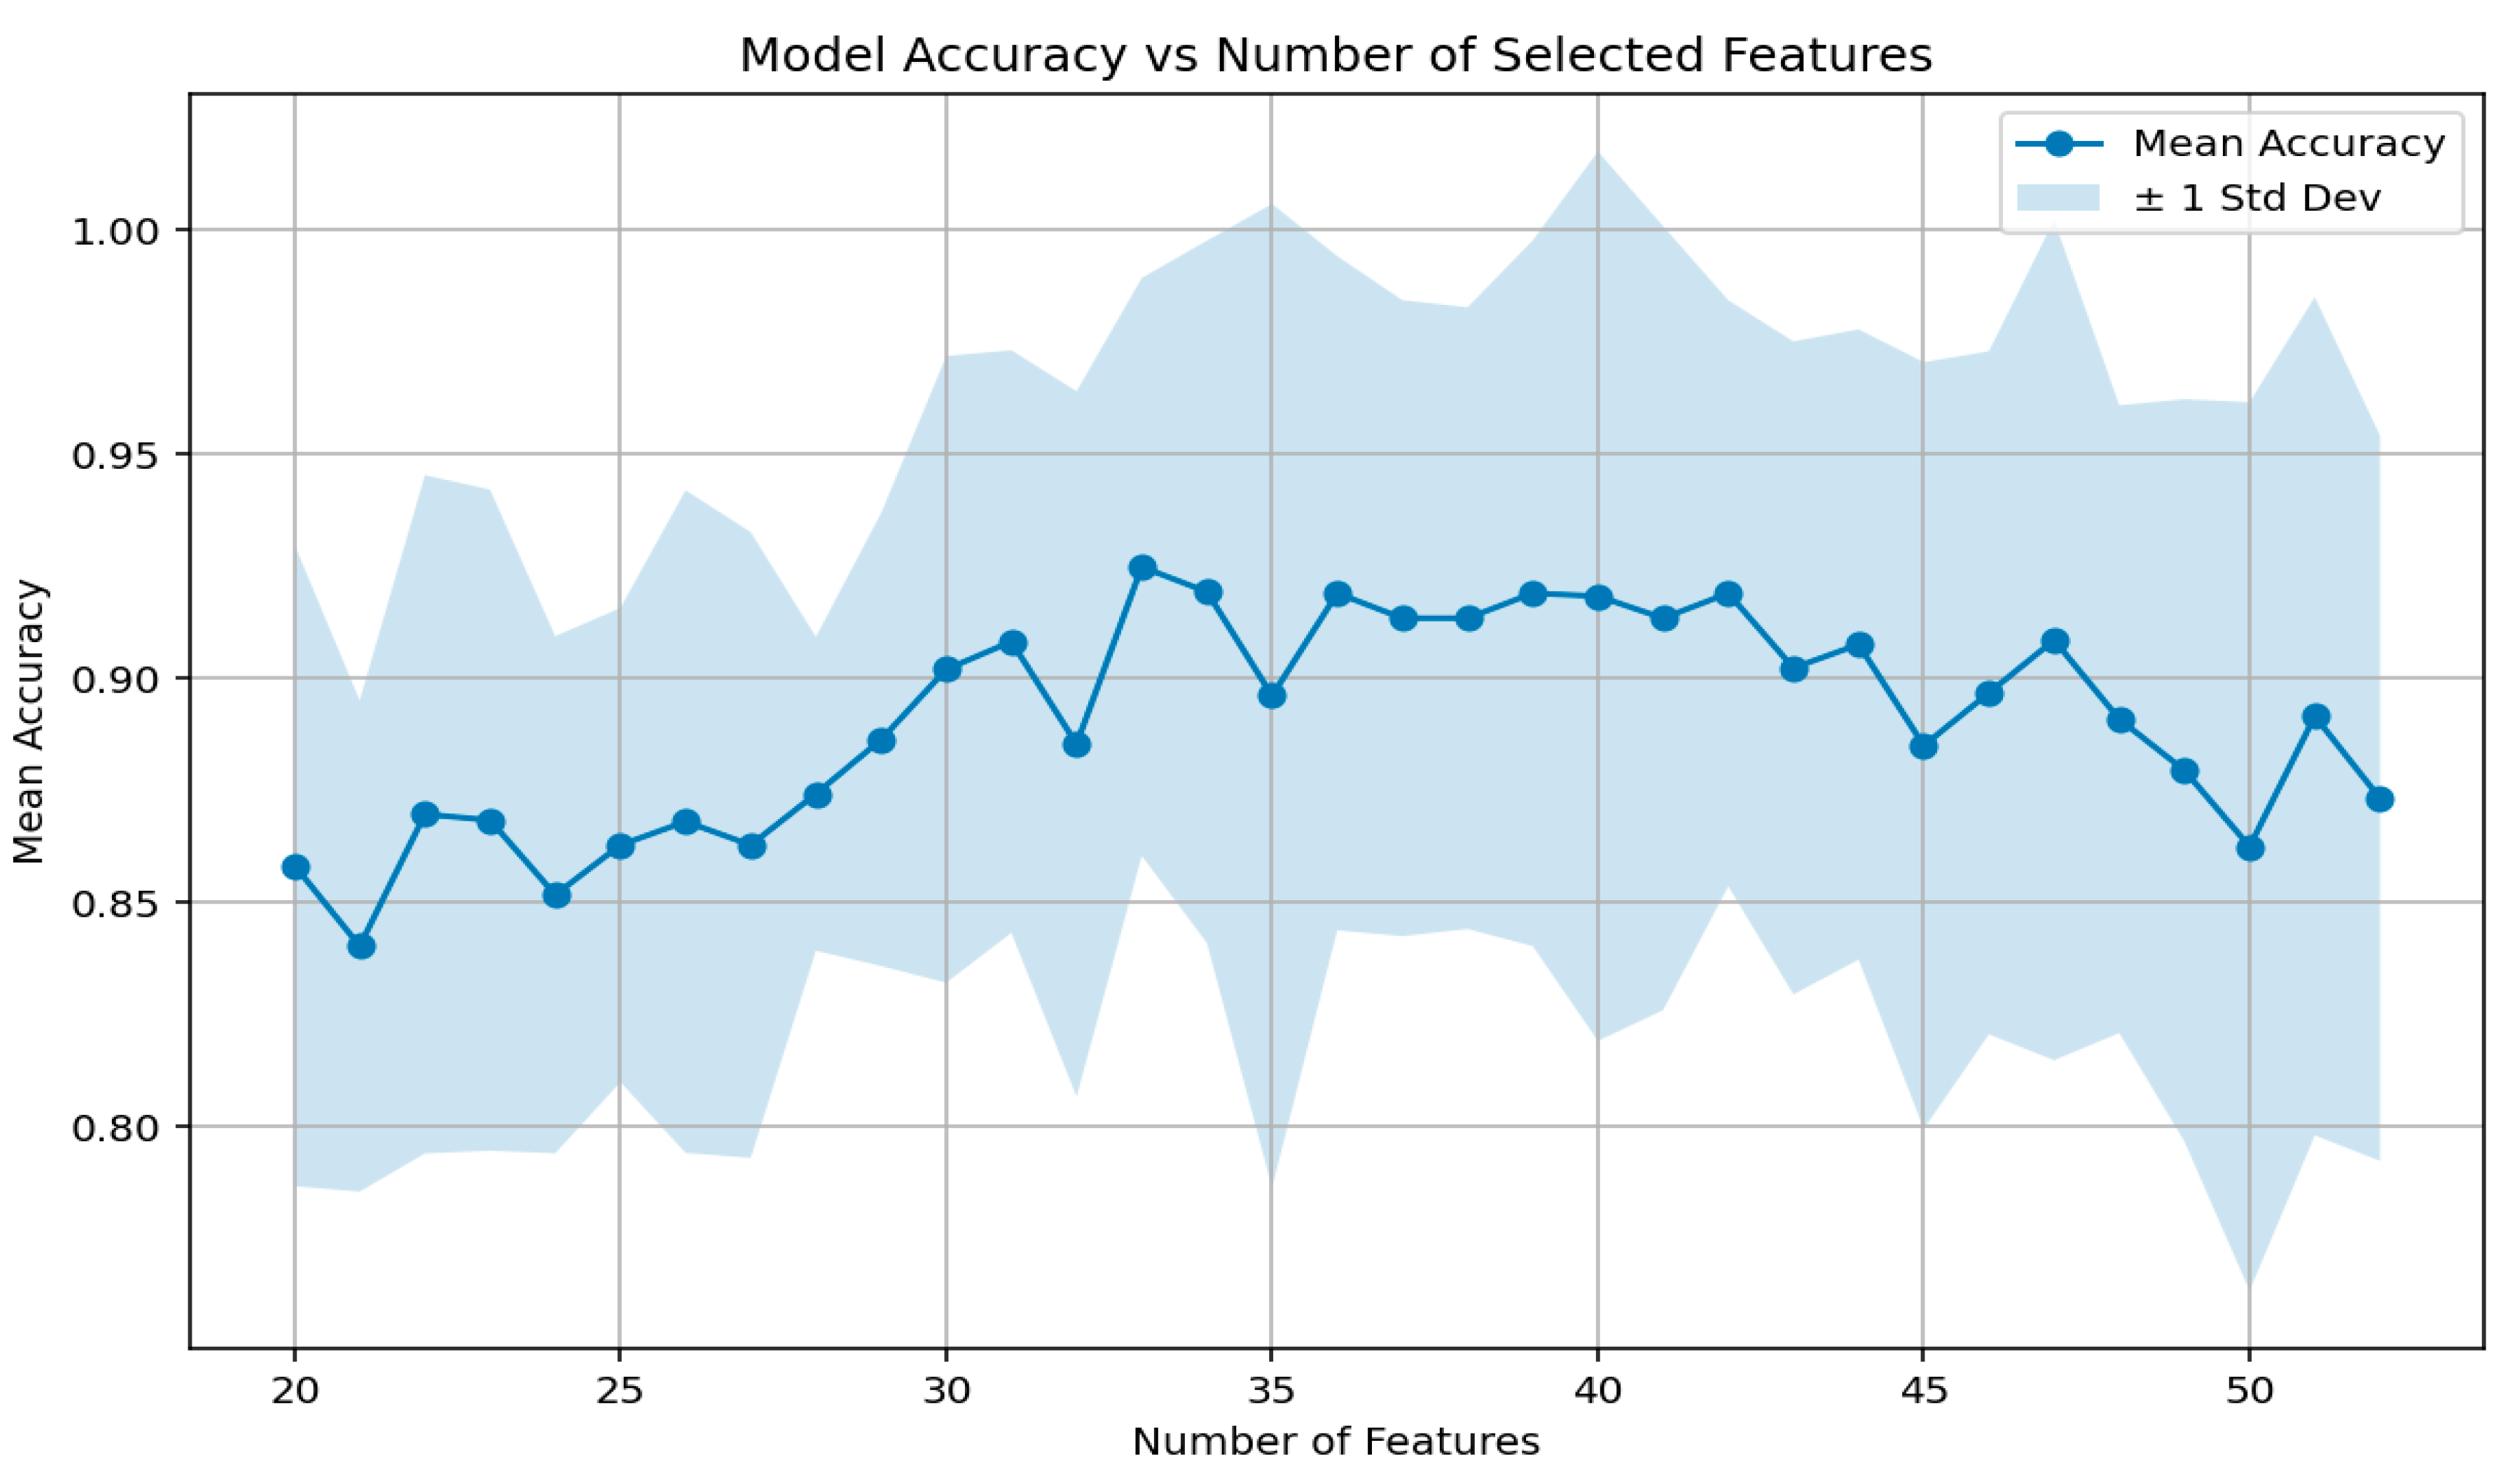
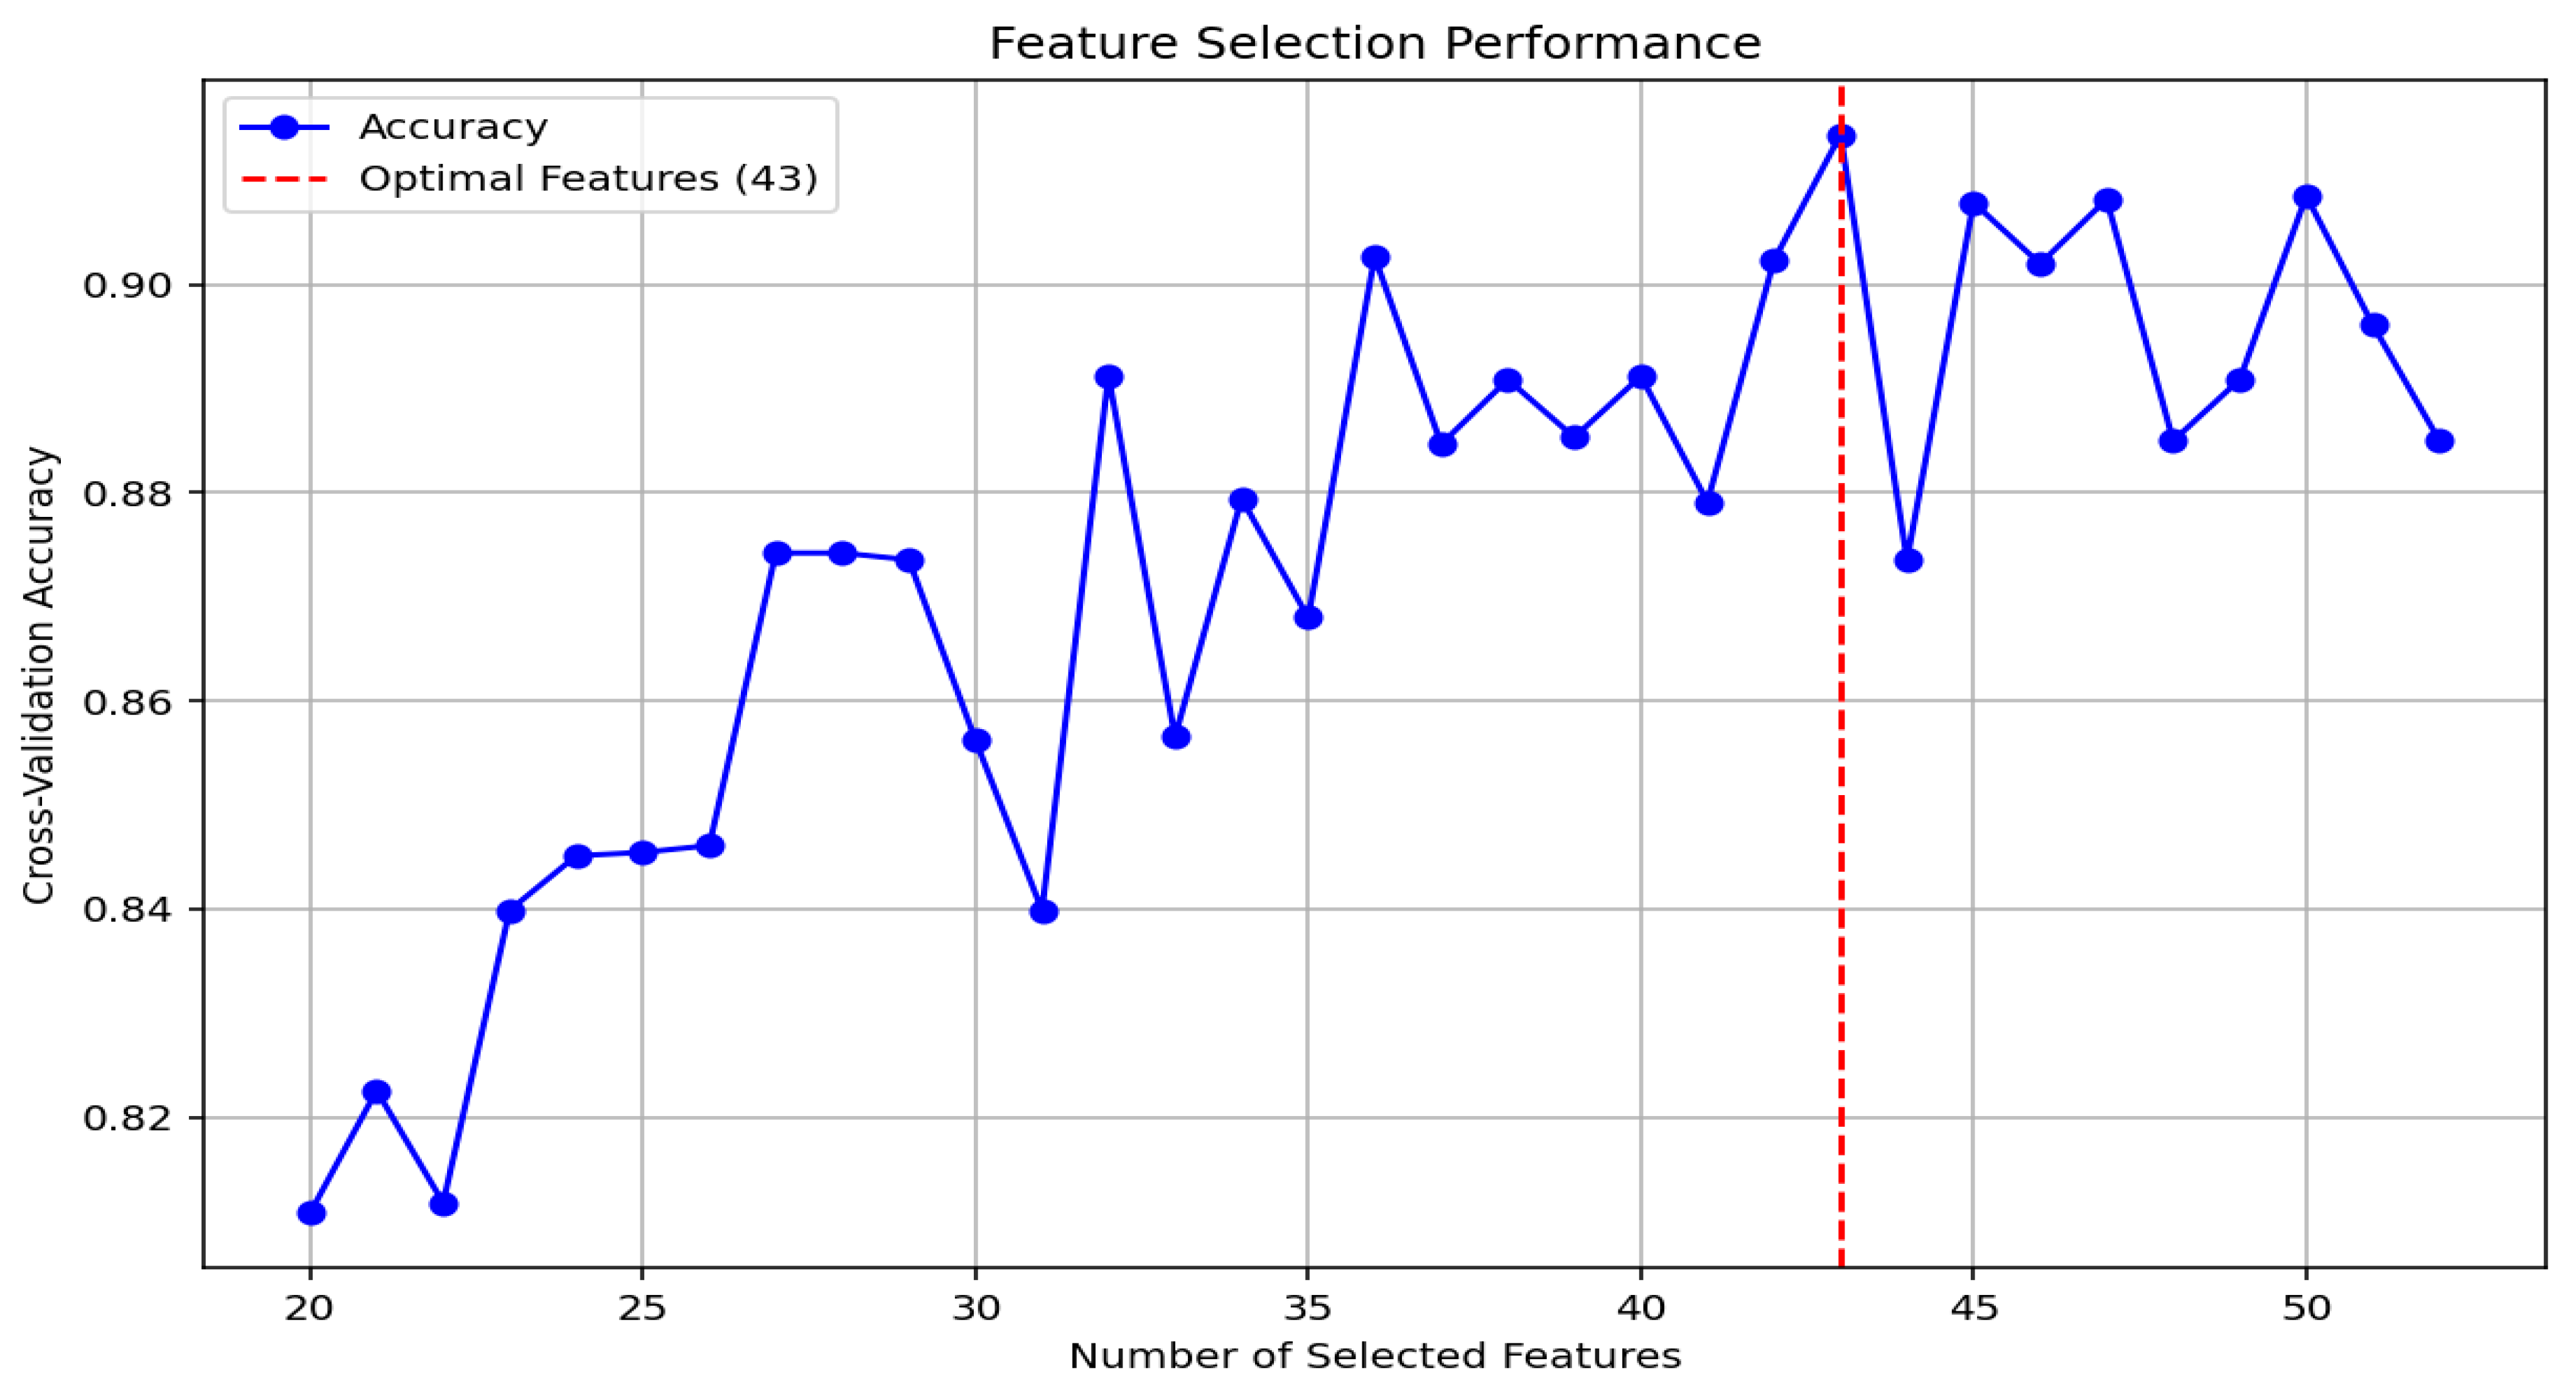
VAFD Insights: Figure 12 illustrates how classification accuracy varies with the number of features on VAFD. Accuracy improves as more features are introduced, peaking around 38–42 features for most models. The Random Forest and XGBoost models exhibited the highest overall accuracy in this range, consistently outperforming other models. Notably, the neural network showed moderate sensitivity to the number of features, displaying some fluctuation. Gradient boosting performed more stably but with a lower accuracy ceiling. This analysis suggests that an optimal trade-off exists around 38–40 features for robust performance on mechanical fault sounds.
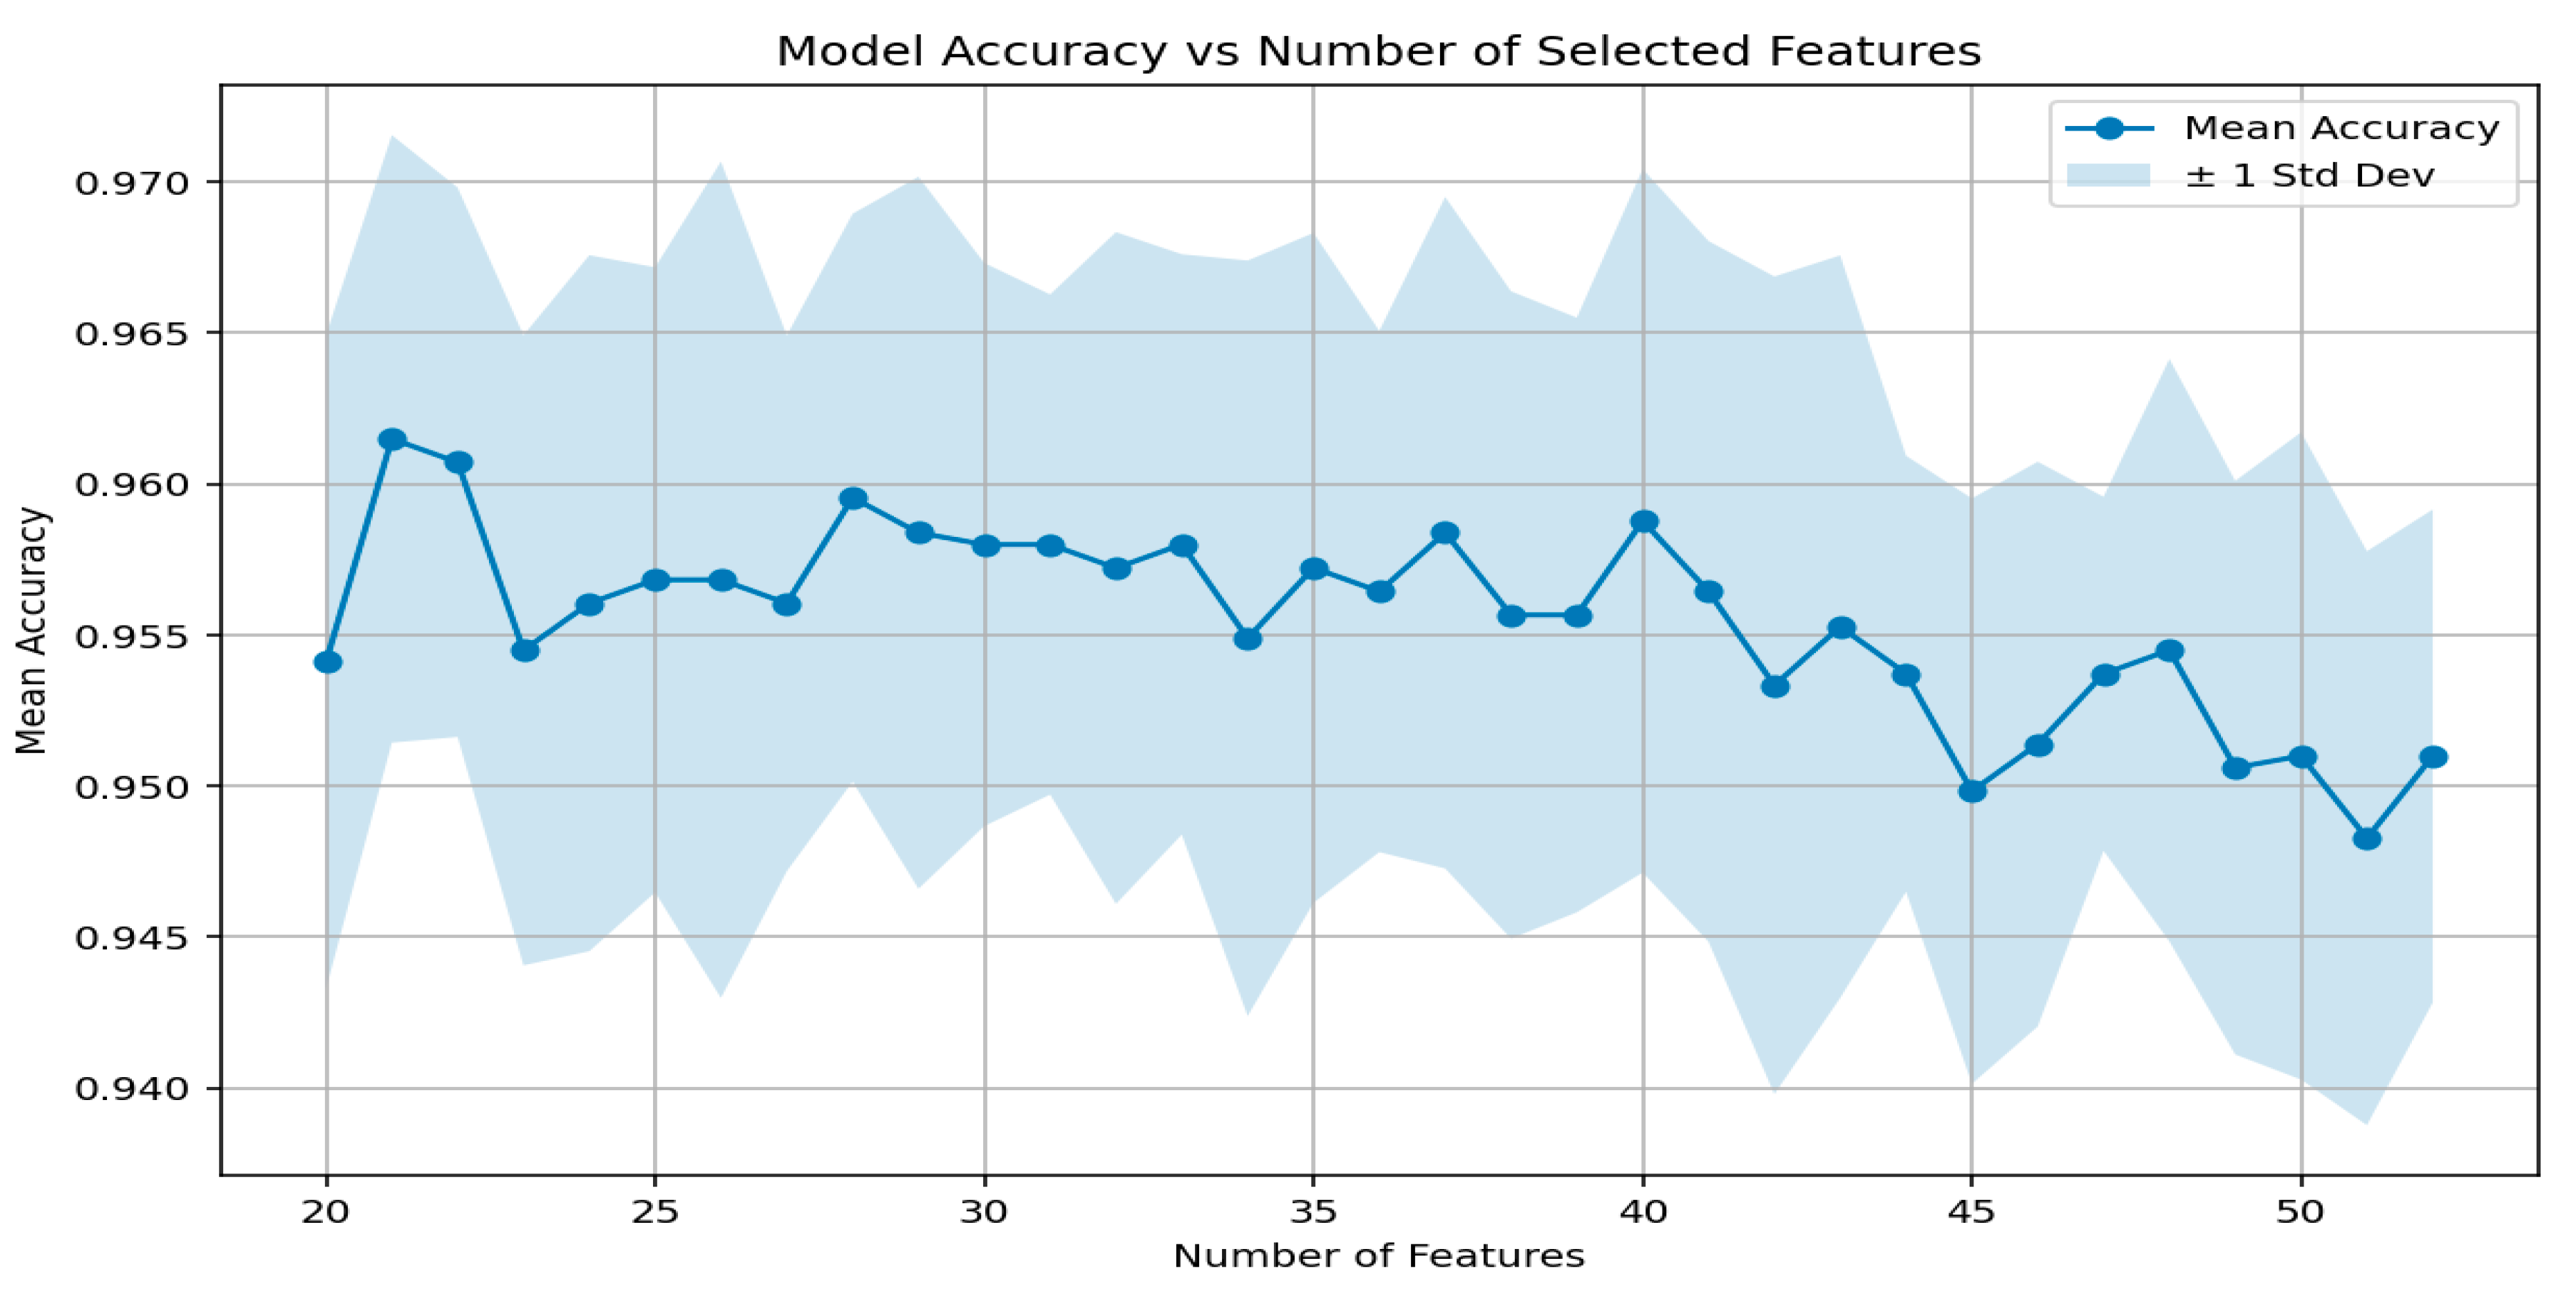
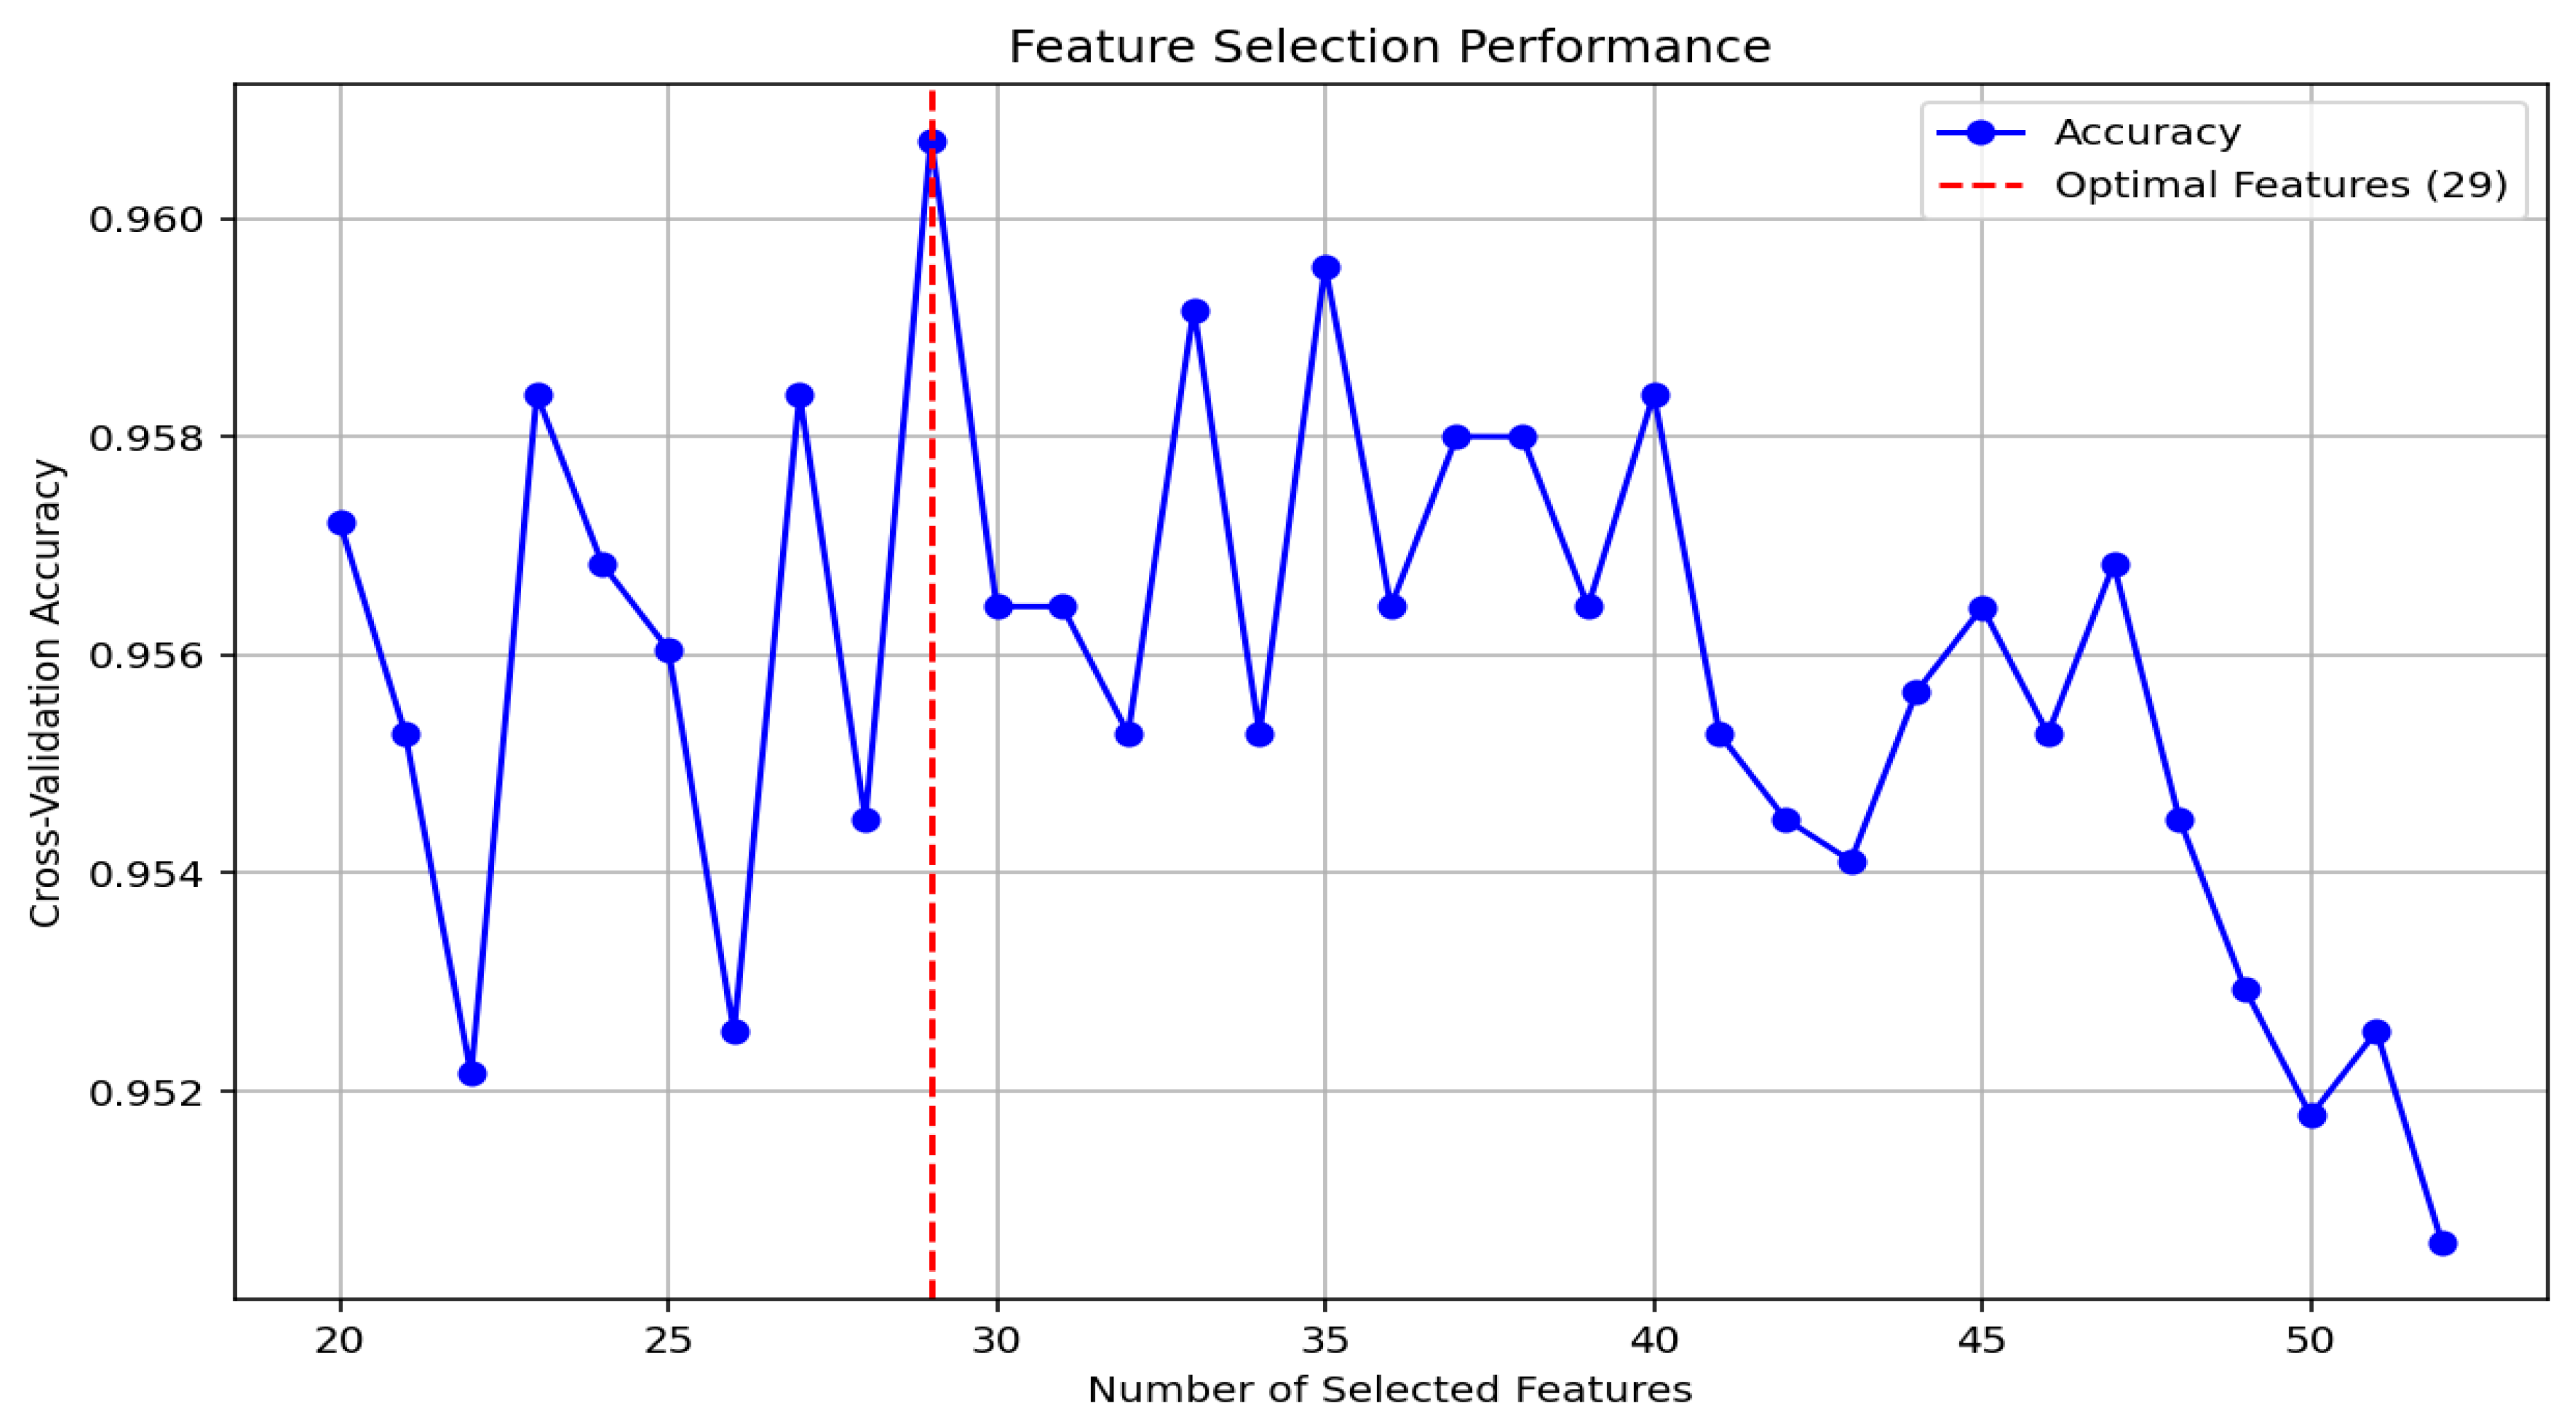
UEASD Insights: As shown in Figure 13, models evaluated on UEASD—composed of emergency and environmental sounds—achieved very high and stable accuracy across a broader feature range (around 28–42 features). XGBoost achieved the highest overall accuracy, followed closely by LightGBM. Interestingly, most models exhibited relatively flat accuracy trends after 30 features, indicating strong separability between sound classes even with fewer inputs. This reinforces the efficiency of ANOVA in prioritizing discriminative features for real-time emergency recognition.
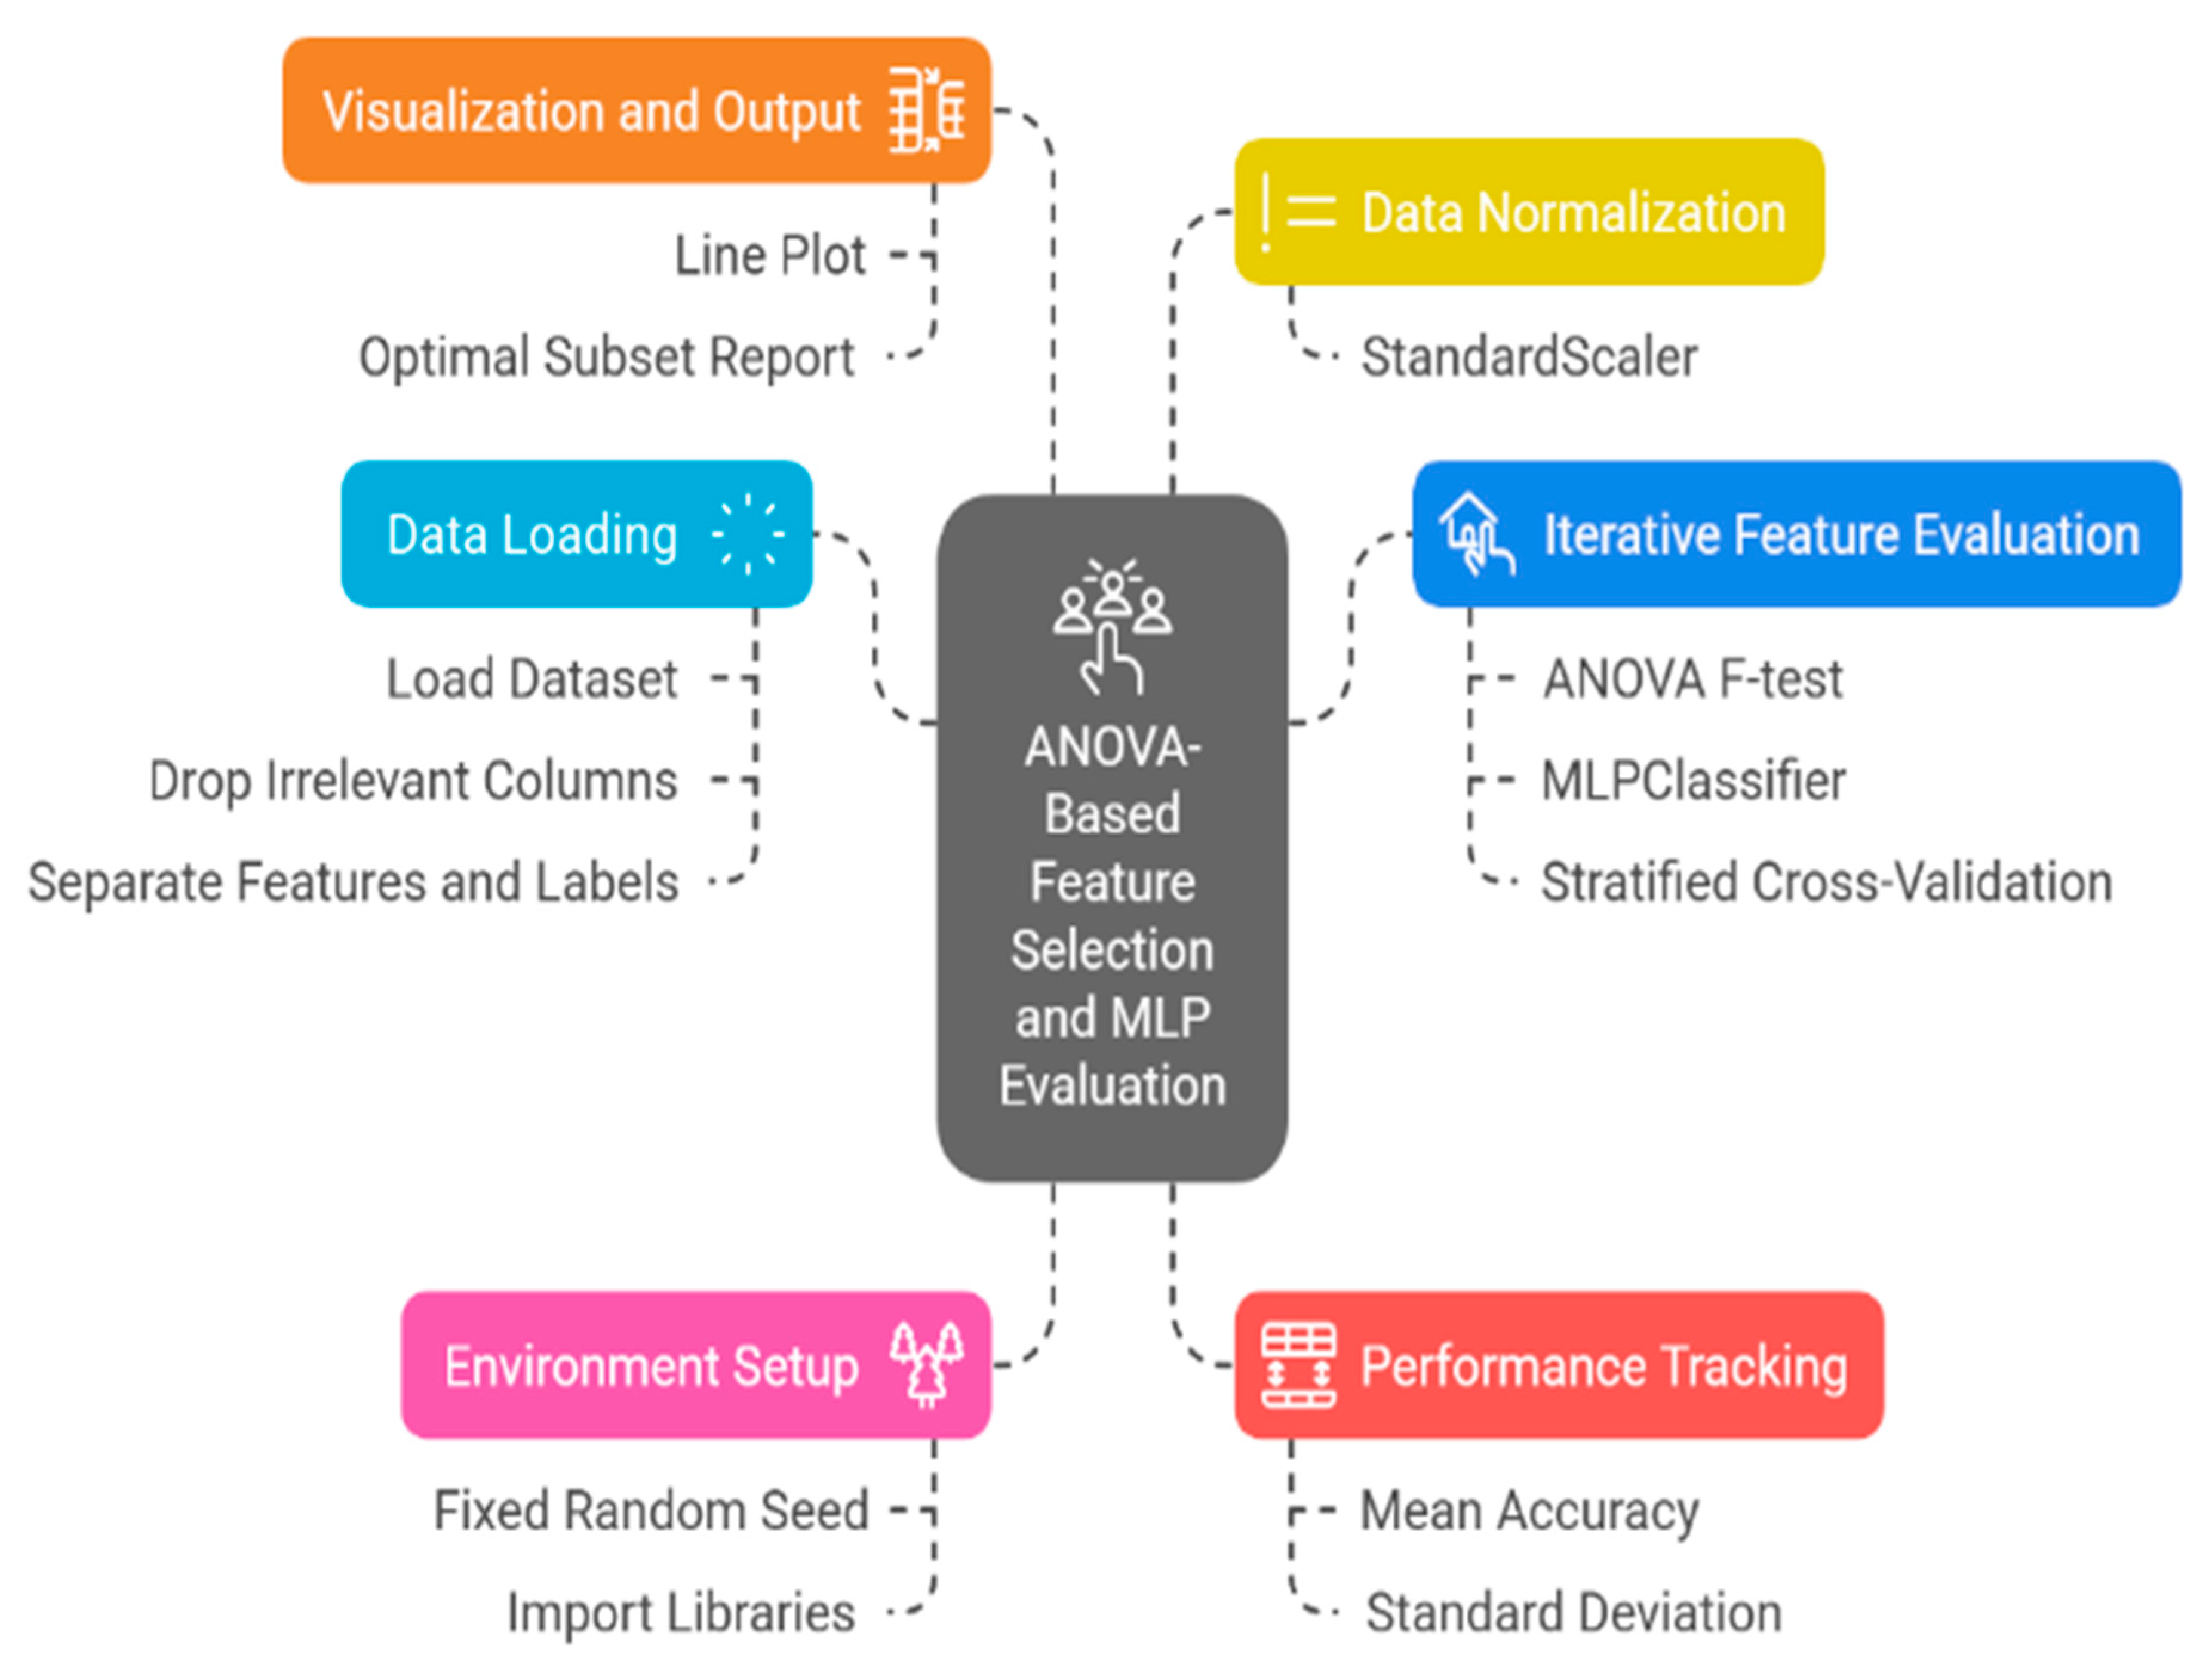
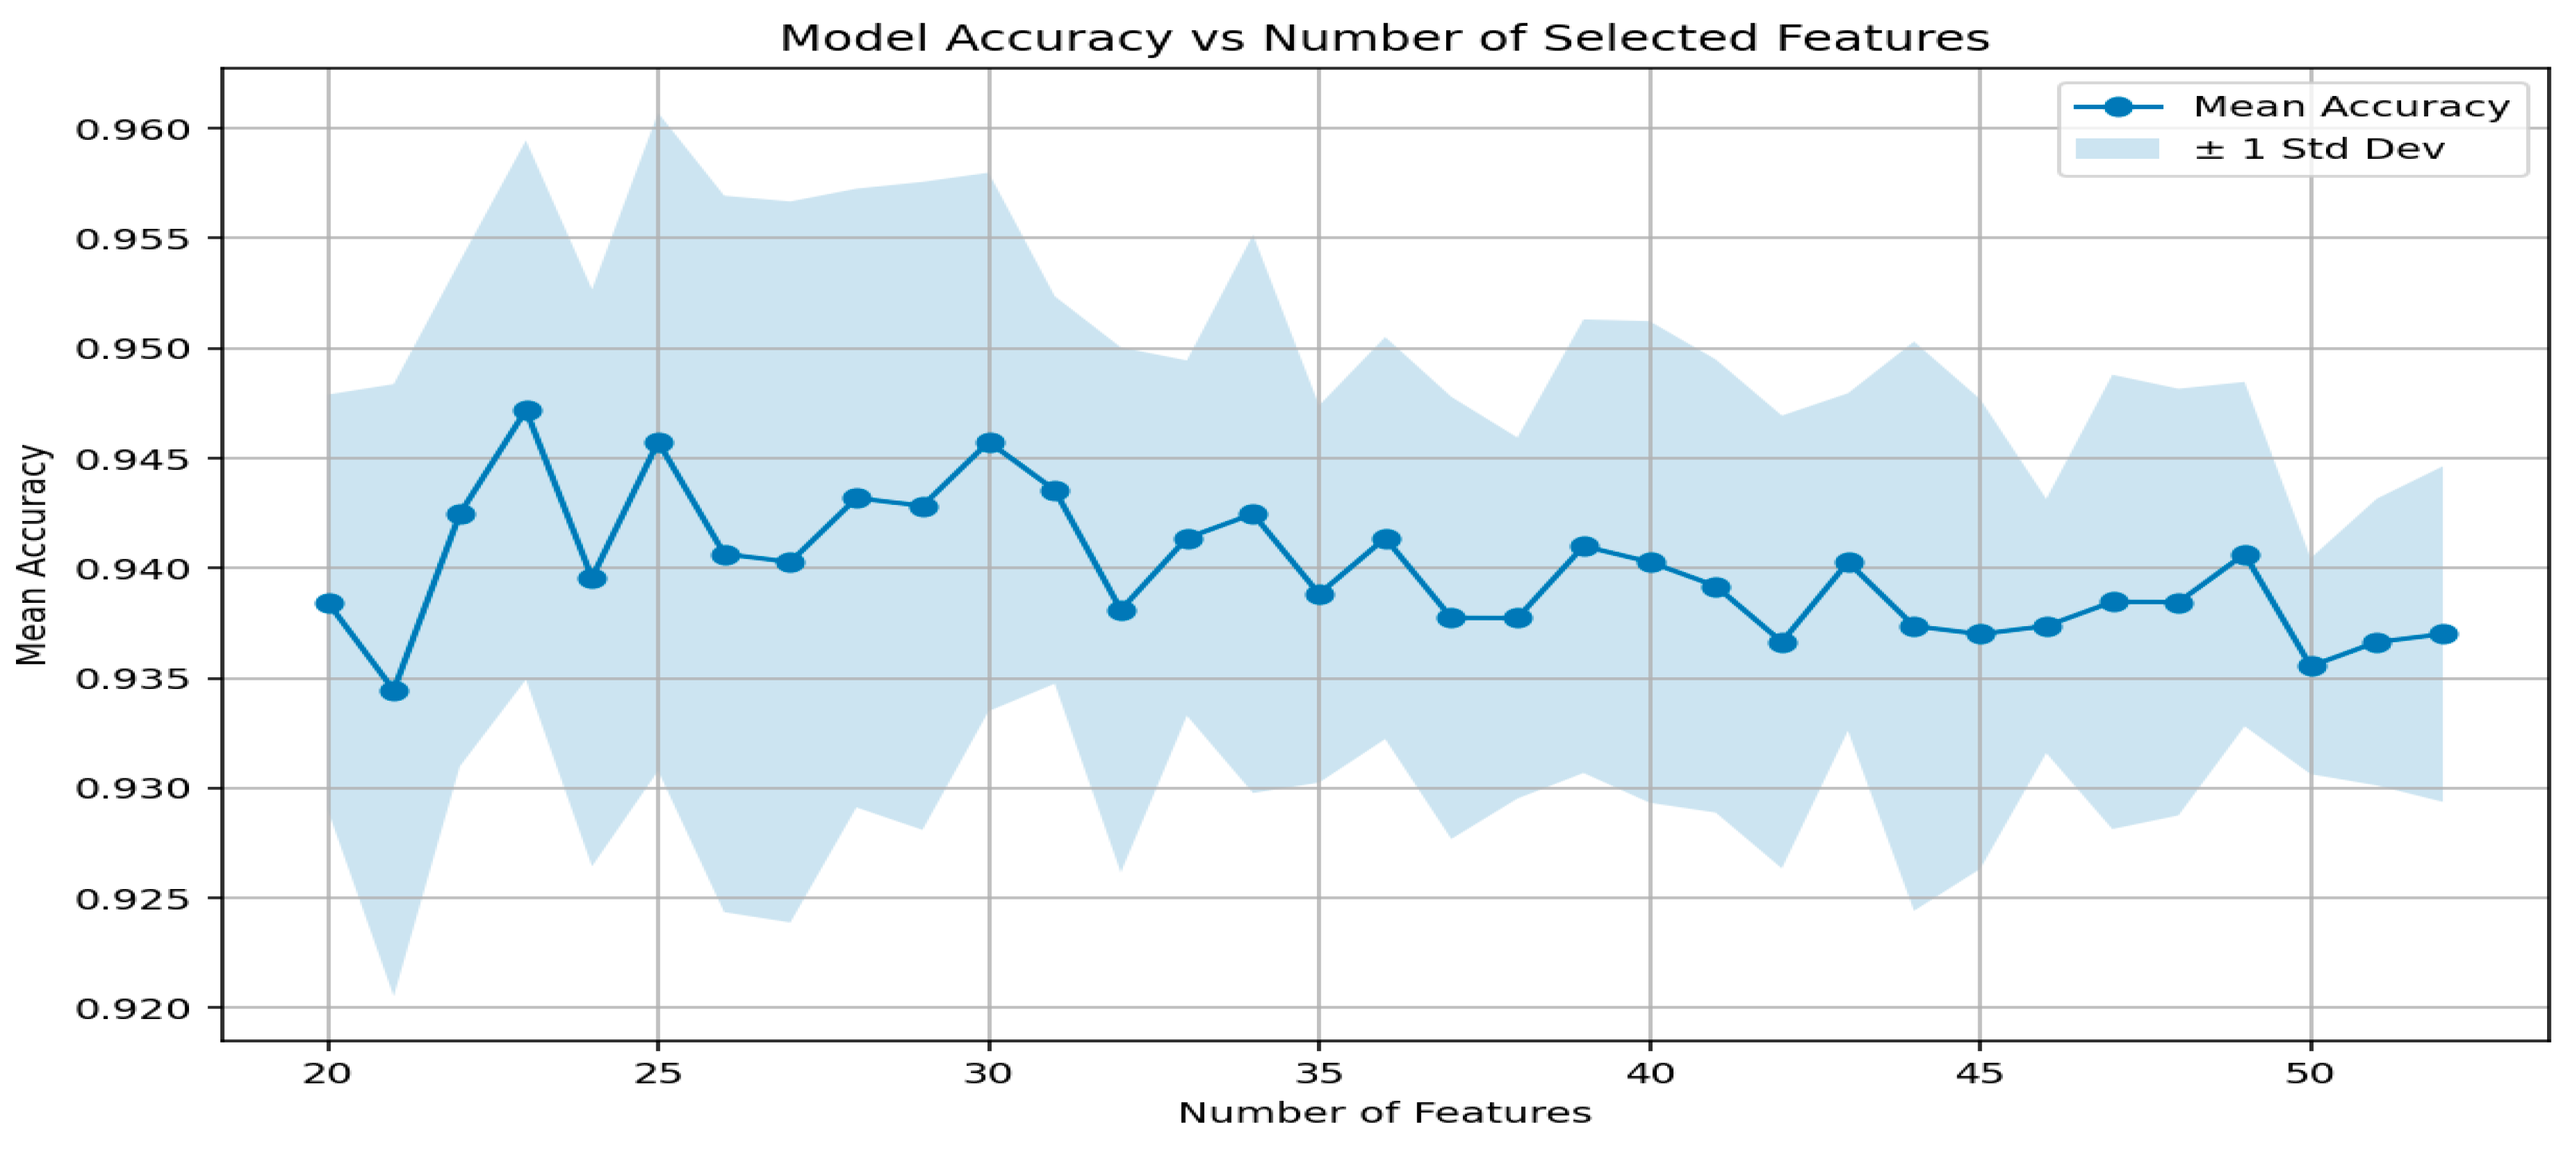
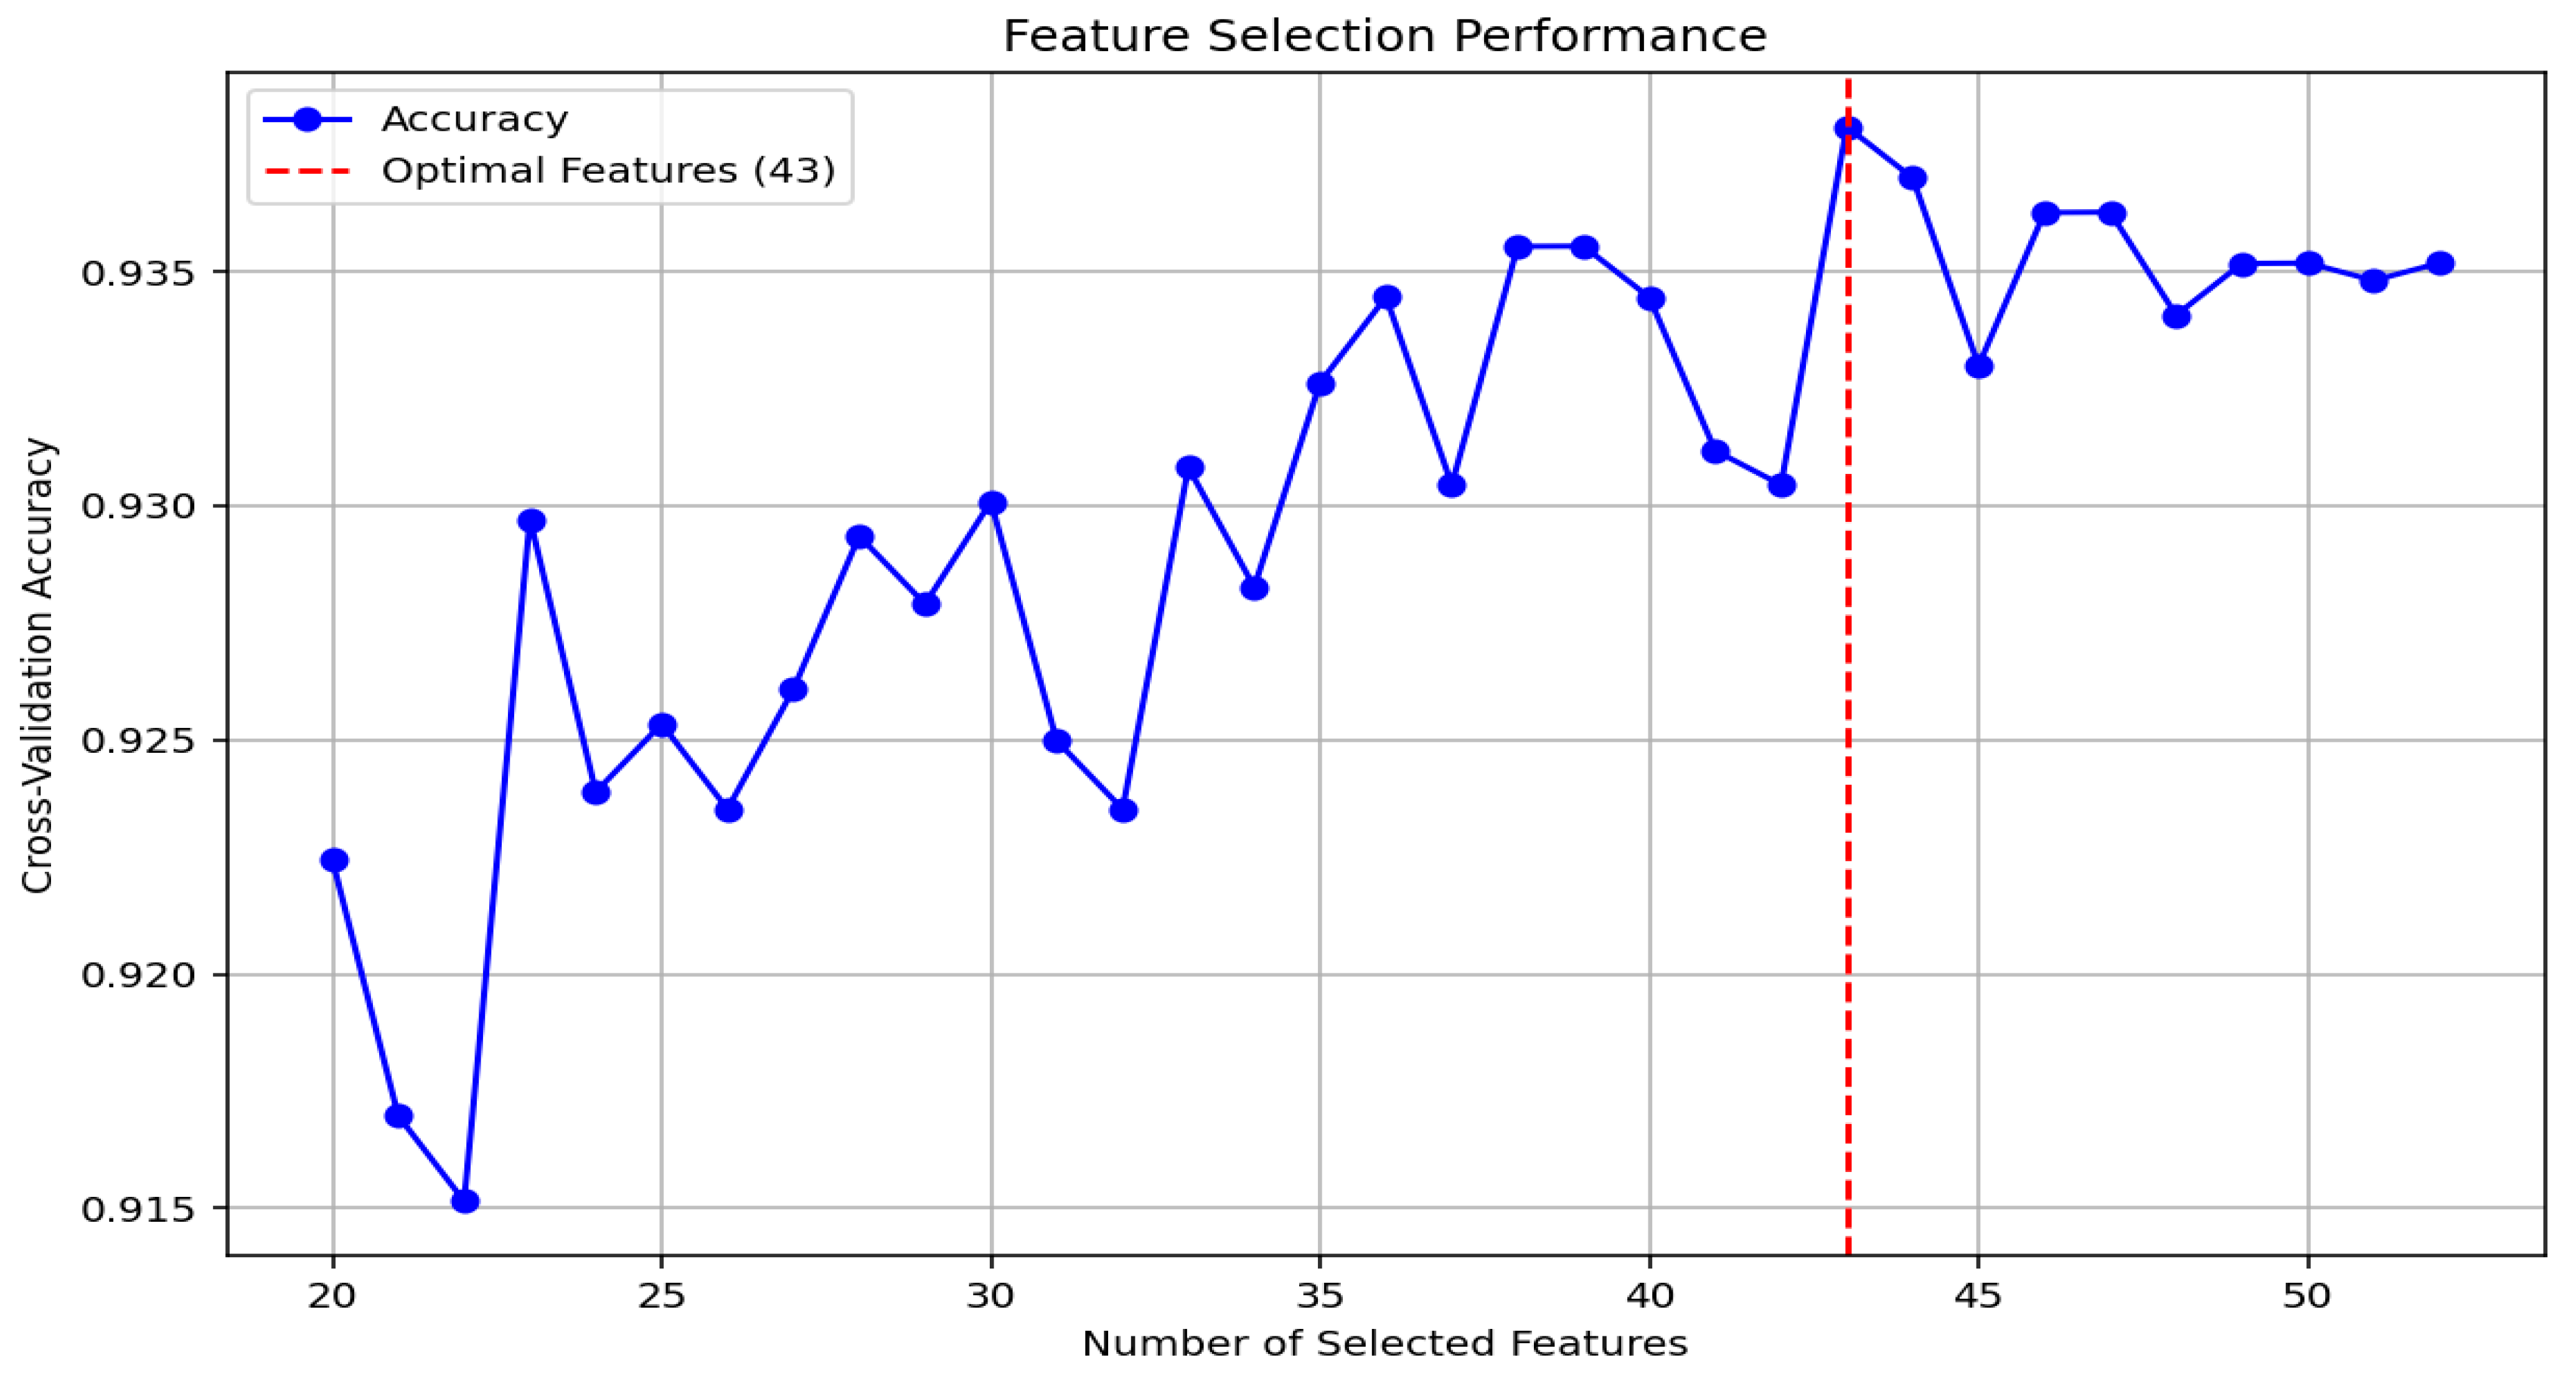
IVESD Insights: Figure 14 presents results for the combined dataset (IVESD), which merges vehicle faults and emergency sounds. While the accuracy levels remained high, models such as Random Forest and LightGBM showed slight performance degradation beyond 45 features—likely due to the presence of redundant or noisy attributes. The optimal number of features appeared to be between 31 and 36 for most models, with Random Forest and LightGBM maintaining consistently superior performance. The neural network displayed more pronounced variability, suggesting its sensitivity to irrelevant features in complex multi-class settings. Across all datasets, the feature selection curves reveal that ANOVA-based ranking can effectively identify compact, high-impact feature subsets that yield competitive performance. These findings underscore the value of statistical feature selection for boosting accuracy, enhancing interpretability, and reducing computational overhead. Such insights are vital for deploying sound-based diagnostics in constrained intelligent transportation environments. The Workflow for Feature Selection and evaluation using ANOVA and Classical ML Models is depicted in Algorithm 2.
Algorithm 2: Comprehensive Workflow for Feature Selection and Evaluation Using ANOVA and Classical ML Models
Environment Setup: Import essential libraries and set a random seed to ensure reproducibility.
Data Loading: Load the dataset from a CSV file and separate features from target labels.
Target Encoding: Convert categorical target labels into numeric form using label encoding.
Label Display: Print the class label mappings for interpretability.
Model Initialization: Define a set of ML models (e.g., Gradient Boosting, LightGBM, MLP, Random Forest, XGBoost).
Result Storage: Prepare dictionaries to store evaluation metrics.
Feature Range Definition: Specify the number of features to test (e.g., from 15 to 52).
Feature Ranking via ANOVA: Calculate F-scores and rank features by importance.
Cross-Validation: Use K-Fold cross-validation to evaluate performance for each feature subset.
Model Training: For each model and fold, train using selected features and compute accuracy.
Result Visualization: Plot model accuracy against the number of selected features.
Plot Display: Present the results to analyze trends across models and feature counts.
While k-fold cross-validation was adopted as the most practical strategy to maximize training data, given the relatively small dataset size, we acknowledge that this approach may inflate reported metrics and cannot fully guarantee generalization without a held-out test set.

5.3. Phase 2—Experimental Configuration and Pipeline Overview

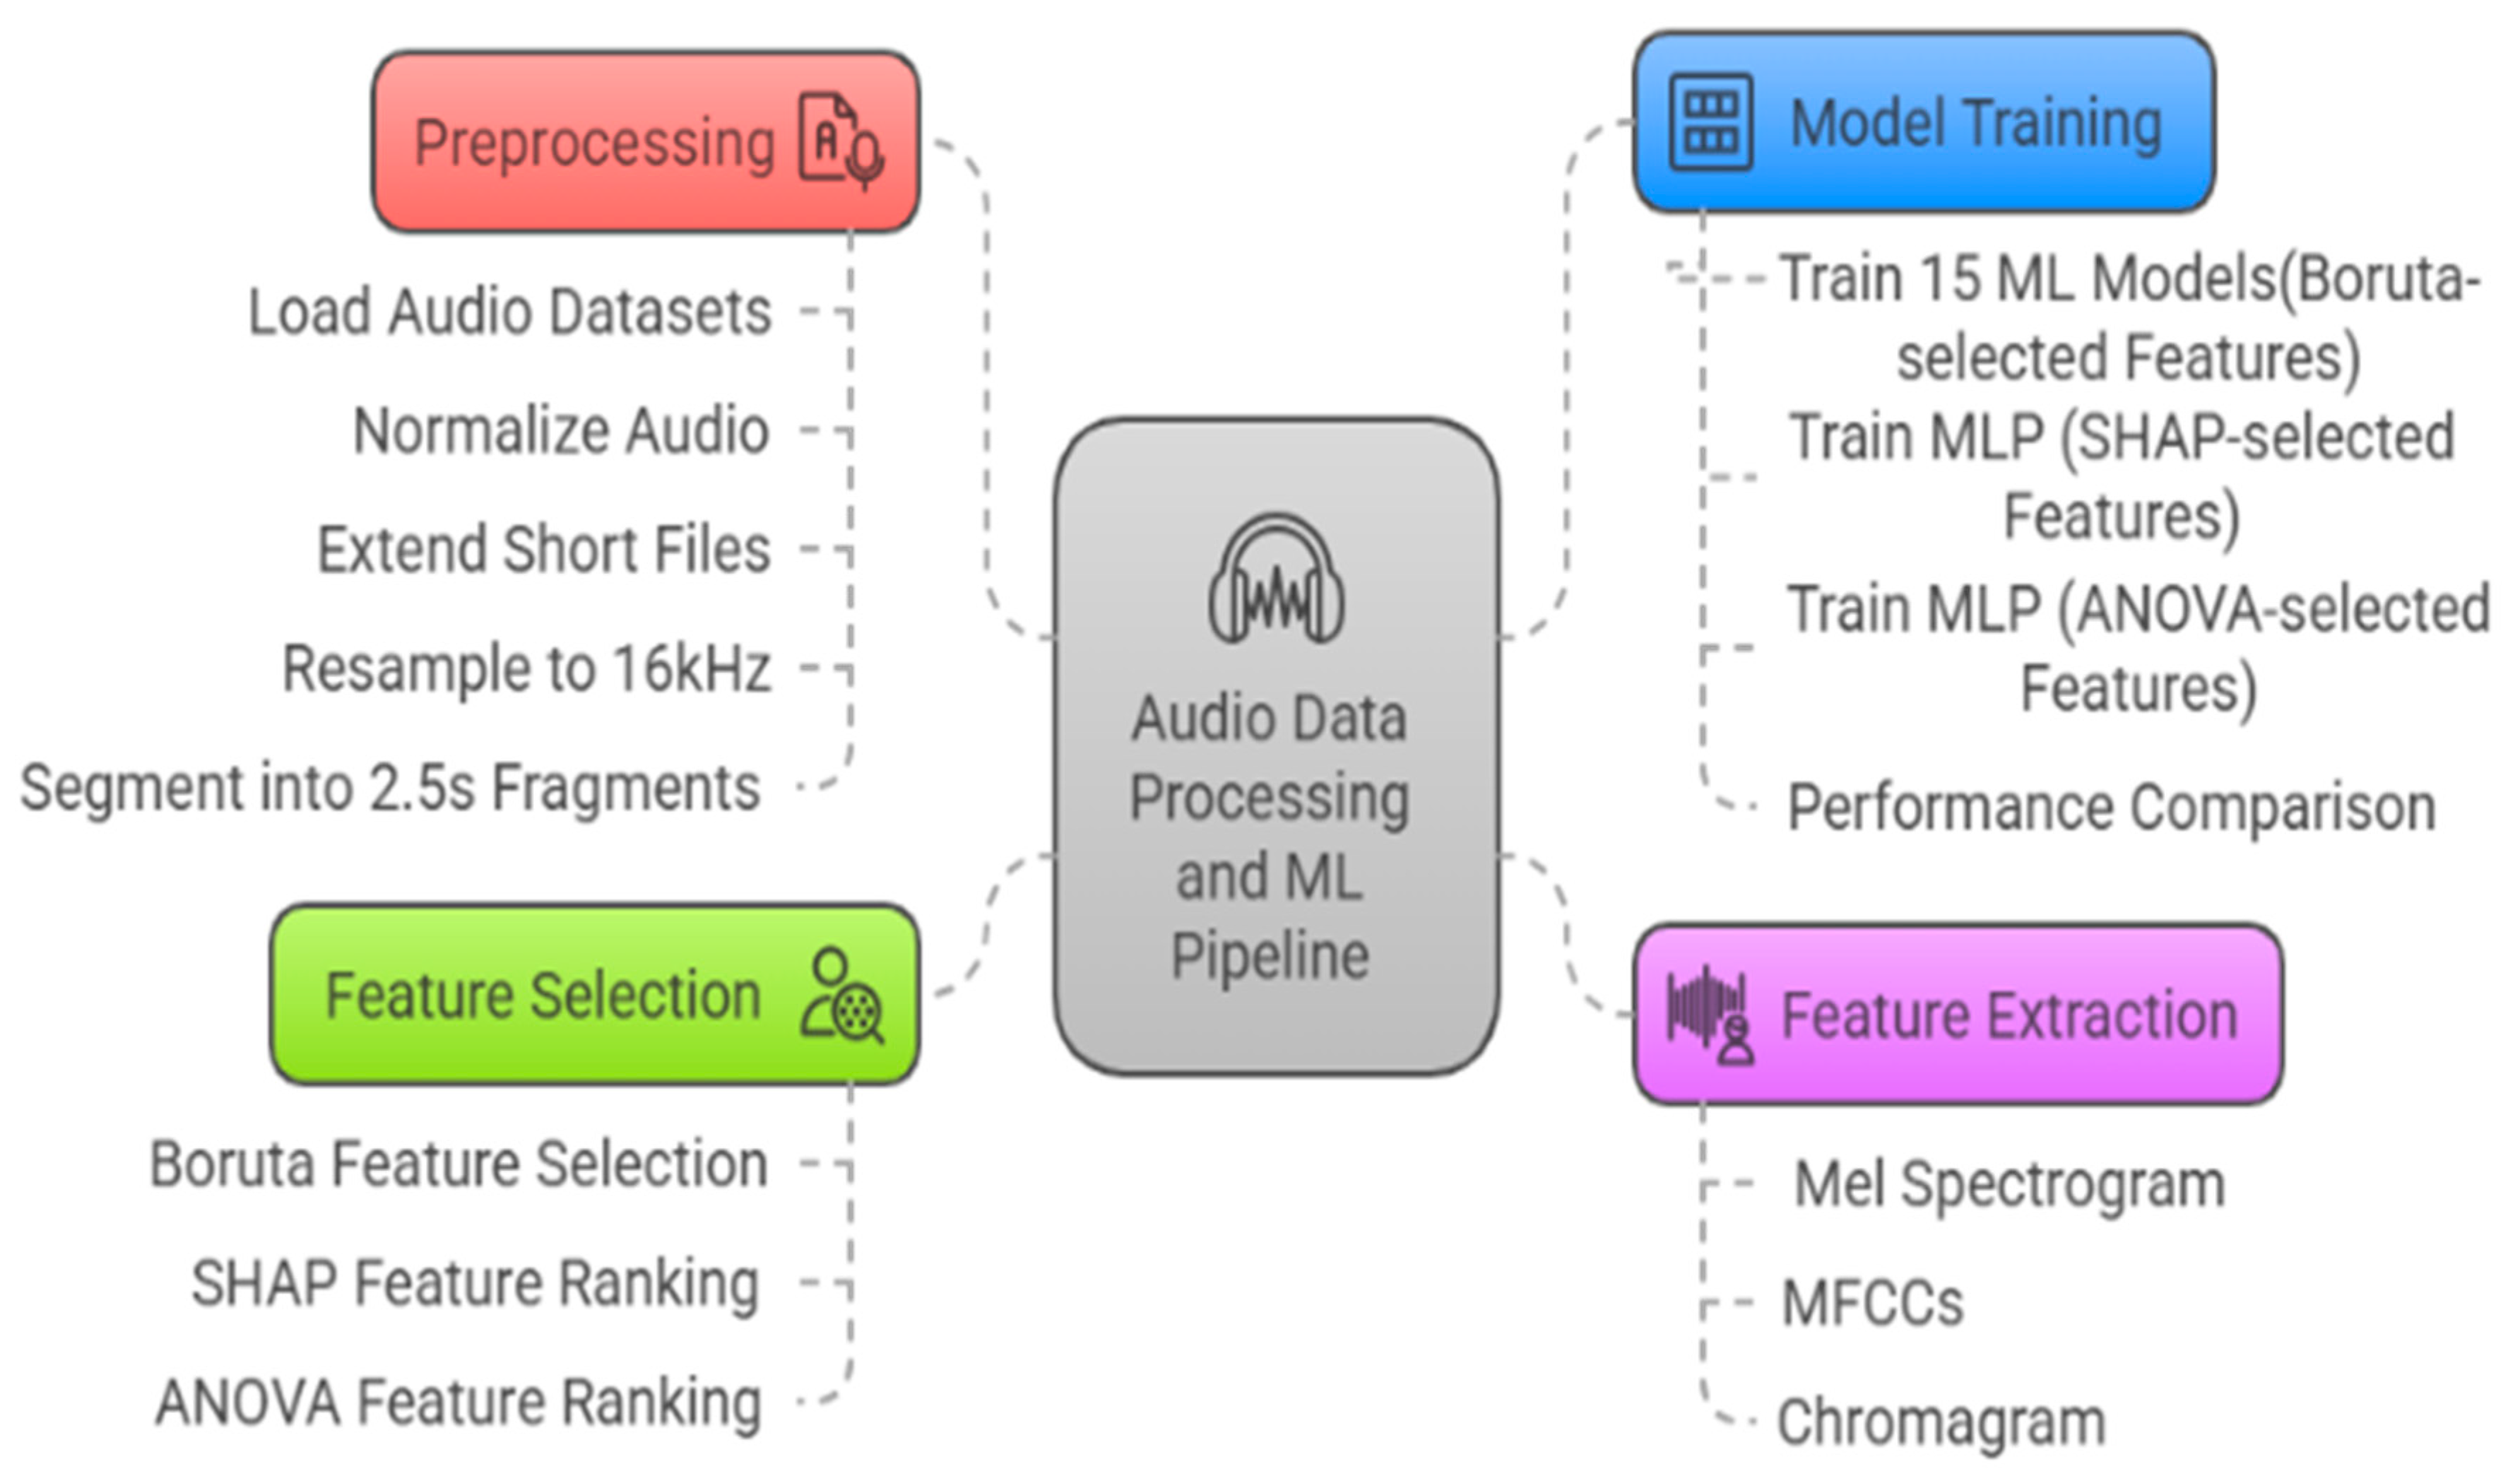
To ensure consistency and reproducibility of experiments, a unified configuration was adopted across all datasets. Table 8 summarizes the preprocessing steps, classification setup, and feature selection methodology. The preprocessing stage involved normalizing audio signals, extending short recordings, resampling all files to 16 kHz, and segmenting the data into uniform 2.5 s fragments.
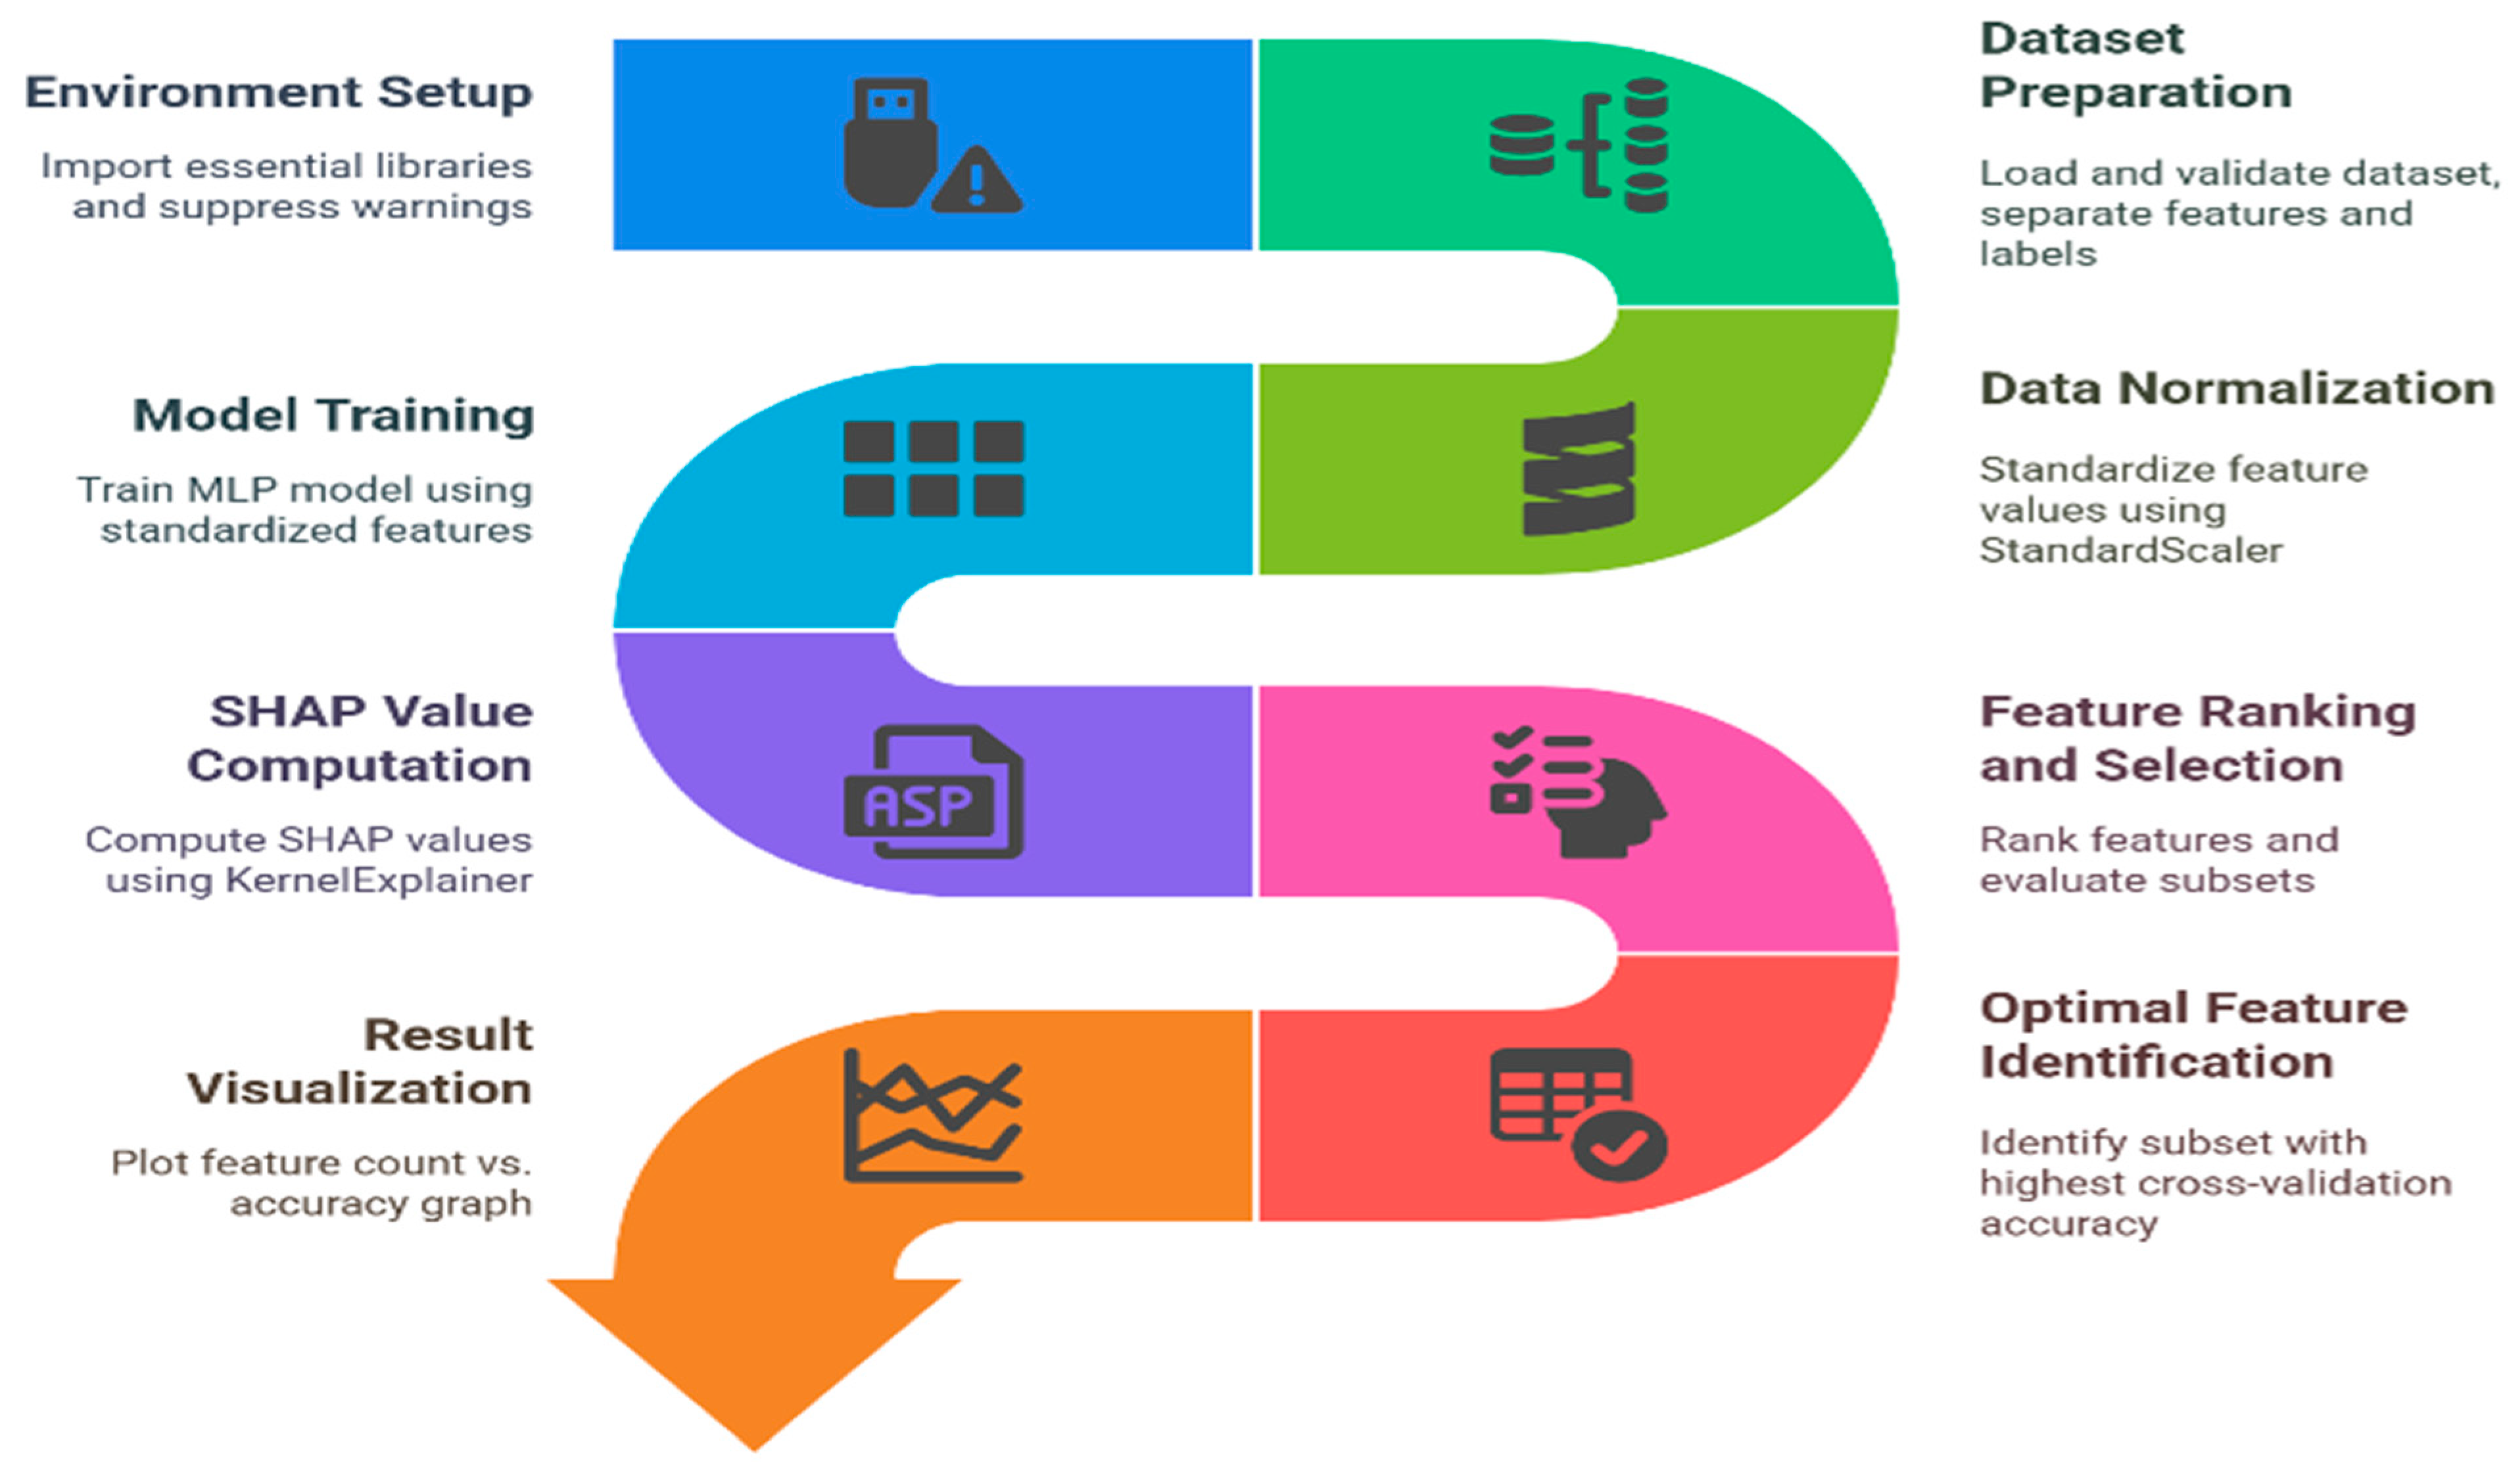
Each audio segment was represented using a 52-dimensional feature vector derived from Mel Spectrograms, MFCCs (13 coefficients × mean & std), and Chroma features (mean & std). These features were used as input to 15 classical machine learning models, including ensemble-based, linear, and probabilistic classifiers. Boruta was employed to select features for the base experiments. Models were trained and validated using stratified 10-fold cross-validation to ensure balanced class representation and robust performance estimation. The complete machine learning pipeline, from preprocessing to model evaluation, is illustrated in Figure 15. This modular pipeline enabled consistent experimentation and comparison across feature selection methods and model families. A high-level visualization of the experimental workflow used in this study. It depicts the major stages: preprocessing, feature extraction, feature selection (Boruta, SHAP, ANOVA), and training of machine learning models. The pipeline ensures standardized processing and enables consistent model evaluation across various configurations.

5.3.1. Phase 2—Experiment 1: Boruta Feature Selection Workflow

The Boruta algorithm was employed to select features to enhance model performance and interpretability. Boruta is a wrapper method that leverages the Extra Trees Classifier to identify and retain features that are statistically significant iteratively. The pseudocode of Algorithm 3 outlines the steps taken to perform Boruta-based feature selection on the datasets.
Algorithm 3: Boruta Feature Selection Workflow
1.
Import Required Libraries
  • Import libraries for data manipulation (pandas, numpy) and machine learning (ExtraTreesClassifier, BorutaPy).
2.
Load Dataset
  • Specify the file path of the dataset.
  • Read the dataset into a DataFrame.
3.
Separate Features and Target Variable
  • Extract the feature columns (X) by dropping non-feature columns (e.g., “label”, “file_name”).
  • Extract the target variable (y) from the DataFrame.
4.
Initialize ExtraTreesClassifier
  • Set up an ExtraTreesClassifier as the base estimator for the Boruta feature selection process.
  • Use balanced class weights and specify a random seed for reproducibility.
5.
Initialize Boruta Selector
  • Create a BorutaPy instance using the ExtraTreesClassifier:
  • Automatically determine the number of trees (n_estimators = ‘auto’).
  • Use the same random seed for reproducibility.
6.
Perform Feature Selection with Boruta
  • Fit the Boruta selector on the dataset (X and y) to identify relevant features.
7.
Retrieve Selected Features
  • Extract the names of the features that Boruta marked as “selected” (essential features).
  • Print the selected features for reference.
8.
Retrieve Tentative Features
  • Extract the names of the features that Boruta marked as “tentative” (uncertain importance).
  • Print the tentative features for review.
9.
Create a Reduced Dataset
  • Filter the original feature set to include only the selected features.
  • Add the target variable (y) back into the reduced dataset.
10.
Save the Reduced Dataset
  • Specify the output file path for the reduced dataset.
  • Save the reduced dataset as a CSV file.
11.
Display Confirmation
  • Print the file path of the saved reduced dataset for user confirmation.
Performance Evaluation on VAFD Using Boruta Feature Selection
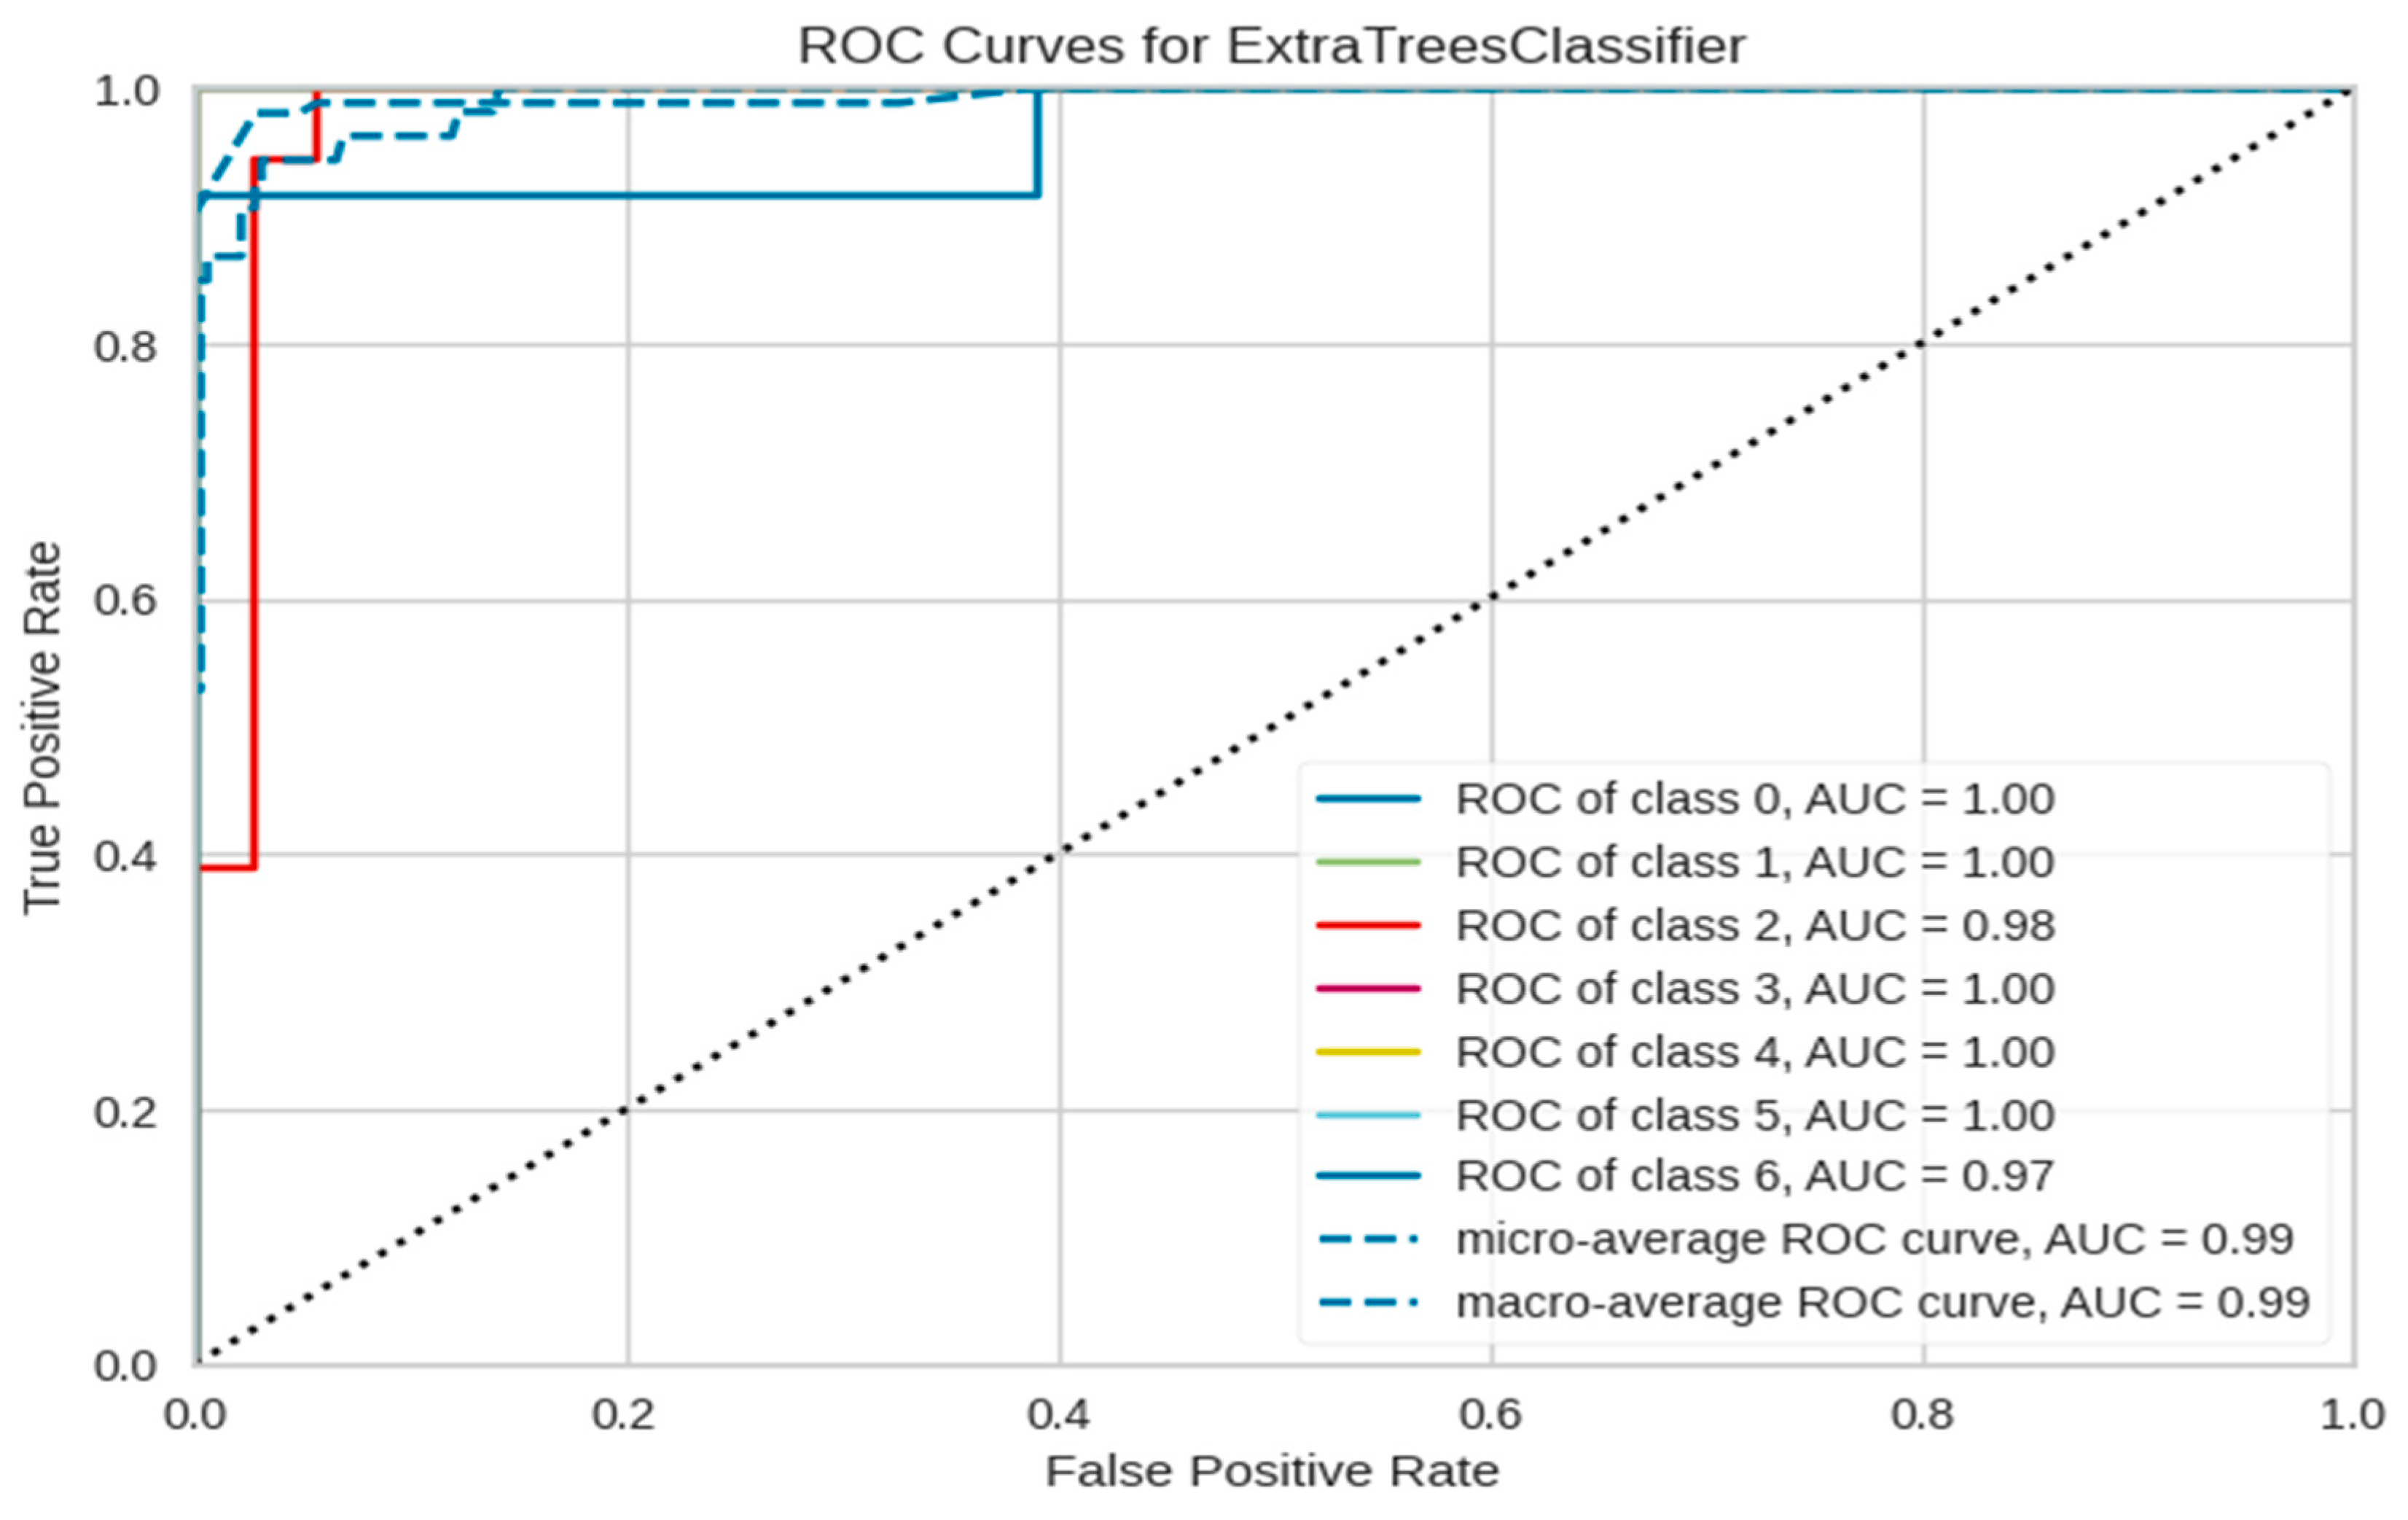
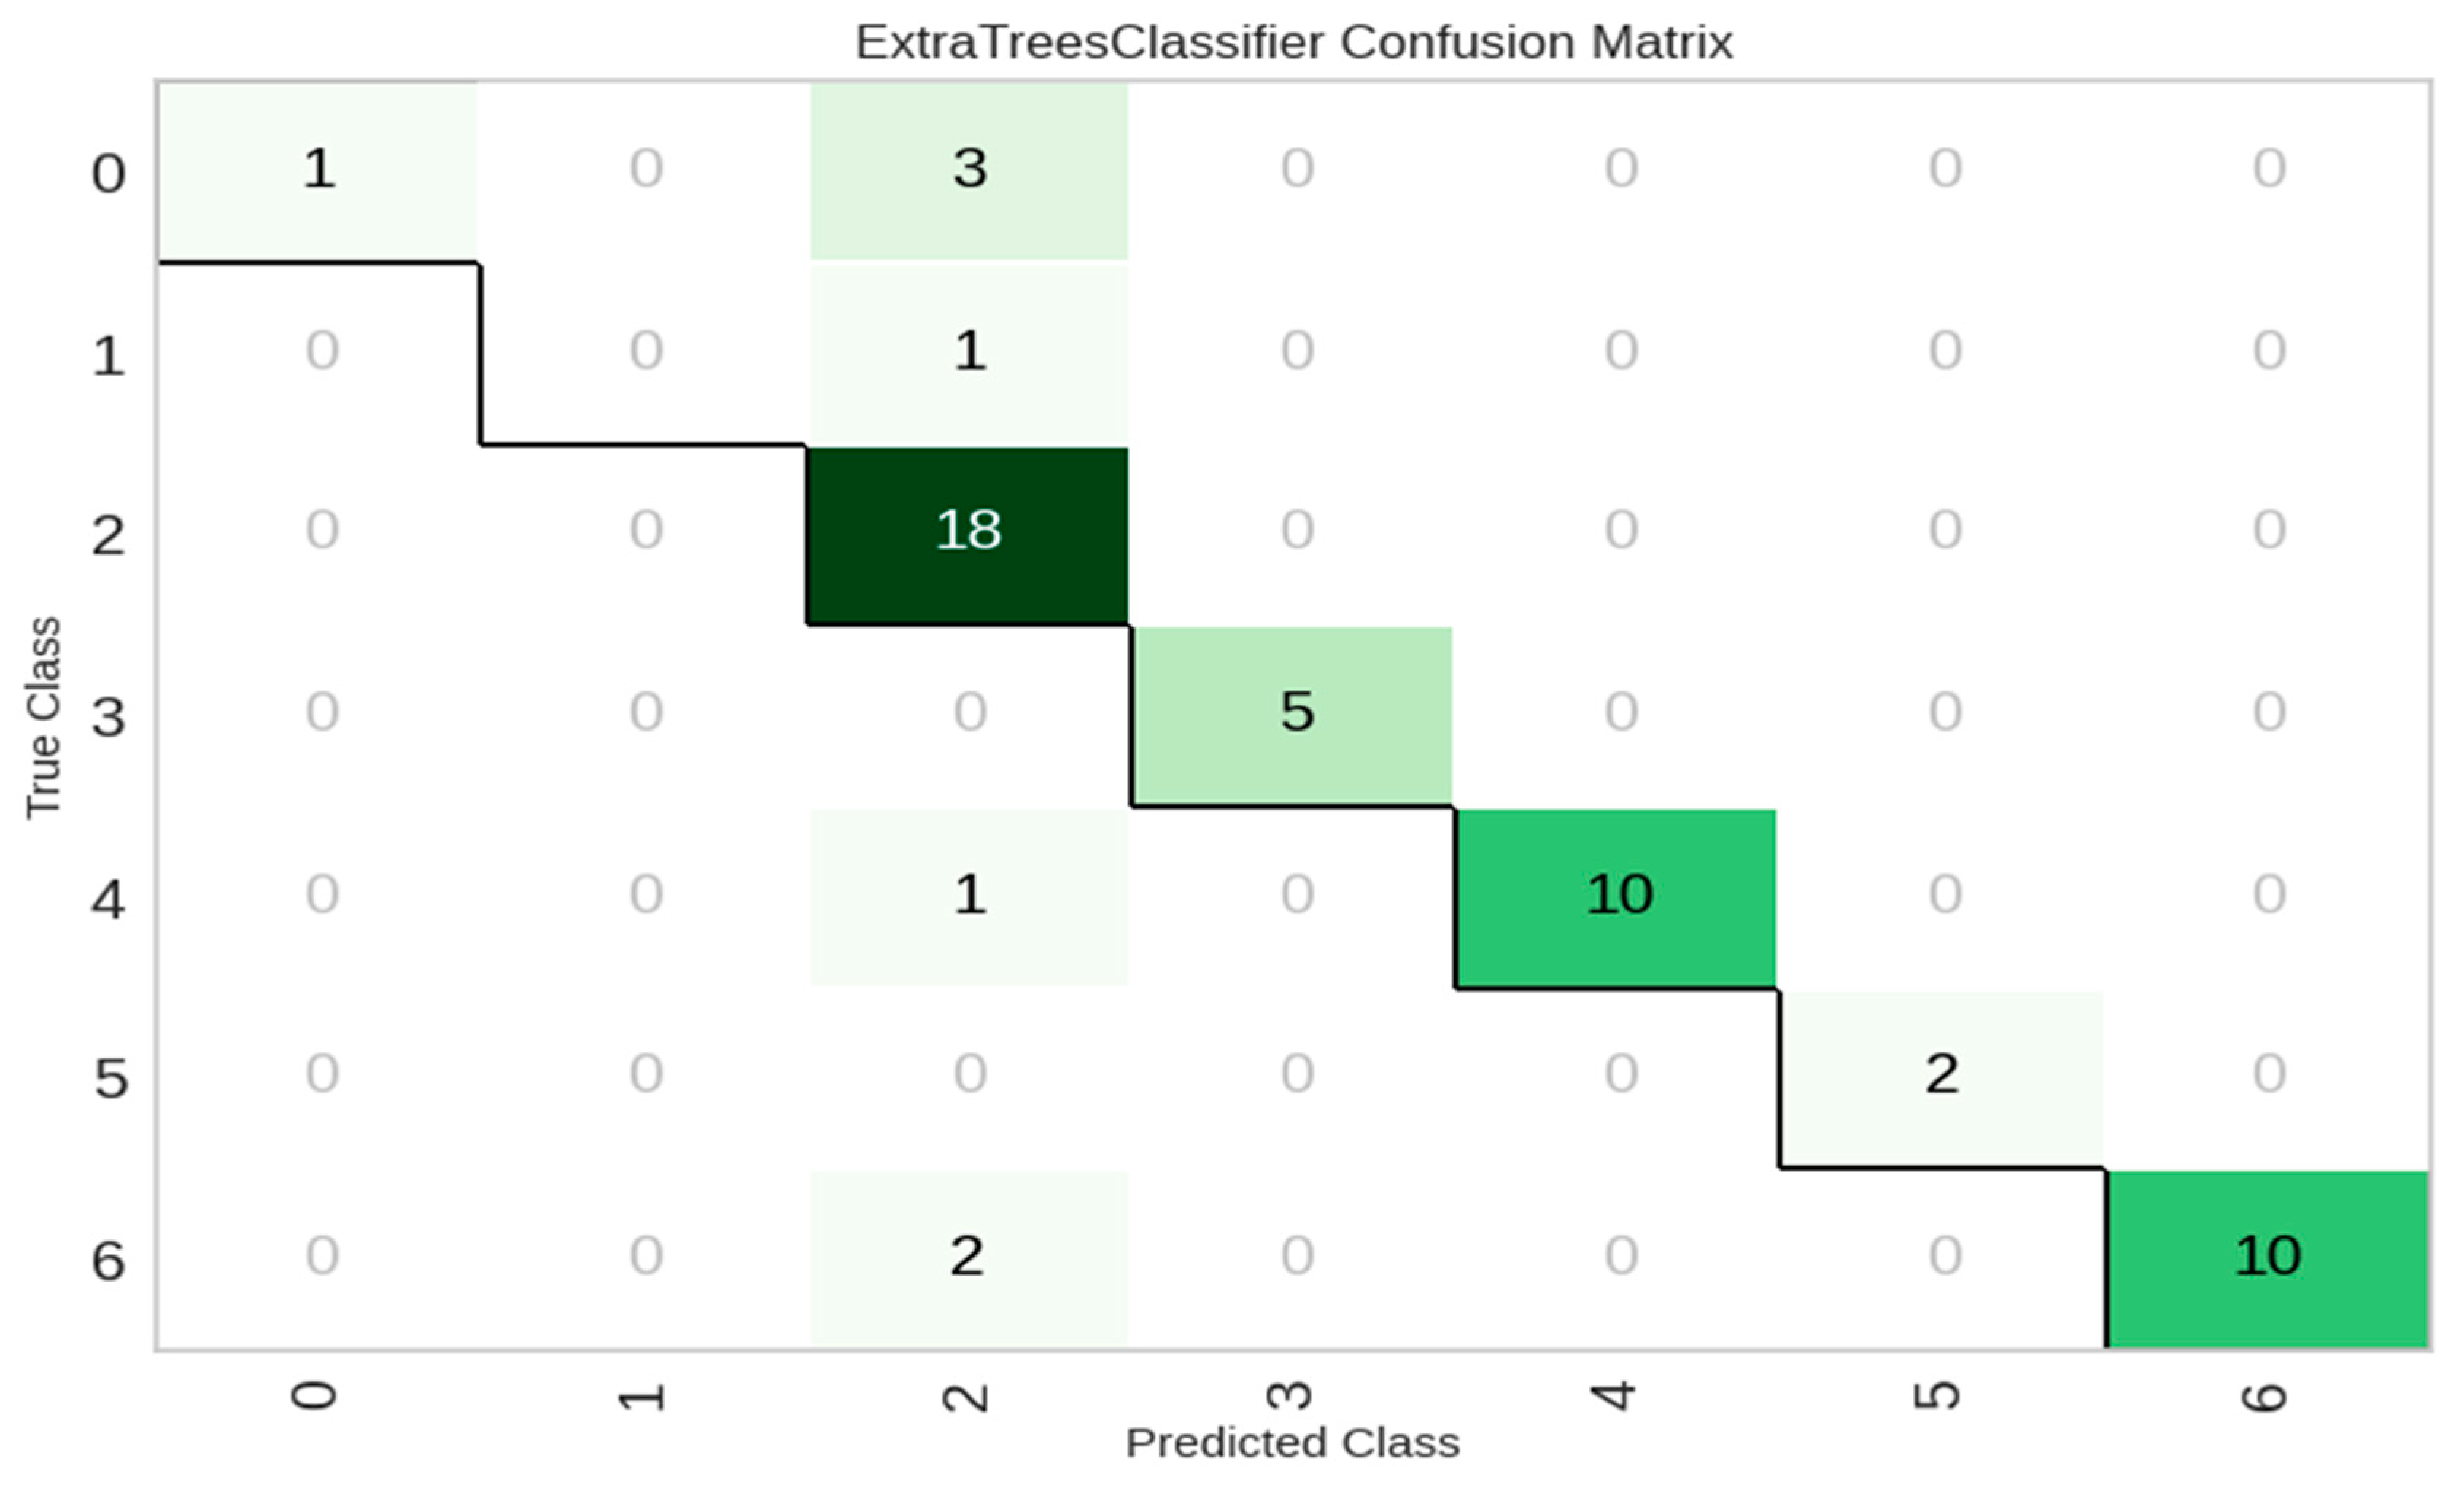
This subsection presents the classification performance of 15 machine learning models on VAFD using Boruta-based feature selection. A total of 45 features were selected as the most relevant according to the Boruta algorithm, and all models were trained and validated using 10-fold stratified cross-validation. As shown in Table 9, the Extra Trees Classifier achieved the highest accuracy of 91.03%, followed by LightGBM (86.15%) and Random Forest (83.46%). These results confirm the effectiveness of ensemble-based methods in capturing the acoustic variability in vehicle fault sounds. Traditional classifiers like Logistic Regression and Ridge showed moderate performance. At the same time, simpler models such as Naïve Bayes and KNN exhibited reduced effectiveness due to the high-dimensional nature of the features. The learning curve for the Extra Trees Classifier (Figure 16) reveals consistent improvement in cross-validation accuracy as training instances increase. Although a small gap remains between training and validation scores, the model demonstrates minimal overfitting and strong generalization capabilities. Further, the ROC curves in Figure 17 indicate near-perfect classification for most classes, with AUC values reaching 1.00 for five out of seven classes. The macro-average AUC stands at 0.99, underscoring the model’s robustness across all sound categories. Finally, the confusion matrix in Figure 18 illustrates high precision in identifying critical fault classes (e.g., 18 correctly classified instances in class 2 and 10 in class 6). However, minor misclassifications remain between acoustically similar categories, such as class 0 and class 2. These insights highlight areas for potential improvement through enhanced feature engineering or data augmentation.
Performance Evaluation on UEASD Using Boruta Feature Selection
Table 10 presents the performance of 15 machine learning models trained on UEASD using the top 52 features selected by the Boruta algorithm. The Light Gradient Boosting Machine (LightGBM) achieved the highest accuracy of 95.55%, closely followed by Extreme Gradient Boosting (XGBoost) and Extra Trees Classifier, with accuracies of 95.22% and 94.61%, respectively. These top-performing models also attained strong precision and recall values above 0.95, with high F1-scores and MCC values above 0.91, indicating a strong balance between sensitivity and specificity. The learning curve for LightGBM (Figure 19) shows a consistently high training score, indicating effective learning. Meanwhile, the validation score increases steadily with more training data, eventually converging near the training performance. The narrow confidence band toward the end indicates stable generalization as training instances increase.
In Figure 20, the ROC curves for LightGBM further support its robustness. The micro- and macro-average AUCs are both 0.99, while class-specific AUCs range between 0.97 and 1.00, demonstrating excellent discrimination capability across all six classes in the multiclass setting. The confusion matrix in Figure 21 confirms the model’s effective classification across different categories. Most classes exhibit very high true positive counts. For instance, class 0 had 456 correct predictions out of 468, while class 4 had 184 correctly identified instances. Misclassifications were sparse and mainly occurred in adjacent or acoustically similar classes, such as minor confusion between class 1 and class 3. These results underscore the significance of Boruta-based feature selection in enhancing model performance. LightGBM consistently capitalized on the selected features to yield high classification performance with low training time (2.6790 s). The ROC and confusion matrix analyses validate the model’s reliability in a real-world multiclass audio classification context.
Performance Evaluation on IVESD Using Boruta Feature Selection
For IVESD, the performance of 15 machine learning models was assessed using the top 47 features selected via the Boruta algorithm. The Extra Trees Classifier achieved the highest accuracy of 91.99%, outperforming all other models in terms of accuracy, recall (0.9190), precision (0.9170), F1-score (0.9121), and MCC (0.8690), as detailed in Table 11. It also reported a strong Cohen’s Kappa of 0.8676, indicating a high level of agreement beyond chance. Other competitive models included LightGBM (accuracy: 91.83%) and XGBoost (accuracy: 91.78%), showing slightly lower performance but with training times that varied substantially. Notably, the Gradient Boosting Classifier achieved a respectable 90.63% accuracy. Still, it required a significantly longer training time (approximately 53 s), which may limit its practical deployment in real-time applications. The learning curve of the Extra Trees Classifier (Figure 22) shows excellent generalization behavior. The model achieves near-perfect training accuracy, and the cross-validation curve consistently improves as training instances increase. This confirms the model’s stability and efficiency in learning from audio segments.
The ROC curve (Figure 23) highlights high discriminative capability across all 13 classes, with micro-average and macro-average AUC scores of 0.99 and 1.00, respectively. Most individual classes achieved AUCs near 1.00, underscoring the classifier’s robustness in distinguishing between various sound types in IVESD. The confusion matrix (Figure 24) reveals that the model achieved perfect classification for several classes, particularly class 4 (460 correct predictions). Misclassifications were relatively sparse and mostly occurred among acoustically similar classes, such as class 10 and class 11. Nevertheless, the overall classification performance demonstrates the model’s suitability for real-world multi-class sound classification tasks.

5.3.2. Phase 2—Experiment 2: Feature Ranking with ANOVA for MLP Evaluation

Using a neural network, an ANOVA-based feature ranking approach was applied to assess the influence of the number of features on classification performance. The Multilayer Perceptron Classifier (MLPClassifier) was trained and evaluated using a 10-fold stratified cross-validation technique across a range of feature subsets. Figure 25 summarizes the process of applying ANOVA feature selection with MLP evaluation. It includes data loading, normalization, iterative feature ranking, model evaluation, and performance visualization to identify the optimal feature subset.
While normalization was applied to control for inconsistencies across heterogeneous recording sources (e.g., varying microphones, distances, and environments), we acknowledge that this process may also reduce natural amplitude variations, which are an important cue for realism in real-world acoustic environments. The choice to normalize was driven by the need to ensure that classification models focused on the underlying spectral–temporal patterns of events rather than being influenced by differences in recording setups. However, preserving volume dynamics could provide additional discriminatory information, particularly in real-time ITS applications where sound intensity may signal urgency (e.g., emergency sirens approaching). This trade-off highlights an important limitation of the present study. Therefore, Future work will explore training and evaluation strategies that retain natural amplitude variations and adaptive normalization techniques to balance robustness with acoustic realism. The pseudocode that outlines the experimental procedure is added to the Appendix B.
Results and Insights for Datasets VAFD, UEASD, and IVESD
The results for VAFD revealed that the optimal number of features for MLP classification, when selected using ANOVA, was 33. This configuration yielded the highest mean accuracy of 0.9248, with a standard deviation of 0.0645, indicating relatively stable model behavior across folds. Figure 26 illustrates the relationship between model accuracy and the number of selected features. The plot shows a consistent improvement in performance as the number of features increases up to 33. Beyond this point, the model’s accuracy plateaus and slightly fluctuates, suggesting that including more features beyond the optimal subset does not significantly enhance classification accuracy and may introduce redundancy. The selected features primarily include mid-to-high-order MFCCs and chromagram-based statistics, reflecting their discriminative power in sound classification tasks. Identifying this optimal feature count improves model performance while reducing computational complexity. These findings highlight the importance of proper feature selection in training robust neural classifiers, particularly when working with high-dimensional audio representations.
For UEASD, evaluating feature subsets ranked by ANOVA yielded consistently high classification performance across a wide range of feature counts. The best performance was achieved using 21 features, reaching a mean accuracy of 96.15% with a standard deviation of only 0.0101, indicating high predictive power and stability. The selected subset included a diverse range of features derived from MFCC means, chromagram means, and mel spectrogram mean, suggesting that both spectral envelope (MFCCs) and harmonic content (chromagram) significantly contribute to model performance. Notably, features such as ‘mfcc_mean_6’, ‘mfcc_mean_7’, and ‘chromagram_mean_5’ appeared among the most influential. As shown in Figure 27, the model maintains a mean accuracy exceeding 95.5% across most feature counts, with a relatively narrow band of standard deviation. This demonstrates that UEASD is inherently more learnable, and the MLP classifier exhibits strong generalization even with moderately sized feature sets. However, beyond approximately 40 features, there is a slight increase in variability, and no substantial gain in accuracy is observed. These results reinforce the efficacy of ANOVA-based feature ranking for this dataset and affirm that optimal performance can be achieved without using all 52 features, making the approach suitable for computationally efficient deployment scenarios.
The results of ANOVA-based feature ranking followed by MLP classification for IVESD revealed optimal performance using a reduced set of 23 features, achieving a mean accuracy of 0.9472 and a standard deviation of 0.0123. This result reflects a solid balance between model complexity and generalization ability. The top-ranked features primarily consisted of MFCC means, chromagram means, and some standard deviation components, showing consistency with patterns observed in VAFD and UEASD. Notably, mfcc_mean_1 through mfcc_mean_12, along with mfcc_std_2, and chromagram features from chromagram_mean_1 to chromagram_mean_9, were frequently selected in the most accurate feature subset. Figure 28 illustrates the model accuracy trend as a function of the number of selected features. A general improvement in performance is observed as the number of features increases from 20 to around 28–30, after which the mean accuracy slightly plateaus and fluctuates. The standard deviation remains relatively low throughout, indicating stable performance.
ANOVA Feature Ranking with MLP Evaluation
This subsection presents a comparative analysis of feature selection performance using ANOVA-based ranking, followed by model evaluation with a Multi-Layer Perceptron (MLP). Each dataset’s features were ranked by ANOVA F-scores and incrementally evaluated using 10-fold stratified cross-validation over a defined feature range. The objective was to identify the optimal number of features that yields the highest model accuracy with minimal variance. Table 12 summarizes the top-performing feature subsets for each dataset, including the number of selected features, mean accuracy, standard deviation, and the most influential features.
Observations: As shown in Table 12, UEASD achieved the best classification performance with the fewest features (21), demonstrating the benefit of selecting compact but highly informative feature subsets. VAFD, while utilizing the largest subset (33 features), exhibited a wider accuracy fluctuation with the highest standard deviation. In contrast, IVESD balanced performance and stability, yielding a relatively high accuracy with moderate variance. Across all datasets, MFCC mean values and chromagram mean features consistently appeared among the most discriminative, confirming their importance in audio-based classification tasks. These findings support the effectiveness of ANOVA-based ranking when combined with neural network evaluation, especially in identifying compact, robust feature subsets for multiclass sound classification.

5.3.3. Phase 2—Experiment 3: SHAP-Based Feature Selection and Evaluation

This subsection introduces a comprehensive SHAP-based framework for feature selection and performance evaluation, tailored to enhance interpretability and optimize classification models across multiple datasets. SHAP (SHapley Additive exPlanations) values offer a robust, model-agnostic approach to quantifying the contribution of each input feature to the model’s predictions, grounded in cooperative game theory. This pipeline aims to identify the most influential audio features contributing to classification accuracy and determine the optimal number of features that balance performance with model complexity.
To achieve this, a structured methodology is followed, which begins with data loading, preprocessing, and the training of a baseline Multi-Layer Perceptron (MLP) model. SHAP values are then computed using a kernel-based explainer to assess the importance of each feature. Based on the resulting importance rankings, a series of top-k feature subsets is evaluated through 10-fold stratified cross-validation. This enables precise measurement of model performance across varying feature counts. This iterative evaluation facilitates the identification of the minimal yet most informative set of features. In addition, visualizations and ranked tables are generated to support transparency, reproducibility, and comparative analysis.
The following components detail the full implementation workflow: a step-by-step pseudocode of the SHAP pipeline, methodological overview, feature ranking strategy, and performance evaluation results across datasets. This integrative approach enables a data-driven feature reduction process while maintaining classification performance. It is suitable for real-time systems and interpretable AI applications. The Pseudocode of the SHAP Feature Selection Workflow is in the Appendix B. Figure 29 summarizes the key steps for SHAP-guided feature selection: environment setup, data preprocessing, MLP model training, SHAP value computation, feature ranking, optimal subset identification, and result visualization.
Methodological Overview
The SHAP-based pipeline was designed to quantify the contribution of each feature to model predictions and evaluate the classification performance for different feature subset sizes. Table 13 outlines the sequential steps followed in the SHAP-based feature selection pipeline. The process begins with loading and preprocessing the dataset, then training an initial MLP model. SHAP values are then computed to assess feature importance, which are used to rank and select subsets of features. Each subset is evaluated using 10-fold stratified cross-validation to measure classification performance. The optimal number of features is determined based on the highest validation accuracy, and the relationship between feature count and performance is visualized to support the interpretability and reproducibility with the following key steps:
  • Data Loading and Validation: Ensure essential columns (label, file_name) exist.
  • Preprocessing: Standardize features with StandardScaler.
  • Model Training: Use a consistent MLP configuration for comparability.
  • SHAP Calculation: Use kernel-based SHAP on a sampled subset to reduce computational overhead.
  • Ranking: Features were ranked using average SHAP values.
  • Evaluation: Perform 10-fold cross-validation to evaluate accuracy across feature counts.
SHAP-Based Feature Selection and Evaluation (VAFD)
To assess feature importance and interpret model predictions on VAFD, SHAP (SHapley Additive exPlanations) analysis was applied using a Multi-Layer Perceptron (MLP) classifier. The model was trained on the standardized input features, and SHAP values were computed to estimate the contribution of each feature to the final output. Figure 30 illustrates the SHAP summary plot for VAFD, which shows the distribution of SHAP values across individual instances. The color gradient in the plot represents feature values, where red indicates high values and blue indicates low values.
Table 13. SHAP-Based Feature Selection and Evaluation Workflow.
StepDescription
1. Load DatasetCheck and prepare audio features and labels.
2. Preprocess FeaturesNormalize all features using StandardScaler.
3. Train Initial ModelFit an MLP model with fixed parameters.
4. Compute SHAP ValuesUse KernelExplainer with 100 background and 50 sampled data points.
5. Rank FeaturesUse mean absolute SHAP values to order features.
6. Feature SelectionEvaluate models with top-k features (k from 20 to 52).
7. Cross-ValidationUse stratified 10-fold validation to assess mean accuracy.
8. Optimal Feature CountSelect a number of features giving the highest validation accuracy.
9. VisualizationGenerate plots of accuracy vs. feature count.
Features such as mfcc_std_9, chromagram_std_6, and mfcc_std_7 exhibited high variability and strong influence, as evident by their wide spread from the SHAP baseline. These features significantly differentiate classes and are visually dominant in the summary plot. To complement this, Figure 31 presents a bar chart summarizing all features’ average absolute SHAP values, ranking them according to global importance. This bar plot confirms that mfcc_std_9 is the most influential feature with a mean SHAP value of 0.0197, followed by chromagram_std_6 at 0.0107 and mfcc_std_7 at 0.0088. provides the complete ranked list of features based on their mean SHAP values. The concentration of high-ranking features within the MFCC and chromagram domains highlights their significance in representing audio patterns relevant to classification tasks.
The analysis reveals that MFCC-based features, especially the standard deviation components, consistently rank at the top. This suggests that variations in frequency content are critical for distinguishing sound events in VAFD. Chromagram-based features, particularly chromagram_std_6, chromagram_std_5, and chromagram_std_10, also play a key role, indicating that harmonic structure information complements the spectral characteristics captured by MFCCs. Lower-ranked features, while less impactful, still contribute marginally to prediction but exhibit diminishing returns regarding accuracy improvement. Overall, SHAP-based evaluation provided a transparent and quantitative method for feature selection, identifying the most relevant subset of features without sacrificing interpretability. The visualizations and ranked table support informed decision-making in downstream modeling, facilitating the selection of optimal features for high accuracy and computational efficiency.
SHAP-Based Feature Importance and Evaluation—UEASD
To evaluate the importance of each feature in UEASD, SHAP (SHapley Additive exPlanations) analysis was conducted using a Multi-Layer Perceptron (MLP) classifier. The classifier was trained on standardized input data. SHAP values were computed using a kernel explainer with a sampled subset of instances. Figure 32 illustrates the SHAP summary plot, where each point represents a SHAP value for a specific instance. The color gradient indicates the feature value, with red denoting high values and blue denoting low values. Notably, features such as mfcc_mean_2, mfcc_mean_9, and mfcc_mean_1 demonstrated the most substantial impact on model output. The corresponding bar plot in Figure 33 shows the mean absolute SHAP values for the top 20 features, reaffirming the dominance of MFCC features (mfcc_mean_2, mfcc_mean_9, mfcc_mean_1, mfcc_std_2, and mfcc_mean_3) and key chromagram statistics such as chromagram_mean_7 and chromagram_mean_6. These features exhibited high contribution magnitudes, with mfcc_mean_2 reaching an average SHAP value of 0.0593, followed closely by mfcc_mean_1 (0.0510) and mfcc_mean_9 (0.0488).
The ranking was based on SHAP values, and model performance across different feature subset sizes was evaluated iteratively. A total of 52 features were ranked, and the distribution of importance indicates that MFCC means and standard deviations provide dominant signals for classification in UEASD. Chromagram-based features, while slightly lower in magnitude, still offered meaningful contributions, especially in the middle and lower portions of the ranked list. The lowest-ranked features include mfcc_std_0, chromagram_mean_4, mfcc_std_4, and mel_spectrogram_std, which had marginal SHAP values around or below 0.004. These results suggest that SHAP-based feature selection provides a reliable interpretability measure and guides effective feature subset selection that supports optimal model performance.
SHAP-Based Feature Selection and Evaluation—IVESD
To assess feature relevance in IVESD, SHAP values were calculated using a Multi-Layer Perceptron (MLP) classifier trained on standardized input features. The SHAP analysis provides insight into how individual features contribute to the model’s output, both in magnitude and direction. As illustrated in Figure 34, the SHAP summary plot shows the dispersion of SHAP values across the top influential features, with color gradients representing the feature values (red = high, blue = low). Features like mfcc_std_9, mfcc_std_1, and chromagram_std_6 consistently exhibited high SHAP values, indicating their significant impact on the model’s predictions.
The corresponding bar chart in Figure 35 ranks the features based on their mean absolute SHAP values, providing a more stable view of average influence. As seen, the top-ranked feature was mfcc_std_9 with a mean SHAP value of approximately 0.00126, followed closely by mfcc_std_1 and chromagram_std_6 with values of 0.00124 and 0.00096, respectively. These features are consistently ranked at the top across the summary and bar plots, reinforcing their relevance in classification decisions. The complete ranked list of features, presented in Tables (Appendix B), includes 52 attributes with varying contributions. Mid-ranked features such as mfcc_mean_4, mfcc_std_8, and chromagram_mean_6 had moderate but consistent influence, while lower-ranked features such as mfcc_std_12, chromagram_mean_3, and mel_spectrogram_mean contributed minimally. The difference in SHAP values across this spectrum reflects the dataset’s diversity and redundancy. Overall, the SHAP-based evaluation for IVESD confirms that a limited subset of features—particularly statistical representations of MFCCs and chromagrams—can effectively drive model predictions. These insights can guide dimensionality reduction strategies and help optimize performance without sacrificing interpretability or accuracy.

5.4. Feature Selection Performance Analysis

To assess how the number of selected features affects model performance, we evaluated subsets of top-ranked features—ranked by SHAP values—using stratified 10-fold cross-validation. We systematically varied the number of selected features for each dataset from 20 to 52 and recorded the corresponding classification accuracy. As illustrated in Figure 36, the accuracy trend for VAFD shows a consistent increase with the number of features, peaking at 43 features, where the model achieved a cross-validation accuracy of 0.9144.
Beyond this point, no significant improvements were observed, indicating that additional features introduced redundancy rather than boosting predictive performance. For UEASD, the optimal feature count was 29, yielding the highest accuracy of 0.9607, as shown in Figure 37. Notably, performance began to degrade when more than 30 features were included. This suggests that a smaller subset of highly informative features was sufficient to capture the discriminative structure of the data, and adding more features may have led to overfitting or noise. In IVESD, the model achieved its best accuracy of 0.9381 using 43 features, as depicted in Figure 38.
Like VAFD, the performance curve plateaued after this point, indicating an optimal trade-off between feature richness and generalization capability. These findings reinforce the value of SHAP-based feature selection in identifying the most impactful attributes while reducing dimensionality. By visualizing the relationship between feature count and classification accuracy, this analysis supports the selection of compact, interpretable feature subsets that preserve or enhance model performance. The identified optimal feature counts (43 for VAFD and IVESD, and 29 for UEASD) are benchmarks for balancing performance and computational efficiency in practical deployments, as shown in Table 14.

6. Discussion

This study presents a detailed investigation of sound-based vehicle diagnostics and emergency signal recognition using a combination of machine learning classifiers and three distinct feature selection strategies across multiple datasets. The results demonstrate the feasibility, reliability, and interpretability of audio-based classification systems for Intelligent Transportation Systems (ITS). The findings reflect careful experimental design, rigorous performance evaluation, and a commitment to balancing accuracy with transparency and computational efficiency. Across all three datasets—VAFD, UEASD, and IVESD—ensemble-based models consistently outperformed traditional classifiers. Extra Trees, LightGBM, and XGBoost exhibited superior accuracy and robustness, with AUC values exceeding 0.99 in most scenarios. These results validate the capacity of ensemble methods to handle high-dimensional, acoustically complex inputs and suggest their suitability for real-time ITS deployment. Notably, Extra Trees performed best on VAFD and IVESD. At the same time, LightGBM excelled on UEASD, likely due to its effectiveness in capturing patterns within structured, distinct emergency sound classes.
The role of feature selection was central to this study. Three techniques—Boruta, SHAP, and ANOVA—were employed to reduce dimensionality and improve interpretability without compromising accuracy. Each method offered unique advantages. Grounded in statistical significance testing, ANOVA-based selection produced the highest classification accuracy with the fewest features across all datasets (e.g., 90.13% on VAFD using only 38 features). This suggests that ANOVA eliminates redundant features while preserving those with the highest-class discriminative power. It is ideal for resource-constrained or edge-based applications where lightweight models are essential.
In contrast, SHAP-based feature selection prioritized model interpretability. By providing local and global explanations of feature contributions to MLP classifier predictions, SHAP enabled deep insight into which features most influenced classification outcomes. Although SHAP required slightly more features and higher computational effort than ANOVA, the trade-off was justified in applications demanding explainability—such as regulatory-compliant ITS platforms or diagnostics requiring human oversight. SHAP visualizations revealed the consistent importance of MFCCs and Chroma-related features across all datasets, reinforcing their centrality in acoustic scene classification. Boruta, a wrapper-based method that leverages ensemble learning, also demonstrated competitive accuracy but with a higher feature count and longer computation time. While it reliably retained all relevant features and avoided underfitting, the increased model complexity makes Boruta less practical for real-time inference tasks, especially compared to the compactness achieved via ANOVA.
A comparative analysis of classification accuracy as a function of the number of selected features showed a common trend: model performance improves significantly up to a threshold (approximately 25–35 features), after which gains become marginal or decline. This plateauing effect was observed across all classifiers, affirming the importance of selecting an optimal feature subset to avoid overfitting and reduce computational cost. Furthermore, the learning curves across datasets confirmed that ensemble classifiers achieved high generalization ability with minimal overfitting. ROC curves and confusion matrices showed high sensitivity and specificity, with most misclassifications occurring among acoustically similar classes—such as overlapping engine faults or closely related emergency tones—highlighting areas where data augmentation or multimodal fusion (e.g., combining audio with vibration or image data) may further improve performance. From an ITS deployment perspective, these findings carry strong implications. The study demonstrates that audio-based diagnostics can serve as a non-intrusive, scalable alternative to traditional sensor-based systems, especially in scenarios where installation costs or system invasiveness are constraints. The proposed system offers high accuracy, interpretability, and operational feasibility by leveraging efficient feature selection and robust classifiers. It is a compelling candidate for integration into smart vehicles, roadside monitoring units, or urban traffic management platforms.
This research provides strong empirical evidence that combining ensemble-based classifiers with interpretable and statistically grounded feature selection techniques can yield highly accurate and explainable sound classification systems. ANOVA emerges as the best choice for maximizing performance with minimal features, while SHAP supports transparency in model behavior. These findings position the proposed system as a practical, reliable, and interpretable tool for real-time sound-based ITS applications. It sets a foundation for future enhancements such as hybrid feature selection strategies or deep learning-based end-to-end pipelines.
Table 15 compares the best achieved classification accuracy and the number of selected features across different feature selection strategies: ANOVA, Boruta, and SHAP. For ANOVA, the results are reported for both Extra Trees and MLP classifiers to reflect their impact across different modeling paradigms. Across all three datasets, SHAP combined with the MLP classifier consistently achieved the highest classification performance, achieving accuracies of 91.44%, 96.07%, and 93.81% for VAFD, UEASD, and IVESD, respectively. Notably, when using ANOVA-based feature selection with MLP, the classification accuracy improved, reaching 92.48%, 96.15%, and 94.72% for the three datasets. These results demonstrate the powerful synergy between effective feature selection and the capacity of neural networks to learn complex representations. Comparing feature selection techniques, SHAP and ANOVA (when paired with MLP) generally outperformed Boruta across all datasets. Although Boruta produced competitive results, it tended to select more features (e.g., 45 for VAFD and 52 for UEASD), indicating higher model complexity. In contrast, ANOVA with MLP achieved superior or comparable performance using significantly fewer features, such as 21 for UEASD and 23 for IVESD, which is advantageous for building more efficient models with lower computational costs.
For traditional ensemble models like Extra Trees and LightGBM, ANOVA and Boruta provided strong baseline results. However, they were generally outperformed by MLP when coupled with either ANOVA or SHAP feature selection, emphasizing the ability of deep models to leverage optimized feature subsets for higher accuracy. In conclusion, the results highlight that while Boruta effectively retains a comprehensive set of relevant features, ANOVA-based selection, particularly when integrated with MLP classifiers, delivers superior classification performance with a reduced feature set. SHAP-based selection further reinforces model interpretability while maintaining high accuracy. It is highly suitable for sound-based intelligent transportation applications where performance and explainability are crucial.
To contextualize the performance of our proposed sound-based classification framework within the current research landscape, we compare it against several recent state-of-the-art (SOTA) methods. These studies span applications in vehicle fault detection, emergency sound recognition, and urban sound classification. The comparison considers dataset characteristics, feature selection methods, classification models, explainability, and reported accuracies.
The proposed method demonstrates superior performance with an accuracy of up to 96.15%, achieved through a combination of interpretable feature selection techniques (SHAP, Boruta, ANOVA) and robust classifiers (Extra Trees, MLP, LightGBM) as shown in Table 16. The integration of explainability tools like SHAP enhances the transparency of the model, making it suitable for deployment in safety-critical Intelligent Transportation Systems (ITSs). In contrast, Rashed et al. [12] employed a Bayesian-Optimized Weighted Soft Voting framework, achieving a respectable accuracy of 91.04%. However, their approach lacks model interpretability and is tailored towards publicly sourced datasets, which may not capture the intricacies of real-world vehicle fault scenarios. Fedorishin et al. [65] introduced a multimodal Sound Event Detection (SED) framework for fine-grained engine fault detection, leveraging audio and vibration data. While their approach is innovative, specific accuracy metrics are not reported, and the lack of feature selection and explainability tools may limit its applicability in real-time ITS environments.
Terwilliger and Siegel [66] developed a cascading CNN architecture for acoustic vehicle characterization, achieving 93.6% accuracy on validation data and 86.8% on test data. Their method focuses on vehicle attribute prediction and misfire fault detection but does not incorporate explainability mechanisms. Salamon et al. [67] presented a CNN-based approach to urban sound classification using the UrbanSound8K dataset, achieving an accuracy of 89.5%. While foundational, this method does not employ feature selection or explainability tools, which are increasingly important in modern ITS applications. In summary, the proposed method achieves high accuracy. It emphasizes model interpretability and applicability to real-world ITS scenarios, setting it apart from existing approaches.
While these findings demonstrate the proposed framework’s technical feasibility, accuracy, and interpretability, it is equally important to consider the broader challenges that may affect real-world deployment in Intelligent Transportation Systems.
Security Perspective. Beyond accuracy and interpretability, real-world deployment of acoustic diagnostic systems must also consider system security. Recent studies emphasize that ITSs and vehicular infrastructures are vulnerable to cyber and physical threats, requiring robust protection measures. Notable contributions include security-aware vehicular networks, intrusion detection in connected vehicles, adversarial robustness for autonomous driving, and cybersecurity frameworks for IoT-enabled transportation [75,76,77,78]. In addition, advanced research has shown how targeted adversarial audio attacks—such as selective audio perturbations, silent-voice injections, and style-transfer–based detection methods—can manipulate or deceive recognition models while remaining imperceptible to humans. These findings highlight that diagnostic solutions such as ours should ultimately be embedded into secure ITS architectures to ensure resilience, reliability, and trustworthiness, which will be a focus of our future research.
Taken together, these considerations underline that the proposed acoustic diagnostic framework is not only technically effective and inclusive but also positioned to be integrated into secure and reliable ITS infrastructures, which will be the focus of future research extensions.

7. Conclusions

This study introduced an interpretable and scalable audio-based framework for Intelligent Transportation Systems (ITSs), addressing vehicle fault diagnostics and emergency sound recognition. Using three curated datasets, the system combined feature-rich audio representations with Boruta, SHAP, and ANOVA feature selection to achieve strong performance, with ensemble models such as Extra Trees, LightGBM, and XGBoost consistently outperforming traditional approaches. ANOVA yielded compact, high-performing models, while SHAP provided transparency by revealing feature contributions—an essential requirement in safety-critical ITSs. The results highlight sound-based diagnostics as a non-intrusive, cost-effective complement to conventional sensors, with potential for real-time deployment in smart vehicles and roadside units. Future work will focus on deploying the framework on edge devices, extending it to multimodal integration, and conducting systematic evaluations with independent test sets and nested cross-validation to ensure stronger evidence of generalization. Future work will explore adaptive normalization strategies that preserve natural amplitude variations while ensuring robustness across diverse recording conditions. Future work will also benchmark inference latency and memory usage to assess the feasibility of deploying the framework in embedded or resource-constrained automotive environments.

Author Contributions

Conceptualization, A.R., M.B. and M.A.E.; methodology, M.B., A.B. and M.A.; software, A.R., R.E. and T.A.F.; validation, A.B., H.A.S. and R.E.; formal analysis, A.R., M.A. and T.A.F.; investigation, A.B. and H.A.S.; resources, R.E. and A.R.; data curation, A.R., T.A.F. and M.A.E.; writing—original draft preparation, A.R., A.B., H.A.S. and R.E.; writing—review and editing, M.B., T.A.F. and M.A.E.; visualization, A.R., H.A.S. and A.B.; supervision, M.A.E. and M.A.; project administration, T.A.F. and M.A.E.; funding acquisition, M.A.E. All authors have read and agreed to the published version of the manuscript.

Funding

This work is supported by funds from the King Salman Center for Disability Research (Group no.: KSRG-2024-240).

Data Availability Statement

All data supporting the findings of this study are publicly available in the GitHub repository Sound-Based Vehicle Diagnostics and Emergency Signal Recognition at https://github.com/amrrashed/Beyond-Sensors-Audio-Based-ML-for-Real-Time-Vehicle-Fault-Emergency-Classification (accessed on 26 August 2025).

Acknowledgments

The authors extend their appreciation to the King Salman Center for Disability Research for funding this work through Research Group No. KSRG-2024-240.

Conflicts of Interest

The authors declare no conflicts of interest.

Appendix A. Dataset

Appendix A.1. Contribution to Dataset Refinement

In this study, we extended and refined the structure of two previously developed datasets—Vehicular Acoustic Fault Dataset (VAFD) and Urban Emergency and Ambient Sound Dataset (UEASD)—to enhance their effectiveness for machine learning-based sound classification in intelligent transportation systems (ITS).
  • For VAFD, a new category, General Vehicle Sounds, was introduced to represent normal car operation, enabling more precise differentiation between faulty and non-faulty audio patterns. A new fault class, Timing Chain Noise, was added, increasing the total number of detailed labels from 27 to 29.
  • For UEASD, several new categories were introduced to expand the diversity of non-vehicular acoustic events. These include weather sounds (e.g., rain and thunder), fire alarms, forest fire sounds, and snake sounds, reflecting environmental and public safety contexts relevant to ITS.
In the original version, VAFD included 27 labels and UEASD included 22, resulting in 49 labels in the Integrated Vehicle and Environmental Sound Dataset (IVESD). In the current version, two new labels (Timing Chain Noise, Car Normal Noise) have been added to VAFD, and four new labels (Forest Fire Sound, Fire Alarm, Rain and Thunderstorm, Snake Sound) have been introduced to UEASD. A consolidated classification scheme has been adopted, reorganizing VAFD into 7 broader categories (from 29 fine-grained labels) and UEASD into 6 categories (from 26 labels).
This restructuring aims to:
  • Improve model generalization across diverse acoustic conditions;
  • Address class imbalance challenges; and
  • Facilitate higher-level semantic learning to support scalable and robust ITS applications.

Appendix A.2. Description of the VAFD Dataset

Group No.CategoryNumber of Unique LabelsNumber of Instances
1Belt and Accessory Issues312
2Braking System Issues14
3Engine and Powertrain Issues1161
4Exhaust and Fuel System Issues416
5General Vehicle Sounds138
6Miscellaneous Issues15
7Suspension and Steering Issues839
Total29175

Appendix A.3. Fine-Grained Label Distribution Across VAFD Categories

GroupLabelCountGroupLabelCountGroupLabelCount
1. Belt and Accessory IssuesEngine Chirping/Squealing Belt43. Engine and Powertrain IssuesThrown Rod47. Suspension and Steering IssuesUniversal Joint Failure/Steering Rack Failure10
Squeaky Belt4Lifter Ticking4Steering Groaning/Whining (Low Power Steering Fluid)4
Timing Chain Noise (New)4Steering Noise4
Vacuum Leak4Turning Front End Clicking/Bad CV Axle4
2. Braking System IssuesBraking System Issues4Bad Wheel Bearing21
4. Exhaust and Fuel System IssuesExhaust and Fuel System Issues4Muffler Running Loud/Exhaust Leak4
Radiator Fan Failure4
Fuel Pump Cartridge Fault4
5. General Vehicle SoundsCar Normal Noise (New)386. Miscellaneous IssuesWheel Bearing Issue + Transmission Whining + Catalytic Converter Issue5
3. Engine and Powertrain IssuesBad CV Joint4Knocking5
Bad Transmission4 Clunking Over Bumps/Bad Stabilizer Link4
Engine Rattle Noise4Strut Mount Failure4
Flooded Engine4Suspension Arm Fault4
Pre-ignition4
Engine Misfire4
Seized Engine4

Appendix A.4. Fine-Grained Label Distribution Across UEASD Categories

GroupLabelCountGroupLabelCountGroupLabelCount
AnimalsCats200Vehicles and TransportationCar Crashes103Emergency VehiclesPolice Car Siren41
Sheep80 Car Horn24 Fire Truck Siren37
Bear68 Motorcycle20 Ambulance Siren30
Dog68 Bus20 Forest Fire Sound (New)1440
Monkey60 Bike20 Fire Alarm (New)12
Lions48 Train20Weather Sounds (New)Rain and Thunderstorm29
Wolf47 Truck Sound20
Horse40 Truck Horn19Construction and MachineryDrilling24
Mouse28 Weapons and ExplosionsGunshot and Gunfire62
Snake (New)11

Appendix B. Pseudo Code

Appendix B.1. Pseudo Code for Feature Extraction 52 Features

#Configuration
Define ROOT_DIR as the root directory containing audio dataset.
Define OUTPUT_FEATURES_CSV as the path to save extracted features.
Define TARGET_SAMPLE_RATE as the target sample rate for audio processing.
#Function to extract audio features
Function extract_features(file_path):
  Try:
    Load audio file from file_path with TARGET_SAMPLE_RATE.
    Calculate Mel Spectrogram and convert it to dB scale.
    Calculate MFCCs (13 coefficients).
    Calculate Chromagram.

    Compute mean and standard deviation for:
      -Mel Spectrogram
      -MFCCs (per coefficient)
      -Chromagram (per feature)

    Return the extracted features as a dictionary.
  Catch exceptions and print an error message.
  Return None if an error occurs.

#Get all subfolders in ROOT_DIR
List input_folders containing subdirectories in ROOT_DIR.

#Initialize an empty list for storing all features
Initialize all_features as an empty list.

#Loop through each subfolder in input_folders
For each folder in input_folders:
  Get the full path of the folder as input_folder.

  #Loop through all files in the folder
  For each file_name in input_folder:
    Get the full file path as file_path.

    If file_path is a valid audio file (extension .wav, .m4a, or .mp3):
      Print that the file is being processed.
      Extract features using extract_features(file_path).

      If features are successfully extracted:
        Add folder name as the label.
        Add file_name to the features.
        Append the features dictionary to all_features.
#Save features to a CSV file
If all_features is not empty:
  Initialize flat_features as an empty list.
    #Flatten nested feature dictionaries
  For each feature dictionary f in all_features:
    Create a new dictionary flat with:
      -file_name
      -label
      -Mean and Std of Mel Spectrogram
    Add MFCC means and standard deviations with indexed keys.
    Add Chromagram means and standard deviations with indexed keys.
    Append the flat dictionary to flat_features.
  Convert flat_features to a data frame.
  Save the data frame to OUTPUT_FEATURES_CSV.
  Print that features have been saved.
Else:
  Print that no features were extracted.

Appendix B.2. Pseudo-Code for Feature Ranking and the Relation Between the Number of Features and Model Evaluation

1.
Import Libraries and Set Up Environment
Import essential libraries for data manipulation, visualization, preprocessing, and modeling.
Suppress warnings for cleaner outputs.
Set a random seed for reproducibility.
2.
Load Dataset
Specify the file path for the dataset.
Read the CSV file into a DataFrame.
3.
Prepare Features and Target
Separate feature columns (X) and the target column (y).
Encode categorical target labels into numerical values using LabelEncoder.
4.
Display Label Mapping
Print the mapping between the encoded numerical values and their corresponding class labels.
5.
Initialize Models
Define a dictionary of machine learning models to test, including:
Gradient Boosting
LightGBM
Neural Network (MLP)
Random Forest
XGBoost
6.
Initialize Results Storage
Create a dictionary to store results for each model.
7.
Define Feature Range
Specify a range of numbers representing the number of features to evaluate (e.g., from 15 to 52).
8.
Rank Features Using ANOVA
Compute ANOVA F-scores for all features.
Rank features in descending order of importance.
9.
Perform K-Fold Cross-Validation for Feature Selection
Loop through the specified range of features:
Select the top n_features based on their ANOVA F-scores.
Scale the selected features using StandardScaler.
10.
Train and Evaluate Models
For each model:
Use K-Fold cross-validation to train and test on the scaled features.
For each fold:
Split data into training and testing subsets.
Train the model on the training subset.
Evaluate accuracy on the testing subset.
Calculate the average accuracy for all folds.
Store the average accuracy for the given number of features.
11.
Visualize Results
Plot the accuracy of each model against the number of selected features.
Add labels, legends, and grid for better interpretation.
12.
Display the Plot
Show the accuracy plot to analyze how the number of features affects performance for each model.

Appendix B.3. Pseudo-Code: Feature Ranking and Evaluation Based on Number of Selected Features

1.
Import Libraries and Set Up Environment
Import essential libraries for data manipulation, visualization, preprocessing, and modeling.
Suppress warnings for cleaner outputs.
Set a random seed for reproducibility.
2.
Load Dataset
Specify the file path for the dataset.
Read the CSV file into a DataFrame.
3.
Prepare Features and Target
Separate feature columns (X) and the target column (y).
Encode categorical target labels into numerical values using LabelEncoder.
4.
Display Label Mapping
Print the mapping between the encoded numerical values and their corresponding class labels.
5.
Initialize Models
Define a dictionary of machine learning models to test, including:
Gradient Boosting
LightGBM
Neural Network (MLP)
Random Forest
XGBoost
6.
Initialize Results Storage
Create a dictionary to store results for each model.
7.
Define Feature Range
Specify a range of numbers representing the number of features to evaluate (e.g., from 15 to 52).
8.
Rank Features Using ANOVA
Compute ANOVA F-scores for all features.
Rank features in descending order of importance.
9.
Perform K-Fold Cross-Validation for Feature Selection
Loop through the specified range of features:
Select the top n_features based on their ANOVA F-scores.
Scale the selected features using StandardScaler.
10.
Train and Evaluate Models
For each model:
Use K-Fold cross-validation to train and test on the scaled features.
For each fold:
Split data into training and testing subsets.
Train the model on the training subset.
Evaluate accuracy on the testing subset.
Calculate the average accuracy for all folds.
Store the average accuracy for the given number of features.
11.
Visualize Results
Plot the accuracy of each model against the number of selected features.
Add labels, legends, and grid for better interpretation.
12.
Display the Plot
Show the accuracy plot to analyze how the number of features affects performance for each model.

Appendix B.4. The Pseudo-Code Outlines the Steps Taken to Perform Boruta-Based Feature Selection on the Datasets

1.
Import Required Libraries
Import libraries for data manipulation (pandas, numpy) and machine learning (ExtraTreesClassifier, BorutaPy).
2.
Load Dataset
Specify the file path of the dataset.
Read the dataset into a DataFrame.
3.
Separate Features and Target Variable
Extract the feature columns (X) by dropping non-feature columns (e.g., "label", "file_name").
Extract the target variable (y) from the DataFrame.
4.
Initialize ExtraTreesClassifier
Set up an ExtraTreesClassifier as the base estimator for the Boruta feature selection process.
Use balanced class weights and specify a random seed for reproducibility.
5.
Initialize Boruta Selector
Create a BorutaPy instance using the ExtraTreesClassifier:
Automatically determine the number of trees (n_estimators=‘auto’).
Use the same random seed for reproducibility.
6.
Perform Feature Selection with Boruta
Fit the Boruta selector on the dataset (X and y) to identify relevant features.
7.
Retrieve Selected Features
Extract the names of the features that Boruta marked as "selected" (important features).
Print the selected features for reference.
8.
Retrieve Tentative Features
Extract the names of the features that Boruta marked as "tentative" (uncertain importance).
Print the tentative features for review.
9.
Create a Reduced Dataset
Filter the original feature set to include only the selected features.
Add the target variable (y) back into the reduced dataset.
10.
Save the Reduced Dataset
Specify the output file path for the reduced dataset.
Save the reduced dataset as a CSV file.
11.
Display Confirmation
Print the file path of the saved reduced dataset for user confirmation.

Appendix B.5. Pseudo-Code: SHAP Feature Selection Workflow

Pseudocode Steps:
1.
Initialize Environment
Import necessary libraries: shap, numpy, pandas, matplotlib.pyplot, sklearn.model_selection, sklearn.preprocessing, sklearn.neural_network, sklearn.metrics, and warnings.
2.
Suppress Warnings
Disable warning messages to keep the output clean.
3.
Load and Validate Dataset
Load the dataset from a specified file path (data_path).
Check if the dataset contains the required columns: label and file_name.
If not, raise an error.
4.
Prepare Data
Extract feature columns by dropping label and file_name.
Assign the target variable (label) to the variable y.
Store the names of the features in feature_names.
5.
Normalize Data
Standardize the features using StandardScaler to ensure all features have similar scale.
Apply the scaler to the features X and store the result in X_scaled.
6.
Train Initial Model (MLP)
Initialize a Multi-Layer Perceptron (MLP) model with specific parameters (max_iter = 500, random_state = 42).
Train the model using the standardized features (X_scaled) and target labels (y).
7.
SHAP Analysis
Perform SHAP value calculation for feature importance:
Set the number of background samples for SHAP computation (n_background = 100).
Use shap.kmeans() to create a background dataset for SHAP.
Initialize the SHAP explainer (KernelExplainer) using the trained MLP model.
Calculate SHAP values for a subset of the data (n_samples_shap = 50).
8.
Calculate Feature Importance
Compute the mean absolute SHAP values for each feature.
Create a dictionary to store the feature names and their corresponding importance values.
Sort the features based on their importance in descending order.
9.
Feature Selection and Model Evaluation
Define a range of feature subset sizes (feature_range = 20 to 52).
For each subset size:
Select the top n_features based on SHAP importance.
Extract the selected features from the original dataset (X).
Standardize the selected features.
Perform 10-fold cross-validation using StratifiedKFold to evaluate the model’s performance with the selected features.
Calculate the mean accuracy for each subset of features.
Track the optimal number of features that give the highest accuracy.
10.
Determine Optimal Features
Print the optimal number of features that provided the best accuracy and the corresponding accuracy value.
11.
Visualize Results
Plot a graph of the accuracy against the number of selected features.
Mark the optimal number of features with a vertical line on the plot.
Label the axes and display the plot with a grid.

Appendix B.6. Pseudo-Code for Feature Ranking ANOVA and MLP

1.
Set Up Environment
Set a random seed for reproducibility.
Import necessary libraries: NumPy, Pandas, Matplotlib, Scikit-learn tools, and StandardScaler.
2.
Load Dataset
Specify the file path to your dataset.
Load the dataset into a DataFrame.
Separate features (X) and target labels (y), removing irrelevant columns like "file_name."
3.
Feature Scaling
Apply standard scaling to the feature set (X) for uniformity.
4.
Initialize Results
Create a data structure to store results for different numbers of selected features (k).
5.
Iterate Over Feature Range
Loop through feature subsets, selecting between 25 and 52 features:
Use ANOVA (f_classif) to rank features by importance and select the top k features.
Transform the dataset to include only the top k features.
Extract the names of the selected features.
6.
Train Neural Network
Initialize an MLPClassifier with a random seed and a maximum iteration limit (500).
Perform 10-fold Stratified Cross-Validation to evaluate the model using the selected features.
Compute and store the mean accuracy, standard deviation, and selected features for this iteration.
7.
Handle Errors
Add error handling to skip or log issues for specific feature subsets.
8.
Determine Best Result
Compare all iterations to find the feature set with the highest mean accuracy.
Store the number of features, mean accuracy, standard deviation, and selected features of the best-performing model.
9.
Visualize Results
Plot the mean accuracy for each feature set against the number of selected features.
Add a shaded region to represent ±1 standard deviation for each feature set.
10.
Output Results
Print the best-performing model’s results, including the number of features, mean accuracy, standard deviation, and names of selected features.
11.
End Program

References

  1. Suman, A.; Kumar, C.; Suman, P. Early detection of mechanical malfunctions in vehicles using sound signal processing. Appl. Acoust. 2022, 188, 108578. [Google Scholar] [CrossRef]
  2. Henriquez, P.; Alonso, J.B.; Ferrer, M.A.; Travieso, C.M. Review of Automatic Fault Diagnosis Systems Using Audio and Vibration Signals. IEEE Trans. Syst. Man Cybern. Syst. 2014, 44, 642–652. [Google Scholar] [CrossRef]
  3. Hossain, M.N.; Rahman, M.M.; Ramasamy, D. Artificial Intelligence-Driven Vehicle Fault Diagnosis to Revolutionize Automotive Maintenance: A Review. Comput. Model. Eng. Sci. 2024, 141, 951–996. [Google Scholar] [CrossRef]
  4. Burdzik, R. A comprehensive diagnostic system for vehicle suspensions based on a neural classifier and wavelet resonance estimators. Measurement 2022, 200, 111602. [Google Scholar] [CrossRef]
  5. Boztas, G.; Tuncer, T.; Aydogmus, O.; Yildirim, M. A DCSLBP based intelligent machine malfunction detection model using sound signals for industrial automation systems. Comput. Electr. Eng. 2024, 119, 109541. [Google Scholar] [CrossRef]
  6. Legala, A.; Kubesh, M.; Chundru, V.R.; Conway, G.; Li, X. Machine learning modeling for fuel cell-battery hybrid power system dynamics in a Toyota Mirai 2 vehicle under various drive cycles. Energy AI 2024, 17, 100415. [Google Scholar] [CrossRef]
  7. Walter, E. (Ed.) Data Acquisition from Light-Duty Vehicles Using OBD and CAN; SAE International: Warrendale, PA, USA, 2018. [Google Scholar] [CrossRef]
  8. Zappatore, M.; Longo, A.; Bochicchio, M.A. Crowd-sensing our Smart Cities: A Platform for Noise Monitoring and Acoustic Urban Planning. J. Commun. Softw. Syst. 2017, 13, 53. [Google Scholar] [CrossRef]
  9. Zaheer, R.; Ahmad, I.; Habibi, D.; Islam, K.Y.; Phung, Q.V. A Survey on Artificial Intelligence-Based Acoustic Source Identification. IEEE Access 2023, 11, 60078–60108. [Google Scholar] [CrossRef]
  10. Ciaburro, G.; Iannace, G. Improving Smart Cities Safety Using Sound Events Detection Based on Deep Neural Network Algorithms. Informatics 2020, 7, 23. [Google Scholar] [CrossRef]
  11. Qurthobi, A.; Maskeliūnas, R.; Damaševičius, R. Detection of Mechanical Failures in Industrial Machines Using Overlapping Acoustic Anomalies: A Systematic Literature Review. Sensors 2022, 22, 3888. [Google Scholar] [CrossRef]
  12. Rashed, A.; Abdulazeem, Y.; Farrag, T.; Bamaqa, A.; Almaliki, M.; Badawy, M.; Elhosseini, M. Toward Inclusive Smart Cities: Sound-Based Vehicle Diagnostics, Emergency Signal Recognition, and Beyond. Machines 2025, 13, 258. [Google Scholar] [CrossRef]
  13. Fahimifar, S.; Mousavi, K.; Mozaffari, F.; Ausloos, M. Identification of the most important external features of highly cited scholarly papers through 3 (i.e., Ridge, Lasso, and Boruta) feature selection data mining methods. Qual. Quant. 2022, 57, 3685–3712. [Google Scholar] [CrossRef]
  14. Parisineni, S.R.A.; Pal, M. Enhancing trust and interpretability of complex machine learning models using local interpretable model agnostic shap explanations. Int. J. Data Sci. Anal. 2023, 18, 457–466. [Google Scholar] [CrossRef]
  15. Manikandan, G.; Pragadeesh, B.; Manojkumar, V.; Karthikeyan, A.L.; Manikandan, R.; Gandomi, A.H. Classification models combined with Boruta feature selection for heart disease prediction. Inform. Med. Unlocked 2024, 44, 101442. [Google Scholar] [CrossRef]
  16. Gong, S.; Jin, Q.; Wang, C.; Wang, T. In-situ test of pedestrian landscape bridge for benchmark SHM model towards smart city. Nondestruct. Test. Eval. 2025, 1–18. [Google Scholar] [CrossRef]
  17. Chahine, K. Tree-Based Algorithms and Incremental Feature Optimization for Fault Detection and Diagnosis in Photovoltaic Systems. Eng 2025, 6, 20. [Google Scholar] [CrossRef]
  18. Somasundaram, M.M.P.; Deepak, D.; Kumar, R. Enhancing Road Safety with AI-Powered System for Effective Emergency Sound Detection and Localization. Sensors 2023, 25, 793. Available online: https://www.mdpi.com/1424-8220/25/3/793 (accessed on 10 July 2025).
  19. Scikit-Learn Developers. Sklearn.Ensemble.ExtraTreesClassifier. Scikit-Learn. Available online: https://scikit-learn.org/stable/modules/generated/sklearn.ensemble.ExtraTreesClassifier.html (accessed on 5 June 2025).
  20. Shi, Y.; Ke, G.; Soukhavong, D.; Lamb, J.; Meng, Q.; Finley, T.; Wang, T.; Chen, W.; Ma, W.; Ye, Q.; et al. Lightgbm: Light Gradient Boosting Machine [dataset]. In CRAN: Contributed Packages; The R Foundation: Vienna, Austria, 2020. [Google Scholar] [CrossRef]
  21. Chen, T.; Guestrin, C. XGBoost. In Proceedings of the 22nd ACM SIGKDD International Conference on Knowledge Discovery and Data Mining, San Francisco, CA, USA, 13–17 August 2016; pp. 785–794. [Google Scholar] [CrossRef]
  22. Kursa, M.B.; Jankowski, A.; Rudnicki, W.R. Boruta—A System for Feature Selection. Fundam. Informaticae 2010, 101, 271–285. [Google Scholar] [CrossRef]
  23. SixSigma.Us. (n.d.). ANOVA F-Value Meaning. Available online: https://www.6sigma.us/six-sigma-in-focus/anova-f-value-meaning/ (accessed on 5 June 2025).
  24. Dubey, R.; Bodade, R.M.; Dubey, D. Two-way analysis of variance (ANOVA) ranking of features based on wavelet bi-phase and bi-spectrum for the classification of adventitious lung sounds. Res. Biomed. Eng. 2024, 41, 6. [Google Scholar] [CrossRef]
  25. Chen, H.; Lundberg, S.; Lee, S.-I. Explaining Models by Propagating Shapley Values of Local Components. In Explainable AI in Healthcare and Medicine; Springer: Cham, Switzerland, 2020; pp. 261–270. [Google Scholar] [CrossRef]
  26. Huang, R.; Ni, J.; Qiao, P.; Wang, Q.; Shi, X.; Yin, Q. An Explainable Prediction Model for Aerodynamic Noise of an Engine Turbocharger Compressor Using an Ensemble Learning and Shapley Additive Explanations Approach. Sustainability 2023, 15, 13405. [Google Scholar] [CrossRef]
  27. Chazette, L.; Brunotte, W.; Speith, T. Exploring Explainability: A Definition, a Model, and a Knowledge Catalogue. In Proceedings of the 2021 IEEE 29th International Requirements Engineering Conference (RE), Notre Dame, IN, USA, 20–24 September 2021; pp. 197–208. [Google Scholar] [CrossRef]
  28. Murovec, J.; Prezelj, J.; Ćirić, D.G.; Milivojčević, M.M. Zero-Crossing Signature: A Time-Domain Method Applied to Diesel and Gasoline Vehicle Classification. IEEE Sens. J. 2025, 25, 5128–5138. [Google Scholar] [CrossRef]
  29. Wang, S.; Xu, Q.; Zhu, S.; Wang, B. Making transformer hear better: Adaptive feature enhancement based multi-level supervised acoustic signal fault diagnosis. Expert Syst. Appl. 2025, 264, 125736. [Google Scholar] [CrossRef]
  30. Wang, Y.; Li, D.; Li, L.; Sun, R.; Wang, S. A novel deep learning framework for rolling bearing fault diagnosis enhancement using VAE-augmented CNN model. Heliyon 2024, 10, e35407. [Google Scholar] [CrossRef]
  31. Nasim, F.; Masood, S.; Jaffar, A.; Ahmad, U.; Rashid, M. Intelligent Sound-Based Early Fault Detection System for Vehicles. Comput. Syst. Sci. Eng. 2023, 46, 3175–3190. [Google Scholar] [CrossRef]
  32. Hamad, A.A.; Nasim, M.F.; Jaffar, A.; Khalaf, O.I.; Ouahada, K.; Hamam, H.; Akram, S.; Siddique, A. Cognitive Inspired Sound-Based Automobile Problem Detection: A Step Toward Xai. SSRN 2024. [Google Scholar] [CrossRef]
  33. Akbalık, F.; Yıldız, A.; Ertuğrul, Ö.F.; Zan, H. Engine Fault Detection by Sound Analysis and Machine Learning. Appl. Sci. 2024, 14, 6532. [Google Scholar] [CrossRef]
  34. Guo, X. Fault Diagnosis of Rolling Bearings Based on Acoustics and Vibration Engineering. IEEE Access 2024, 12, 139632–139648. [Google Scholar] [CrossRef]
  35. Li, Y.; Tao, X.; Sun, Y. A Fault Diagnosis Method for Turnout Switch Machines Based on Sound Signals. Electronics 2024, 13, 4839. [Google Scholar] [CrossRef]
  36. Hameed, U.; Masood, S.; Nasim, F.; Jaffar, A. Exploring the Accuracy of Machine Learning and Deep Learning in Engine Knock Detection. Bull. Bus. Econ. (BBE) 2024, 13, 203–210. [Google Scholar] [CrossRef]
  37. Yuan, G.; Yang, Y. Fault detection method of new energy vehicle engine based on wavelet transform and support vector machine. Int. J. Knowl.-Based Intell. Eng. Syst. 2024, 28, 718–731. [Google Scholar] [CrossRef]
  38. Akbalik, F.; Yildiz, A.; Ertuğrul, Ö.F.; Zan, H. Enhancing vehicle fault diagnosis through multi-view sound analysis: Integrating scalograms and spectrograms in a deep learning framework. Signal Image Video Process. 2025, 19, 182. [Google Scholar] [CrossRef]
  39. Yun, E.; Jeong, M. Acoustic Feature Extraction and Classification Techniques for Anomaly Sound Detection in the Electronic Motor of Automotive EPS. IEEE Access 2024, 12, 149288–149307. [Google Scholar] [CrossRef]
  40. Khan, F.A.; Jamil, A.; Khan, S.A.; Hameed, A.A. Enhancing robotic manipulator fault detection with advanced machine learning techniques. Eng. Res. Express 2024, 6, 025204. [Google Scholar] [CrossRef]
  41. Zhao, D.; Shao, D.; Wang, T.; Cui, L. Time-frequency self-similarity enhancement network and its application in wind turbines fault analysis. Adv. Eng. Inform. 2025, 65, 103322. [Google Scholar] [CrossRef]
  42. Kim, S.-M.; Soo Kim, Y. Enhancing Sound-Based Anomaly Detection Using Deep Denoising Autoencoder. IEEE Access 2024, 12, 84323–84332. [Google Scholar] [CrossRef]
  43. Naryanto, R.F.; Delimayanti, M.K.; Naryaningsih, A.; Warsuta, B.; Adi, R.; Setiawan, B.A. Diesel Engine Fault Detection using Deep Learning Based on LSTM. In Proceedings of the 2023 7th International Conference on Electrical, Telecommunication and Computer Engineering (ELTICOM), Medan, Indonesia, 13–14 December 2023; pp. 37–42. [Google Scholar] [CrossRef]
  44. Chu, S.; Zhang, J.; Liu, F.; Kong, X.; Jiang, Z.; Mao, Z. Fault identification model of diesel engine based on mixed attention: Single-cylinder fault data driven whole-cylinder diagnosis. Expert Syst. Appl. 2024, 255, 124769. [Google Scholar] [CrossRef]
  45. Lee, D.; Choo, H.; Jeong, J. GCN-Based LSTM Autoencoder with Self-Attention for Bearing Fault Diagnosis. Sensors 2024, 24, 4855. [Google Scholar] [CrossRef]
  46. Spadini, T.; Nose-Filho, K.; Suyama, R. Intelligent Fault Diagnosis of Type and Severity in Low-Frequency, Low Bit-Depth Signals. arXiv 2024, arXiv:2411.06299. [Google Scholar]
  47. Qiao, Z.; Yao, D.; Yang, J.; Zhou, T.; Ge, T. MSTD: A framework for rolling bearing fault diagnosis based on multi-scale and soft-threshold denoising. Nondestruct. Test. Eval. 2024, 1–21. [Google Scholar] [CrossRef]
  48. Hao, J.; Shen, G.; Zhang, X.; Shao, H. An adversarial gradual domain adaptation approach for fault diagnosis via intermediate domain generation. Nondestruct. Test. Eval. 2025, 1–21. [Google Scholar] [CrossRef]
  49. Beritelli, F.; Casale, S.; Russo, A.; Serrano, S. An Automatic Emergency Signal Recognition System for the Hearing Impaired. In Proceedings of the 2006 IEEE 12th Digital Signal Processing Workshop & 4th IEEE Signal Processing Education Workshop, Teton National Park, WY, USA, 24–27 September 2006. [Google Scholar] [CrossRef]
  50. Tran, V.-T.; Tsai, W.-H. Acoustic-Based Emergency Vehicle Detection Using Convolutional Neural Networks. IEEE Access 2020, 8, 75702–75713. [Google Scholar] [CrossRef]
  51. Banchero, L.; Vacalebri-Lloret, F.; Mossi, J.M.; Lopez, J.J. Enhancing Road Safety with AI-Powered System for Effective Detection and Localization of Emergency Vehicles by Sound. Sensors 2025, 25, 793. [Google Scholar] [CrossRef]
  52. Asif, M.; Usaid, M.; Rashid, M.; Rajab, T.; Hussain, S.; Wasi, S. Large-scale audio dataset for emergency vehicle sirens and road noises. Sci. Data 2022, 9, 599. [Google Scholar] [CrossRef]
  53. Principi, E.; Squartini, S.; Bonfigli, R.; Ferroni, G.; Piazza, F. An integrated system for voice command recognition and emergency detection based on audio signals. Expert Syst. Appl. 2015, 42, 5668–5683. [Google Scholar] [CrossRef]
  54. Kim, J.; Min, K.; Jung, M.; Chi, S. Occupant behavior monitoring and emergency event detection in single-person households using deep learning-based sound recognition. Build. Environ. 2020, 181, 107092. [Google Scholar] [CrossRef]
  55. Min, K.; Jung, M.; Kim, J.; Chi, S. Sound Event Recognition-Based Classification Model for Automated Emergency Detection in Indoor Environment. In Advances in Informatics and Computing in Civil and Construction Engineering; Springer: Cham, Switzerland, 2018; pp. 529–535. [Google Scholar] [CrossRef]
  56. Nguyen, Q.; Yun, S.-S.; Choi, J. Detection of audio-based emergency situations using perception sensor network. In Proceedings of the 2016 13th International Conference on Ubiquitous Robots and Ambient Intelligence (URAI), Xi’an, China, 19–22 August 2016; pp. 763–766. [Google Scholar] [CrossRef]
  57. Kamelia, R.; Kusuma, H. Emergency Sound Classification and Visual Alert System for Enhanced Situational Awareness. In Proceedings of the 2024 International Conference on TVET Excellence & Development (ICTeD), Melaka, Malaysia, 16–17 December 2024; pp. 213–218. [Google Scholar] [CrossRef]
  58. Kreuzer, M.; Schmidt, D.; Wokusch, S.; Kellermann, W. Real-World Airborne Sound Analysis for Health Monitoring of Bearings in Railway Vehicles. SSRN 2024. [Google Scholar] [CrossRef]
  59. Shajie, D.; Juliet, S.; Ezra, K.; Annie Flora, J.B. Diagnostic Sonance: Sound-Based Approach to Assess Engine Ball Bearing Health in Automobiles. Przegląd Elektrotechniczny 2024, 1, 74–78. [Google Scholar] [CrossRef]
  60. Senanayaka, A.; Lee, P.; Lee, N.; Dickerson, C.; Netchaev, A.; Mun, S. Enhancing the accuracy of machinery fault diagnosis through fault source isolation of complex mixture of industrial sound signals. Int. J. Adv. Manuf. Technol. 2024, 133, 5627–5642. [Google Scholar] [CrossRef]
  61. Gantert, L.; Zeffiro, T.; Sammarco, M.; Campista, M.E.M. Multiclass classification of faulty industrial machinery using sound samples. Eng. Appl. Artif. Intell. 2024, 136, 108943. [Google Scholar] [CrossRef]
  62. Dobre, R.A.; Nita, V.A.; Ciobanu, A.; Negrescu, C.; Stanomir, D. Low computational method for siren detection. In Proceedings of the 2015 IEEE 21st International Symposium for Design and Technology in Electronic Packaging (SIITME), Brasov, Romania, 22–25 October 2015; pp. 291–295. [Google Scholar] [CrossRef]
  63. Dobre, R.-A.; Dumitrascu, E.-V. High-performance, low complexity yelp siren detection system. Alex. Eng. J. 2024, 109, 669–684. [Google Scholar] [CrossRef]
  64. Colelough, B.; Zheng, A. Effects of Dataset Sampling Rate for Noise Cancellation through Deep Learning. arXiv 2024, arXiv:2405.20884. [Google Scholar] [CrossRef]
  65. Fedorishin, D.; Forte, L.; Schneider, P.; Setlur, S.; Govindaraju, V. Fine-Grained Engine Fault Sound Event Detection Using Multimodal Signals. In Proceedings of the ICASSP 2024—2024 IEEE International Conference on Acoustics, Speech and Signal Processing (ICASSP), Seoul, Republic of Korea, 14–19 April 2024; pp. 1186–1190. [Google Scholar] [CrossRef]
  66. Terwilliger, A.M.; Siegel, J.E. Improving Misfire Fault Diagnosis with Cascading Architectures via Acoustic Vehicle Characterization. Sensors 2022, 22, 7736. [Google Scholar] [CrossRef]
  67. Salamon, J.; Bello, J.P. Deep Convolutional Neural Networks and Data Augmentation for Environmental Sound Classification. IEEE Signal Process. Lett. 2017, 24, 279–283. [Google Scholar] [CrossRef]
  68. Kalantarian, H.; Mortazavi, B.; Pourhomayoun, M.; Alshurafa, N.; Sarrafzadeh, M. Probabilistic segmentation of time-series audio signals using Support Vector Machines. Microprocess. Microsyst. 2016, 46, 96–104. [Google Scholar] [CrossRef]
  69. Nath, K.; Sarma, K.K. Separation of overlapping audio signals: A review on current trends and evolving approaches. Signal Process. 2024, 221, 109487. [Google Scholar] [CrossRef]
  70. Tran, T.; Lundgren, J. Drill Fault Diagnosis Based on the Scalogram and Mel Spectrogram of Sound Signals Using Artificial Intelligence. IEEE Access 2020, 8, 203655–203666. [Google Scholar] [CrossRef]
  71. Abdul, Z.K.; Al-Talabani, A.K. Mel Frequency Cepstral Coefficient and its Applications: A Review. IEEE Access 2022, 10, 122136–122158. [Google Scholar] [CrossRef]
  72. Zalkow, F.; Muller, M. CTC-Based Learning of Chroma Features for Score–Audio Music Retrieval. IEEE/ACM Trans. Audio Speech Lang. Process. 2021, 29, 2957–2971. [Google Scholar] [CrossRef]
  73. Khan, S. Ethem Alpaydin. Introduction to Machine Learning (Adaptive Computation and Machine Learning Series). The MIT Press, 2004. ISBN: 0 262 01211 1 Price £32.95/$50.00 (hardcover). xxx+415 pages. Nat. Lang. Eng. 2008, 14, 133–137. [Google Scholar] [CrossRef]
  74. Bishop, C.M.; Nasrabadi, N.M. Pattern Recognition and Machine Learning; Springer: Berlin/Heidelberg, Germany, 2006; Volume 4. [Google Scholar]
  75. Ko, K.; Kim, S.; Kwon, H. Selective Audio Perturbations for Targeting Specific Phrases in Speech Recognition Systems. Int. J. Comput. Intell. Syst. 2025, 18, 103. [Google Scholar] [CrossRef]
  76. Kwon, H.; Park, D.; Jo, O. Silent-Hidden-Voice Attack on Speech Recognition System. IEEE Access 2024, 12, 173010–173019. [Google Scholar] [CrossRef]
  77. Kwon, H.; Lee, K.; Ryu, J.; Lee, J. Audio Adversarial Example Detection Using the Audio Style Transfer Learning Method. IEEE Access 2025, 13, 122464–122472. [Google Scholar] [CrossRef]
  78. Kwon, H.; Nam, S.-H. Audio adversarial detection through classification score on speech recognition systems. Comput. Secur. 2023, 126, 103061. [Google Scholar] [CrossRef]
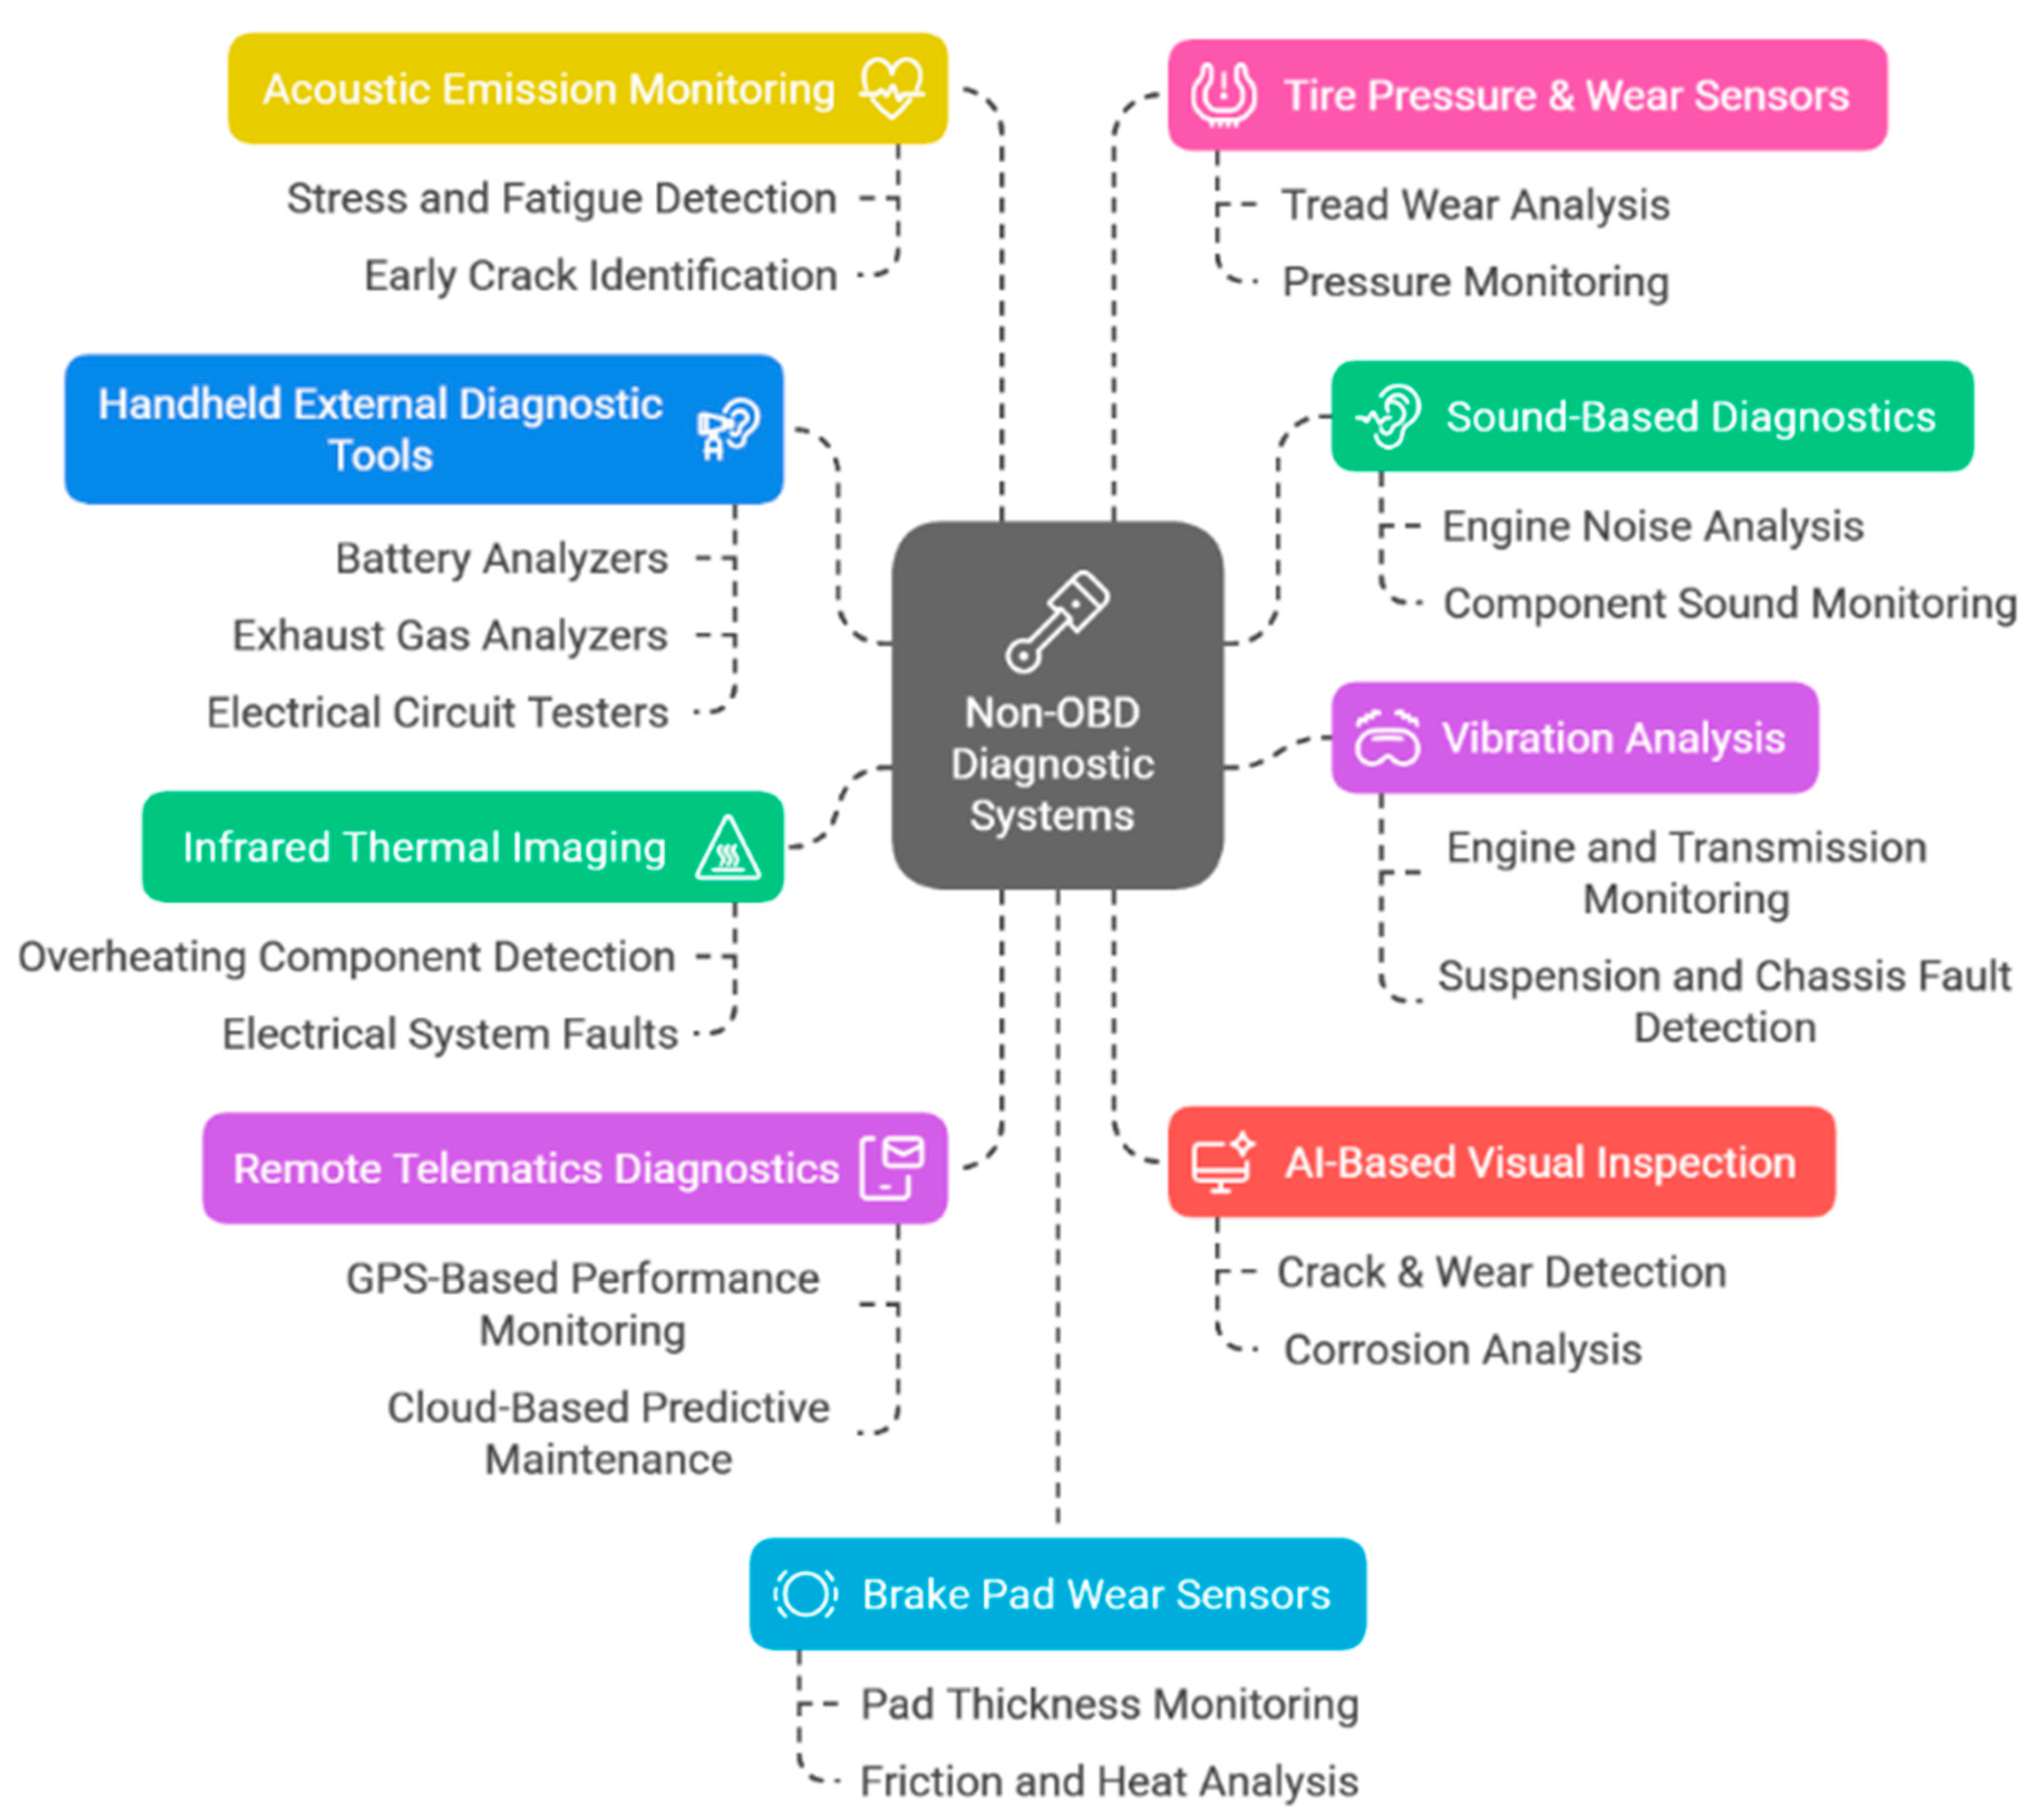
Figure 1. Non-OBD systems.
Machines 13 00888 g001
Figure 2. Distribution of 52 handcrafted features across families: MFCC (26), Mel spectrogram statistics (2), and Chroma (24). Axes show feature family and count.
Machines 13 00888 g002
Figure 3. Bar Chart for VAFD Class Distribution.
Machines 13 00888 g003
Figure 4. Bar Chart for UEASD Class Distribution.
Machines 13 00888 g004
Figure 5. Bar Chart for IVESD Class Distribution.
Machines 13 00888 g005
Figure 6. Learning curve for the Extra Trees Classifier on VAFD using the top 38 ANOVA-selected features.
Machines 13 00888 g006
Figure 7. The confusion matrix of the Extra Trees Classifier applied to VAFD using the top 38 features selected by ANOVA. The color intensity encodes the magnitude of these values: darker green shades correspond to higher counts, whereas lighter shades indicate lower counts. White cells (with zeros) represent cases where no samples were assigned to that class combination.
Machines 13 00888 g007
Figure 8. Learning curve of the Extreme Gradient Boosting (XGBoost) classifier trained on UEASD using the top 31 features selected by ANOVA.
Machines 13 00888 g008
Figure 9. Confusion matrix of the XGBoost classifier on UEASD using the top 31 features selected by ANOVA. The color intensity encodes the magnitude of these values: darker green shades correspond to higher counts, whereas lighter shades indicate lower counts. White cells (with zeros) represent cases where no samples were assigned to that class combination.
Machines 13 00888 g009
Figure 10. Learning curve of the Extra Trees Classifier on IVESD using 31 ANOVA-selected features.
Machines 13 00888 g010
Figure 11. Confusion matrix of the Extra Trees Classifier on IVESD using the top 31 features selected via ANOVA. The color intensity encodes the magnitude of these values: darker green shades correspond to higher counts, whereas lighter shades indicate lower counts. White cells (with zeros) represent cases where no samples were assigned to that class combination.
Machines 13 00888 g011
Figure 12. Accuracy versus Number of Selected Features for VAFD using ANOVA-based Feature Ranking and K-Fold Cross-Validation.
Machines 13 00888 g012
Figure 13. Accuracy vs. Number of Selected Features for Multiple Classifiers (K-Fold Cross-Validation on UEASD).
Machines 13 00888 g013
Figure 14. Accuracy vs. Number of Selected Features for Multiple Classifiers (K-Fold Cross-Validation on IVESD).
Machines 13 00888 g014
Figure 15. Overview of the Audio Data Processing and Machine Learning Pipeline.
Machines 13 00888 g015
Figure 16. Learning curve of the Extra Trees Classifier on VAFD using 45 Boruta-selected features.
Machines 13 00888 g016
Figure 17. Receiver Operating Characteristic (ROC) curves for the Extra Trees Classifier on VAFD. Many ROC curves are not visually distinct in the plot because the ExtraTreesClassifier achieved nearly perfect separation for most classes (AUC = 1.00 in several cases). When performance is perfect or near-perfect, the ROC curve hugs the top-left corner of the plot (True Positive Rate ≈ 1, False Positive Rate ≈ 0). As a result, the ROC curves of different classes overlap almost completely, making them appear as a single curve.
Machines 13 00888 g017
Figure 18. Confusion matrix of the Extra Trees Classifier for VAFD. The color intensity encodes the magnitude of these values: darker green shades correspond to higher counts, whereas lighter shades indicate lower counts. White cells (with zeros) represent cases where no samples were assigned to that class combination.
Machines 13 00888 g018
Figure 19. Learning curve of the LightGBM classifier on UEASD using the top 52 Boruta-selected features.
Machines 13 00888 g019
Figure 20. ROC curves for the LightGBM classifier on UEASD using 52 Boruta-selected features.
Machines 13 00888 g020
Figure 21. Confusion matrix for the LightGBM classifier on UEASD with 52 Boruta-selected features. The color intensity encodes the magnitude of these values: darker green shades correspond to higher counts, whereas lighter shades indicate lower counts. White cells (with zeros) represent cases where no samples were assigned to that class combination.
Machines 13 00888 g021
Figure 22. Learning curve for the Extra Trees Classifier on IVESD using 47 Boruta-selected features.
Machines 13 00888 g022
Figure 23. Receiver Operating Characteristic (ROC) curves for the Extra Trees Classifier on IVESD using 47 Boruta-selected features. The classifier achieved near-perfect AUC values across all classes, with a macro-average AUC of 1.00, indicating excellent multi-class discrimination capability. The ROC curves of different classes overlap almost completely, making them appear as a single curve.
Machines 13 00888 g023
Figure 24. Confusion matrix for the Extra Trees Classifier on IVESD using 47 Boruta-selected features. The color intensity encodes the magnitude of these values: darker green shades correspond to higher counts, whereas lighter shades indicate lower counts. White cells (with zeros) represent cases where no samples were assigned to that class combination.
Machines 13 00888 g024
Figure 25. ANOVA-Based Feature Selection and MLP Evaluation Workflow.
Machines 13 00888 g025
Figure 26. Accuracy vs. Number of Selected Features using ANOVA Ranking for MLP Classifier on VAFD.
Machines 13 00888 g026
Figure 27. The accuracy of the trends of the MLP classifier on UEASD with ANOVA-ranked features is also important. The curve shows the variation in mean accuracy across different feature subset sizes, with shaded regions indicating ±1 standard deviation.
Machines 13 00888 g027
Figure 28. Mean accuracy vs. number of selected features for IVESD using ANOVA feature ranking and MLP classifier (10-fold cross-validation). The shaded region represents ±1 standard deviation.
Machines 13 00888 g028
Figure 29. SHAP-Based Feature Selection and Model Evaluation Pipeline.
Machines 13 00888 g029
Figure 30. SHAP summary plot for VAFD showing the distribution of SHAP values across top features. Each point represents a SHAP value for an instance, with color indicating the feature value (red = high, blue = low)—features such as mfcc_std_9, chromagram_s.
Machines 13 00888 g030
Figure 31. Bar plot of SHAP-based feature importance for VAFD using the MLP classifier.
Machines 13 00888 g031
Figure 32. SHAP summary plot for UEASD showing the distribution of SHAP values for the top 20 features.
Machines 13 00888 g032
Figure 33. Bar plot of SHAP-based feature importance for UEASD using the MLP classifier.
Machines 13 00888 g033
Figure 34. SHAP summary plot for IVESD showing the distribution of SHAP values across the most influential features.
Machines 13 00888 g034
Figure 35. Bar plot of SHAP-based feature importance for IVESD using the MLP classifier.
Machines 13 00888 g035
Figure 36. Accuracy vs. Number of Selected Features for VAFD. The plot illustrates the impact of varying the number of SHAP-ranked features on cross-validation accuracy. The highest accuracy (0.9144) was achieved using 43 features, as marked by the red dash.
Machines 13 00888 g036
Figure 37. Accuracy vs. Number of Selected Features for UEASD. The graph displays cross-validation accuracy as a function of the number of SHAP-ranked features. The highest accuracy (0.9607) was obtained using 29 features, denoted by the red dashed line.
Machines 13 00888 g037
Figure 38. Accuracy vs. Number of Selected Features for IVESD. The graph illustrates the cross-validation accuracy trend with varying numbers of SHAP-ranked features. The optimal accuracy (0.9381) was achieved using 43 features, marked by the red dashed line.
Machines 13 00888 g038
Table 2. Dataset Overviews.
DatasetDescription
Vehicular Acoustic Fault Dataset (VAFD)Curated to represent vehicle-related fault sounds across subsystems and include general operational audio. Designed to support diagnostic model development through acoustic analysis.
Urban Emergency and Ambient Sound Dataset (UEASD)Includes emergency signals (e.g., sirens), environmental noises, animal sounds, and construction sounds. Structured to support acoustic scene analysis, anomaly detection, and public safety research.
Integrated Vehicle and Environmental Sound Dataset (IVESD)Merges VAFD and UEASD into a comprehensive multi-domain collection, facilitating the creation of robust models capable of distinguishing between mechanical faults and environmental sounds.
Table 3. Final validated distribution of audio samples across VAFD, UEASD, and IVESD after expert review and majority voting.
DatasetClassCount
VAFDEngine/Powertrain Faults61
Suspension/Steering Faults39
General Vehicle Sounds (Normal)38
Exhaust/Fuel System Faults16
Belt/Accessory Issues12
Braking Faults4
Miscellaneous Mechanical Faults5
UEASDEmergency Vehicle Sirens1560
Animal Sounds650
Vehicles/Transport Noise246
Weapons/Explosions62
Weather Sounds29
Construction/Machinery24
IVESDIntegrated Vehicle + Env. ClassesBalanced integration from VAFD + UEASD
Table 4. The objectives, methods, and key findings of the proposed experiments.
PhaseExperimentObjectiveKey MethodsMain Findings
Phase 1:
Baseline Evaluation and Feature Selection
1. Baseline Performance of ML ModelsEstablish baseline using 15 ML models across 3 datasets52 handcrafted features (Mel spectrogram stats, MFCCs, Chroma); ANOVA F-test for feature ranking; feature count varied (20–52).Ensemble models (e.g., LightGBM, XGBoost) performed best; reduced feature sets outperformed full sets due to redundancy.
2. Ensemble vs. MLPCompare top ensembles with MLP under refined feature selectionANOVA-ranked feature subsets (15–52); 10-fold cross-validation.MLP outperformed ensembles when redundant features were removed, highlighting its strength in modeling non-linear patterns.
Phase 2:
Advanced Feature Selection and Optimization
1. Boruta-Based Selection with 15 ModelsEvaluate Boruta’s ability to identify relevant features and improve model generalization.Boruta with Extra Trees: retraining 15 models on selected subsetsBoruta effectively reduced dimensionality while maintaining or improving performance across all datasets.
2. ANOVA-Based Optimization with MLPOptimize MLP performance by selecting the best feature count.ANOVA selection (25–52 features); 10-fold cross-validationIdentified optimal feature range balancing accuracy and computational efficiency.
3. SHAP-Based Selection and InterpretabilityCombine performance with model transparency using SHAPSHAP ranking with MLP; tested varying top-n feature subsetsAchieved high accuracy with interpretable models; suitable for safety-critical ITS applications.
Table 5. Performance comparison of 15 machine learning models on VAFD using the top 38 features selected by ANOVA.
ModelAccuracyAUCRecallPrec.F1KappaMCCTT (Sec)
Extra Trees Classifier0.90130.00000.90130.88620.88110.86550.87830.2340
Random Forest Classifier0.84360.00000.84360.83560.82060.78660.80190.2830
Light Gradient Boosting Machine0.82760.00000.82760.84500.80910.76830.78870.1930
K Neighbors Classifier0.77120.00000.77120.81230.76810.70400.72010.0510
Gradient Boosting Classifier0.76150.00000.76150.77040.74600.68400.69691.8780
Linear Discriminant Analysis0.74550.00000.74550.77440.73340.66870.68810.0530
Logistic Regression0.73850.00000.73850.74220.72400.65500.66710.2580
Ridge Classifier0.73780.00000.73780.73790.72260.65200.66410.0360
Extreme Gradient Boosting0.73590.00000.73590.72070.70830.64220.66360.2310
Naive Bayes0.73080.00000.73080.73170.71280.64420.66050.0500
Decision Tree Classifier0.62820.00000.62820.64370.60340.50850.53170.0580
SVM—Linear Kernel0.61350.00000.61350.62140.56900.50280.54720.0660
Ada Boost Classifier0.53210.00000.53210.38240.41740.30850.41810.1580
Dummy Classifier0.35320.00000.35320.12660.18580.00000.00000.0300
Quadratic Discriminant Analysis0.31150.00000.31150.19530.19920.04840.05360.0390
Table 6. Performance comparison of 15 machine learning classifiers on UEASD using the top 31 features selected by ANOVA with 10-fold stratified cross-validation.
ModelAccuracyAUCRecallPrec.F1KappaMCCTT (Sec)
Extreme Gradient Boosting0.95500.99480.95500.95340.95250.91880.91920.6550
Light Gradient Boosting Machine0.95280.99560.95280.95220.95010.91490.91541.3880
Extra Trees Classifier0.95050.99270.95050.95090.94790.91100.91150.3800
Random Forest Classifier0.94720.99520.94720.94760.94460.90500.90560.5150
Gradient Boosting Classifier0.94220.00000.94220.94130.93940.89580.896412.8640
K Neighbors Classifier0.93220.98440.93220.93240.92960.87810.87850.0620
Logistic Regression0.92610.00000.92610.92350.92290.86610.86680.7020
Decision Tree Classifier0.92550.94870.92550.92690.92440.86670.86720.0750
Quadratic Discriminant Analysis0.90660.00000.90660.89860.89670.83550.83900.0480
Linear Discriminant Analysis0.90270.00000.90270.90490.90140.82600.82680.0550
Ridge Classifier0.89830.00000.89830.88440.88790.81470.81580.0340
SVM—Linear Kernel0.81940.00000.81940.85960.80600.70340.72050.0620
Naive Bayes0.80380.94450.80380.87630.82880.67060.67760.0370
Ada Boost Classifier0.68490.00000.68490.65530.62160.36600.41770.6190
Dummy Classifier0.60700.50000.60700.36850.45860.00000.00000.0350
Table 7. Performance comparison of 15 machine learning models on IVESD using the top 31 features selected via ANOVA and evaluated using 10-fold stratified cross-validation.
ModelAccuracyAUCRecallPrec.F1KappaMCCTT (Sec)
Extra Trees Classifier0.92660.09900.92660.92650.92040.87910.88000.3840
Light Gradient Boosting Machine0.92450.09910.92450.91890.91600.87510.87623.9820
Random Forest Classifier0.91830.09920.91830.91600.91070.86510.86620.7940
Extreme Gradient Boosting0.91730.09880.91730.91290.90990.86330.86421.4490
Gradient Boosting Classifier0.90370.00000.90370.89890.89670.84140.842430.1280
K Neighbors Classifier0.89070.09810.89070.89030.88660.82140.82210.0570
Logistic Regression0.87150.00000.87150.86540.86080.78530.78661.9600
Decision Tree Classifier0.87150.09210.87150.87310.86910.78970.79040.0970
Quadratic Discriminant Analysis0.84340.00000.84340.81710.82050.74470.75030.0660
Linear Discriminant Analysis0.83770.00000.83770.86320.84410.74000.74150.1230
Ridge Classifier0.83510.00000.83510.77410.79850.71530.71970.1240
SVM—Linear Kernel0.82050.00000.82050.77800.79120.69500.70200.1570
Naive Bayes0.75550.09520.75550.82210.77540.61870.62420.0440
Dummy Classifier0.56820.05000.56820.32280.41170.00000.00000.0710
Ada Boost Classifier0.55630.00000.55630.60040.51340.42110.46570.7190
Table 8. Experimental Configuration Summary.
ComponentDescription
Preprocessing StepsNormalize Audio—Extend Short Files—Resample to 16 kHz—Segment into 2.5 s
Target TypeMulticlass Classification
Target EncodingLabel Encoding
Total Number of Features52
Feature TypesMel Spectrogram (mean, std), MFCCs (13 × mean & std), Chromagram (mean, std)
Feature SelectionBoruta Algorithm
Model Training15 Machine Learning Models (e.g., SVM, RF, KNN, XGBoost, etc.)
Fold Generation MethodStratified K-Fold Cross-Validation
Number of Folds10
Table 9. Performance metrics of 15 machine learning models on VAFD using Boruta-selected 45 features.
ModelAccuracyAUCRecallPrec.F1KappaMCCTT (Sec)
Extra Trees Classifier0.91030.00000.91030.90560.89870.87960.88870.2630
Light Gradient Boosting Machine0.86150.00000.86150.84220.83470.81560.83230.2150
Random Forest Classifier0.83460.00000.83460.78420.79990.77510.78930.3800
Gradient Boosting Classifier0.81990.00000.81990.81530.79680.76160.78042.0860
Extreme Gradient Boosting0.81090.00000.81090.77880.78280.74430.76010.2550
Logistic Regression0.78590.00000.78590.79950.77540.71440.72680.2700
Naive Bayes0.74620.00000.74620.71750.71490.65550.67390.0410
Ridge Classifier0.71280.00000.71280.68660.68280.61240.62950.0390
K Neighbors Classifier0.70580.00000.70580.75110.69460.62470.64340.0380
Decision Tree Classifier0.70510.00000.70510.70500.68310.61880.63470.0400
Linear Discriminant Analysis0.68720.00000.68720.73900.68680.59380.60880.1140
Ada Boost Classifier0.54810.00000.54810.40820.43380.34010.44530.1720
SVM—Linear Kernel0.50190.00000.50190.43950.42460.30960.39270.0520
Quadratic Discriminant Analysis0.44360.00000.44360.53160.44610.33050.35860.0400
Dummy Classifier0.35190.00000.35190.12470.18390.00000.00000.0370
Table 10. Performance metrics of 15 machine learning models on UEASD using the top 52 features selected by the Boruta algorithm.
ModelAccuracyAUCRecallPrec.F1KappaMCCTT (Sec)
Light Gradient Boosting Machine0.95550.99490.95550.95540.95180.91980.92062.6790
Extreme Gradient Boosting0.95220.99430.95220.95160.94890.91400.91461.6070
Random Forest Classifier0.94770.99430.94770.94410.94330.90590.90670.9090
Extra Trees Classifier0.94610.99080.94610.94320.94190.90280.90360.4280
Gradient Boosting Classifier0.94500.00000.94500.94400.94170.90130.902125.1000
K Neighbors Classifier0.93500.98660.93500.93340.93200.88300.88360.1000
Decision Tree Classifier0.92220.94670.92220.92660.92240.86120.86210.1410
Logistic Regression0.91610.00000.91610.91510.91230.84780.84921.5590
Quadratic Discriminant Analysis0.90220.00000.90220.87790.88600.82600.83060.1160
Ridge Classifier0.89940.00000.89940.88120.88710.81610.81800.0670
Linear Discriminant Analysis0.89880.00000.89880.90390.89890.81940.82020.1240
SVM—Linear Kernel0.85490.00000.85490.83560.83470.73350.74280.0940
Ada Boost Classifier0.82050.00000.82050.81510.80350.67520.68530.9120
Naive Bayes0.76100.93710.76100.87590.79490.60690.62160.0810
Dummy Classifier0.60700.50000.60700.36850.45860.00000.00000.0450
Table 11. Performance comparison of 15 machine learning models on IVESD using Boruta-selected 47 features.
ModelAccuracyAUCRecallPrec.F1KappaMCCTT (Sec)
Extra Trees Classifier0.91990.09910.91990.91700.91210.86760.86900.3880
Light Gradient Boosting Machine0.91830.09880.91830.91300.91000.86480.86574.5030
Extreme Gradient Boosting0.91780.09890.91780.91460.91030.86420.86512.5270
Random Forest Classifier0.91050.09910.91050.90500.90020.85170.85321.0420
Gradient Boosting Classifier0.90630.00000.90630.90490.89920.84540.846352.9980
K Neighbors Classifier0.89540.09800.89540.89520.89090.82890.82970.0710
Logistic Regression0.88400.00000.88400.87690.87490.80700.80802.6920
Decision Tree Classifier0.86990.09170.86990.86800.86570.78650.78720.1430
Linear Discriminant Analysis0.84970.00000.84970.86870.85450.75740.75840.0700
Ridge Classifier0.84500.00000.84500.79300.81090.73260.73700.0670
Quadratic Discriminant Analysis0.83720.00000.83720.78210.80090.73070.73820.0800
SVM—Linear Kernel0.80230.00000.80230.77030.76970.64890.66510.1340
Ada Boost Classifier0.77160.00000.77160.68850.71350.61110.64081.0660
Naive Bayes0.70970.09420.70970.82600.74160.55850.57090.0530
Dummy Classifier0.56820.05000.56820.32280.41170.00000.00000.0440
Table 12. Summary of ANOVA-Based Feature Selection Results Across Datasets.
DatasetOptimal No. of FeaturesMean AccuracyStandard DeviationKey Selected Features
Dataset 1330.92480.0645mfcc_mean_6–12, mfcc_std_8–9, chromagram_mean_1–11, chromagram_std_0–11
Dataset 2210.96150.0101mfcc_mean_1–12, chromagram_mean_2–9
Dataset 3230.94720.0123mfcc_mean_1–12, mfcc_std_2, chromagram_mean_1–9
Table 14. Summary of SHAP-Based Feature Selection Performance Across Datasets.
DatasetOptimal Number of FeaturesBest Accuracy
VAFD430.9144
UEASD290.9607
IVESD430.9381
Table 15. Comparison of Best Accuracy and Selected Features Across Feature Selection Methods.
DatasetFeature Selection MethodBest ClassifierAccuracy (%)No. of Selected Features
1ANOVA (Extra Trees)Extra Trees Classifier90.1338
1ANOVA (MLP)MLP92.4833
1BorutaExtra Trees Classifier91.0345
1SHAPMLP91.4443
2ANOVA (Extra Trees)Extra Trees Classifier95.5031
2ANOVA (MLP)MLP96.1521
2BorutaLightGBM95.5552
2SHAPMLP96.0729
3ANOVA (Extra Trees)Extra Trees Classifier92.6631
3ANOVA (MLP)MLP94.7223
3BorutaExtra Trees Classifier91.9947
3SHAPMLP93.8143
Table 16. Comparative Analysis of Recent Sound-Based Classification Methods.
Study and YearApplication DomainDatasetFeature SelectionClassification ModelExplainabilityReported Accuracy (%)
Proposed Method (2025)Vehicle faults and emergency soundsCustom DB3 (vehicle + emergency sounds)SHAP, Boruta, ANOVAExtra Trees, MLP, LightGBMYes (SHAP)Up to 96.15
Rashed et al. (2025) [12]Vehicle fault detectionYouTube-derived audio + FeatureList-126ReliefF, ANOVA, FCBFBOWSVFS (Bayesian Soft Voting)No91.04
Fedorishin et al. (2024) [65]Fine-grained engine fault detectionMultimodal dataset (audio + vibration)Not specifiedMultimodal SED frameworkNoNot specified
Terwilliger and Siegel (2022) [66]Acoustic vehicle characterizationSynthesized dataset (40+ hours)Not specifiedCascading CNN architectureNo93.6 (validation), 86.8 (test)
Salamon et al. (2017) [67]Urban sound classificationUrbanSound8KNot specifiedCNN with data augmentationNo89.5
Disclaimer/Publisher’s Note: The statements, opinions and data contained in all publications are solely those of the individual author(s) and contributor(s) and not of MDPI and/or the editor(s). MDPI and/or the editor(s) disclaim responsibility for any injury to people or property resulting from any ideas, methods, instructions or products referred to in the content.