Abstract
Gas monitoring and dust control in coal mine goafs are critical for ensuring safe and efficient production. To address the challenges posed by dust accumulation from mechanized mining and ventilation systems, this study designs a spiral-driven gas purification pipeline robot integrating a wet dust removal mechanism. The robot features a modular structure, including a spiral drive, a plugging and extraction system, and a wet dust removal unit, to enhance pipeline adaptability and dust removal performance. Dynamic modeling reveals that the robot’s speed increases with the deflection angle of the driving wheel, with optimal performance observed at a 45° angle. The analysis of the rolling friction, medium resistance, and deflection angle indicates that reducing the angle improves the obstacle-crossing ability. Numerical simulations of gas migration in the goaf identify a high dust concentration at the air outlet and show that flow velocity significantly affects dust removal efficiency. Simulation and prototype testing confirm stable robot operation at deflection angles of between 30° and 90° and effective crossing of 5 mm barriers. Optimal dust removal is achieved with a 5 m/s flow velocity, 0.6 MPa water mist pressure, and 400 mm chord grid spacing, providing both theoretical and practical guidance for gas monitoring and dust control in coal mine goafs.
1. Introduction
Coal, as a non-renewable and dominant energy source in China, accounts for over 60% of the country’s primary energy mix and is expected to remain the leading energy source for a long time [1,2]. More than 90% of China’s coal is extracted via underground mining. Due to China’s resource characteristics—abundant in coal, deficient in oil, and lacking natural gas—coal plays a highly significant role in the national energy structure [3,4]. Despite ongoing efforts to develop oil, gas, and clean energy alternatives, coal remains the backbone of China’s energy supply.
In recent years, coal mining enterprises have continuously improved mechanized extraction, and by 2024, intelligent mining capacity exceeded 50%, with annual coal production reaching approximately 4.76 billion tons nationwide [5,6]. However, mechanized mining has intensified the fragmentation of coal seams, resulting in substantial dust generation. Goafs, the voids left after coal extraction, are prone to high dust concentrations, posing serious explosion risks. Notable accidents—such as the 2019 explosion at the Lijiagou Coal Mine in Shenmu and the 2020 accident at the Liangbaosi Coal Mine of Feicheng Mining Group—caused severe casualties and underscored the critical role of environmental monitoring in goafs for coal mine safety [7,8].
Although current coal mine monitoring systems have been optimized, they still face challenges in deployment due to harsh and complex underground environments. Narrow or confined zones often suffer from poor sensor coverage. Tube bundle monitoring systems, commonly used for spontaneous combustion detection, are susceptible to dust interference, resulting in reduced accuracy and false alarms. Additionally, the coexistence of dust and gas can further distort gas concentration readings [9,10].
To address these limitations, many researchers have proposed pipe inspection robots. Kwon et al. from Hanyang University developed a robot capable of inspecting pipes with diameters of 80–100 mm [11]. Japanese scholar Kakogawa introduced the AIRo-6 series, a V-shaped robot whose spherical wheels can be independently controlled in rolling and pitching via geared motors [12]. Jeon et al. designed a robotic system for inspecting large-diameter water pipes (900–1200 mm in diameter) [13]. Thung-Od et al. developed a robot capable of horizontal and vertical inspection in ferromagnetic pipes as narrow as 127 mm and on flat surfaces, capable of negotiating 90° bends [14]. The MRINSPECT IV robot was designed for inspecting 4-inch urban gas pipelines, featuring a 3D differential drive configuration that adapts to complex pipe layouts [15].
Shi et al. developed a modular walking device with Mecanum wheels and a scissor-hinge structure, enabling variable diameter adjustment and multiple motion modes, which enhance adaptability and maneuverability in complex pipelines [16]. Li et al. proposed an elastic obstacle-surmounting pipeline inspection robot featuring composite wheels and shock-absorbing suspension mechanisms. This robotic system demonstrates stable traversal over 20 mm high obstacles while adapting to pipelines of varying diameters, with a payload capacity of 30 kg, offering an efficient solution for industrial pipeline inspection and maintenance [17]. Existing in-pipe robots are designed for inspection or maintenance and do not address high-dust environments; our work fills this gap by combining a spiral drive with an on-board wet dust removal unit [11,12,13,14,15,16,17]. Helical-drive pipe robots use rotating helical mechanisms to generate propulsion through contact with pipe walls. This mode of movement delivers high thrust and traction, making them suitable for pipes of various diameters and configurations—including curved, inclined, and horizontal sections—and for operation in confined environments [18,19,20].
Spray dust suppression technologies have also been widely adopted in underground coal mines for pollution control due to their cost-effectiveness and ease of deployment [21,22,23]. These systems pressurize water and eject it through nozzles to form fine mist droplets, creating a conical aerosol zone. Dust particles passing through this zone collide with similarly sized droplets, undergoing impaction, interception, and diffusion to achieve effective dust removal. When combined with mesh filtering structures, wet dust suppression significantly enhances dust control efficiency.
Therefore, this study proposes the design of a gas purification pipeline robot for goaf environments, capable of efficiently removing dust from gas streams while improving the intelligence and safety of monitoring systems. This has important implications for enhancing coal mine safety and ensuring national energy security.
2. Structural Design of the Gas Purification Pipeline Robot
In goaf areas with high methane concentrations, the gas purification pipeline robot must focus on the efficient and safe extraction and purification of methane gas. Its structural design must be adaptable to various pipeline diameters and utilize corrosion-resistant and explosion-proof materials to withstand the harsh underground environment. The key performance specifications of the gas purification pipeline robot designed in this study are shown in Table 1.

Table 1.
Key performance specifications of the gas purification pipeline robot.
Compared with existing robots, our design achieves DN180–220 adaptability and a traction force ≥30 N, exceeding comparable systems [12,16,17]. To meet the above performance requirements, a modular and flexible design approach is adopted for the gas purification pipeline robot. The proposed design aims to develop a robot specifically suited for dust-laden methane environments in underground goafs, capable of efficient extraction and dust removal from gas mixtures. The robot is intended to operate reliably in confined pipeline conditions and support continuous monitoring and purification tasks under hazardous underground conditions.
2.1. Overall Assembly Drawing
The overall assembly of the gas extraction and purification pipeline robot for goaf applications is shown in Figure 1. Given that the operating environment of the robot is the underground goaf, in order to enhance operational safety and improve work efficiency, a modular unit design is adopted, in which all components are constructed using protective, flame-retardant, and explosion-proof materials. Key modules are housed in explosion-proof enclosures designed for hazardous environments, with robust dust and water resistance; the casing employs flame-retardant materials to ensure operational safety.
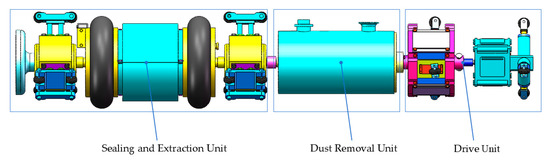
Figure 1.
Overall assembly of the gas extraction and purification pipeline robot designed for underground goaf environments.
This gas purification pipeline robot system operates in conjunction with existing underground methane extraction equipment. During the extraction process, the system is connected downstream to perform preliminary dust removal from the extracted methane gas. The overall assembly of the gas purification pipeline robot platform is shown in Figure 2; it consists of six main components: a bundle tube connector, platform mobility wheels, flange and blind plate assemblies, a structural support frame, and two sampling ports—Port (a) and Port (b).
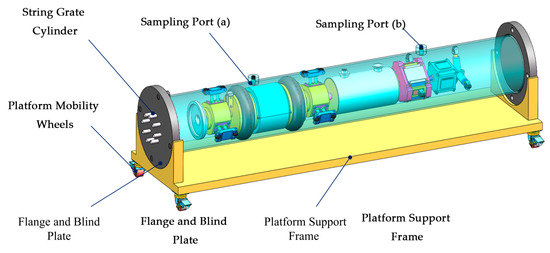
Figure 2.
Overall assembly of the gas purification pipeline robot platform.
When deployed in the goaf, the platform’s support frame is positioned at the designated site, where it connects to the extracted methane via the bundle tube interface. The gas then enters a sealed space formed by double-side flanges and blind plates. Within this enclosed region, the gas is subjected to dust filtration by the pipeline robot. Subsequently, Port (a) and Port (b) are connected to an external gas chromatograph to measure the concentrations of dust and other gaseous components before and after purification, respectively.
In this study, the dust concentration measured at Port (a) (prior to purification) and at Port (b) (after purification) is used to evaluate the dust removal efficiency of the robot, thereby validating its methane purification performance.
2.2. Drive Unit Design
As illustrated in Figure 3, the drive unit consists of four main modules: the screw variable-diameter drive module, the shaft coupling, the motor drive module, and the driven support module. Among these, the screw variable-diameter drive module and the driven support module adjust to different pipe diameters through an internal variable-diameter support spring. The shaft coupling connects the screw drive module to the motor drive module, enabling power transmission. The motor drive module provides the primary driving force for the unit, while the driven support module serves to support and stabilize the structure, ensuring operational reliability during movement. The overall design is compact and functionally clear, meeting the requirements for efficient drive across various pipeline diameters.
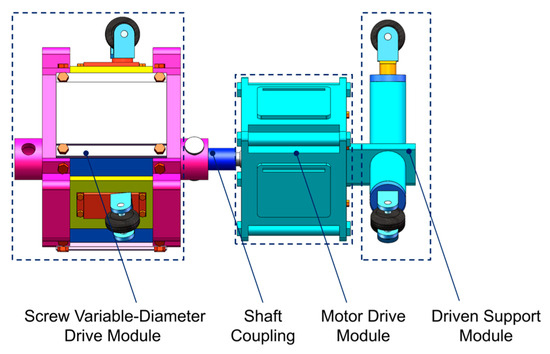
Figure 3.
Structural diagram of the drive unit.
2.3. Sealing and Extraction Unit Design
The core design of the sealing and extraction unit lies in achieving the efficient sealing of the gas extraction channel and precise airflow guidance, preventing dust interference before and after purification to ensure the accuracy of gas monitoring. This unit is a key component of the gas purification pipeline robot during sealing and extraction operations, and it comprises four parts, the gas collection hood, sealing module, extraction module, and support module, as illustrated in Figure 4. The gas collection hood is used to concentrate and direct the gas flow. The sealing module employs an inflatable bladder sealing method, which features a simple and intuitive principle, ease of operation, strong adaptability, and rapid response.
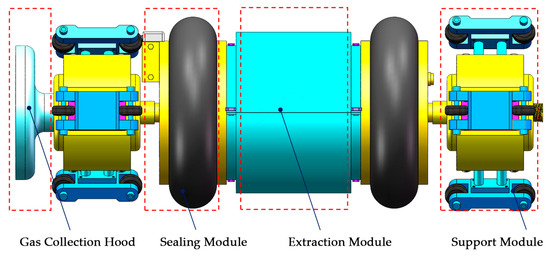
Figure 4.
Structural diagram of the sealing and extraction unit.
2.4. Dust Removal Unit Design
As shown in Figure 5, the dust removal unit primarily consists of a string grate cylinder, a connecting sleeve, a string grate mesh, an enclosed casing, connecting bearings, a dust outlet, an atomization inlet, and atomizing nozzles. Its working principle involves atomizing water through the atomizing nozzles, which combined with the string grate mesh removes dust from the dust-laden gas. The purified gas is then discharged through the dust outlet. The connecting sleeve links to the front sealing and extraction unit, while the connecting bearings provide a clearance fit with the drive unit’s drive connection. The screw motion of the drive unit does not affect the operation of the dust removal unit. The housing includes small drainage holes at the bottom to prevent water accumulation inside the pipe during misting operations.
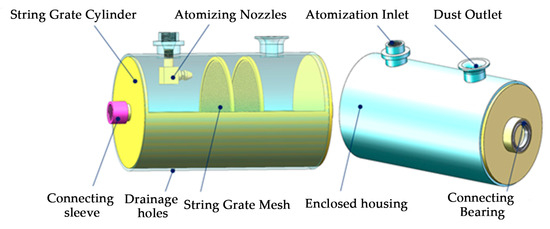
Figure 5.
Structural diagram of the dust removal unit.
3. Wet Dust Removal Process Analysis
Wet dust removal combines pre-string-grate spray wet dust removal and string grate water mist filtration dust removal technologies. Dust particles carried in the dust-laden gas flow interact dynamically with the water droplets sprayed from the nozzles and are captured. Subsequently, the dust-laden gas passes through the string grate, where water mist filtration further traps the dust particles. Finally, clean air is discharged. The dust removal process is illustrated in Figure 6.
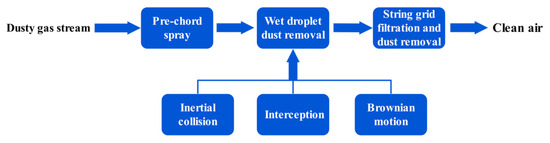
Figure 6.
Wet string grate dust removal process flow.
3.1. Study on Wet Droplet Dust Removal Mechanism
By spraying fine water mist particles into the air, suspended dust particles aggregate into larger particles through inertial collision and interception. These larger particles then settle by gravity onto the string grate cylinder. The dust is ultimately removed by disassembling and cleaning the string grate cylinder, thereby achieving dust reduction. The wet dust removal mechanism is illustrated in Figure 7 [24].
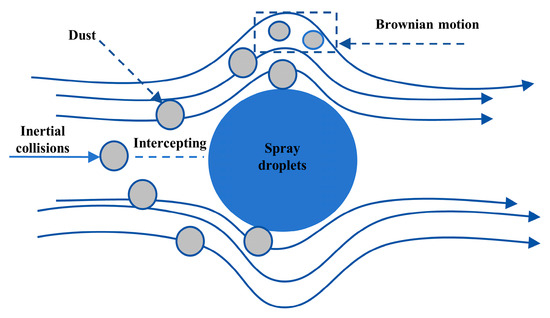
Figure 7.
Diagram of the wet droplet dust removal mechanism.
3.1.1. Inertial Impaction
In a dust-laden airflow, the movement trajectory of dust particles is influenced by the water mist sprayed from the nozzles. Fine particles tend to deviate along with the airflow streamlines, while larger particles, due to their greater inertia, are unable to follow the curved flow around the droplets and instead continue along their original path, resulting in collisions with the droplets and subsequent capture [25].
Assuming the droplets are spherical, the proposed formula for calculating the dust removal efficiency is as follows:
When 0.0416 ≤ Stk ≤ 0.3,
When Stk > 0.3,
The dimensionless term for dust inertia is called the Stokes number, so the inertial impaction parameter can be expressed by s, namely
In the equation, dp is the diameter of dust particles; is the dust density of dust-laden airflow; is the aerodynamic viscosity value of air; dc is the diameter of fog droplets; and v0 is the inlet flow velocity in the flow field.
From Equation (1) and the theoretical formula for the impaction parameter, Equation (3), it can be concluded that the inertial impaction dust removal efficiency is proportional to the inlet flow velocity of the flow field and the dust particle size while being inversely proportional to the fog droplet diameter. The influence of the dust particle size and fog droplet diameter can be derived from the analysis of the interception mechanism.
3.1.2. Interception
When the dust mass is neglected, the dust moves toward the fog droplets along the airflow streamlines. Interception occurs when the distance between the airflow streamlines and the surface of the fog droplets falls within the range of the dust particle size [26]. The interception effect is independent of the flow velocity; what plays a decisive role is the size of the dust and fog droplet particles, rather than the inertial impaction of the dust particle size. The dust removal parameter for the interception effect can be denoted by the letter A:
The formula for calculating the dust removal efficiency by interception is as follows:
In the equation, Re is the flow-around Reynolds number, where ; dp is the dust particle diameter; and dc is the fog droplet diameter. The above theoretical model formula for the interception efficiency is applicable to variations in different flow velocities. The interception efficiency increases as the dust particle size increases and the fog droplet diameter decreases.
Among these factors, the dust particle size cannot be controlled in practice; therefore, the dust removal efficiency can be indirectly influenced by controlling the atomizing nozzle to adjust the fog droplet diameter. According to the relationship between the liquid nozzle pressure and the fog droplet diameter, the fog droplet diameter is generally inversely proportional to the liquid nozzle pressure, i.e., dc∝P−n (where n ≈ 0.3–0.5). Increasing the liquid nozzle pressure can effectively reduce the fog droplet diameter, thereby improving the interception efficiency.
3.1.3. Brownian Motion
Brownian motion refers to the irregular movement of particles suspended in gas, which is caused by constant collision with gas molecules. In the process of spray dust suppression, dust particles with a diameter of less than 0.1 μm are affected by gas molecules, exhibiting a movement pattern that is not entirely consistent with the direction of the streamline, which is manifested as Brownian motion. Due to this irregular movement, fine dust particles near the surface of fog droplets will collide with each other, and this phenomenon is known as the diffusion effect.
In the equation, Pe = v0dc/D, whose reciprocal is the characteristic number representing diffusion sedimentation; v0 is the inlet flow velocity in the flow field; dc is the fog droplet diameter; and D is the dust diffusion coefficient.
The diffusion coefficients for different particle sizes are shown in Table 2.
Table 2.
Key performance specifications of the gas purification pipeline robot.
For the convenience of research, we analyze dust and fog droplets separately. The process of fog droplets capturing dust can be regarded as the behavior of one sphere flowing around another sphere. A schematic diagram of dust flowing around water mist is shown in Figure 8.
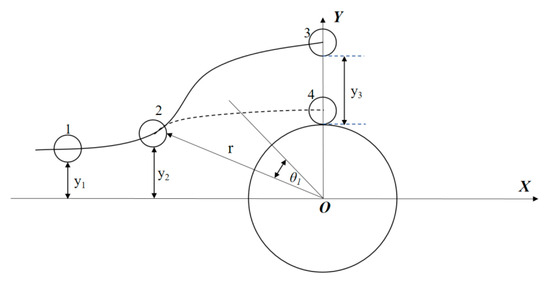
Figure 8.
Schematic diagram of dust flowing around fog droplets.
Assuming the dust particles initially follow the streamline, when a dust particle reaches point 3, it begins to deviate from the streamline, and at point 2 it crosses the y-axis, with a vertical distance of y2 from the upper surface of the water droplet. The flow around the droplet can be described by the following stream function:
In the equation, v0 represents the inlet velocity of the flow field; θ1 is the angle between the perpendicular from the dust streamline and the radial vector r, which denotes the distance from the center of the droplet to point 2; and dc is the droplet diameter.
The expression for velocity components is as follows:
If the dust particle’s distance from the axis of droplet motion exceeds y1, it will not be captured. Therefore, when calculating the dust removal efficiency, a correction factor must be introduced to account for this effect. In general, the efficiency Eri (%) of droplet capture for dust particles can be expressed as the ratio of the area of a circle with radius y1 to the projected area of the droplet:
To facilitate the calculation of the dust removal efficiency by droplets, it is assumed that dust particles and droplets encounter each other both in front of the baffle and on the baffle mesh. Each droplet captures a certain number of dust particles, with a removal efficiency denoted as Eri. Let the number of dust particles entering at a given moment be N0 and the number of particles remaining after passing the first droplet be N1, after the second droplet be N2, and after the nnn-th droplet be Nn. That is,
Therefore, the efficiency of droplet capture for dust particles is given by
Interception effects play significant roles, while the diffusion effect can be neglected. Under these conditions, the wet mist dust removal efficiency can be calculated by the following formula:
In the formula, represents the efficiency of inertial impaction, and represents the efficiency of interception. According to theoretical derivation, the key factors affecting the dust removal efficiency in wet mist dust collection are the inlet flow velocity of the airflow and the pressure of the water mist jet.
3.2. Study on the Dust Filtration Efficiency of the Grid Structure
After the dust in the gas mixture is treated by wet mist dust removal, it enters the space between the double-layer grid wires. The filtration efficiency of the grid mainly depends on the spacing between the two layers of grid wires. In this study, the dust removal unit adopts a grid structure with a diameter of 130 mm, a cylindrical wire diameter df = 0.2 mm, a wire spacing d0 = 0.1 mm, and a grid wire filling ratio = 46.00%. The same grid configuration is used in the subsequent simulation and experimental sections.
The spacing between the double-layer grid wires can be calculated as
In the equation, Ls represents the spacing between the double-layer grid structures, a denotes the length of a single grid wire, and b refers to the width of a single grid wire.
To better illustrate the filtration efficiency of the wire mesh, the dust removal unit is simplified, and a schematic cross-sectional diagram of the mesh filtration is shown in Figure 9. In this diagram, the operating parameters of the mesh panel include the dust-laden airflow rate Q (m3/s), the dust concentration before the mesh CO (g/m3), the dust concentration after the mesh C1 (g/m3), and the mesh filtration efficiency ηf, which is dimensionless. The inlet flow velocity far upstream of the mesh is v0 (m/s), while the flow velocity at the mesh wire surface is v1 (m/s). Accordingly, the amount of dust collected per unit of length of the mesh wire per unit of time, denoted as , can be expressed as
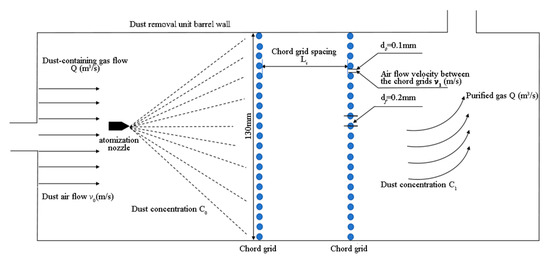
Figure 9.
Schematic diagram of grid filtration.
For the dust collection elements uniformly distributed within the mesh, assume that a single filter element of length dx is located on the surface of the mesh wire. Let the dust concentration entering the element be C. Within a unit of time, the total number of dust particles passing through the mesh area a × b in the filter element dx is . Therefore, the number of dust particles captured by the filter element per unit of time is as follows:
In the formula, represents the efficiency of inertial impaction, and represents the efficiency of interception. According to theoretical derivation, the key factors affecting the dust removal efficiency in wet mist dust collection are the inlet flow velocity of the airflow and the pressure of the water mist jet.
By rearranging and integrating the above equation, we obtain
The dust collection efficiency of the grid can be simplified as
The dust concentrations before and after passing through the grid can be measured using a concentration analyzer. For CFD, dust particles were assumed to have a mean diameter of 5 μm, based on reported coal mine particulate distributions [27]. According to the theoretical derivation, the dust removal efficiency increases monotonically with the widening of the grid spacing. Therefore, in the study of grid-based filtration and dust removal, the key factor affecting the removal efficiency is the spacing between the double-layer grids.
4. Robot Simulation Analysis
4.1. Traction Force Simulation of the Robot
To verify whether the robot possesses sufficient traction force to ensure smooth operation within the pipeline, a traction force simulation environment was established in Adams, as shown in Figure 10.
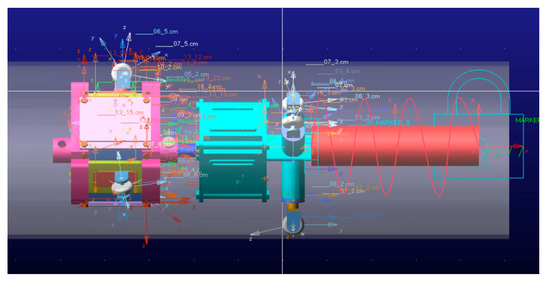
Figure 10.
Traction force simulation environment.
A simplified model of the robot was used. The tail end of the robot was fixed to the ground via a spring, and the traction force was evaluated by measuring the tension exerted on the spring. The pipeline was laid horizontally on the ground. Relevant simulation parameters are listed in Table 3.
Table 3.
Traction force simulation analysis parameters.
To improve analysis efficiency and highlight critical operating conditions, five representative servo deflection angles—15°, 30°, 45°, 60°, and 90°—were selected for simulation. The results are shown in Figure 11.
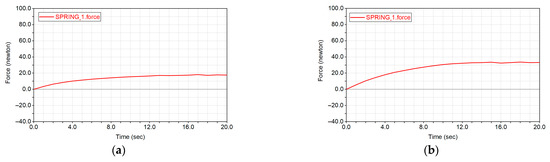
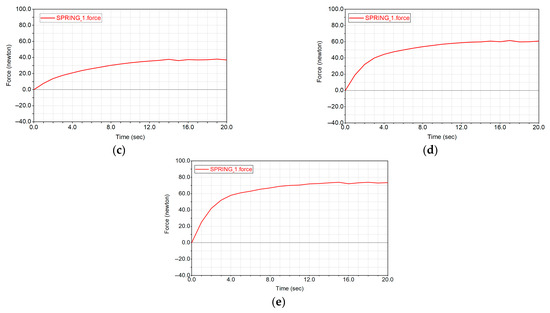
Figure 11.
Traction force simulation diagrams: (a) traction force at a deflection angle of 15°; (b) traction force at a deflection angle of 30°; (c) traction force at a deflection angle of 45°; (d) traction force at a deflection angle of 60°; and (e) traction force at a deflection angle of 90°.
4.2. Dust Removal Simulation of the Robot
The governing equations are based on continuity and Navier–Stokes momentum equations for internal dust-laden flows. Analytical solutions are limited to simplified laminar cases [28]; therefore, CFD is required for accurate analysis. It is noted that elbows and junctions induce secondary vortices and additional pressure loss, which can affect particle–droplet collision rates. These secondary flows are particularly important in understanding how dust particles interact with water droplets during dust removal in curved or complex pipeline sections [29]. As established in the previous theoretical analysis, the effectiveness of wet dust removal is significantly influenced by the inlet flow velocity and the atomization pressure of the spray nozzle. To investigate the impact of these parameters on the dust removal efficiency, a numerical simulation model for wet dust removal was developed using Fluent. First, a simplified model of the baffle dust removal unit and its wall surface was built in SolidWorks 2024 and then imported into Fluent 2020 R2 for fluid simulation analysis.
During the setup process, the model was defined under fluid computation mode, and mesh generation was carried out using the meshing module, as shown in Figure 12. A grid independence study was conducted with multiple mesh densities; the final mesh (~962,568 cells, 0.2 mm size) resulted in <2% variation in the dust removal efficiency. Inflation layers ensured near-wall y + values within recommended limits (50–100 for k − ε). Residuals were monitored to 1 × 10⁻⁵. Regarding the boundary conditions of the flow field, the inlet was set as inlet, the surrounding walls as wall, and the dust removal outlet as outlet.
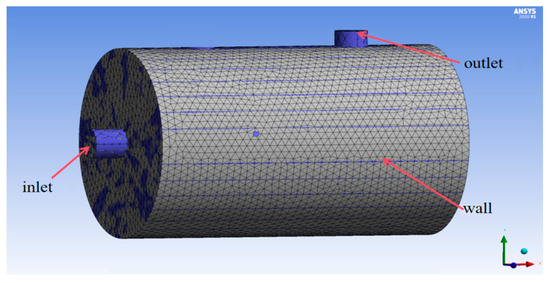
Figure 12.
Mesh division diagram of the dust removal unit.
The gas-phase flow was modeled using the Realizable k − ε turbulence model, while the Discrete-Phase Model (DPM) was employed to track particle trajectories. It was assumed that the inlet airflow had a uniform velocity distribution and was perpendicular to the inlet cross-section. Therefore, the inlet boundary condition was set as a velocity inlet, with turbulence parameters defined by the turbulence intensity and hydraulic diameter. The outlet boundary condition was set as outflow to allow free discharge of the flow.
Turbulence intensity:
Reynolds number:
Turbulent kinetic energy:
Turbulent dissipation rate:
Realizable k–ε equation:
In the formula, is the air density, in kg/m3; are the velocities of air in the x and y directions, respectively, in m/s; are the position vectors in the x and y directions; is the dynamic viscosity coefficient, in Pa·s; k is the turbulent kinetic energy, in m2/s2; is the turbulent dissipation rate; is the turbulent viscosity coefficient, in Pa·s; Gk is the rate of change in the turbulent kinetic energy caused by the velocity gradient; and is the Prandtl number corresponding to the Realizable k − ε equation.
4.2.1. Influence of Inlet Flow Velocity on Dust Removal Efficiency
To analyze the influence of different inlet dust-laden airflow velocities on the inertial collision efficiency, a simplified flow field simulation was conducted based on the structural study of the wet dust removal system. Under conditions of dust particle injection and spraying, a single-phase airflow simulation of the dust removal system was performed. The inertial collision efficiency is closely related to the velocity and direction of the airflow, while the motion of dust particles is influenced by both the airflow drag and their own inertia. The inlet flow velocities were set sequentially at 1 m/s, 2 m/s, 3 m/s, 4 m/s, 5 m/s, and 6 m/s. The velocity and pressure distributions inside the cylinder are shown in Figure 13 and Figure 14, respectively.
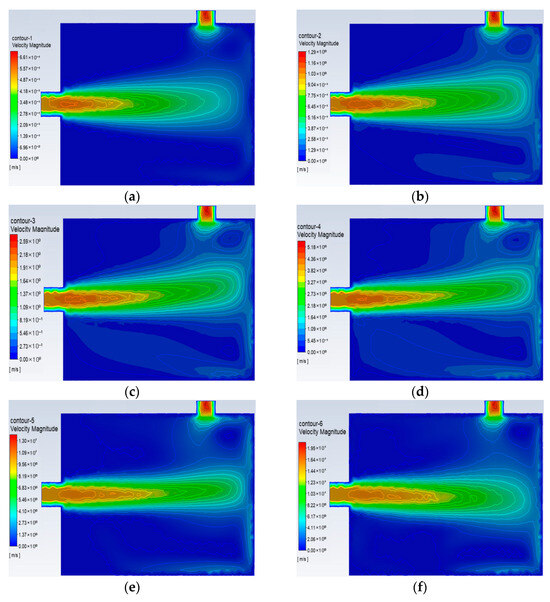
Figure 13.
Velocity contour maps inside the cylinder at six different inlet flow velocities: (a) velocity contour map at inlet flow velocity of 1 m/s; (b) velocity contour map at inlet flow velocity of 2 m/s; (c) velocity contour map at inlet flow velocity of 3 m/s; (d) velocity contour map at inlet flow velocity of 4 m/s; (e) velocity contour map at inlet flow velocity of 5 m/s; and (f) velocity contour map at inlet flow velocity of 6 m/s.
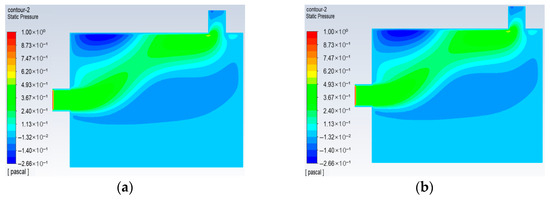

Figure 14.
Pressure contour plots inside the cylinder at six different inlet flow velocities: (a) pressure contour map at inlet flow velocity of 1 m/s; (b) pressure contour map at inlet flow velocity of 2 m/s; (c) pressure contour map at inlet flow velocity of 3 m/s; (d) pressure contour map at inlet flow velocity of 4 m/s; (e) pressure contour map at inlet flow velocity of 5 m/s; and (f) pressure contour map at inlet flow velocity of 6 m/s.
It can be seen from Figure 13 and Figure 14 that when the inlet flow velocity is low, the flow velocity inside the cylinder is relatively uniform, but the inertia of the particles is insufficient, resulting in a low inertial collision rate and thus a low dust removal efficiency. As the velocity gradually increases, the kinetic energy and inertia of the particles increase, which significantly improves the collision and capture effect with subsequent droplets, and the dust removal efficiency also increases accordingly. As shown in Figure 14, when the inlet flow velocity reaches 6 m/s, the pressure inside the cylinder causes turbulent disorder, which in turn affects the stability of particle capture. It can be seen from Table 4 that when the inlet flow velocity is 1~5 m/s, the velocity gradient and turbulent kinetic energy are stable; when the inlet flow velocity is 6 m/s, the velocity gradient increases, the turbulent kinetic energy increases significantly, the turbulent disturbance is enhanced, and turbulent disorder is caused. It is noted that elbows and junctions induce secondary vortices and additional pressure loss, which can affect particle–droplet collision rates. These secondary flows are particularly important in understanding how dust particles interact with water droplets during dust removal in curved or complex pipeline sections.
Table 4.
Velocity distribution inside the cylinder under different inlet flow velocities.
As shown in Figure 15, which presents the inertial collision efficiency at inlet flow velocities of 1 m/s, 2 m/s, 3 m/s, 4 m/s, 5 m/s, and 6 m/s, the inertial collision efficiency reaches its peak at an inlet dust-laden flow velocity of 5 m/s, resulting in the best dust removal efficiency.
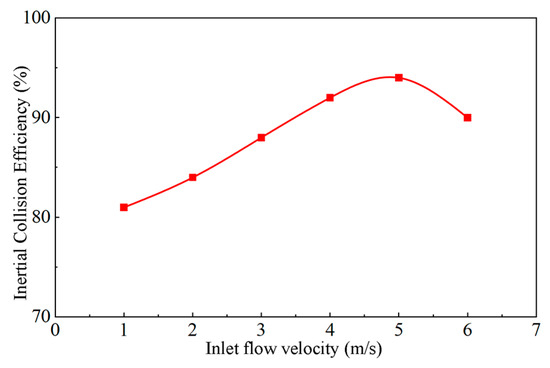
Figure 15.
Inertial collision efficiency under six different inlet flow velocities.
4.2.2. Influence of Water Mist Jet Pressure on Dust Removal Efficiency
The Discrete-Phase Model (DPM) in Fluent was employed to indirectly reflect the effect of pressure on droplet motion by simulating the influence of the pressure gradient in the airflow on droplet trajectories. To simplify calculations, droplets were treated as smooth spheres introduced into the fluid domain from the positive X-axis direction. Numerical simulation software was used to conduct the simulation study of the discrete phase in the flow field within a Lagrangian coordinate system. The geometric model is shown in Figure 16.
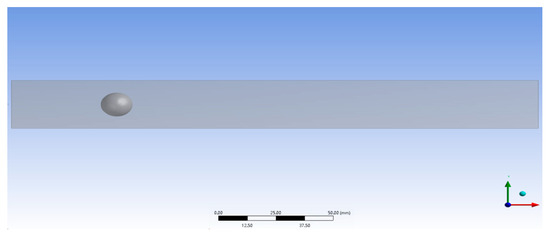
Figure 16.
Geometric model of droplets in Fluent.
Within the computational domain, the continuous phase is air, and the discrete phase is liquid water. Air is assumed to be an incompressible fluid with a constant temperature of 20 °C. The relevant material parameters are provided in Table 5.
Table 5.
Material parameters.
From the previous analysis, it is evident that the droplet diameter is one of the key factors influencing the wet dust removal efficiency, and the nozzle pressure directly determines the droplet diameter and interception efficiency (dust removal efficiency). In the simulation, different inlet pressures were set to model varying nozzle pressures. To investigate the impact of different nozzle pressures on the interception efficiency, simulations were conducted in a flow field with an inlet velocity of 5 m/s, setting nozzle pressures at 0.3 MPa, 0.45 MPa, 0.6 MPa, and 0.75 MPa to analyze the droplet interception efficiency. The results are shown in Figure 17, Figure 18, Figure 19 and Figure 20, which study the effect of different nozzle pressures on the dust removal efficiency.
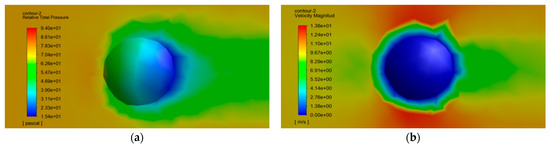
Figure 17.
Droplet pressure and velocity contour map at nozzle pressure of 0.3 MPa: (a) droplet pressure contour map at nozzle pressure of 0.3 MPa; (b) droplet velocity contour map at nozzle pressure of 0.3 MPa.

Figure 18.
Droplet pressure and velocity contour map at nozzle pressure of 0.45 MPa: (a) droplet pressure contour map at nozzle pressure of 0.45 MPa; (b) droplet velocity contour map at nozzle pressure of 0.45 MPa.
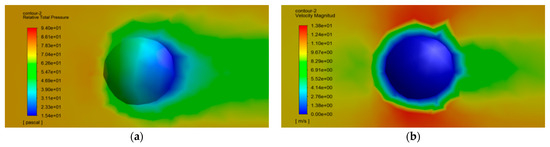
Figure 19.
Droplet pressure and velocity contour map at nozzle pressure of 0.6 MPa: (a) droplet pressure contour map at nozzle pressure of 0.6 MPa; (b) droplet velocity contour map at nozzle pressure of 0.6 MPa.
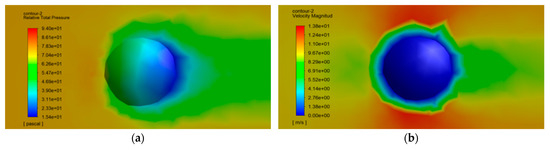
Figure 20.
Droplet pressure and velocity contour map at nozzle pressure of 0.75 MPa: (a) droplet pressure contour map at nozzle pressure of 0.75 MPa; (b) droplet velocity contour map at nozzle pressure of 0.75 MPa.
Based on the above turbulence numerical simulation analysis, it can be observed that at 0.3 MPa and 0.45 MPa, the pressure and velocity gradients around the mist droplets are relatively uniform. At 0.6 MPa, the pressure and velocity gradients around the droplets remain highly uniform. However, as the nozzle pressure increases to 0.75 MPa, the pressure gradient around the droplets becomes significantly larger. A large red region appears on the left side of the droplets, indicating intense pressure fluctuations and turbulent disturbances in the region, which lead to complex and irregular droplet motion. The interception efficiency under four different nozzle pressures is shown in Figure 21.
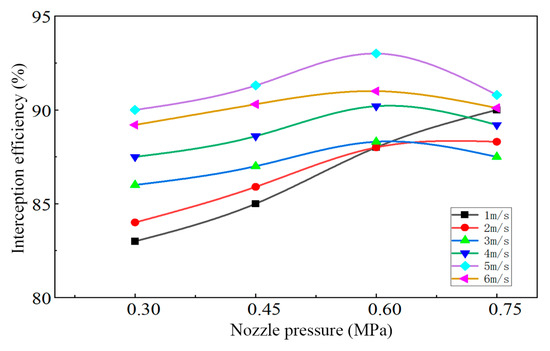
Figure 21.
Interception efficiency graph for nozzle pressures of 0.3 MPa, 0.45 MPa, 0.6 MPa, and 0.75 MPa.
From Figure 21, it can be observed that as the nozzle pressure and inlet flow velocity increase, the interception efficiency generally increases. Specifically, at 0.3 MPa, 0.45 MPa, and 0.6 MPa, the interception efficiency shows a stable increase, indicating that under these pressures, the droplet kinetic energy and flow field distribution are relatively uniform. At 0.75 MPa, the interception efficiency exhibits significant fluctuations due to excessive pressure gradients causing turbulent flow disturbances, which prevent some dust particles from being effectively captured. In summary, the highest interception efficiency, and thus the best dust removal efficiency, is achieved at a nozzle pressure of 0.6 MPa.
4.2.3. Influence of Double-Layer String Grid Spacing on Dust Removal Efficiency
For gas–solid-phase flow, to simulate the motion of particulate matter in the airflow, the gas is set as the continuous phase, and the liquid is set as the discrete phase, using the Discrete-Phase Model (DPM) within the multiphase flow model. Droplets and dust can be treated together as the liquid phase, with the DPM employed to simulate the concentration distribution of dust during the filtration process. The DPM material is set as water with a density of 1000 kg/m3, and the inlet pressure is set to 0.6 MPa. The mesh division for the Discrete-Phase Model is shown in Figure 22.
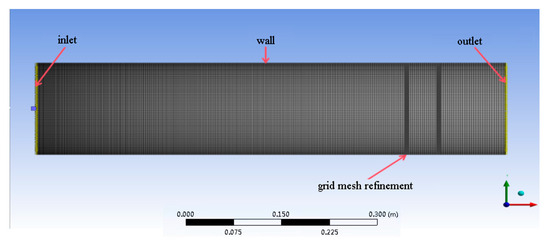
Figure 22.
Mesh division for the Discrete-Phase Model.
The Fluent simulation was carried out by adjusting the spacing between refined mesh layers to simulate the double-layer cascade spacing. The motion of gas in the dense two-phase flow was described using the continuous-phase equations and the momentum conservation equation. The influence of the mixed particles on the gas phase cannot be neglected. The governing equations are as follows:
In the equation, and represent the velocity and density of the gas, respectively; denotes the pressure; is the volume fraction of the fluid; is the particle source term, representing the gas–solid coupling force within the control volume; and denotes the viscous stress tensor.
In the equation, and represent the number and volume of particles in the computational cell, respectively; , , and denote the drag force, shear lift force, and Magnus lift force, respectively; is the volume of the computational cell; is the dynamic viscosity; and is the Kronecker delta function.
The standard k − ε model is used to solve the turbulence in the fluidized bed, described as follows:
is defined as
In the equation, Cμ is the turbulent viscosity coefficient; C1 = 1.44, C2 = 1.92, and Cμ = 0.09; k is the turbulent kinetic energy, with a turbulent Prandtl number = 1.0; and ε is the dissipation rate, with a turbulent Prandtl number = 1.3.
The inlet pressure is 0.6 MPa. According to the actual working conditions of the pipeline robot, the cascade spacing is set to 200 mm, 300 mm, 400 mm, and 500 mm, respectively. The dust concentration distributions before and after the double-layer cascades under these conditions are shown in Figure 23.
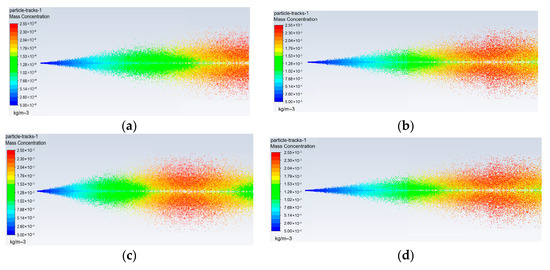
Figure 23.
Dust concentration distributions under four different cascade spacings: (a) dust concentration distribution contour map with a cascade spacing of 200 mm; (b) dust concentration distribution contour map with a cascade spacing of 300 mm; (c) dust concentration distribution contour map with a cascade spacing of 400 mm; and (d) dust concentration distribution contour map with a cascade spacing of 500 mm.
Based on the contour maps in Figure 23, it can be observed that within a certain period of time, the dust concentration distributions remain generally similar as the cascade spacing increases. However, after that period, the concentration distribution gradually changes—the color transitions from red (indicating high concentration) to yellow and green (indicating lower concentrations). As the cascade spacing increases, the green regions become more prominent but eventually begin to shrink again. This indicates that excessively increasing the cascade spacing may actually reduce the dust removal effectiveness.
In Figure 24, the dust concentration variation trends under cascade spacings of 200 mm, 300 mm, 400 mm, and 500 mm are illustrated. Figure 25 presents the dust concentration trends before and after dust removal. Based on the analysis of Figure 24 and Figure 25, it can be concluded that with the increase in the cascade spacing Ls, the overall dust concentration decreases over time. When the spacing increases from 200 mm to 400 mm, the dust concentration drops rapidly. However, at a spacing of 500 mm, the dust concentration rises slightly compared to that at 400 mm. Therefore, under the dust removal system designed in this study, a cascade spacing of 400 mm yields the most effective dust removal performance.
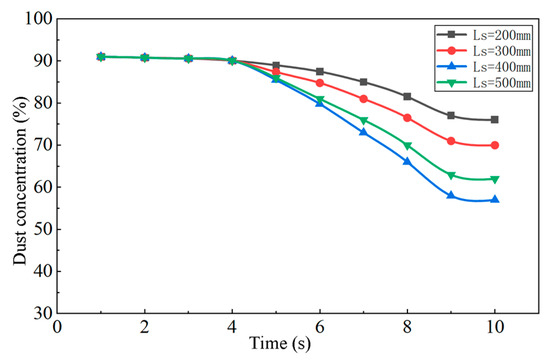
Figure 24.
Trend of dust concentration variation under four different cascade spacings.
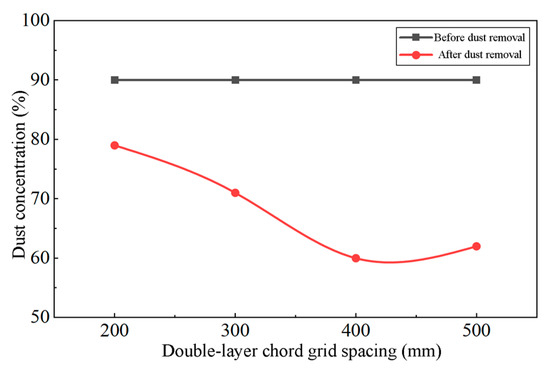
Figure 25.
Trend of dust concentration variation before and after dust removal.
The above sections present simulation analyses of the motion process of the drive unit and the dust removal process of the purification unit in the gas purification pipeline robot. The results show that the traction force increases gradually with the deflection angle of the drive wheels. By modeling the dust removal process of the purification unit, generating a computational mesh, and conducting finite element simulations, the effects of the inlet flow velocity, water mist jet pressure, and double-layer cascade spacing on the dust removal efficiency were investigated. Based on the results of the three simulation groups, it is concluded that the optimal dust removal performance is achieved when the inlet flow velocity is 5 m/s, the jet pressure is 0.6 MPa, and the double-layer cascade spacing is 400 mm.
5. Robot Experimental Testing
5.1. Construction of the Robot Experimental Platform
Based on the previously proposed structural design, an experimental prototype of the gas purification pipeline robot was constructed. The test pipeline is made of acrylic, with a length of 2000 mm and an inner diameter of 200 mm, and is equipped with flanges and blind plates to facilitate gas flow, operational observation, and performance monitoring. A schematic diagram of the gas purification pipeline robot experimental platform is shown in Figure 26.
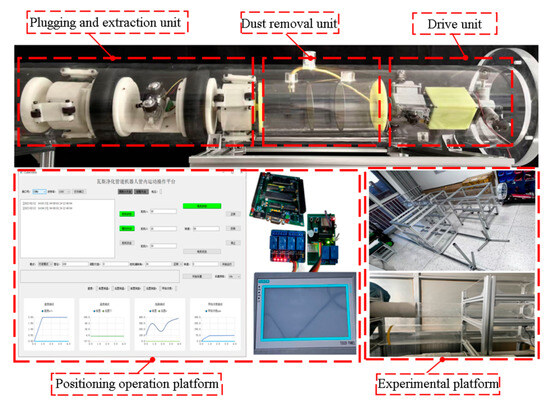
Figure 26.
Experimental platform for gas purification pipeline robot.
To investigate the effects of various parameters on the gas dust removal performance, a pipeline robot dust removal experimental platform was constructed. The experimental system, shown in Figure 27, mainly consists of air monitoring equipment, a dust generator, the robot, and a water supply device. The system is designed for closed-loop control: the spray pressure and drive speed can be adjusted via real-time dust concentration feedback using PID logic. All dust sensors and pressure transducers were calibrated before experiments according to manufacturer guidelines; the dust concentration probe was checked against known test dust. Each condition was tested three times, and average values with standard deviations are reported.
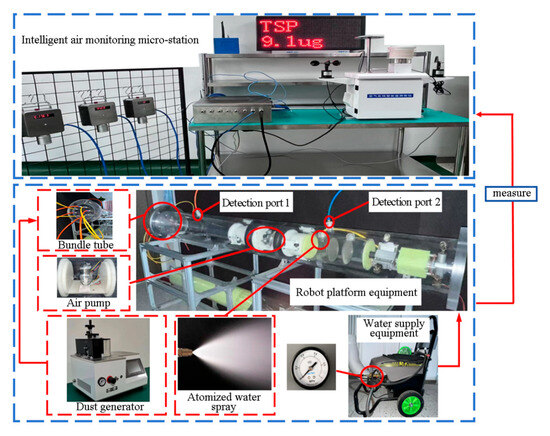
Figure 27.
Dust removal experimental system diagram.
5.2. Robot Traction Force Experiment
One of the key parameters to evaluate the robot’s performance is its load capacity, which can be assessed by measuring the traction force. To ensure accurate traction force measurement, the prototype is driven at a low speed inside the pipeline while pulling a spring dynamometer until the wheels slip and the robot can no longer advance. At this point, the reading on the dynamometer represents the maximum traction force of the robot during operation inside the pipeline. A schematic diagram of the traction force test experiment is shown in Figure 28. Actual mine pipelines may have misalignments and higher friction; these factors were not included in our model and could affect traction and energy use.
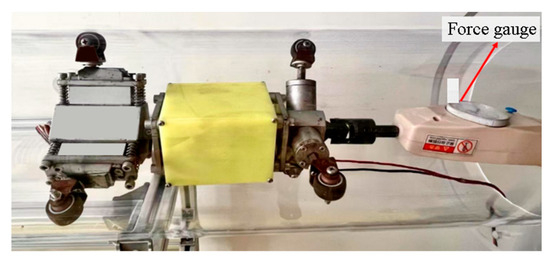
Figure 28.
Traction force test experiment.
The rotational speed of the drive motor was set to 50 r/min. The steering servo was then used to adjust the deflection angle of the drive wheel within a range of 5° to 90°. The spring dynamometer readings were recorded progressively during these adjustments. A comparison between the experimental data and simulation results is shown in Figure 29.
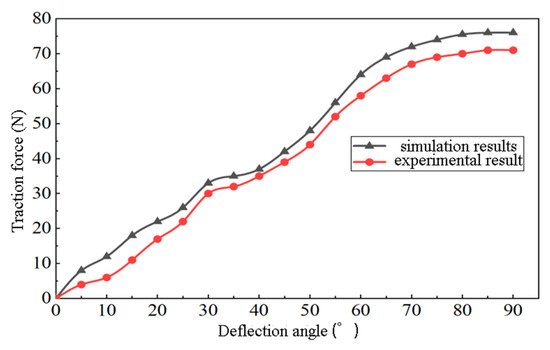
Figure 29.
Traction force experiment and simulation comparison diagram.
The comparative analysis between the experimental results and simulation data indicates that the traction force variation trends of both are generally consistent, although the experimental values are slightly lower than the simulation results. This discrepancy is mainly due to the simulation being conducted under ideal conditions, without accounting for friction losses between components and potential errors during assembly. From the experimental data, it can be observed that when the drive wheel deflection angle ranges from 30° to 90°, the measured traction force lies between 30 N and 65 N, meeting the design requirement of the model, FT ≥ 30 N.
5.3. Robot Dust Removal Experiment
In the dust removal experiments of this study, the primary focus was to investigate the effects of three factors—the inlet flow velocity, jet pressure, and grid spacing—on the dust removal efficiency. To ensure the reliability of experimental data and avoid the influence of multiple variables on equipment stability and measurement accuracy, the study employed the method of controlling variables. Only one variable was changed at a time while keeping the others constant, allowing the isolated effect of each factor on the dust removal efficiency to be observed. This approach was aligned with the conditions used in the simulation study to facilitate a comparison between experimental and simulation data and to validate the reliability of the simulation analysis.
Therefore, to determine the effect of the inlet flow velocity on the dust removal efficiency, one test condition was established, namely Condition 1 (24 data sets); to assess the impact of the jet pressure on the dust removal efficiency, another test condition, Condition 2 (24 data sets), was set; and to evaluate the influence of the grid spacing on the dust removal efficiency, Condition 3 (16 data sets) was proposed. The specific parameters are listed in Table 6.
Table 6.
Gas purification dust removal test conditions.
The wet grid dust removal efficiency was measured under varying dust removal inlet flow velocities, water mist jet pressures, and grid spacing conditions. If the dust removal efficiency is denoted as , the dust concentration at detection point (b) as C1, and the dust concentration at detection point (a) as C0, then the dust removal efficiency under each test condition can be expressed as .
5.3.1. Experimental Analysis of Inlet Flow Velocity in the Flow Field
Under the experimental condition of a water mist jet pressure of 0.6 MPa, the 24 sets of experimental data for Condition 1 are shown in Table 7.
Table 7.
Dust removal efficiency for Condition 1.
The experimental data and simulation comparison of the dust removal efficiency versus inlet flow velocity for Condition 1 are presented in Figure 30a,b. Figure 30b compares the average experimental values with the simulation results.
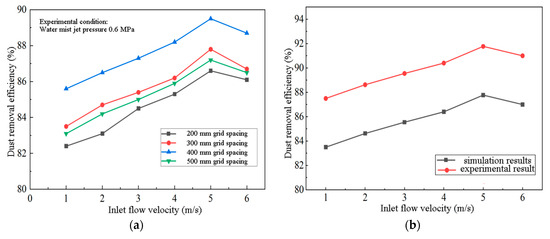
Figure 30.
Comparison of experimental and simulated data for inlet flow velocity and dust removal efficiency for Condition 1: (a) experimental values for Condition 1; (b) comparison of average experimental values with simulation results.
The analysis of Figure 30 indicates that, with the water mist jet pressure and grid spacing held constant, the dust removal efficiency increases as the inlet flow velocity rises. However, when the flow velocity exceeds 5 m/s, the dust removal efficiency significantly decreases.
5.3.2. Experimental Analysis of Water Mist Jet Pressure
Under the experimental condition of a grid spacing of 400 mm, the 24 sets of experimental data for Condition 2 are presented in Table 8.
Table 8.
Dust removal efficiency for Condition 2.
The experimental data and simulation comparison of the dust removal efficiency versus water mist jet pressure for Condition 2 are shown in Figure 31a,b. In Figure 30b, the average experimental values are compared with the simulation results.
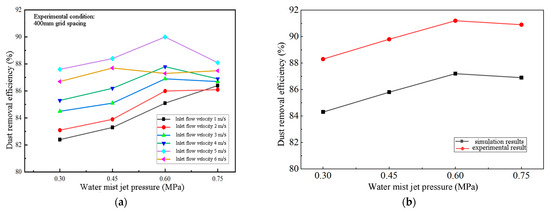
Figure 31.
Comparison of experimental and simulated data for water mist jet pressure and dust removal efficiency for Condition 2: (a) experimental values for Condition 2; (b) comparison of average experimental values with simulation results.
The analysis of Figure 31 indicates that, with the grid spacing and inlet flow velocity held constant, the dust removal efficiency increases as the water mist jet pressure increases. However, when the water mist jet pressure reaches 0.75 MPa, the dust removal efficiency exhibits an overall decline of varying degrees. This decrease is attributed to the excessive pressure gradient at 0.75 MPa, which causes turbulence disruption and fluctuations in the interception efficiency, thereby reducing the overall dust removal performance.
5.3.3. Experimental Analysis of Double-Layer Grid Spacing
Under the experimental condition of an inlet flow velocity of 5 m/s, 16 sets of experimental data for Condition 3 are presented in Table 9.
Table 9.
Dust removal efficiency for Condition 3.
The experimental data and simulation comparison of the dust removal efficiency versus grid spacing for Condition 3 are shown in Figure 31b and Figure 32a. In Figure 32b, a comparison is made between the average experimental values and the average simulation values.
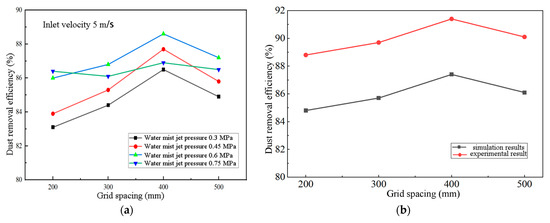
Figure 32.
Comparison of experimental and simulated data for grid spacing and dust removal efficiency for Condition 3: (a) experimental values for Condition 3; (b) comparison of average experimental values with simulation results.
The analysis of Figure 32 shows that, with the inlet flow velocity and water mist jet pressure held constant, the dust removal efficiency first increases and then decreases as the grid spacing increases. The highest dust removal efficiency is achieved when the grid spacing is 400 mm.
Comparing the experimental results with the simulation results across the three test conditions, it can be observed that the experimental values are generally slightly lower than the simulation results. This deviation is mainly caused by instability in measurement, pressure supply, and other equipment in real-world conditions. Nevertheless, the overall trends are consistent, which not only confirms the accuracy of the simulation but also validates the reliability of the experiments. The close agreement between the simulated and experimental dust removal efficiencies (Figure 30, Figure 31 and Figure 32) provides confidence in the selected turbulence model.
By employing the method of controlling variables, the effects of the inlet flow velocity, water mist jet pressure, and grid spacing on the dust removal performance were investigated individually. The experimental results demonstrate that the gas purification and dust removal performance is optimal under the condition of an inlet flow velocity of 5 m/s, a water mist jet pressure of 0.6 MPa, and a double-layer grid spacing of 400 mm. Under these conditions, dust interference with monitoring equipment is effectively reduced, and the accuracy of gas composition detection is significantly improved. Droplet evaporation effects were neglected due to high ambient humidity and short interaction times. Under different humidity or temperature conditions, evaporation could reduce efficiency; this will be addressed in future work.
6. Conclusions
The conclusions of this work are as follows:
- (1)
- A gas purification pipeline robot combining helical drive and wet dust removal was designed. Through a modular design, the coordinated operation of the driving, sealing–extraction, and dust removal units was achieved, enabling adaptive operation in pipelines with diameters ranging from DN180 to DN220. The robot is enclosed in a flame-retardant and explosion-proof shell, ensuring operational safety while effectively removing dust from gas mixtures, thereby enhancing the safety and data reliability of subsequent underground gas monitoring.
- (2)
- The robot’s motion characteristics were analyzed, including its performance in straight pipelines and traction capability. A dynamic model for straight-pipe motion was established to derive the relationship between the drive wheel deflection angle and the robot’s velocity, as well as the trajectory equation. The traction force experienced during movement was investigated, revealing that the force increases with the drive wheel deflection angle and then stabilizes. Additionally, three dust removal mechanisms—inertial impaction, interception, and Brownian diffusion—were analyzed, and the influence of key parameters, namely the inlet flow velocity, water mist jet pressure, and double-layer grid spacing, on the dust removal efficiency was explored.
- (3)
- The robot’s motion process was simulated using Adams virtual prototyping technology. The results showed that the traction force increases with the deflection angle of the drive wheels. A numerical simulation of the wet dust removal process was conducted using Fluent, demonstrating that variations in the inlet flow velocity, water mist jet pressure, and double-layer grid spacing significantly influence the inertial collision rate, interception efficiency, and dust concentration. Each of these parameters has an optimal value that maximizes the dust removal efficiency.
- (4)
- A physical prototype was developed and its performance tested. The measured traction force ranged from 30 N to 65 N when the drive wheel deflection angle was between 30° and 90°. An experimental platform for dust removal was constructed, and dust removal experiments confirmed that the optimal operating condition is achieved at an inlet flow velocity of 5 m/s, a jet pressure of 0.6 MPa, and a double-layer grid spacing of 400 mm. These experimental results are consistent with the simulation analysis, verifying the accuracy and reliability of the simulation conclusions.
By establishing a model for the gas purification pipeline robot, we successfully completed the prototype fabrication and the setup of a testing platform. The results indicate that the optimal dust removal condition for the robot within the pipeline is achieved at a jet pressure of approximately 0.6 MPa, an inlet flow velocity of 5 m/s, and a double-layer grid spacing of 400 mm. The modular design allows scaling: smaller diameters require reduced dimensions and torque, while larger pipes need stronger motors and supports.
7. Future Work
Future work will investigate the performance of the robot in non-straight pipelines, including bends and vertical sections, as secondary flows and turbulence may affect the dust removal efficiency. Additionally, we plan to conduct field validation in real goaf conditions, optimize the closed-loop control system, and adapt the robot to handle complex geometries. These advancements will contribute to enhancing coal mine safety and automating dust control processes.
Author Contributions
Conceptualization, H.Y., H.W. and Z.K.; Methodology, H.Y. and H.W.; Software, Y.M. and G.W.; Validation, H.Y., Y.M. and Z.K.; Formal Analysis, H.Y.; Investigation, Y.M. and H.R.; Data Curation, Y.M., G.W. and Z.K.; Writing—Review and Editing, all authors; Visualization, H.R.; Supervision, H.W.; Project Administration, H.Y.; Funding Acquisition, H.Y. and H.W. All authors have read and agreed to the published version of the manuscript.
Funding
This paper is part of a project that has received funding from The Local Technology Development Funding Projects Guided By The Central Government, “Research and Promotion of Positioning and Repair Technology of Intelligent Inspection Robots in Pipeline Internal Defect Monitoring Industry” (YDZJSX2024C011), and from the Shanxi Province Postgraduate Student Innovation Project (2025SJ303). This work was supported by the National Natural Science Foundation of China (NSFC) General Program (52574202).
Data Availability Statement
The original contributions presented in this study are included in the article. Further inquiries can be directed to the corresponding author.
Acknowledgments
This research was generously supported by the following organizations, to which we express our sincere gratitude: Shanxi Provincial Key Laboratory of Advanced Manufacturing, North University of China; Taiyuan University of Technology National and Local Joint Engineering Laboratory of Mine Fluid Control; Shanxi Datong University Coal Mine Electromechanical Technology Institute; Shanxi Coal Import and Export Group Science and Technology Research Institute Co., Ltd.; and Shanxi Honganxiang Science and Technology Co., Ltd.
Conflicts of Interest
The authors declare no conflicts of interest.
Correction Statement
This article has been republished with a minor correction to the Funding statement. This change does not affect the scientific content of the article.
References
- Deng, J.; Li, X.; Wang, K.; Wang, W.; Yan, J.; Tang, Z.; Kang, F.; Ren, S. Intelligent Monitoring and Early Warning Technology for Mine Fires: Research Progress and Prospects Over the Past 20 Years. Coal Sci. Technol. 2024, 52, 154–177. [Google Scholar]
- Yin, W.H. Current Situation, Trends, and Countermeasures in China’s Energy Industry. China Price 2024, 2, 15–20. [Google Scholar]
- Wang, K.; Ding, C.; Jiang, S.; Wu, Z.; Shao, H.; Zhang, W. Application of the Addition of Ionic Liquids Using a Complex Wetting Agent to Enhance Dust Control Efficiency During Coal Mining. Process Saf. Environ. Prot. 2018, 122, 13–22. [Google Scholar] [CrossRef]
- Zhou, G.; Jing, B.; Meng, Q.; Liu, Y.; Yang, W.; Sun, B. Study on Coupling Diffusion of Composite Dust and Cloud-Mist Dedust Technology in Fully Mechanized Driving Face of Mixed Coal-Rock Roadway. Adv. Powder Technol. 2023, 34, 103911. [Google Scholar] [CrossRef]
- Peng, H.; Nie, W.; Zhang, X.; Xu, C.; Meng, X.; Cheng, W.; Liu, Q.; Hua, Y. Research on the Blowing-Spraying Synergistic Dust Removal Technology for Clean Environment in Large-Scale Mechanization Coal Mine. Fuel 2022, 324, 124508. [Google Scholar] [CrossRef]
- Wang, Y.; Jiang, Z.; Zhang, F.; Lu, Y.; Bao, Y. Study on Dust Diffusion Characteristics of Continuous Dust Sources and Spray Dust Control Technology in Fully Mechanized Working Face. Powder Technol. 2022, 396, 718–730. [Google Scholar] [CrossRef]
- Lin, B.Q.; Li, Q.Z.; Zhou, Y. Research Progress on Multi-Field Evolution of Gas and Coal Spontaneous Combustion Composite Thermodynamic Hazards in Goaf of Coal Mines. J. China Coal Soc. 2021, 46, 1695–1705. [Google Scholar]
- Si, R.J.; Huang, Z.C. Key Technologies and Development Trends in Coal Dust Explosion Disaster Prevention and Control. Min. Saf. Environ. Prot. 2024, 51, 45–50. [Google Scholar]
- Guo, J. Research and Application of Nitrogen Injection Technology in Goaf of Fully Mechanized Working Face. Tongmei Sci. Technol. 2021, 179, 56–58. [Google Scholar]
- Zhao, J.B.; Chen, Y.P. Application of the Novel JSG6 Tube Bundle Monitoring System in Fire Prevention and Extinguishing at Shangwan Coal Mine. Coal Eng. 2022, 54, 95–98. [Google Scholar]
- Kwon, Y.-S.; Yi, B.-J. Design and Motion Planning of a Two-Module Collaborative Indoor Pipeline Inspection Robot. IEEE Trans. Robot. 2012, 28, 681–696. [Google Scholar] [CrossRef]
- Kakogawa, A.; Sekiya, K.; Nakazawa, R.; Ikuno, Y. A V-Shaped In-Pipe Robot to Travel Through Complex Winding Pathways in Three Dimensions. J. Field Robot. 2024, 41, 123–135. [Google Scholar] [CrossRef]
- Jeon, K.W.; Jung, E.J. Development of an In-Pipe Inspection Robot for Large-Diameter Water Pipes. Sensors 2024, 24, 3470. [Google Scholar] [CrossRef] [PubMed]
- Thung-Od, K.; Kanjanawanishkul, K.; Boonyaprapasorn, A. An In-Pipe Inspection Robot with Permanent Magnets and Omnidirectional Wheels: Design and Implementation. Appl. Sci. 2022, 12, 1226. [Google Scholar] [CrossRef]
- Roh, S.-G.; Choi, H.R. Differential-Drive In-Pipe Robot for Moving Inside Urban Gas Pipelines. IEEE Trans. Robot. 2005, 21, 1–17. [Google Scholar]
- Shi, N.; Li, H.; Xu, T.; Hua, H.; Ye, J.; Chen, Z. Design, Analysis, and Optimization Testing of a Novel Modular Walking Device for Pipeline Robots. Machines 2024, 12, 718. [Google Scholar] [CrossRef]
- Li, J.; Huang, F.; Tu, C.; Tian, M.; Wang, X. Elastic Obstacle-Surmounting Pipeline-Climbing Robot with Composite Wheels. Machines 2022, 10, 874. [Google Scholar] [CrossRef]
- Yan, H.W.; Niu, H.L.; Chang, Q.; Zhao, P.; He, B. Study on Dynamic Characteristics of Pipeline Jet Cleaning Robot. Actuators 2024, 13, 49. [Google Scholar] [CrossRef]
- Chang, Q.; Yan, H.W.; Niu, H.L.; Zhao, P.Y.; He, B.L. Motion Analysis of Pipeline Inspection and Cleaning Robot Inside Pipes. J. Mech. Transm. 2024, 48, 155–163. [Google Scholar]
- Yan, H.W.; Zhao, P.Y.; Xiao, C.J.; Zhang, D.; Jiao, S.; Pan, H.; Wu, X. Design and Kinematic Characteristic Analysis of a Spiral Robot for Oil and Gas Pipeline Inspections. Actuators 2023, 12, 240. [Google Scholar] [CrossRef]
- Guo, S.W.; Liu, Y.Z.; Zhang, C.; Zhang, C.; Wang, S.; Li, Y.; Cheng, S. Computational Fluid Dynamics Analysis of Wet Dust Removal in High-Gravity Countercurrent Rotating Packed Bed. Atmosphere 2024, 15, 157. [Google Scholar] [CrossRef]
- Wu, Z.R.; Wang, H.Q.; Guo, H.; Gu, M.; Jiang, J.; Chen, S.; Huang, J.; Fan, S. Experimental Investigation and Application of Mine Airflow Purification and Reuse Technology. Environ. Technol. Innov. 2021, 24, 101845. [Google Scholar] [CrossRef]
- Cao, Y.; Xiao, Y.; Wang, Z.P.; Li, Q.W.; Shu, C.M.; Jiang, X.R.; Wu, S.L. Recent Progress and Perspectives on Coal Dust Sources, Transport, Hazards, and Controls in Underground Mines. Process Saf. Environ. Prot. 2024, 187, 159–194. [Google Scholar] [CrossRef]
- Zhu, N.T.; Chen, W.S.; Huang, D.P.; Fan, Y.F. Performance Study of Porous Media Wet Scrubbers for Collecting Fine Particulate Matter. Met. Mine 2021, 10, 204–208. [Google Scholar]
- Li, S. Design and Experimental Study of a Three-Stage Composite Wet Scrubber. Ph.D. Thesis, Qingdao University of Science and Technology, Qingdao, China, 2019. [Google Scholar]
- Li, H.Y.; Dong, G.L.; Zhang, J.Y.; Wang, S.X.; Zhang, Y.C. Research Progress on Dust Suppression Technology Based on Wet Dust Removal. Energy Conserv. 2022, 41, 77–80. [Google Scholar]
- Wang, J.J. Research on Dust Detection and Spray Dust Suppression Technology in Coal Mining Operations. Master’s Thesis, Xi’an University of Science and Technology, Xi’an, China, 2018. [Google Scholar]
- Urbanowicz, K.; Bergant, A.; Stosiak, M.; Deptuła, A.; Karpenko, M. Navier-Stokes Solutions for Accelerating Pipe Flow—A Review of Analytical Models. Energies 2023, 16, 1407. [Google Scholar] [CrossRef]
- Karpenko, M.; Stosiak, M.; Šukevičius, Š.; Skačkauskas, P.; Urbanowicz, K.; Deptuła, A. Hydrodynamic Processes in Angular Fitting Connections of a Transport Machine’s Hydraulic Drive. Machines 2023, 11, 355. [Google Scholar] [CrossRef]


Disclaimer/Publisher’s Note: The statements, opinions and data contained in all publications are solely those of the individual author(s) and contributor(s) and not of MDPI and/or the editor(s). MDPI and/or the editor(s) disclaim responsibility for any injury to people or property resulting from any ideas, methods, instructions or products referred to in the content. |
© 2025 by the authors. Licensee MDPI, Basel, Switzerland. This article is an open access article distributed under the terms and conditions of the Creative Commons Attribution (CC BY) license (https://creativecommons.org/licenses/by/4.0/).