Abstract
The efficient and sustainable design of robotic manufacturing cells is a critical aspect of modern industrial processes, for which energy and time efficiency play significant roles in achieving sustainability goals. In industrial practice, robotic cell design often involves methods such as predefined layout templates, empirical rules for positioning, and simulation-based validation. While these approaches provide a practical starting point, they may not fully account for the complex interdependencies between robot configuration, energy consumption, and operational efficiency. Consequently, opportunities for optimizing resource usage are frequently overlooked. This paper presents a novel methodology for optimizing the deployment of industrial robots and their peripherals, focusing on minimizing energy and time costs to enhance the sustainability of industrial processes. The proposed approach, grounded in experimental measurements and simulations, was validated through an experimental model of a welding robot station. The methodology integrates the analysis of the relationship between the robot base position, trajectory, and energy consumption. The results indicate that adjusting the relative positions of robots and work points can achieve energy savings of approximately six percent. Specifically, optimization reduced energy consumption by 1.6731 Wh per work cycle, translating to an annual savings of 0.8794 MWh for a 60 s clock cycle. These findings highlight the practical applicability of the proposed methodology, demonstrating its potential to significantly improve the energy and time efficiency of robotic workplaces.
1. Introduction
Small- and medium-sized enterprises (SMEs) and research and development teams are responding to increasing demands for productivity and quality by adopting industrial robots. These systems improve efficiency, address labor shortages, and enable specialized tasks such as welding, assembly, and painting, making them a vital component of modern production systems [1,2,3,4,5,6].
Traditionally, the design of robotic work cells relied on standardized methods and practical experience. While effective, these approaches are now enhanced by advanced technologies, like simulation, digital twins, and virtual commissioning. These tools allow for iterative testing and the optimization of work cell layouts, enabling enterprises and research teams to explore alternative configurations, improve workflows, and validate designs before physical implementation [7,8,9,10,11].
Well-designed workplace layouts maximize productivity, resource efficiency, and cost-effectiveness. Conversely, poorly planned layouts can lead to inefficiencies, increased costs, and energy losses, highlighting the importance of systematic design approaches [12,13].
Among various aspects of robotic workplace design, energy efficiency plays a significant role, as factors like robot positioning, optimized motion trajectories, and the effective use of robotic capabilities directly impact energy consumption and operational costs [14,15,16].
Inefficiencies, such as the redundant use of robots or poorly coordinated movements, can hinder these optimization efforts by increasing costs and extending production times [17,18].
To address these challenges, methodical and systematic planning and optimization are crucial. Tools such as simulation and digital twins enable the early identification and mitigation of potential inefficiencies during the design phase. Additionally, advanced algorithms and machine learning methods further enhance these optimization efforts by reducing energy consumption and improving time efficiency [19,20].
This article introduces a comprehensive approach to robotic workstation design, focusing on layout optimization, energy efficiency, and theoretical principles. The proposed methodology bridges gaps in existing approaches by integrating energy efficiency as a critical factor throughout all stages of robotic layout design. Each of the six steps, from conceptual layout planning to trajectory optimization and validation, has been enhanced to align with industrial demands.
The background highlights key concepts in robotic cell design, including layout methodologies, energy efficiency, and theoretical relationships, identifying limitations in existing methods for measuring energy consumption. These insights underpin the development of a systematic methodology that optimizes robot base positions to enhance energy efficiency while maintaining productivity.
The proposed methodology, illustrated through a development diagram, incorporates established practices alongside novel insights. It systematically addresses six steps of robotic layout design, integrating energy consumption analysis and optimization techniques. The framework was validated through a case study in the automotive industry, which demonstrated significant energy savings and productivity improvements. Adjustments were made during implementation to address real-world challenges, further validating its practicality.
The discussion highlights the energy savings achieved compared to traditional methods, emphasizing the methodology’s industrial relevance and potential for refinement. The study concludes with directions for future research to expand and adapt the framework to diverse industrial applications.
2. Background
To comprehensively address robotic workstation design and optimization, it is essential to focus on key areas such as robotic cell concepts, layout methodologies, energy efficiency, and the theoretical basis for analysis. Advanced methods like simulations, digital twins, and computer-assisted systems enable precise calculations for determining the optimal number of machines and robots, optimizing trajectories, reducing cycle times, and achieving efficient layouts [21].
However, it is crucial to focus on the theoretical relationships that underpin these approaches, as they provide the foundation for understanding and deriving these practical solutions. This chapter emphasizes the importance of integrating these theoretical principles with practical applications to meet industrial demands for productivity, efficiency, and sustainability.
2.1. Robotic Manufacturing Cell
A robotic cell is a defined workspace containing one or more robots, designed to perform tasks efficiently and safely. An optimally designed robotic cell not only boosts productivity but also minimizes energy consumption and supports sustainable production. Achieving this requires systematic methods and experimental approaches that focus on selecting appropriate concepts, tools, and techniques to refine the structure and interrelationships of the cell’s components [22].
Determining the optimal number of machines and robots within a robotic cell is a crucial aspect of its design, involving an analysis of system utilization and throughput. Formula (1) is often used to calculate the resources required for efficient part processing [23]:
where MT is the number of machines needed, D is the total demand (number of parts to be processed in a certain period of time), Tm is the processing time per part on the machine, A is the uptime of the machine (the relative time the machine is operational, e.g., 0.9 for an uptime of 90%), and Tp is the available production time per period (e.g., the number of working hours per day) [24].
Capacity analysis [25], based on Formula (2), which considers the available time, operations, and efficiency, is key because it provides accurate data to improve productivity, reduce costs, and minimize downtime, thereby directly supporting the competitiveness of the production system:
where U is the capacity utilization of the robot cell, Ti is the time during which the robot i executes the tasks, Tcycle is the total cycle time of the cell, and n is the number of robots.
Optimizing the robot’s motion trajectory minimizes time or energy consumption [26,27,28]. The total energy consumption for the entire trajectory is computed by Formula (3), integrating the power over the time duration of the trajectory [29]:
where N is the total number of trajectory points, E is energy, and pi is the total power usage.
The total cycle time (Tcycle) is a key indicator [30] of the efficiency and energy intensity of production, and optimizing it increases productivity, reduces costs, and promotes system sustainability, as shown in Formula (4):
where Tcycle is the total cycle time, Tload is the time required to load the material, Toperate is the operation (production and processing) time, Tunload is the time required to unload the material, and Tdelay represents time delays caused by setups, tool changes, and other downtime.
2.2. Robotic Cell Layout
Robotic cell design includes a requirements analysis, robotic technology selection, equipment design, and an optimal workstation layout to maximize throughput, ensure safety, and simplify maintenance [31,32,33,34].
2.2.1. Theoretical Aspects for the Creation of a Robotic Cell Layout
Determining the optimal number of robots and equipment depends on the cycle time, daily demand, and resource availability. Optimizing these parameters reduces material movement costs and increases the efficiency and return on investment [35,36,37]. The minimization is calculated as follows in Formula (5):
where Z is the total cost of the movement of materials, fij is the frequency of movement between workplaces i and j, dij is the distance between workplaces i and j, and n is the number of workplaces [38].
The optimization of the placement of robotic cells was addressed by a study [39], which proposed Formula (6) for minimizing the workspace and defining a safe robot workspace (Asafe), thus enabling multivariate arrangements and more efficient installation:
where X is the maximum reach along the x-axis, Y is the maximum reach along the y-axis, and C is the safety distance. This calculation provides a simplified estimation, assuming a square workspace, and helps in planning the layout to ensure safety margins are maintained.
Formula (7) is used to calculate the optimum position of workstations based on frequency weights to calculate the centroid of the workstation. This formula allows one to determine the optimal location of workstations in order to minimize distances and improve the efficiency of the layout:
where xc, yc are the coordinates of the optimal site location, fij is the frequency of movement between sites, and xi, yi are the coordinates of the existing sites [40].
2.2.2. Robotic Cell Layout Design Methodology
The design of robotic workplaces follows a systematic methodology rooted in empirical knowledge gained through industrial practice. This approach addresses key challenges, such as effective layout design, efficient investment utilization, the optimized use of robots, and cycle time reduction. It builds on decades of experience from companies, supported by multiple studies [41,42,43,44], and integrates these insights into a universal framework.
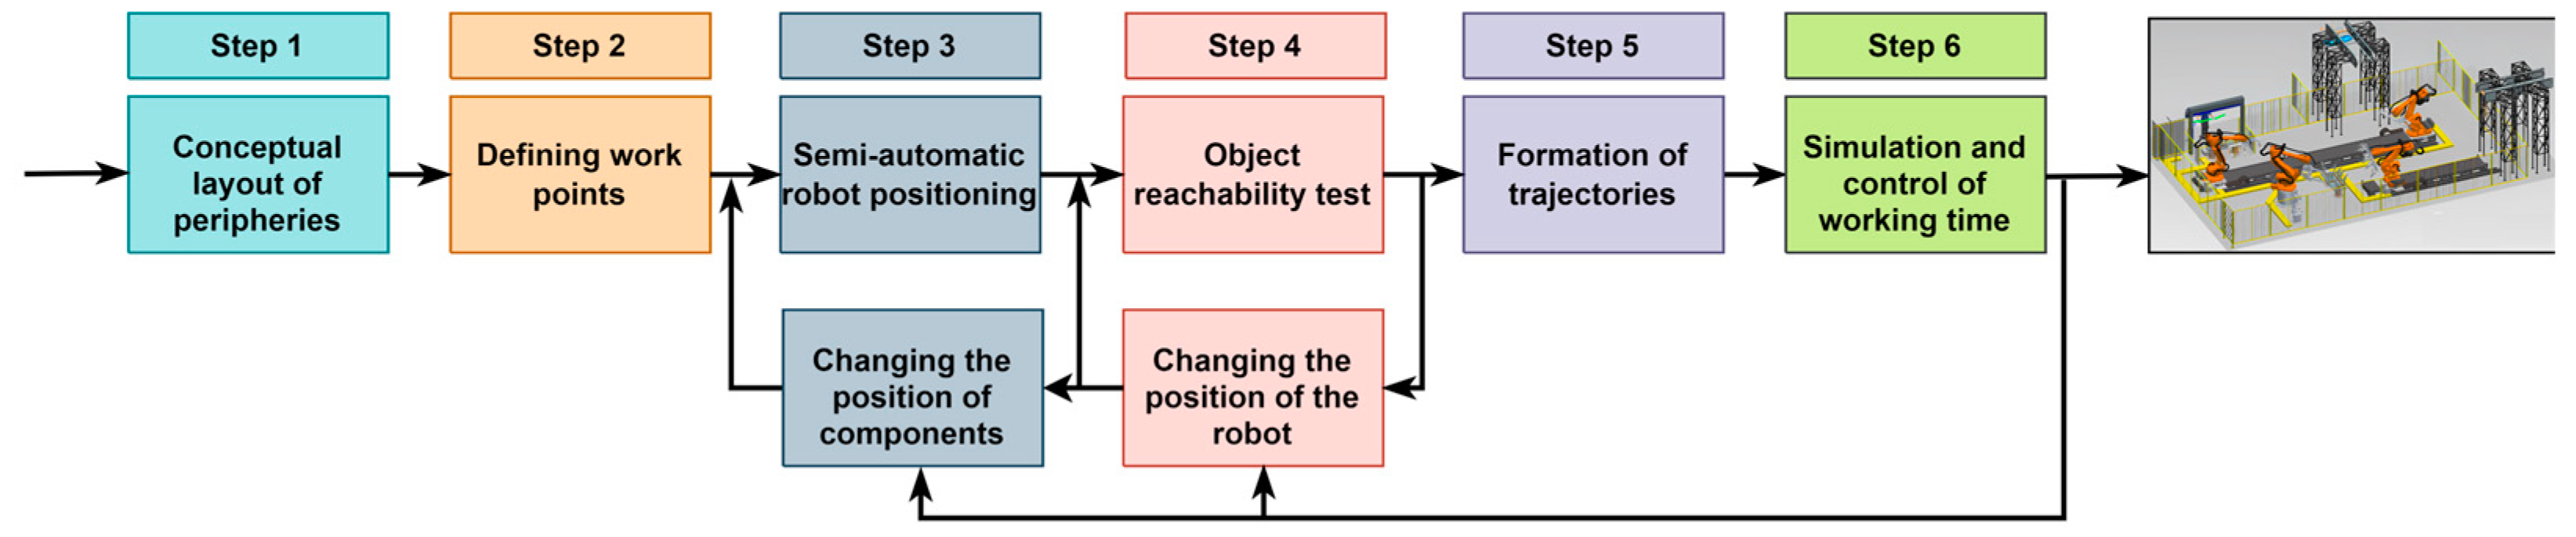
In this study, practical insights into robotic workplace design were summarized into six systematic steps, as shown in Figure 1. These steps form a structured methodology rooted in empirical practices and address key challenges [45] in layout planning and robotic integration.

Figure 1.
Six steps of workstation layout planning: component design, material flow analysis, work point determination, robot positioning, reach test, trajectory design, and final simulation to verify the optimal layout.
The first step focuses on the conceptual layout of components, where relationships between activities are analyzed using tools such as the relationship chart and from–to chart. This step assesses material flow and determines the spatial requirements for processes, machines, and equipment.
The second step, defining work points, involves developing a relationship diagram to establish the proximity of and interconnections between components. This is followed by preparing a space diagram to serve as a foundation for alternative layout designs.
The third step emphasizes semi-automatic robot positioning, in which the initial placement of components is carried out to evaluate their influence on workstation functionality. Simulation tools, such as smart place, are used to refine the positioning of components and enhance efficiency in alternative layouts.
The fourth step, the reachability testing of objects, ensures that the robot can access all necessary work points. Any required modifications to the robot’s position are made to achieve optimal reachability and performance.
In the fifth step, trajectory design, robot movement trajectories are created based on the optimized layout and positioning. The focus is on reducing time and energy usage while maintaining precision.
Finally, the sixth step involves simulations and final layout selection, in which simulations are performed to validate the trajectories and proposed layouts. The process concludes with finalizing the most efficient layout and implementing it in the workspace.
While this six-step methodology provides a robust framework for layout design, it does not sufficiently address critical factors such as energy efficiency and ergonomics. To meet modern demands for sustainable production systems, the methodology must be extended with advanced analyses of robot positioning, motion trajectories, and energy consumption. This study highlights the importance of adapting traditional steps to align with contemporary requirements for energy efficient and flexible robotic systems.
2.2.3. Current Research on Layout Optimization and Their Methodologies
The design of robotic systems requires iterative work by experts, which is time-consuming but essential for accuracy and innovation.
Mata and Tubaileh [46] investigated the deployment of single-robot workstations, while Lueth [45] developed automatic layout planning for 3D layout optimization with collision-free trajectories without simulations, minimizing costs and increasing productivity. This system optimizes the positioning of robotic components against tasks and plans.
Fang and Zhang [47] proposed a solution for a collaboration between CAD and CAR software, in which reference objects such as points and coordinate systems enable the conversion of CAD designs into CAR software, such as ABB’s RobotStudio 5.61.
Cycle time is a key productivity indicator that needs to be optimized by design. Han and Cook [48] addressed the placement of the robot base in the CNC machine room, while Nelson and Donath [49] focused on optimizing robot motions and singularities in the workspace. Izui et al. [50] proposed a method to optimize cell layout using sequence pair representation.
Robotic cell layout development involves requirements analysis, environment design, and simulation configurations, combining theoretical knowledge with practical investigations. Research focuses on the use of advanced algorithms, machine learning, and optimization techniques, with an emphasis on productivity, flexibility, and energy efficiency [50,51]. This paper proposes a novel multi-objective layout optimization method for the conceptual design of robot cellular manufacturing systems, which can simultaneously determine the positions of manufacturing components as well as task scheduling [52].
2.3. Theoretical Basis of Energy Consumption
The robot’s energy requirement depends on the position of the base, the trajectory of the movement, and the tasks to be performed [53]. Theoretical models make it possible to analyze these relationships and identify opportunities for optimization, thereby reducing the energy intensity. The integration of energy efficiency into cycle time optimization is crucial, especially in manufacturing plants with high energy consumption, supporting the development of methodologies for more sustainable robotic systems [54,55,56,57].
Initially, an energy consumption model for the robot is established, taking into account its operational parameters. The fundamental equation describing this model can be expressed in Equation (8) as follows [58]:
where E is represented as the total energy consumption, Pi is defined as the power input during the ith phase of the operation, and Ti is defined as the duration of the ith phase.
Considering the characteristics of energy optimization and the potential for energy savings, the aim is to determine an energy efficient trajectory along a defined tool path while accounting for geometric, process, and joint drive constraints. The trajectory planning problem along the specified path can be formulated (9) as follows [59]:
where EΣ is the total energy consumption of the real trajectory. For articulated robots, the energy consumption can be analyzed by considering the torques and angular velocities of individual joints. The instantaneous power P(t) at a given time t can be expressed in Formula (10) as follows [53]:
where n is the number of joints, τi(t) is the torque at joint i at time t, and ωi(t) is the angular velocity at joint i at time t. In general, the energy consumption of a robot is calculated by extending its power usage over the operational period. This involves integrating instantaneous power consumption over time, considering the robot’s dynamic parameters, such as velocity, acceleration, and applied torques, along with external factors like payload and trajectory constraints. The comprehensive calculation can be expressed as Equation (11) as follows [60]:
where ωj(t) is the angular velocity of the j-joint at time t, τj(t) is the torque of the j-joint at time t, τm(t) is the torque of a motor of the j-joint at time t, Rj is the electrical resistance of a motor of the j-joint, and kj is the torque constant of a motor of the j-joint. The power consumed in each joint is calculated, and then the total power consumption is calculated by adding all of the joints’ power consumptions.
2.4. Methods for Measuring and Optimizing Energy Consumption
Optimizing the energy consumption of industrial robots is essential for achieving sustainable production and reducing operating costs [61,62,63,64]. This process involves adapting the robot trajectories, improving the work weight placement, and implementing intelligent control algorithms that use advanced simulation tools such as MATLAB R2014b, Simulink R2015a, or ABB RobotStudio 5.61 [65]. These tools allow for a detailed analysis of the impact of the base position, trajectories, and dynamic parameters on the overall robot performance, thus identifying the most efficient configurations.
Simulations allow for theoretical solutions to be verified and practical configurations to be developed, which are then tested under real conditions by monitoring the energy consumption [61]. Differences between simulations and reality may be due to wear, external factors, or model inaccuracies, which highlights the need for an iterative approach [66].
Energy efficiency is influenced by many factors, including the design of the arm, its range of motion, and its ability to manipulate various objects. Heavier arms require more energy, while optimizing the position of the base reduces the length of the movements and therefore the power consumption. The momentum and the moment of inertia are critical for understanding how speed and direction changes affect energy requirements [67].
2.5. Motivation
The need to reduce energy consumption and enhance the efficiency of industrial production processes underscores the importance of this study. Traditional robotic layout design methodologies often address layout optimization, trajectory planning, or energy efficiency in isolation, lacking a cohesive framework that integrates these aspects. Simulations and digital twins have advanced iterative design processes, but they fall short in fully addressing the interplay among robot positioning, motion trajectories, and energy consumption. This gap highlights the need for a systematic methodology that incorporates energy consumption as a fundamental factor in robotic workstation design.
To address these challenges, this study develops a comprehensive methodology that integrates robotic workstation layout optimization with a focus on energy consumption and time efficiency. By analyzing the relationships among robot layout, motion trajectories, and energy consumption, the proposed framework ensures efficient resource utilization while maintaining productivity. A key research question drives this effort: What is the relationship between the position of the base of an industrial robot, its trajectory, and its energy requirements, and how can this relationship be exploited in the design of efficient robotic workplaces?
The methodology expands on traditional practices by introducing a dedicated step for energy efficiency and enhancing all six steps of robotic layout design with practical considerations. It emphasizes optimizing robotic base positions to minimize unnecessary movements, optimize device placement, and reduce energy losses. Strategic positioning eliminates delays and allows for future adjustments without compromising efficiency, promoting sustainability and cost-effectiveness.
3. Optimizing the Position of Robotic Bases to Improve the Energy Efficiency
Before developing the proposed methodology for optimizing robotic workstation layouts, it was essential to conduct a foundational study to understand the impact of the robot base position on energy consumption. This preliminary research aimed to analyze how the relative position of the robot’s base in relation to its trajectory affects energy efficiency. Building on our earlier work [68], which focused on measuring the energy consumption of industrial robots, this study served as a critical step in identifying key factors influencing energy consumption and establishing the groundwork for the methodology presented in this paper.
3.1. Study Description
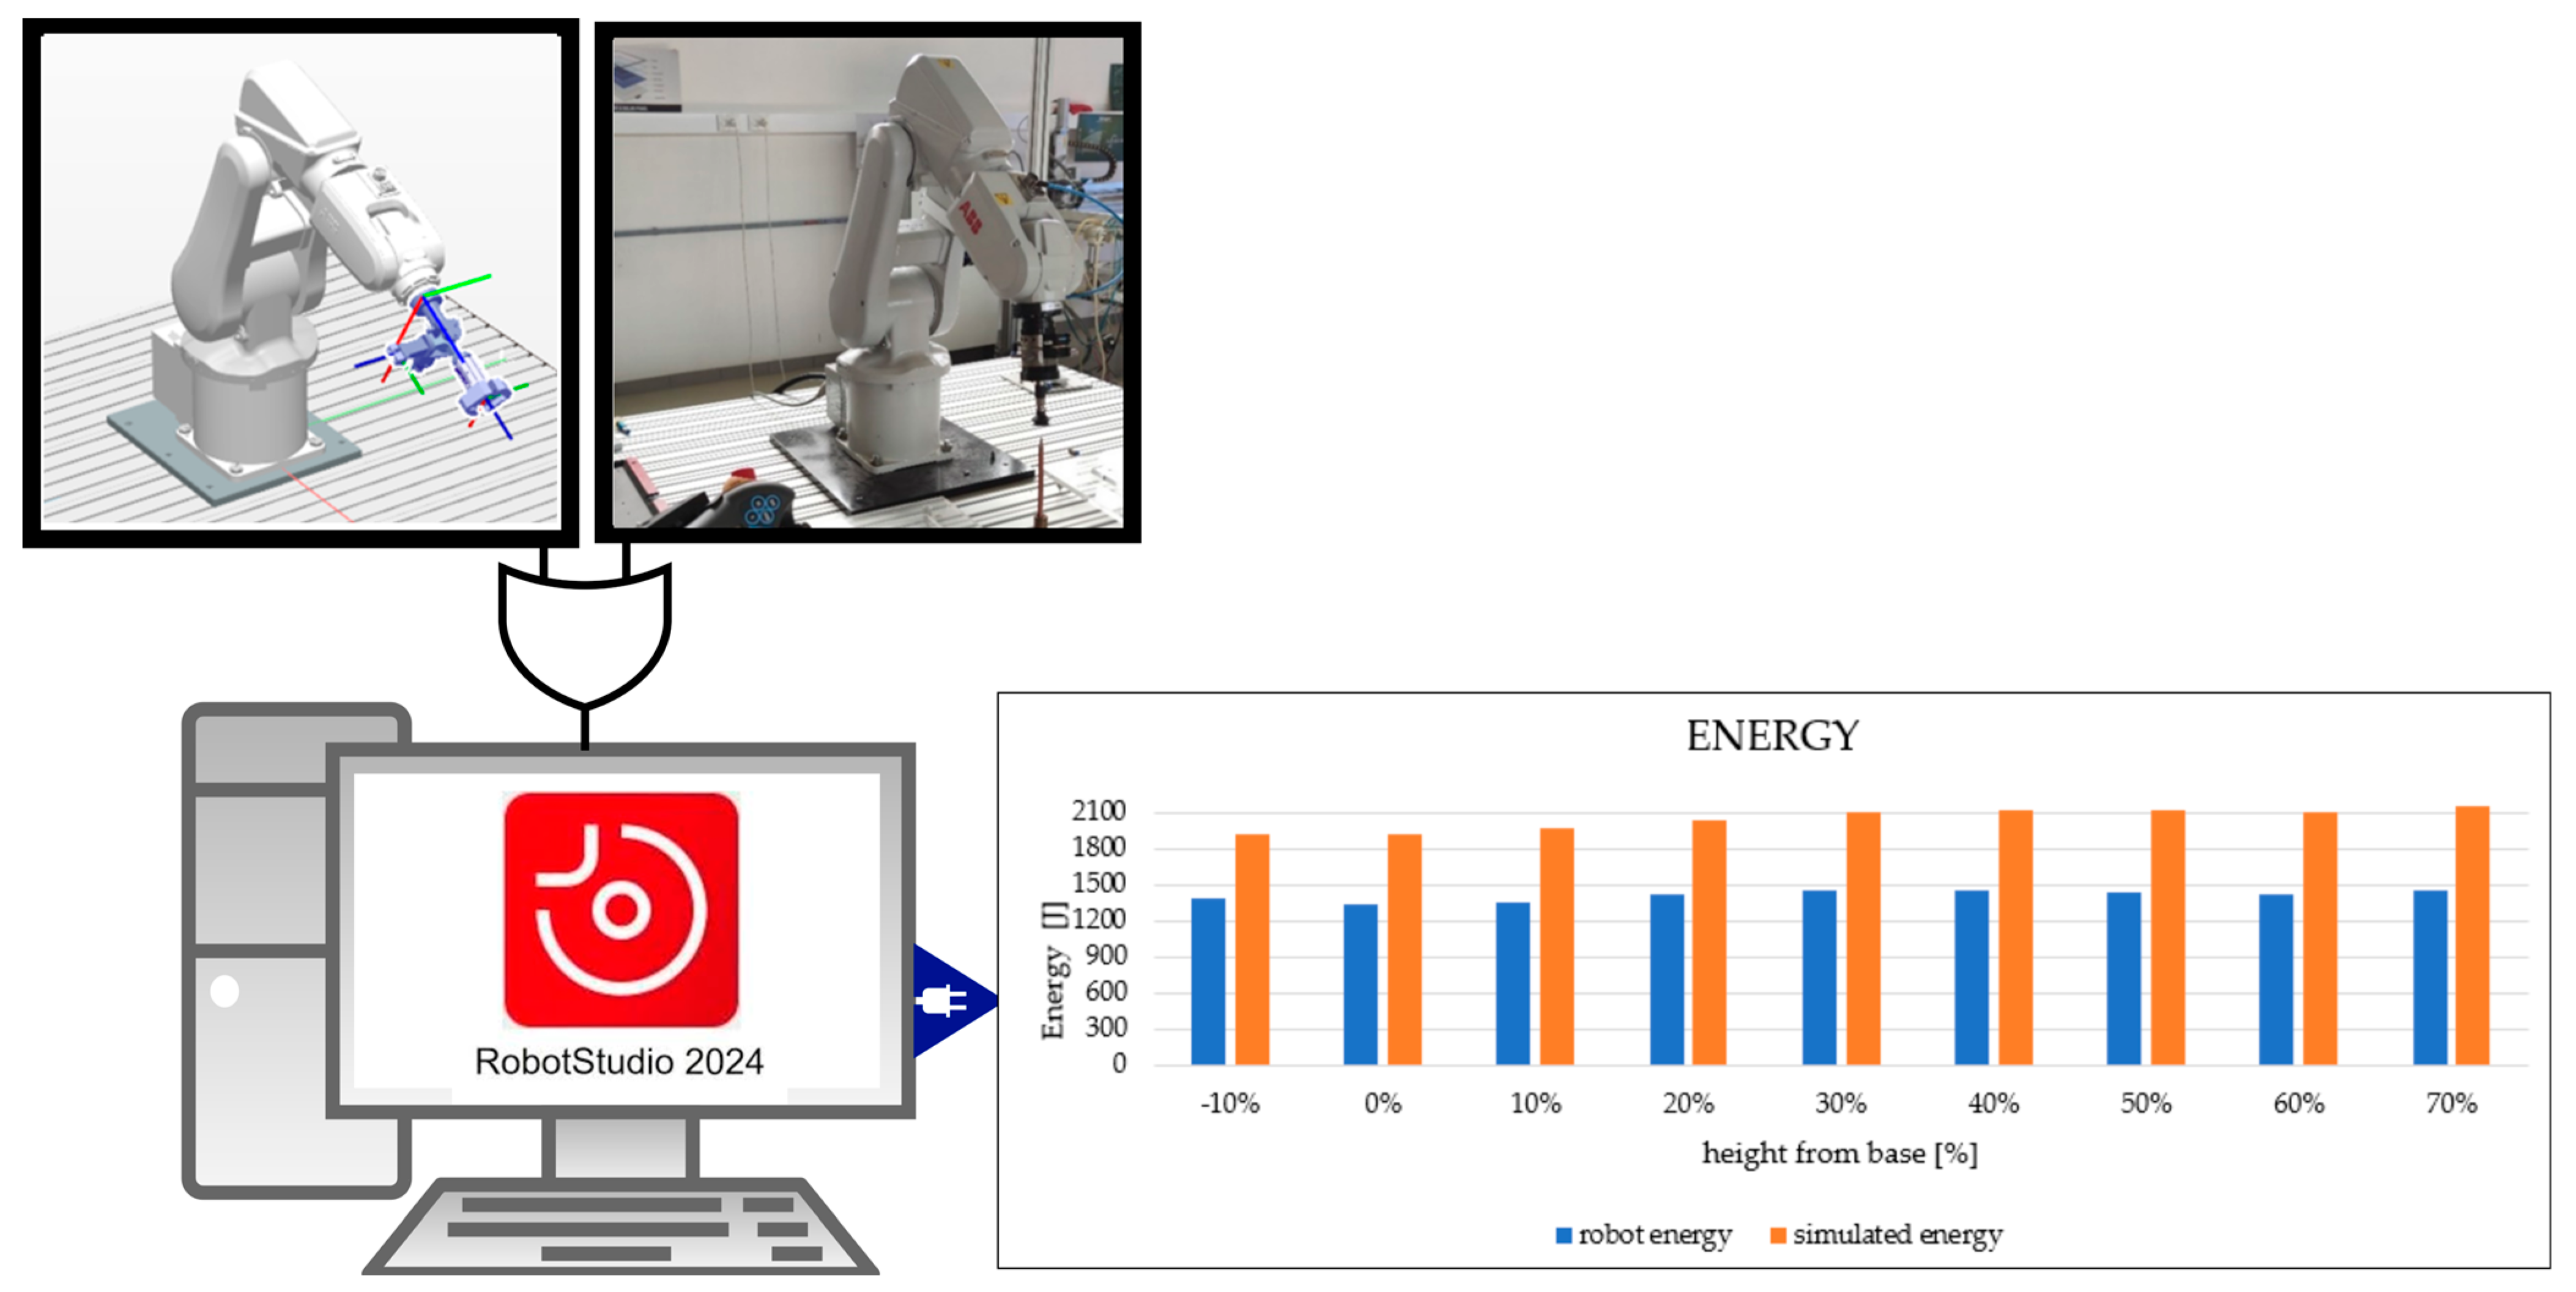
Qualitative methods combining simulation and experimental models were used during the study. The initiation phase involved verifying the accuracy of the simulated values by comparing the measurements with those obtained on an ABB IRB 120 industrial robot (ABB, Zurich, Switzerland) in the ABB RobotStudio 2024.1.1 environment. This comparison provides important information about the reliability of the methodology used, as shown in Figure 2.

Figure 2.
Workflow for comparing energy consumption of a simulated and real ABB IRB 120 robot using ABB RobotStudio 2024.1.1. The chart highlights the impact of robot base positioning on energy efficiency, comparing measured energy values (blue bars) and simulated energy values (orange bars) to analyze discrepancies and trends in energy consumption at varying heights from the robot base.
Subsequently, the study was extended to a wider sample of six-axis industrial robots of similar designs to investigate the effect of the base position on energy efficiency. For this purpose, standardized parametric trajectories were used to ensure consistent energy and time consumption measurements.
The acquired data were analyzed to identify the optimal position of the robot base while minimizing the energy consumption and maintaining efficiency. The results showed that the position of the robot’s base has a key impact on its energy efficiency, allowing for the design of workstations that are not only more efficient but also more environmentally friendly.
In this study, parametric trajectories were used to test the robot performance according to the specified operations and trajectories, including pick-and-place operations. These trajectories were loaded into the robot controllers and included the robot motions at different ranges and heights, allowing for accurate measurements of the robot’s baseline energy efficiency under simulated conditions.
A key aspect of the simulations was the total motor energy analysis, which represented the cumulative energy consumption of the motors during operation. This figure is essential for assessing the energy efficiency of the robots and allowing for the optimization of their operational settings to minimize energy consumption.
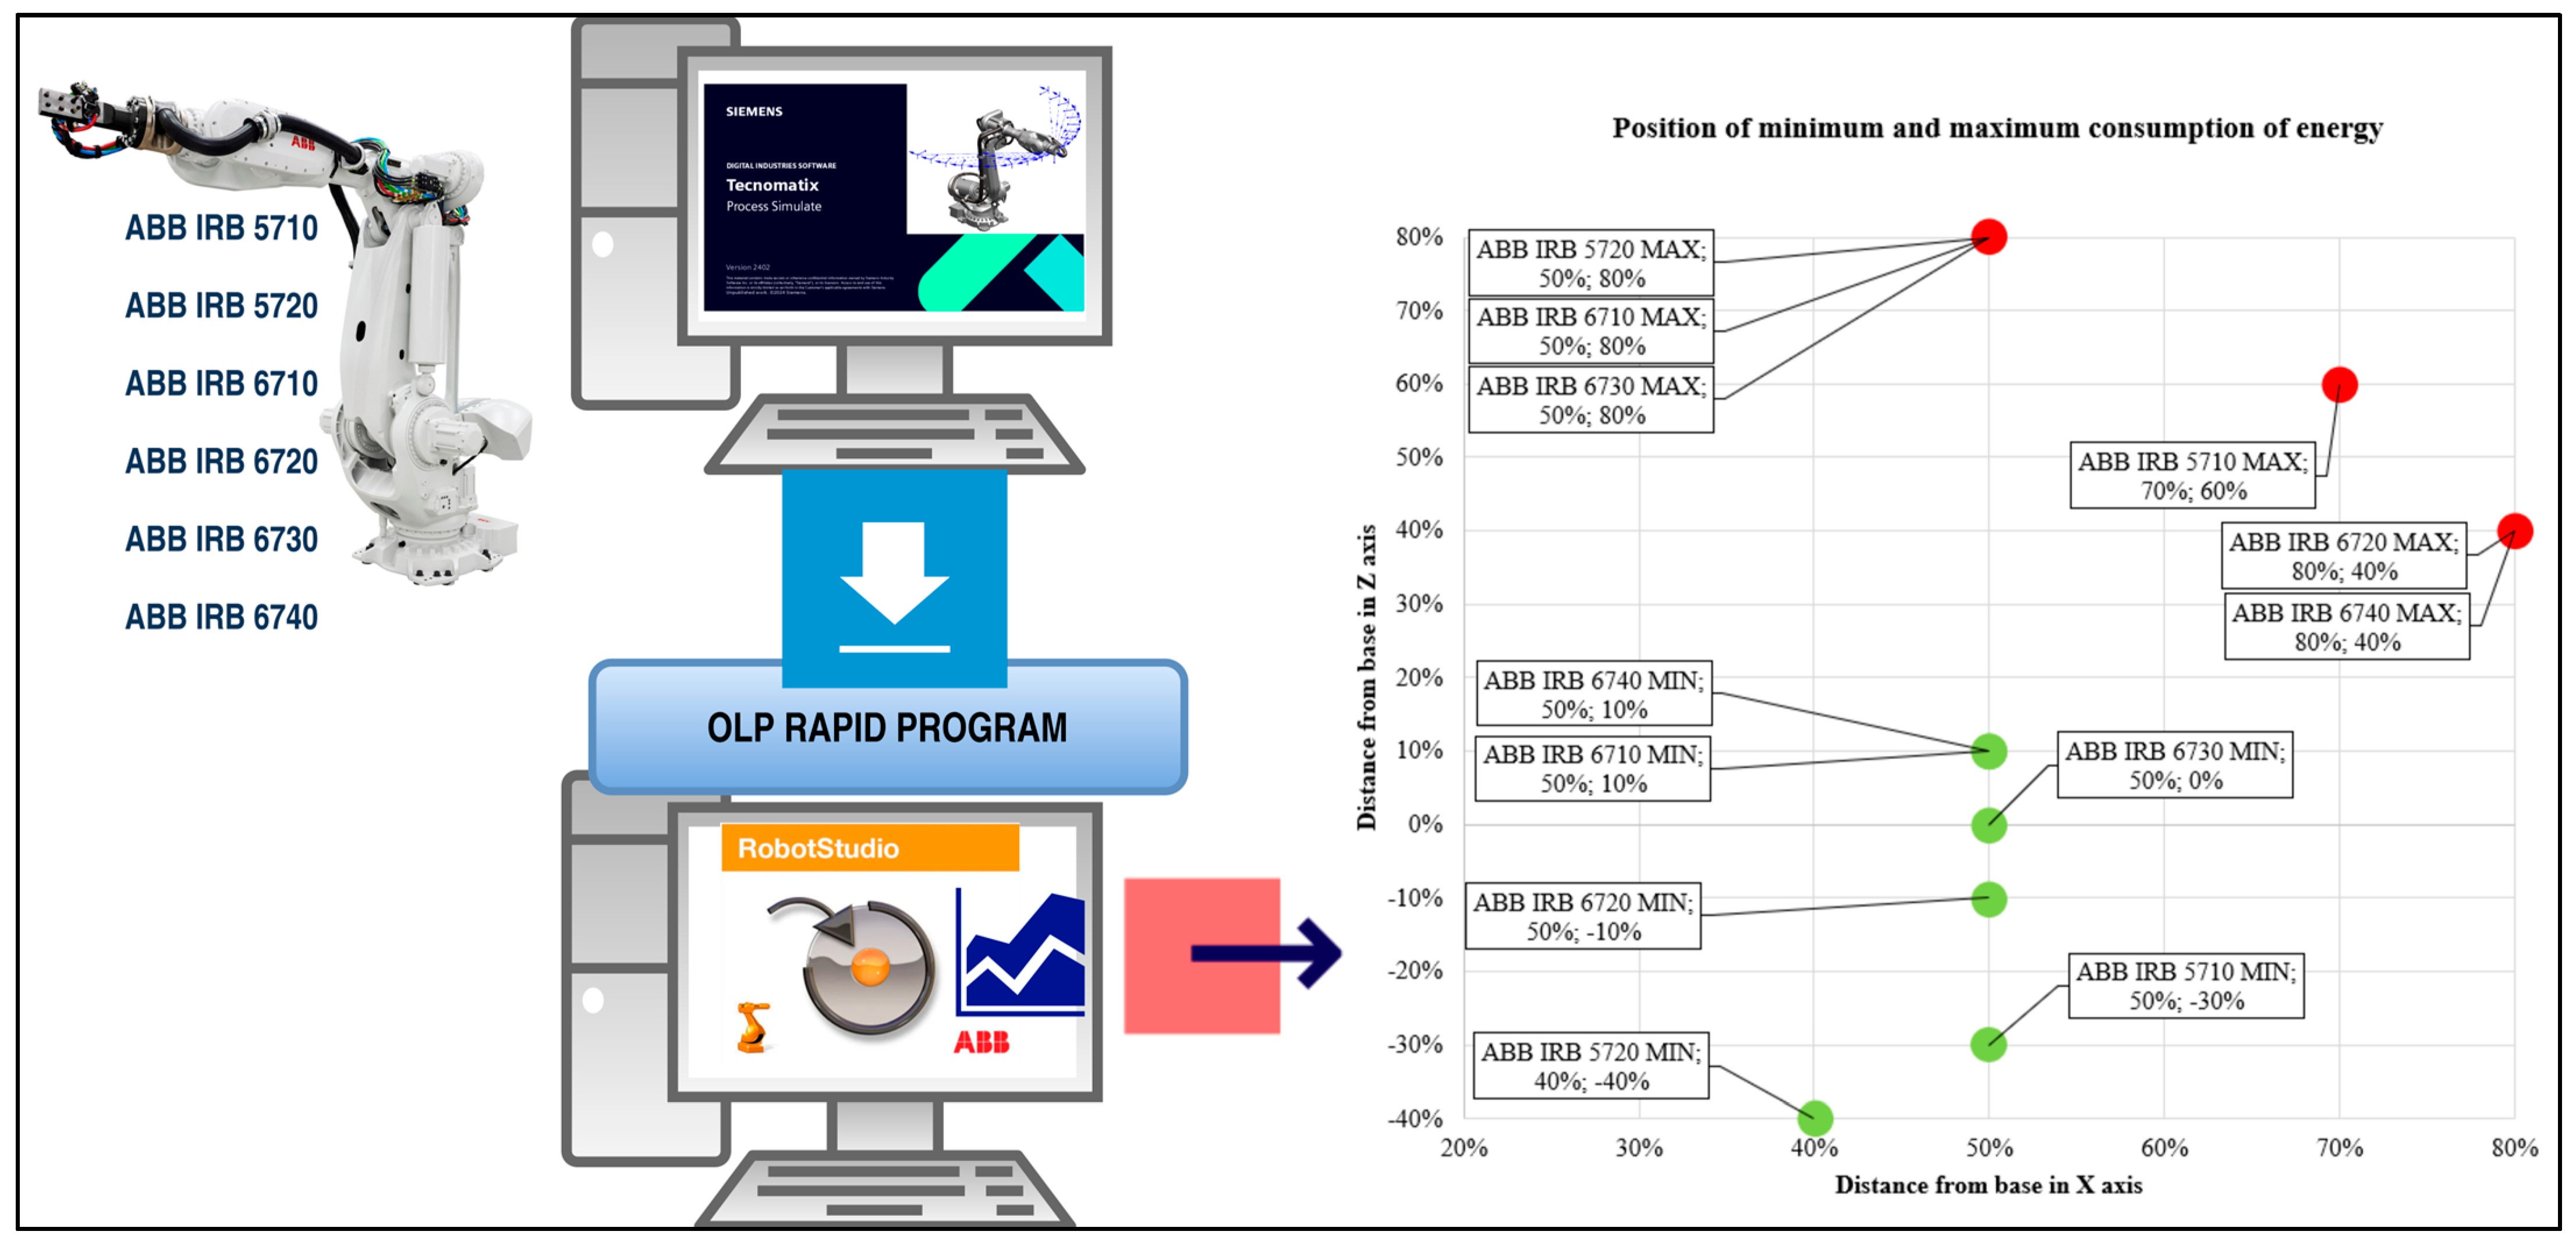
The results of our study confirmed that positioning the tool center point (TCP) near the center of the robot’s workspace leads to lower energy consumption than positions closer to the base or at the maximum range. This effect was consistent for robots of a similar design, suggesting that the optimal TCP position at approximately 50% of the robot’s range is the most energy efficient.
A total of 274 trajectories were tested, with 173 satisfying the required constraints, indicating that the ideal working distance along the x-axis is approximately 50% of the robot’s maximum range. This position also optimizes the energy consumption; lowering the z-axis decreases the energy consumption but increases the time, whereas increasing the height decreases the time but increases the energy requirements, as shown in Figure 3.
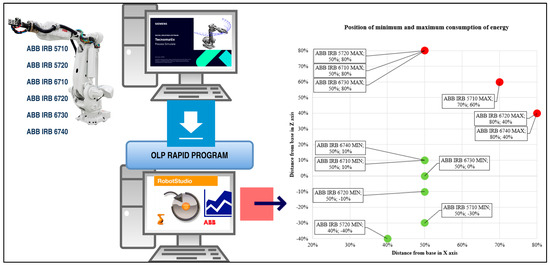
Figure 3.
Methodology for measuring energy consumption of ABB robots. A universal parametric trajectory was created in Siemens Tecnomatix Process Simulate 2402 and simulated for selected robot types. Subsequently, an offline robotic program (OLP) was generated, which was uploaded to ABB RobotStudio 2024.1.1 as a RAPID program for each robot type. In RobotStudio, the energy consumption was measured during the simulation. The measured data was exported to Excel, where it was analyzed and visualized in graphs to evaluate the energy consumption based on the robot base positioning.
These findings suggest that the robot design characteristics, such as the balancing mechanisms and weight distribution, significantly affect the energy efficiency. The practical applications of these results require consideration of these factors when designing robotic workstations to optimize energy use in industrial applications.
Based on the collected data, a detailed analysis was performed to identify the optimal position of the robot base to minimize energy consumption while considering the time efficiency. These analyses revealed that the position of the robot base has a critical impact on its energy consumption; therefore, it is possible to design workstations that are not only more efficient but also more environmentally friendly.
3.2. Electrical Power Measurement for a Selected Sample of Industrial Robots
Table 1, Table 2, Table 3, Table 4, Table 5 and Table 6 summarize the power consumption values when performing the parametric trajectory at different altitudes and distances. The limitations of the robot design prevented the execution of some trajectories, as indicated by the crosses in the tables. Of the original 274 trajectories, the number of suitable trajectories was reduced to 173 due to the limits of the rotation of the joints usable in practice. Trajectories exceeding the 5% rotation limit are indicated in black, and the energy consumption is illustrated by a color-coded scale ranging from the lowest (green) to the highest (red) value measured in Wh.

Table 1.
Measured power consumption of ABB IRB 5710 in Wh. The letter x indicates positions where measurements were not possible because the robot could not reach some points of the trajectory.
Table 2.
Measured power consumption of ABB IRB 5720 in Wh. The letter x indicates positions where measurements were not possible because the robot could not reach some points of the trajectory.
Table 3.
Measured power consumption of ABB IRB 6710 in Wh. The letter x indicates positions where measurements were not possible because the robot could not reach some points of the trajectory.
Table 4.
Measured power consumption of ABB IRB 6720 in Wh. The letter x indicates positions where measurements were not possible because the robot could not reach some points of the trajectory.
Table 5.
Measured power consumption of ABB IRB 6730 in Wh. The letter x indicates positions where measurements were not possible because the robot could not reach some points of the trajectory.
Table 6.
Measured power consumption of ABB IRB 6740 in Wh. The letter x indicates positions where measurements were not possible because the robot could not reach some points of the trajectory.
Table 1 summarizes the power consumption of the ABB IRB 5710 robot. Of the 44 measurements, 15 were unusable because the joint rotation limits were exceeded. The working position with the lowest power consumption (20.46 Wh) was at X 50% and Z 30% because the lowest value of 18.83 Wh exceeded the limits. The highest consumption of 33.44 Wh was measured at X 70% and Z 60%, revealing a 38.9% difference between the highest and lowest values.
Table 2 shows the power consumption data of the ABB IRB 5720 robot, which performed trajectories in 59 different positions. Of these 19 measurements, 19 were invalid because they exceeded the limits. The lowest valid power consumption value (19.26 Wh) was measured at X = 40% and Z = 40% coordinates. The highest valid value (35.16 Wh) was observed at X 50% and Z 80%. These values show a difference of 15.90 Wh, representing a 45.2% variability between the lowest and highest levels of consumption.
Table 3 shows the power consumption of the ABB IRB 6710 robot. Due to design constraints, the model could not operate below its base level, allowing it to perform only 41 trajectories, 20 of which exceeded the specified limits. The lowest consumption (22.47 Wh) was recorded at X 50% and Z 10% coordinates, whereas the highest consumption (34.69 Wh) was recorded at X 50% and Z 80%. This difference of 12.22 Wh indicates that the consumption variability between these two positions is 35.2%.
Table 4 presents the results of power consumption measurements of the ABB IRB 6720 robot, which was able to perform 50 trajectories, but 21 of them exceeded the specified limits. The lowest recorded power consumption value (19.20 Wh), which was, however, outside the allowed limits, was located at 20% of the distance and 80% of the height from the base. Thus, for practical purposes, 21.61 Wh at X coordinates of 50% and Z coordinates of −10% is considered the lowest consumption value. Similarly, the highest value (36.37 Wh) was recorded beyond the limit, and 32.00 Wh was recorded as the highest acceptable value at X 80% and Z 40% coordinates. This difference of 10.38 Wh represents a 32.5% difference in consumption between the lowest and highest acceptable values.
Table 5 shows the power consumption data of the ABB IRB 6730 robot, which could execute 44 trajectories, 20 of which did not pass the conditions set for exploitation. As with the other robots, the lowest (20.77 Wh) and highest (42.69 Wh) consumption levels were recorded in the limit-violating position. For practical use, the lowest acceptable consumption was 24.21 Wh at X 50% and Z 0% coordinates, whereas the highest acceptable consumption was 36.42 Wh at X 50% and Z 80% coordinates. This difference, amounting to 12.21 Wh, represents a 33.5% variability in consumption between the two positions.
Table 6 shows the measured power consumption values of the ABB IRB 6740 robot, in which 36 measurements were recorded, 17 of which exceeded the specified limits. The lowest (30.53 Wh) and highest (58.82 Wh) measured electrical consumption values fall into the category of violating the constraints. In the X 50% and Z 10% coordinates, the lowest acceptable energy consumption measured was 32.81 Wh, and in the X 80% and Z 40% positions, the highest acceptable consumption was found to be 49.00 Wh. The difference between these values, amounting to 16.20 Wh, represents approximately 33.1% of the variance in the energy requirements of the robot at these positions.
4. Systematic Methodology for Design/Layout of Robotic Systems
The introductory chapter provides an overview of existing practices and challenges in the design of robotic workplaces, highlighting the critical need for energy efficiency in modern manufacturing systems. Traditionally, a six-step process has been used to design robotic workstations. Although this process forms the basis of many methodologies, it does not explicitly consider energy consumption, which has become a critical factor in robot layout optimization. The absence of energy considerations limits the adaptability of traditional approaches to the requirements of sustainable and efficient manufacturing systems.
Based on these findings and addressing the shortcomings outlined in the introduction, the proposed methodology extends and refines the traditional six-step process to a seven-step framework. This framework is not merely an adaptation of existing methods, but incorporates original insights and empirical knowledge gained from practical experience in designing and optimizing robotic workstation deployments. The methodology systematically guides the process from conceptual layout planning to the final verification of the robotic system, integrating energy efficiency into each phase.
The methodology starts with a conceptual layout design that analyzes material flow and space requirements to ensure the efficient placement of components and peripherals. This is followed by defining the robot’s key operating points to guarantee availability and functionality. Using simulation tools, the optimal basic robot location is determined, ensuring that operational constraints are taken into account. Once the layout has been planned, the reachability of the robot to all work points is verified and adjustments are made to eliminate inefficiencies.
A distinctive feature of this methodology is the inclusion of a dedicated energy analysis step, which involves measuring and optimizing energy consumption based on the robot’s positioning and motion trajectories. The methodology further addresses trajectory optimization, ensuring that the motion trajectories are accurate, energy efficient, and capable of minimizing cycle times. Finally, the entire system is simulated to verify its effectiveness, detect potential collisions, and ensure the design complies with industry standards.
This methodology is characterized by the integration of empirical knowledge and practical experience gained from real robotic layout design projects. Each stage has been enriched with its own sub-steps that make this approach unique and adapted to current industrial needs. By addressing the limitations of traditional methods and focusing on energy efficiency, the methodology provides a comprehensive and adaptable framework for designing sustainable and efficient robotic workplaces.
The methodology consists of seven steps (Figure 4), which cover the entire process from the design of the workstation layout to the simulation and optimization of the robot trajectories and periphery placement (Appendix A). It includes optimizing the layout of components, verifying the reachability of work points, creating and testing trajectories, and simulating the entire system to detect collisions and optimize transition points. When problems such as reachability or collisions are identified, adjustments are made to the roles and positions of the robot and peripherals. The methodology also incorporates safety aspects and has been validated on ABB IRB 5710-6740 models, demonstrating its adaptability and practical effectiveness.
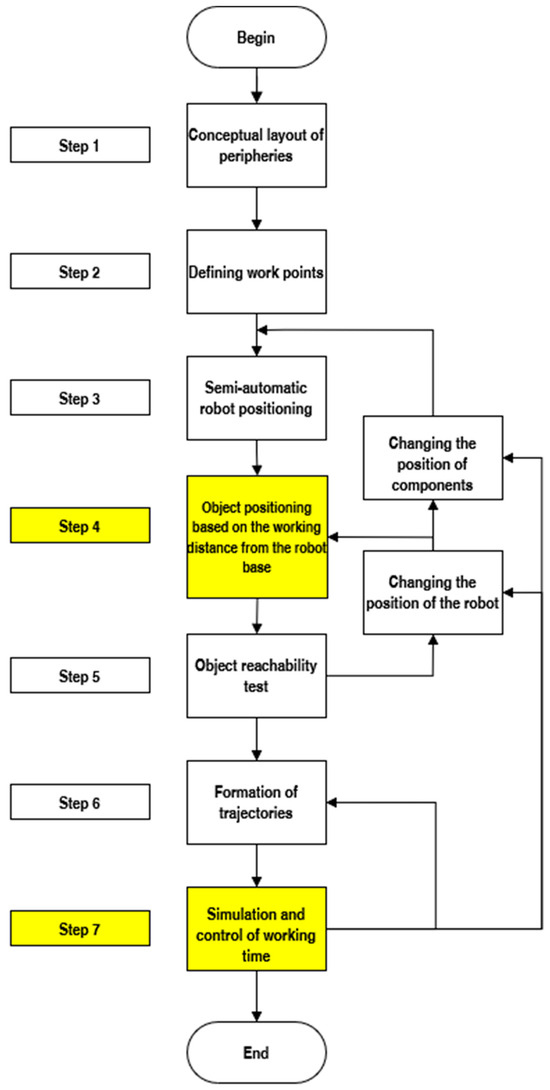
Figure 4.
The proposed seven-step methodology for robotic workplace design. Yellow-highlighted steps represent additions or modifications: Step 4 adjusts the layout to reduce robot energy consumption, while Step 7 simulates the entire workstation, including device movements, collision checks, and working time verification, ensuring optimal robot-peripheral positioning and safety compliance.
4.1. Initial Layout Design of the Station Components
The initial layout of the components in a robotic workplace refers to the first three steps of creating a robotic workplace (Figure 5). Thus, it is a conceptual layout of peripheral devices in which work points can be defined and the industrial robot positioned to them.
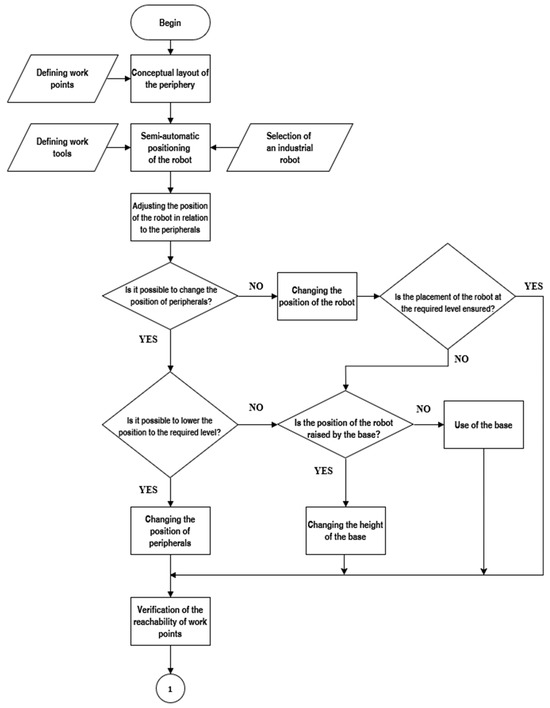
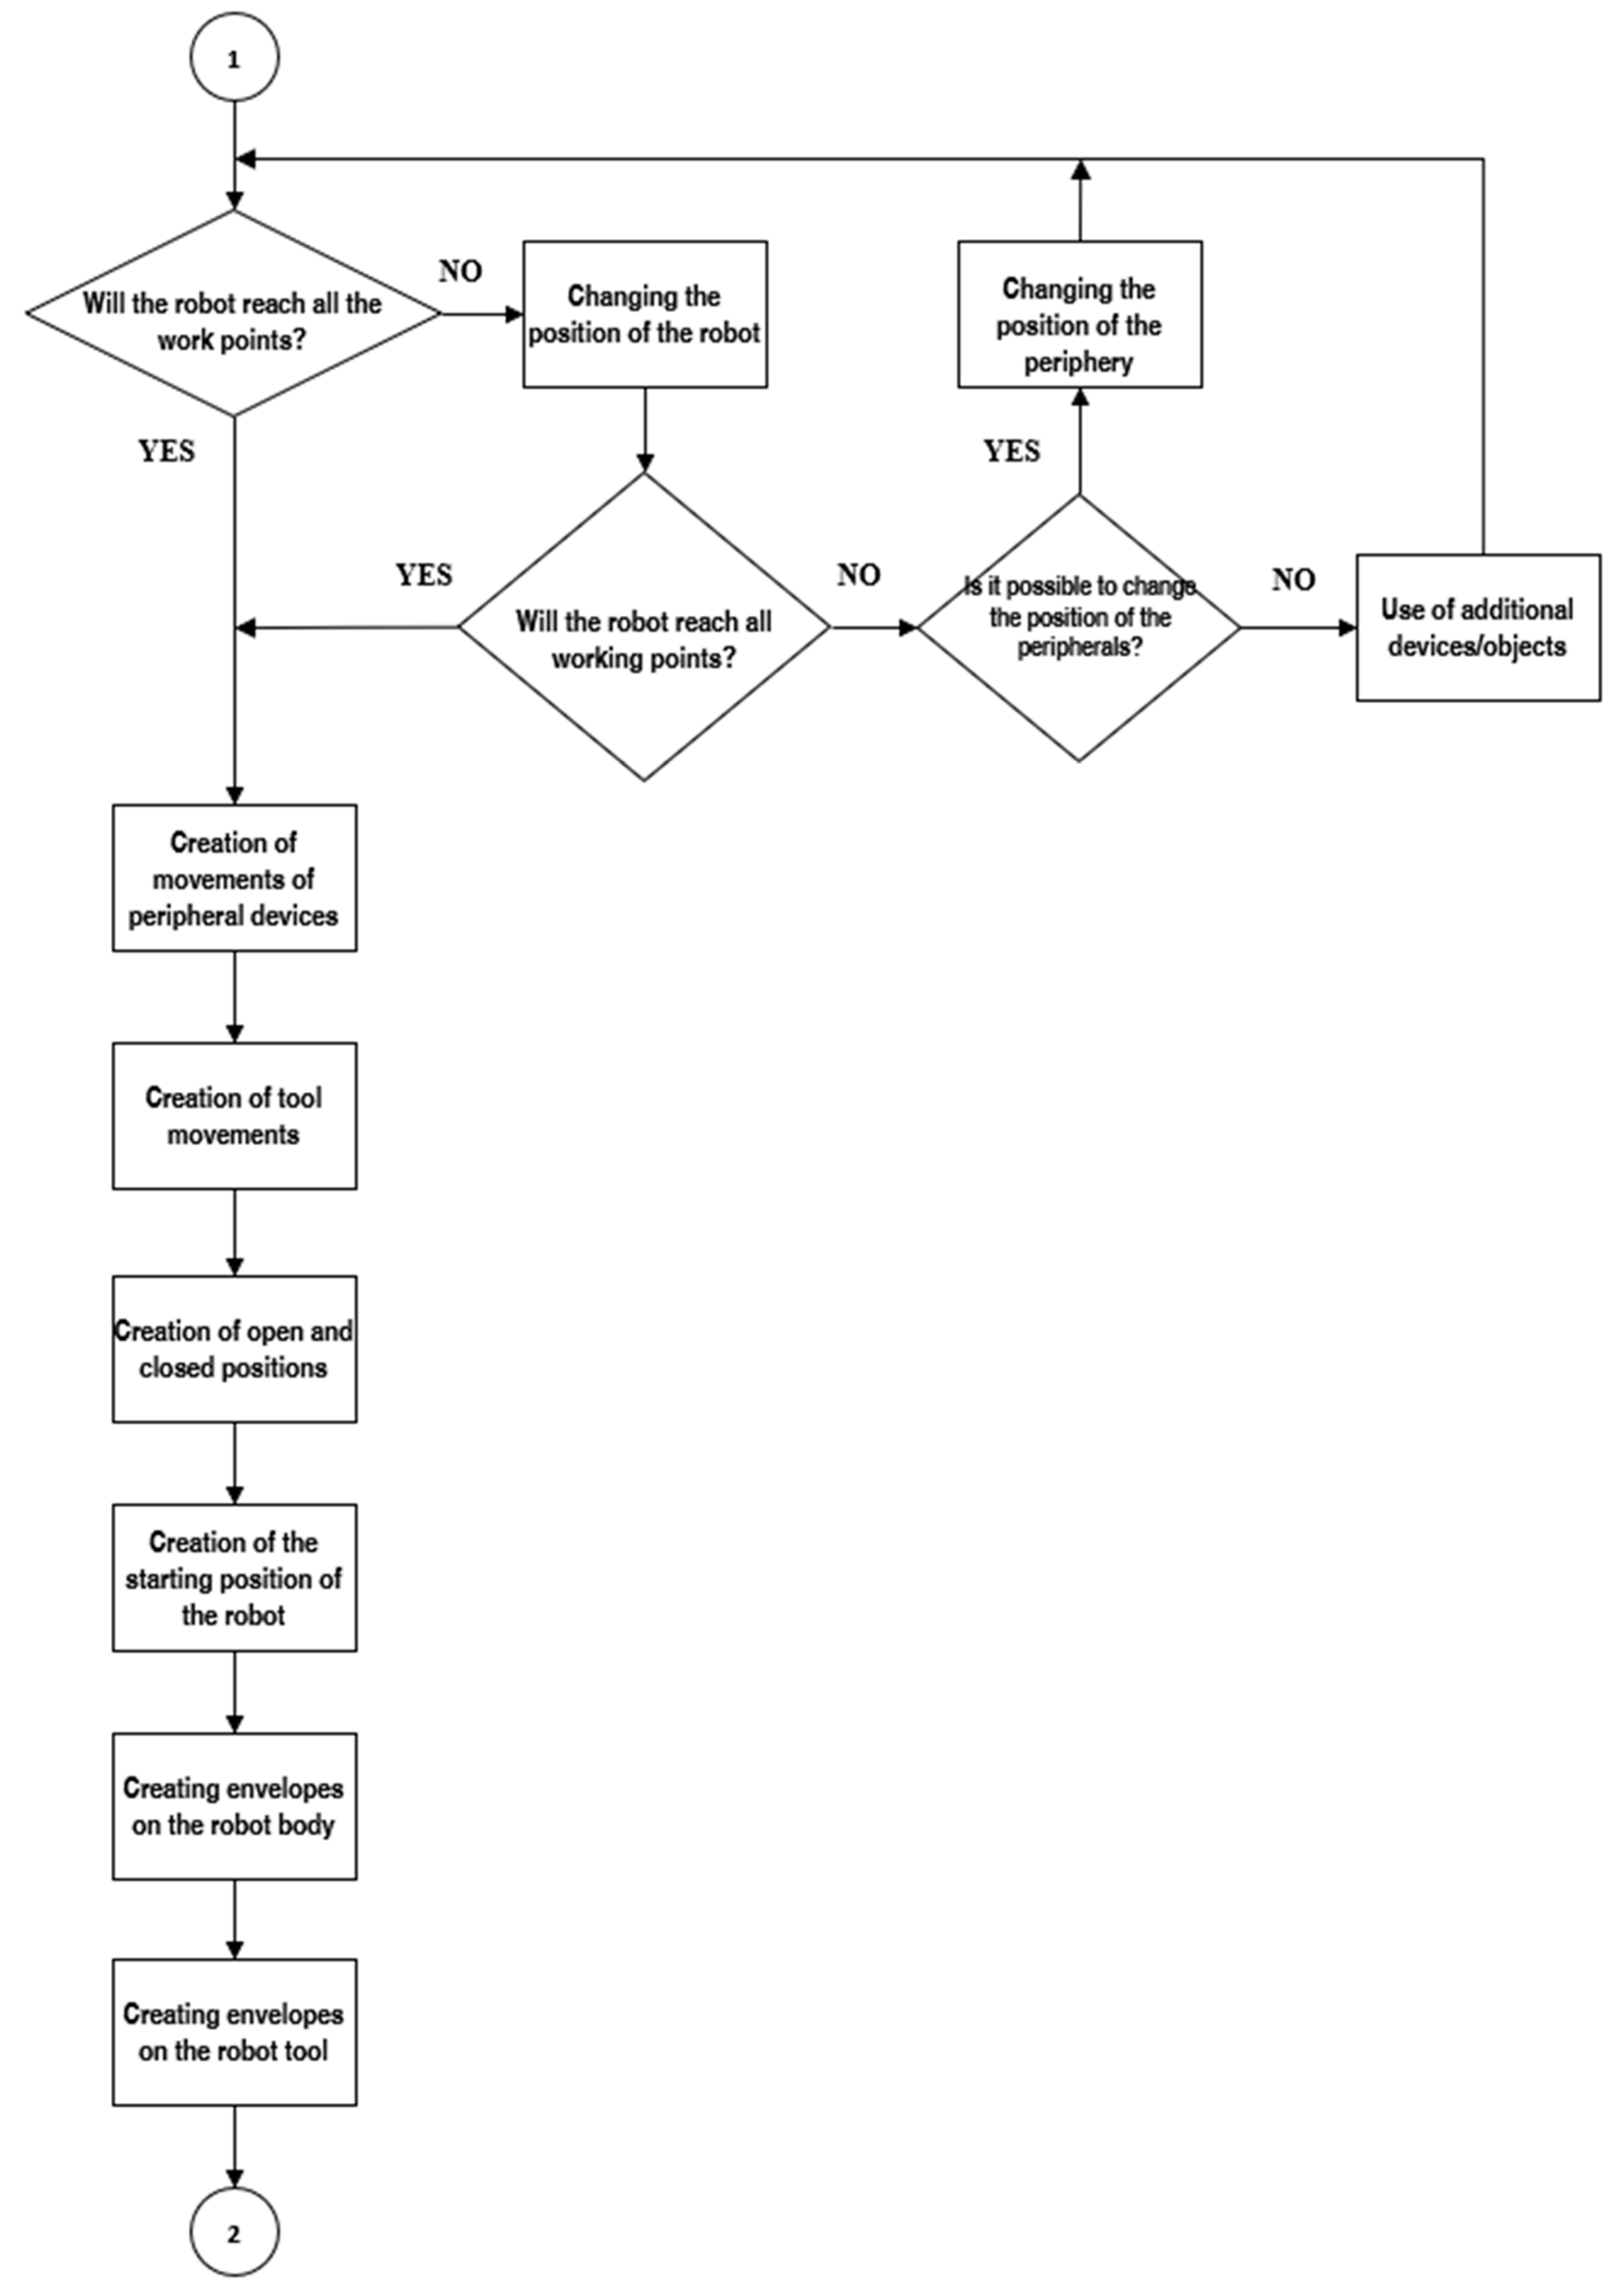
Figure 5.
Flowchart illustrating the initial stages of robotic workstation design, including defining work points, conceptual layout of peripherals, and semi-automatic robot positioning. The diagram also incorporates decision-making steps for adjusting the robot’s position, base height, and peripheral placement to ensure the reachability of all work points and alignment with operational requirements.
4.2. Positioning Based on Working Distance from the Robot Base
The conceptual layout of peripherals is determined by the size of the robotic workstation and the constraints that limit layout options. Peripheral work points vary by operation type; manipulation tasks involve pick-and-place points, while processes like welding or gluing require multiple points for execution.
After peripheral placement, the methodology defines the robot’s effector and uses modern tools for semiautomatic robot positioning, optimizing its placement based on work points. Correct robot and effector selection is essential, with handling tasks using a handling effector and process operations requiring specific tools, either on the robot’s axis or static peripherals (Figure 5).
As shown in Section 3, the energy consumption of industrial robots depends on the position of the working object relative to the robot base. Activities performed closer to the base and at lower heights significantly reduce energy consumption.
4.3. Verification of the Reachability of Work Points
If the position of the peripherals can be adjusted, they can be moved closer to the robot base, or their working height can be reduced. If the design of the peripherals does not allow for such adjustments, the height of the robot itself must be changed, for example by modifying its base (Figure 6).

Figure 6.
Flowchart detailing the decision-making process for verifying and adjusting the position of the robot and its peripherals. It includes steps for assessing reachability, compliance with task requirements, and ensuring proper alignment. Adjustments such as modifying the robot’s position, altering peripheral placement, or changing the base height are iteratively evaluated to meet operational constraints and improve efficiency.
After the components are deployed, the robot is tested to determine whether it could reach all the required working positions. If not, the position of the robot or peripherals is changed, and the constraints of the workplace may require the use of additional devices such as a seventh axis to move the robot or a base to raise its height. Extension flanges between the robot and tool can be used to achieve higher or aligned points.
4.4. Creating Device Movements and Defining Positions
To increase the complexity of the simulation, it is necessary to animate all the components with which the robot interacts, including the tool and peripheral components (Figure 6). The movements of the devices are crucial for verifying the collision-free state of the workstation, for example, when opening clamps or changing the angle of the welding pliers. Once the motions are defined, their positions are set. Simple devices have three basic positions (default, open, and closed), while more complex devices require more positions according to the movement scheme. Finally, the robot’s default position is set, which is also used in the program.
4.5. Creation of Safety Zones
Today’s robotic workplaces must consider operator safety, especially in situations where a human enters a shared space with a robot or moves near a robot. In these cases, safety zones are defined (Figure 7) that the robot must not cross. If a zone is violated, the robot is obligated to immediately stop or shut down.
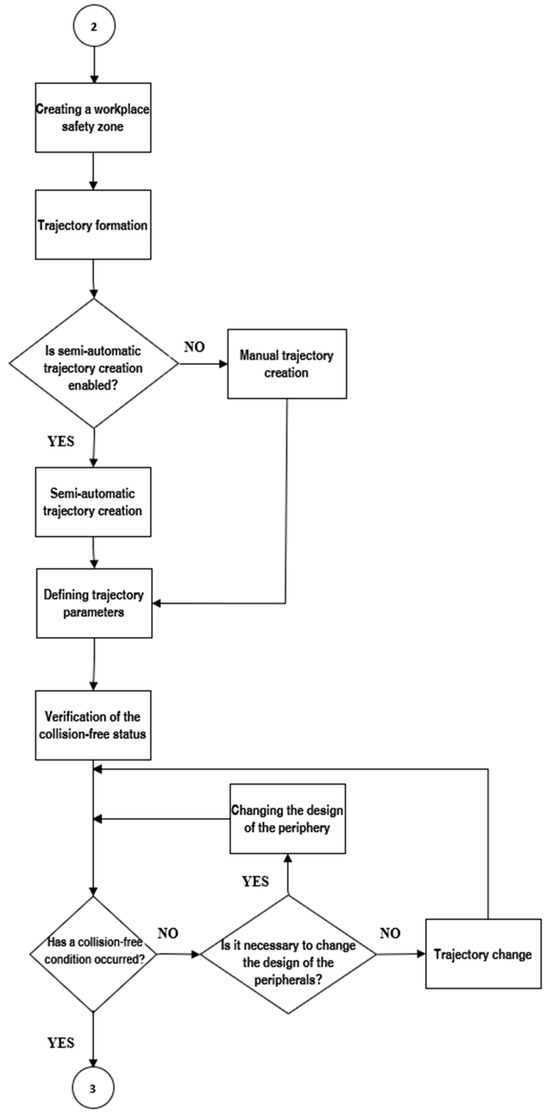
Figure 7.
Flowchart representing the process of creating a workplace safety zone, forming trajectories, and verifying collision-free conditions. It includes steps for creating manual or semi-automatic trajectories, defining trajectory parameters, and iteratively modifying trajectories or peripheral designs to resolve collisions and ensure safe operation.
4.6. Trajectory Generation
Once the components have been deployed, a safe working area is defined, the kinematics of the moving parts are established, and then trajectories are generated (Figure 7). A trajectory contains at least two points: a starting point and a process or traversal point. Process points are used for direct operations, such as welding and handling, while traversal points allow for safe movement between locations. Trajectories are created manually or semi-automatically using algorithms.
When creating trajectories manually, the programmer checks each point based on their experience, which is time-consuming. The semi-automatic trajectory generation process is accelerated using algorithms that create the remaining points based on the given start and end points and the TCP tool. Modern approaches focus on collision-free trajectory generation and energy reduction; however, not all software supports such technology.
After creating the trajectory, its parameters are defined. The motion command determines how the robot moves between points: a linear motion follows a straight line, a circular motion describes a circular arc, and PTP (point-to-point) motion allows the controller to optimize the trajectory for a smaller energy load and shorter time. PTP motions are not suitable for precise positioning or process points.
Other parameters include velocity (in mm/s), acceleration (in mm/s2), and a zone that defines the distance of the TCP as it approaches the trajectory point. Zone 0 (in the case of the RAPID programming language) indicates an accuracy of 0.3 mm, and higher zone values provide a smoother motion and shorter trajectory times. The tool data and work object parameters specify the position of the tool endpoint, its center of gravity, and the position of the work object relative to the robot base to which the trajectory work points are linked.
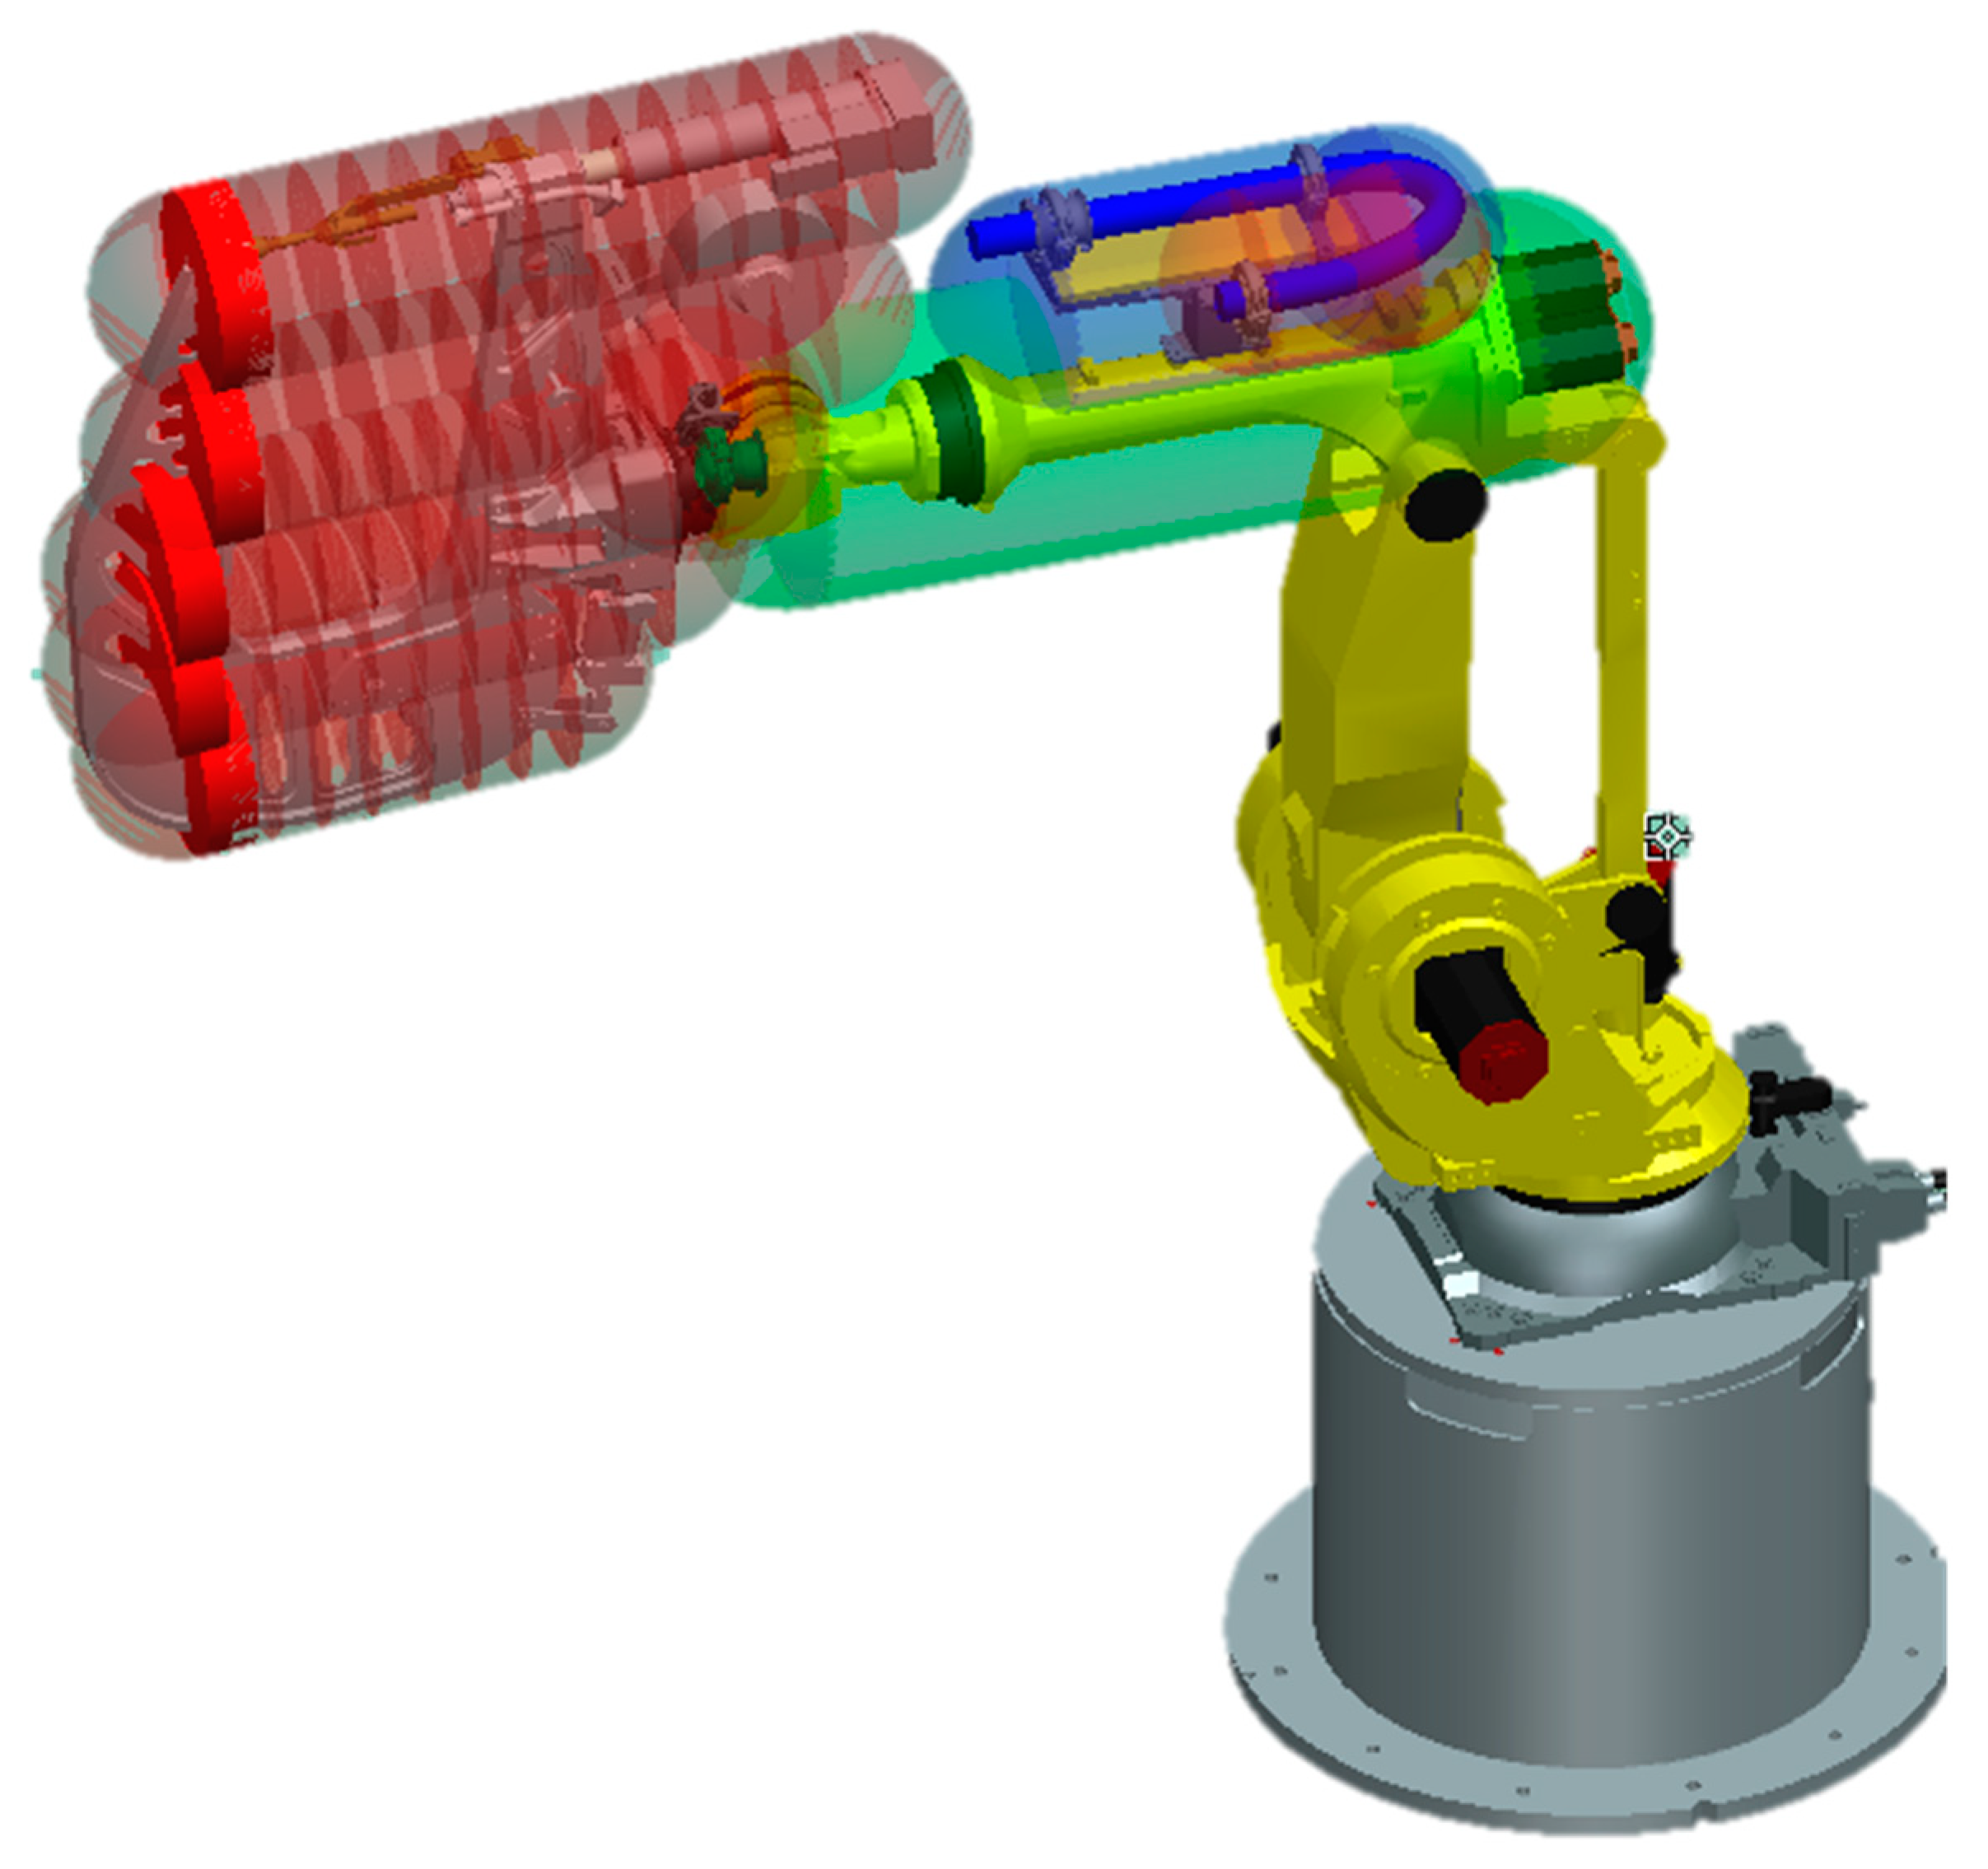
The first step is to create safety envelopes (Figure 8) on the moving parts of the robot and its tool, which define the area of possible interference with the environment. The envelopes on the third and fifth axes are spherical, while those on the fourth axis and the tool are capsule-shaped. The robot and the tool may cannot extend beyond these envelopes.

Figure 8.
Security envelopes of the industrial robot, illustrating the safe operating zones and motion ranges of the robot’s arm to ensure collision-free operation and adherence to safety standards.
The next step is to define safety zones in the workplace that provide safe spaces for robot movement without endangering people. These zones, created at a distance of at least 200 mm from the fence, protect the operator from being hit, even if the operator puts his or her fingers over the fence. The braking distance of the robot, which depends on its speed and the weight of the loaded load, must also be considered.
4.7. Verification of Collision-Free Status
The collision-free state is a key requirement in the design of trajectories for industrial robots (Figure 9). Collisions are prevented by software control that uses collision sets. These sets divide the objects on the job site into two groups: the first consists of the controlled objects, such as the industrial robot, its tool, and the manipulated object; the second consists of all potential obstacles, such as peripheries, fences, poles, and jigs.

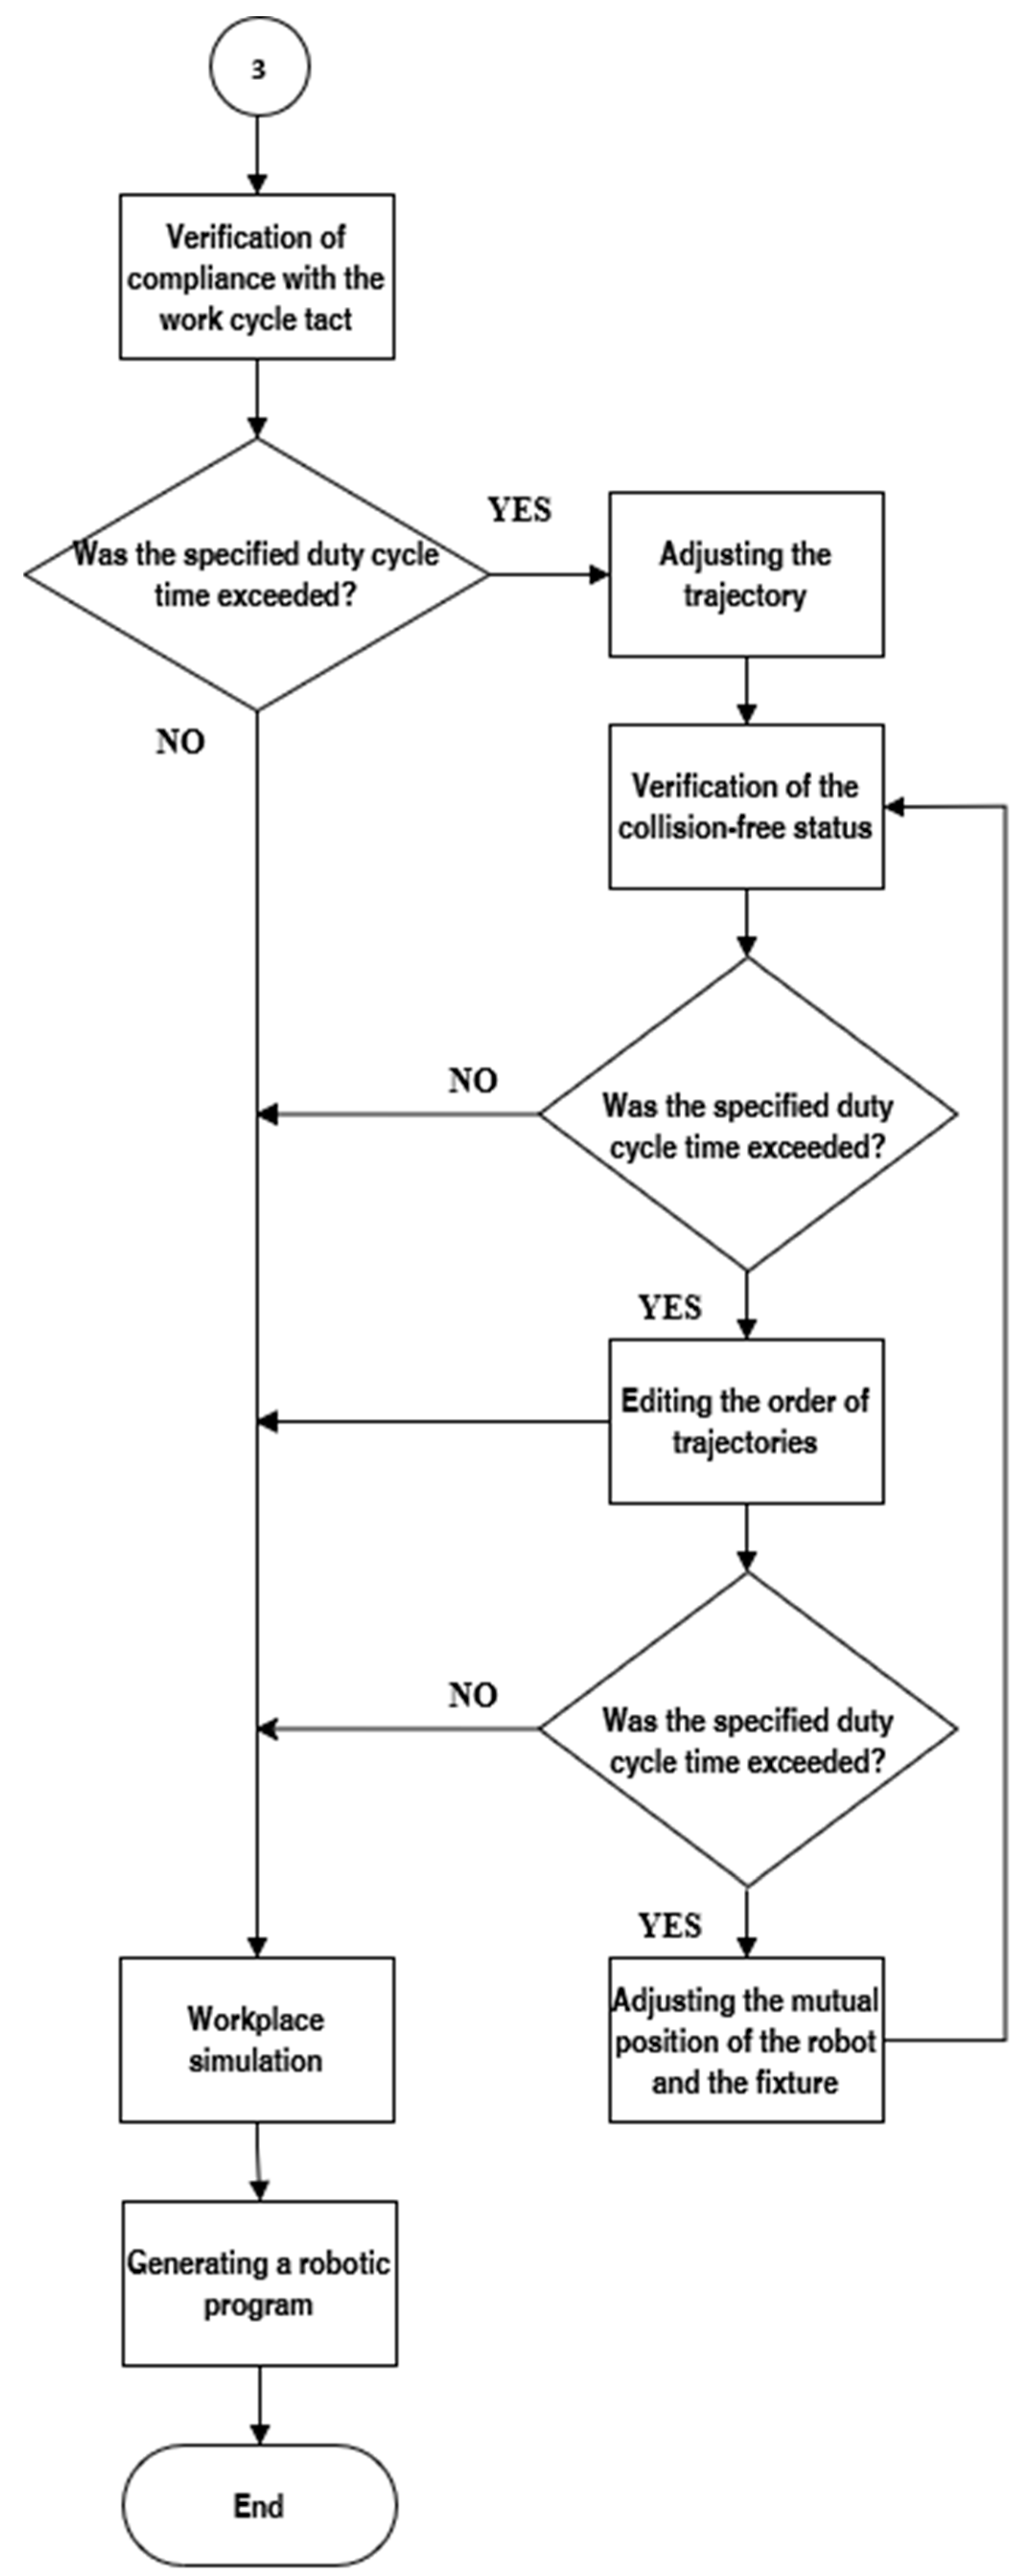
Figure 9.
Flowchart depicting the final stages of robotic workstation design, including verification of compliance with the work cycle tact, trajectory adjustments, and collision-free status verification. Iterative steps for editing trajectory order and adjusting the mutual position of the robot and fixture are performed if the specified duty cycle time is exceeded. The process concludes with workplace simulation and robotic program generation.
The position for the removal or insertion of the parts was checked, as well as the movements of the centering pins and clamps and the opening of the welding pliers. The software also verifies that the tool does not meet the robot body or its attachments. When objects from different groups come into contact, collisions are indicated in red. Collisions are resolved by adjusting the trajectory or making design changes to the tools or fixtures. The collision-free status is verified.
4.8. Verification of Adherence to the Duty Cycle Tact
The last step of the proposed methodology (Figure 9) is to verify that the work tact is followed. If the duty cycle time is satisfactory, no changes are required. If the limit is exceeded, the clock can be reduced by modifying the trajectories, reducing the number of points, and changing the order of the trajectories or the position of the robot relative to the peripheries. The measurements in Section 3 show that the robot works faster when it is higher and closer to the base axis.
5. Case Study from Automotive Industry
An experimental model of a welding station used in the automotive industry was used to demonstrate the different energy and time consumptions of industrial robots depending on their working height. This welding station was designed according to a commonly used methodology in practice and thus two main conditions had to be met: adherence to the specified working time and reachability to all work points.
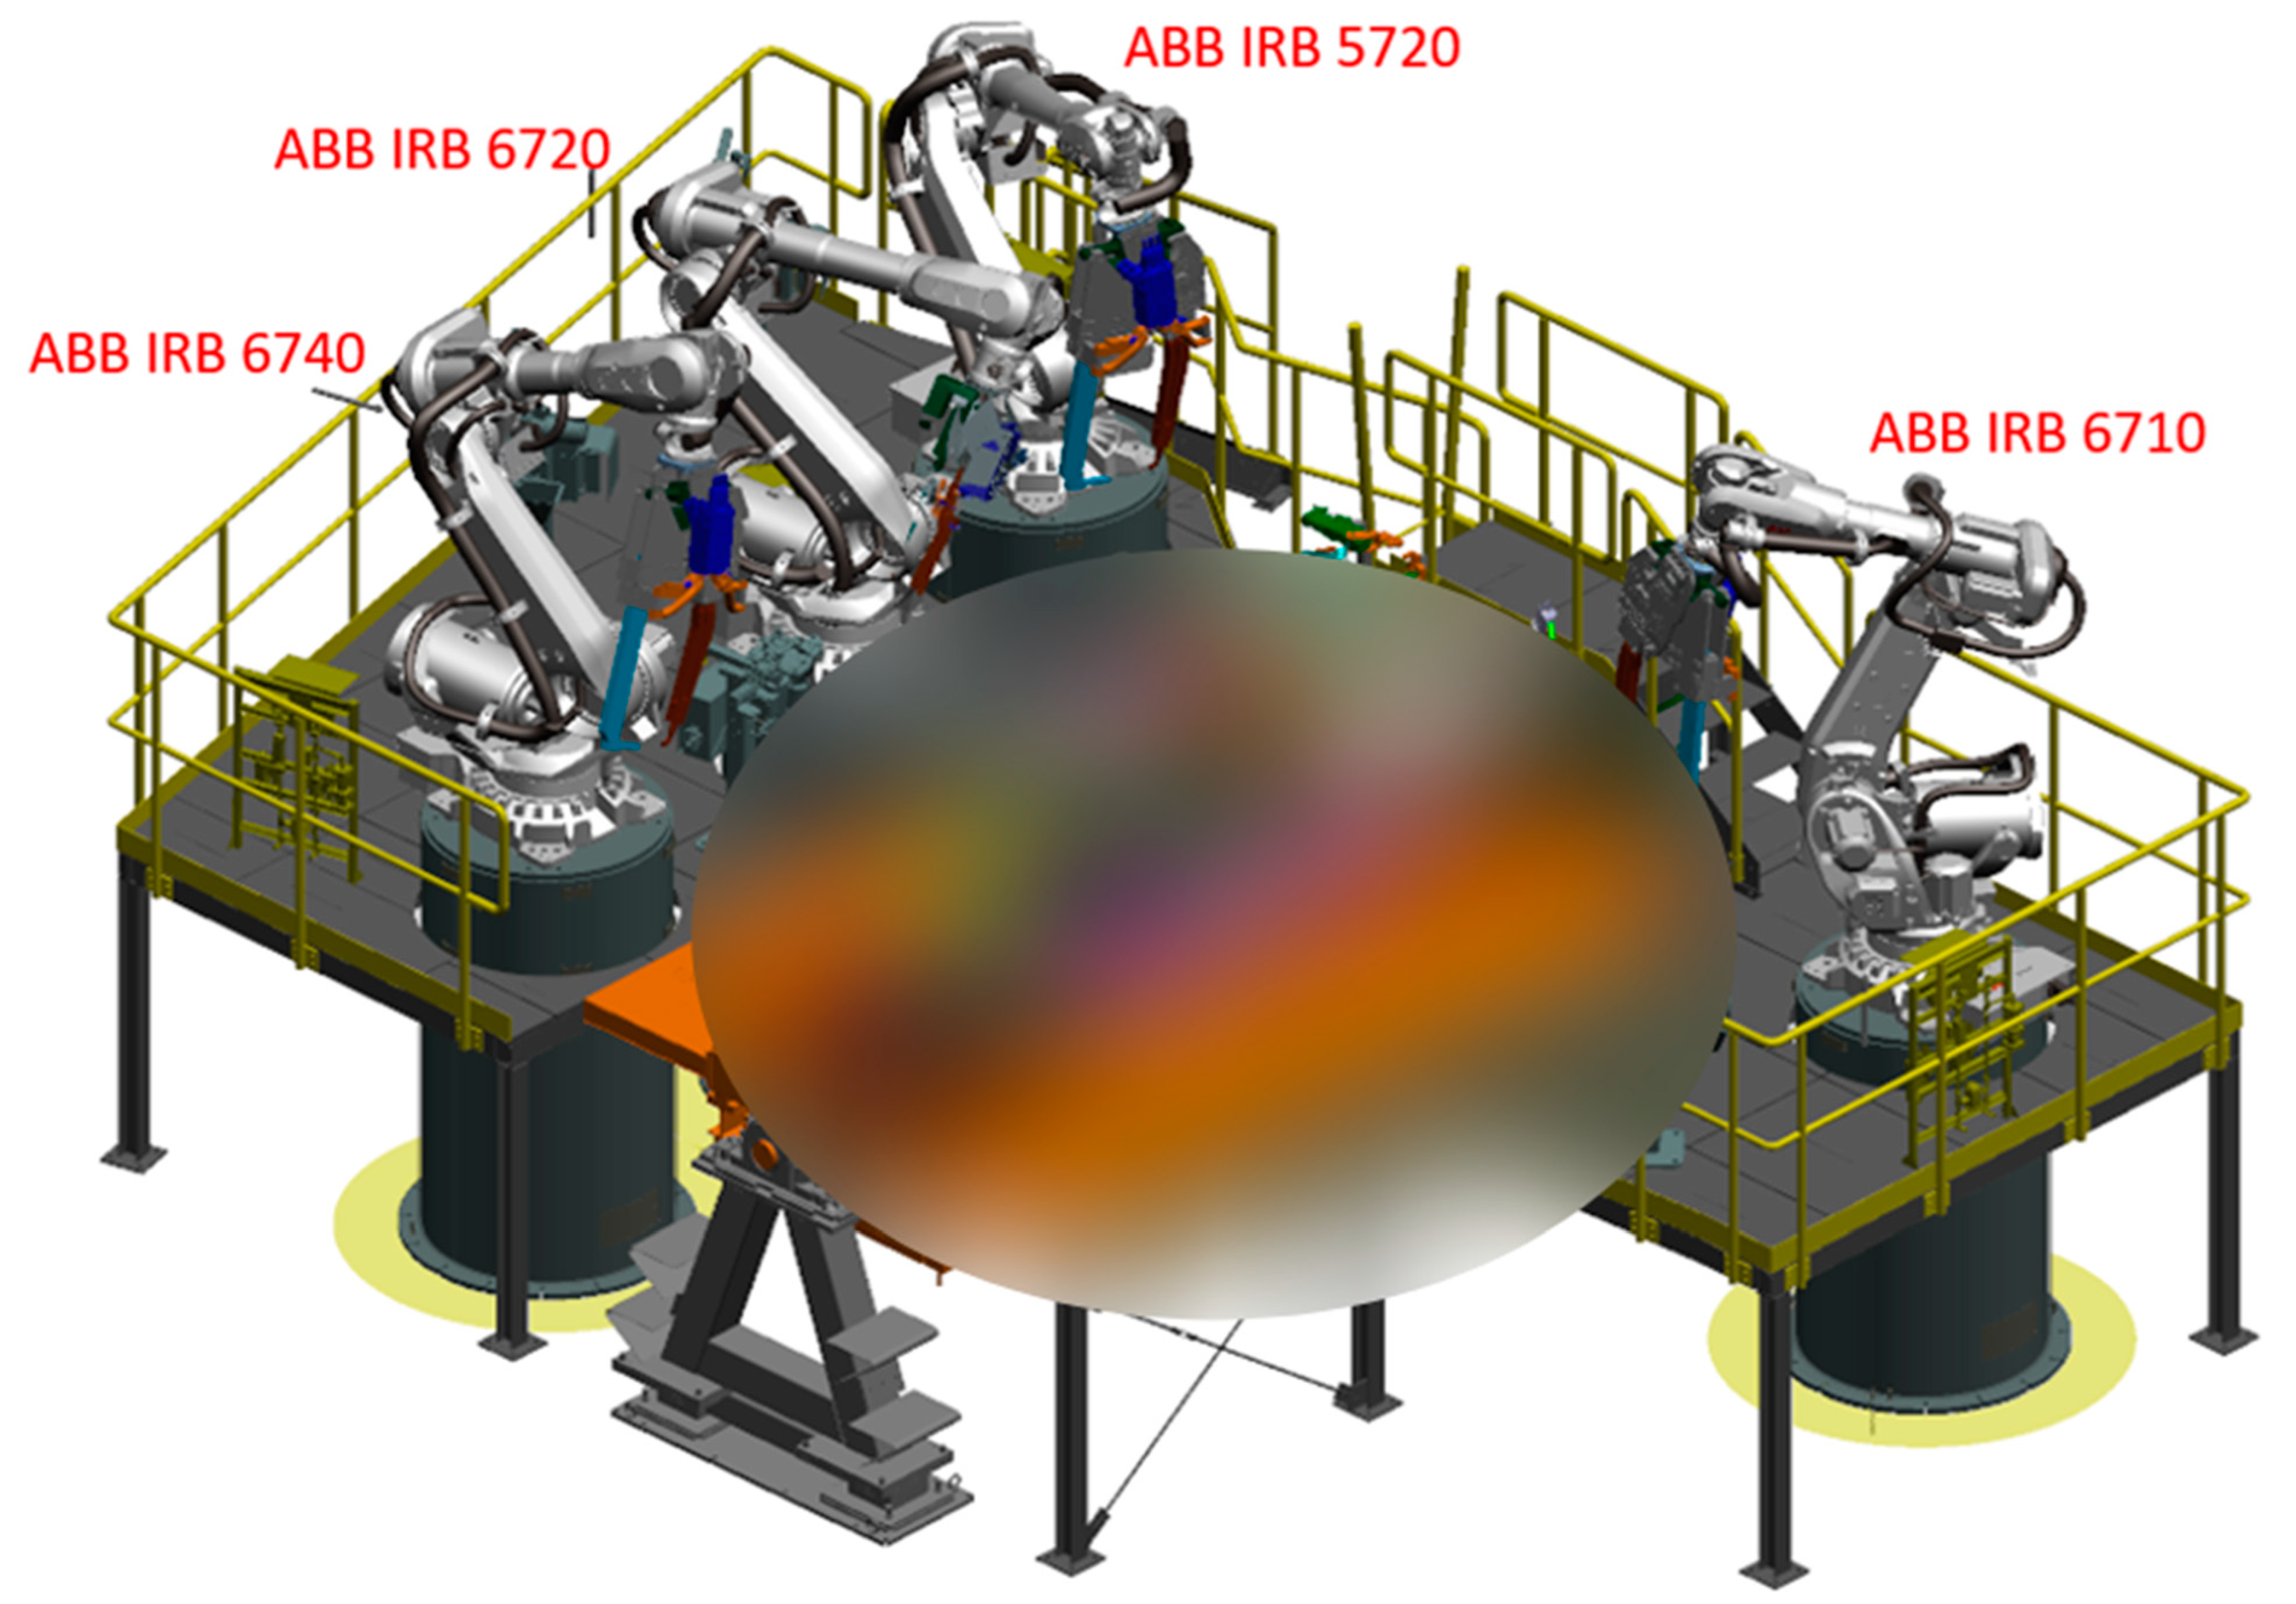
The work points in this case are located on the side of the car, which is positioned in the center of the workstation on a turntable. Four industrial robots (ABB IRB 6740, ABB IRB 6720, ABB IRB 5720, and ABB IRB 6710; ABB, Zurich, Switzerland) were located around the turntable and used welding pliers as tools. Furthermore, the workstation has an elevated platform on which additional equipment such as welding pliers can be placed. The platform is also used by service technicians. The remaining parts of the workstation were hidden to improve visibility.
The initial model of the experimental site (Figure 10) can be considered as a starting point for the following comparison. The original trajectories are also part of this workstation and can be used to determine the working range of single-unit robots along the x- and z-axes.
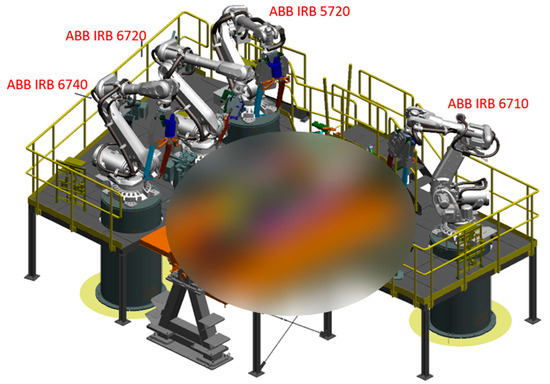
Figure 10.
The original experimental workplace model; blurring is due to protection.
The ABB IRB 6740 robot operates from 25% to 65.8% of its maximum x-axis range. The working range in the z-axis is 36.8% to 56.5% of its maximum range from the robot base. To perform this trajectory, this robot consumed 8.7739 Wh.
The ABB IRB 6720 and 5720 industrial robots have a similar working range. The working range of the ABB IRB 6720 industrial robot in the x-axis is 26.9% to 83.2% of its maximum reach, and in the z-axis, it is 26.9% to 46.9% of the maximum reachable height from the base. The power consumption in this case was 7.5665 Wh.
The ABB IRB 5720 industrial robot has an operating range of 26.1% to 75.2% in the x-axis and 26.1% to 56.1% in the z-axis. Its measured power consumption was 8.7216 Wh.
The last industrial robot, ABB IRB 6710, is the robot with the largest working range among the selected ones. Its x-axis working range is 35.3% to 80% and its z-axis working range is from 5.3% to 80% of its maximum range. The measured energy consumption for a given operation is 8.835 J.
Given that the proposed robotic workstation layout methodology deals with the initial layout design of the components in a robotic workstation, it was challenging to apply the proposed changes to an existing workstation. For this reason, changing the x-axis position of the industrial robots was not possible and the changes were only applied by changing the z-axis position of the industrial robots.
However, the changes were not only related to the position of the industrial robots themselves, but also their trajectory had to be partially modified by changing the initial position. This was adjusted so that the robot did not exceed its axis limits and did not create an obstacle for the rotary table tool during the fixture change by rotating.
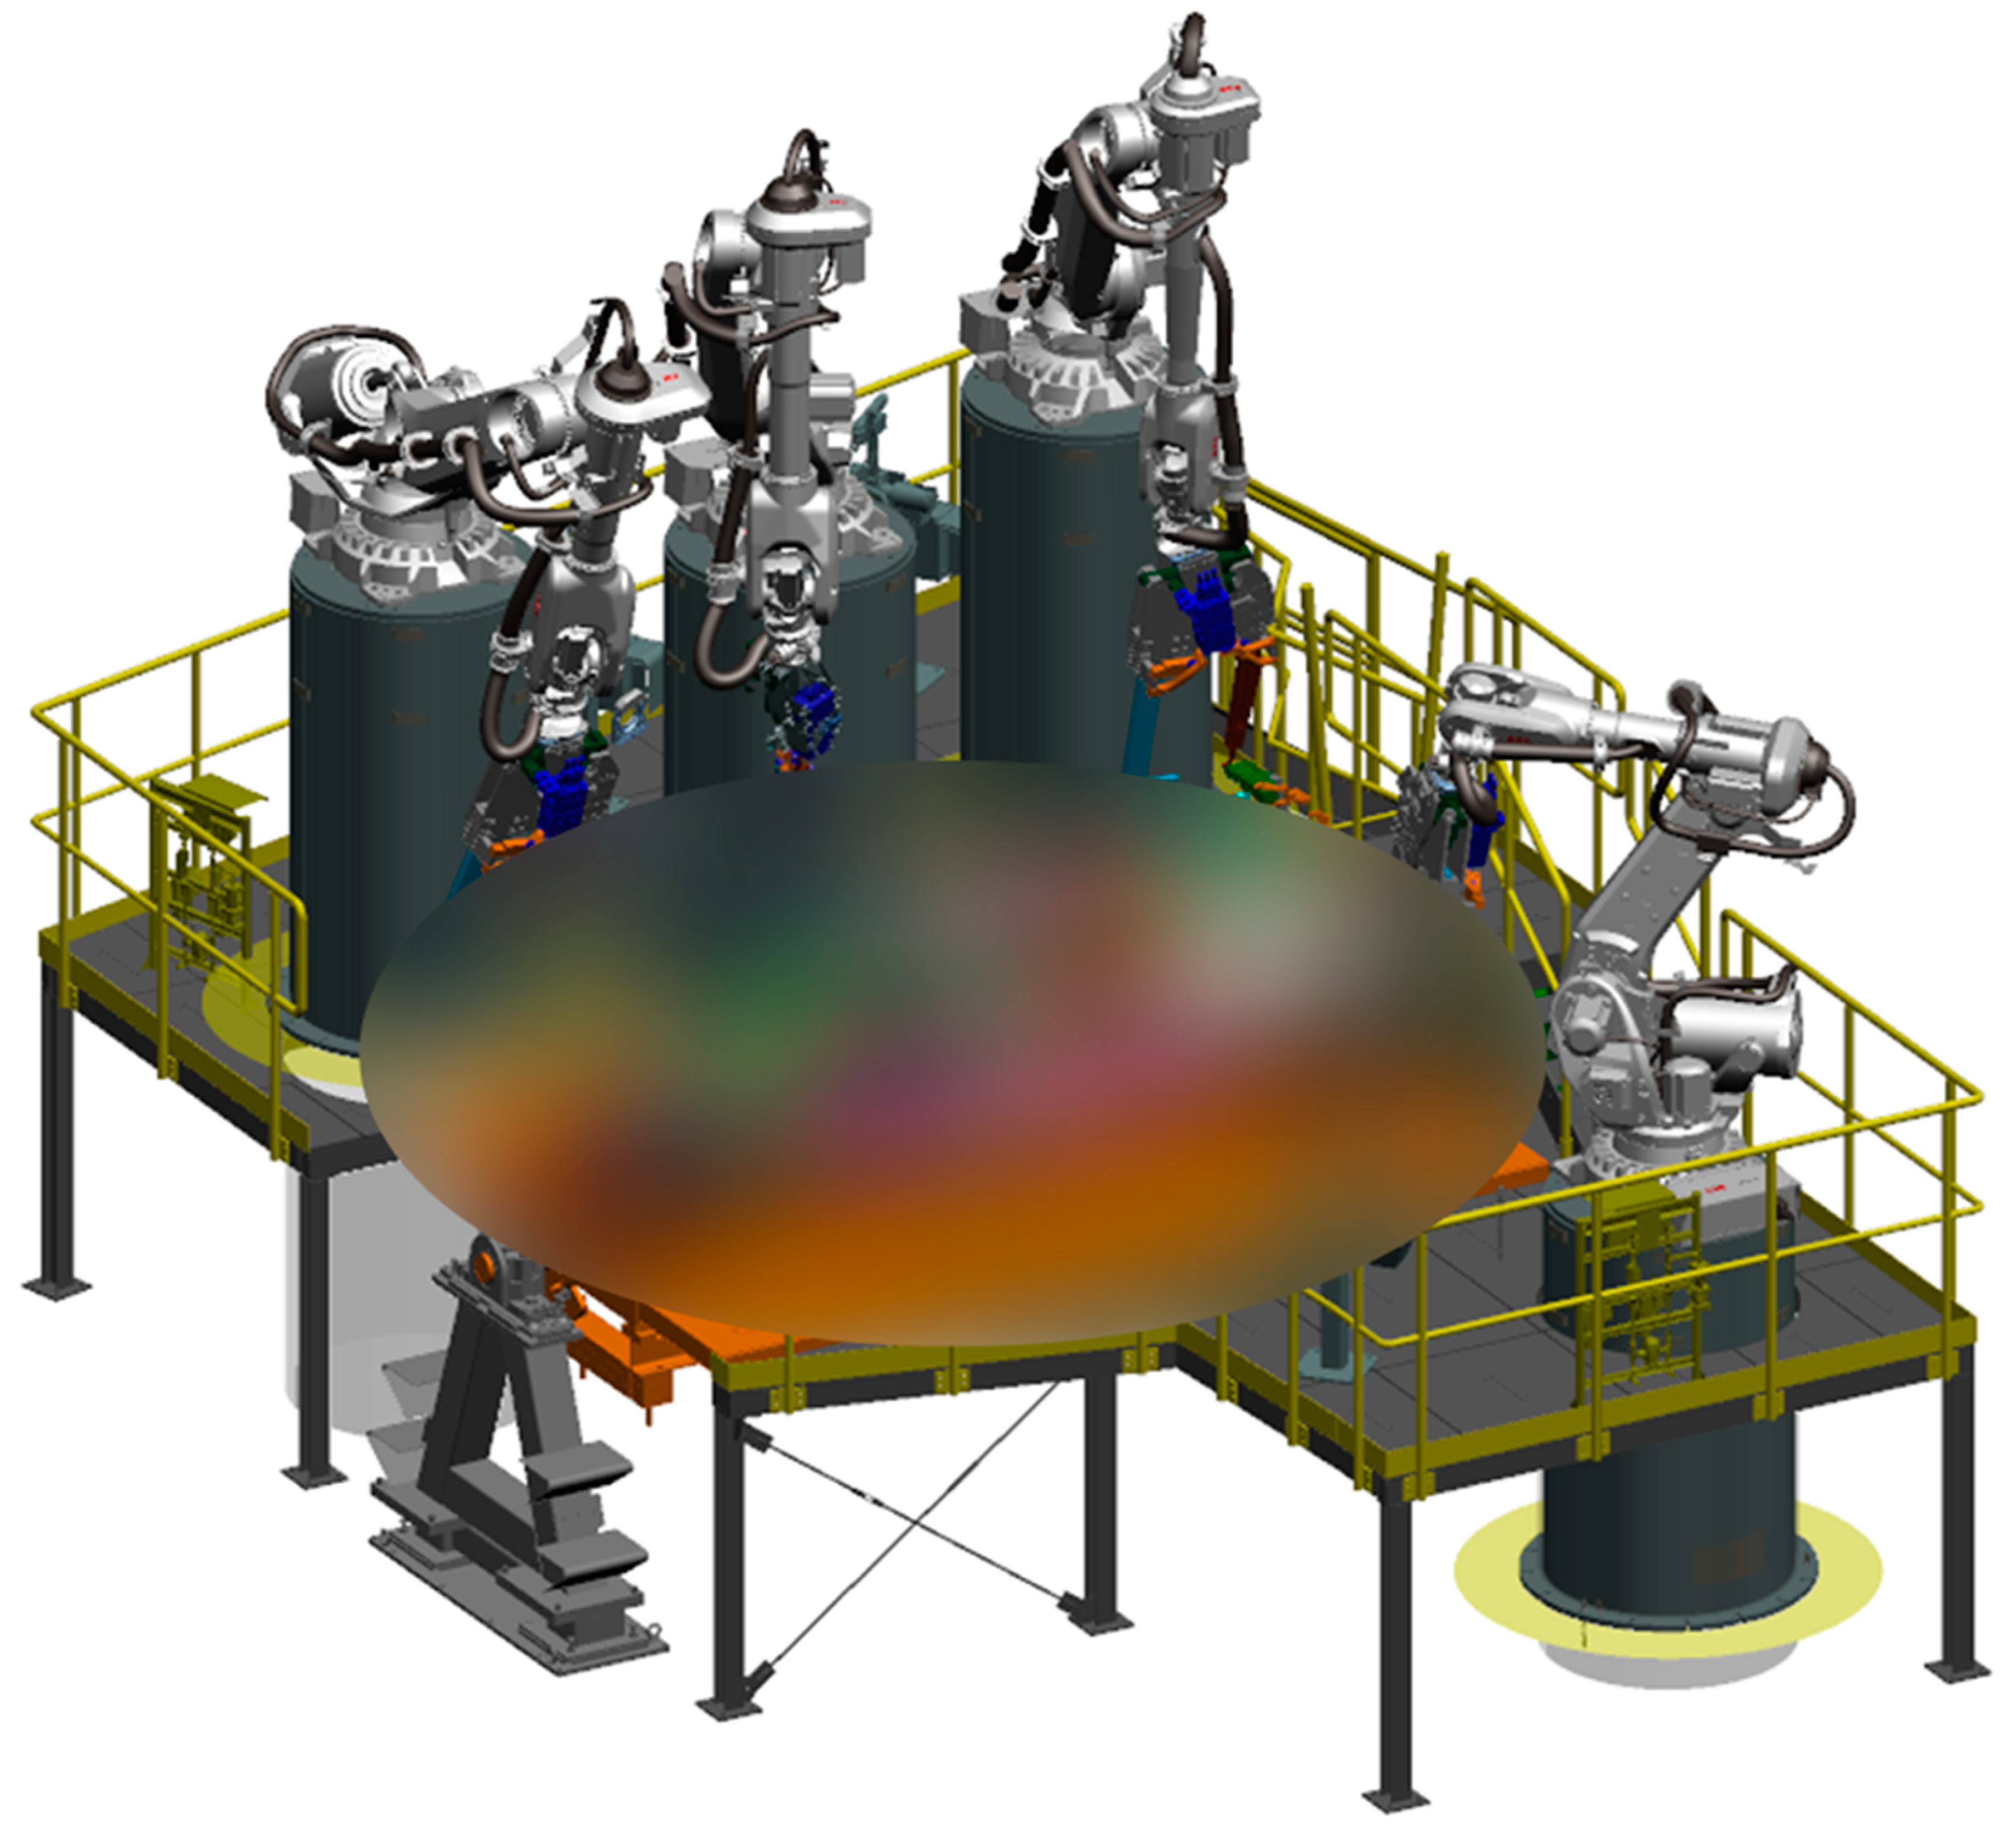
Based on the developed methodology, this workstation was modified to reduce the working height of each industrial robot to the lowest possible level. This change was achieved by increasing the z-axis position of each robot, as shown in Figure 11.

Figure 11.
Modified experimental workplace model; blurring is due to protection.
The base of the ABB IRB 6740 industrial robot has been moved upwards by 1760 mm. This achieved a change in the z-axis working range from 36.8% to 56.5% to −12.2% to 0.3% of its maximum z-axis range from the base. The change in z-axis position or x-axis working range was also affected. From a range of 25% to 65.8%, the working range was changed to 38% to 66.4% of its maximum x-axis range. The effect of this change was to reduce power consumption by 0.5415 Wh, which is approximately 6.17%.
A similar change was made to the ABB IRB 6720 industrial robot, in which the position of the robot base was increased by 1500 mm. This resulted in a change in its working range in the z-axis from 26.9% to 46.9% to −10.7% to 3.4% of its maximum reach from the base. There was also a change in the x-axis range from 26.9% to 83.2% to 29.5% to 76.6%. A reduction in power consumption of 0.4463 Wh, or 5.9%, was achieved by changing the position.
The position of the ABB IRB 5720 industrial robot has been increased by 1600 mm. This changed its working range in the z-axis from 26.1% to 56.1% to −17.5% to 12.5%. In the x-axis, the working range was changed from 26.1% to 75.2% to 32% to 75.3% of the maximum range. This change resulted in a reduction in power consumption of 0.5793 Wh, or 6.46%.
A special case of increasing the position occurred with the ABB IRB 6710 robot, as in this case, it was only possible to increase the position of the robot base by 300 mm. This is due to the fact that when changing the base position to a higher height, some points became unreachable and a complete change in trajectory was required. Despite this small change in position, it was possible to adjust the working range in the z-axis from 5.3% to 70% to 4% to 50% of its maximum range from the base. There was also a change in the x-axis range, where the original range of 35.3% to 80% became a working range of 25.6% to 70%. This subtle change resulted in a reduction in power consumption of 0.106 Wh, or 1.19%.
6. Discussion
6.1. Findings
The results of previous measurements clearly demonstrate that the relative positioning of an industrial robot and its surrounding peripherals has a significant impact on both energy and time consumption. The proposed methodology adapts traditional industrial practices by introducing an additional step focused on the precise positioning of objects based on their working distance from the robot base. Additionally, the simulation step has been refined to emphasize both energy and time optimization.
The validation of this methodology on an experimental workstation showed measurable improvements. Specifically, positioning working points at approximately 50% of the robot’s maximum x-axis range and 10% below the base height in the z-axis minimized energy consumption. For time-critical tasks, positioning at 50% of the x-axis range and 70% above the base height achieved faster cycle times. These adjustments reduced energy consumption by 1.6731 Wh per duty cycle, translating to an annual energy savings of 0.8794 MWh, as shown in Table 7. While this corresponds to a financial savings of EUR 131.03 (the average market price of electricity for businesses for 2024 is set at EUR 149/MWh [69]), this only reflects the robot’s energy use and excludes other equipment in the workstation.
Table 7.
Annual savings of industrial robots of the experimental site.
6.2. Benefits
The proposed methodology offers significant benefits that go beyond financial savings. Applied to multiple robotic workstations, it enables significant cumulative energy savings, especially in high-production environments. By addressing energy efficiency in addition to time optimization, the methodology supports sustainability goals and environmental compliance, as well as enhances the reputation of organizations as socially responsible. In addition, optimizing robot movements reduces component wear and tear, extends equipment life, reduces maintenance costs, and minimizes downtime, thereby increasing productivity and reliability.
The versatile and customizable nature of the methodology provides a practical framework applicable to a variety of industries and robotic applications. It improves workplace functionality, reduces inefficiencies, and minimizes costly adjustments during commissioning. Its simplicity and low computational requirements make it accessible to small- and medium-sized businesses and facilitate efficient workstation design without the need for advanced optimization tools.
In addition to immediate savings, the methodology introduces a standardized process for energy-conscious design and the measurement of energy consumption. This allows for consistent comparisons, identifies inefficiencies, and supports data-driven decisions for layout adjustments. It also promotes energy efficient practices at the organizational level, improving resource allocation, environmental reporting, and compliance with standards such as ISO 50001 [70].
Finally, the real-world validation of the methodology through experimentation ensures its practical applicability, increasing its relevance for both academic research and industrial use, while aligning it with Industry 4.0 goals for sustainable, adaptive, and competitive production systems.
6.3. Challenges and Limitations
The methodology introduces challenges related to the accessibility of equipment for operators and technicians. Positioning the robot at an optimal height to minimize energy consumption may hinder access for maintenance, requiring the use of steps or other tools, which can increase safety risks. Similarly, lowering peripheral devices to avoid a high robot base may compromise ergonomics for operators and technicians. These trade-offs must be carefully evaluated by simulation engineers to balance energy efficiency with safety, ergonomics, and operational requirements.
6.4. Comparison with Other Approaches
Existing methods for energy optimization, such as mixed integer linear programming, heuristic algorithms, and energy-saving robot modes, often achieve up to 20% energy savings by optimizing trajectories and robot speed [71,72,73,74,75]. In contrast, the proposed methodology focuses on repositioning industrial robots and peripherals within the workstation. While simpler than advanced optimization techniques, this approach effectively reduces energy consumption by minimizing inefficiencies associated with the robot’s moment of inertia and working range. Its low computational demands and ease of implementation make it particularly appealing for practical use.
7. Conclusions
This paper addresses reducing the energy and time consumption of industrial robots by optimizing their positioning relative to peripheral components. The theoretical section analyzes current trends, limitations, and tools in robotic workplace design, highlighting that energy efficiency is often excluded from traditional methodologies, which focus on work point reachability and adherence to cycle time.
The proposed methodology minimizes energy consumption by adjusting the relative positions of industrial robots and their peripherals. Initial simulations were validated against real-world measurements using a sample of ABB industrial robots with similar designs and ranges. A parametric trajectory was developed in Process Simulate 2401 to assess energy consumption across different heights and distances, with 173 out of 274 tested trajectories meeting the required constraints.
The results revealed that optimal robot positioning is 50% of its maximum range on the x-axis, while adjustments along the z-axis present trade-offs: lowering the robot reduces energy consumption but increases the cycle time, and raising it has the opposite effect. The experimental application of this methodology reduced energy consumption by 33.95 Wh per cycle, corresponding to EUR 131.03 annually, though this calculation excludes peripheral and workplace equipment.
The methodology enables up to 45% energy and 30% time savings by optimizing component layouts. However, achieving maximum savings may require significant adjustments in the positions of peripherals, which must consider design constraints and tool compatibility. Simulation engineers must evaluate how much adjustment is feasible while maintaining safety and efficiency.
The primary scientific contribution lies in addressing robotic workplace design from an energy optimization perspective, an area often overlooked in favor of time efficiency. Most existing research focuses on software-based energy-saving methods, while this methodology emphasizes dispositional solutions. The findings provide a foundation for further research into optimizing robotic systems based on work point distance and height from the robot base.
This methodology offers practical value by streamlining the design process and integrating energy-saving strategies. It has potential applications across various industries, particularly in the automotive sector. Future advancements could include automated algorithms for component placement, adaptive trajectory control, and renewable energy integration to enhance sustainability. Combining this practical approach with advanced optimization techniques may further improve energy efficiency and time savings, making robotic systems more adaptable and economically viable.
Author Contributions
Conceptualization, R.R., R.B., T.H., R.Z. and M.C.; methodology, R.R., R.B., T.H., R.Z. and M.C.; validation, R.R., R.B. and R.Z.; formal analysis, T.H., R.R., M.C. and R.Z.; investigation, R.B., R.R. and T.H.; resources, R.R., R.B., T.H., R.Z. and M.C.; writing—original draft preparation, R.R., R.B., T.H., M.C. and R.Z.; writing—review and editing, T.H. and M.C.; visualization, R.R., T.H. and R.Z.; supervision, R.R., R.Z. and T.H.; funding acquisition, R.R. and T.H.; All authors have read and agreed to the published version of the manuscript.
Funding
This research was funded by the Scientific Grant Agency of the Ministry of Education, Science, Research, and Sport of the Slovak Republic and the Slovak Academy of Sciences, grant number VEGA 1/0391/24: The research and development of a sensor calibration methodology for diagnostic equipment for automated and robotic systems. This work was supported by the call for doctoral students and young researchers of Slovak University of Technology in Bratislava to start a research career (project ESG 23-06-01-B: Design and implementation of the security of industrial network systems with the creation of a standardized data set for security analyses (NAIZPSS)). This contribution was created with the support of the project APVV-23-0084 “Robotic-Based Hybrid Manufacturing of Workpieces for the Concept of Smart Production,” funded by the Slovak Research and Development Agency.
Data Availability Statement
Data are contained within the article.
Conflicts of Interest
The authors declare no conflicts of interest.
Appendix A
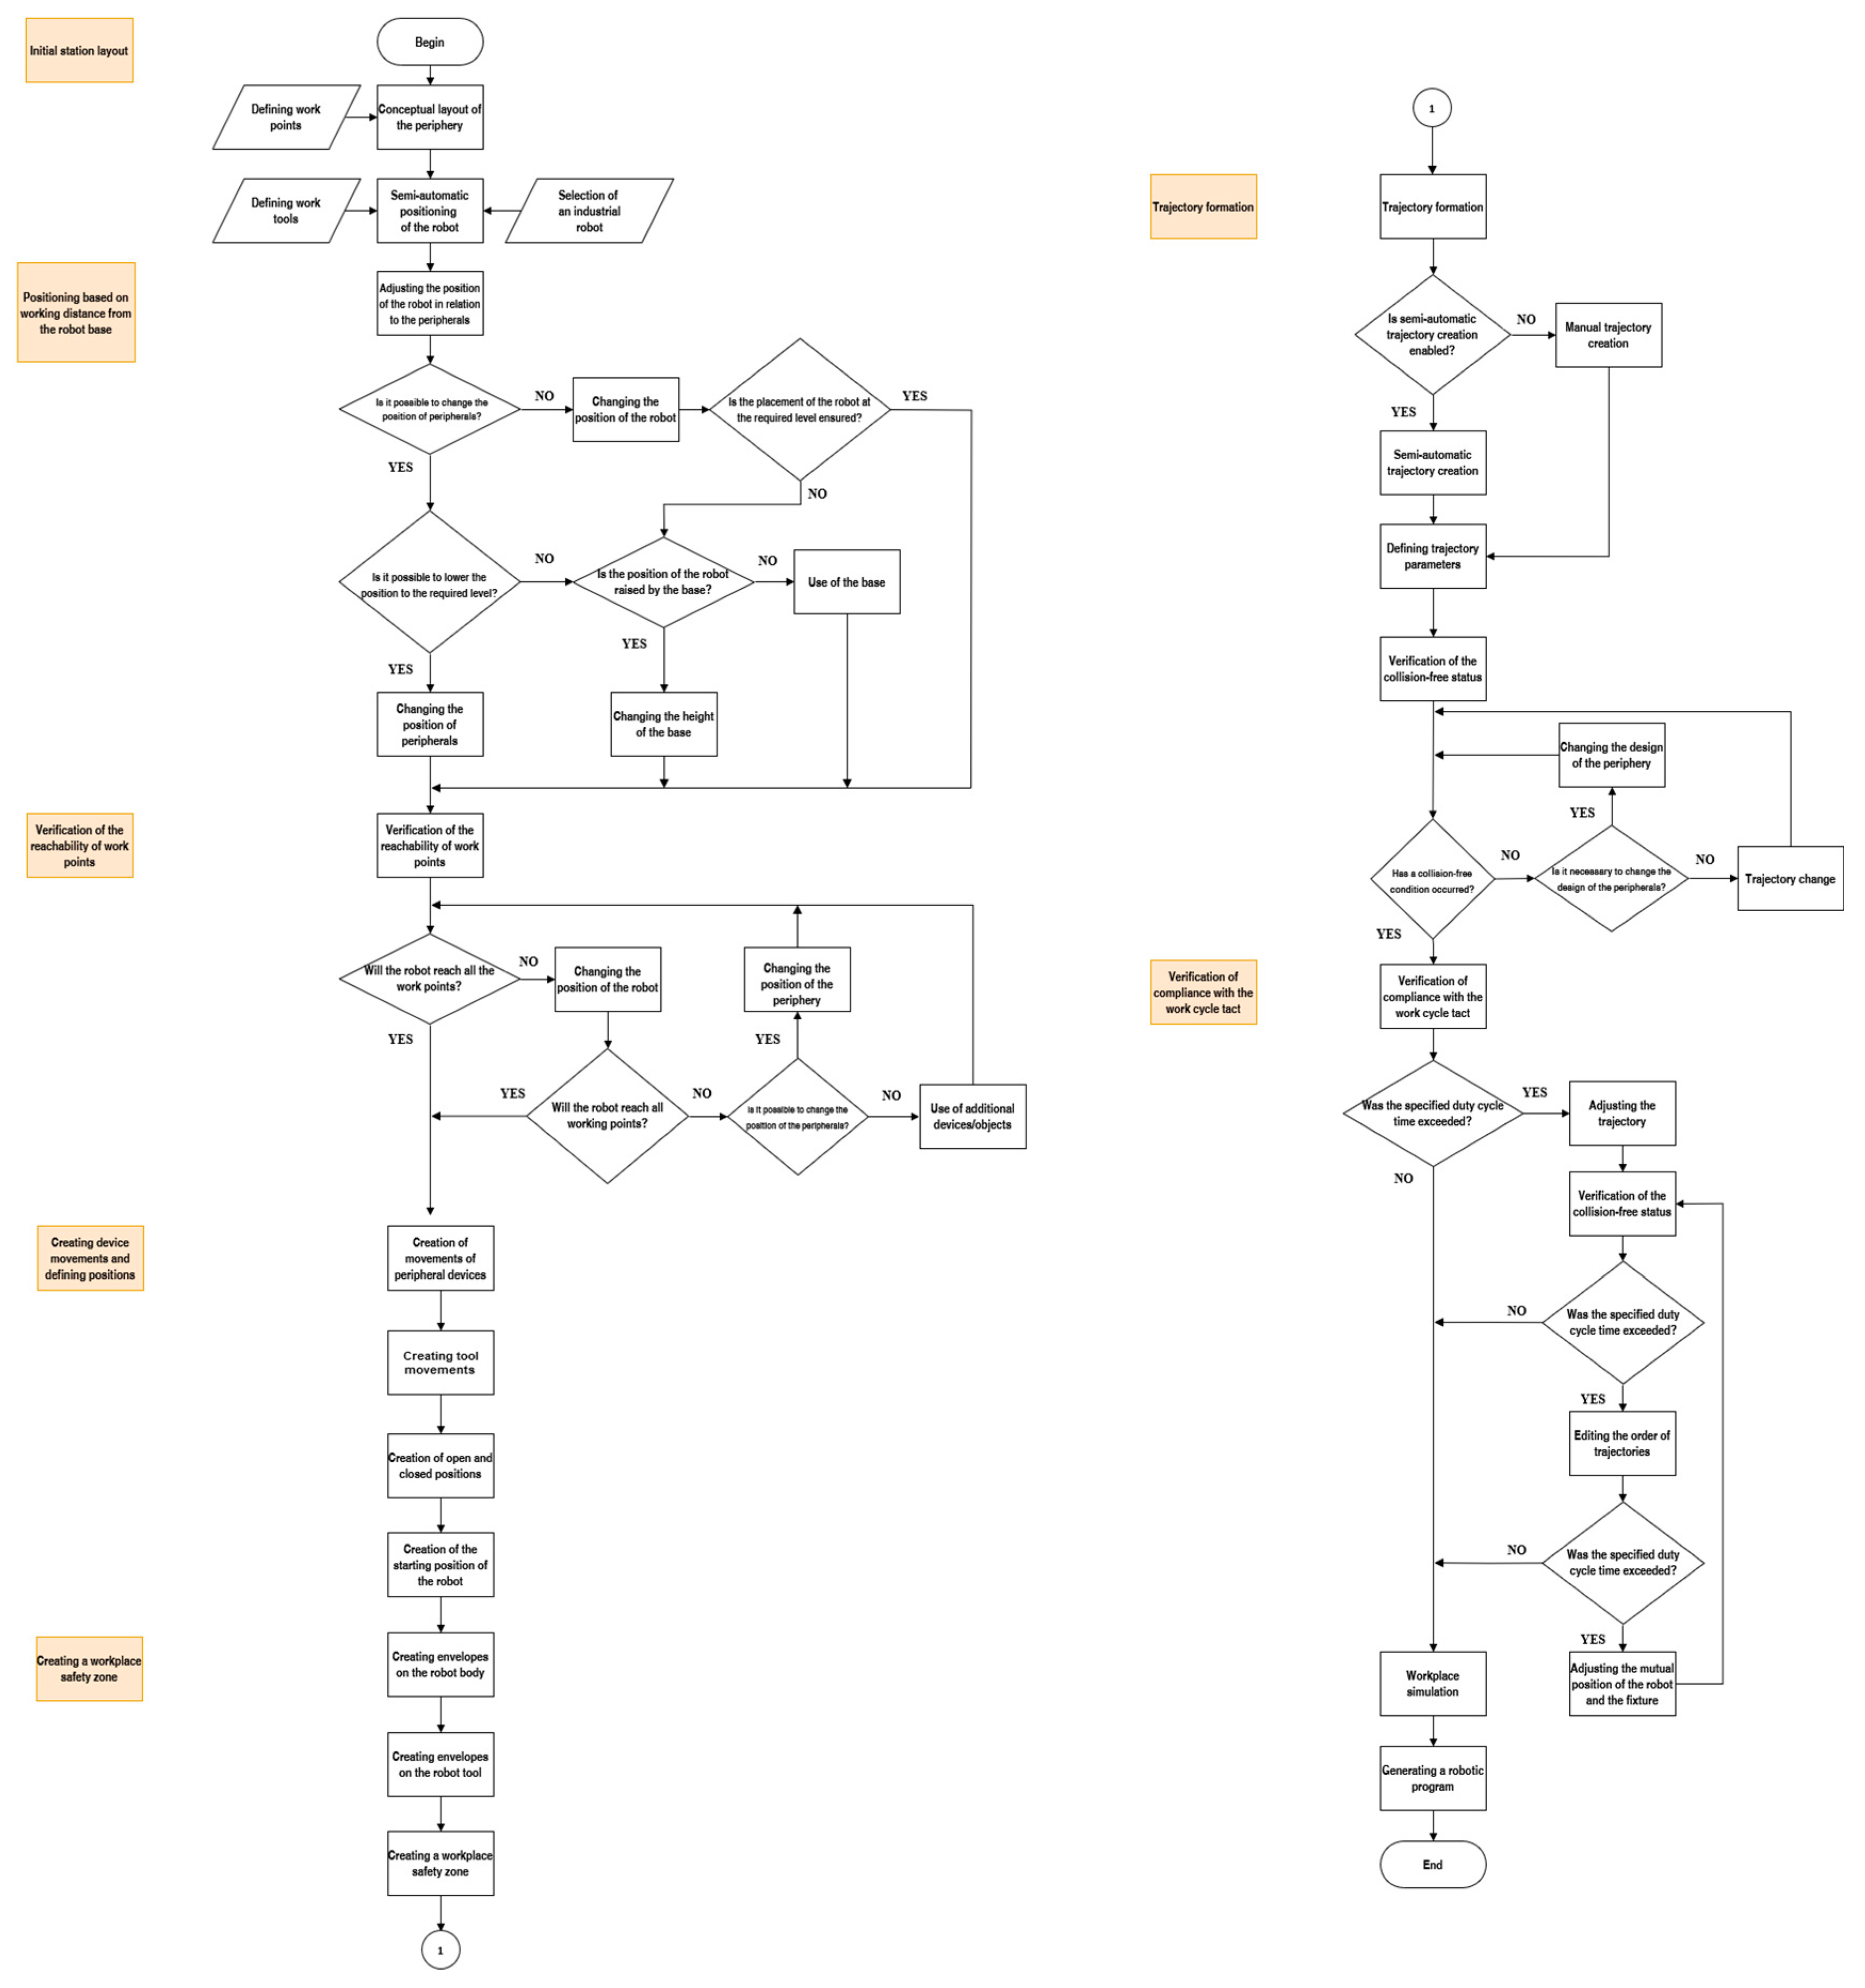
Overall flowchart (Figure A1) of the proposed methodology for robotic stations aimed at reducing energy and time consumption based on the relative position of the industrial robot.
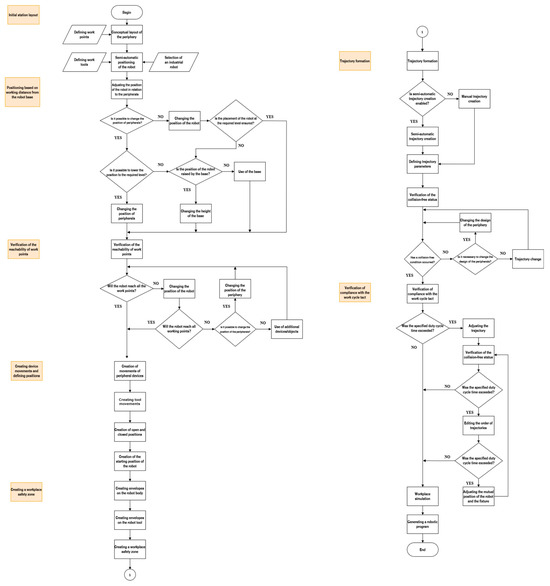
Figure A1.
Overall flowchart of the proposed methodology for designing robotic stations, focusing on reducing energy and time consumption through the optimization of the relative position of the industrial robot.
Figure A1.
Overall flowchart of the proposed methodology for designing robotic stations, focusing on reducing energy and time consumption through the optimization of the relative position of the industrial robot.
References
- Ballestar, M.T.; Díaz-Chao, Á.; Sainz, J.; Torrent-Sellens, J. Knowledge, Robots and Productivity in SMEs: Explaining the Second Digital Wave. J. Bus. Res. 2020, 108, 119–131. [Google Scholar] [CrossRef]
- Bartoš, M.; Bulej, V.; Bohušík, M.; Stancek, J.; Ivanov, V.; Macek, P. An Overview of Robot Applications in Automotive Industry. Transp. Res. Procedia 2021, 55, 837–844. [Google Scholar] [CrossRef]
- Vetiska, J.; Holub, M.; Blecha, P.; Bradac, F.; Brazina, J.; Stanek, V.; Kroupa, J.; Tuma, Z. Industry 4.0 in Educational Process. In Lecture Notes Mechanical Engineering; Springer: Cham, Switzerland, 2021; pp. 324–332. [Google Scholar] [CrossRef]
- Prada, E.; Varga, M.; Virgala, I.; Mikova, Ľ.; Kelemen, M. Model-Based Methodology for Designing Automated Workplaces. MM Sci. J. 2023, 2023, 7076. [Google Scholar] [CrossRef]
- Ekrem, Ö.; Aksoy, B. Trajectory Planning for a 6-Axis Robotic Arm with Particle Swarm Optimization Algorithm. Eng. Appl. Artif. Intell. 2023, 122, 106099. [Google Scholar] [CrossRef]
- Chakraa, H.; Guérin, F.; Leclercq, E.; Lefebvre, D. Optimization Techniques for Multi-Robot Task Allocation Problems: Review on the State-of-the-Art. Rob. Auton. Syst. 2023, 168, 104492. [Google Scholar] [CrossRef]
- Noga, M.; Juhás, M.; Gulan, M. Hybrid Virtual Commissioning of a Robotic Manipulator with Machine Vision Using a Single Controller. Sensors 2022, 22, 1621. [Google Scholar] [CrossRef]
- Raffaeli, R.; Bilancia, P.; Neri, F.; Peruzzini, M.; Pellicciari, M. Engineering Method and Tool for the Complete Virtual Commissioning of Robotic Cells. Appl. Sci. 2022, 12, 3164. [Google Scholar] [CrossRef]
- Phanden, R.K.; Sharma, P.; Dubey, A. A Review on Simulation in Digital Twin for Aerospace, Manufacturing and Robotics. Mater. Today Proc. 2021, 38, 174–178. [Google Scholar] [CrossRef]
- Choi, H.S.; Crump, C.; Duriez, C.; Elmquist, A.; Hager, G.; Han, D.; Hearl, F.; Hodgins, J.; Jain, A.; Leve, F.; et al. On the Use of Simulation in Robotics: Opportunities, Challenges, and Suggestions Formoving Forward. Proc. Natl. Acad. Sci. USA 2021, 118, e1907856118. [Google Scholar] [CrossRef] [PubMed]
- Mia, R.; Shuford, J. Exploring the Synergy of Artificial Intelligence and Robotics in Industry 4.0 Applications. J. Artif. Intell. Gen. Sci. (JAIGS) 2024, 1, 1–4, ISSN: 3006-4023. [Google Scholar] [CrossRef]
- Vysocký, A.; Papřok, R.; Šafařík, J.; Kot, T.; Bobovský, Z.; Novák, P.; Snášel, V. Reduction in Robotic Arm Energy Consumption by Particle Swarm Optimization. Appl. Sci. 2020, 10, 8241. [Google Scholar] [CrossRef]
- Rahman, M.A.A.; Shikder, K.N.; Maropoulos, P.G.; Mohamad, E.; Rahman, A.A.A.; Salleh, M.R. Configuration Tool for Generating Multi-Type and Multi-Robot Work Cell Layout. In Proceedings of the 2023 International Conference on Robotics and Automation in Industry, ICRAI, Peshawar, Pakistan, 3–5 March 2023. [Google Scholar] [CrossRef]
- Carabin, G.; Wehrle, E.; Vidoni, R. A Review on Energy-Saving Optimization Methods for Robotic and Automatic Systems. Robotics 2017, 6, 39. [Google Scholar] [CrossRef]
- Paryanto, P.; Brossog, M.; Bornschlegl, M.; Franke, J. Reducing the Energy Consumption of Industrial Robots in Manufacturing Systems. Int. J. Adv. Manuf. Technol. 2015, 78, 1315–1328. [Google Scholar] [CrossRef]
- Heredia, J.; Schlette, C.; Kjaergaard, M.B. Data-Driven Energy Estimation of Individual Instructions in User-Defined Robot Programs for Collaborative Robots. IEEE Robot. Autom. Lett. 2021, 6, 6836–6843. [Google Scholar] [CrossRef]
- Osman, N.S.; Rahman, M.A.A.; Abdul Rahman, A.A.; Kamsani, S.H.; Bali Mohamad, B.M.; Mohamad, E.; Zaini, Z.A.; Ab Rahman, M.F. Systematic Approach in Determining Workspace Area and Manufacturing Throughput Time for Configuring Robot Work Cell. Adv. Transdiscipl. Eng. 2017, 5, 959–966. [Google Scholar] [CrossRef]
- Gürel, S.; Gultekin, H.; Akhlaghi, V.E. Energy Conscious Scheduling of a Material Handling Robot in a Manufacturing Cell. Robot. Comput. Integr. Manuf. 2019, 58, 97–108. [Google Scholar] [CrossRef]
- Liu, A.; Liu, H.; Yao, B.; Xu, W.; Yang, M. Energy Consumption Modeling of Industrial Robot Based on Simulated Power Data and Parameter Identification. Adv. Mech. Eng. 2018, 10, 1687814018773852. [Google Scholar] [CrossRef]
- Riazi, S.; Wigstrom, O.; Bengtsson, K.; Lennartson, B. Energy and Peak Power Optimization of Time-Bounded Robot Trajectories. IEEE Trans. Autom. Sci. Eng. 2017, 14, 646–657. [Google Scholar] [CrossRef]
- Garg, G.; Kuts, V.; Anbarjafari, G. Digital Twin for FANUC Robots: Industrial Robot Programming and Simulation Using Virtual Reality. Sustainability 2021, 13, 10336. [Google Scholar] [CrossRef]
- Dzedzickis, A.; Subačiūtė-Žemaitienė, J.; Šutinys, E.; Samukaitė-Bubnienė, U.; Bučinskas, V. Advanced Applications of Industrial Robotics: New Trends and Possibilities. Appl. Sci. 2021, 12, 135. [Google Scholar] [CrossRef]
- Hadad, Y.; Keren, B. A Revised Method for Allocating the Optimum Number of Similar Machines to Operators. Int. J. Product. Perform. Manag. 2016, 65, 223–244. [Google Scholar] [CrossRef]
- Altendorfer, K. Optimal Composition of Number and Size of Machines. Lect. Notes Econ. Math. Syst. 2014, 671, 73–98. [Google Scholar] [CrossRef]
- Faieza, A.A. Manufacturing System; IntechOpen: London, UK, 2012. [Google Scholar]
- Wang, X.; Cao, J.; Cao, Y.; Zou, F. Energy-Efficient Trajectory Planning for a Class of Industrial Robots Using Parallel Deep Reinforcement Learning. Nonlinear Dyn. 2024, 1–21. [Google Scholar] [CrossRef]
- Glorieux, E.; Riazi, S.; Lennartson, B. Productivity/Energy Optimisation of Trajectories and Coordination for Cyclic Multi-Robot Systems. Robot. Comput. Integr. Manuf. 2018, 49, 152–161. [Google Scholar] [CrossRef]
- Yin, S.; Ji, W.; Wang, L. A Machine Learning Based Energy Efficient Trajectory Planning Approach for Industrial Robots. Procedia CIRP 2019, 81, 429–434. [Google Scholar] [CrossRef]
- Petrichenko, V.; Lokstein, L.; Thiele, G.; Haninger, K. Energy Consumption in Robotics: A Simplified Modeling Approach. arXiv 2024, arXiv:2411.03194. [Google Scholar]
- Haeberle, W.C. How a Business Works: What Every Businessperson, Citizen, Consumer, and Employee Needs to Know About Business; AuthorHouse: Bloomington, IN, USA, 2008; ISBN 9781434392169. [Google Scholar]
- Pérez-Gosende, P.; Mula, J.; Díaz-Madroñero, M. Facility Layout Planning. An Extended Literature Review. Int. J. Prod. Res. 2021, 59, 3777–3816. [Google Scholar] [CrossRef]
- Peron, M.; Fragapane, G.; Sgarbossa, F.; Kay, M. Digital Facility Layout Planning. Sustainability 2020, 12, 3349. [Google Scholar] [CrossRef]
- Laemmle, A.; Gust, S. Automatic Layout Generation of Robotic Production Cells in a 3D Manufacturing Simulation Environment. Procedia CIRP 2019, 84, 316–321. [Google Scholar] [CrossRef]
- Sánchez-Sosa, R.A.; Chavero-Navarrete, E. Robotic Cell Layout Optimization Using a Genetic Algorithm. Appl. Sci. 2024, 14, 8605. [Google Scholar] [CrossRef]
- Eswaran, M.; Inkulu, A.K.; Tamilarasan, K.; Bahubalendruni, M.V.A.R.; Jaideep, R.; Faris, M.S.; Jacob, N. Optimal Layout Planning for Human Robot Collaborative Assembly Systems and Visualization through Immersive Technologies. Expert Syst. Appl. 2024, 241, 122465. [Google Scholar] [CrossRef]
- Nguyen, Q.C.; Kim, Y.; Kwon, H.D. Optimization of Layout and Path Planning of Surgical Robotic System. Int. J. Control Autom. Syst. 2017, 15, 375–384. [Google Scholar] [CrossRef]
- Suemitsu, I.; Izui, K.; Yamada, T.; Nishiwaki, S.; Noda, A.; Nagatani, T. Simultaneous Optimization of Layout and Task Schedule for Robotic Cellular Manufacturing Systems. Comput. Ind. Eng. 2016, 102, 396–407. [Google Scholar] [CrossRef]
- Dowluru, S.; Madivada, H.; Prasanth, G.; Bammidi, R.; Muddada, V. Material Handling Cost Minimization Through Facility Layout Design Using Particle Swarm Optimization Method. Commun. Comput. Inf. Sci. 2024, 2093, 187–202. [Google Scholar] [CrossRef]
- Goyal, K.; Sethi, D. An Analytical Method to Find Workspace of a Robotic Manipulator. J. Mech. Eng. 2010, 41, 25–30. [Google Scholar] [CrossRef]
- Anjos, M.F.; Vieira, M.V.C. Facility Layout; EURO Advanced Tutorials on Operational Research; Springer International Publishing: Cham, Switzerland, 2021; ISBN 978-3-030-70989-1. [Google Scholar]
- Bikas, H.; Manitaras, D.; Souflas, T.; Stavropoulos, P. Process-Driven Layout Optimization of a Portable Hybrid Manufacturing Robotic Cell Structure. Eng 2024, 5, 918–931. [Google Scholar] [CrossRef]
- Lietaert, P.; Billen, N.; Burggraeve, S. Model-Based Multi-Attribute Collaborative Production Cell Layout Optimization. In Proceedings of the 2019 20th International Conference on Research and Education in Mechatronics, REM, Wels, Austria, 23–24 May 2019. [Google Scholar] [CrossRef]
- Zhao, Y.; Lu, J.; Yi, W. A New Cellular Manufacturing Layout: Multi-Floor Linear Cellular Manufacturing Layout. Int. J. Adv. Robot. Syst. 2020, 17, 1729881420925300. [Google Scholar] [CrossRef]
- Zúñiga, E.R.; Moris, M.U.; Syberfeldt, A.; Fathi, M.; Rubio-Romero, J.C. A Simulation-Based Optimization Methodology for Facility Layout Design in Manufacturing. IEEE Access 2020, 8, 163818–163828. [Google Scholar] [CrossRef]
- Lueth, T.C. Automated Planning of Robot Workcell Layouts. Proc IEEE Int. Conf. Robot. Autom. 1992, 2, 1103–1108. [Google Scholar] [CrossRef]
- Mata, V.; Tubaileh, A. The Machine Layout Problem in Robot Cells. Int. J. Prod. Res. 1998, 36, 1273–1292. [Google Scholar] [CrossRef]
- Fang, X.; Zhang, J. A Collaborative Method between CAD and CAR Software for Robotic Cells Design. In Proceedings of the 2nd International Conference on Information Technology and Electronic Commerce, ICITEC, Dalian, China, 20–21 December 2014; pp. 127–131. Available online: https://ieeexplore.ieee.org/stamp/stamp.jsp?tp=&arnumber=7105586 (accessed on 6 December 2024). [CrossRef]
- Han, B.T.; Cook, J.S. An Efficient Heuristic for Robot Acquisition and Cell Formation. Ann. Oper. Res. 1998, 77, 229–252. [Google Scholar] [CrossRef]
- Nelson, B.; Donath, M. Optimizing the Location of Assembly Tasks in a Manipulator’s Workspace. J. Robot. Syst. 1990, 7, 791–811. [Google Scholar] [CrossRef]
- Izui, K.; Murakumo, Y.; Suemitsu, I.; Nishiwaki, S.; Noda, A.; Nagatani, T. Multiobjective Layout Optimization of Robotic Cellular Manufacturing Systems. Comput. Ind. Eng. 2013, 64, 537–544. [Google Scholar] [CrossRef]
- Tao, L.; Liu, Z. Optimization on Multi-Robot Workcell Layout in Vertical Plane. In Proceedings of the 2011 IEEE International Conference on Information and Automation, ICIA, Shenzhen, China, 6–8 June 2011; pp. 744–749. [Google Scholar] [CrossRef]
- Lakshminarayanan, N.; Surendra Babu, K.; Amin, S.; Sulficker, A.; Nassar, M.N.A. Design Optimization of Robotic Work Cell Layout in Automotive Industries. IOP Conf. Ser. Mater. Sci. Eng. 2020, 993, 012036. [Google Scholar] [CrossRef]
- Qiu, B.; Chen, S.; Xiao, T.; Gu, Y.; Zhang, C.; Yang, G. A Feasible Method for Evaluating Energy Consumption of Industrial Robots. In Proceedings of the 16th IEEE Conference on Industrial Electronics and Applications, ICIEA, Chengdu, China, 1–4 August 2021; pp. 1073–1078. [Google Scholar] [CrossRef]
- Gadaleta, M.; Berselli, G.; Pellicciari, M.; Grassia, F. Extensive Experimental Investigation for the Optimization of the Energy Consumption of a High Payload Industrial Robot with Open Research Dataset. Robot. Comput. Integr. Manuf. 2021, 68, 102046. [Google Scholar] [CrossRef]
- Han, G.; Xie, F.; Liu, X.J. Evaluation of the Power Consumption of a High-Speed Parallel Robot. Front. Mech. Eng. 2018, 13, 167–178. [Google Scholar] [CrossRef]
- Gultekin, H.; Gürel, S.; Taspinar, R. Bicriteria Scheduling of a Material Handling Robot in an M-Machine Cell to Minimize the Energy Consumption of the Robot and the Cycle Time. Robot. Comput. Integr. Manuf. 2021, 72, 102207. [Google Scholar] [CrossRef]
- Pellegrinelli, S.; Borgia, S.; Pedrocchi, N.; Villagrossi, E.; Bianchi, G.; Tosatti, L.M. Minimization of the Energy Consumption in Motion Planning for Single-Robot Tasks. Procedia CIRP 2015, 29, 354–359. [Google Scholar] [CrossRef]
- Othman, A.; Belda, K.; Burget, P. Physical Modelling of Energy Consumption of Industrial Articulated Robots. In Proceedings of the 2015 15th International Conference on Control, Automation and Systems (ICCAS), BEXCO, Busan, Republic of Korea, 13–16 October 2015. [Google Scholar]
- Zhou, J.; Cao, H.; Jiang, P.; Li, C.; Yi, H.; Liu, M. Energy-Saving Trajectory Planning for Robotic High-Speed Milling of Sculptured Surfaces. IEEE Trans. Autom. Sci. Eng. 2022, 19, 2278–2294. [Google Scholar] [CrossRef]
- Otani, T.; Nakamura, M.; Kimura, K.; Takanishi, A. Energy Efficient Path and Trajectory Optimization of Manipulators With Task Deadline Constraints. IEEE Access 2023, 11, 107441–107450. [Google Scholar] [CrossRef]
- Miranda, S.; Vázquez, C.R. Analysis and Prediction of Energy Consumption in a Collaborative Robot. IFAC-PapersOnLine 2023, 56, 3710–3715. [Google Scholar] [CrossRef]
- Palomba, I.; Wehrle, E.; Carabin, G.; Vidoni, R. Minimization of the Energy Consumption in Industrial Robots through Regenerative Drives and Optimally Designed Compliant Elements. Appl. Sci. 2020, 10, 7475. [Google Scholar] [CrossRef]
- Yan, J.; Zhang, M. A Transfer-Learning Based Energy Consumption Modeling Method for Industrial Robots. J. Clean Prod. 2021, 325, 129299. [Google Scholar] [CrossRef]
- Garcia, R.R.; Bittencourt, A.C.; Villani, E. Relevant Factors for the Energy Consumption of Industrial Robots. J. Braz. Soc. Mech. Sci. Eng. 2018, 40, 464. [Google Scholar] [CrossRef]
- Cheng, F.; Bai, J.; Wang, H.; Xie, X. Reducing the Energy Consumption of a Palletizing Robot through RobotStudio. In Proceedings of the 31st Chinese Control and Decision Conference, CCDC, Nanchang, China, 3–5 June 2019; pp. 5608–5610. [Google Scholar] [CrossRef]
- Lin, H.I.; Mandal, R.; Wibowo, F.S. BN-LSTM-Based Energy Consumption Modeling Approach for an Industrial Robot Manipulator. Robot. Comput. Integr. Manuf. 2024, 85, 102629. [Google Scholar] [CrossRef]
- Li, Y.; Wang, Z.; Yang, H.; Zhang, H.; Wei, Y. Energy-Optimal Planning of Robot Trajectory Based on Dynamics. Arab. J. Sci. Eng. 2023, 48, 3523–3536. [Google Scholar] [CrossRef]
- Ruzarovsky, R.; Horak, T.; Bocak, R. Evaluating Energy Efficiency and Optimal Positioning of Industrial Robots in Sustainable Manufacturing. J. Manuf. Mater. Process. 2024, 8, 276. [Google Scholar] [CrossRef]
- Eurostat, “Statistics”. 2024. Available online: https://ec.europa.eu/eurostat/databrowser/view/nrg_pc_205_c/default/bar?lang=en (accessed on 19 December 2024).
- International Organization for Standardization. ISO 50001:2018—Energy Management Systems; International Organization for Standardization: Geneva, Switzerland, 2018; Available online: https://www.iso.org/standard/69426.html (accessed on 19 December 2024).
- Guerra-Zubiaga, D.A.; Luong, K.Y. Energy Consumption Parameter Analysis of Industrial Robots Using Design of Experiment Methodology. Int. J. Sustain. Eng. 2021, 14, 996–1005. [Google Scholar] [CrossRef]
- Mukund Nilakantan, J.; Huang, G.Q.; Ponnambalam, S.G. An Investigation on Minimizing Cycle Time and Total Energy Consumption in Robotic Assembly Line Systems. J. Clean. Prod. 2015, 90, 311–325. [Google Scholar] [CrossRef]
- Bukata, L.; Šůcha, P.; Hanzálek, Z. Optimizing Energy Consumption of Robotic Cells by a Branch & Bound Algorithm. Comput. Oper. Res. 2019, 102, 52–66. [Google Scholar] [CrossRef]
- Wen, X.; Sun, Y.; Ma, H.L.; Chung, S.H. Green Smart Manufacturing: Energy-Efficient Robotic Job Shop Scheduling Models. Int. J. Prod. Res. 2023, 61, 5791–5805. [Google Scholar] [CrossRef]
- Bukata, L.; Sucha, P.; Hanzalek, Z.; Burget, P. Energy Optimization of Robotic Cells. IEEE Trans. Industr. Inform. 2017, 13, 92–102. [Google Scholar] [CrossRef]


Disclaimer/Publisher’s Note: The statements, opinions and data contained in all publications are solely those of the individual author(s) and contributor(s) and not of MDPI and/or the editor(s). MDPI and/or the editor(s) disclaim responsibility for any injury to people or property resulting from any ideas, methods, instructions or products referred to in the content. |
© 2025 by the authors. Licensee MDPI, Basel, Switzerland. This article is an open access article distributed under the terms and conditions of the Creative Commons Attribution (CC BY) license (https://creativecommons.org/licenses/by/4.0/).