1. Introduction
In the rapidly evolving technological landscape, sensors are integral components that provide critical data for decision-making processes across various applications. Ensuring the reliability and accuracy of sensor data is critical, as any discrepancies can lead to significant errors and system failures. The importance of this issue is magnified in the context of embedded systems and the Internet of Things (IoT), where sensors operate in diverse and often harsh environments [
1,
2,
3,
4,
5,
6,
7].
The challenge of ensuring sensor data integrity is amplified in embedded systems and IoT networks, where sensors are often exposed to harsh and variable conditions. Traditional methodologies for anomaly detection, such as signature-based Intrusion Detection Systems (IDS), have proven effective against known threats but struggle with novel and sophisticated attacks [
8]. As cyber threats and system vulnerabilities evolve, there is a pressing need for advanced detection techniques that can adapt to emerging risks and safeguard system integrity.
This research addresses this critical gap by proposing an innovative approach that leverages discrete wavelet transforms (DWT) embedded within microcontrollers for real-time anomaly detection and fault isolation. Wavelet transforms, particularly DWT, have emerged as powerful tools in signal processing. They allow signals to be decomposed into different frequency components and analyze localized features. The Haar wavelet from the DWT family was chosen for anomaly detection due to its simplicity and efficiency in decomposing non-stationary signals, allowing the detection of both transient and persistent faults in sensor data. Haar wavelets provide clear time and frequency localization, crucial for identifying anomalies in embedded systems. Their computational simplicity makes them ideal for real-time applications on resource-constrained devices like microcontrollers [
9,
10,
11]. Euclidean distance was used together with DWT to quantify deviations between transformed data and a reference model, offering a straightforward and efficient way to detect faults.
The motivation behind this study lies in the recognition that traditional methods are insufficient for modern, dynamic environments where sensor data must be scrutinized continuously and accurately. By embedding wavelet-based analysis directly into microcontrollers, this approach allows for the meticulous monitoring of sensor data, enabling the detection and isolation of anomalies before they can propagate and disrupt the system.
The proposed scheme enhances system reliability and security by incorporating wavelet-based analysis into microcontrollers, which offers a robust defense against false data injection and other anomalies. This proactive approach not only improves the reliability of embedded systems but also contributes to overall cybersecurity by preventing erroneous data from compromising system integrity.
This paper leans on the work introduced in [
12], targeting anomaly behavior analysis of sensors, the key differences are an innovative methodology for sensor fault detection using wavelet transforms and Euclidean distance calculations in embedded systems. We validate our approach through experiments involving embedded systems that simulate IoT network nodes. The results demonstrate a high detection rate with minimal false alarms, underscoring the efficacy of wavelet-based anomaly detection in enhancing sensor reliability and overall system security.
1.1. Background
With the raising use of IoT applications such as command and control, monitoring, and premises management, to name a few, ensuring the correct operation of all interconnected devices is becoming more and more challenging [
8]. Predominantly, the proper functioning of sensors is crucial in IoT applications, requiring continuous research to detect and resolve device issues. Additionally, protecting data integrity as well as reducing potential risks are significant concerns for regular customers, businesses, and even researchers.
Recent research emphasizes the growing importance of wavelet-based methods for anomaly detection in embedded systems, particularly due to their ability to address the limitations of traditional fault detection approaches. For instance, the discrete wavelet neural network algorithm has demonstrated significant promise in detecting faults in rotor systems by effectively capturing signal features across multiple scales, resulting in enhanced detection accuracy and robustness [
13]. Similarly, wavelet-based multi-class support vector machines have proven effective in diagnosing stator faults in induction motors, showcasing the method’s capability to handle complex, multi-class fault scenarios with high precision [
14]. Additionally, ensemble convolution-based methods for fault detection using vibration signals have shown that integrating multiple analytical approaches, including wavelet transforms, can significantly improve fault detection performance by leveraging diverse signal characteristics [
15]. These studies highlight the advantages of wavelet-based techniques in decomposing signals into localized frequency components, making them well-suited for detecting both transient and persistent anomalies in real-time applications. By embedding wavelet analysis, fault detection can be substantially enhanced, contributing to the overall reliability and security of critical applications in dynamic environments. This evidence supports the foundation for the selection of wavelet-based methods in the current work, pointing out their potential to overcome the challenges posed by traditional anomaly detection techniques.
The next sections show a summary of the most frequent types of sensor faults, some of the strategies applied to address these issues, and the current security techniques for data integrity.
1.1.1. Sensor Fault Classification
The classification and detection of sensor faults have gathered significant attention due to the critical role of sensors in modern automated and industrial systems. Sensor faults are generally categorized into incipient and abrupt types, with incipient faults representing gradual deviations that can evolve into more severe issues over time, while abrupt faults occur suddenly and can have immediate detrimental effects on system performance [
1]. Recent advances in fault classification methodologies reflect a growing trend towards leveraging sophisticated computational techniques. Deep learning approaches, such as convolutional autoencoders, have shown considerable potential in capturing complex fault patterns through unsupervised feature learning [
2,
3]. Additionally, machine learning algorithms like decision trees and particle swarm optimization have been applied to fault classification, providing interpretable models with adaptive capabilities [
4]. More advanced methods, including support vector machines (SVM), K-nearest neighbor (KNN) classifiers, and generative adversarial networks (GAN), combined with random forests, have further enhanced fault classification accuracy by exploiting high-dimensional data characteristics and reducing false positives [
5,
6]. Time-frequency analysis (TFA) integrated with deep learning techniques has been successfully employed for the detection and classification of faults in complex systems such as unmanned aerial vehicles (UAVs), demonstrating the applicability of these methods in dynamic environments [
7]. In highly sensitive settings like nuclear power plants, two-layer mathematical models utilizing data-driven methods have been developed for thermocouple sensor fault detection, showcasing the integration of statistical and machine learning approaches in critical safety applications [
16]. These diverse techniques underline the ongoing global efforts and technological advancements aimed at improving sensor fault detection and classification, reflecting the growing complexity and critical importance of maintaining sensor integrity in varied applications across industries.
Loss of accuracy is the result of sensor bias, where data samples are replaced with constant values. Since it is a common issue, many strategies have been applied, for instance, authors in [
17] suggest the use of angular-rate-aided estimation methods to improve bias assessment. Authors in [
18] studied the bias issue in accelerometers used in the drilling process and introduced a sensor fault detection and isolation method that outperforms previous strategies.
The drift phenomenon in sensors is the presence of an offset or bias parameter that slowly changes (drifts) over time. Authors in [
19] introduced a sensor drift detection method based on grey models and discrete wavelet transform (DWT), using DWT to decompose the signal and grey models for detrending. On the other hand, authors in [
20] proposed a trinomial distribution for quantifying sensor drift in temperature sensors; the core of the method uses probabilistic neural networks (PNN) to estimate the correct temperature and then compare with the online values.
In addition to the drift and bias errors, a sudden fault can occur when the sensor unexpectedly stops working due to physical damage. This leads to a detectable fault parameter [
1] that can be seen as sensor noise, short circuits, open circuits and/or random sensor faults. Sensor noise can show up in two types: internally (originating from the sensor and its inner circuit) and externally (occurring from an outside source). For instance, faulty connections and disconnections, respectively, trigger short and open-circuit faults. Random sensor faults, on the other hand, stem from the intricate layout environment, potentially surpassing the sensor’s capabilities [
1].
1.1.2. Discrete Wavelet Transform (DWT)
Wavelets are short-duration waveforms used for analyzing functions. Wavelets allow splitting signals into different frequency components and at different scales. Wavelet analysis involves decomposing signals into wavelet coefficients, representing their components at different scales and positions in time. This is different from approaches like the Fourier transform [
9,
10]. Due to these features, wavelets are widely used for solving problems related to time-varying non-stationary variables. The wavelet transform represents a signal as a set of essential functions (wavelets) obtained from the translation and scaling of a mother wavelet, given by Equation (1):
where
represents the wavelet function, the core function used in the wavelet transform.
a is the scaling parameter that stretches or compresses the wavelet, allowing analysis at different scales, and must be greater than zero.
b is the translation parameter that shifts the wavelet along the time axis, allowing the function to be localized in time.
t is the time variable representing the original signal’s domain.
represents the mother wavelet function, which is the prototype for generating all the wavelets used in the analysis.
Continuous wavelet transforms (CWT) enable the mapping of properties in non-stationary signals. In time-frequency, the coefficients
in (2) are obtained by changing the scale and position parameters of a signal [
13]:
where
represents the wavelet coefficients, which quantify the similarity between the signal and the scaled and shifted wavelet function at a given scale and position. These coefficients are the results of the wavelet transform and describe the signal’s behavior in both time and frequency domains.
is the original function being analyzed. It represents the time-domain data to which the wavelet transform is applied.
is the conjugate of the wavelet function, where the wavelet is scaled by
a and translated by
b. This function is used to match and extract specific features of the signal at different scales and positions.
There is also a discrete wavelet transform (DWT), which consists of the decomposition of the signal into a mutually orthogonal set of wavelets. Unlike traditional methods that analyze signals in the frequency domain only, DWT provides both time and frequency localization, making it effective for analyzing non-stationary signals commonly encountered in embedded systems [
9]. In the context of sensor fault detection, DWT enables the isolation of specific features associated with faults, such as abrupt changes or gradual drifts, by decomposing the signal into various scales and resolutions. This multi-resolution analysis allows for the precise identification of anomalies that might be overlooked by other signal processing techniques. Additionally, the computational efficiency of DWT makes it suitable for real-time applications on resource-constrained embedded systems, where timely and accurate anomaly detection is crucial. The ability to perform detailed analysis at different levels of decomposition provides a robust framework for fault detection, aligning with the critical need to safeguard sensor data integrity and ensure reliable operation in complex and dynamic environments.
The DWT is described thoroughly in [
11] and in the seminal paper [
21]. This transform is expressed by (3)
where
represents the discrete wavelet function at a specific scale
j and position
k. It is derived from the mother wavelet by scaling and translating it discretely, forming a set of orthogonal basis functions used in the discrete wavelet transform.
t is the time variable, representing the domain over which the signal and wavelet function are defined.
is the scaled and shifted version of the mother wavelet function. Here,
scales the wavelet, compressing it for finer details (higher frequencies) or stretching it for broader features (lower frequencies), while −
k shifts the wavelet along the time axis.
On the other hand, the DWT coefficients are represented by Equation (4):
where
represents the discrete wavelet transform coefficients at scale
j and position
k.
is the original function being analyzed.
is the scaled and shifted version of the mother wavelet function.
computes the projection of the signal
f(
t) onto the wavelet function.
The simplest wavelet is the Haar wavelet, which is represented by a step function as shown in Equation (5):
The discrete Haar wavelet transform is widely used due to its simplicity and has been enhanced for various applications [
10]. The process involves applying an ordered fast form of the transform to analyze a discrete signal. It starts with a one-dimensional array of
entries and then undergoes
n iterations of the same basic transform. This transform calculates a sample using the average and the difference between two points of an approximation function.
Before the iteration number
where
, this array consists of
step-functions defined by (6) or (7):
where
represents the scaling function, or approximation function, at the (
n −
l) level of decomposition and position
k.
n is the total number of decomposition levels in the discrete wavelet transform.
l is the current iteration or level of decomposition, where
. As
increases, the decomposition goes deeper, capturing coarser details of the signal.
represents the basic scaling function defined over the interval
, which is scaled and translated to different positions and resolutions.
After iteration
l, the array will have half as many
coefficients of
step functions
and
coefficients given by (8) or (9):
The calculation of the two wavelet coefficients, also called approximation coefficients and detail coefficients, in each iteration for an array of
values is given by (10) and (11):
where
represents the approximation coefficient at level
and position
. These coefficients capture the low-frequency (smooth) components of the signal at a particular level of decomposition.
and
are the approximation coefficients from the previous level of decomposition, which are used to calculate the new approximation coefficient at the current level.
represents the detail coefficient at level
and position
. These coefficients capture the high-frequency (detailed) components of the signal, such as sharp changes or edges, at a given level of decomposition.
The
pairs of new coefficients constitute two arrays given by (12) and (13):
This algorithm allows the preservation of the basic information of the whole array.
1.1.3. Anomaly Behavior Analysis
Current cybersecurity solutions must be more effective to cope with the exponential increase in the quantity and complexity of cyber-attacks [
8,
22,
23,
24,
25]. Two important techniques for detecting such threats are signature-based and anomaly-based Intrusion Detection Systems (IDS) [
23,
26,
27]. A signature-based IDS relies on a set of known attack signatures or identities. However, these systems fail when it comes to detecting new attack types or even known attacks with small modifications to their base signatures. On the other hand, anomaly-based detection approaches excel in identifying novel and emerging threats or failures.
An anomaly-based IDS establishes a baseline model of the system’s normal behavior through offline training (under known conditions) and flags any activity that deviates from this model as abnormal [
28,
29,
30]. Configuration, misuse, or any fault can lead to abnormal behavior. However, this approach may generate numerous false alarms, which is a significant disadvantage.
1.1.4. Quality Control
Quality engineering ensures that projects, products, or services meet specified standards. It includes monitoring, testing, control, and taking corrective actions to identify and rectify defects or deviations from quality criteria. The objective is to produce reliable and accurate results, minimize issues, and continually enhance the quality of a given output [
31]. Usually, quality control is linked with the information provided by a device or manually by humans. Using multiple sensors in industrial environments could benefit quality control in production lines. These benefits include the use of data analytics to detect possible issues in the whole process, the simulation of physical production through real-time data, and higher levels of worker engagement [
31].
This work uses quality control techniques to inspect any sensor deviation. After obtaining the limits of normal operation, the samples from a sensor’s wavelets are inspected to determine whether they are exhibiting normal behavior [
32].
This paper is organized as follows:
Section 1 provided a theoretical background on IoT applications, sensor faults, quality control, anomaly behavior analysis, and wavelets.
Section 2 details the proposed methodology for monitoring sensor functionality.
Section 3 presents the experimental results, and
Section 4 offers conclusions and future work directions.
3. Results
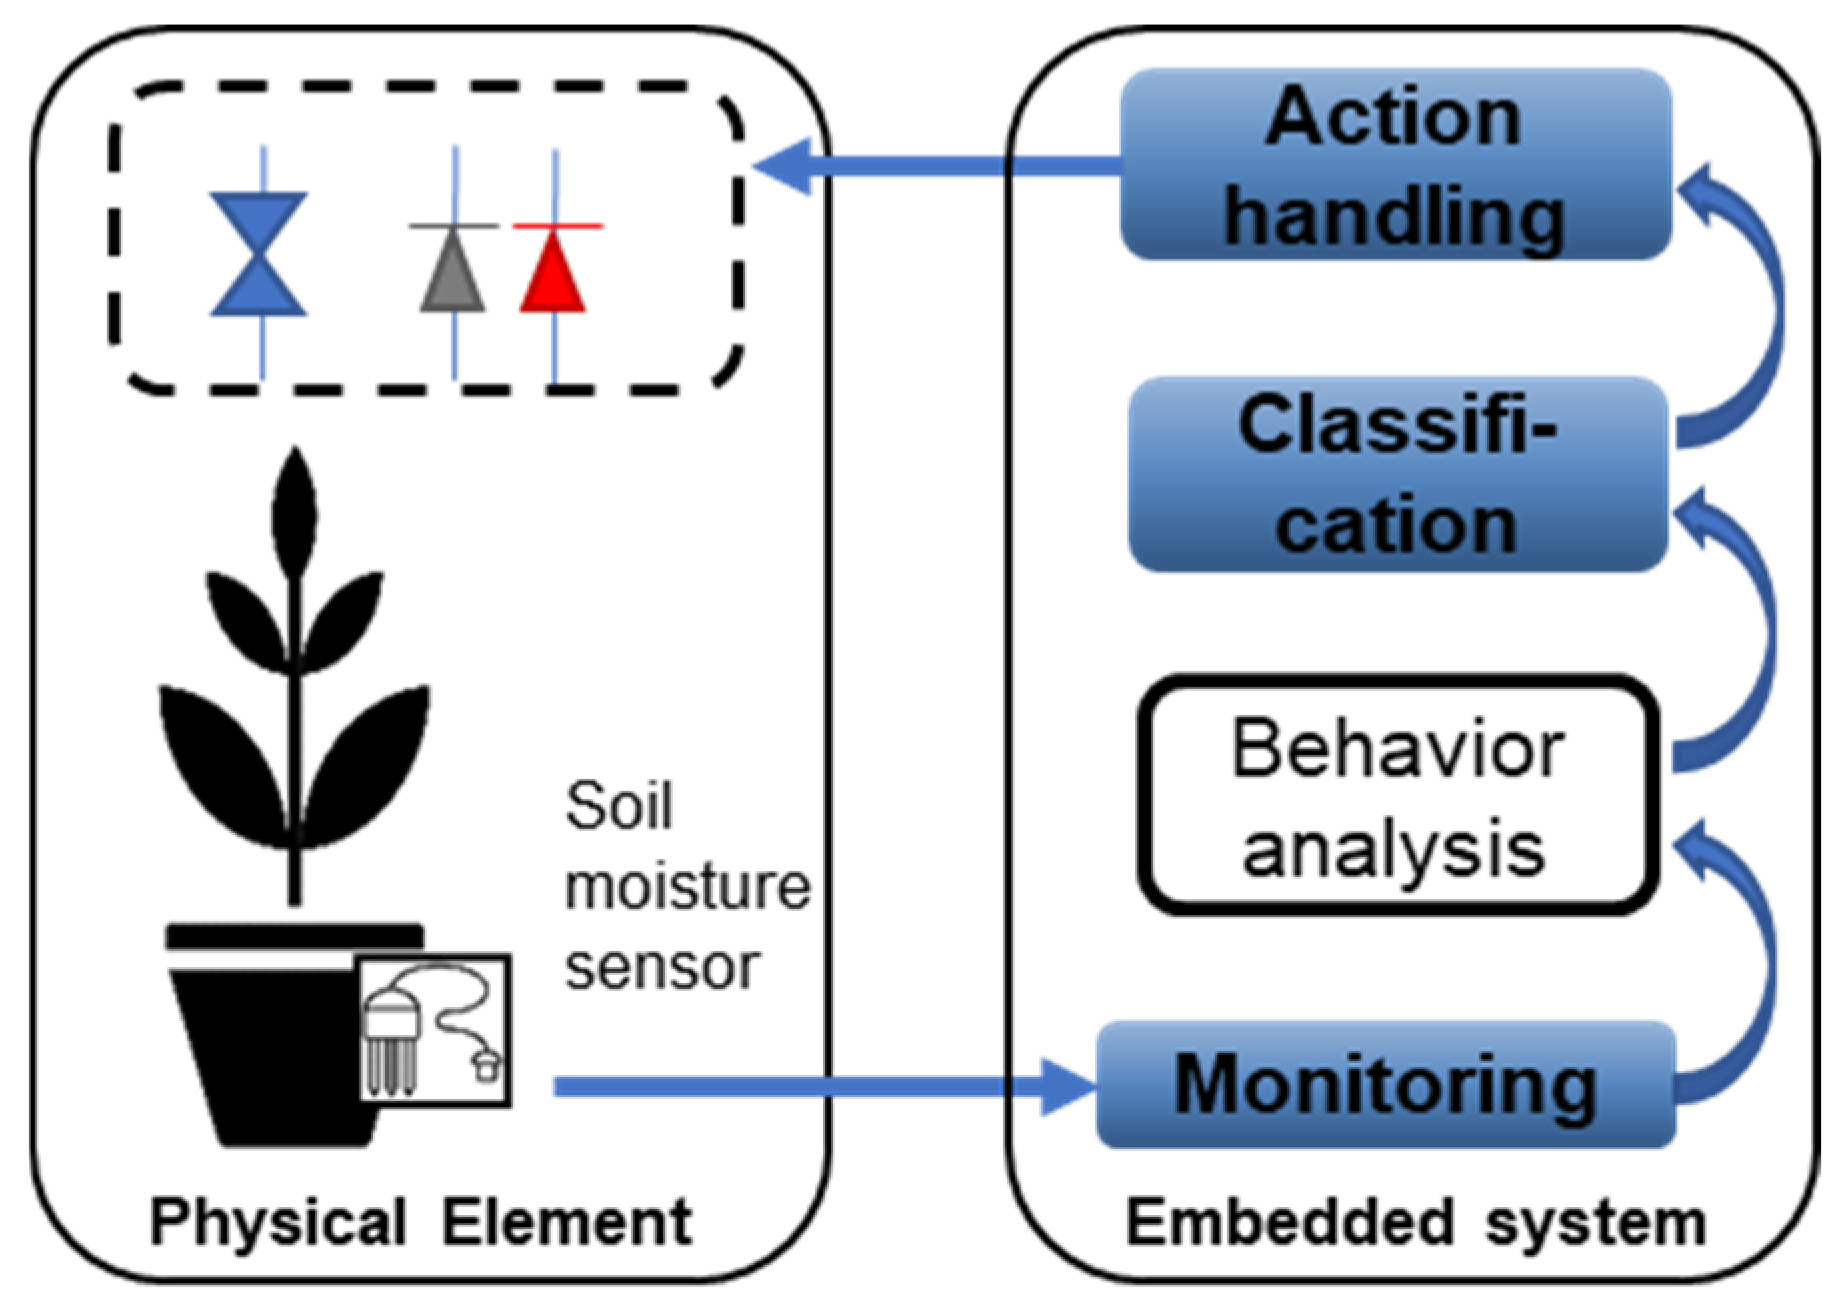
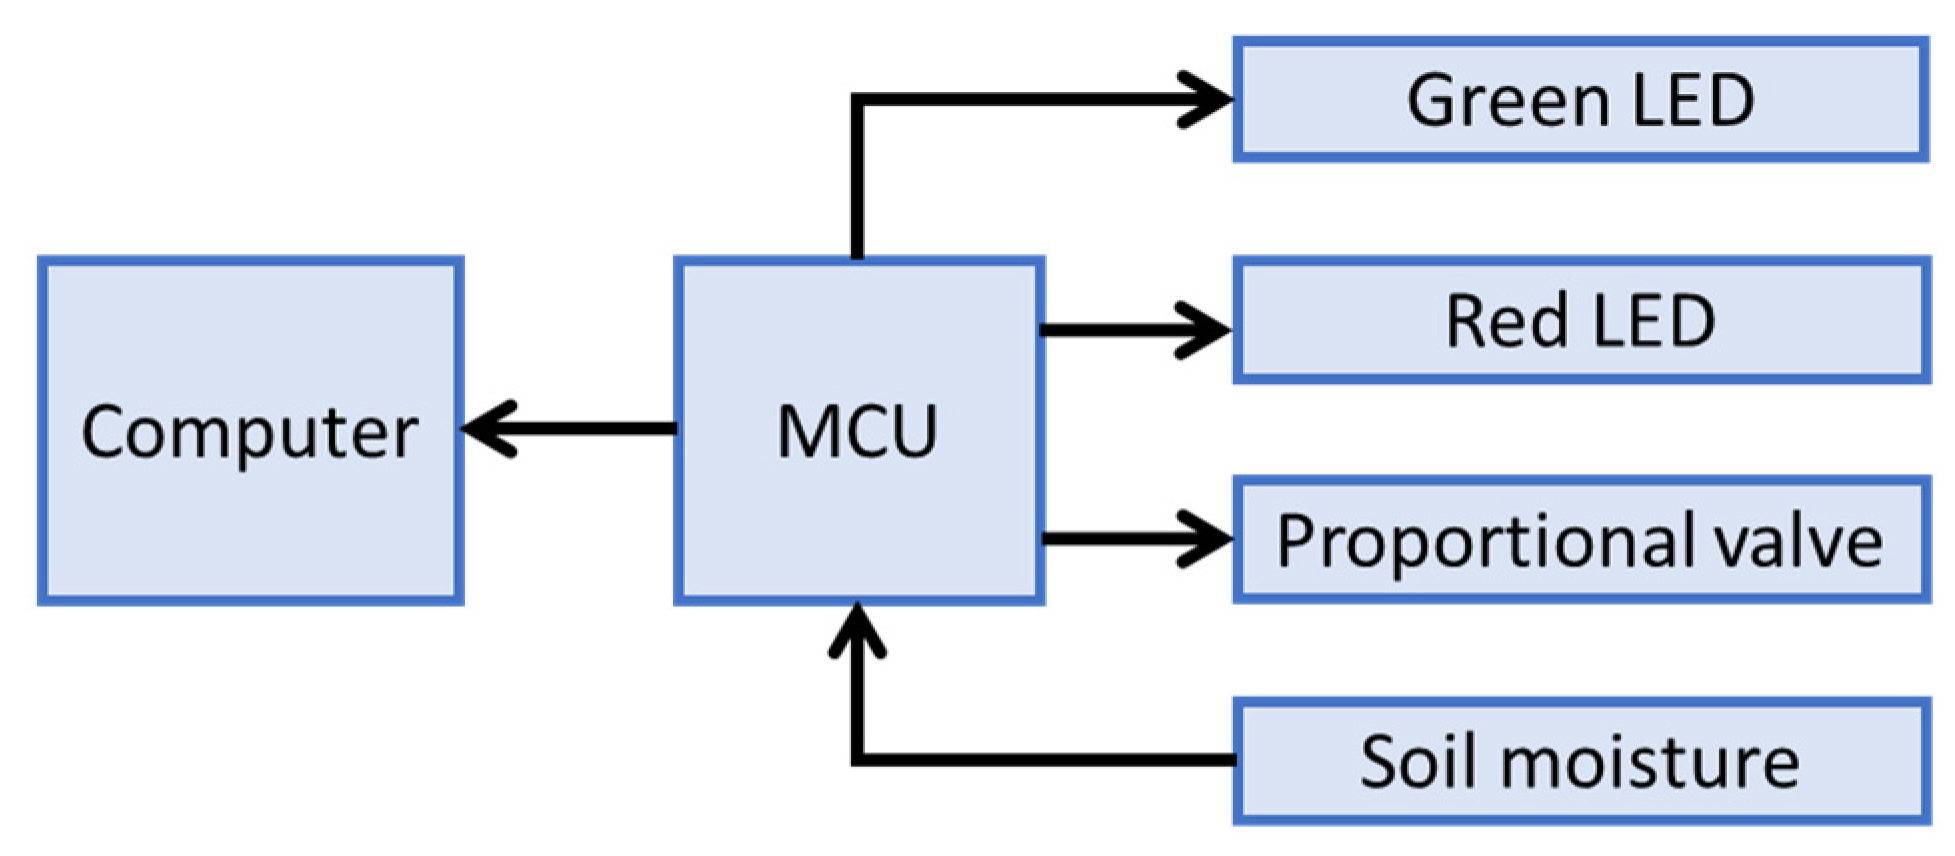
The system architecture illustrated in
Figure 4 was utilized to implement the proposed approach. It is a basic communication network consisting of three primary components: a computer, an embedded system, and a set of sensors and actuators.
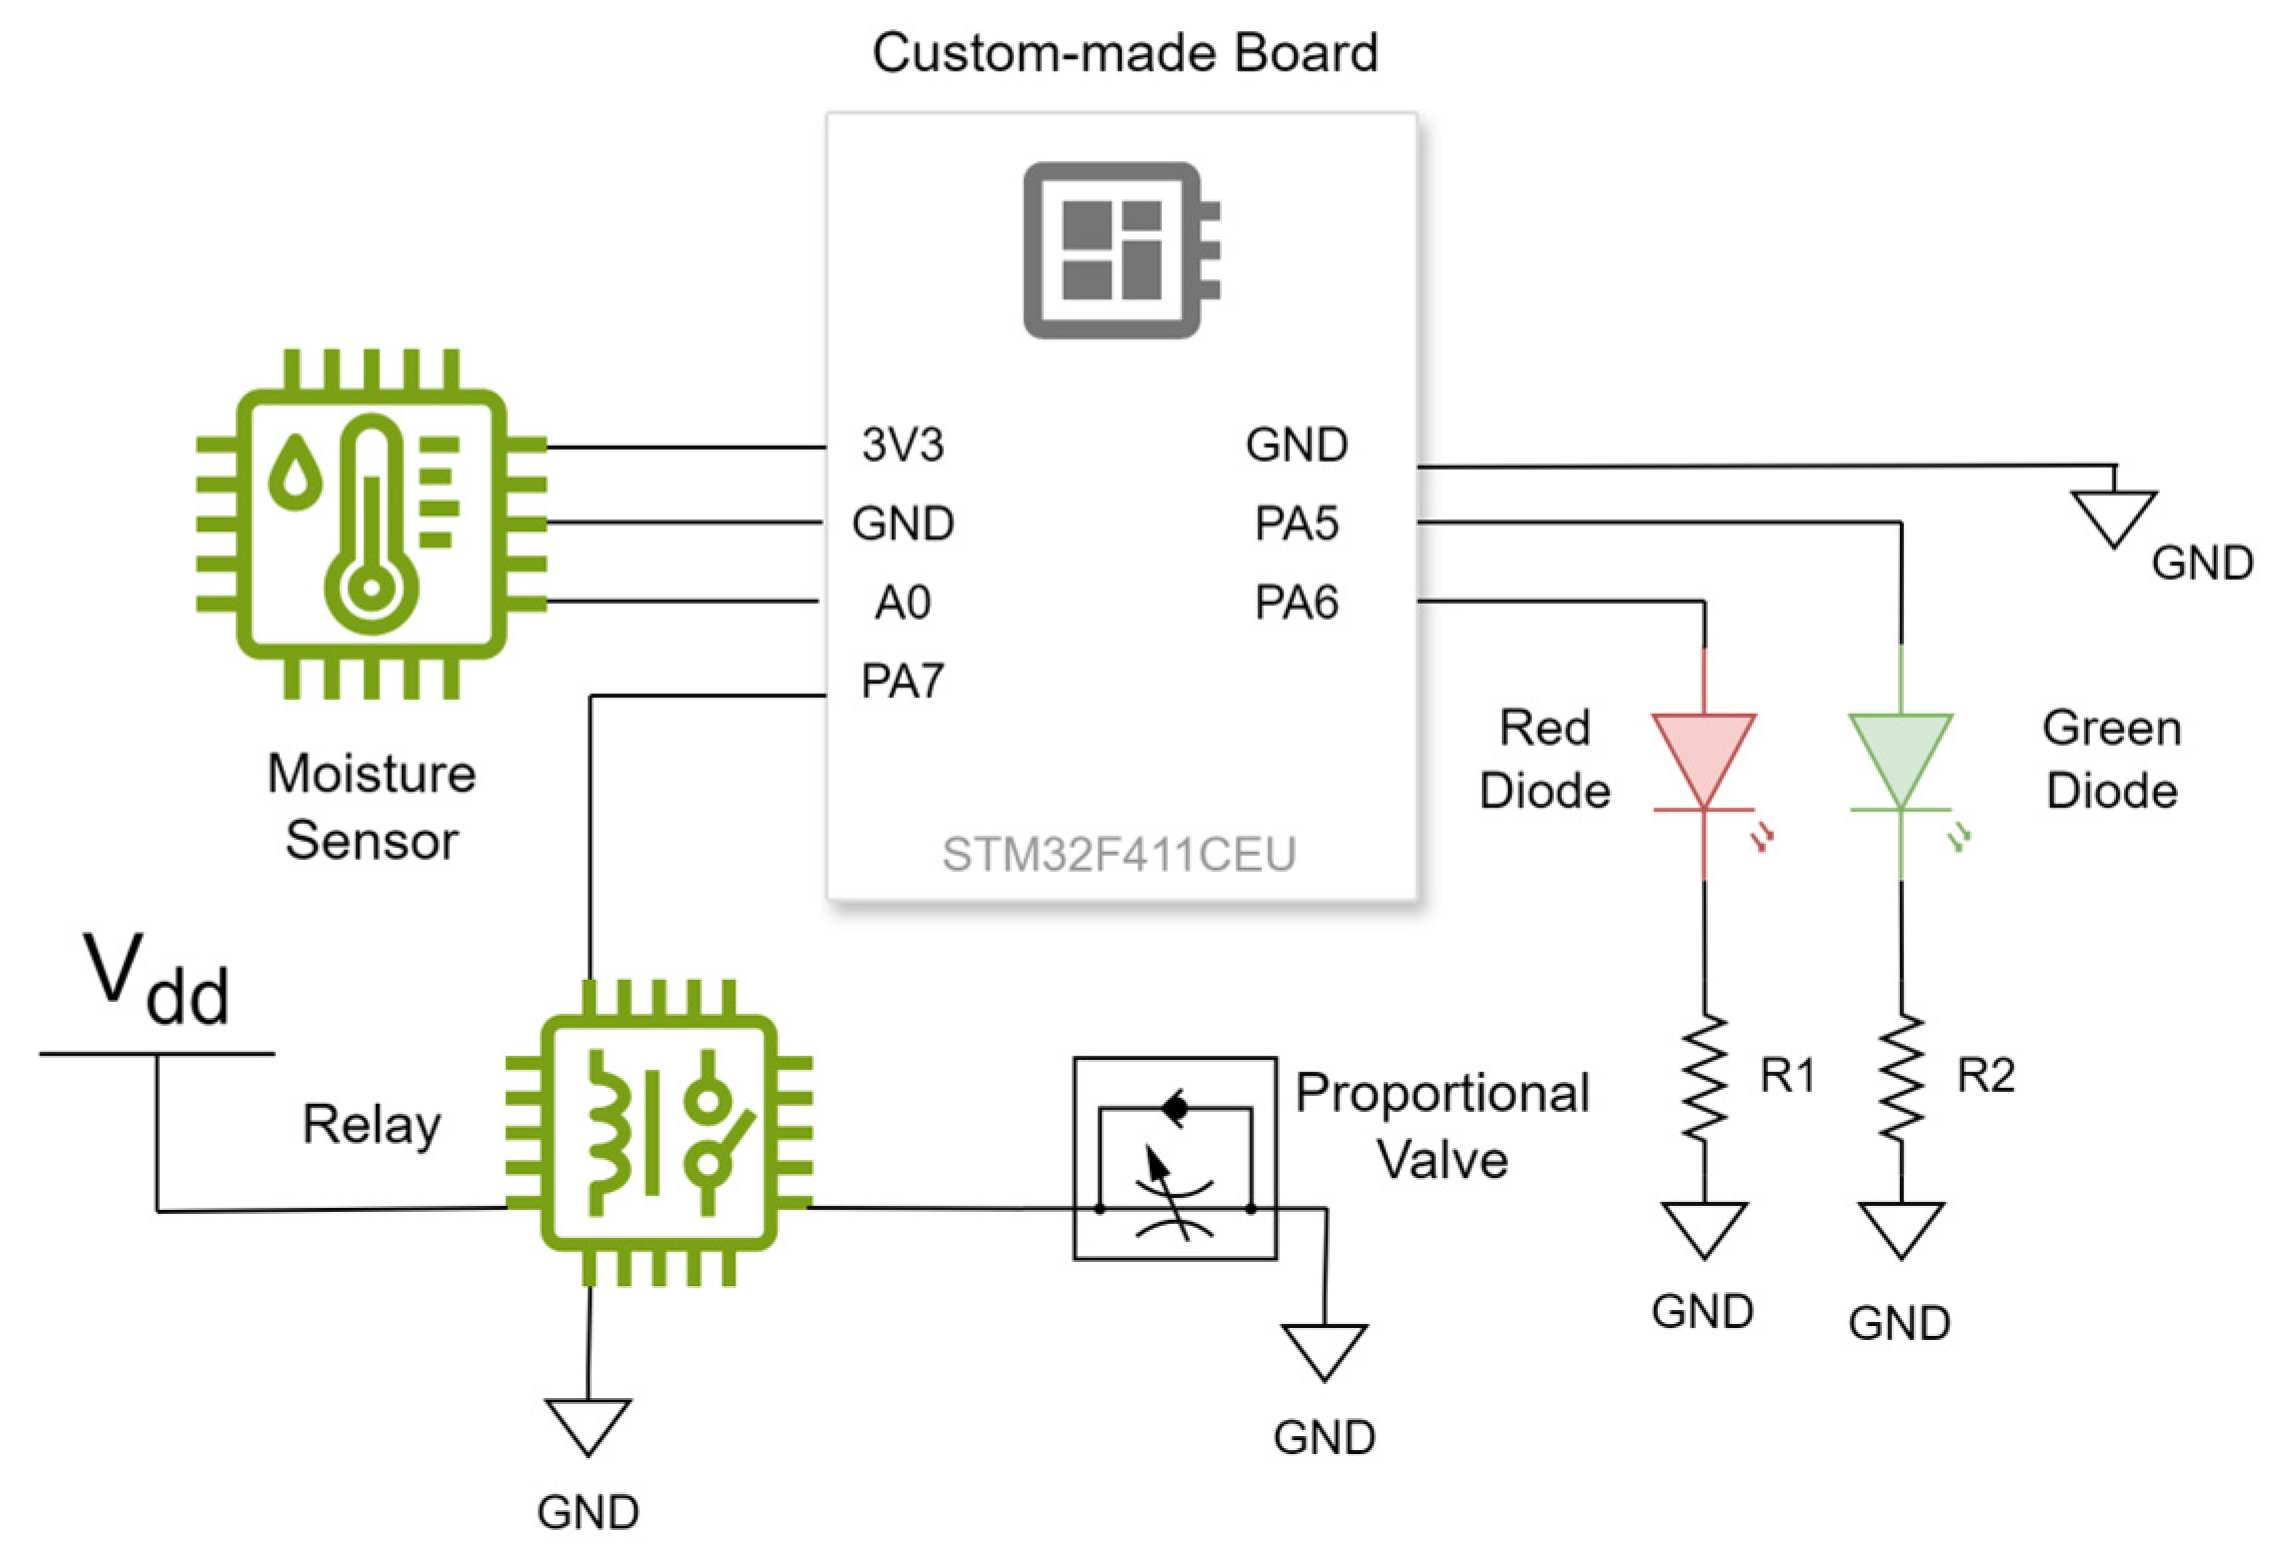
Figure 5 shows the testbed for the proposed approach. It includes a 32-bit microcontroller embedded in a custom-made board, which is connected to a soil moisture sensor using the sensor pinout: the analog output (AO), the ground (GND), and the voltage input (VCC). Pin A0 in the microcontroller was set as an analog input, while pins D1 and D0 were set as TX and RX connectivity pins, respectively. The sensor data were received using Algorithm 1, executed in a loop.
| Algorithm 1: Transmitting data through microcontroller |
Input: Raw analog values coming from sensor.
Output: Soil moisture percentage.
1. for k = 1 to 32 do
2. Analog-to-digital conversion of input
3. Digital value is stored as part of an array.
4. end for
5. for k = 1 to 32 do
6. Print value stored in the array.
7. end for |
In Algorithm 1, incoming data are converted from analog to digital values and stored in a 32-element array. After that, these 32 elements are printed from the first to the last. The printed values are then received and plotted using Algorithm 2.
| Algorithm 2: Receiving data from microcontroller |
Input: Printed digital value from 0 to 1023.
Output: Plotted soil moisture values.
1. for k = 1 to 32 do
2. Convert digital value to soil moisture percentage.
3. end for
4. plot values |
Algorithm 2 receives and splits the array the microcontroller sends into 32 values. Each value is multiplied by (100/1023) and subtracted from 100. This process converts each value from 0 to 1023 into a moisture percentage ranging from 0% to 100%. In this conversion, 100% represents the maximum moisture, and 0% represents the minimum moisture.
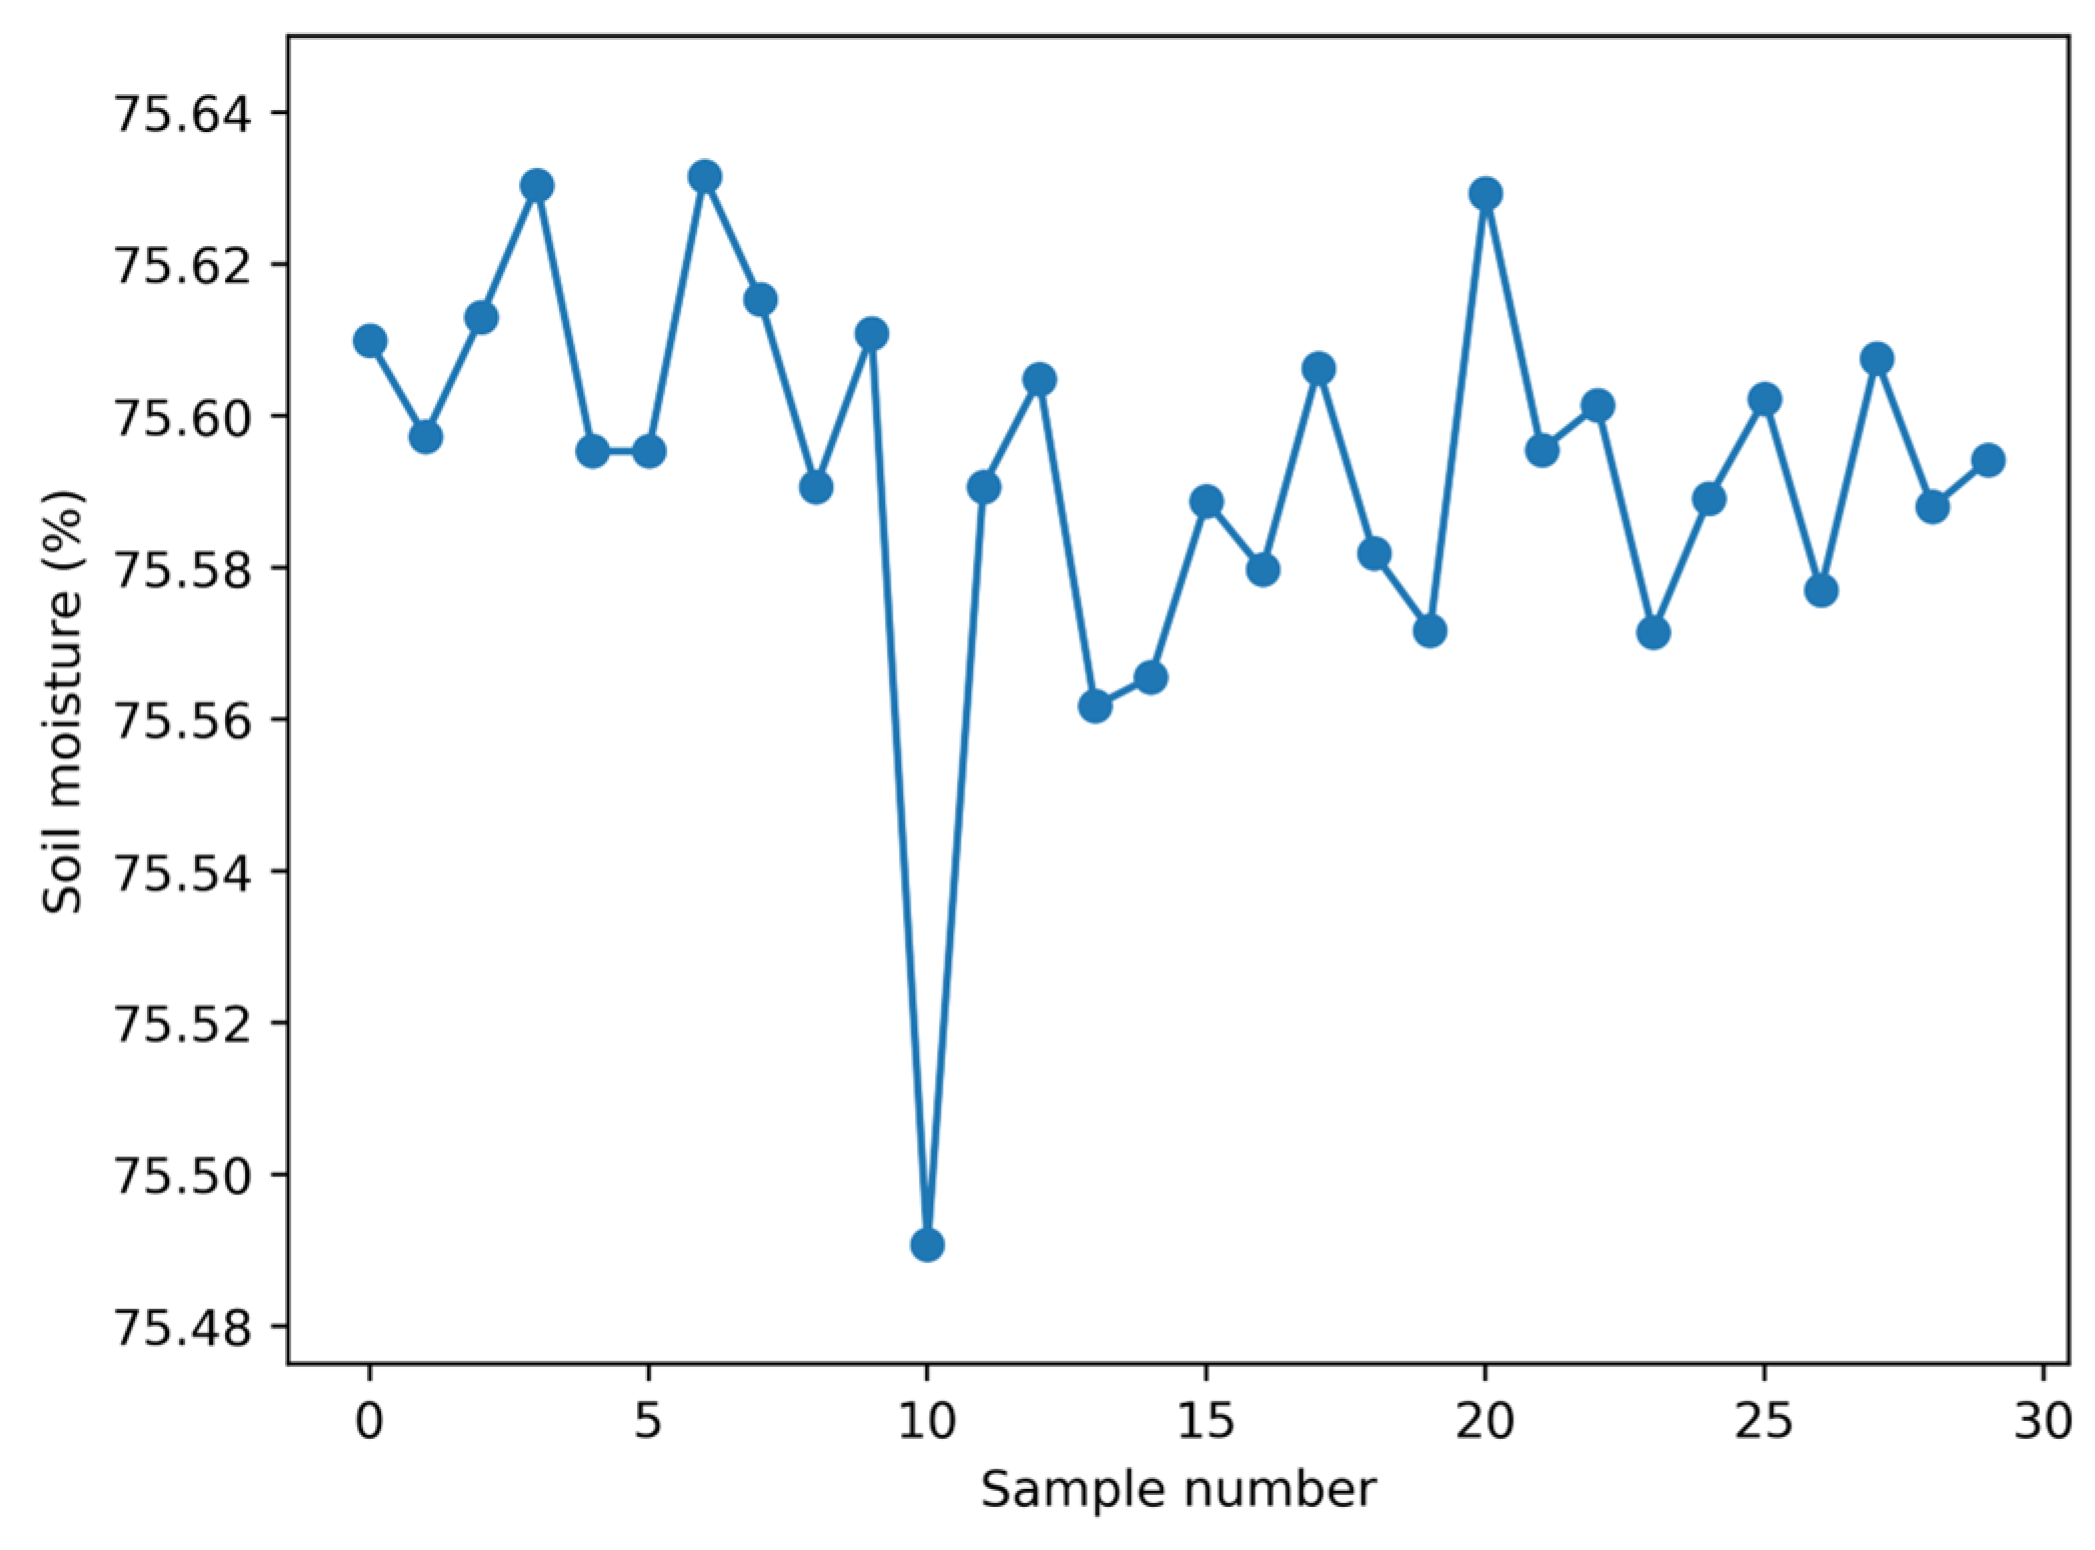
Figure 6 displays the plot created using Algorithm 2. This plot illustrates normal moisture levels measured immediately after moderate plant watering.
Also, to evaluate the sensor behavior, the Euclidean distances of the Haar DWT were calculated and plotted for ten 1-D 8-element arrays. Algorithm 3 summarizes the steps used to obtain these distances. This process involves creating a 1-D wavelet pattern and a set of additional wavelets of the same dimension.
| Algorithm 3: Computing of Euclidean distances between DWTs |
Input: Soil moisture percentage
Output: Euclidean distance between pattern and calculated wavelets
1. for k = 1 to 8 do
2. A soil moisture value is stored in an 8-element array.
3. end for
4. Approximation and detail coefficients are calculated for the pattern wavelet.
5. for k = 1 to 10 do
6. for k = 1 to 8 do
7. A soil moisture value is stored in an 8-element array.
8. end for
9. Approximation and detail coefficients are calculated for the wavelet.
10. Euclidean distance between the pattern and current wavelet is calculated.
11. Euclidean distance is printed.
12. end for |
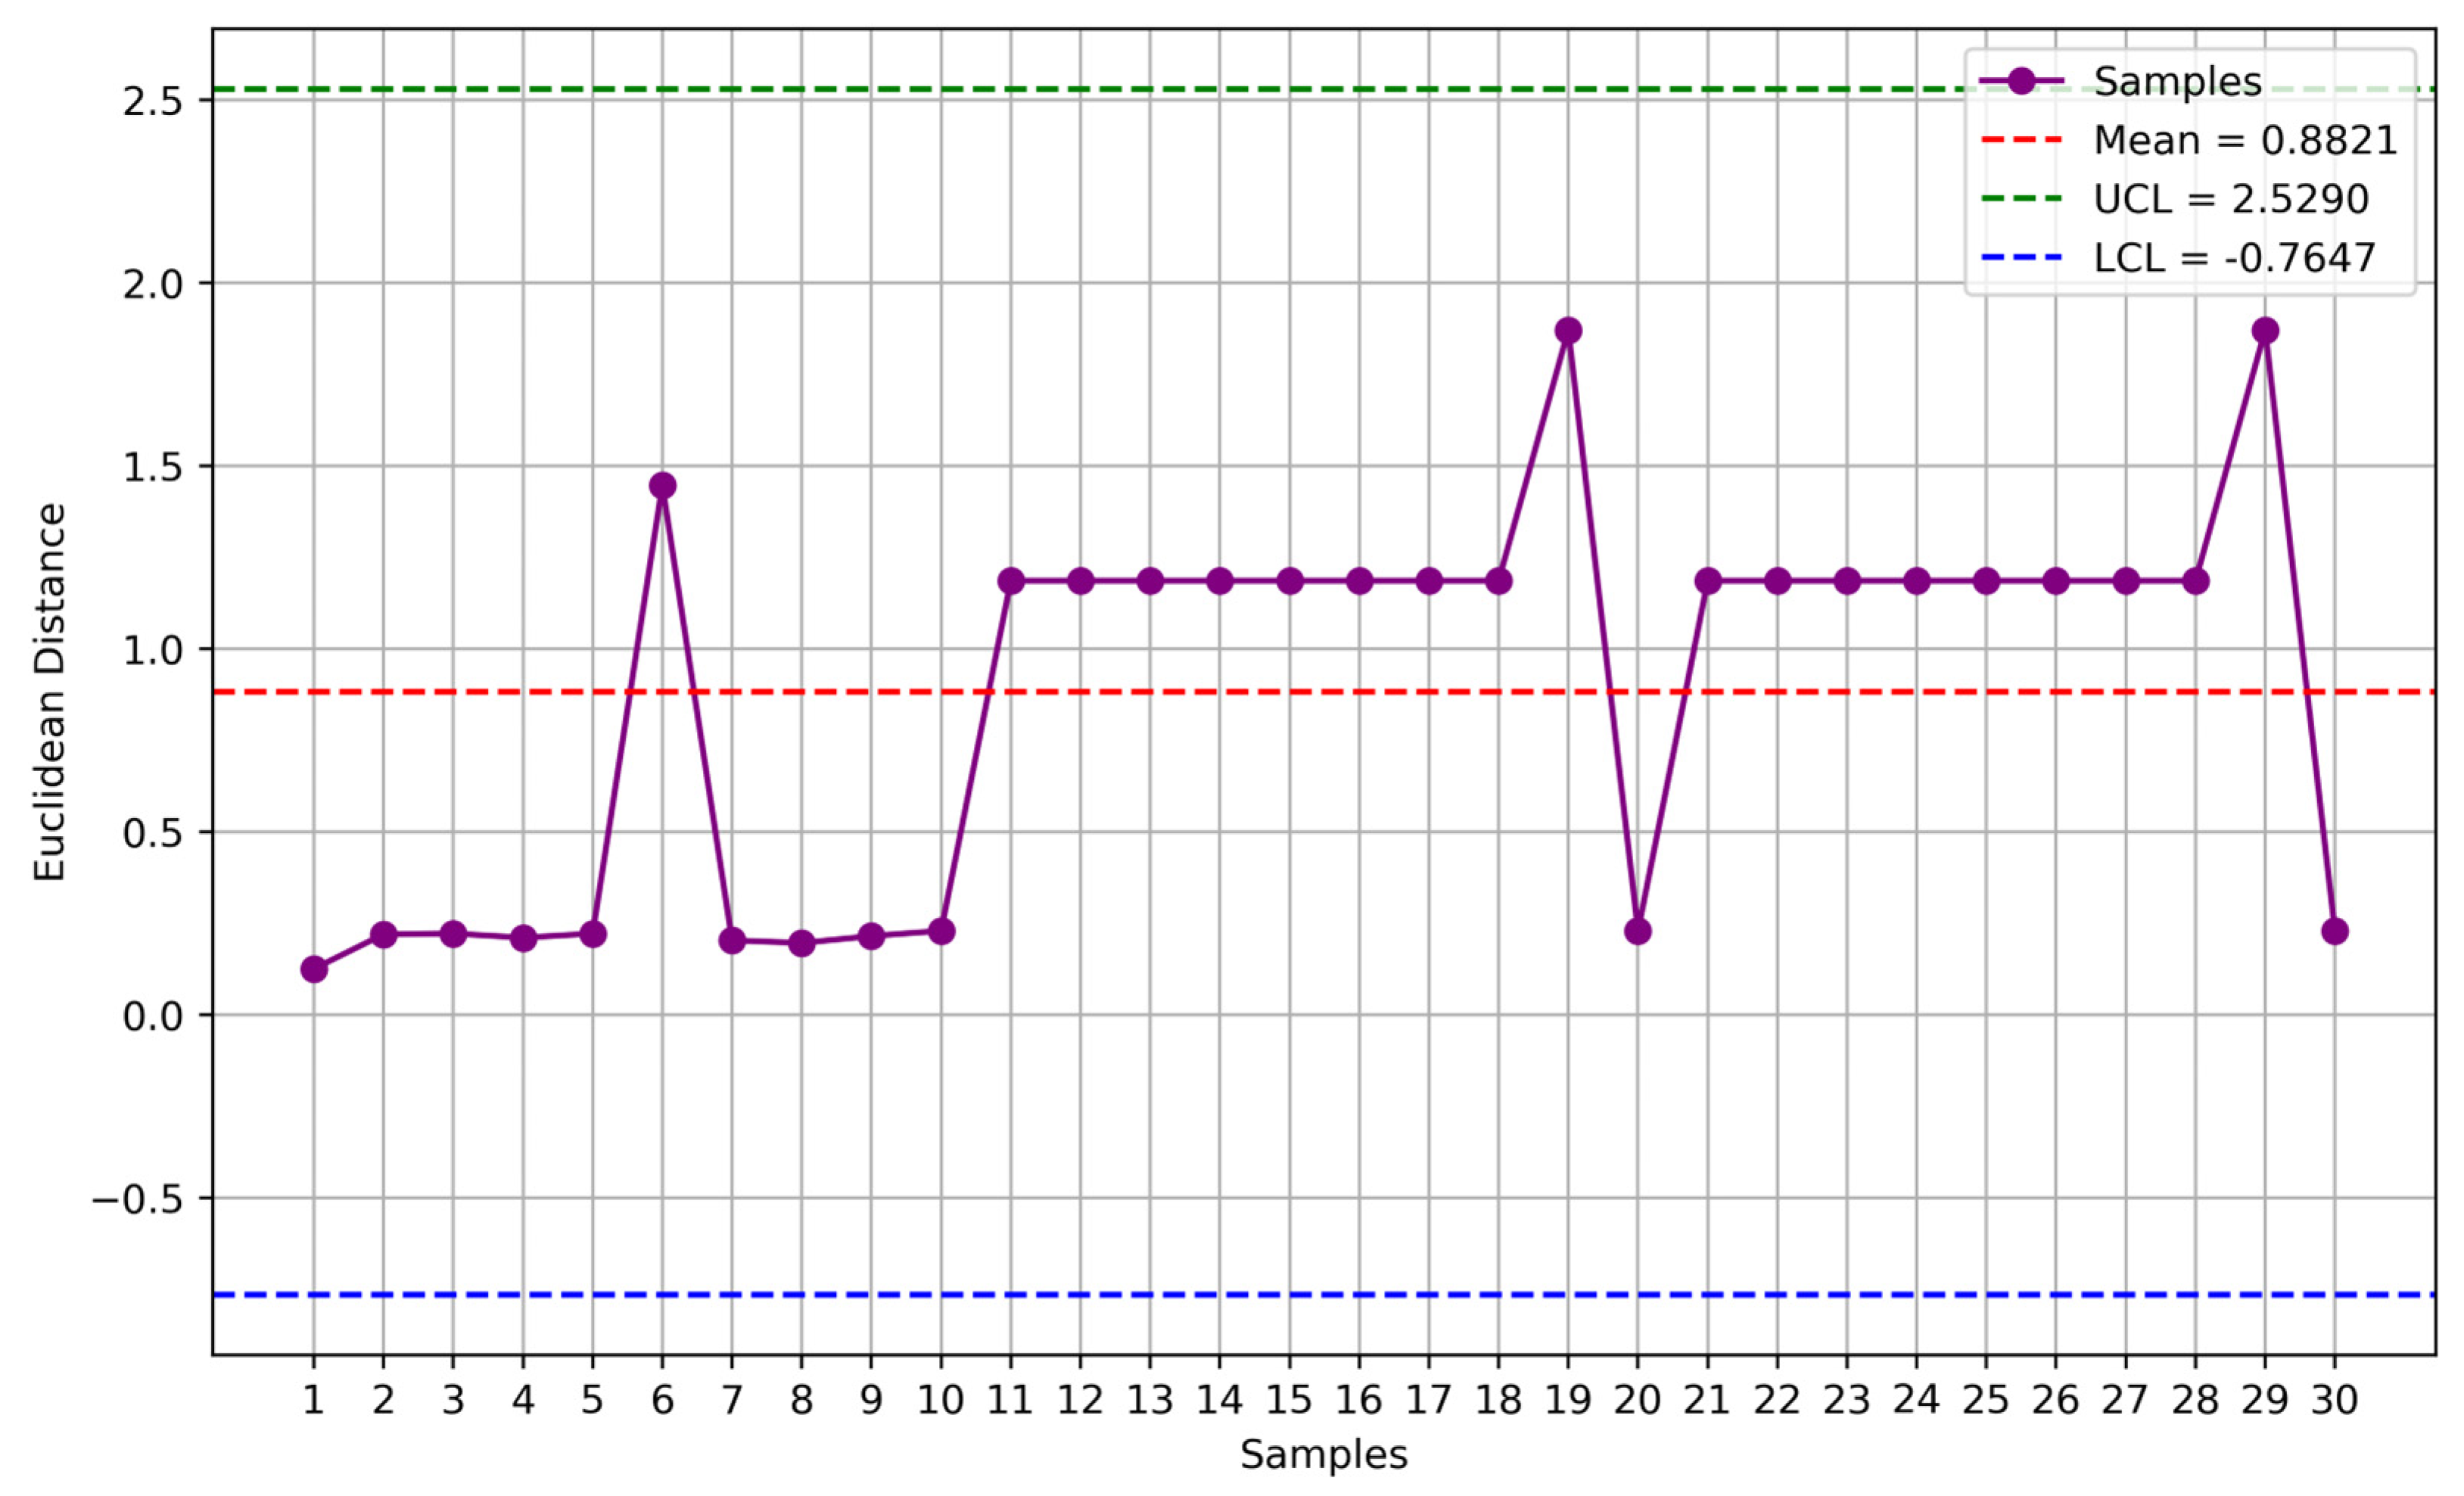
Figure 7 depicts a plot of the 30 Euclidean distances calculated using Algorithm 3. In the plot, all the values fall within the range defined by
(green and blue lines), referred to as control limits: Upper Control Limit (UCL) and Lower Control Limit (LCL). This outcome suggests that the sensor accurately measures stable moisture levels, indicated by the activation of a green LED. However, if the results fall outside these control limits, a red LED is activated, and the plant watering valve will close to allow for sensor replacement or repair. These procedures are summarized in Algorithm 4.
| Algorithm 4: Sensor element activation |
Input: Euclidean distance between wavelets.
Output: Signal to activate led and modify valve closing.
1. if
2. turn green LED on
3. else if
4. turn red LED on
5. close valve
6. end if |
Figure 7 illustrates that all recent measurements fall within the three-sigma limits from the mean, indicating minimal deviation from the mean and, thus, the correct functioning of the sensor.
Once normal behavior has been identified, the next step is to manipulate the sensor to confirm its capability to detect issues.
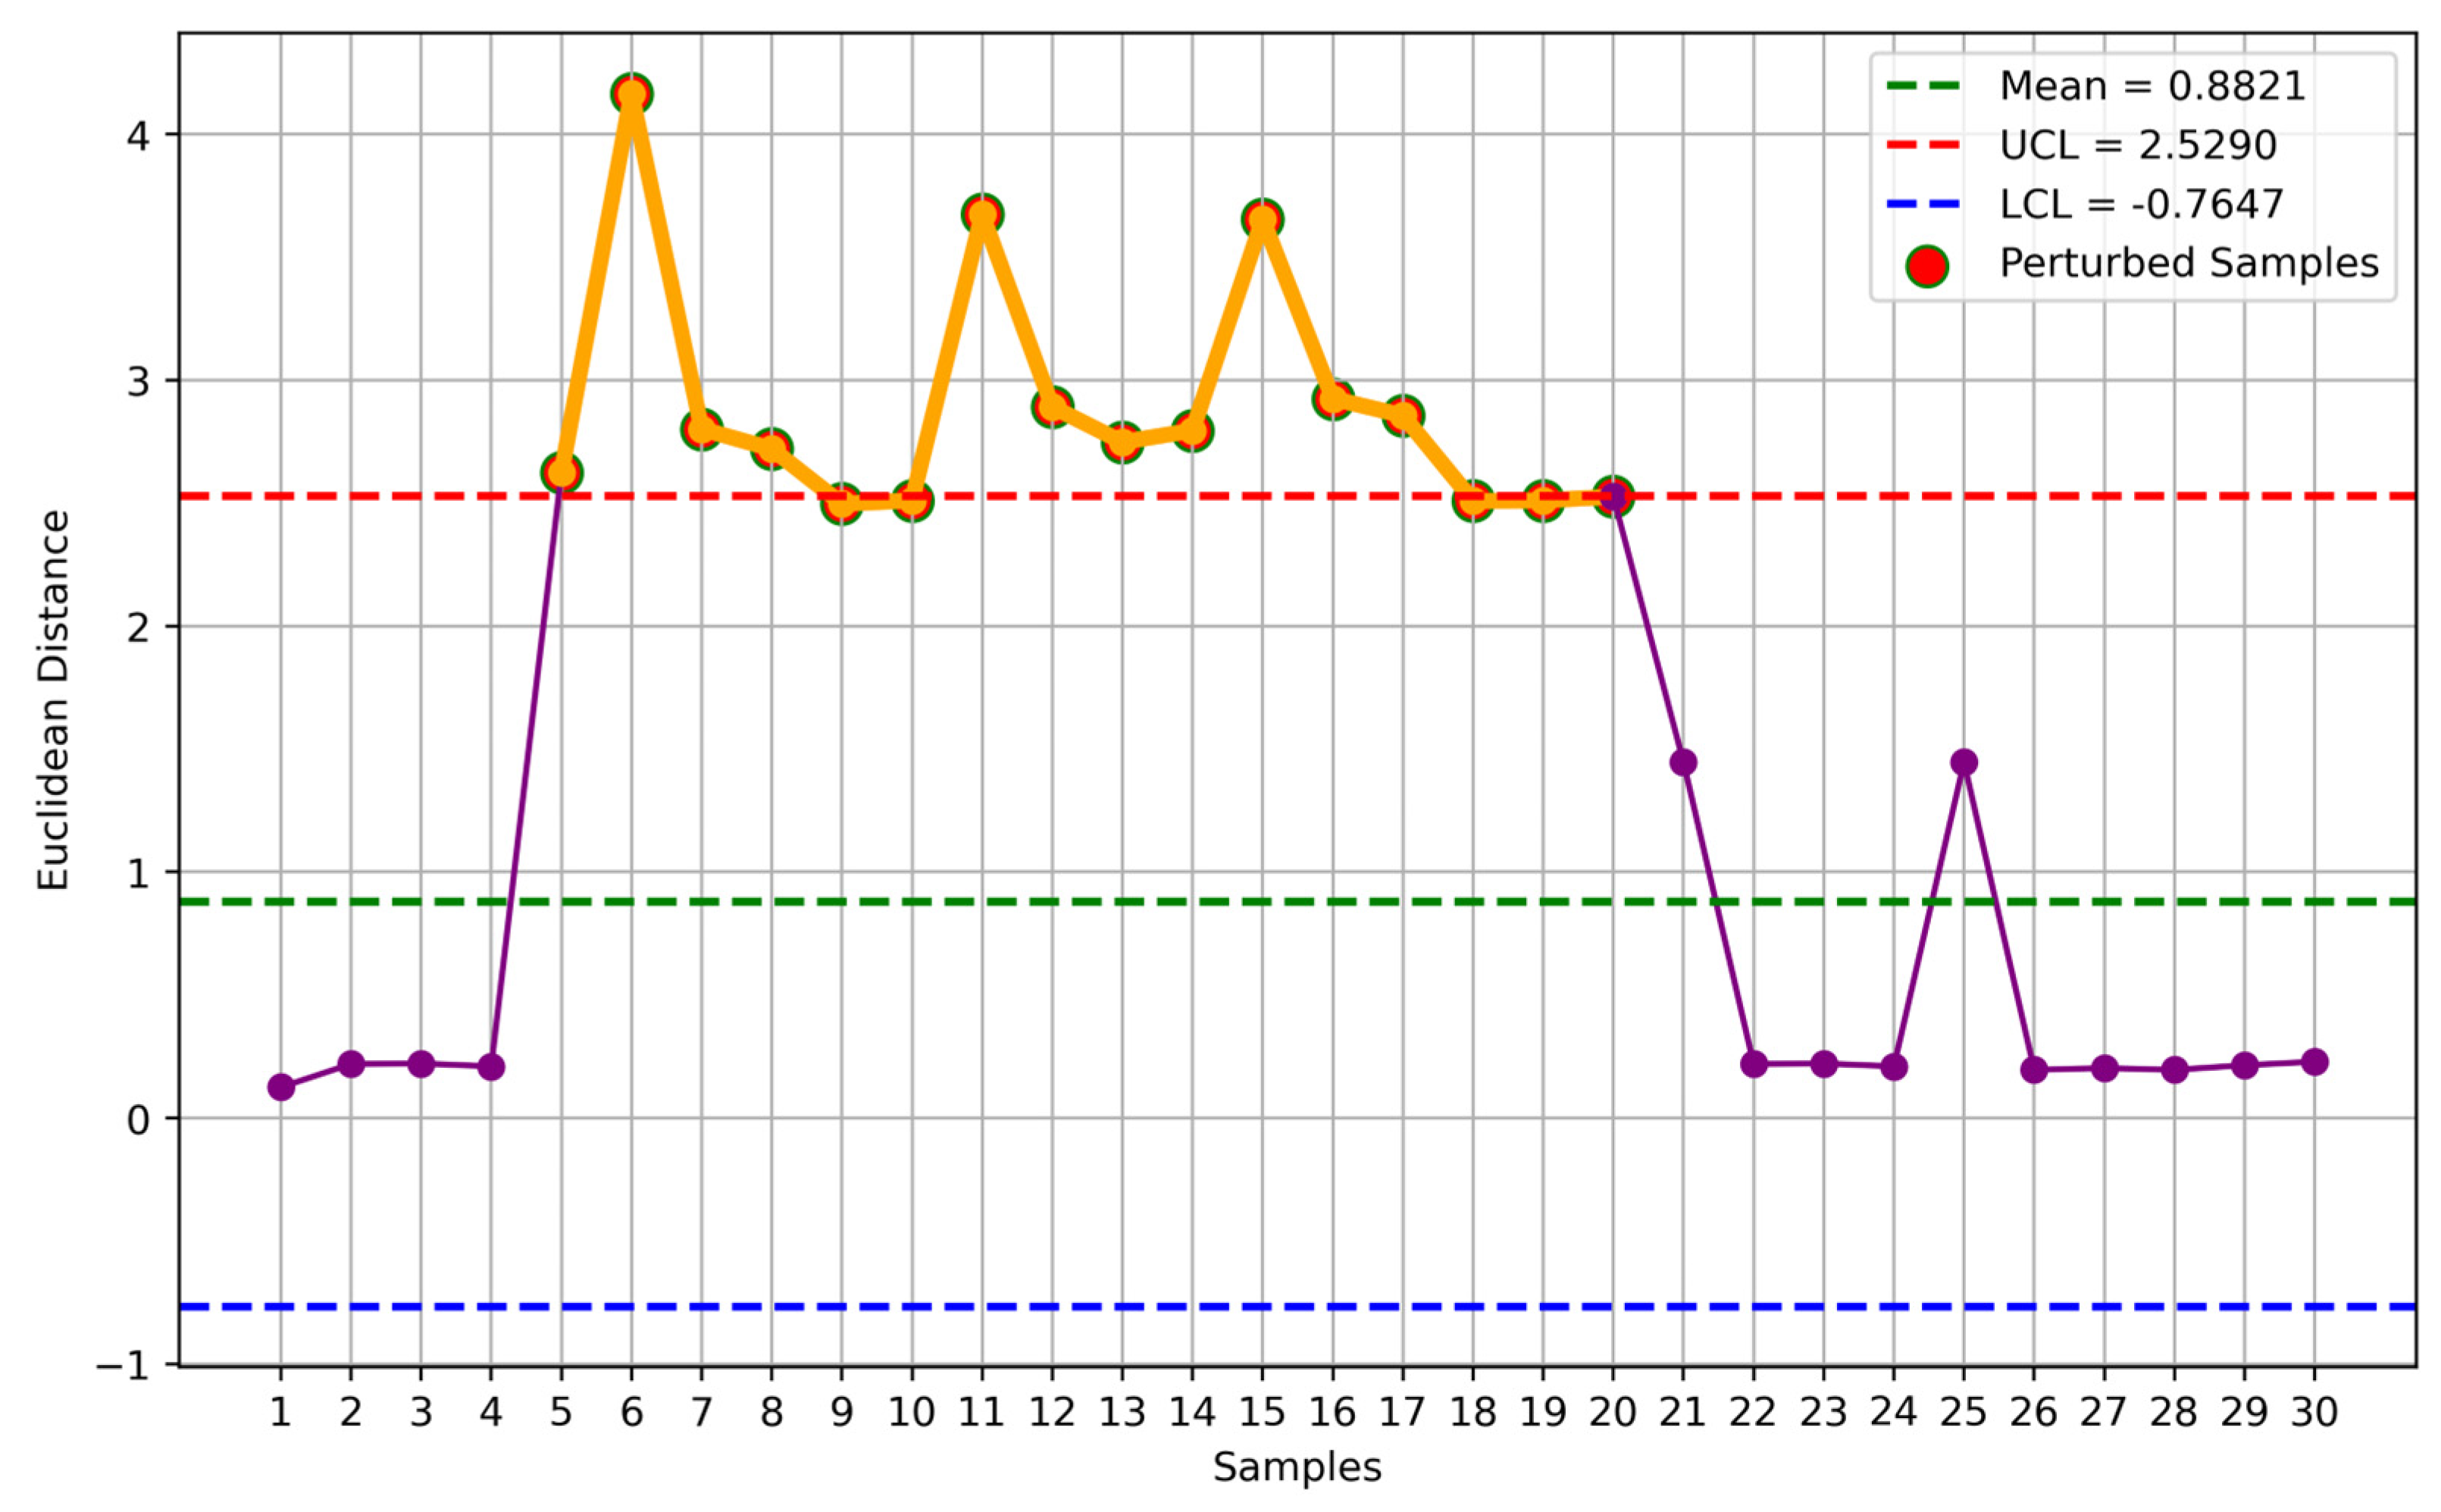
Figure 8 provides a crucial evaluation of the wavelet-based anomaly detection system by comparing normal and abnormal sensor behaviors using Euclidean distance metrics derived from DWT coefficients. The figure illustrates 16 data points out of control limits. It also illustrates the differences in Euclidean distances between the wavelet-transformed data of normal sensor operations and those subjected to induced perturbations, simulating real-world faults. As can be seen, the Euclidean distances for normal sensor behavior are shown to consistently fall within the established control limits, typically defined as the mean (
) plus or minus three standard deviations (
). These control limits act as thresholds to distinguish between normal and abnormal operations. The data points representing normal behavior remain well within these boundaries, indicating stable sensor performance under standard conditions. Conversely, the abnormal data points, which are introduced through perturbations such as altering the sensor’s position or adding external noise, exhibit significant deviations from the normal range. These deviations result in Euclidean distances that fall outside the control limits, effectively triggering the anomaly detection mechanism. This separation between normal and abnormal data points underscores the system’s sensitivity to deviations and its capability to detect anomalies, even when the perturbations are relatively subtle. The distinct separation of normal and abnormal behaviors in the Euclidean distance space highlights the system’s high sensitivity and specificity in anomaly detection. The abnormal points show a wide spread beyond the control limits, suggesting that the system is capable of distinguishing various types of anomalies, such as gradual drifts and abrupt faults. This behavior pattern analysis is valuable, as it allows the system to classify the nature and severity of sensor faults, enhancing its fault isolation capabilities.
The implications of these findings for real-time monitoring are significant. The wavelet-based approach demonstrated in
Figure 8 allows for the rapid detection of deviations, enabling timely responses to potential faults in embedded systems. This capability is essential for maintaining system integrity and preventing erroneous data propagation, which could lead to broader operational failures. The results confirm that the wavelet-based method is robust and effective for real-time anomaly detection, making it a valuable tool for enhancing the reliability and security of embedded sensor systems.
To compare the presented method against others in the literature, false sensor data injection was implemented by altering the moisture sensor’s signal to simulate erroneous data, thereby challenging the system’s ability to distinguish between genuine and manipulated sensor outputs [
33]. This procedure involved injecting false data directly into the sensor’s analog signal path using a variable resistor or an external signal generator to superimpose incorrect readings onto the actual sensor data. This method replicated common sensor faults, such as drift, bias, or abrupt deviations, providing a realistic scenario to assess the effectiveness of the anomaly detection framework. Across over 1000 datapoints of injection, the DWT combined with Euclidean distance metrics was particularly effective in detecting this false data injection, achieving a detection rate of up to 93%, capturing both transient and persistent characteristics of the injected false data. Considering the metrics introduced in [
33], where the best-case scenario for false sensor data injection reached a 96% detection rate, the results appear to outperform our proposed approach. However, the high accuracy was achieved using a Support Vector Machine, which is not optimized for resource-constrained environments such as the STM32F411. Additionally, DWT’s computational efficiency makes it ideal for real-time monitoring on resource-constrained embedded systems, ensuring the prompt detection and isolation of faults or false data injections.
After conducting a thorough review of the state of the art in the field of anomaly detection, specifically in applications that are implementable and applicable in embedded systems, we found a limited number of works that directly address this area. Most of the existing research either focuses on computationally expensive algorithms or simulation-based studies that are not directly comparable to our approach, which emphasize real-time implementation in resource-constrained environments.
However, four references were identified [
34,
35,
36,
37], that are closely related to our proposed approach. To aid in making a meaningful comparison, a comparison matrix (see
Table 1) was designed to contrast our approach with these selected studies using both qualitative and quantitative characteristics. The comparison addresses aspects such as main focus, anomaly detection methods, detection accuracy, resource consumption, control strategy, and real-time applicability. This structured comparison provides insights into how our approach differs and highlights the novelty and practicality of our system for real-time anomaly detection in embedded systems. In
Table 1, the following acronyms are used:
DWT: Discrete Wavelet Transform.
CNN: Convolutional Neural Network.
PCA: Principal Component Analysis.
WNN: Wavelet Neural.
ML: Machine learning.
ED: Euclidean distance.
Based on
Table 1, much of the current literature on anomaly detection relies on simulations or computationally intensive algorithms that are hard to validate in real-world applications due to their complex nature. These approaches often require significant industrial infrastructure changes, which are not practical or recommended for existing processes. On the other hand, our approach focuses on lightweight computational solutions that can be implemented on readily available yet powerful embedded systems, such as 32-bit microcontrollers.
Using 32-bit microcontrollers and a custom-based PCB design, the proposed approach reduces computational overhead and facilitates seamless integration into existing industrial processes. This makes deploying and evaluating our system in real-world settings significantly easier, avoiding the limitations of solutions confined to research platforms or simulations.
In the anomaly detection community context, the proposed wavelet anomaly detection scheme represents an alternative to deploying anomaly detection solutions. It emphasizes real-world applicability by providing a solution that can be deployed in real-time on actual industrial systems rather than remaining theoretical or experimental. This practical focus distinguishes our work and addresses a gap in the literature where many solutions are not easily translatable to operational environments.
4. Discussion and Conclusions
In this paper, we have demonstrated that it is highly effective to continuously monitor the behavior of a soil moisture sensor by employing advanced techniques such as discrete wavelet transform (DWT) together with Euclidean distances. These methods enable us to detect subtle changes in sensor performance, ensuring that any deviations from optimal functionality are identified and addressed. By maintaining the sensor’s accuracy and reliability, we can provide a precise and responsive system that consistently meets the moisture needs of plants.
Compared with machine learning techniques like SVMs and neural networks, which require extensive computational resources, DWT+ED is computationally efficient and suitable for real-time applications on resource-constrained devices like microcontrollers. The Haar wavelet allows for fast signal decomposition, and the simple calculation of Euclidean distance quantifies deviations effectively, achieving up to a 93% detection accuracy. This balance of performance and low computational overhead highlights the novelty and practicality of the DWT+ED approach for embedded systems.
It is also important to explore the integration of the wavelet-based anomaly detection system into diverse real-world scenarios beyond the current setup. Potential applications include industrial automation, where real-time fault detection in critical sensors could prevent costly downtime, and smart healthcare, where monitoring patient vitals with embedded sensors could enhance patient safety by promptly identifying anomalies. Additionally, expanding the system’s capabilities to handle multi-sensor environments would significantly enhance its robustness, allowing it to process data from various sources such as temperature, humidity, or pressure sensors simultaneously. For future research, exploring the use of advanced wavelet transforms, such as continuous wavelet transforms (CWT) or adaptive wavelets tailored to specific signal characteristics, could further improve the detection accuracy and adaptability of the system.
While exploring the integration of machine learning techniques, such as neural networks or reinforcement learning, offers promising avenues for dynamically adjusting detection thresholds and enhancing decision-making under evolving conditions, further experimental validation is crucial for a comprehensive evaluation. There is an open area to conduct additional experiments such as injecting faults, tampering with sensors, or executing sophisticated cyber-attacks like Denial of Service (DoS) and impersonation attacks. Future work should aim to include these types of tests to fully assess the robustness and applicability of the proposed approach in real-world scenarios, thereby further strengthening its performance and resilience in complex, dynamic environments.


