1. Introduction
With the rapid development of the oil industry, more waste drilling fluids are being generated at drilling sites, and these waste drilling fluids will undoubtedly have a huge impact on the marine and terrestrial environments [
1,
2,
3]. During the drilling of oil and gas wells, there are two main types of wastes produced: one is drill cuttings and the other is drilling fluid. Therefore, the recycling of drill cutting mud containing waste drilling flu-ids generated during the drilling process can greatly reduce the impact of environmental pollution caused by drilling, save mud materials, and reduce drilling costs [
4]. Drill cut-tings and mud are important waste products in drilling operations [
5,
6]. Up to now, the most widely used drilling mud treatment method is the reinjection method, but for some inland seas, such as China’s Bohai Sea, the discharge in these seas will be subject to strict requirements, only the use of the waste liquid recycling method of drilling mud within the liquid phase of the treatment, also known as the reduction of drilling cuttings containing liquid. International researchers have carried out much research on both improving the capacity of solid control equipment and equipping reduction and treatment devices to solve the challenges of drilling waste disposal. In recent years, with the continuous improvements in drilling fluid systems, the capability of rock cutting solid control equipment and the development of treatment devices to reduce the fluid content of drill cuttings have also been significantly improved. Next, the current status of research on screw conveyor and negative pressure suction technology will be presented separately.
Screw conveyors are one of the best conveying systems for specific applications [
7], such as in the chemical, building materials, and grain industries. Screw conveyors can be used to transport and mix more than one type of material during material transfer [
8,
9,
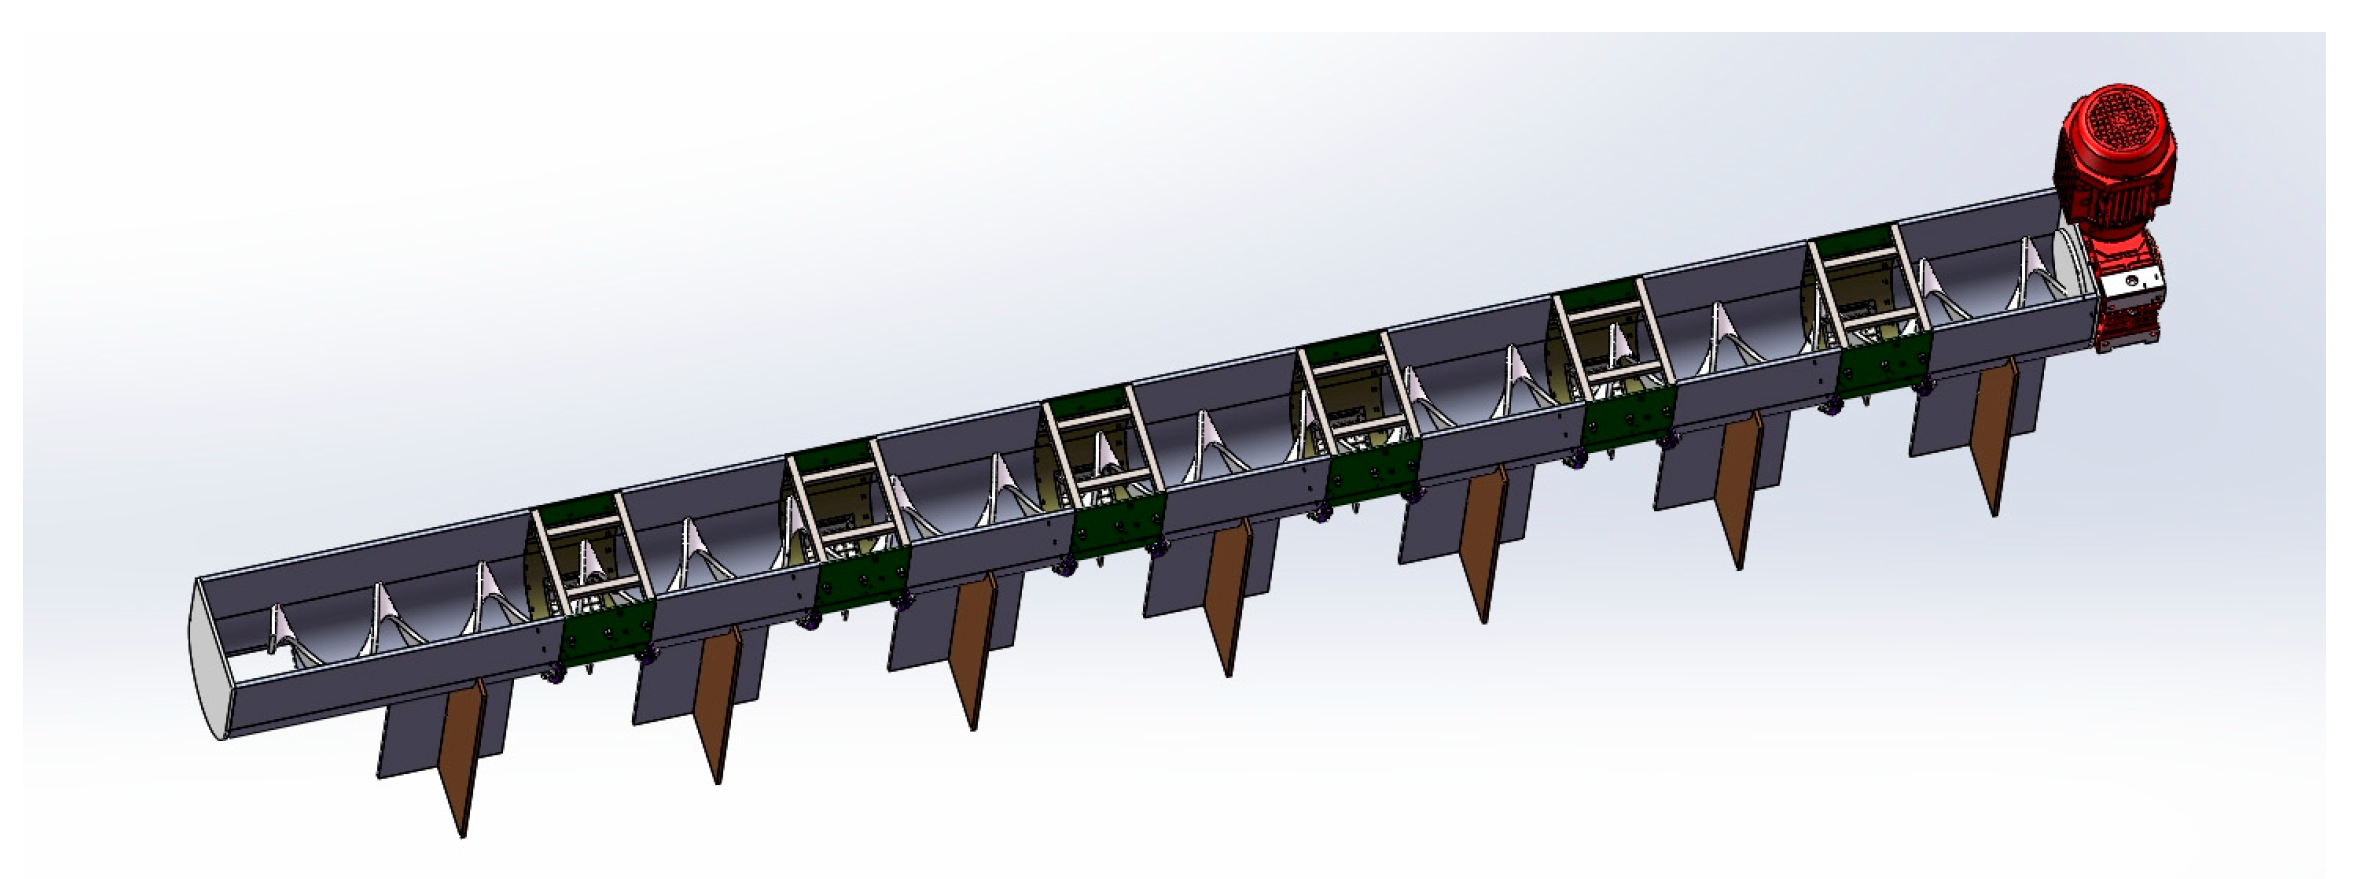
10], and the 3D model is shown in
Figure 1.
The rotary motion of the shaftless auger facilitates the conveying and simultaneous mixing of granular material through the discharge area [
11,
12]. The Shaftless Screw Conveyor has a strong anti-tangling property, which can reduce the interference of easily tangled materials and then convey materials easily and quickly, which cannot be done by a Shafted Screw Conveyor. In 2008, Merritt et al. [
13] proposed a novel theoretical model to describe the total pressure gradient and torque of tunnel excavator spiral conveyors. The theory introduced new equations that establish connections between the pressure gradient and torque with the geometric characteristics, shear stress, and material flow within the spiral conveyor. In 2021, Narayani et al. [
14] developed an innovative oil sludge excavation system based on spiral conveyors and devised a mathematical model to facilitate the design of a spiral conveyor capable of excavating maximum sludge per rotation. Computational fluid dynamics were employed for numerical simulations to visualize material flow in various system designs. In 2010, Zhongjun Yin et al. [
15] investigated the conveying principle of open-helix conveyors from a kinematic perspective by focusing on individual particles within such conveyors. They analyzed the granular material conveying speed during the transportation process along with its influencing factors, thereby deriving design criteria for key parameters of open-helix conveyors. In 2014, Qingchun Sun [
16] conducted relevant research on optimizing stiffness in two components—the spiral axis and blade—of horizontal spiral conveyors using multi-degree-of-freedom system vibration theory while also enhancing existing structural models. In 2015, Chaobin Jia [
17] on the structure of the screw conveyor and its working principle, analyzed the basis of the design of the conveyor, to establish the mathematical model of its parameter design, to determine the optimization of the main variables (parameters), constraints, and objective function to establish the optimization of the mathematical model and the optimization of the main parameters and to find the optimal combination of parameters.
Mud solid phase control equipment is used to control the solid phase particles in the drill cutting mud [
18,
19,
20]. Through a large amount of literature research, it was found that up to now, offshore oilfield drill cutting liquid phase reduction equipment applied to the negative pressure pumping technology is only a vibrating screen. A drilling shaker is the first stage of solid phase control equipment for recovering drilling fluids [
21,
22,
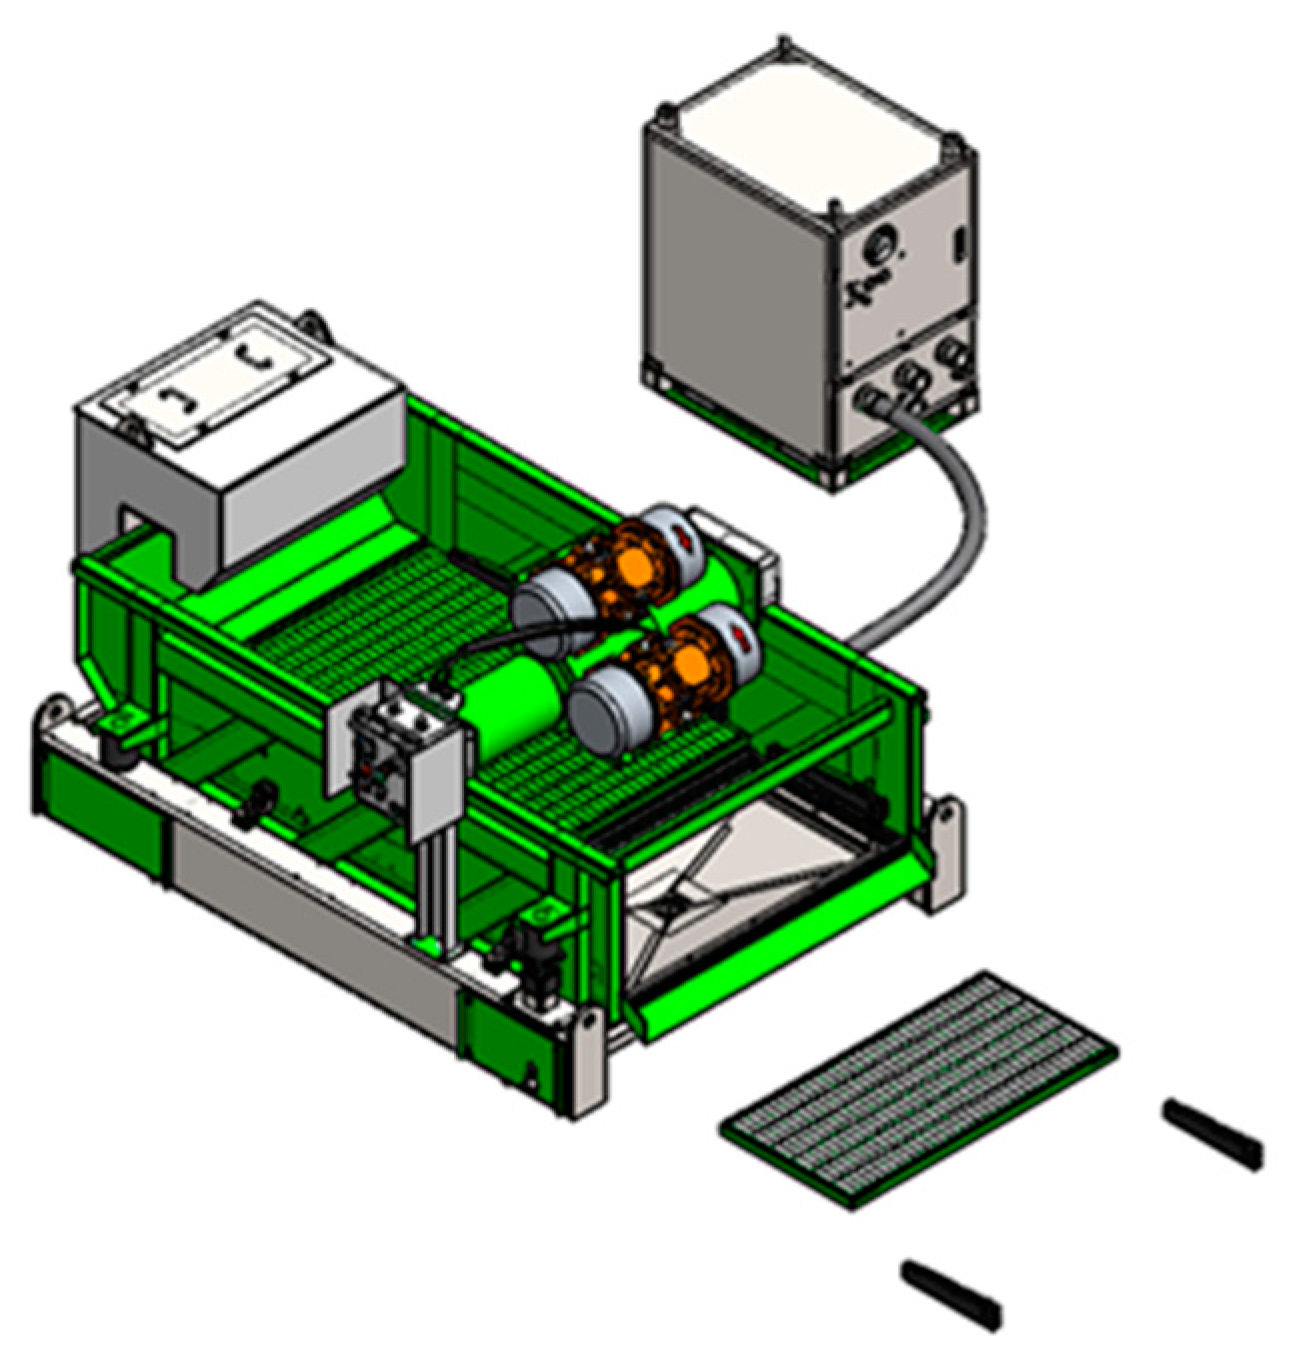
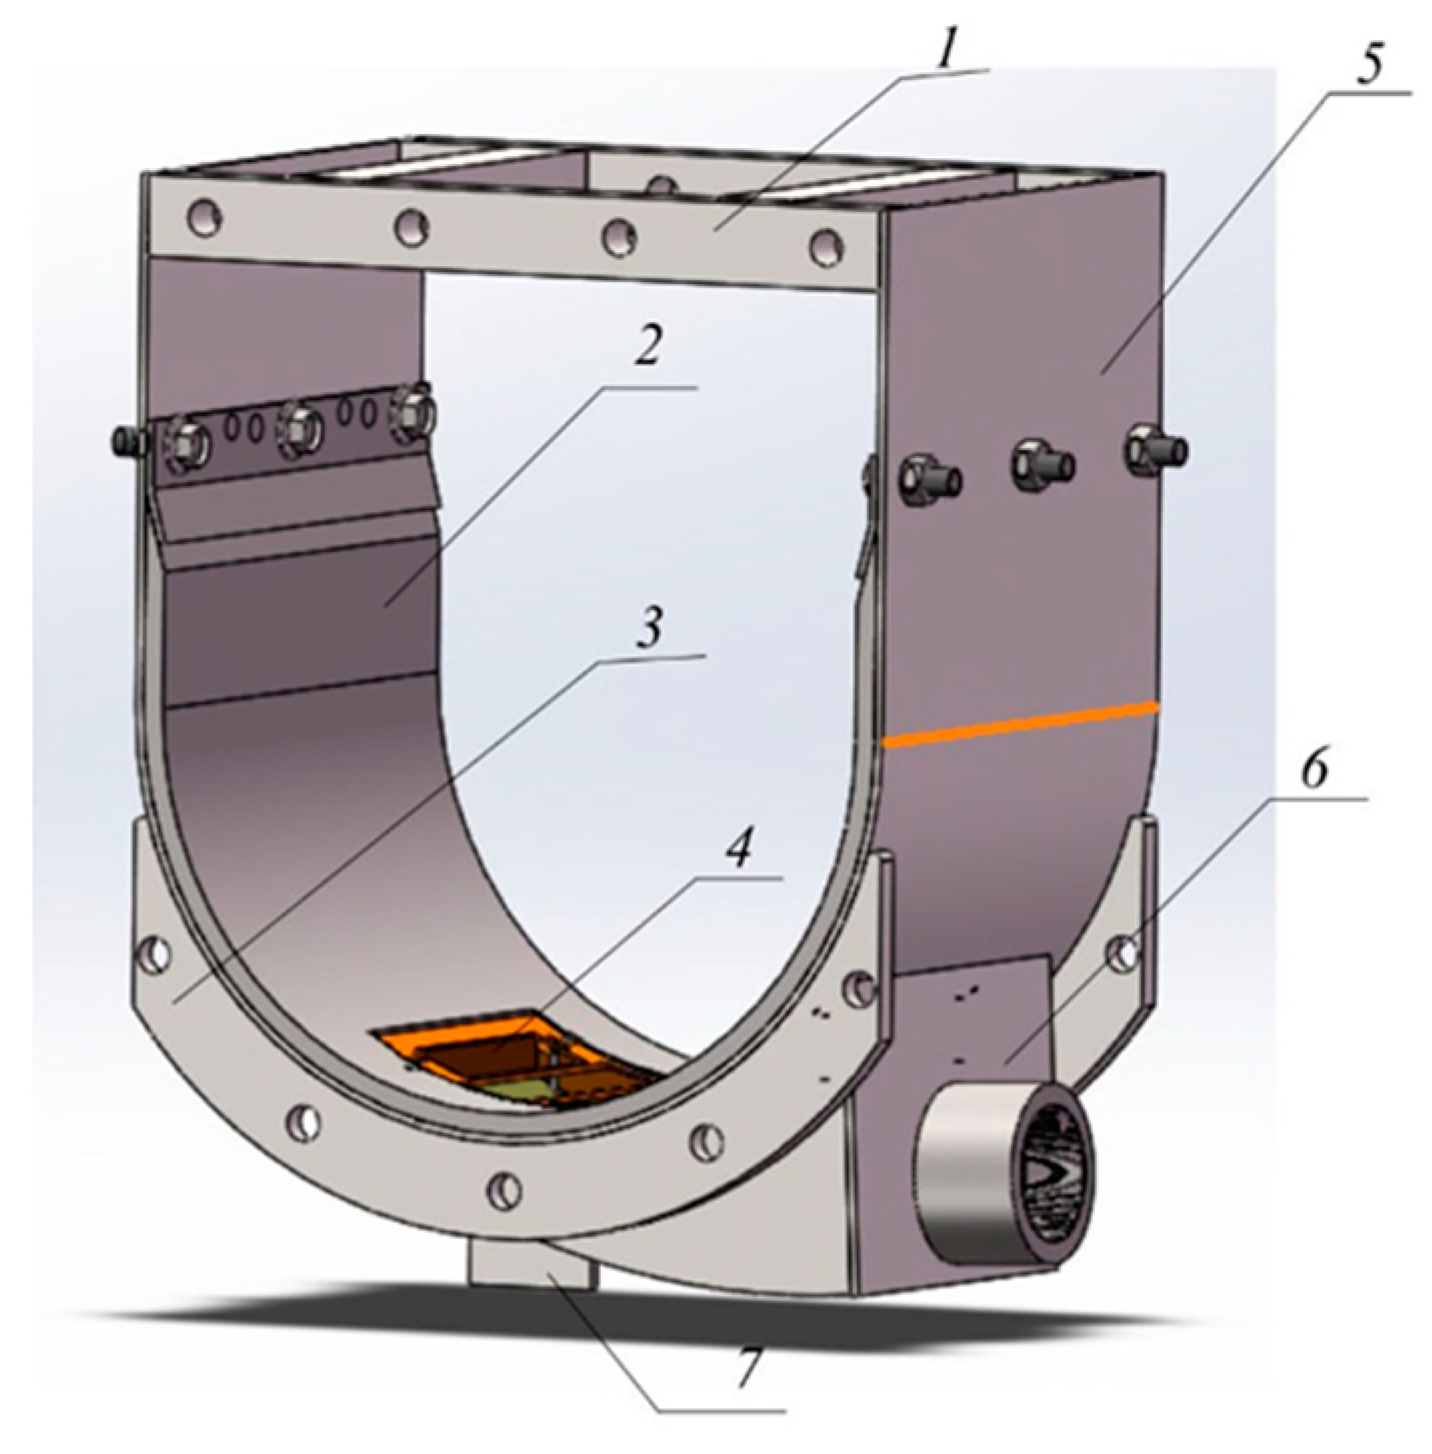
23]. In order to improve screening efficiency, researchers have proposed the concept of “negative pressure suction”. The 3D model of a negative pressure vibrating screen is shown in
Figure 2. In the 1980s, Remteck, an American company, ref. [
24] pioneered the development of the MAX system. This groundbreaking innovation introduced the vacuum filtration principle commonly employed in mining to revolutionize the solid–liquid separation process of drilling fluid. By effectively extracting drilling mud through a filter belt, this technology marked a significant advancement in the field. In 2015, US-based SWACO [
25] introduced a pulsed vacuum negative pressure vibrating screen that incorporates a vacuum negative pressure device at the end of the traditional vibrating screen and utilizes pulsed airflow to create a suction effect, thereby enhancing the drilling-fluid-recovery rate and reducing solid–liquid separation difficulties in mixed liquids. This technology can effectively reduce liquid content in solid-phase material from drilled rock cuttings by 20–30% after treatment, improve liquid reuse efficiency, and significantly lower drilling costs. In 2018, Sizhu Zhou et al. [
26] designed an innovative type of drilling vibrating screen that leverages pressure differences to enhance the working performance and increase drilling fluid treatment capacity. They analyzed different-sized rock debris’ throwing motion under negative pressure conditions and optimized the corresponding parameters. In 2020, Wenliang Li [
27] developed a sludge vacuum suction device that employs large screw air compressors to generate high-pressure airflow, which is then converted into negative pressure for generating suction force capable of drawing in drilling mud; high-pressure airflow is subsequently used for the direct discharge of mud to central treatment points.
The present study aims to comprehensively investigate the feasibility of the proposed scheme through a theoretical analysis, kinematic analysis, structural design and strength analysis, fluid dynamic simulation analysis of the vacuum screen, and experimental trials on a prototype to validate the theoretical findings by assessing actual suction effects.
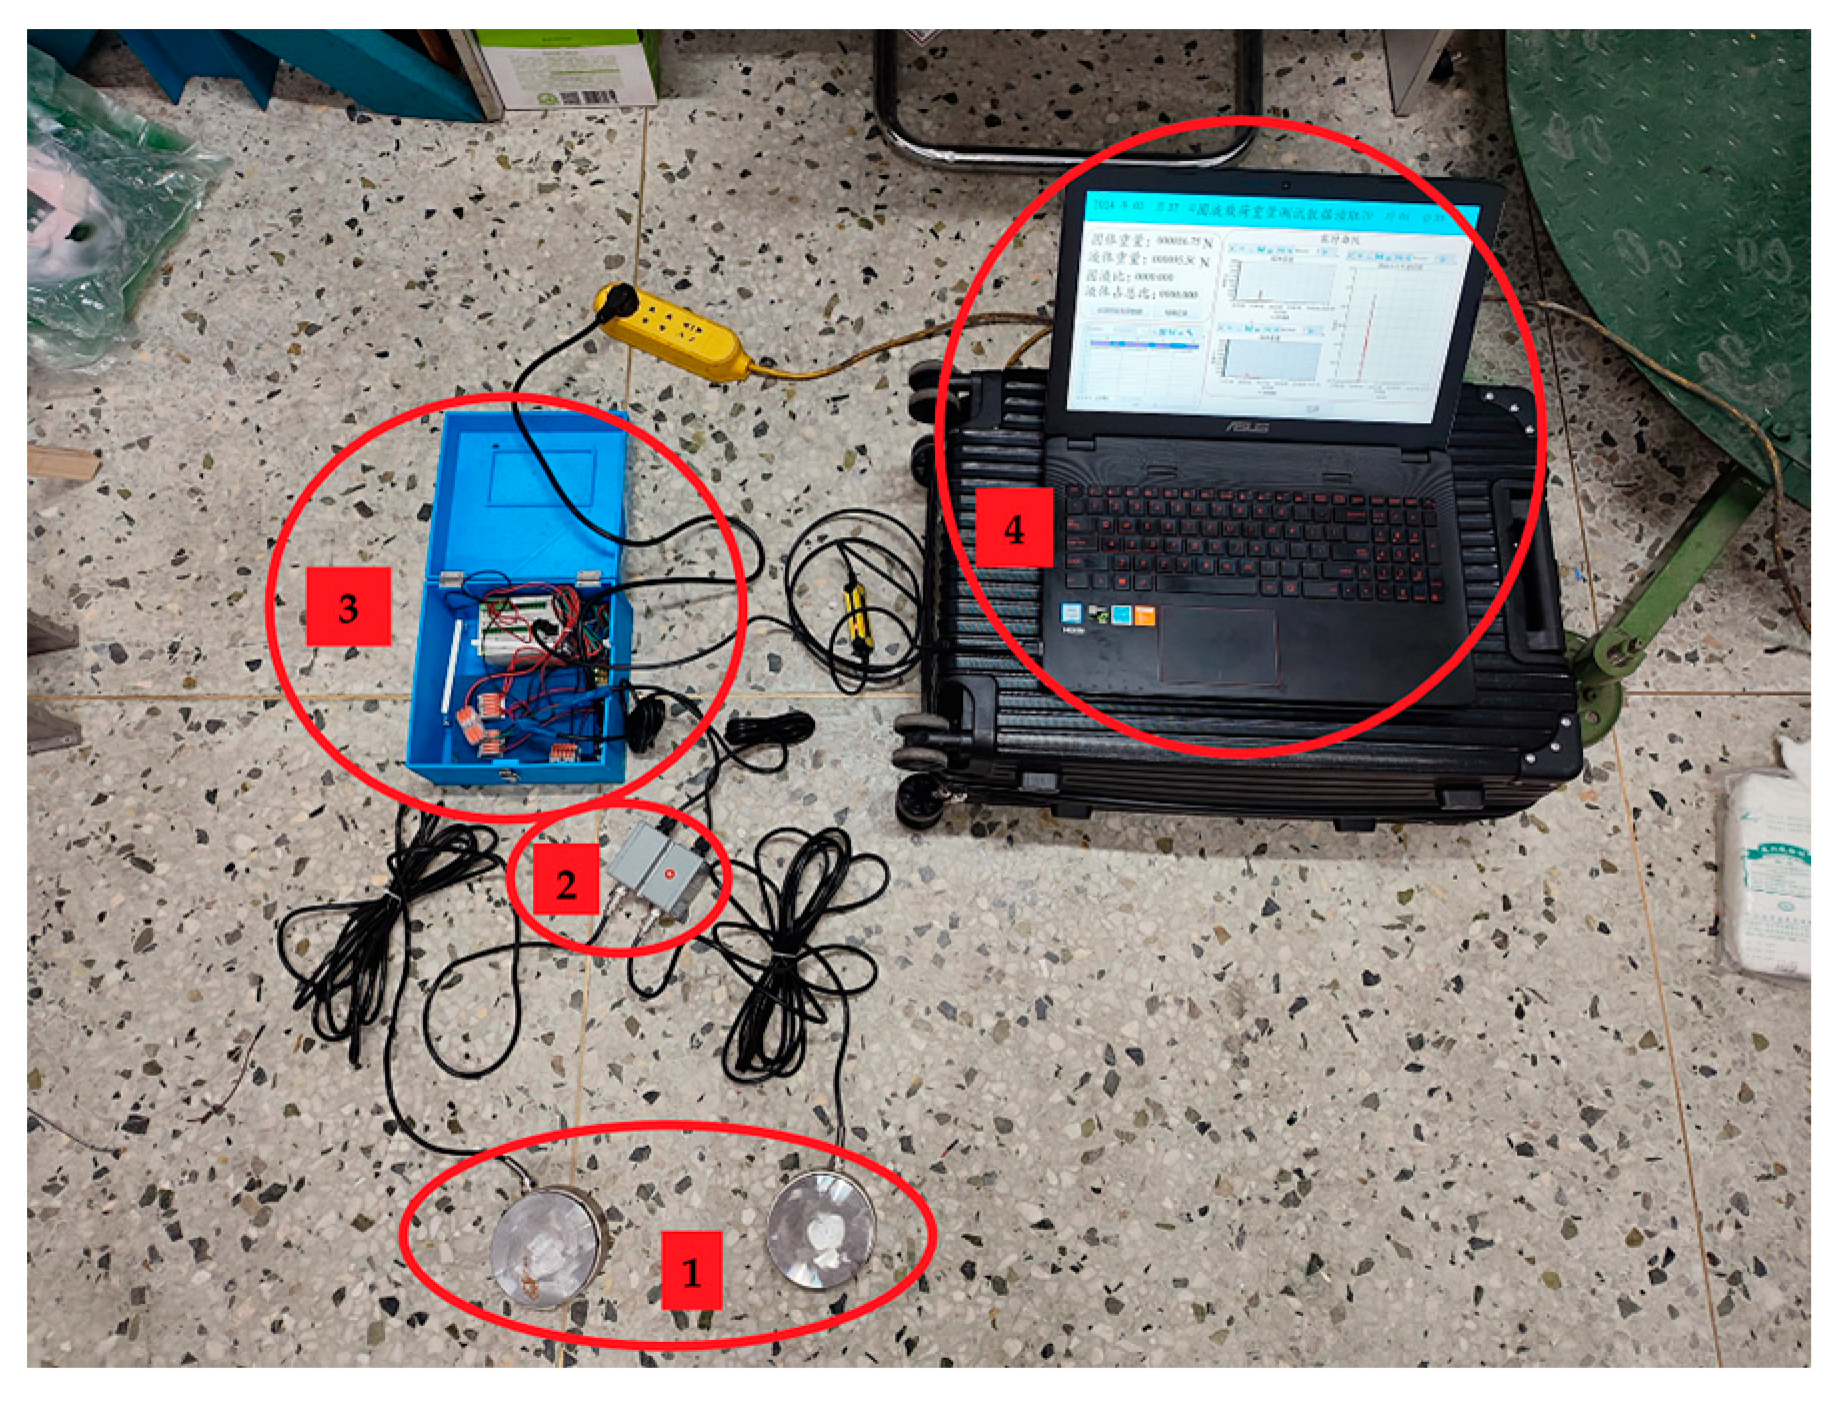
After conducting a comprehensive review of the relevant literature on the treatment of drilling cuttings in offshore oilfields both domestically and internationally, this paper presents a concise summary of related technologies and subsequently proposes an innovative design scheme for negative pressure spiral separation and reduction. Notably, this scheme represents the pioneering application of negative pressure suction technology to a screw conveyor. Firstly, the device’s detailed structure is meticulously designed, followed by the establishment of a 3D model and subsequent finite element strength analysis. Then the theoretical analysis of relevant process parameters was carried out, and the vacuum screening process was simulated using the coupled EDEM-Fluent method. Finally, an online real-time testing system is devised to evaluate the solid–liquid separation effect. The experimental results conclusively demonstrate that this proposed scheme enables the more efficient solid–liquid separation of drilling cuttings, enhances the drilling fluid recovery efficiency, reduces mud material consumption, and lowers drilling costs significantly while effectively conserving energy.
3. Theoretical Analysis of Process Parameters of Negative Pressure Spiral Separation and Reduction Device
The vacuum screening principle investigated in this study is as follows: particles enter the screening area through the material inlet located at the top of the material screening cylinder, while the bottom of the cylinder is connected to a vacuum chamber. The high-speed gas flow carries the material into the screening cylinder. Initially, during the vacuum screening process, gas and particles smaller than the mesh size pass through, whereas particles with a diameter close to or larger than that of the mesh are intercepted by it. Over time, these retained particles accumulate and form a bed, potentially leading to partial blockage of some sections of the mesh. The vacuum chamber maintains a pressure differential between the upper and lower surfaces of the mesh and facilitates gas flow, thereby enhancing the solid–liquid separation efficiency through the combined effects of the carrying capacity and pressure differential induced by the gas flow. In this chapter, we will employ an EDEM-Fluent coupled computational method to investigate screen mesh blocking patterns occurring during vacuum screening.
3.1. Numerical Simulation of Vacuum Sieving
3.1.1. Numerical Simulation Study of Gas-Solid Two-Phase
The vacuum screening process involves the calculation of the multiphase flow, which is a complex coupled process that is challenging to describe using single simulation software. In this study, we employ the EDEM-Fluent coupled method to simulate the blocking process in vacuum screening. The EDEM-Fluent computational model consists of two main models: the Eulerian–Lagrange method and the Eulerian–Eulerian method. When simulating without considering the solid-phase volume fraction, only momentum exchange between gas and solid phases needs to be considered, making the Eulerian–Lagrange coupled method suitable for calculations. This model offers a faster computation speed but is limited to working conditions where the local solid-phase volume fraction remains below 10%. On the other hand, the Eulerian–Eulerian method (also known as double Eulerian) considers interactions between solid and fluid phases, including the mass, momentum, and energy exchange [
28]. As our simulation involves particle blocking and accumulation leading to local solid-phase volume fractions exceeding 10%, we choose the double Eulerian coupled model for discrete phase treatment.
3.1.2. EDEM Computational Model
The discretization of the model is based on the following assumptions [
29]:
The total deformation of the granular system is considered to be equivalent to the overall displacement of all particles within it;
Particle–particle contact occurs through point contacts, which are localized in very small areas;
Partial overlap may occur when particles come into contact, but the magnitude of this overlap is significantly smaller compared to the size of individual particles;
In each computational step, no particle can instantaneously transmit external excitation to its adjacent particles. Consequently, the resultant force acting on any particle at any given time can be uniquely determined by interactions with its neighboring particles that are in contact.
The particle-motion-simulation process in EDEM 2022 software entails the movement of particles within a particle group. During the simulation, contact and collision between particles are essential, resulting in forces when particles come into contact. The discrete element method’s fundamental model is based on mutual contact, where the torque-based contact model directly determines the forces acting on the particles during analysis. In the discrete element analysis, the contact model for dispersed particles is categorized as either dry or wet based on analysis conditions. For dry particle materials without adhesion at remaining contact points, the Hertz–Mindlin basic contact model can be selected in EDEM software as it serves as both the default and suitable choice for calculating inter-particle forces [
30].
The format is as follows: is the equivalent Young’s modulus, ; is the normal overlap, ; is the equivalent contact radius.
The inter-particle normal damping force, as well as the tangential damping force, is calculated as follows [
31]:
The format is as follows: is the tangential stiffness; is the normal stiffness; is the tangential true velocity; is the normalized true speed; is the coefficient of restitution; is the equivalent mass.
3.1.3. Gas–Solid Coupling Control Equation
Laminar flow and turbulent flow are two flow states of airflow; the control equations of the two flows are the same, but the difference is that the variables have different expressions, and the turbulent transport equation needs to be attached when calculating turbulent flow. The following is the gas–solid coupling equation for laminar flow, and its N-S equation and continuity equation are as follows:
The format is as follows: is the density of the gas; for time; is the gas velocity; is the gas porosity; is the gas pressure; is the gas dynamic viscosity; is the acceleration due to gravity; is the phase of the momentum exchange source.
3.2. EDEM-Fluent Coupled Computational Model and Related Parameter Settings
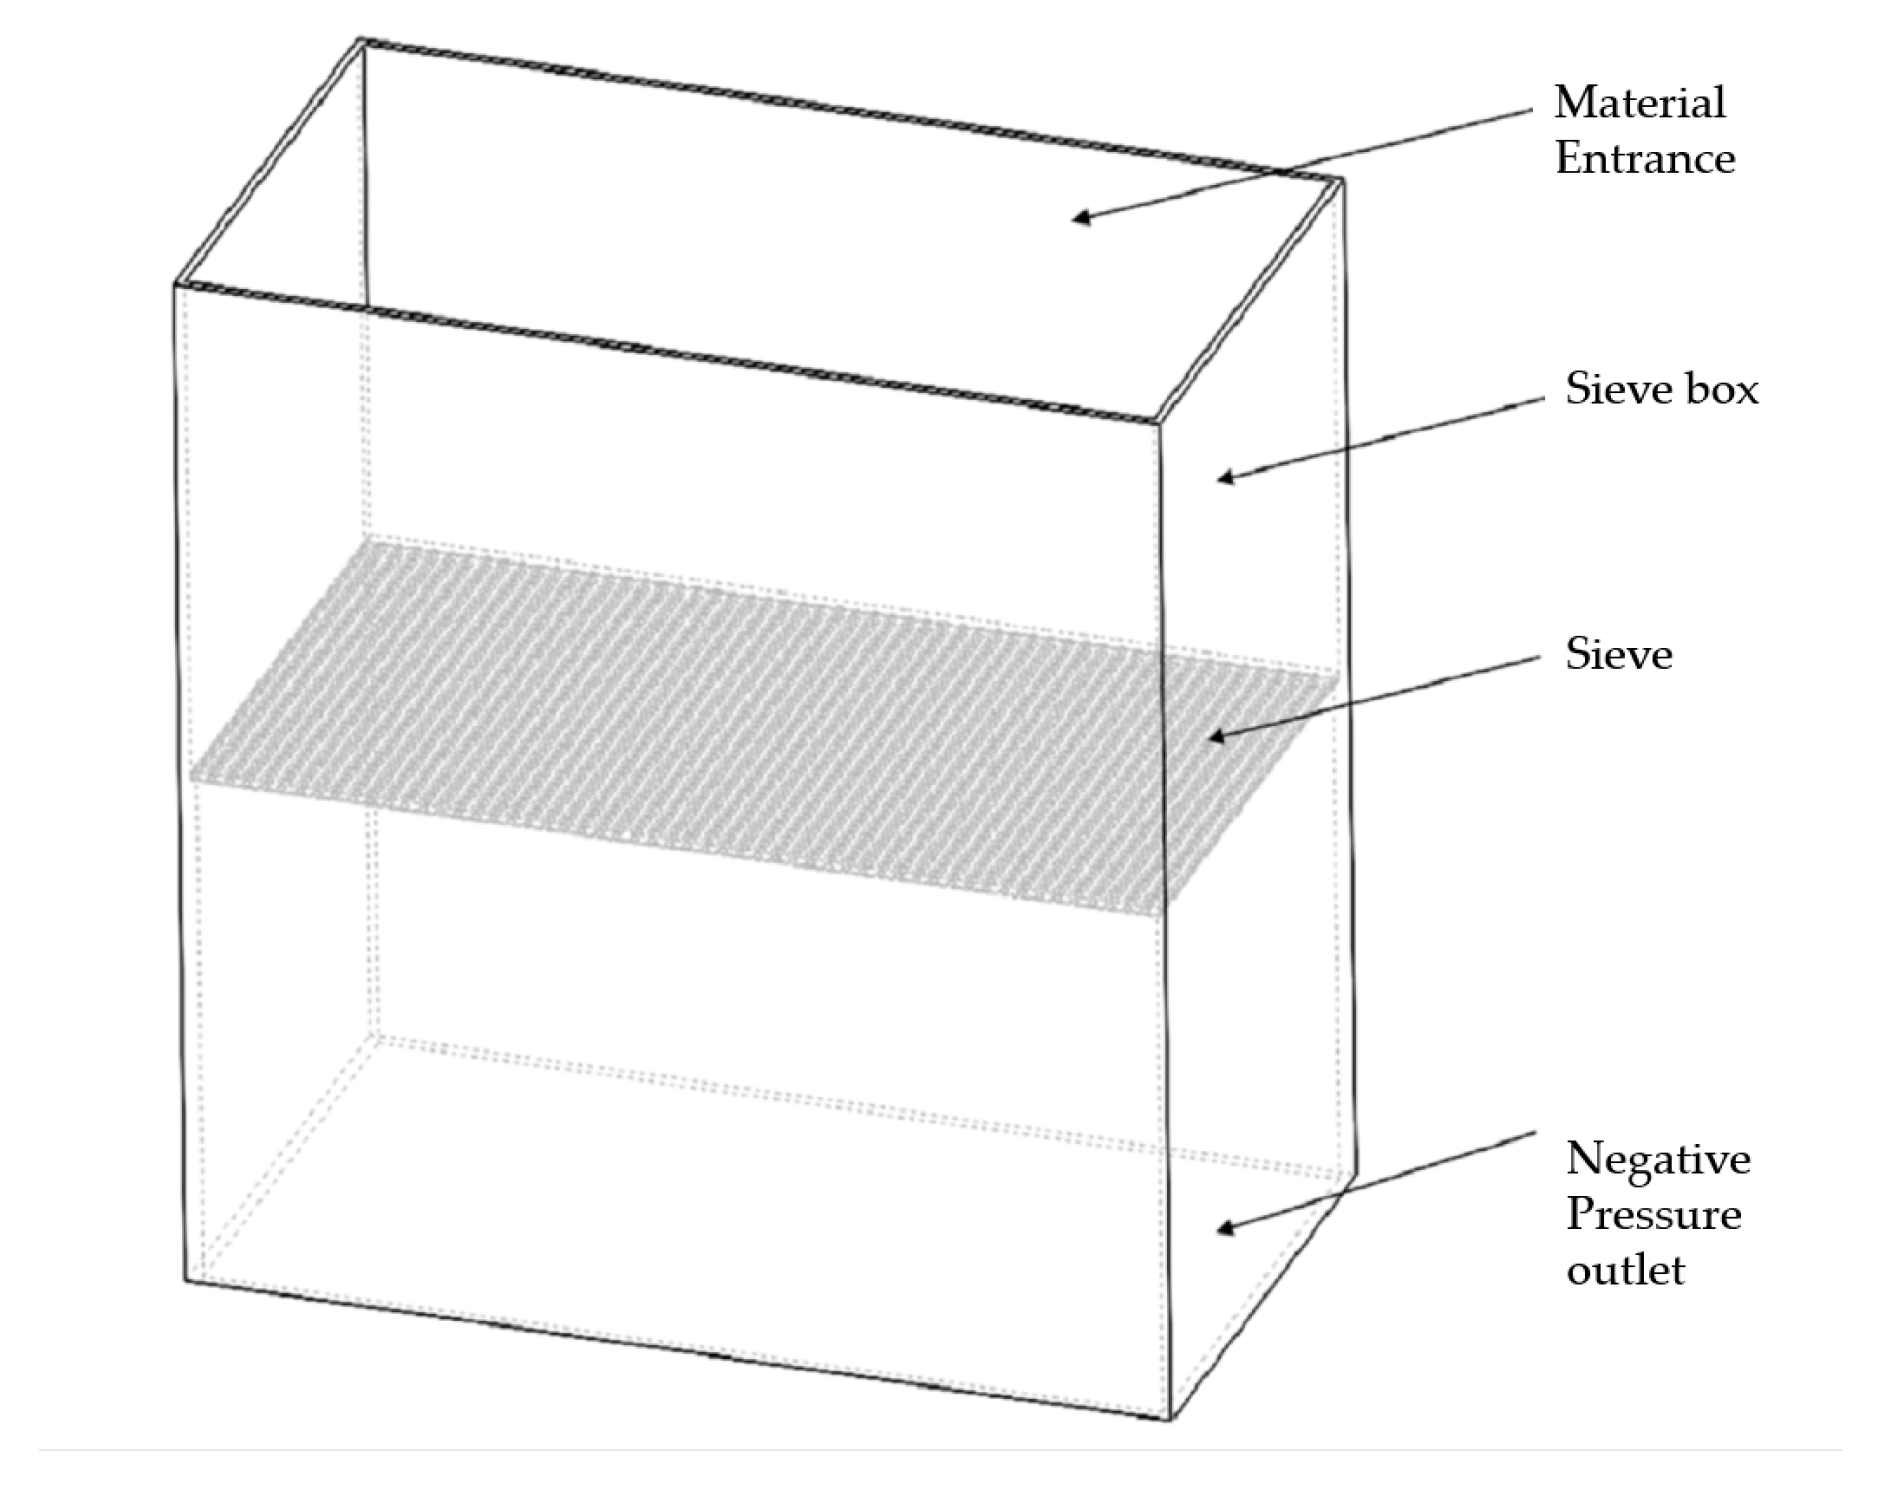
Based on the principle of vacuum screening and the reasonable simplification of the structure of the vacuum screening and filtration experimental device, the application of Solidworks2020 three-dimensional modeling software to establish a simplified three-dimensional model of the sieve bin, as shown in
Figure 12, the sieve bin structure includes the material inlet, the material sieve cylinder, the sieve mesh, and the vacuum outlet.
Vacuum sieving and filtration experiments choose the effective processing area of the screen for
, but simulation calculations need to take into account the computer computing power and calculation cycle, so the effective filtration area of the calculation model is reduced to the effective filtration area of the experimental 1/200, the screen calculation model is simplified to a porous structure but the mesh number of the screen remains unchanged, i.e., the effective area of the calculations for the 33,695 mm
2, the mesh size
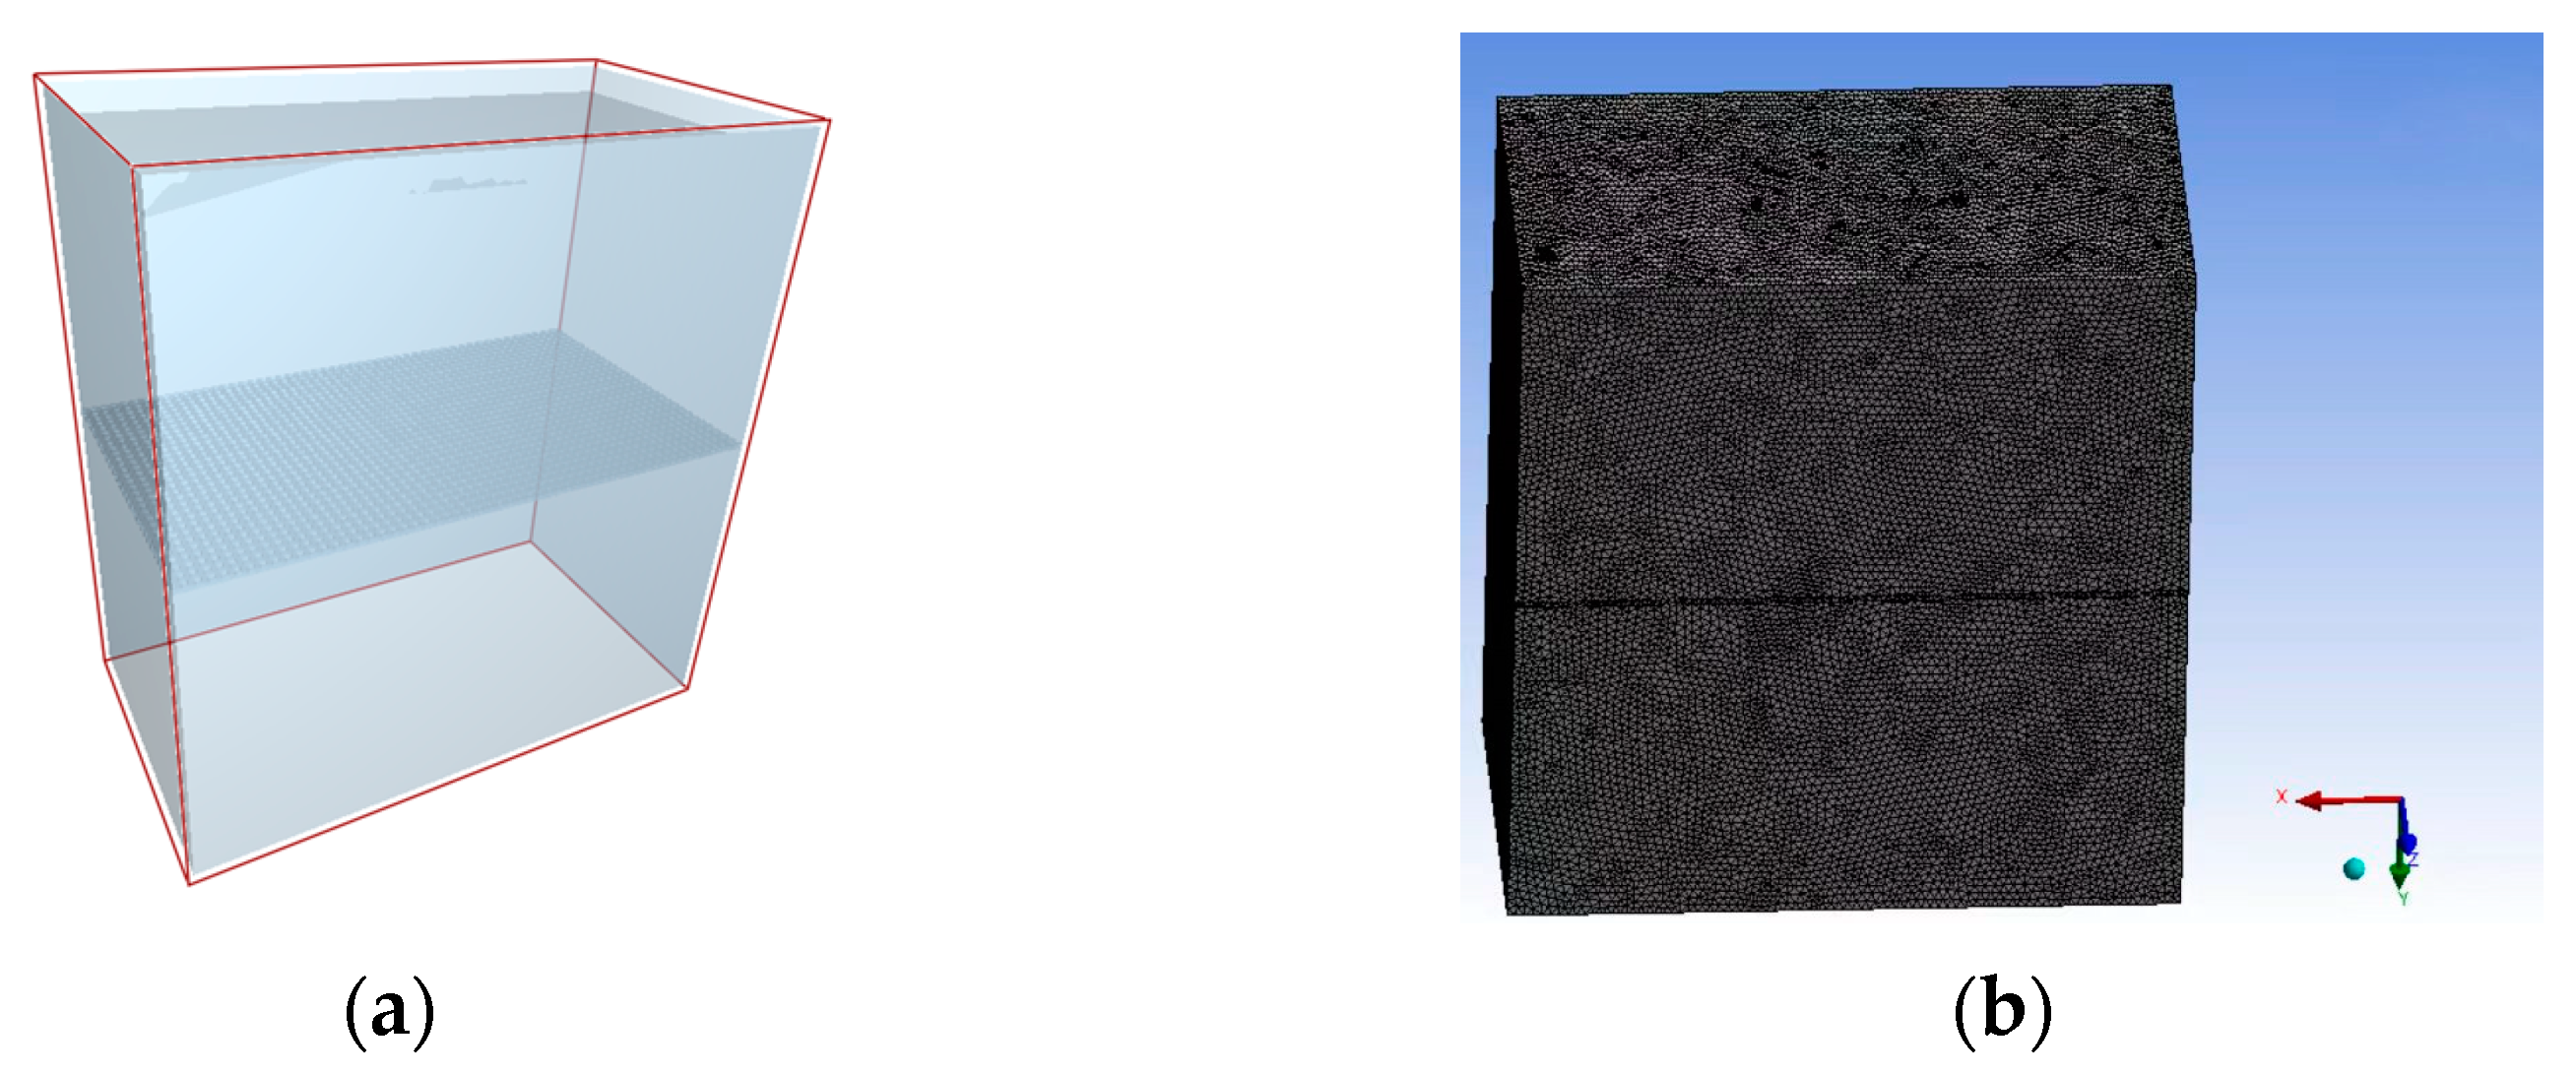
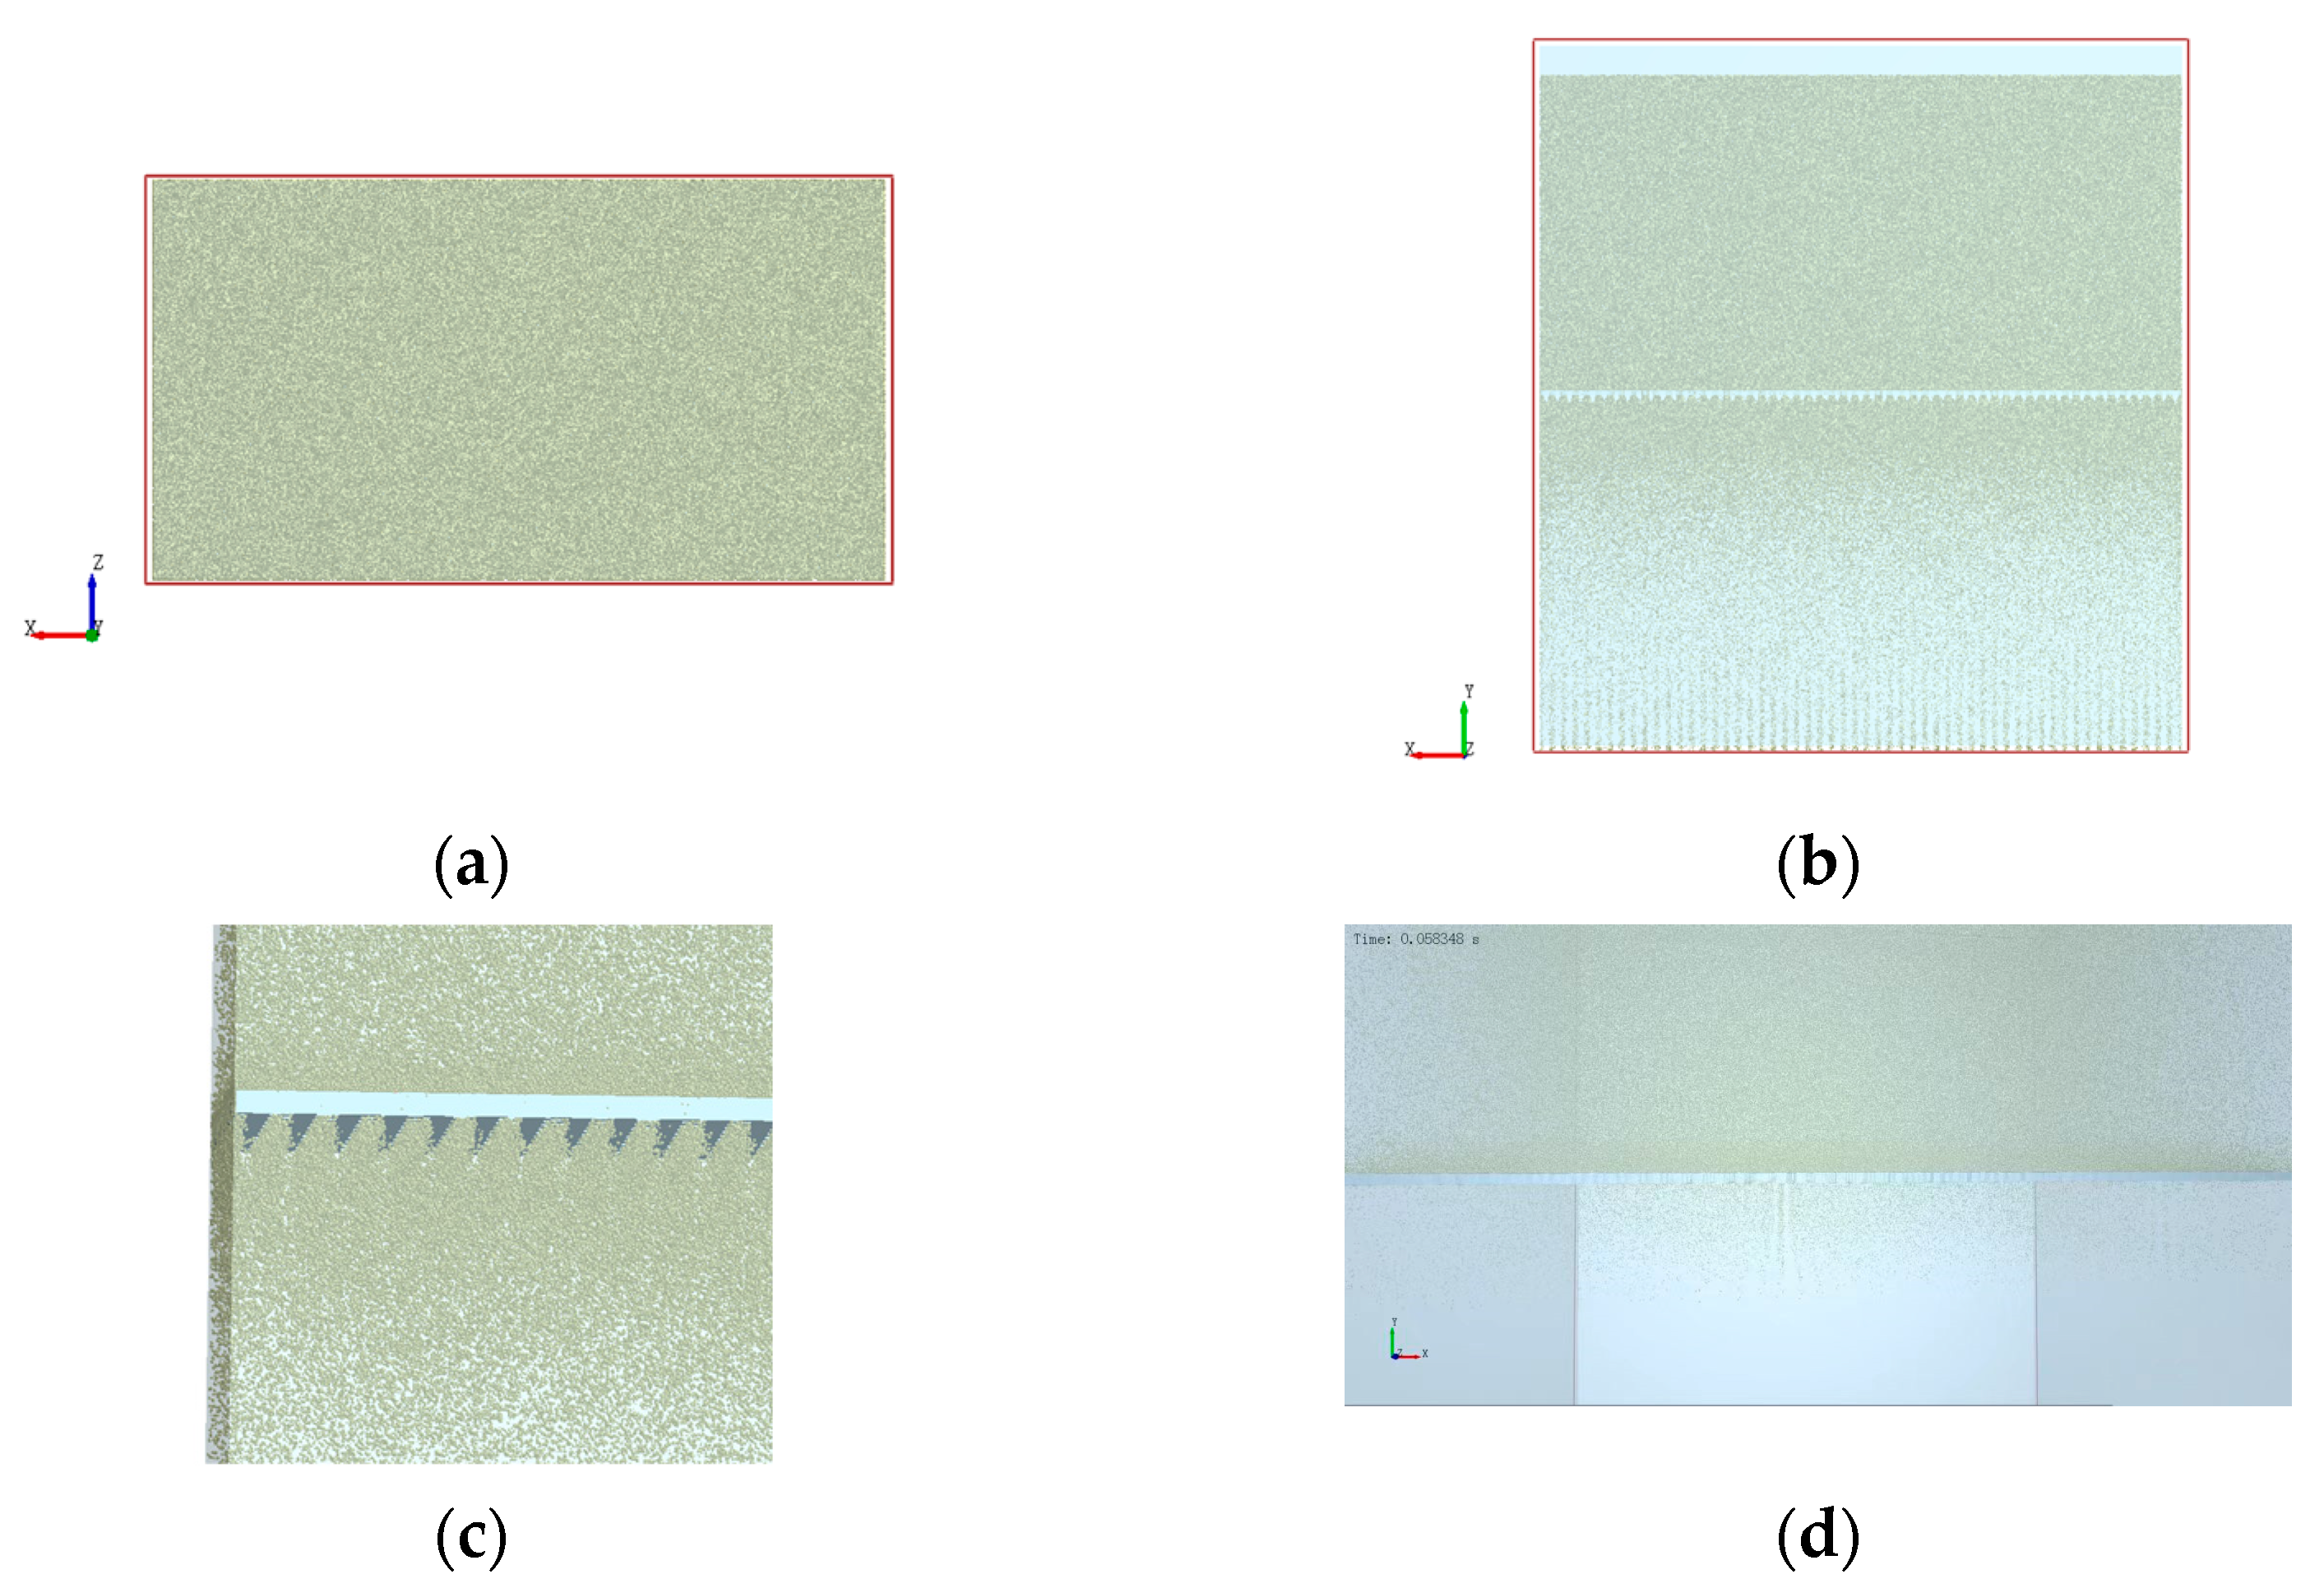
, and the structure is square. The EDEM computational model is shown in
Figure 13a, and the mesh division of the computational fluid domain in Fluent is shown in
Figure 13b.
3.2.1. Solid-Phase Particle Modeling
Due to the heterogeneous particle size distribution and irregular shape and number of particles in drilling fluid, it is imperative to simplify the calculation model and reduce the simulation time. Consequently, this simulation analysis focuses on simulating particles prone to blockage, employing spherical particles as solid-phase calculation entities in the EDEM software. Several particle size distribution methods are available in EDEM for selection based on specific conditions, including a uniform particle size, average particle size distribution, normal distribution, random distribution, and user-defined particle size range. Given the irregularity of both the particle size distribution and number of solid-phase particles within a certain range only, we set the particle ratio according to
Table 1 in EDEM software while opting for random distribution as the chosen method to establish our particle model.
3.2.2. Main Simulation Parameter Setup
Using the EDEM-Fluent coupled calculation method, the laws of screen mesh blockage during vacuum screening are studied. The calculation uses the EDEM 2022 version to simulate the particle phase and Fluent 2022 to simulate the gas phase. In the EDEM software, the parameters of the particles are set, and the contact model is selected as the Hertz–Mindlin frictionless contact model [
32]. The gravity acceleration direction is set along the negative
Y axis, with a magnitude of 9.81 m/s
2. After the parameters in the EDEM software are set, the coupling interface is opened, and then, the coupling file is loaded in Fluent. The two softwares are coupled together, and the solver in Fluent is selected as the pressure algorithm coupled solver, and the k-epsion model is selected. The working environment is set to atmospheric pressure. After the grid is divided for the fluid domain, the material handling cylinder outlet is set as the velocity outlet, the inlet is set as free flow into the atmospheric environment, and the outlet is set as the constant flow rate flow. The flow rate in the outlet can be controlled by changing the airflow speed, thereby achieving the goal of controlling the airflow during vacuum screening; because two softwares need to exchange data for the coupled calculation, the calculation time steps of the two softwares need to be matched. Since the calculation time step in EDEM is much smaller than that in Fluent 2022 software, it cannot be set at a ratio of 1:1, and the time step length in Fluent must be an integer multiple of the time step length in EDEM. In EDEM, the time step is set to 1 × 10
−6 s, and the save time is set to 0.01 s. In Fluent, the time step is set to 0.01 s, and the iteration calculation is performed for 5000 steps, with a total calculation time of 1 s. The particle parameters can be set in EDEM software, and the physical parameters of each item are shown in
Table 2 and
Table 3.
3.3. Simulation Results of Vacuum Screening Using EDEM-Fluent
This chapter employs the EDEM-Fluent coupled computational method to investigate screen clogging patterns that arise during vacuum screening. The study primarily encompasses the analysis of screen clogging patterns, gas flow characteristics, and screen clogging severity under various operational conditions, including different particle concentrations and particle size ratios. The simulation parameters encompass simulations conducted under varying particle concentration and particle size ratio conditions.
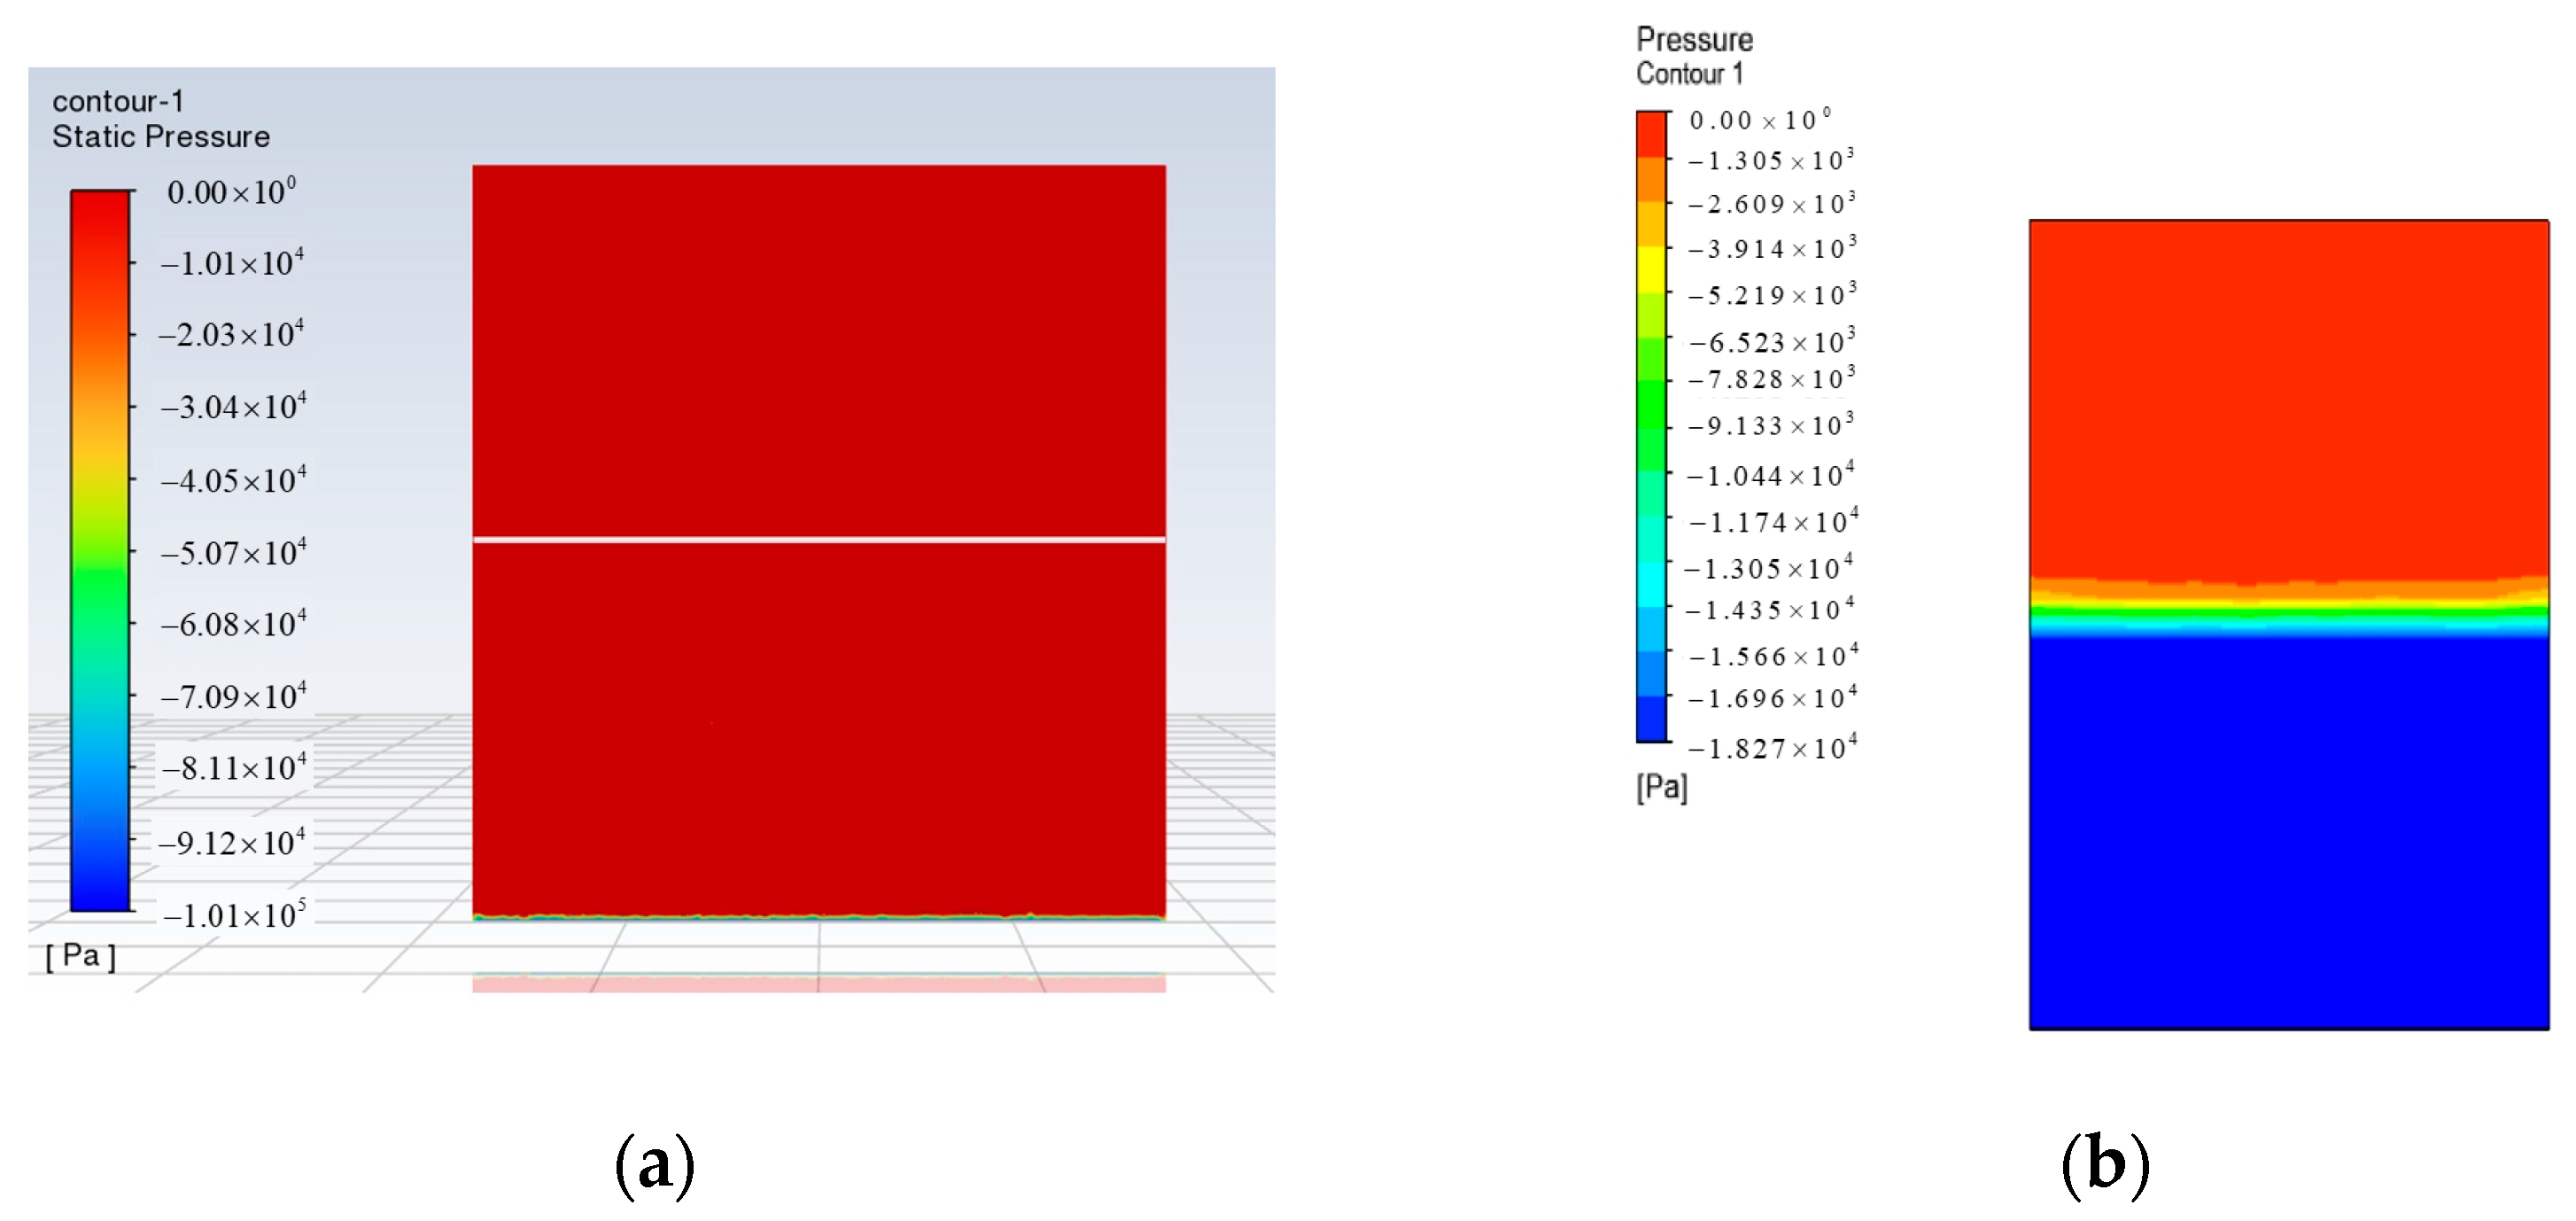
Due to the combined action of the airflow, granule bed, and screen, there is a relatively obvious pressure difference between the upper and lower parts of the filter bed formed by the granule accumulation layer and the screen. Because the thickness of the granule layer accumulation increases and the inter-granule pores are gradually squeezed by the airflow and mutual pressure between the granules, the granule layer accumulation becomes more compact, the interception of airflow is enhanced, and the pressure drop across the screen increases as the airflow passes through the granule bed, as shown in
Figure 14.
In Fluent, the pressure distribution cloud map of the fluid domain at different computational conditions when the pressure tends to stabilize under static conditions is shown in
Figure 15. The post-processing analysis of the computational results in Fluent software was conducted, and the pressure distribution of the entire screening chamber was exported. The simulation results are the final simulation results. Due to the gradual compression of the interparticle pores and the increasing tightness of the particle layer, the interception of the airflow is enhanced, so a relatively obvious pressure gradient is formed in the screening chamber.
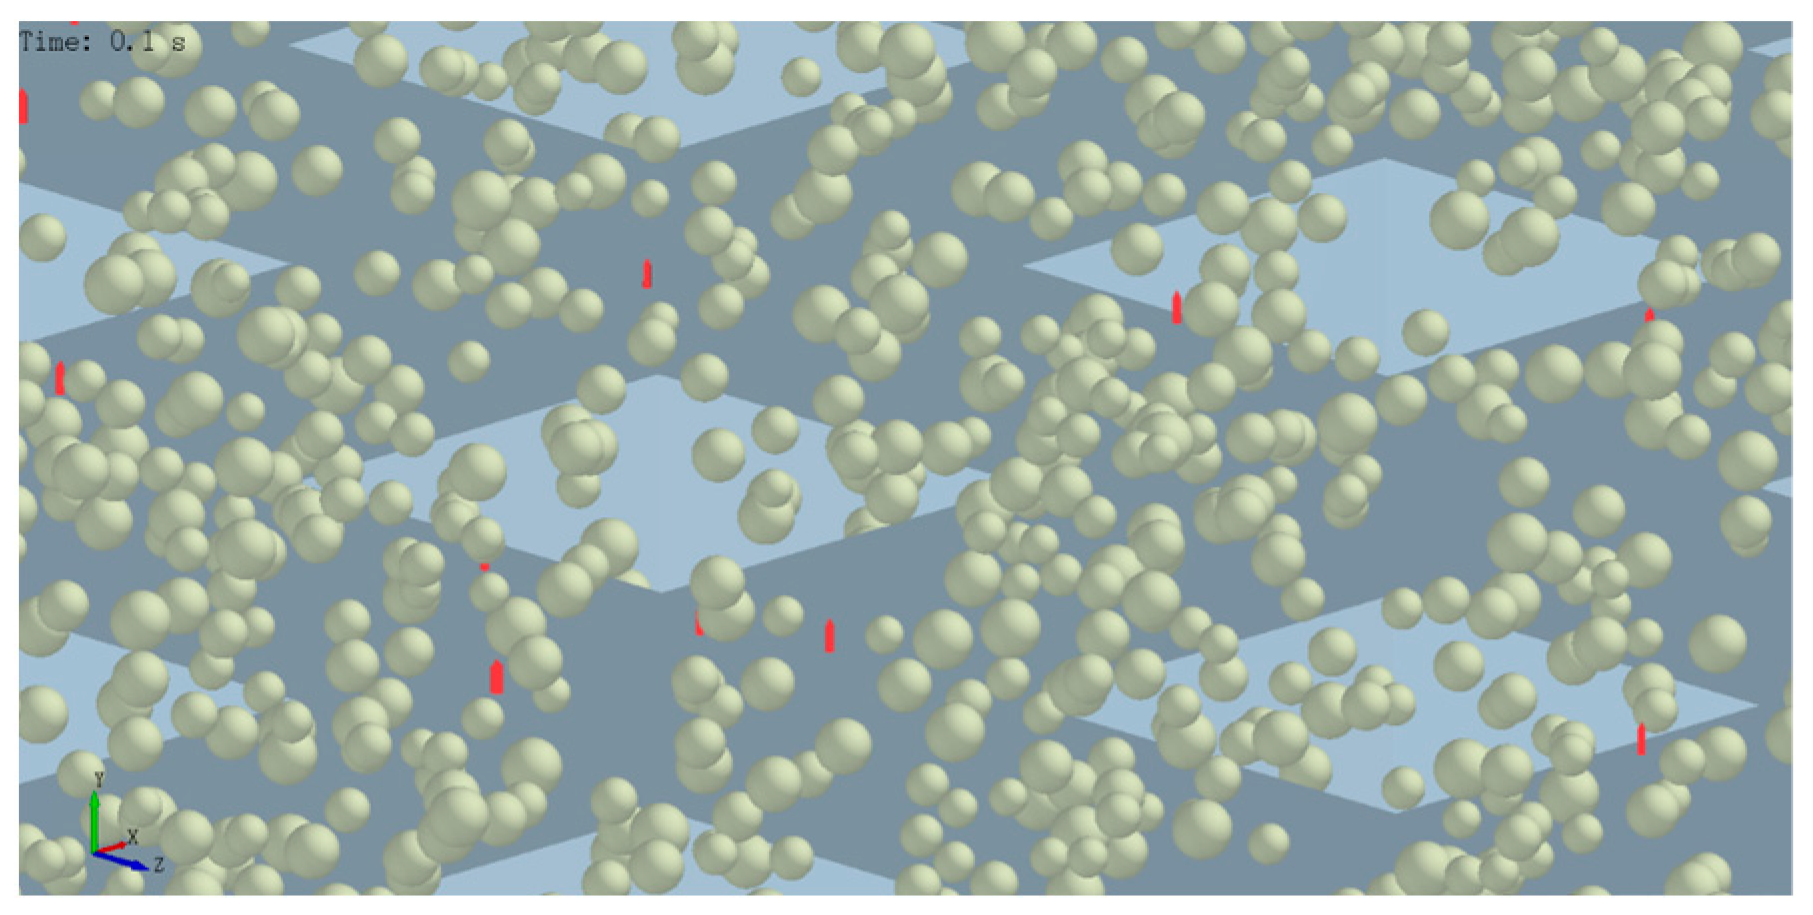
In order to elucidate the phenomenon of screen mesh blockage caused by particulate matter, partial images depicting the obstructed areas with embedded particles were extracted, as illustrated in
Figure 16. The figure reveals a substantial number of particles deeply lodged within the apertures of the screen mesh, resulting in embedded blockages. Generally, there are two main causes for this type of obstruction: firstly, when the particle size closely approaches or slightly exceeds that of the mesh openings; secondly, when numerous particles agglomerate and form larger entities that become trapped within the mesh apertures. As calculations progress deeper into subsequent levels, these larger-volume particles increasingly contribute to more severe blockages. Furthermore, variations in particle size lead to differences in how deeply they embed themselves within the screen mesh holes; some particles become so deeply embedded that their removal becomes challenging.
The study used the EDEM-Fluent coupling to simulate the vacuum screening and filtration process and calculated the filtration efficiency, blockage, and pressure in the screening chamber of the vacuum screen. Due to the limited computational time of the simulation model, there are still some shortcomings in the study, and some issues have not been studied yet and need further research and discussion.
