Article

Human-Centered Design and Manufacturing of a Pressure-Profile-Based Pad for Better Car Seat Comfort

Department of Industrial Engineering, University of Salerno, Via Giovanni Paolo II, 132, 84084 Fisciano, SA, Italy
*
Author to whom correspondence should be addressed.
Machines 2024, 12(6), 374; https://doi.org/10.3390/machines12060374
Submission received: 12 April 2024 / Revised: 22 May 2024 / Accepted: 23 May 2024 / Published: 28 May 2024

Abstract

:
A car seat’s function is to support, protect, and make passengers and drivers feel comfortable during a trip. A more uniform pressure distribution and a larger contact area usually provide less discomfort. Consequently, the seat pan’s material and geometry play an essential role in the design process. A shaped pad was opportunely designed and realized, starting from the pressure distributions between the buttocks and the seat pan; pressure data were acquired during an initial experiment involving 41 people, representing a wide range of percentiles. The shaped pad was compared with a standard one by building a special seat with an interchangeable internal pad and testing the standard and the new seat; the second experiment involved 52 people that tested both seats. The tests were conducted to assess comfort (33 subjects were asked to be seated for 1 min each) and discomfort (19 subjects were asked to be seated for 15 min each); during the tests, pressure distribution and contact area data were gathered. The results showed that, for both tests, about 80% of the participants, among which 100% of the female sample, preferred the shaped seat pan pad. Even if the material was exactly the same, the shaped pad seemed to be softer, more comfortable, and more suited to the body’s shape than the standard one. The design methodology was demonstrated to be very useful for granting a more uniform pressure distribution and a wider contact area, i.e., higher comfort and less discomfort.

1. Introduction

Passenger cars have emerged as the primary means of family transportation, with an estimated 1.4 billion in operation worldwide. Thus, the car is an integral part of our everyday routines. To capitalize on their proprietary technological advances, manufacturers introduce new designs ever more frequently [1].
In this regard, one of the challenges is concerned with the seat, whose main functions are providing a seating space, safety, and comfort. The car seat is one of the most important components in a vehicle. Proposing an innovative design is a pretext for companies to assert their creativity, personality, safety, functionality, and differentiation [2]. Moreover, ergonomic and comfortable seats play a key role in minimizing physical strain and fatigue, thereby supporting sustained attention and concentration [3]. Comfort is considered a higher priority, especially during long journeys.
Designing a comfortable seat is complicated [4,5,6] because there are a lot of factors to consider in human–seat interactions. Some factors depend on the passenger (anatomical features and characteristics of the passenger’s buttocks) and others on the seat characteristics (seat hardness, seat shape, and contour) [7]. In fact, human–seat interactions are affected by human anthropometry [8], body shape [4], posture [9], the seat’s design, body sensitivity [10], comfort [11,12,13,14,15], and seating duration [16]. In the literature, several studies have been carried out to improve comfort by changing the seat pan tilt angle and the friction coefficient of the seat surface [17], as well as work on the pressure distribution at the body–seat interface [14,18,19,20].
Thus, the contact area is the best factor for objectively assessing the perceived (dis)comfort. Improving this contact area can potentially increase the positive experience of a car journey. Furthermore, some pressure mapping systems are low-cost and easy to use [21,22].
All of these aspects must already be considered in the early stages of the design process. To do this, the virtual prototype plays a fundamental role. In the automotive sector, prototypes are supported, i.e., for rapid visualization of car parameters and car exterior body proportions [23], or for designing a shaped seat pan pad [24].
Therefore, the assumption is that developing a shaped seat pad based on human contours could improve pressure distribution and, consequently, increase comfort and decrease discomfort perception. Starting from this hypothesis, two different car seats were compared: a standard seat, and another with a shaped seat pan.
The experiment was divided into two parts.
The first part focused on the shaped seat pad design. Forty-one people were asked to sit on a standard seat, and interface pressure maps were acquired; three different postures were investigated, in order to represent different passengers’ conditions: non-driving passengers in a relaxed posture, driving passengers pressing the brake pedal, and driving passengers pressing the accelerator pedal. The averaged pressure maps were merged to obtain a geometric model that conformed throughout the sample for the different postures.
The second part aimed to validate the shaped seat pad. Sitting comfort and discomfort are independent entities associated with different factors; discomfort is related to biomechanics and fatigue factors (long periods), and comfort is a sense of well-being and aesthetics (short periods) [25]. Therefore, in this study two different tests were conducted: a 1-min test (comfort assessment) and a 15-min test (discomfort assessment).
The virtual prototype of the shaped pad was designed with 3D-CAD (Computer Aided Design) software (Grasshopper® for Rhino 5.0 software) starting from the set of pressure maps output from the first part of the experiment. Then, a physical prototype was manufactured and compared with the standard pad.
The main research questions of the study are as follows:
  • What is the preferred seat pan of the subjects, among standard and shaped ones?
  • Comparing the two-seat pans, how does the comfort/discomfort perception change?
  • Is the shaped seat pan better than the standard one, considering the contact area and the pressure distribution?
  • Does the new shaped seat pad have a positive effect on costs (materials)?
Based on these research questions, our aim is to expand knowledge on the design of seat pans that can increase comfort and reduce discomfort during their use. Similar studies have been carried out in the aeronautical sector [24] and in the office chair sector [22]. The authors’ goals are to demonstrate the validity of these assumptions for car seats also, defining a design roadmap that can be easily replicated to create commercial seat pads that follow human contours without changing the materials.

2. First Step: Shaped Seat Pan Pad Design

2.1. Materials and Methods

2.1.1. Shaped Seat Pan Pad

The shaped seat pan was designed by generating geometries that replicate, as much as possible, human body contours at the buttock–thigh area on the basis of pressure profiles. The idea is to obtain a more uniform pressure distribution on a higher contact area, having, as consequence, higher perceived comfort and lower discomfort when compared with a standard seat pan pad.
In addition, the amount of material used may be reduced by producing a contoured seat, having a positive impact on (material) costs.

2.1.2. Pressure Acquisition

The first step in creating a shaped seat pan pad was to acquire a dataset of pressure maps. The pressure mat “Seat Pressure Measurement System 165”, by Medilogic©, with 480 capacitive sensors (Table 1), was used to obtain the pressure distribution of the participants during the experiments.
The pressure mat was placed on the seat pan; thanks to its flexibility and its minimum thickness (0.8 mm), it was quite unperceivable by the subjects. The pressure mat’s software provided a CSV file as output, in which the following data were recorded:
Minimum, maximum, and mean values of the pressure distribution.
Contact area over time.
Average pressure map over time.
Pressure variation over time.
Barycenter positions on the seat over time.

2.1.3. Setup

A simplified mock-up was used for the experiment (Figure 1); its layout comes from a low-weight quadricycle scheme with fixed seat backrest at 105°, a mean seat pan height equal to 300 mm above the ground, and pedals’ distance to be set by subjects between two values (minimum and maximum distances provided by the car maker).
In order to simulate the driving action, each subject was asked to adjust the distance between the seat and the pedals as he/she prefers by moving the pedal box (thanks to the aid of the experiment conductors).

2.1.4. Data Acquisition

The sample included 41 participants (14 females and 27 males). All of them had a driving license for at least two years. The anthropometric data of the participants are reported in Table 2. The subjects were trained on the experiment protocol and were asked to fill out an informed consent form (by the ethics committee of the University of Salerno).
The participants were asked to assume three different postures on the seat (1—relaxed posture simulating a passenger, no pedal use; 2—pressing the brake pedal; 3—pressing the accelerator pedal) for 60 s each (Figure 2).

2.2. Experimental Results

2.2.1. Pressure Distributions

For each posture, the subjects sat for 30 s to assess their posture, and then pressures were recorded for 30 s at 50 Hz (1500 pressure maps for each posture).
The 123 output files from the Medilogic© software rel. 2016 (3 postures × 41 participants) were processed through two Matlab® scripts.
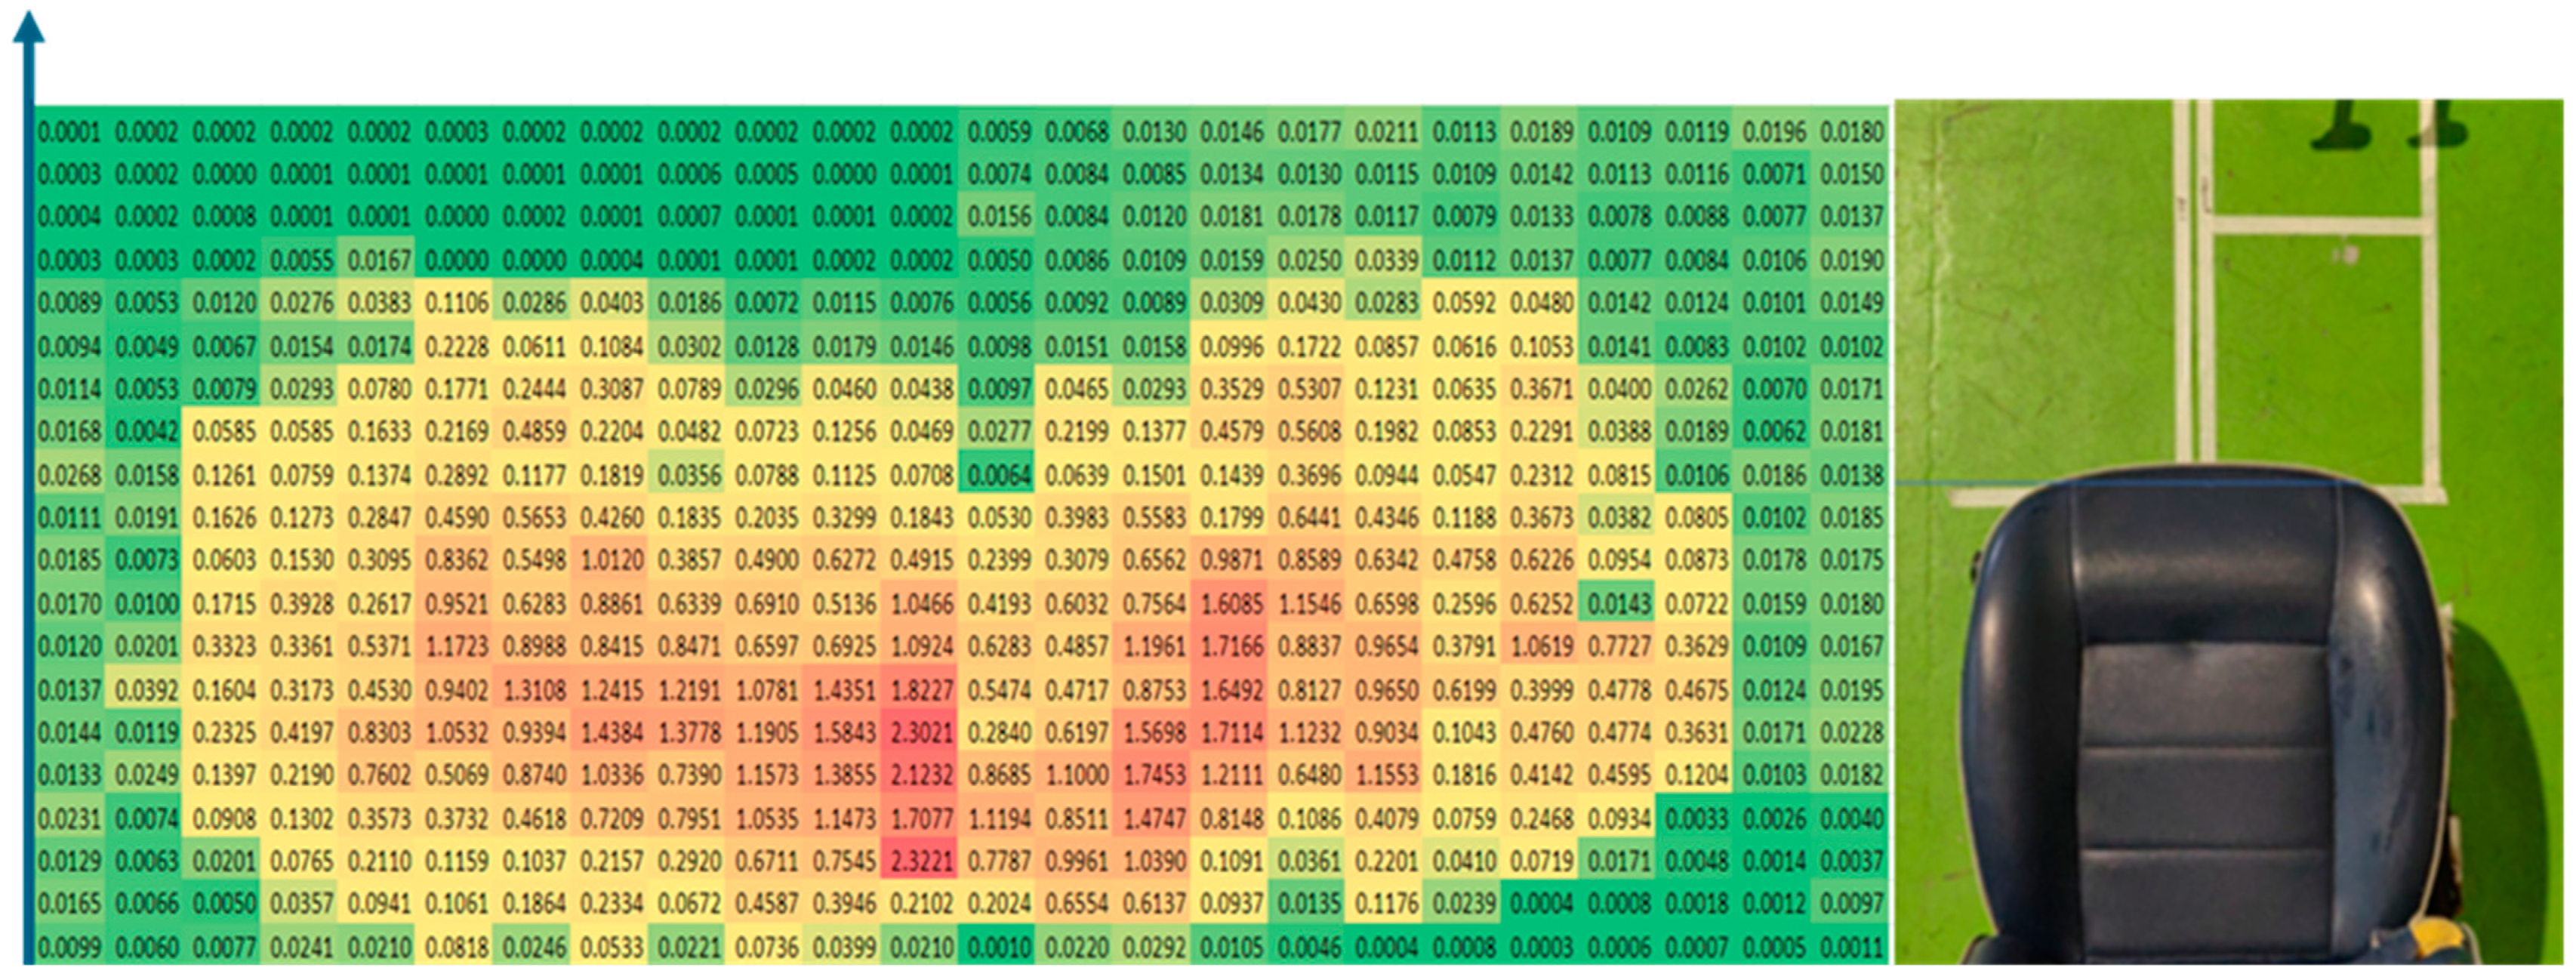
In the first script, each file was processed to obtain an average pressure distribution over the 30 s (among 1500 maps) of measurement. In the second script, obtained data were merged to create three averaged maps, one for each posture (Figure 3, Figure 4 and Figure 5). In pressure maps’ representation, higher pressure values are in red and lower pressure values are in green color.

2.2.2. Developing the 3D Model

Grasshopper® for Rhino 5.0 software, a visual programming language and environment that runs within the Rhinoceros® 3D CAD, was used to create the upper seat pan geometry from the pressure maps by converting pressure values in surface Z-values (the higher the pressure, the deeper the point into the foam).
Figure 6 shows the 3D modeled surface in which the X- and Y-axes are the length and width of the shape obtained by pressure distribution, respectively, and the Z-axis represents the depth of the shape. These three surfaces were exported in Iges format.
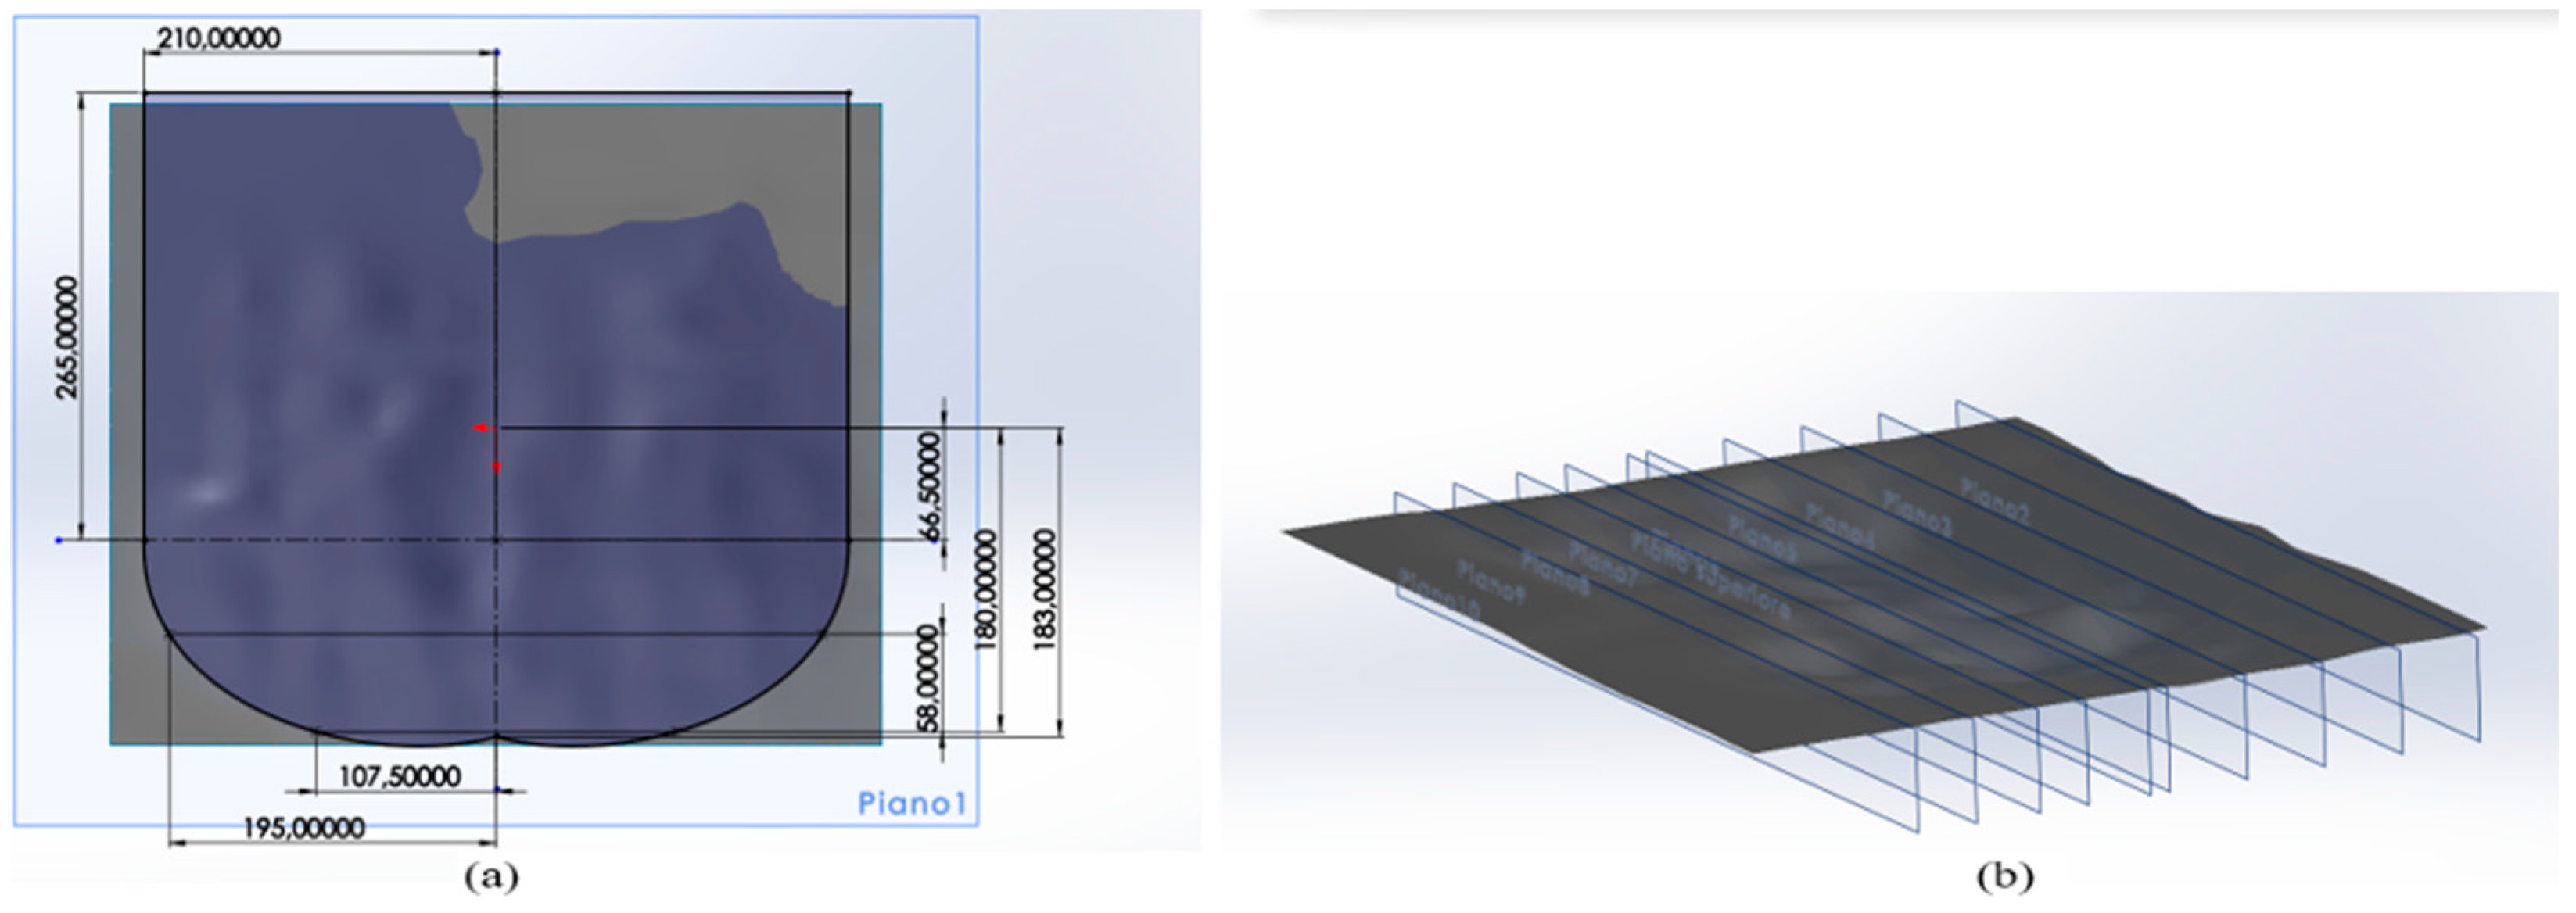
Solidworks® rel. 2020 software was used to create the surface-based solid model of the seat pan (Figure 7a). Auxiliary planes were created (Figure 7b) for comparing the solid models representing the three pressure maps, and for mathematically analyzing them.
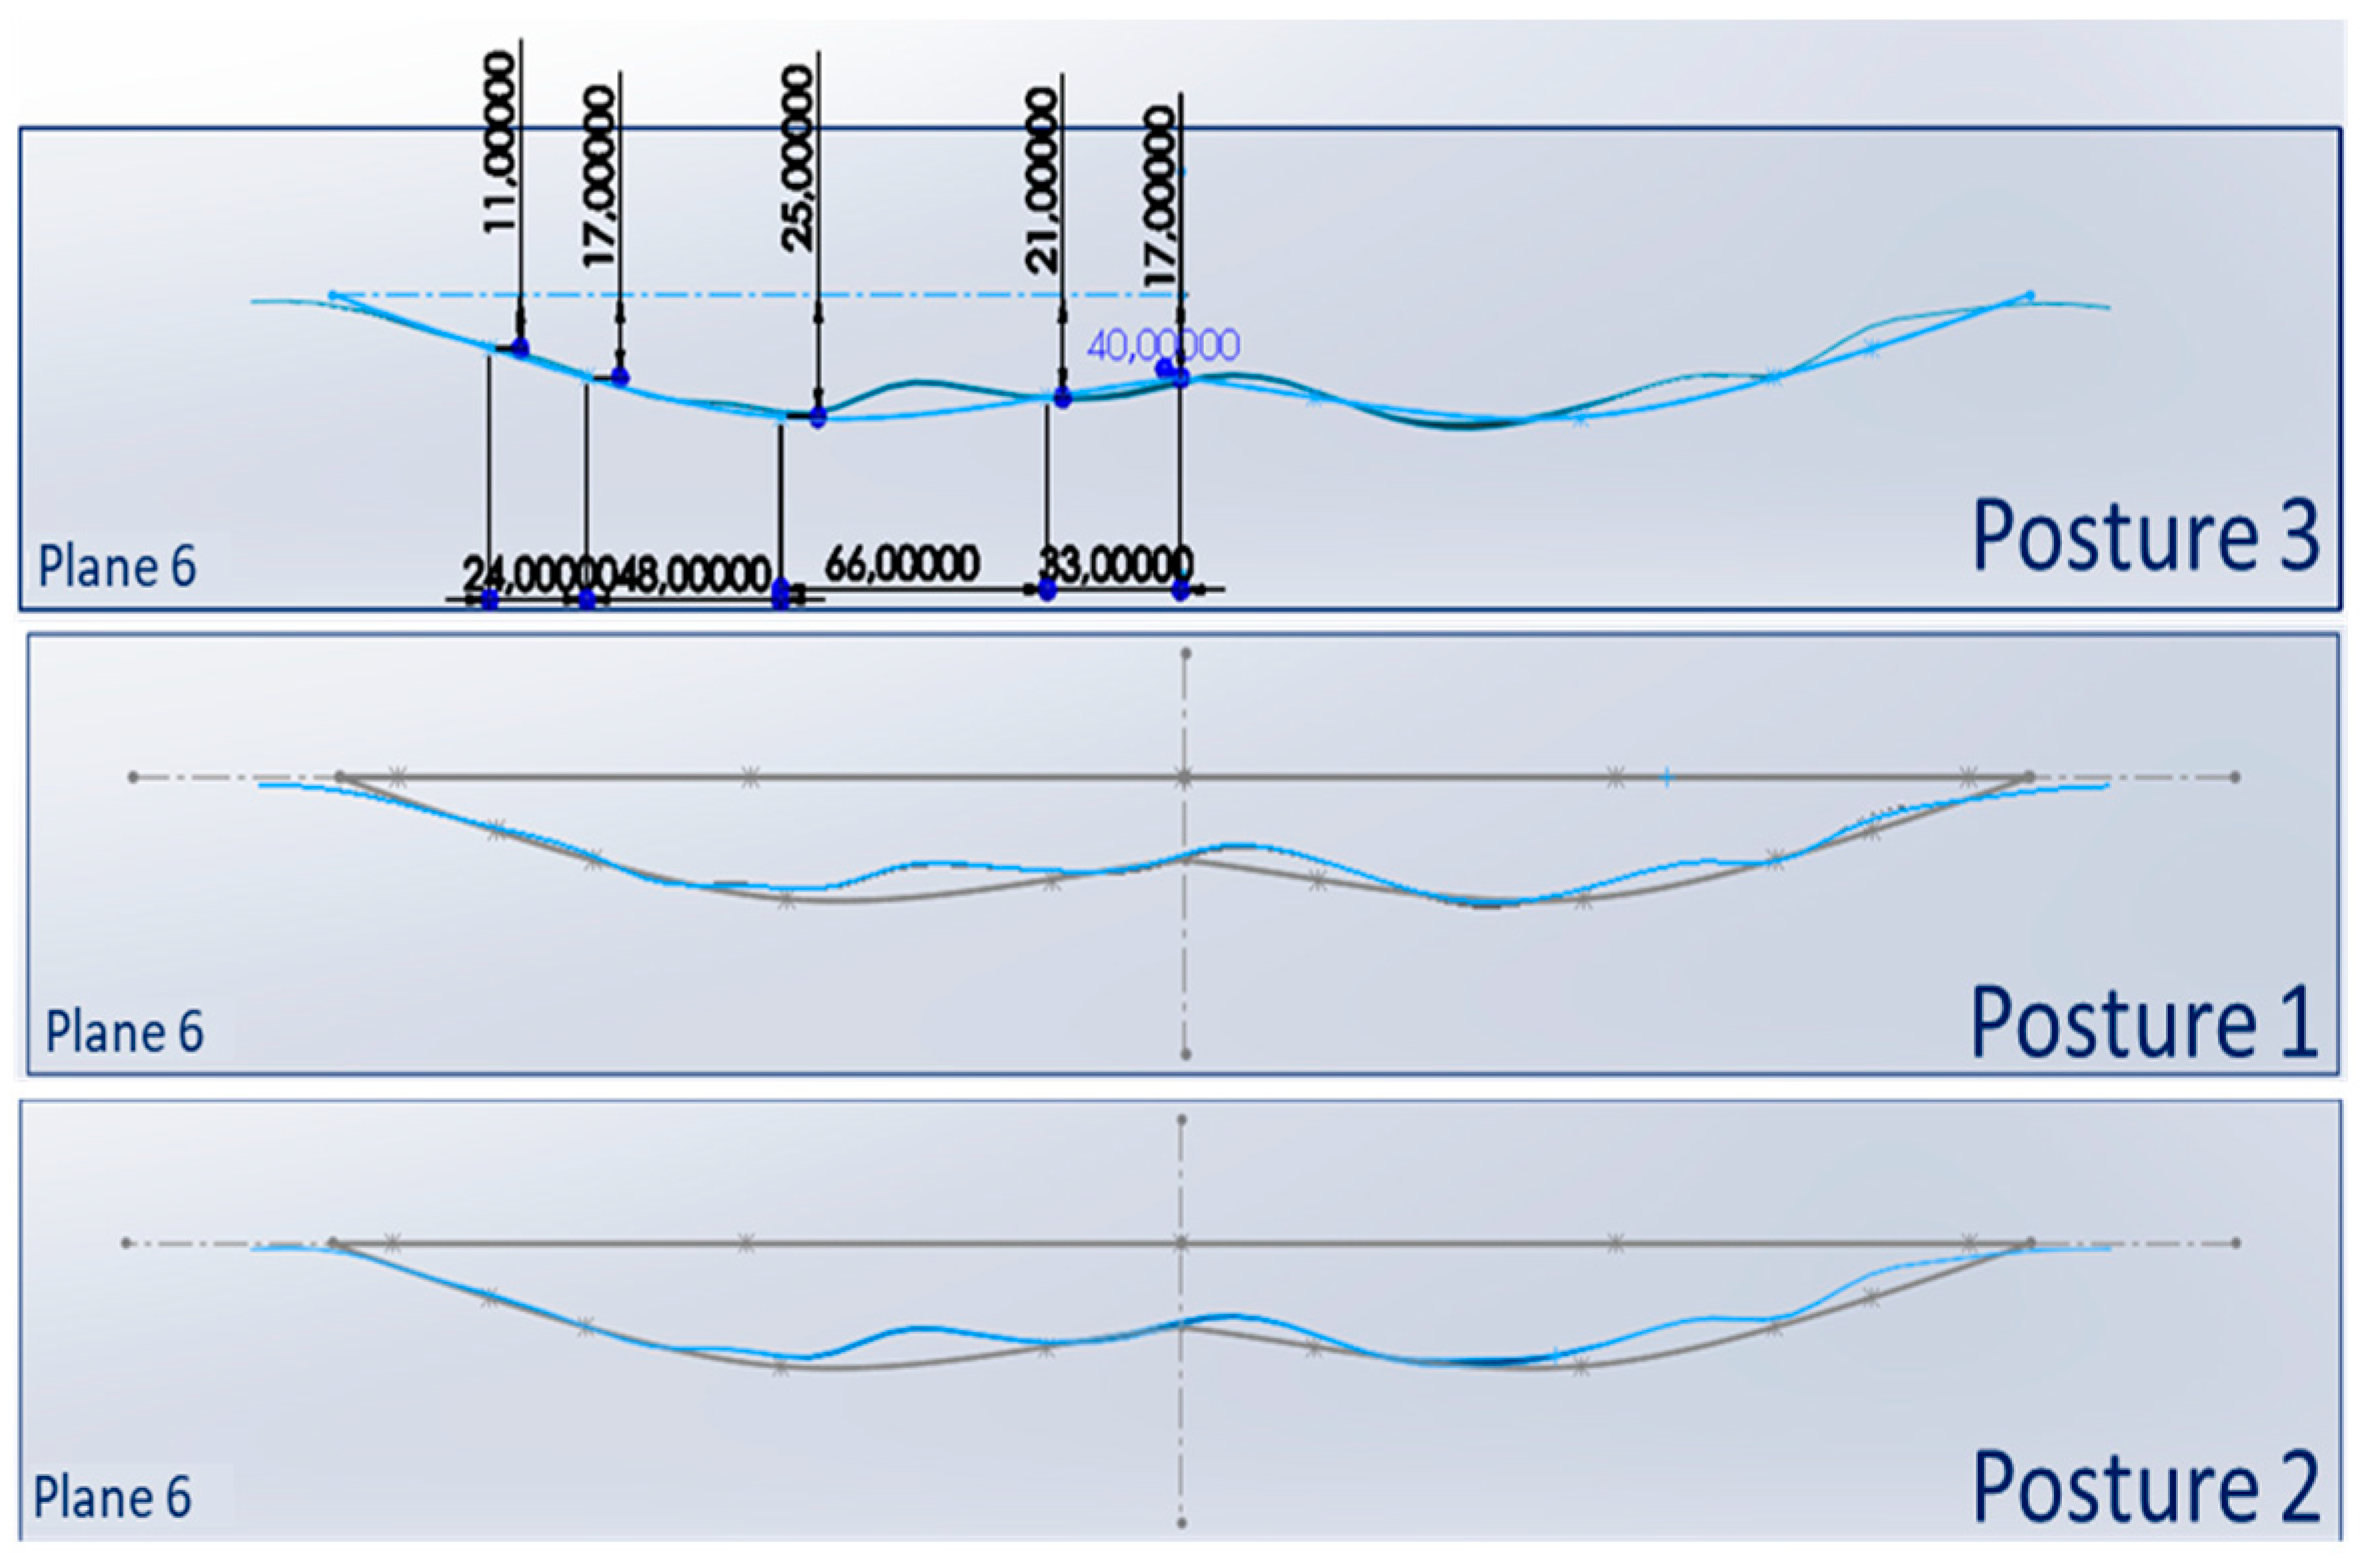
For each slice obtained by the intersection of auxiliary planes (Figure 8) and solid models, three profiles were mathematically merged in order to obtain an average profile. Each profile was smoothed by controlling curvature peaks and uniformity, in order to arrange a workable profile. Finally, the hypothesis of symmetry (right–left) and curvature threshold was used to refine the profiles, in order to obtain a smooth surface by interpolating the obtained profiles. The final Solidworks® virtual prototype of the seat pan is shown in Figure 9.

2.2.3. Developing the 3D Prototype

Polyurethane foam was selected as the prototyping material (Figure 10a). It is also a sustainable choice because through chemical recycling processes, such as glycolysis and hydrolysis, it is possible to recycle raw materials and extract fuel from used foam. It was sprayed into a mold built from a wooden block (550 × 550 × 90 mm) for creating the physical model. Finally, the seat pan pad was covered with an elastic fabric and was integrated into the seat (Figure 10b). No glue was applied between the foam and the cover, in order to separate the mechanical behavior of the foam from the cover, thus preserving the foam’s flexibility. The shaped pad showed a weight reduction equal to 7%, having a weight of 1020 g if compared with the standard one, whose weight is 1095 g.

3. Second Step: Validation of Prototype

3.1. Materials and Methods

3.1.1. Experimental Protocol

The designed pad was integrated into a car seat, and experiments were performed to compare two car seats (the first with the shaped seat pan and the second with a standard seat pan). The aim was to detect differences in (dis)comfort perception, pressure distribution, and contact area. The experimental protocol respects the guidelines of the ethics committee at the University of Salerno in Italy.
Subjective data were obtained through a questionnaire. Before the test, participants were informed about the topic and purposes of the test; then, they filled out the informed consent form before the experiments.
The test was divided into two parts: a 1-min test for comfort assessment and a 15-min test for discomfort assessment. As comfort and discomfort are independent entities associated with different factors [26], the tests were performed in different sessions with different subjects. In this way, we avoided the discomfort assessment being influenced by the comfort assessment tests and the reciprocal influence among the participants.
In the “1 min” test, participants were asked to sit alternately on car seats and answer the comfort questionnaire to gather data about the overall comfort and general personal feelings about the seat pan pads.
In the “15 min” test, a short trip duration was simulated in order to check discomfort perception while people interacted with both seats, alternately, for a longer time. After each test, the discomfort perceptions were gathered through the discomfort questionnaire, and pressure data were collected using the Medilogic® pressure mat.
The subjects were seated in pairs (to prevent order effects), and experienced each seat pan (flat and shaped) in a random order through the Latin Square Method [27]. In order to avoid the effect of the previous test on the following, while testing the two seats, participants were asked to walk or relax for 5 min between one test and the other; after experiencing both seat pan pads, the participants were asked to indicate their seat pan pad’s preference and explain the reason(s) for their choice.

3.1.2. Participants

Thirty-three subjects, including eight women and twenty-five men, whose age was between 19 and 28, performed the “1 min” test.
Nineteen subjects, including eight women and eleven men, whose age was between 22 and 34, performed the “15 min” test.
Participants’ anthropometric data were measured, and are shown in Table 3 and Table 4.

3.1.3. Setup

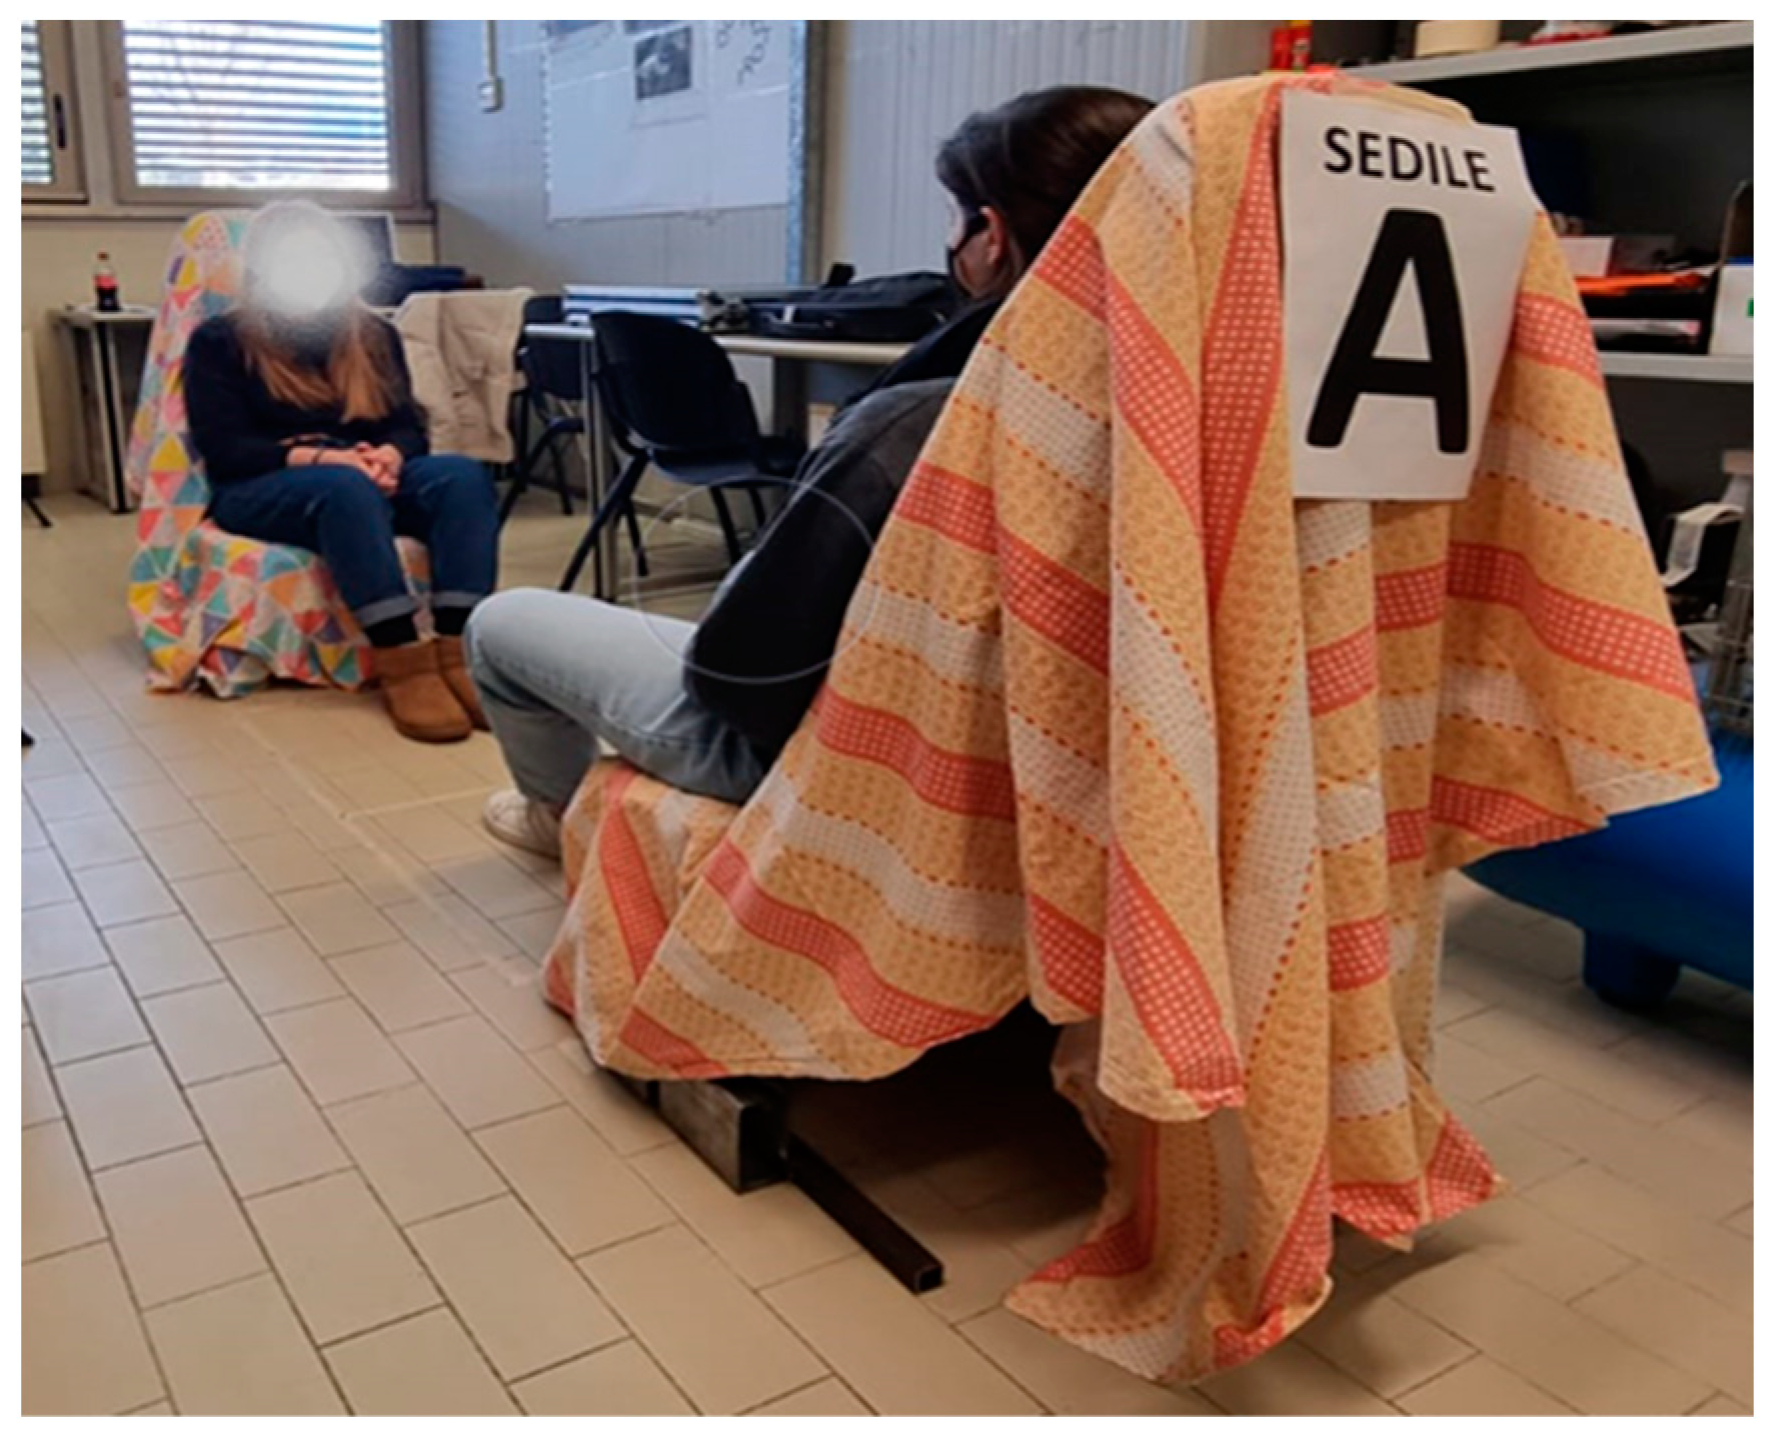
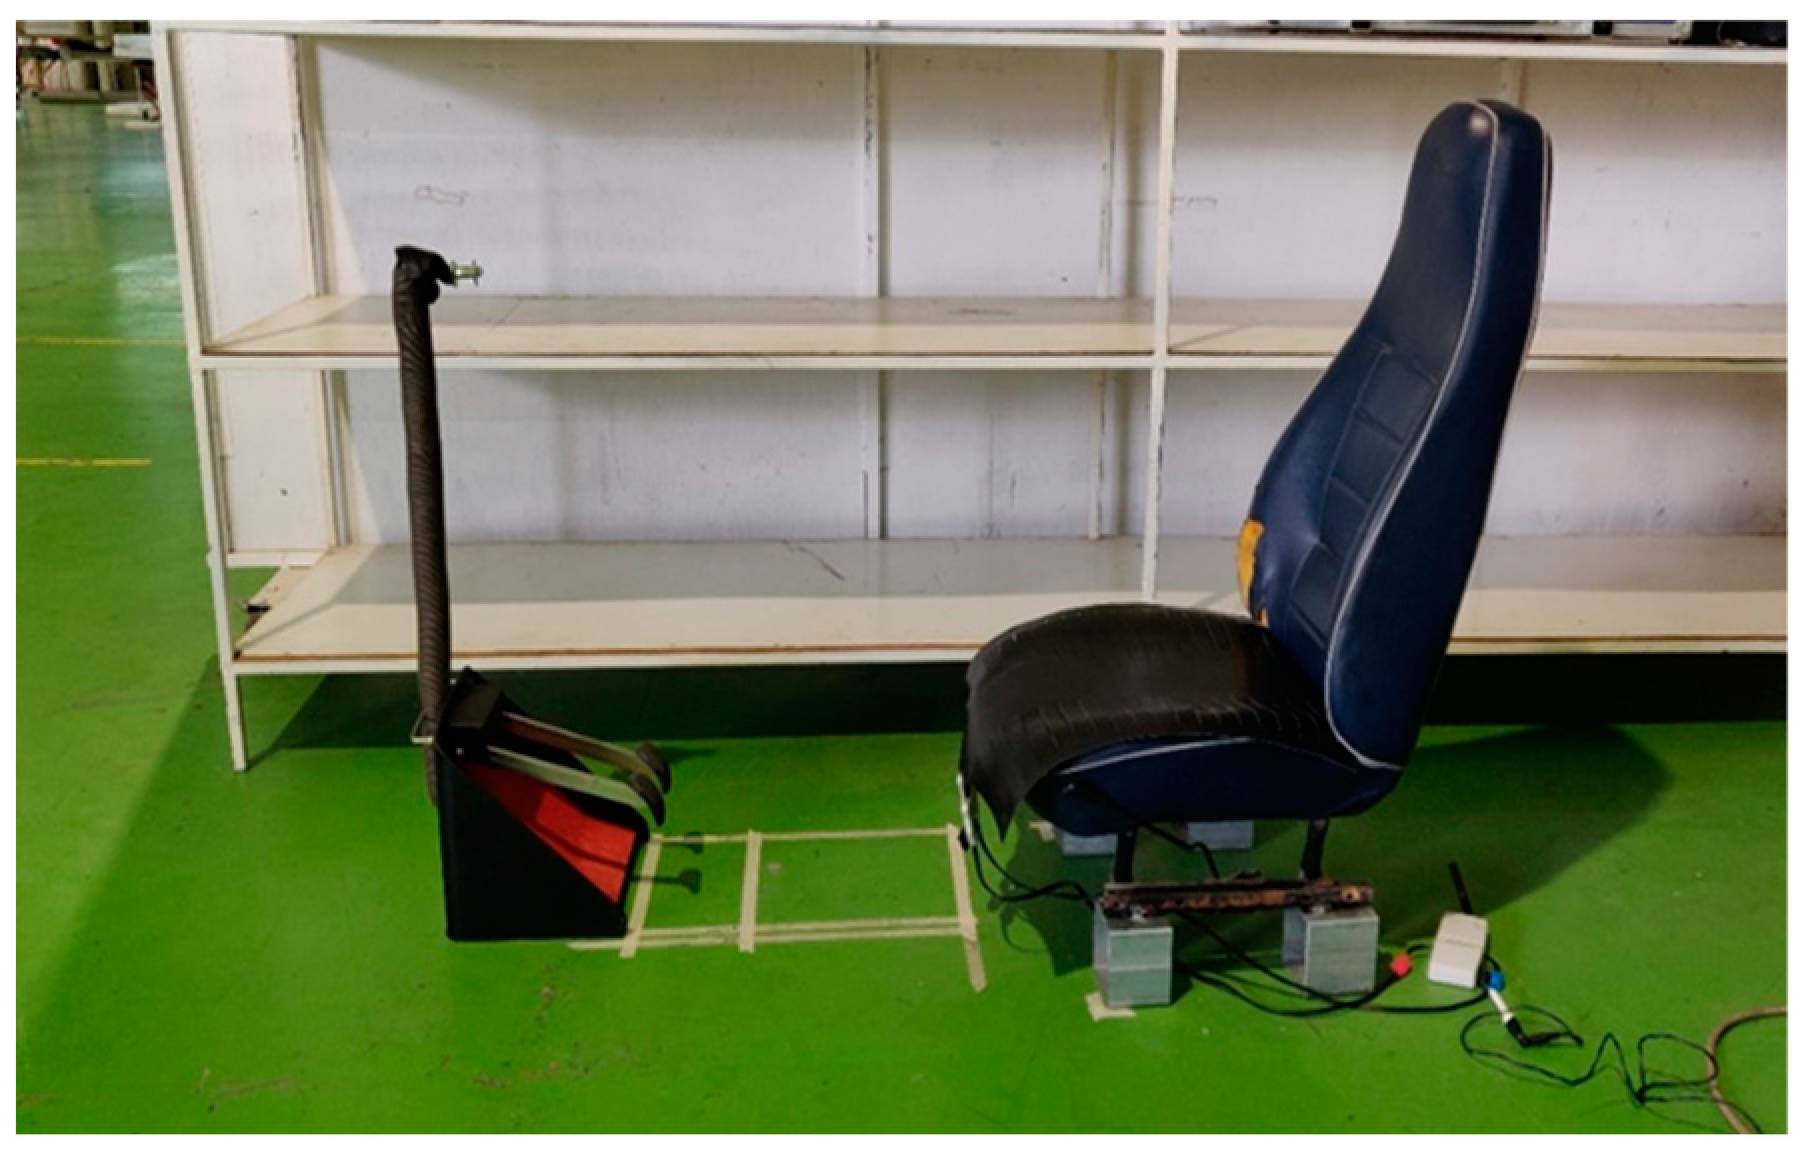
A simplified setup was used for both experiments (Figure 11). The shaped seat pan pad was integrated into a standard seat. The seat’s backrest angle was fixed at 105°, and the seat pan’s height was 300 mm above the ground. The two seats were named A and B:
A.
“Standard or flat pan”, as commonly used in a standard seat;
B.
“Shaped pan”, which was built as described in previous paragraphs.
Both seats were covered by a bedsheet to perform blind tests, and were identified only with the letters A and B. Blind tests allowed participants to not be influenced by the aesthetic aspects and expectations [27] during the discomfort assessment.

3.1.4. Questionnaires

In order to acquire the subjective perceptions, two questionnaires were prepared.
The perceived comfort questionnaire (“1 min” test) consists of two questions about the following:
  • Overall perceived comfort (from 1 = No Comfort to 5 = Extreme Comfort) [25].
  • Personal feelings about the seat pan pads (comfortable, hard, annoying, indifferent, flabby, soft, flat, contoured, uncomfortable, and firm).
The perceived discomfort questionnaire (“15 min” test) consists of three questions about the following:
  • Overall perceived discomfort (from 1 = No Discomfort to 5 = Extreme Discomfort).
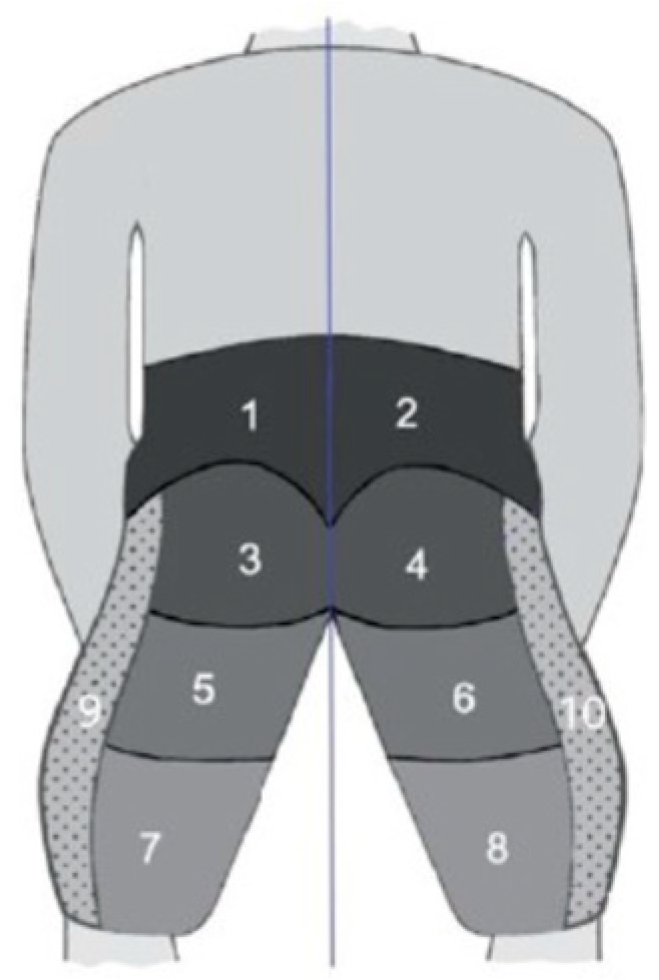
  • Body part discomfort (BPD) (from 1 = No discomfort to 5 = Extreme Discomfort) [14] for each part of the body (Figure 12).
  • Personal feelings about the seat pan pads (comfortable, hard, annoying, indifferent, flabby, soft, flat, contoured, uncomfortable, firm, or other).
After experiencing both seat pan pads, the participants were asked to indicate their preferred pad. They did not know the real difference between them, as it was a blind test.

4. Experimental Results and Discussion

4.1. (Dis)comfort Data

After processing the acquired data, it was noted that 26 of 33 participants after the “1 min” test and 10 of 19 participants after the “15 min” test preferred the shaped pan instead of the standard one. This means that, as an average of all performed tests, 78.8% of the participants chose the shaped seat pan. Furthermore, the results show that the preference for the shaped seat pan was immediately evident during the “1 min” test; this also justifies the choices of the authors in preparing two different tests for evaluating comfort and perceived discomfort as two separate entities [25].
The cross-analysis of the data showed that the preferred seat, chosen after experimenting with both, obtained higher comfort and lower discomfort values in the specific questionnaire for that seat pan pad. Statistical analysis showed a significant correlation between the (dis)comfort ranking and the preferred seat pan pad (Spearman coefficient = 0.615) (Table A1 in Appendix A). This demonstrates the consistency in participants’ responses.
The descriptive adjectives data correlated to the two seat pans were analyzed. Figure 13 and Figure 14 show the occurrences of participants that chose each adjective to describe the seat pans.
The shaped seat pan appeared softer due to the lower mean pressure distribution and the higher contact area. This seat pan pad was more comfortable and more appropriate to the body shape, confirming the literature studies [18,22,28,29]. The shaped seat pan was rated as “enveloping” in the comments. The flat seat pan pad seemed to be firmer than the shaped one due to its geometrical characteristics (the material being exactly the same). Participants who preferred it stated that (in open questions) the flat seat pan supported their body weight better.
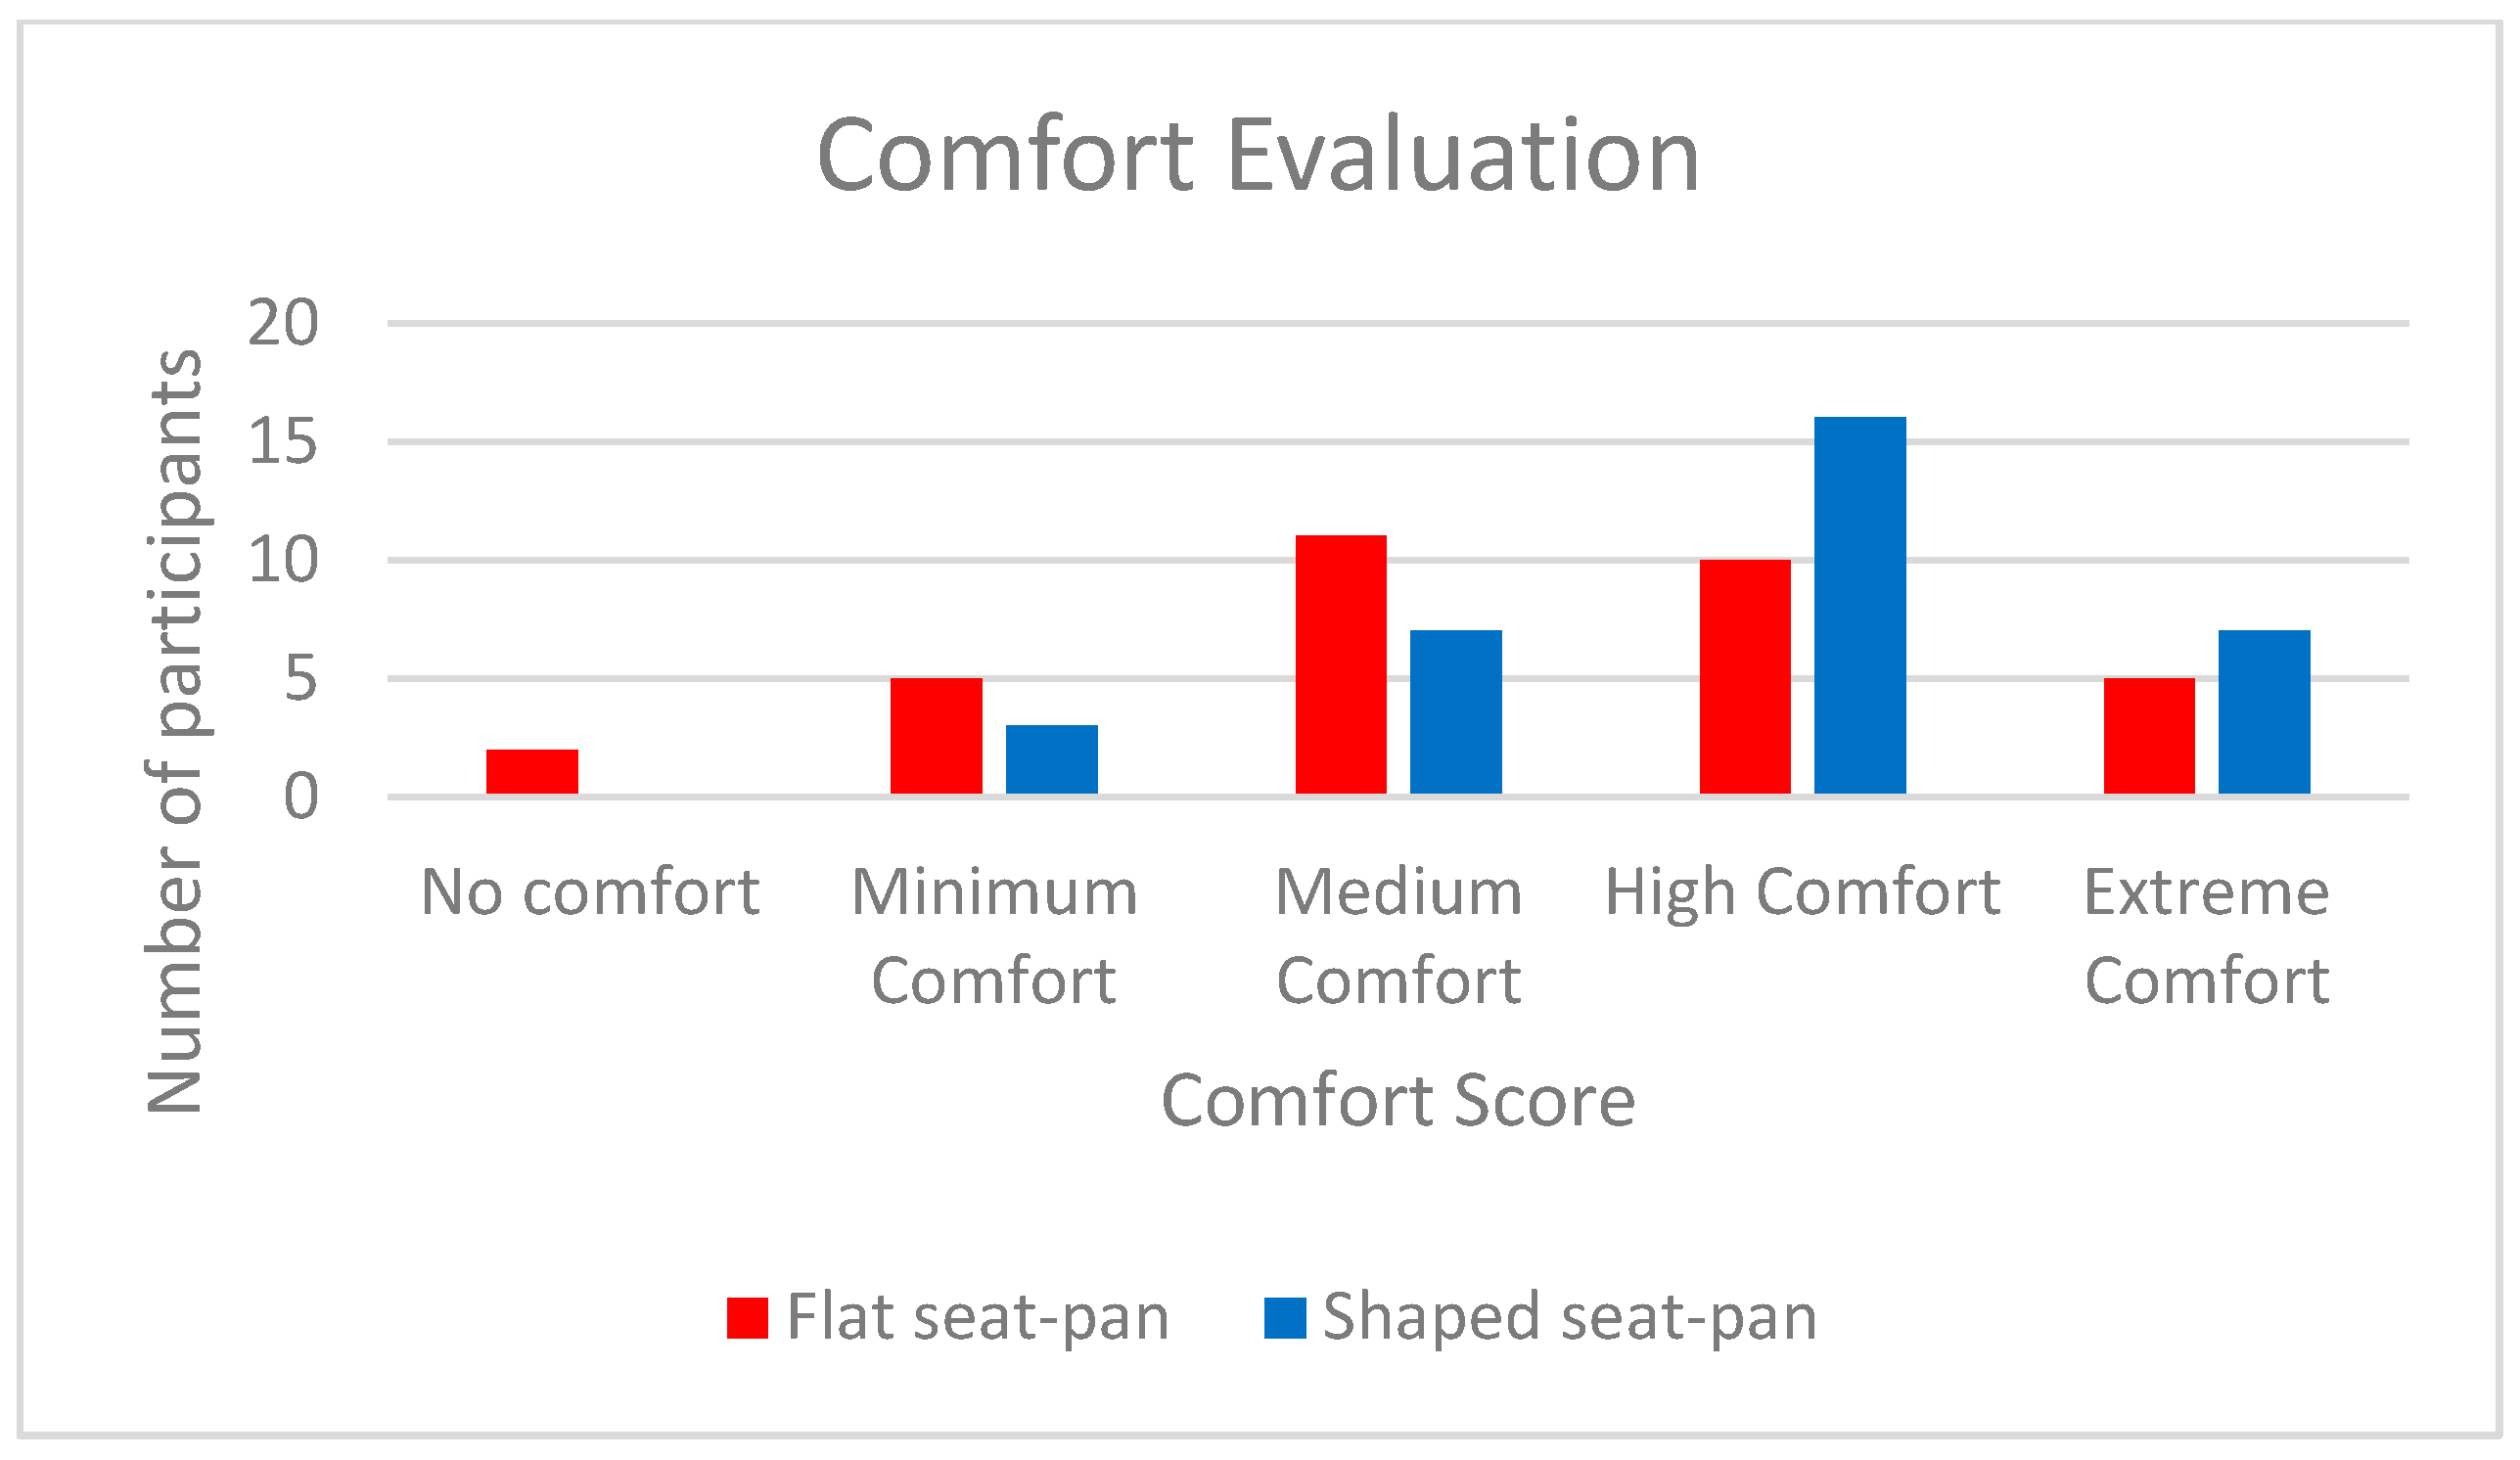
The histogram in Figure 15 shows the distribution of comfort scores given by participants.
Table 5 shows the discomfort average score for each body part for the seat pans; the highest values are related to the lumbar and buttocks areas (zones 1, 2, 3, and 4). The sensitivity of the human buttocks is different both for the same seat pan pad and between the flat and shaped ones [10]. For these areas where the sensitivity to discomfort is higher, the shaped seat pan solution brought improvements, exhibiting lower discomfort values.
Table 6 and Table 7 show the number of participants that answered the questionnaires rating the perceived discomfort score (from no discomfort to extreme discomfort), for each body part.
For the flat seat pan, participants provided ratings ranging from low to high discomfort. One person even rated the discomfort in zone 10, as experiencing extreme discomfort.
In Table 7, values show that participants provided ratings ranging from no discomfort to extreme discomfort scores to the shaped seat pan.
Correlation analysis showed a strong correlation between seat preference and buttocks discomfort (left and right sides), with Spearman coefficients equal to −0.728 and −0.654, respectively. In fact, participants that preferred the flat or shaped seat pan pad declared that they perceived less discomfort in the buttocks area. This negative correlation indicates that, in the choice of the preferred pad, buttocks discomfort played an important role.
The data analysis, moreover, showed that 100% of the female participants preferred the shaped pad; this is probably due to the different physical conformation of the pelvis.
Moreover, the Spearman index showed strong positive correlations between the discomfort assessment of two adjacent body parts (Table A2 and Table A3 in Appendix A). This suggests that two body parts, in proximity, influence each other’s discomfort levels or, alternately, that it is difficult to identify the precise area where the discomfort is concentrated. No correlation was found regarding the anthropometric characteristics of the participants. The contoured seat was preferred by about 80% of the sample. Considering that the sample for both tests sufficiently varied in height and weight (Table 3 and Table 4), this means that anthropometric characteristics cannot be considered as a “factor of influence” while experiencing the shaped seat.

4.2. Pressure Distribution and Contact Area

The pressure mat data (for both pads), acquired during the validation phases (15 min for each solution), were analyzed. For each solution (flat and shaped seat pans) and each participant, a single average pressure and contact area map was obtained.
Then, the two maps from the two solutions for each participant were compared. In particular, data from the shaped pad were subtracted from standard pad data: negative values of average pressure mean that the mean pressure on the shaped pad is lower than the flat pad. Positive values of contact area mean that the contact area on the shaped pad is larger than the flat pad.
Finally, the mean values (Table 8) show the trend of the results, demonstrating that the shaped pad allows lower mean pressure and a larger contact area than the flat pad, like the scientific literature confirms [22,30,31]. The subjective data (perceived comfort and discomfort) were statistically validated through the objective data (pressure distribution and contact area).

5. Limitations

There were several potential limitations in this study. Firstly, the tests were made in a different environment than a vehicle, so evaluations were performed under static conditions without the dynamic effects of the road. Secondly, the sample involved in the (dis)comfort rating tests was very small considering the age distribution; in fact, most part of the subjects were university students with ages ranging between 19 and 34. Thirdly, the inability to properly adjust the seat according to preferences (this might not have been a limitation; in fact, the seat is designed for vehicles in which regulations are limited) may have influenced the subjective ratings. Lastly, the samples involved in the comfort and discomfort evaluation tests belong to different human percentiles towards a limited number of participants.

6. Conclusions

The car seat’s function is to provide comfortable seating posture for occupants. An uncomfortable seat increases the risk of health issues and discomfort perception. Consequently, the seat plays an essential role in the car design process. A shaped seat pan was designed to follow the buttock–thigh contour. A special procedure was applied to create the enveloping shape of the seat pan pad: the pressure distributions of 41 participants were acquired and processed. Participants were asked to assume three different postures on a standard car seat (1—relaxed posture simulating a passenger, no pedal use; 2—pressing the brake pedal; 3—pressing the accelerator pedal) for 60 s each. The pressure data were opportunely processed to generate the geometric characteristics that were obtained using Matlab® and Grasshopper®, then merged to create a final solid model of the shaped pan to be manufactured with a low-pressure foaming machine and integrated into a standard car seat. The proposed design approach is easily replicable and modifiable using virtual prototyping techniques and physical prototyping activities. The aim was to compare the proposed seat pan (shaped pan) and the standard one (flat plan) in terms of comfort and discomfort perceptions, and to validate the comparison using objective data acquired by a pressure mat at the interface between the subject and car seat. To avoid any potential influences on the participants’ perceptions and expectations, two blind tests were conducted: the first one (the comfort assessment), in which 33 participants tested the two solutions, for 1 min each; and the second one (the discomfort assessment), in which 19 participants (not the same as the previous test) tested each solution for 15 min. In both tests, the shaped seat pan pad was preferred by 79% of the participants, and 100% of the female participants preferred the shaped seat pan.
Generally, the shaped seat pan pad was considered more suited and “enveloping”. Comfort and discomfort data confirmed the participants’ preference: the shaped seat pan pad scored higher for comfort level than the flat one, and less for local discomfort level, especially in the buttocks area. Regarding the objective data (pressure mat data), the results showed that the shaped pad was the best solution in terms of better pressure distribution and lower pressure peaks, thanks to its larger contact area than the flat pad. This study confirms the scientific literature about the influence of pressure distribution and contact area on (dis)comfort perception. Furthermore, it shows a new design roadmap that is easy to replicate, in order to create commercial seat pads based on the physical interaction data between human buttocks and the seat itself.

Author Contributions

Methodology, A.N. and R.C.; Software, A.M.; Validation, A.N. and A.M.; Formal analysis, A.M.; Investigation, A.M. and R.C.; Writing—original draft, A.M. and R.C.; Writing—review & editing, A.N.; Visualization, R.C. All authors have read and agreed to the published version of the manuscript.

Funding

This research received no external funding.

Data Availability Statement

Data are contained within the article.

Acknowledgments

The shaped seat pan was furnished by MGR s.r.l., for research purposes. Many thanks for the support during the design phase. Experimental tests were performed in a laboratory of the Department of Industrial Engineering at the University of Salerno, Italy. Many thanks to engineering students, who gave us their time and patience in carrying out many hours of tests.

Conflicts of Interest

The authors declare that they have no known competing interests or personal relationships that could have appeared to influence the research reported in this article.

Appendix A

The following tables show results of the correlation analysis conducted with SPSS v26.
Refer to the following legend: ** Correlation is significant at the 0.01 level (2-tailed); * correlation is significant at the 0.05 level (2-tailed).
Table A1. Comfort test correlation analysis.
First Seat Tested?How Comfortable Do You Rate the Seat You Just Tried?Preferred Seat?
Flat Seat PanShaped Seat Pan
Ages−0.1940.0270.2830.083
Gender? M = 1. F = 2−0.159−0.3200.2790.294
Weight (kg)0.2170.080−0.294−0.090
Height (cm)0.1180.166−0.272−0.160
BMI0.1560.110−0.135−0.035
Waist circumference (cm)0.1780.089−0.074−0.027
Hip circumference (cm)0.1180.121−0.1250.004
WHR0.0890.077−0.024−0.074
First seat tested?1.000−0.033−0.0510.090
How comfortable do you rate the seat you just tried?Flat−0.0331.0000.073−0.343
Shaped−0.0510.0731.0000.615 **
Refer to the following picture as a reference for the different parts of the body.
Figure A1. Reference image.
Machines 12 00374 g0a1
Table A2. Discomfort test correlation analysis—flat.
Flat: Judge the Level of Discomfort Perceived for the Following Body Parts.
[1][2][3][4][5][6][7][8][9][10]Global
Flat: Judge the level of discomfort perceived for the following body parts.[1]1.0000.781 **0.019−0.0090.3770.2890.3290.3280.505 *0.504 *0.482 *
[2]0.781 **1.0000.3380.2810.498 *0.512 *0.2830.3090.622 **0.627 **0.678 **
[3]0.0190.3381.0000.950 **0.1810.1930.0110.1350.1690.1870.473 *
[4]−0.0090.2810.950 **1.0000.1300.197−0.0350.0810.1230.1460.443
[5]0.3770.498 *0.1810.1301.0000.862 **0.725 **0.797 **0.567 *0.575 *0.301
[6]0.2890.512 *0.1930.1970.862 **1.0000.725 **0.676 **0.577 **0.587 **0.427
[7]0.3290.2830.011−0.0350.725 **0.725 **1.0000.943 **0.556 *0.565 *0.271
[8]0.3280.3090.1350.0810.797 **0.676 **0.943 **1.0000.512 *0.525 *0.299
[9]0.505 *0.622 **0.1690.1230.567 *0.577 **0.556 *0.512 *1.0000.998 **0.557 *
[10]0.504 *0.627 **0.1870.1460.575 *0.587 **0.565 *0.525 *0.998 **1.0000.573 *
Global0.482 *0.678 **0.473 *0.4430.3010.4270.2710.2990.557 *0.573 *1.000
Ages−0.0090.036−0.179−0.1610.3670.3540.1590.0650.3620.350−0.136
Gender? M = 1 F = 20.3460.458 *−0.145−0.1840.547 *0.547 *0.577 **0.525 *0.557 *0.567 *0.369
Weight (kg)−0.396−0.515 *−0.052−0.023−0.251−0.334−0.207−0.101−0.503 *−0.511 *−0.334
Height (cm)−0.324−0.549 *−0.0360.059−0.407−0.454−0.473 *−0.412−0.637 **−0.641 **−0.377
BMI−0.439−0.4060.0550.026−0.103−0.1720.0200.137−0.313−0.312−0.167
Waist circum. (cm)−0.390−0.551 *−0.051−0.095−0.162−0.298−0.1000.008−0.362−0.371−0.416
Hip circum. (cm)−0.326−0.2430.2390.265−0.097−0.180−0.1250.021−0.177−0.173−0.044
WHR−0.306−0.523 *−0.267−0.359−0.196−0.283−0.081−0.088−0.394−0.413−0.634 **
Shaped: Judge the level of discomfort perceived for the following body parts.[1]0.3390.3760.051−0.0390.065−0.089−0.269−0.1960.1420.114−0.165
[2]0.2080.376−0.0460.046−0.0200.071−0.296−0.2420.1670.1550.218
[3]−0.193−0.1260.1050.0120.060−0.0830.0860.135−0.055−0.080−0.256
[4]−0.160−0.0320.3620.3700.1270.0360.0690.1710.004−0.007−0.070
[5]0.3840.4160.2950.2010.3610.1690.2890.3910.3900.3630.206
[6]0.2120.2580.1730.0970.166−0.0300.1260.2530.1880.1600.000
[7]−0.212−0.017−0.144−0.1170.1940.4000.1780.1320.005−0.0120.000
[8]−0.230−0.015−0.108−0.0750.1640.3950.1480.103−0.012−0.0280.030
[9]0.1850.205−0.136−0.193−0.225−0.225−0.239−0.2850.0900.075−0.198
[10]0.1910.191−0.290−0.326−0.135−0.135−0.150−0.1900.005−0.012−0.236
Global−0.178−0.1190.0730.090−0.272−0.359−0.360−0.312−0.230−0.256−0.307
Preferred seat?0.2460.197−0.075−0.0120.2600.2600.0780.1270.1320.1450.223
Table A3. Discomfort test correlation analysis—shaped.
Shaped: Judge the Level of Discomfort Perceived for the Following Body Parts.
[1][2][3][4][5][6][7][8][9][10]Global
Flat: Judge the level of discomfort perceived for the following body parts.[1]0.3390.208−0.193−0.1600.3840.212−0.212−0.2300.1850.191−0.178
[2]0.3760.376−0.126−0.0320.4160.258−0.017−0.0150.2050.191−0.119
[3]0.051−0.0460.1050.3620.2950.173−0.144−0.108−0.136−0.2900.073
[4]−0.0390.0460.0120.3700.2010.097−0.117−0.075−0.193−0.3260.090
[5]0.065−0.0200.0600.1270.3610.1660.1940.164−0.225−0.135−0.272
[6]−0.0890.071−0.0830.0360.169−0.0300.4000.395−0.225−0.135−0.359
[7]−0.269−0.2960.0860.0690.2890.1260.1780.148−0.239−0.150−0.360
[8]−0.196−0.2420.1350.1710.3910.2530.1320.103−0.285−0.190−0.312
[9]0.1420.167−0.0550.0040.3900.1880.005−0.0120.0900.005−0.230
[10]0.1140.155−0.080−0.0070.3630.160−0.012−0.0280.075−0.012−0.256
Global−0.1650.218−0.256−0.0700.2060.0000.0000.030−0.198−0.236−0.307
Ages0.1450.0110.2570.1860.104−0.0170.2240.1850.053−0.0150.097
Gender? M = 1 F = 2−0.182−0.021−0.215−0.260−0.051−0.192−0.092−0.107−0.164−0.092−0.464 *
Weight (kg)0.0660.0910.511 *0.512 *0.1640.3670.3490.3420.0470.1740.547 *
Height (cm)0.0400.0290.1760.229−0.1120.0430.0580.064−0.047−0.0290.434
BMI−0.0390.0370.567 *0.544 *0.1950.4000.3860.3790.0260.1870.429
Waist circum. (cm)0.080−0.0150.535 *0.4540.1550.3610.1720.160−0.0270.1350.337
Hip circum. (cm)0.0440.2840.552 *0.652 **0.2840.477 *0.2090.210−0.0260.1590.542 *
WHR0.193−0.1880.469 *0.1980.0110.2100.1330.1090.0920.1580.195
Shaped: Judge the level of discomfort perceived for the following body parts.[1]1.0000.521 *0.3790.2760.4200.532 *0.1020.0820.673 **0.596 **0.539 *
[2]0.521 *1.0000.1450.2930.2430.3710.3350.3500.2730.4160.462 *
[3]0.3790.1451.0000.853 **0.600 **0.729 **0.2680.2380.1480.2680.778 **
[4]0.2760.2930.853 **1.0000.631 **0.651 **0.2540.2460.0660.2280.754 **
[5]0.4200.2430.600 **0.631 **1.0000.880 **0.1780.1570.1010.1780.458 *
[6]0.532 *0.3710.729 **0.651 **0.880 **1.0000.2280.2060.1560.2280.634 **
[7]0.1020.3350.2680.2540.1780.2281.0000.997 **0.2270.2940.245
[8]0.0820.3500.2380.2460.1570.2060.997 **1.0000.2060.2710.232
[9]0.673 **0.2730.1480.0660.1010.1560.2270.2061.0000.873 **0.392
[10]0.596 **0.4160.2680.2280.1780.2280.2940.2710.873 **1.0000.452
Global0.539 *0.462 *0.778 **0.754 **0.458 *0.634 **0.2450.2320.3920.4521.000
Preferred seat?−0.193−0.038−0.728 **−0.654 **−0.322−0.398−0.167−0.149−0.380−0.501 *−0.697 **
Table A4. Discomfort test correlation analysis.
Preferred Seat?
Flat: Judge the level of discomfort perceived for the following body parts.[1]0.246
[2]0.197
[3]−0.075
[4]−0.012
[5]0.260
[6]0.260
[7]0.078
[8]0.127
[9]0.132
[10]0.145
Global0.223
Ages−0.024
Gender? M = 1 F = 20.440
Weight (kg)−0.590 **
Height (cm)−0.344
BMI−0.636 **
Waist circum. (cm)−0.460 *
Hip circum. (cm)−0.618 **
WHR−0.259
Shaped: Judge the level of discomfort perceived for the following body parts.[1]−0.193
[2]−0.038
[3]−0.728 **
[4]−0.654 **
[5]−0.322
[6]−0.398
[7]−0.167
[8]−0.149
[9]−0.380
[10]−0.501 *
Global−0.697 **
Preferred seat?1.000

References

  1. Purdy, K.W.; Cromer, G.C.; Cromer, O.C.; Foster, C.G. Automobile. Encyclopedia Britannica. 2024. Available online: https://www.britannica.com/technology/automobile/Cooling-system (accessed on 15 January 2024).
  2. Gokila, P.; Suresh, P. Parameters Influenced in Car Seat Design from Ergonomic Perspectives—A Review. Appl. Mech. Mater. 2014, 592–594, 2534–2538. Available online: https://www.scientific.net/AMM.592-594.2534 (accessed on 15 January 2024).
  3. Kale, H.N.; Dhamejani, C.L. Design parameters of driver seat in an automobile. Int. J. Res. Eng. Technol. 2015, 4, 448–452. [Google Scholar]
  4. Hiemstra-van Mastrigt, S.; Groenesteijn, L.; Vink, P.; Kuijt-Evers, L. Predicting passenger seat comfort and discomfort on the basis of human, context and seat characteristics: A literature review. Ergonomics 2016, 60, 889–911. [Google Scholar] [CrossRef] [PubMed]
  5. Vink, P.; Bazley, C.; Kamp, I.; Blok, M. Possibilities to improve the aircraft interior comfort experience. Appl. Ergon. 2012, 43, 354–359. Available online: http://www.sciencedirect.com/science/article/pii/S0003687011000846 (accessed on 15 January 2024). [CrossRef] [PubMed]
  6. Vink, P. Vehicle Seat Comfort and Design, 1st ed.; Pumbo: Zwaag, The Netherlands, 2016. [Google Scholar]
  7. Kamp, I. The influence of car-seat design on its character experience. Appl. Ergon. 2012, 43, 329–335. Available online: https://www.sciencedirect.com/science/article/pii/S0003687011000810?via%3Dihub (accessed on 7 December 2018). [CrossRef] [PubMed]
  8. Molenbroek, J.F.M.; Albin, T.J.; Vink, P. Thirty years of anthropometric changes relevant to the width and depth of transportation seating spaces, present and future. Appl. Ergon. 2017, 65, 130–138. Available online: http://www.sciencedirect.com/science/article/pii/S0003687017301308 (accessed on 15 January 2024). [CrossRef] [PubMed]
  9. Groenesteijn, L.; Hiemstra-van Mastrigt, S.; Gallais, C.; Blok, M.; Kuijt-Evers, L.; Vink, P. Activities, postures and comfort perception of train passengers as input for train seat design. Ergonomics 2014, 57, 1154–1165. [Google Scholar] [CrossRef] [PubMed]
  10. Vink, P.; Lips, D. Sensitivity of the human back and buttocks: The missing link in comfort seat design. Appl. Ergon. 2017, 58, 287–292. [Google Scholar] [CrossRef] [PubMed]
  11. El Falou, W.; Duchêne, J.; Grabisch, M.; Hewson, D.; Langeron, Y.; Lino, F. Evaluation of driver discomfort during long-duration car driving. Appl. Ergon. 2003, 34, 249–255. Available online: https://www.sciencedirect.com/science/article/pii/S0003687003000115?via%3Dihub (accessed on 6 December 2018). [CrossRef]
  12. Kyung, G.; Nussbaum, M.; Babski-Reeves, K. Driver sitting comfort and discomfort (part I): Use of subjective ratings in discriminating car seats and correspondence among ratings. Int. J. Ind. Ergon. 2008, 38, 516–525. [Google Scholar] [CrossRef]
  13. Mansfield, N.; Sammonds, G.; Nguyen, L. Driver discomfort in vehicle seats—Effect of changing road conditions and seat foam composition. Appl. Ergon. 2015, 50, 153–159. Available online: https://www.sciencedirect.com/science/article/pii/S0003687015000435?via%3Dihub (accessed on 6 December 2018). [CrossRef] [PubMed]
  14. Zenk, R.; Mergl, C.; Hartung, J.; Sabbah, O.; Bubb, H. Objectifying the Comfort of Car Seats. In SAE 2006 World Congress & Exhibition; SAE International: Warrendale, PA, USA, 2006. [Google Scholar]
  15. Naddeo, A.; Di Brigida, L.; Fontana, C.; Montese, J.; Quartuccia, M.; Nasti, M.; Pisani, M.M.; Turco, V.; De Stefano, M.; Fiorillo, I.; et al. A body-shaped lumbar-sacral support for improving car-seat comfort. Work 2021, 68, S129–S138. Available online: https://www.scopus.com/inward/record.uri?eid=2-s2.0-85099341351&doi=10.3233%2FWOR-208012&partnerID=40&md5=dd5177a6044179c9ee8ff2cb79cfd639 (accessed on 15 January 2024). [CrossRef]
  16. Hiemstra-van Mastrigt, S.; Meyenborg, I.; Hoogenhout, M. The influence of activities and duration on comfort and discomfort development in time of aircraft passengers. Work 2016, 54, 955–961. [Google Scholar] [CrossRef] [PubMed]
  17. Rasmussen, J.; Tørholm, S.; de Zee, M. Computational analysis of the influence of seat pan inclination and friction on muscle activity and spinal joint forces. Int. J. Ind. Ergon. 2009, 39, 52–57. [Google Scholar] [CrossRef]
  18. Zenk, R.; Franz, M.; Bubb, H.; Vink, P. Technical note: Spine loading in automotive seating. Appl. Ergon. 2012, 43, 290–295. [Google Scholar] [CrossRef] [PubMed]
  19. Kilincsoy, U.; Wagner, A.; Vink, P.; Bubb, H. Application of ideal pressure distribution in development process of automobile seats. Work 2016, 54, 895–904. [Google Scholar] [CrossRef] [PubMed]
  20. Mergl, C.; Klendauer, M.; Mangen, C.; Bubb, H. Predicting Long Term Riding Comfort in Cars by Contact Forces between Human and Seat; SAE International: Warrendale, PA, USA, 2005. [Google Scholar]
  21. Wang, X.; Savonnet, L.; Beurier, G.; Obadia, J. An Experimental Investigation of Preferred Seat Pressure Distribution. In Advances in Simulation and Digital Human Modeling: Proceedings of the AHFE 2020 Virtual Conferences on Human Factors and Simulation, and Digital Human Modeling and Applied Optimization, Virtual Event, 16–20 July 2020; Springer: Cham, Switzerland, 2020; pp. 330–335. [Google Scholar]
  22. Zemp, R.; Taylor, W.; Lorenzetti, S. Are pressure measurements effective in the assessment of office chair comfort/discomfort? A review. Appl. Ergon. 2015, 48, 273–282. [Google Scholar] [CrossRef]
  23. Anderl, R.; Mecke, K.; Klug, L. Advanced Prototyping with Parametric Prototypes. In Digital Enterprise Technology: Perspectives and Future Challenges; Springer: Boston, MA, USA, 2007; pp. 503–510. [Google Scholar]
  24. Smulders, M.; Berghman, K.; Koenraads, M.; Kane, J.A.; Krishna, K.; Carter, T.; Schultheis, U. Comfort and pressure distribution in a human contour shaped aircraft seat (developed with 3D scans of the human body). Work 2016, 54, 925–940. [Google Scholar] [CrossRef] [PubMed]
  25. Helander, M.; Zhang, L. Field studies of comfort and discomfort in sitting. Ergonomics 1997, 40, 895–915. [Google Scholar] [CrossRef]
  26. Zhang, L.; Helander, M.G.; Drury, C.G. Identifying Factors of Comfort and Discomfort in Sitting. Hum. Factors 1996, 38, 377–389. [Google Scholar] [CrossRef]
  27. Fisher, R.A. Statistical Methods for Research Workers. In Breakthroughs in Statistics: Methodology and Distribution; Kotz, S., Johnson, N.L., Eds.; Springer: New York, NY, USA, 1992; pp. 66–70. [Google Scholar] [CrossRef]
  28. Ahmadpour, N.; Lindgaard, G.; Robert, J.M.; Pownall, B. The thematic structure of passenger comfort experience and its relationship to the context features in the aircraft cabin. Ergonomics 2014, 57, 801–815. [Google Scholar] [CrossRef] [PubMed]
  29. Franz, M.; Kamp, I.; Durt, A.; Kilincsoy, Ü.; Bubb, H.; Vink, P. A light weight car seat shaped by human body contour. Int. J. Hum. Factors Model Simul. 2011, 2, 314–326. [Google Scholar] [CrossRef]
  30. Zemp, R.; Taylor, W.R.; Lorenzetti, S. Seat pan and backrest pressure distribution while sitting in office chairs. Appl. Ergon. 2016, 53 Pt A, 1–9. [Google Scholar] [CrossRef]
  31. Fang, F.; Shen, L.; Chen, Y.; Yuding, Z. A Method for Measuring the Weight of Body Segment Based on Human Model and Body Pressure Distribution. In Advances in Ergonomics in Design, Proceedings of the AHFE 2016 International Conference on Ergonomics in Design, Walt Disney World®, Orlando, FL, USA, 27–31 July 2016; Springer: Cham, Switzerland, 2016; pp. 735–741. [Google Scholar]
Figure 1. Simplified mock-up.
Machines 12 00374 g001
Figure 2. Three different postures, from left to right: relaxed posture simulating a passenger, pressing the brake pedal, pressing the accelerator pedal.
Machines 12 00374 g002
Figure 3. Output script 2: relaxed posture simulating a passenger (posture 1).
Machines 12 00374 g003
Figure 4. Output script 2: pressing the brake pedal (posture 2).
Machines 12 00374 g004
Figure 5. Output script 2: pressing the accelerator pedal (posture 3).
Machines 12 00374 g005
Figure 6. Example of 3D surface obtained by Grasshopper®.
Machines 12 00374 g006
Figure 7. (a) Solidworks® model; (b) auxiliary planes.
Machines 12 00374 g007
Figure 8. Examples of profiles generated by plane 6 (posture 1—relaxed posture simulating a passenger, posture 2—pressing the brake pedal, posture 3—pressing the accelerator pedal).
Machines 12 00374 g008
Figure 9. (a) Seat pan shape; (b) seat pan pad prototype.
Machines 12 00374 g009
Figure 10. (a) Printed seat pan pad; (b) assembled seat.
Machines 12 00374 g010
Figure 11. Setup used for the experiments.
Machines 12 00374 g011
Figure 12. Body map used in the tests; areas are numbered as indicated in the questionnaires.
Machines 12 00374 g012
Figure 13. One-minute test, descriptive adjectives.
Machines 12 00374 g013
Figure 14. Fifteen-minute test, descriptive adjectives.
Machines 12 00374 g014
Figure 15. Comfort assessment.
Machines 12 00374 g015
Table 1. Technical characteristics of the pressure mat.
Physical Characteristics
Total Area630 mm × 530 mm
Sensing Area480 mm × 480 mm
Sensitivity
Measuring range0.6–100 N/cm2
Accuracy5% FSO
Measuring frequency20–60 Hz
Sensors
Number of sensors24 × 20 = 480
Table 2. Anthropometric measurements of participants.
AgeHeight [cm]Weight [kg]BMIWaist Circumference [mm]Hip Circumference [mm]WHR
(Waist to Hip Ratio)
Min211535118.516108300.7
Max6619211534.22118011901.1
Mean35.61173.7177.2925.49864.391015.850.85
SD13.19.2714.913.77129.0481.970.0934
Table 3. Anthropometric measurements of participants—“1 min” test.
AgeHeight [cm]Weight [kg]BMIWaist Circumference [mm]Hip Circumference [mm]WHR
(Waist to Hip Ratio)
Min191554718.366108300.69
Max2819712532.87108011301.04
Mean22.97175.2776.7924.85855.81020.50.84
SD2.539.2916.013.9911.187.580.07
Table 4. Anthropometric measurements of participants—“15 min” test.
AgeHeight [cm]Weight [kg]BMIWaist Circumference [mm]Hip Circumference [mm]WHR
(Waist to Hip Ratio)
Min221604718.366108300.69
Max341869531.02108011301.04
Mean26171.5875.0525.29855.81020.50.84
SD3.118.1514.093.2911.187.580.075
Table 5. Average discomfort for each body part—15-min test.
Body Part
12345678910
Flat seat pan2.22.21.92.11.71.71.71.81.71.8
Shaped seat pan1.51.81.61.91.41.31.21.31.41.4
Table 6. Number of participants and discomfort assessment (15-min test) for each body part: flat seat pan.
Body Part
Flat seat pan12345678910
No discomfort568710101091111
Minimum discomfort7756665644
Medium discomfort2302210311
High discomfort5364124132
Extreme discomfort0000000001
Table 7. Number of participants and discomfort assessment (15-min test) for each body part: shaped seat pan.
Body Part
Shaped seat pan12345678910
No discomfort129128141516161516
Minimum discomfort5635432120
Medium discomfort1346001212
High discomfort1100110011
Extreme discomfort0000000000
Table 8. Results from the pressure mat: differences in average pressures and contact areas (desired values are negative values for pressure and positive values for contact area).
ParticipantDifferences in Average Pressure N/cm2
(Shaped vs. Flat)
Differences in Contact Area cm2
(Shaped vs. Flat)
1−0.11151.75
20.02127.12
3−0.09425.65
4−0.04339.81
5−0.02100.22
6−0.08168.97
7−0.11310.4
8−0.0298.17
9−0.06−272.12
10−0.02121.2
11−0.05150.27
120.01151.17
13−0.10168.36
140.00210.33
150.03194.71
16−0.0350.77
17−0.06−290.43
180.00236.08
19−0.05160.52
Mean−0.04137.00
Disclaimer/Publisher’s Note: The statements, opinions and data contained in all publications are solely those of the individual author(s) and contributor(s) and not of MDPI and/or the editor(s). MDPI and/or the editor(s) disclaim responsibility for any injury to people or property resulting from any ideas, methods, instructions or products referred to in the content.