Study on the Load-Bearing Characteristics Analysis Model of Non-Pneumatic Tire with Composite Spokes


Abstract
1. Introduction
2. Experiments
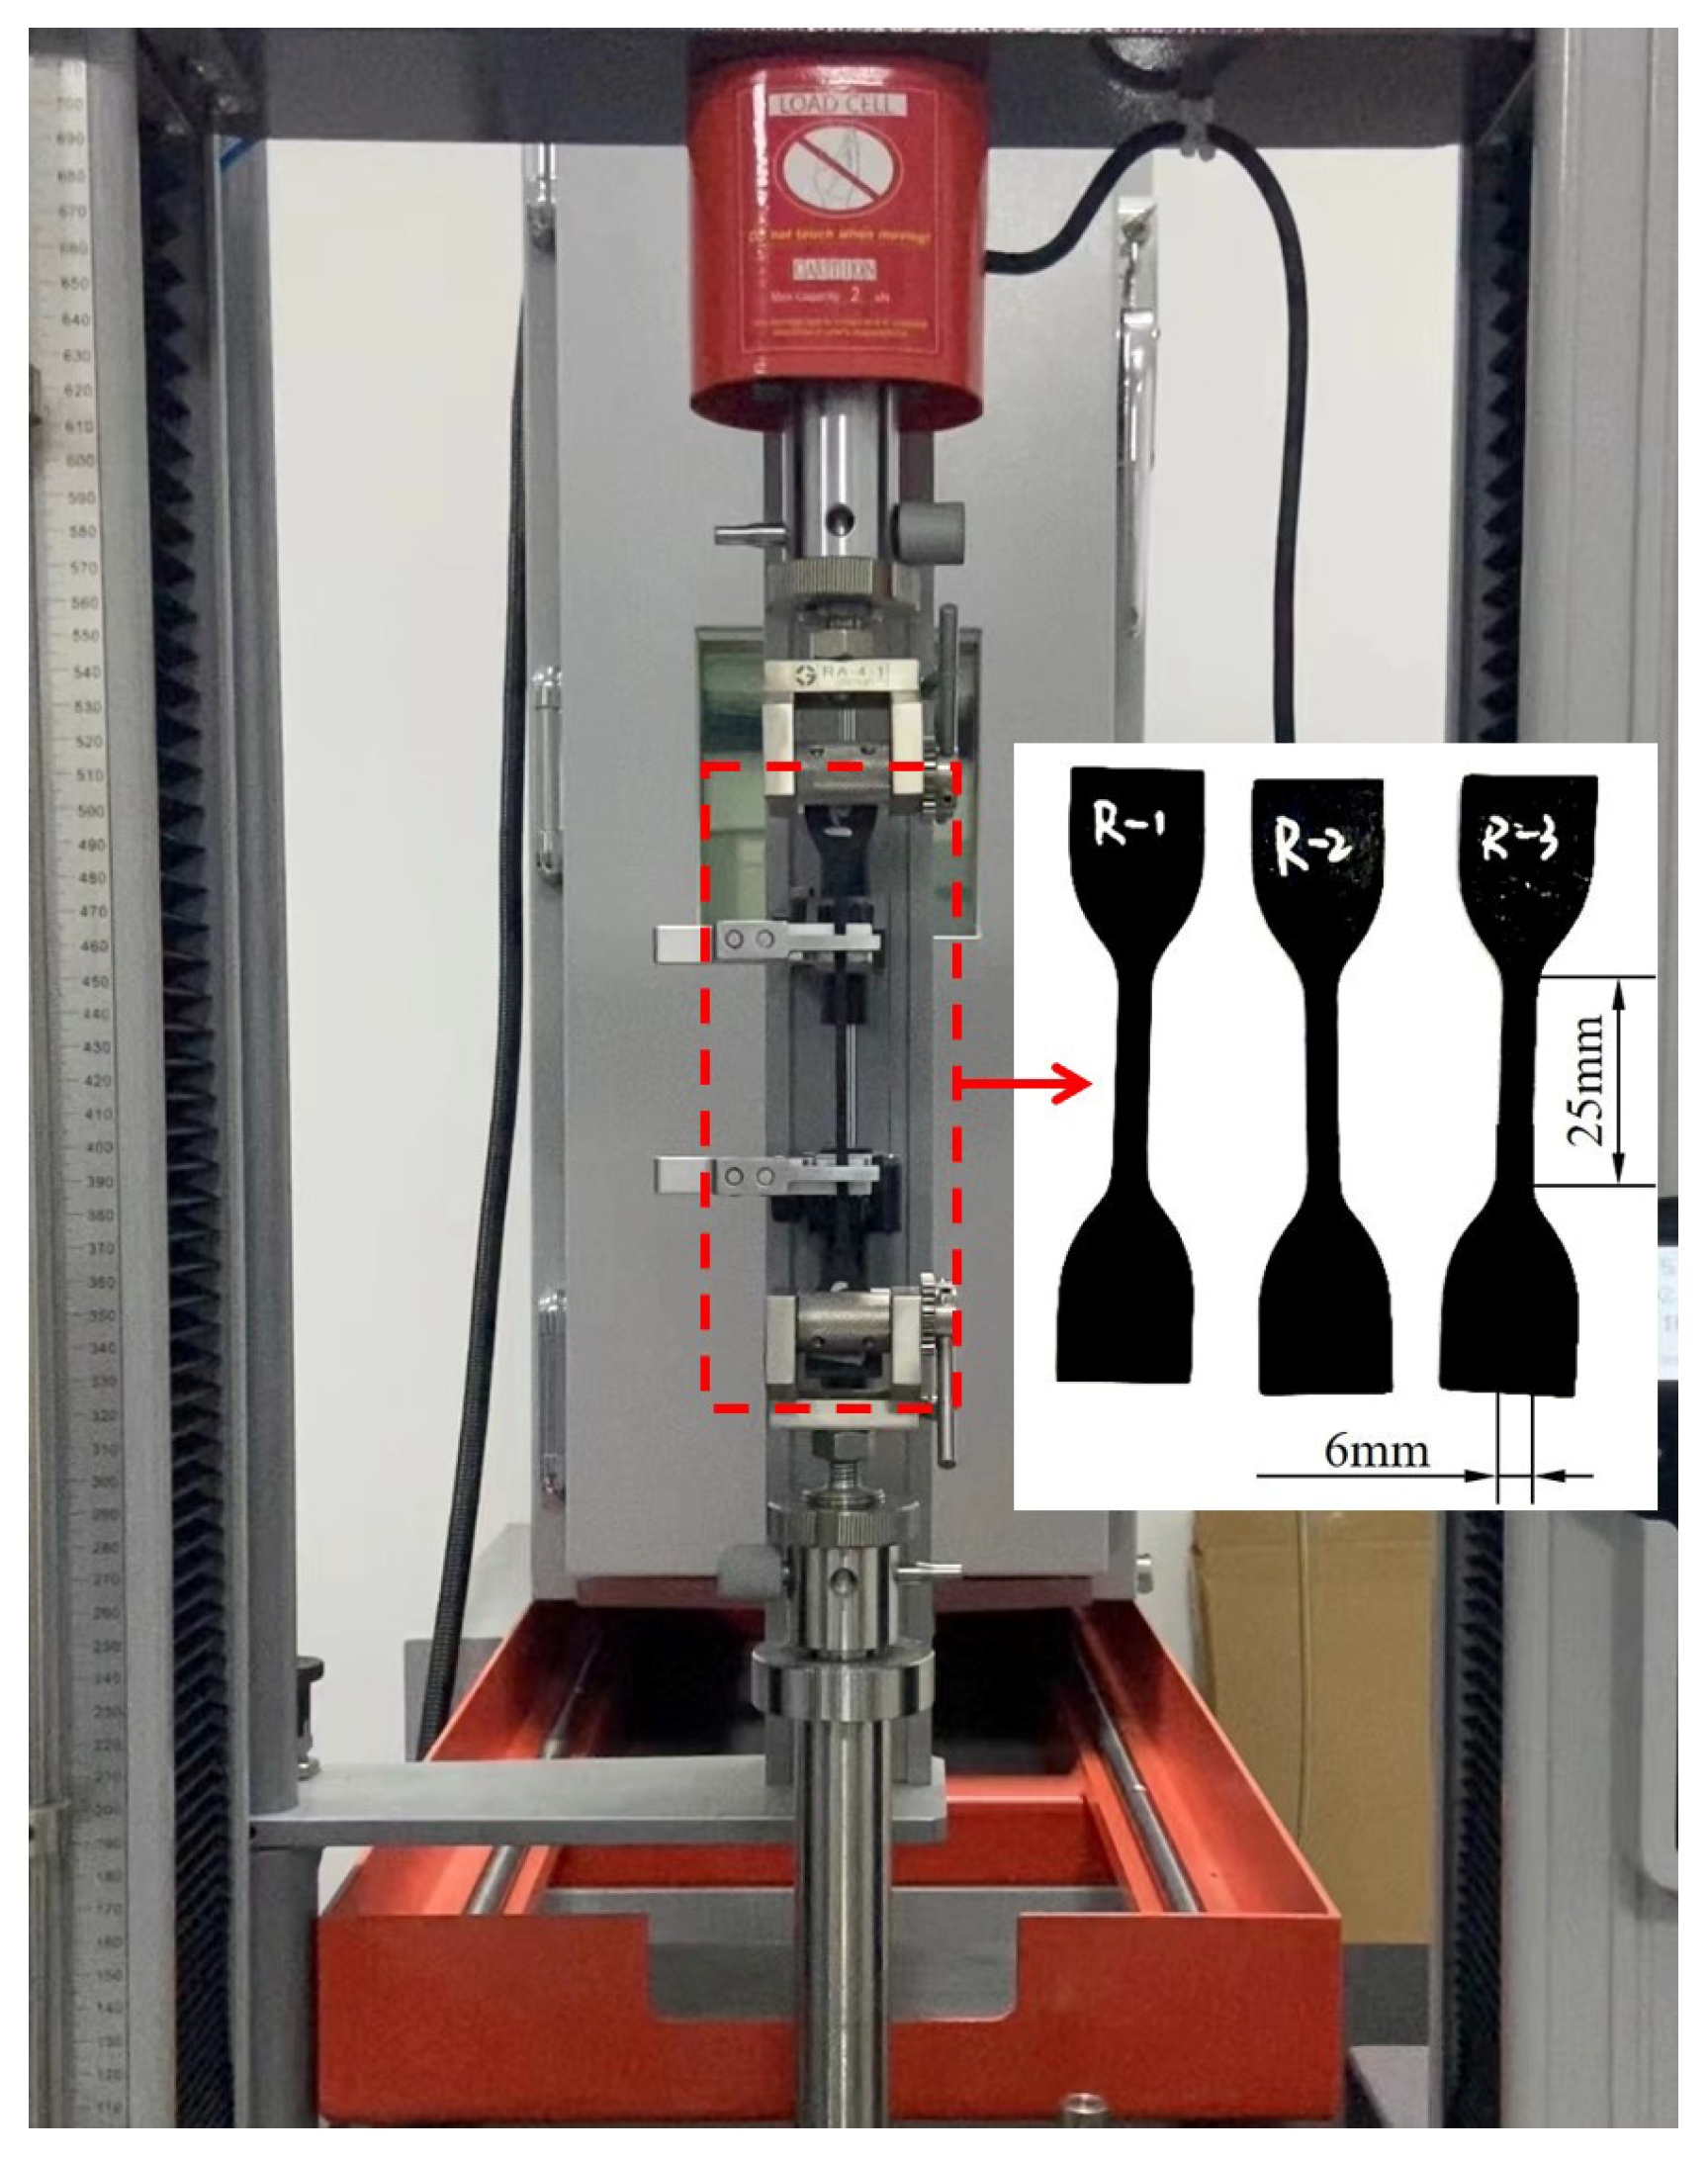
2.1. CFRP
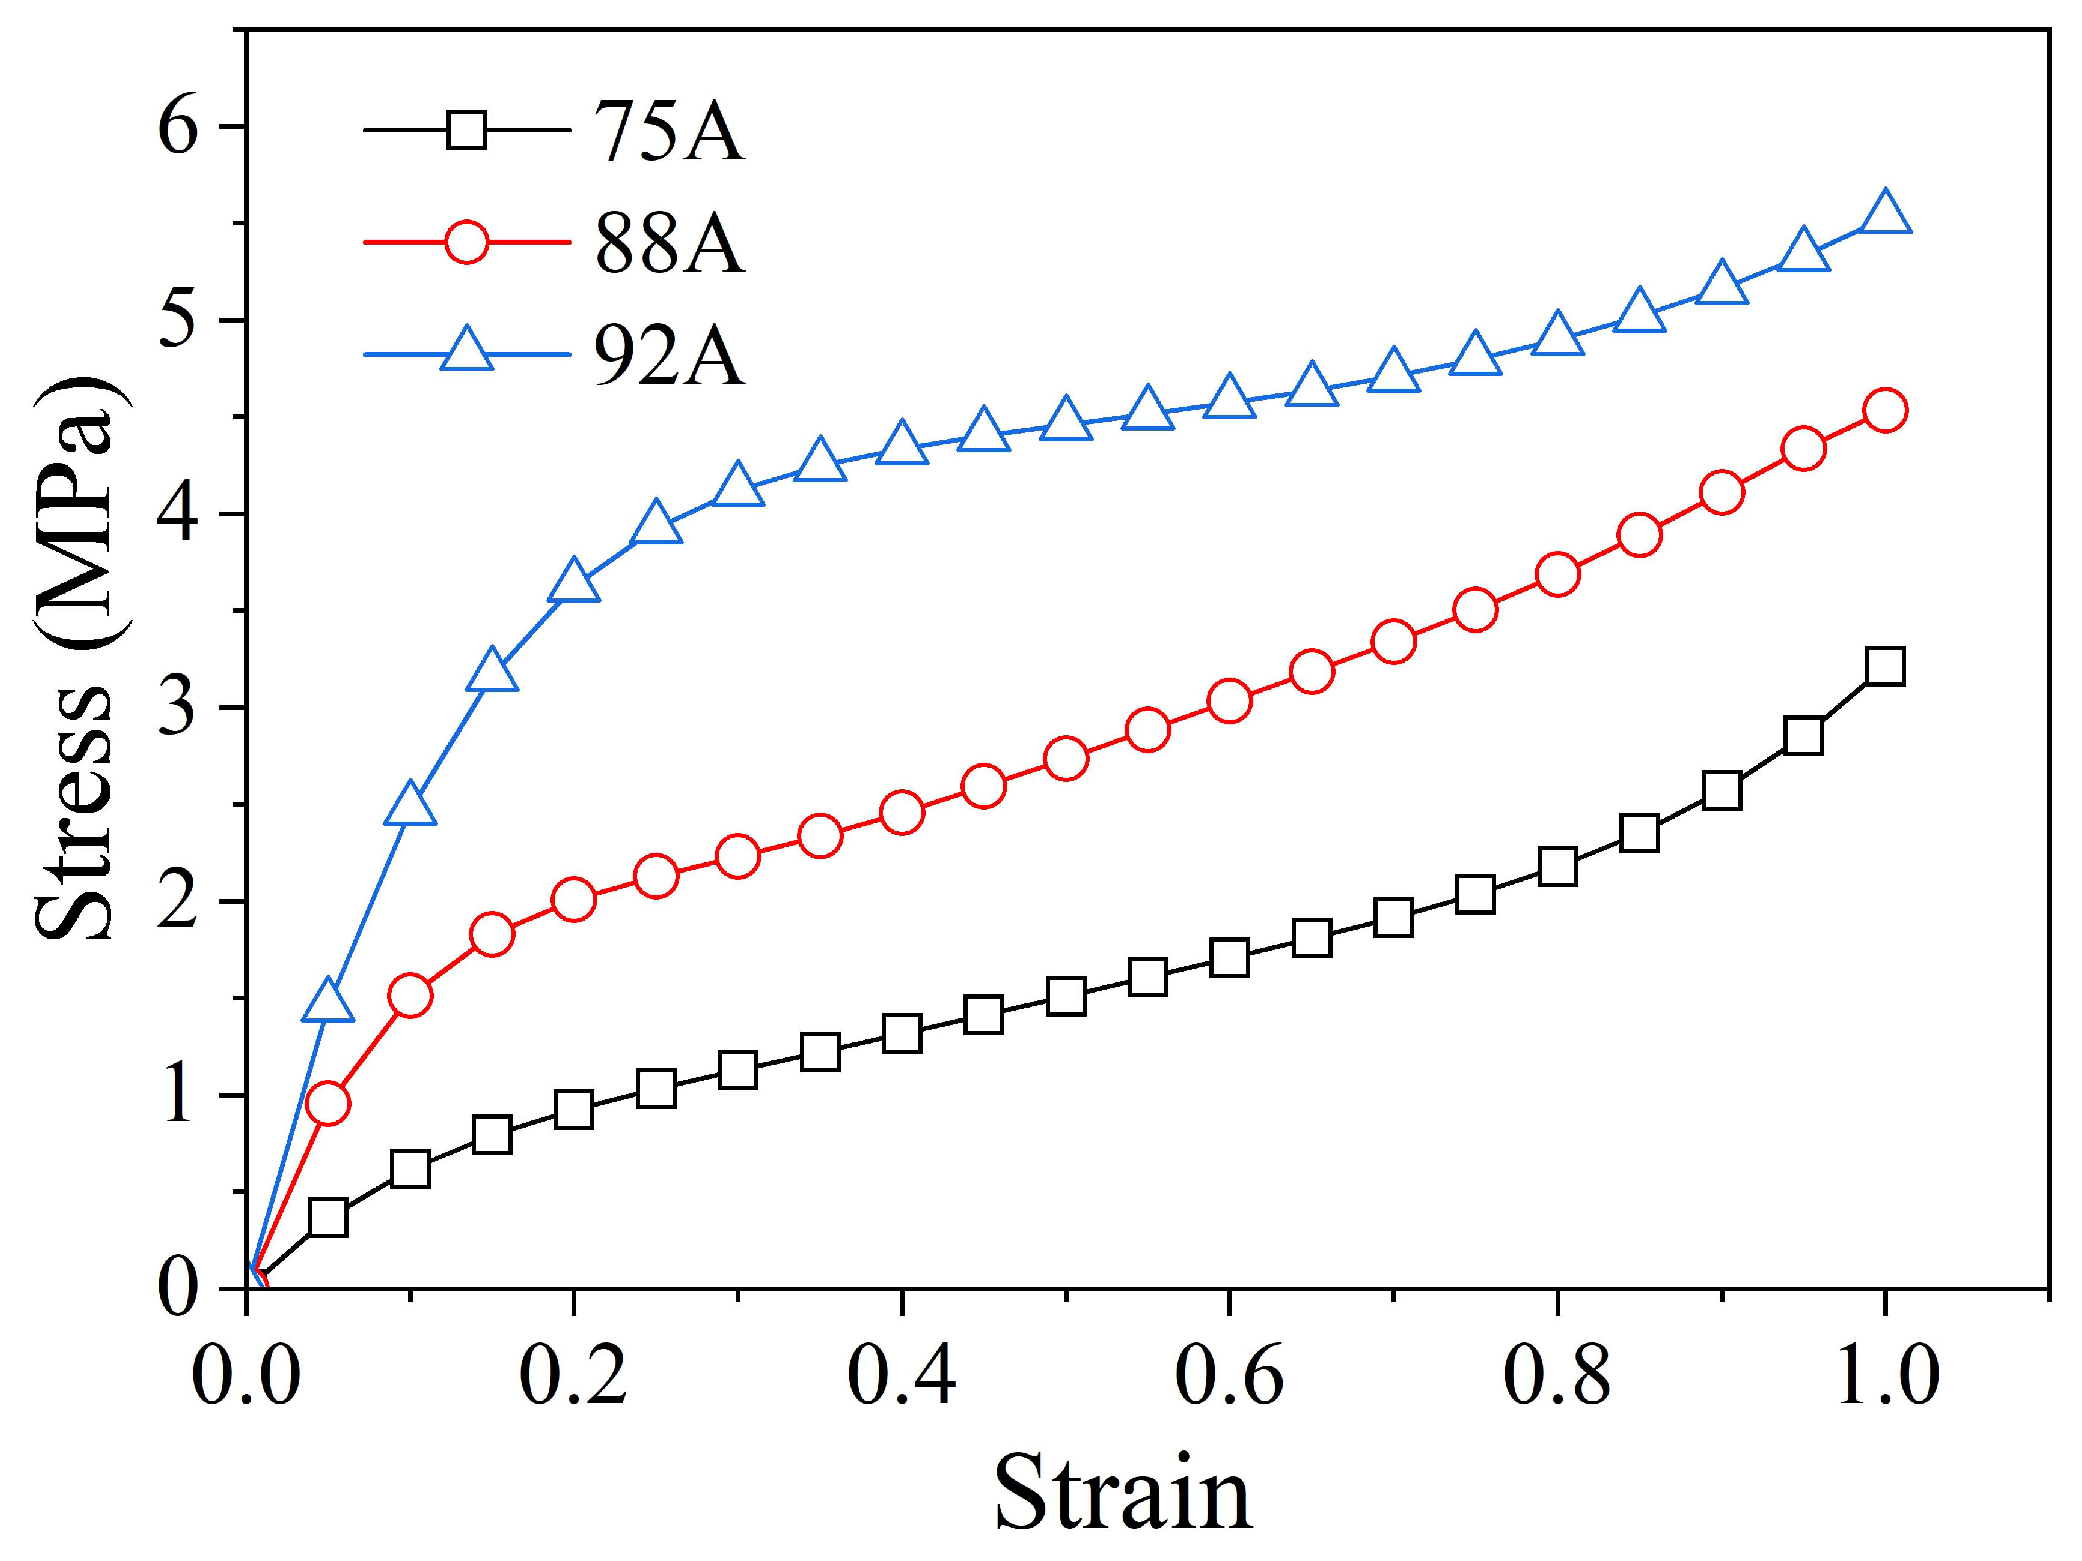
2.2. Rubbers
3. Simulation Models
3.1. Constitutive Models
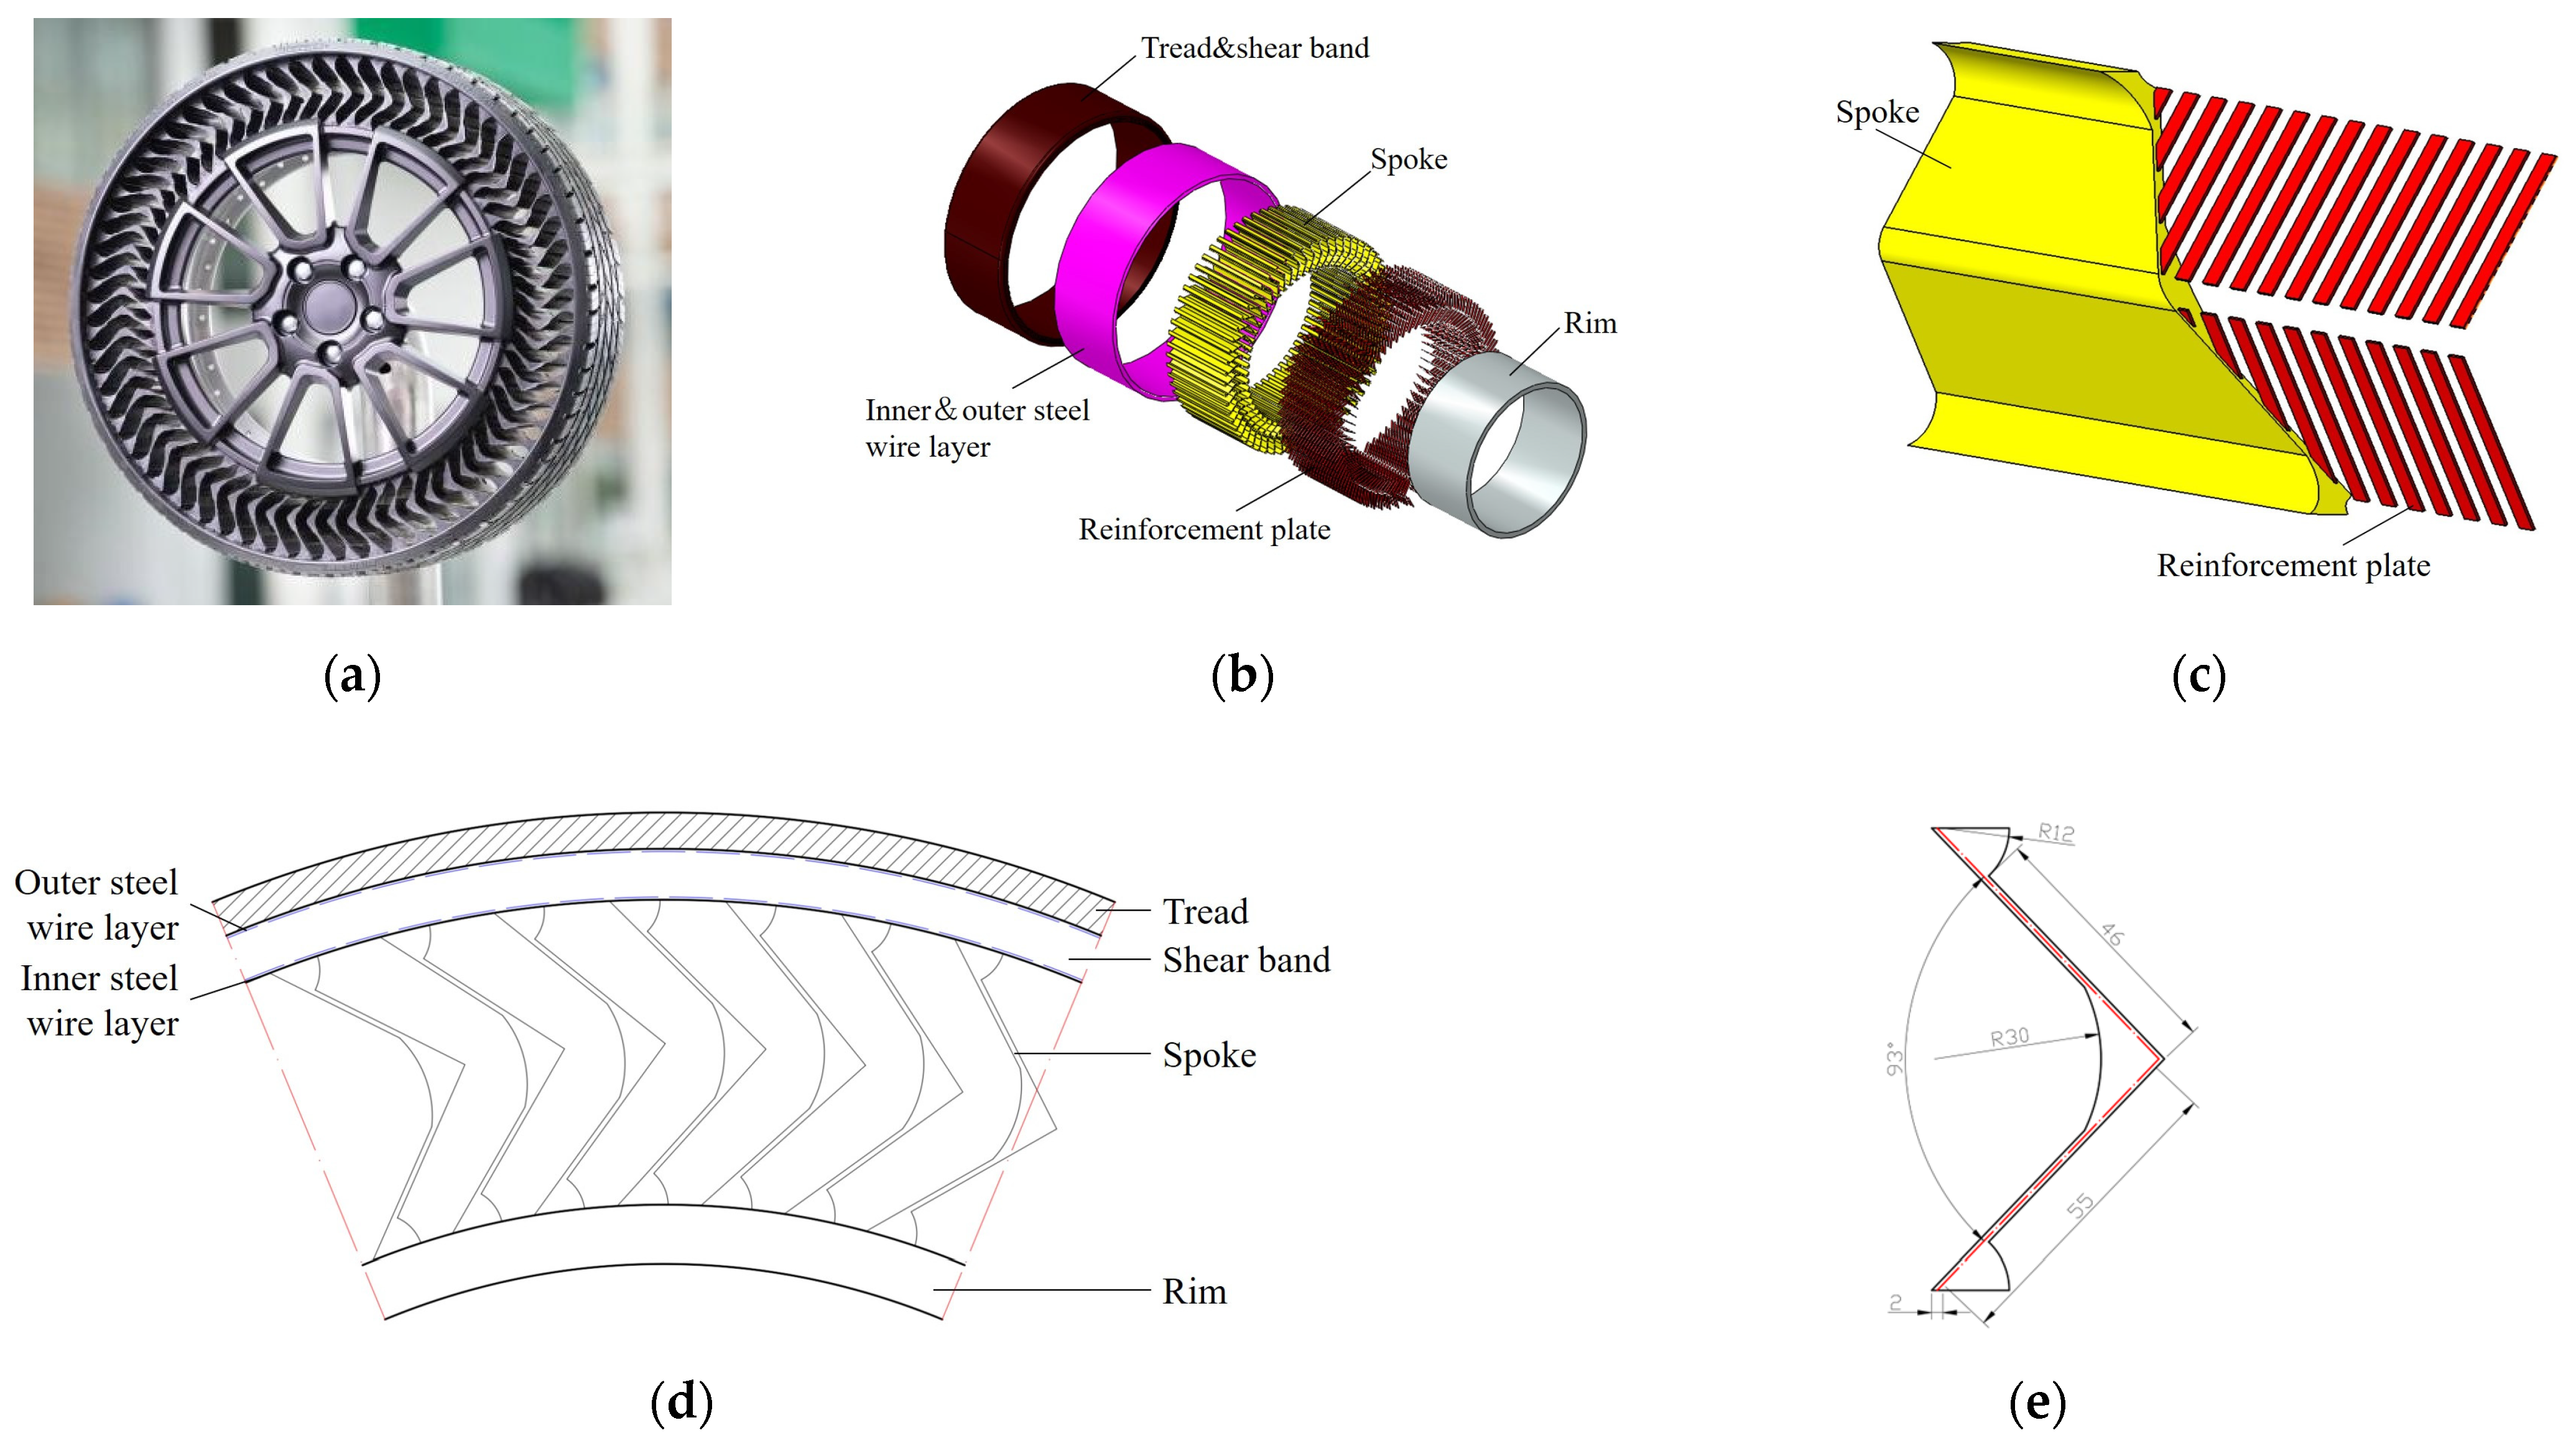
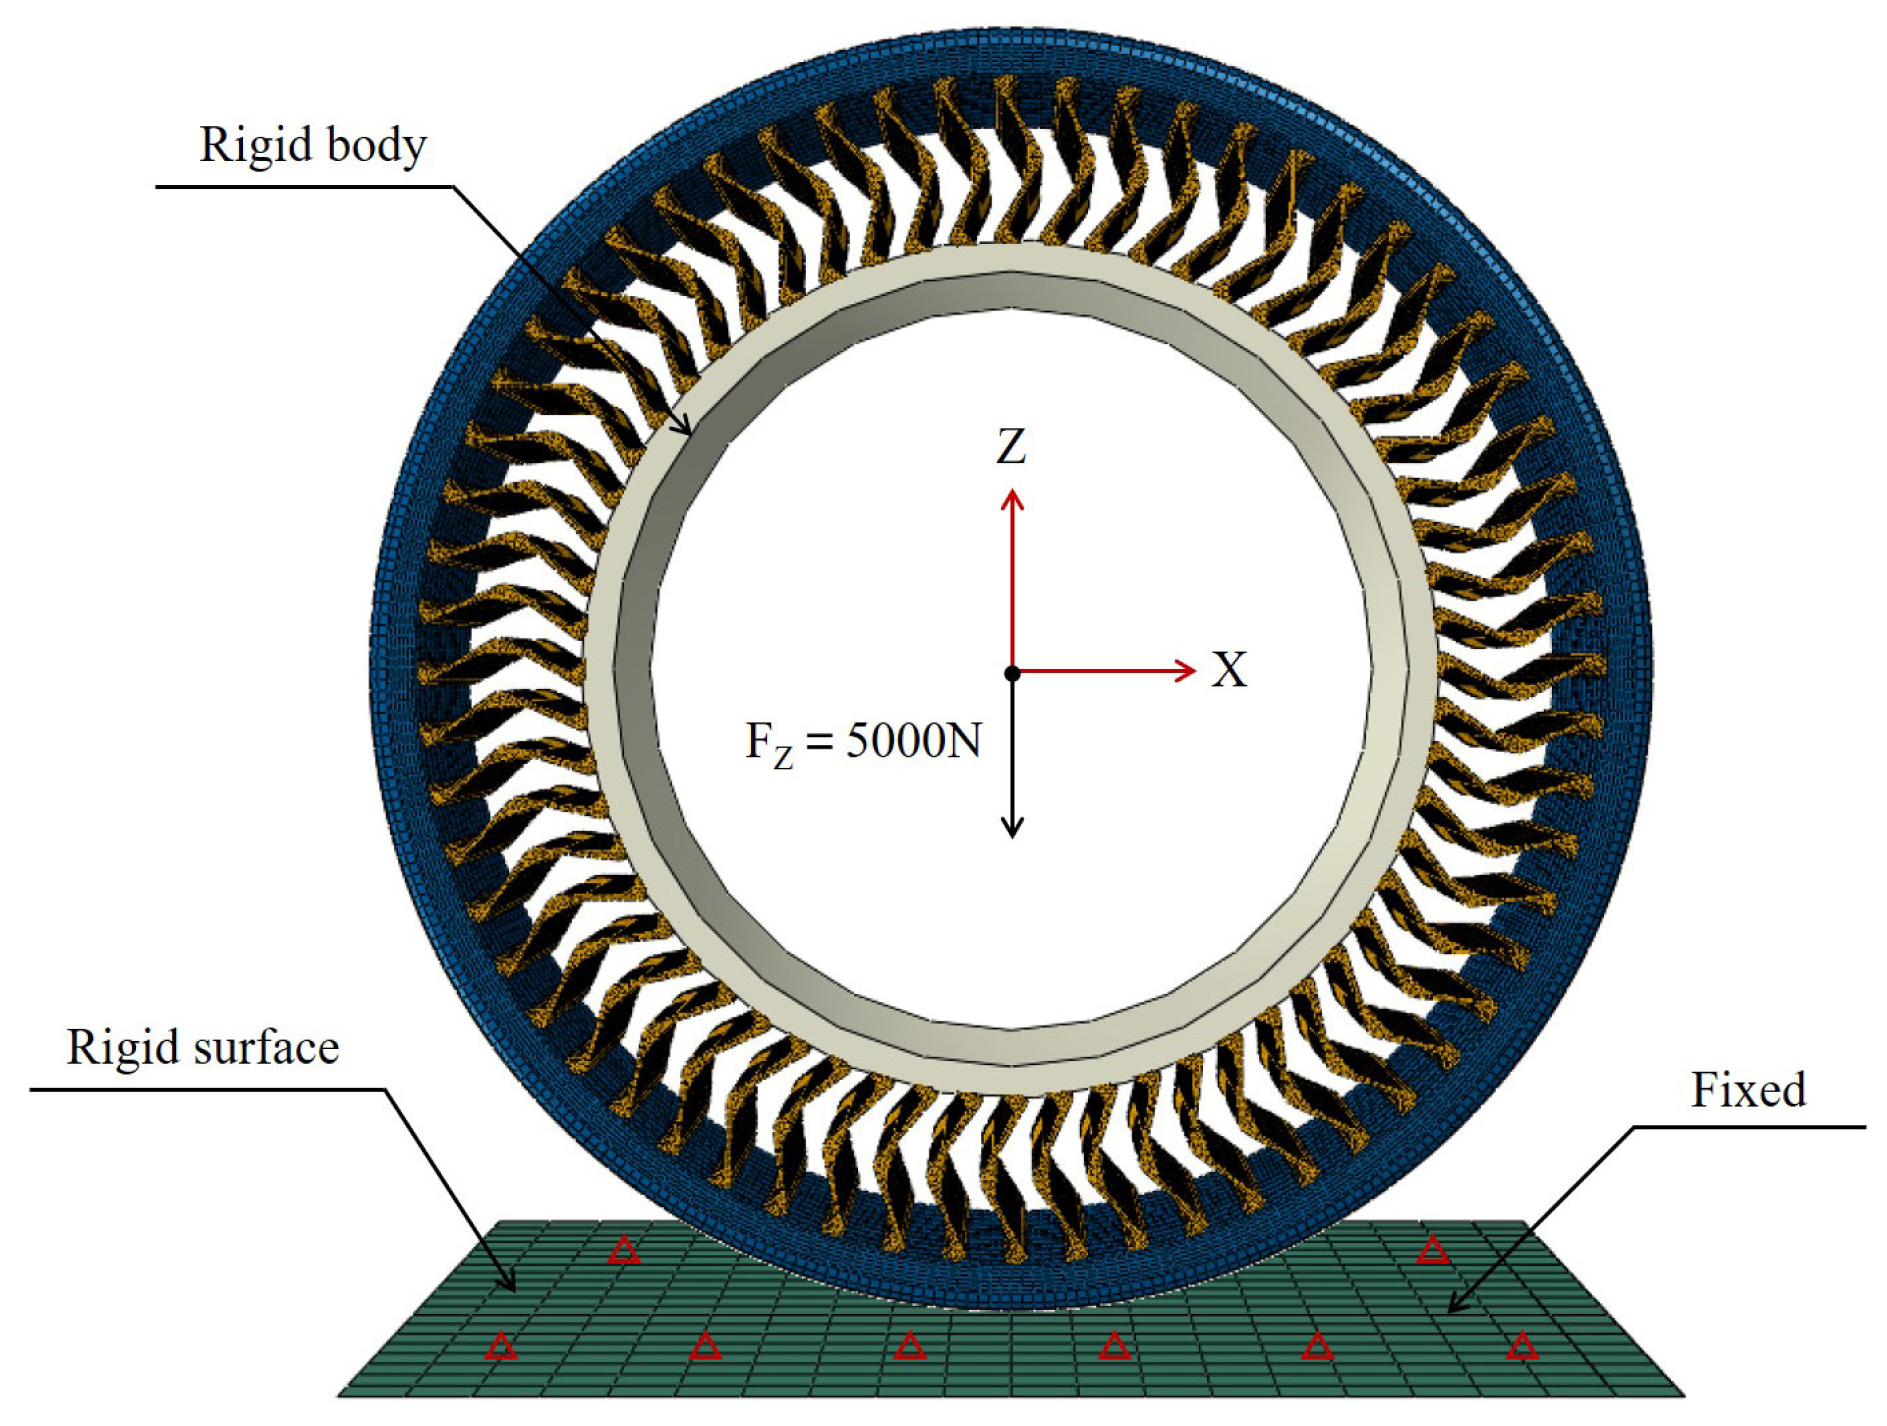
3.2. NPT FE Model
3.3. NPT LCA Model
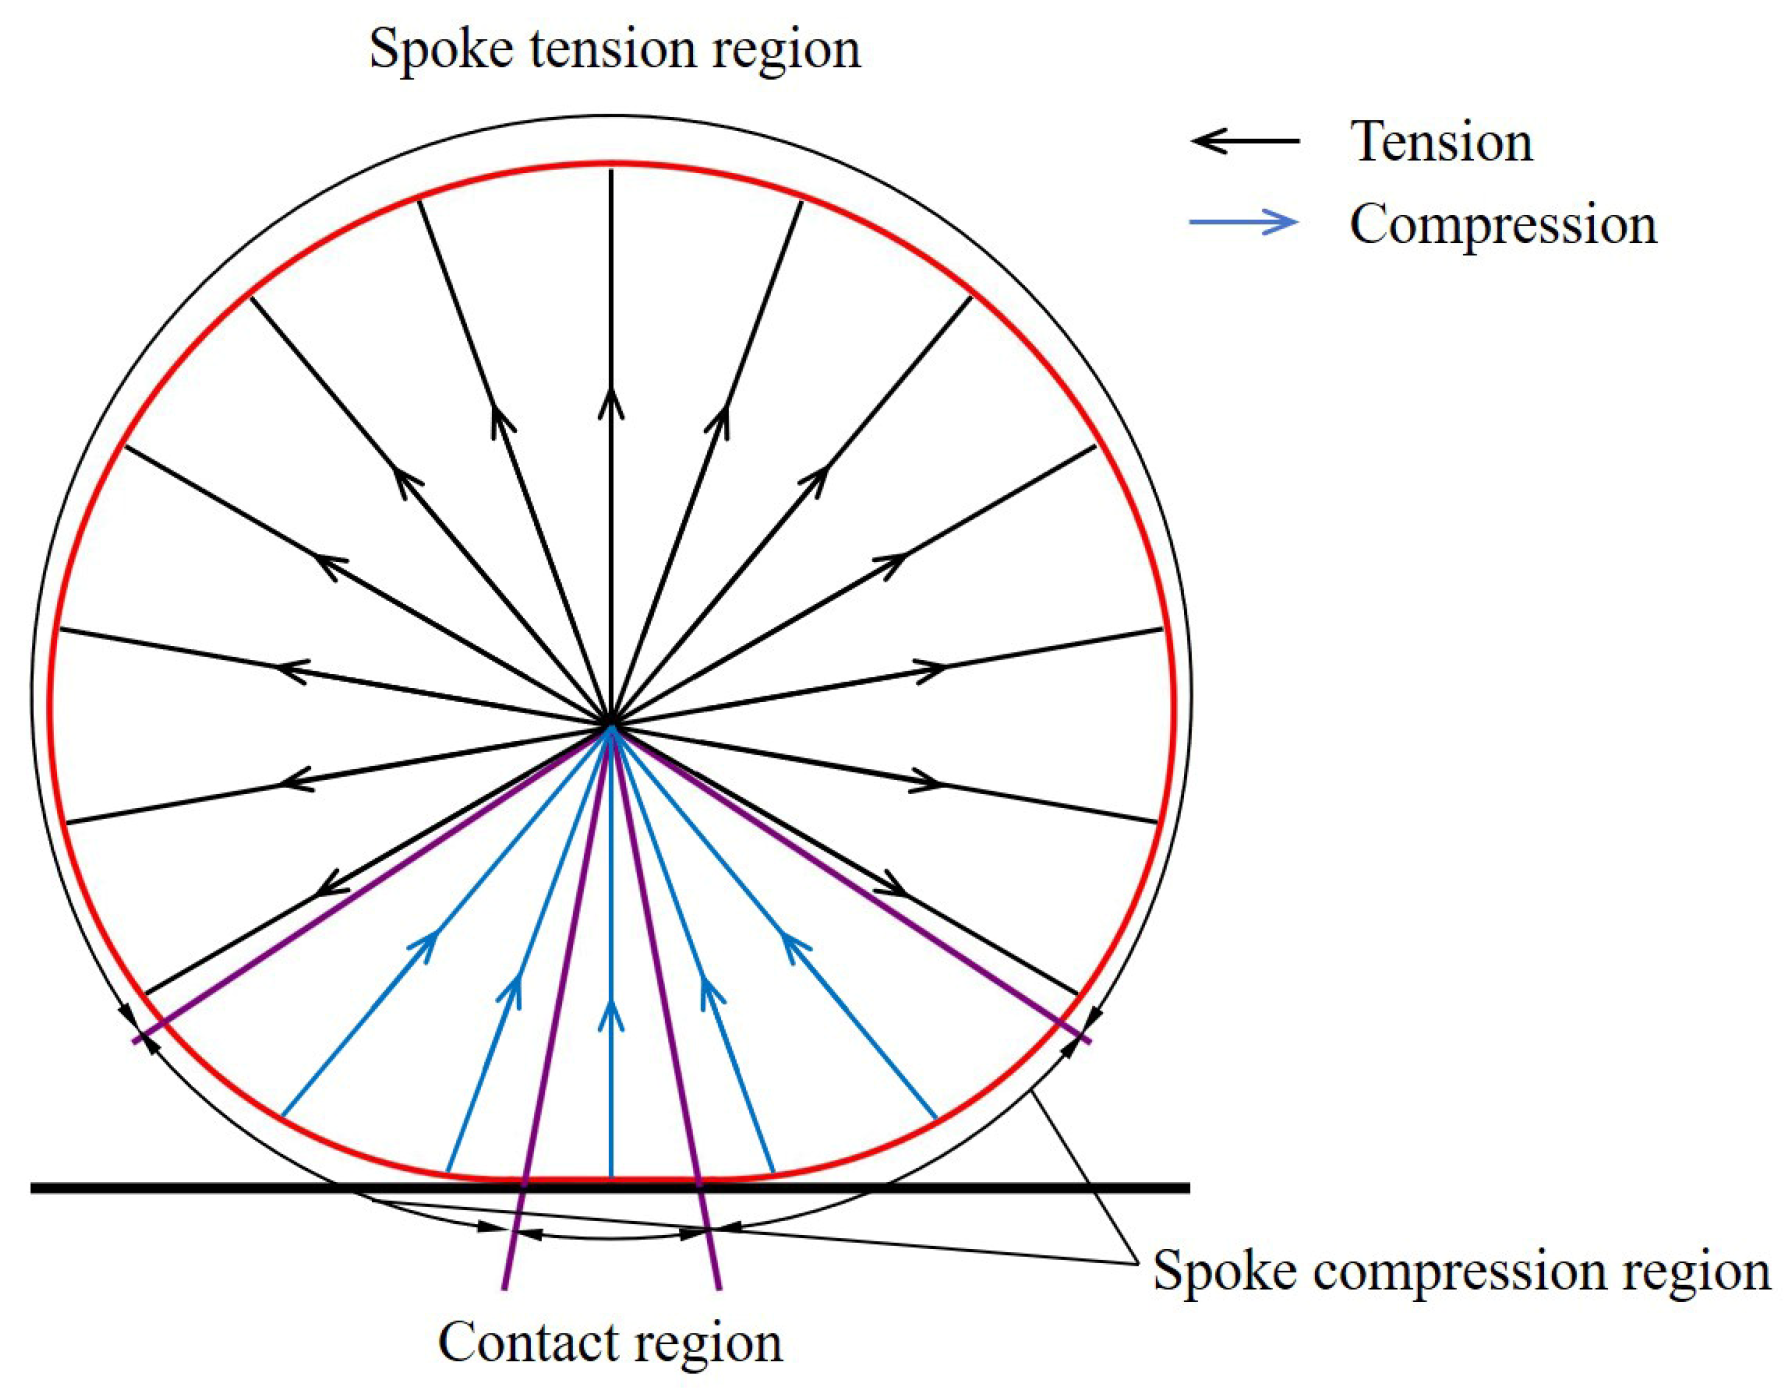
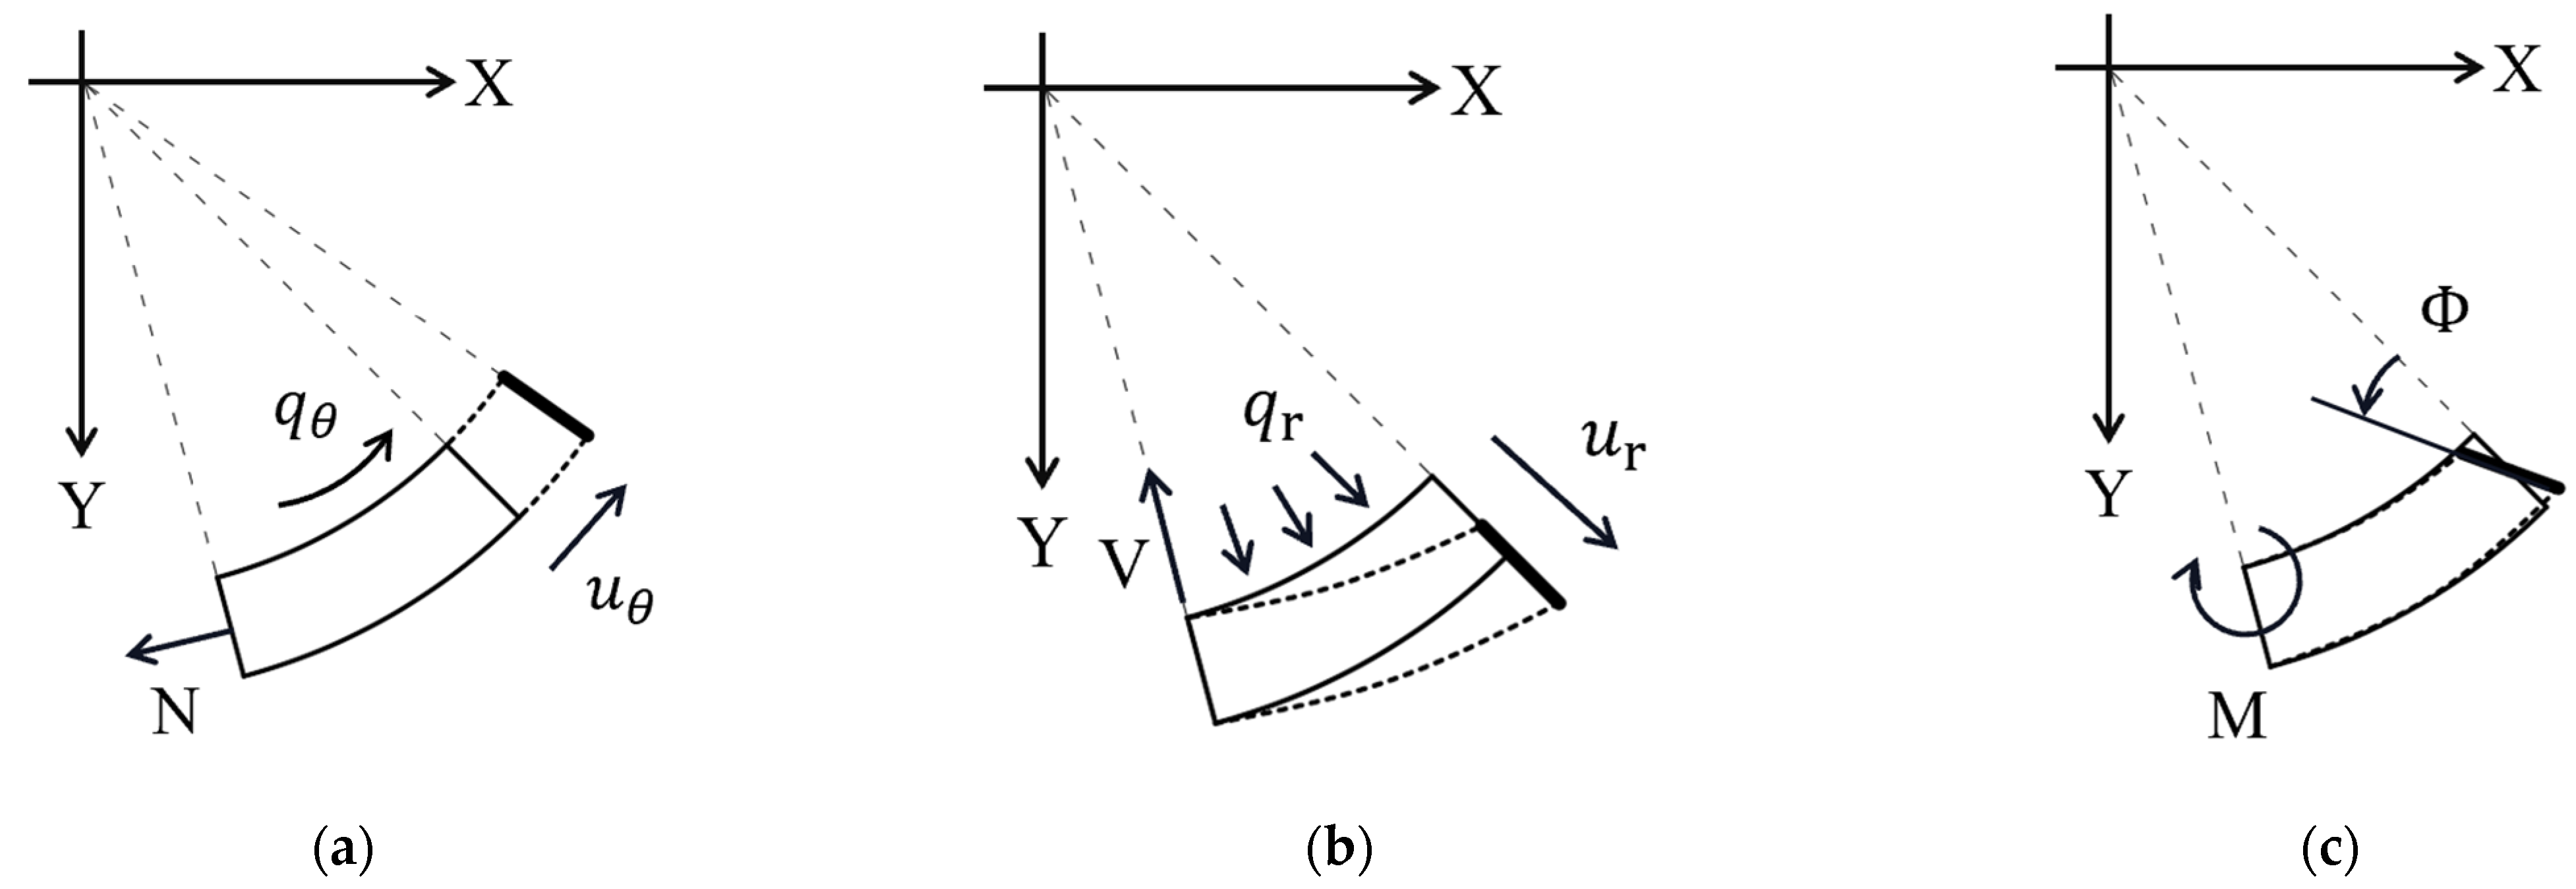
3.3.1. Solution Procedure
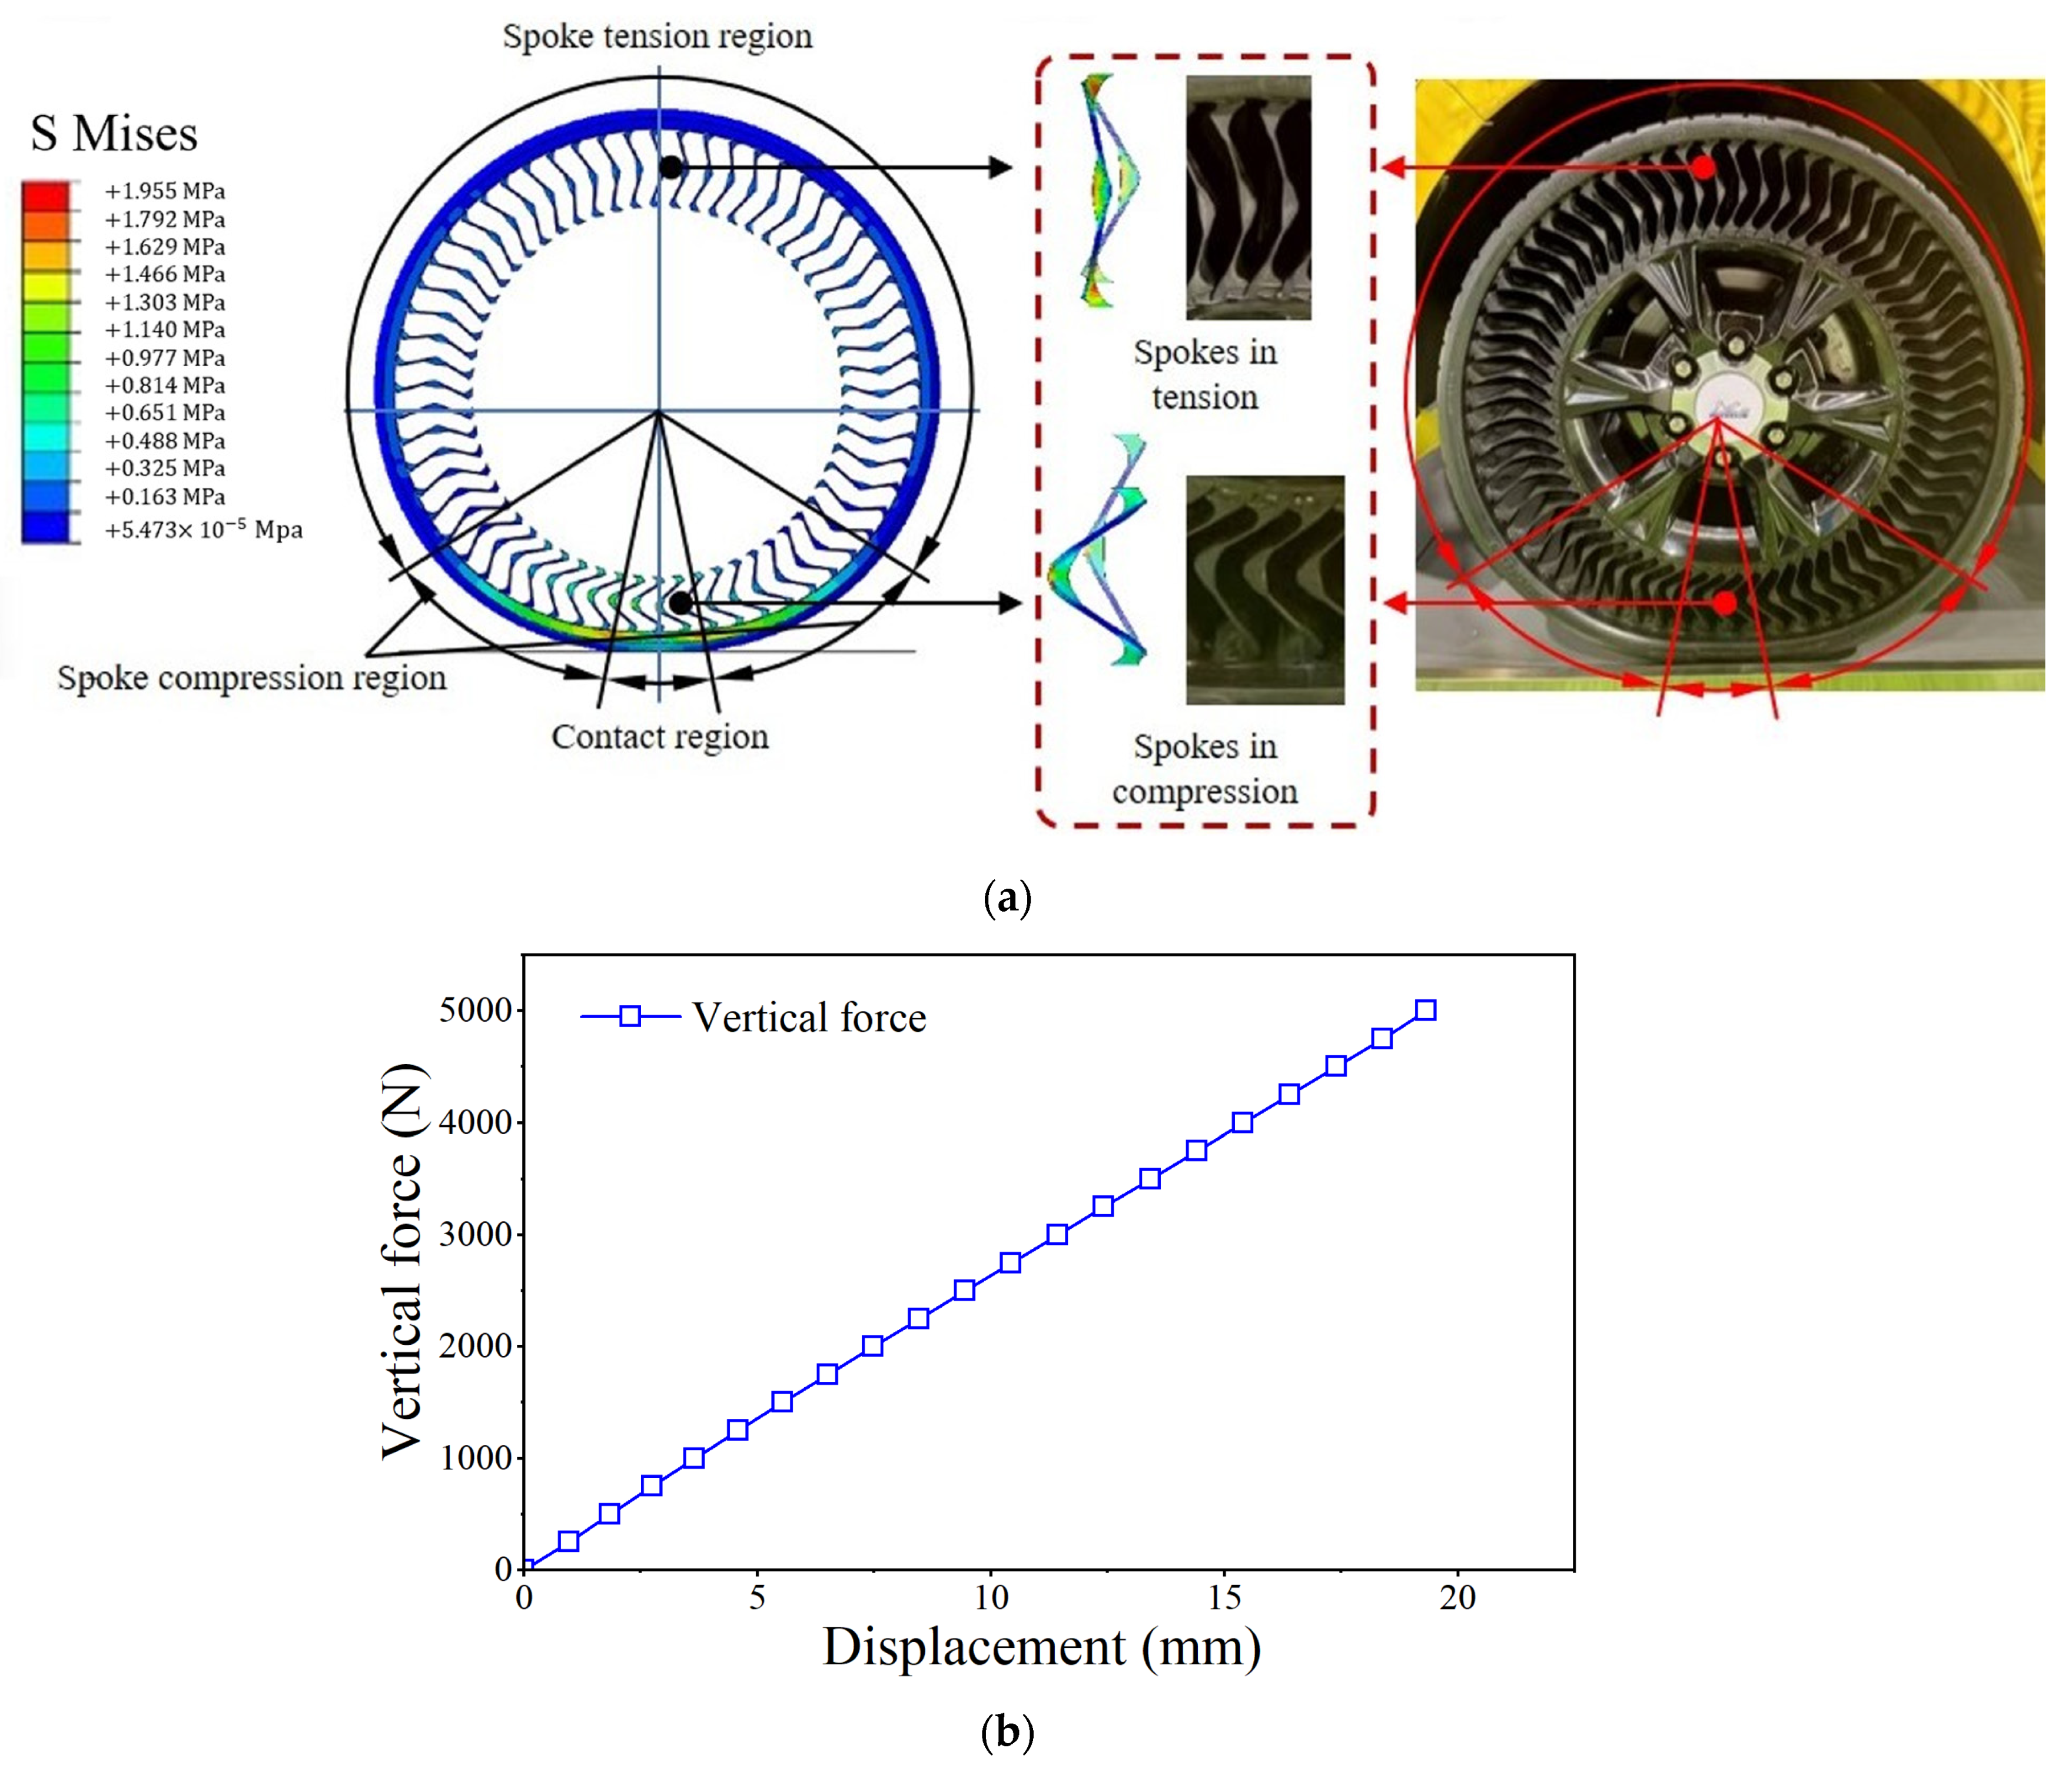
- Contact region (included spokes are independently calculated compression forces and do not apply a load to the circular beam)
- Spoke compression region (region between the edge of contact and the angle where spoke tension, including spokes, is compressed and load is applied to the circular beam)
- Spokes tension region (spokes are engaged in tension)
- Contact region
- Spokes compression/tension regions
- Spokes Compression Region
- Spokes Tension Region
3.3.2. Calculation of θt
3.3.3. Main Parameters
4. Results and Discussion
4.1. FEM Results
- One mixed bending–compression deformation occurred in the contact and spoke compression regions, where the reinforcement plates were bent while the rubber blocks were compressed.
- Another mixed bending–tension deformation occurred in the spokes tension region, where the reinforcement plates were bent while the rubber blocks were under tension.
4.2. RSM Analysis
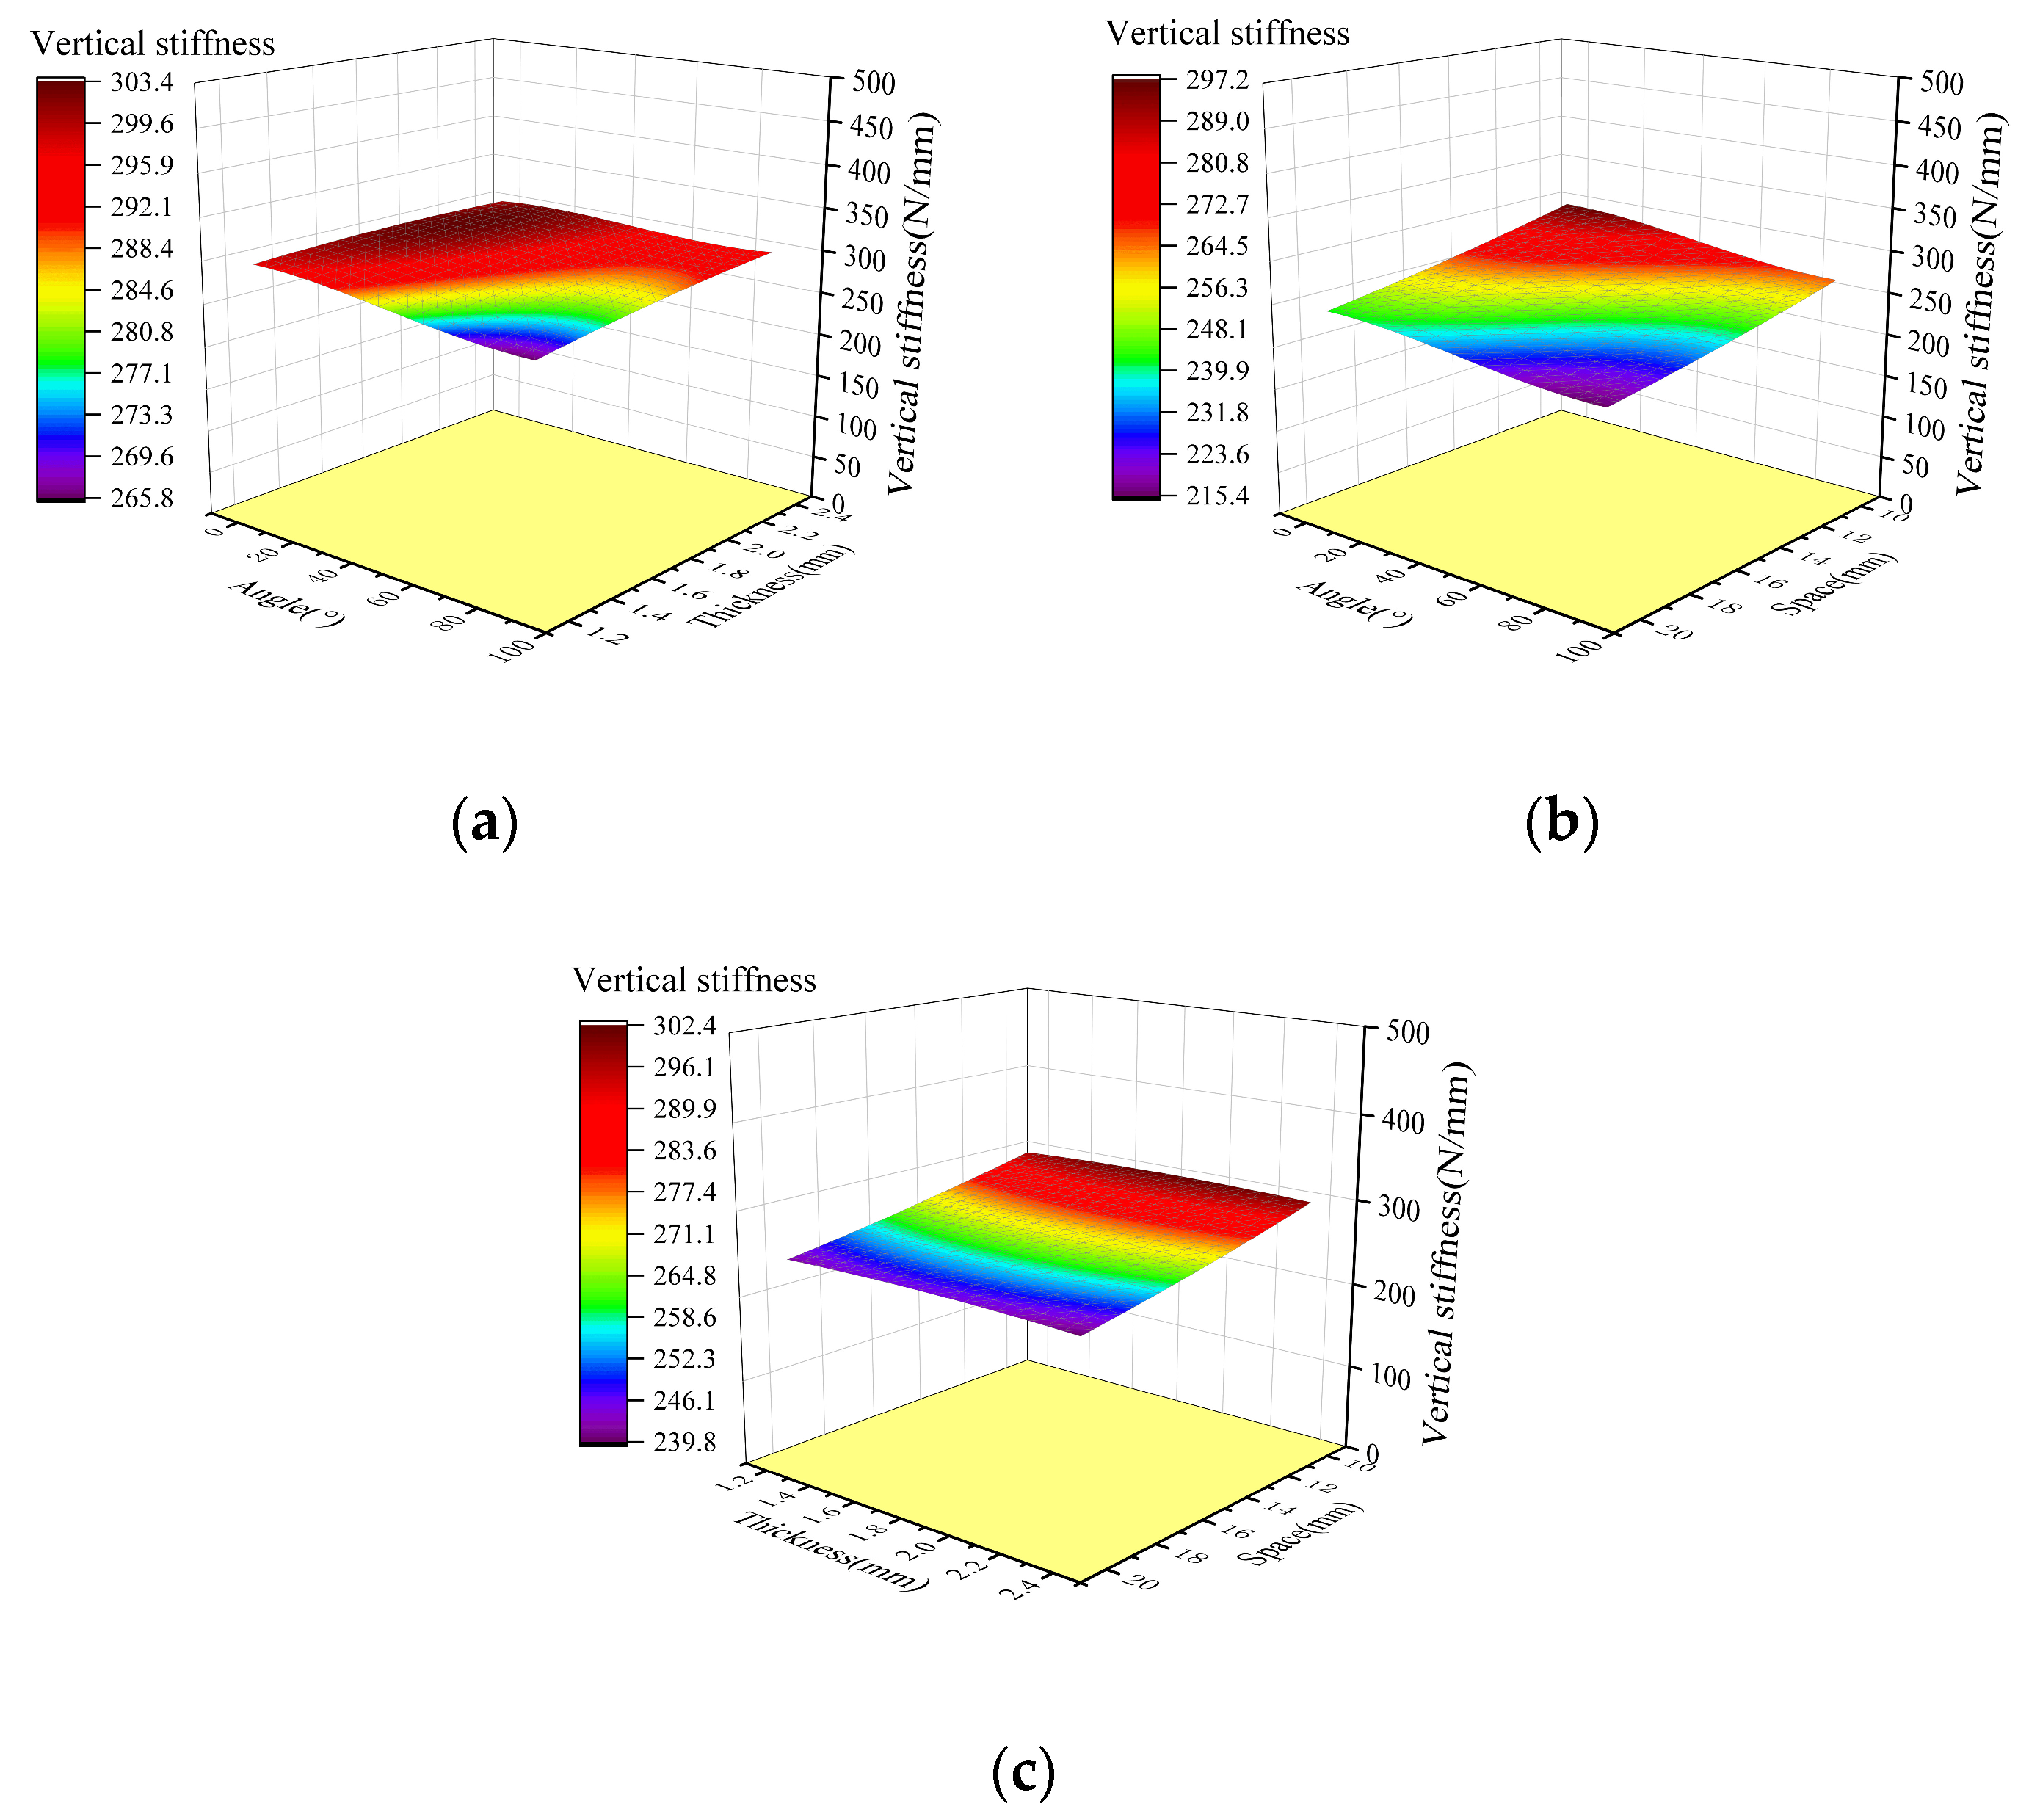
4.2.1. CFRP Reinforcement Plate Parameters
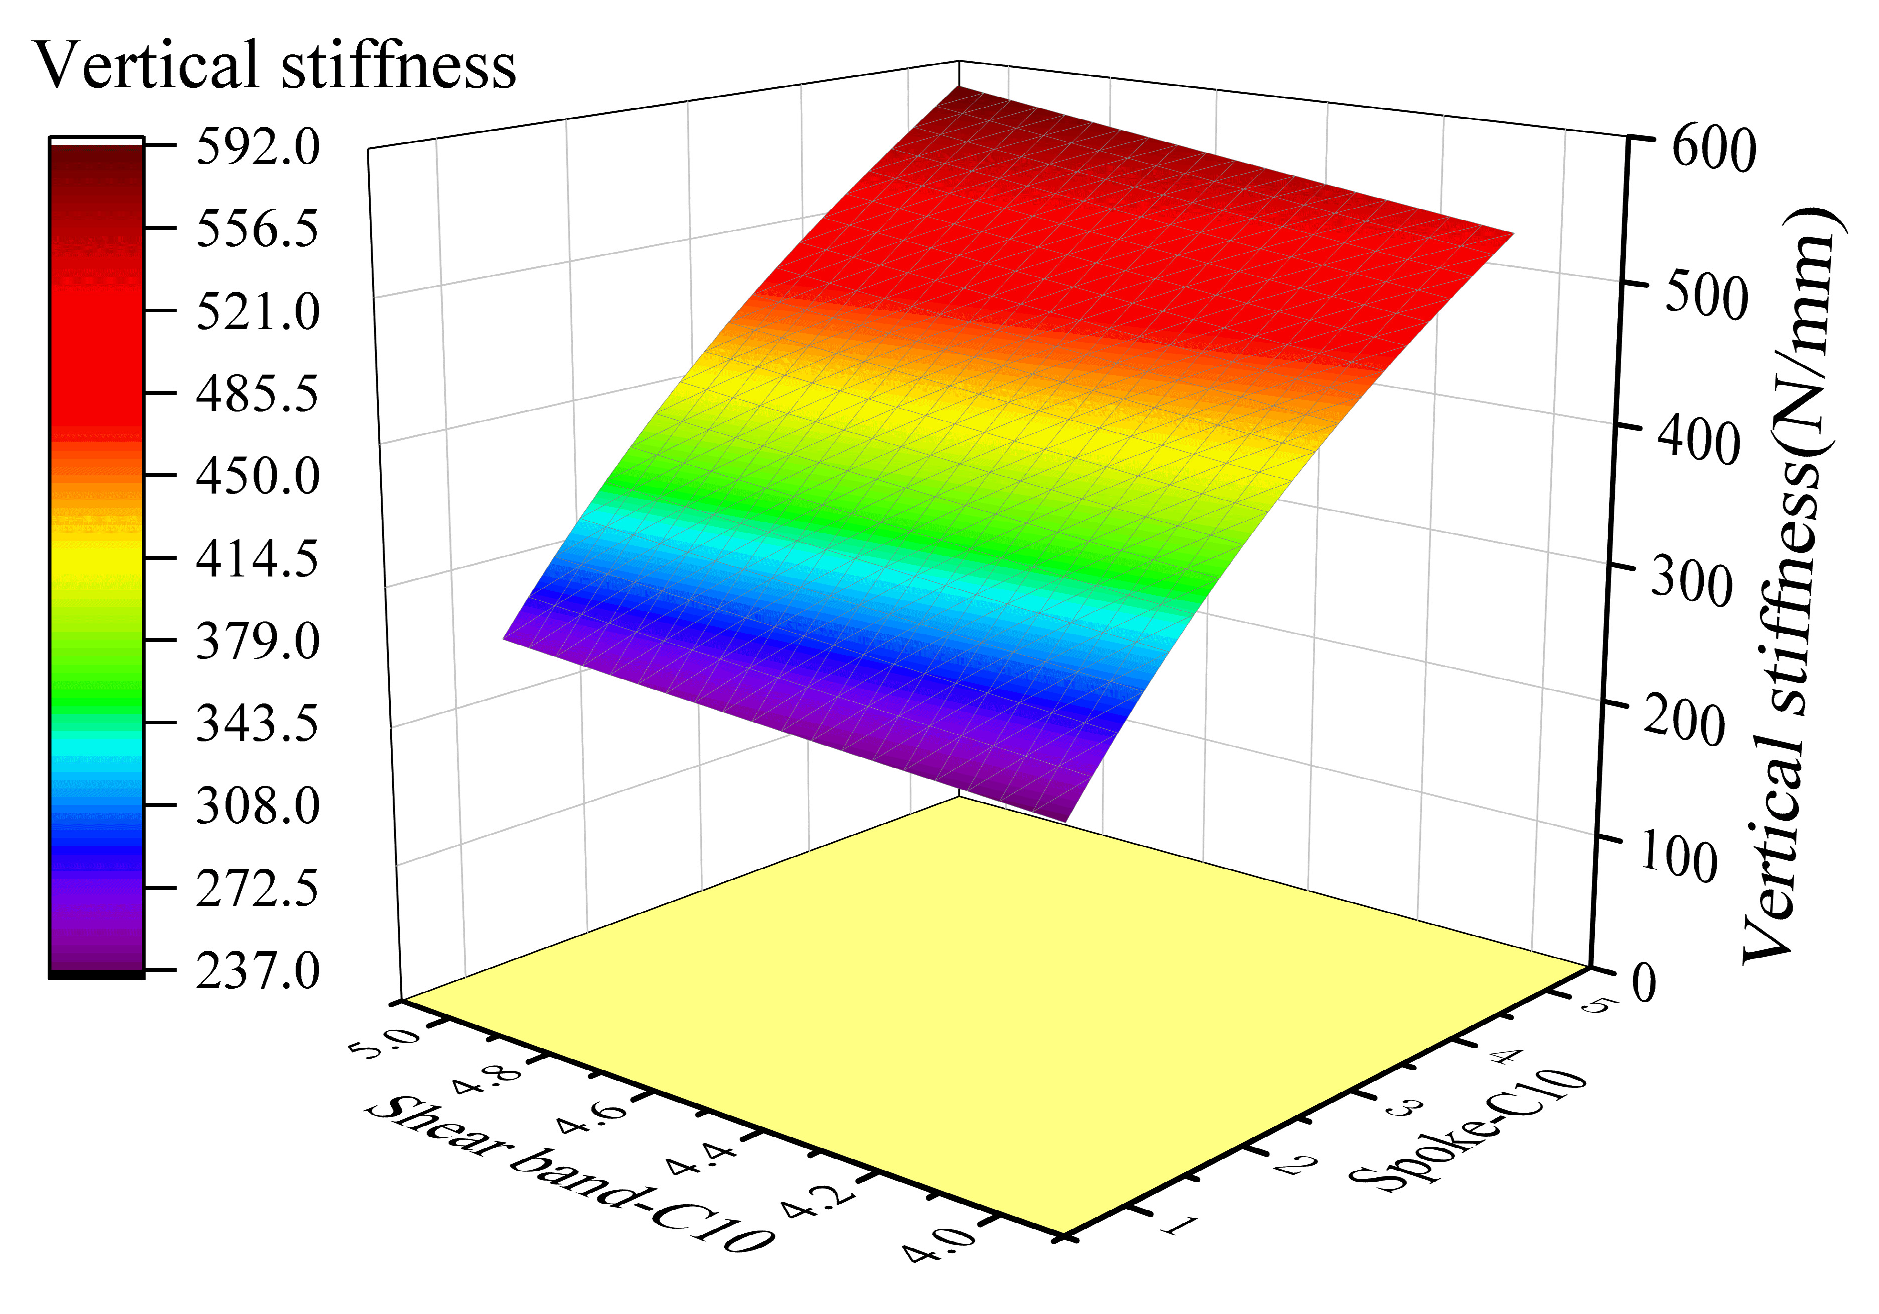
4.2.2. Rubber Parameters
4.2.3. Load-Bearing Characteristics and Sensitivity Analysis
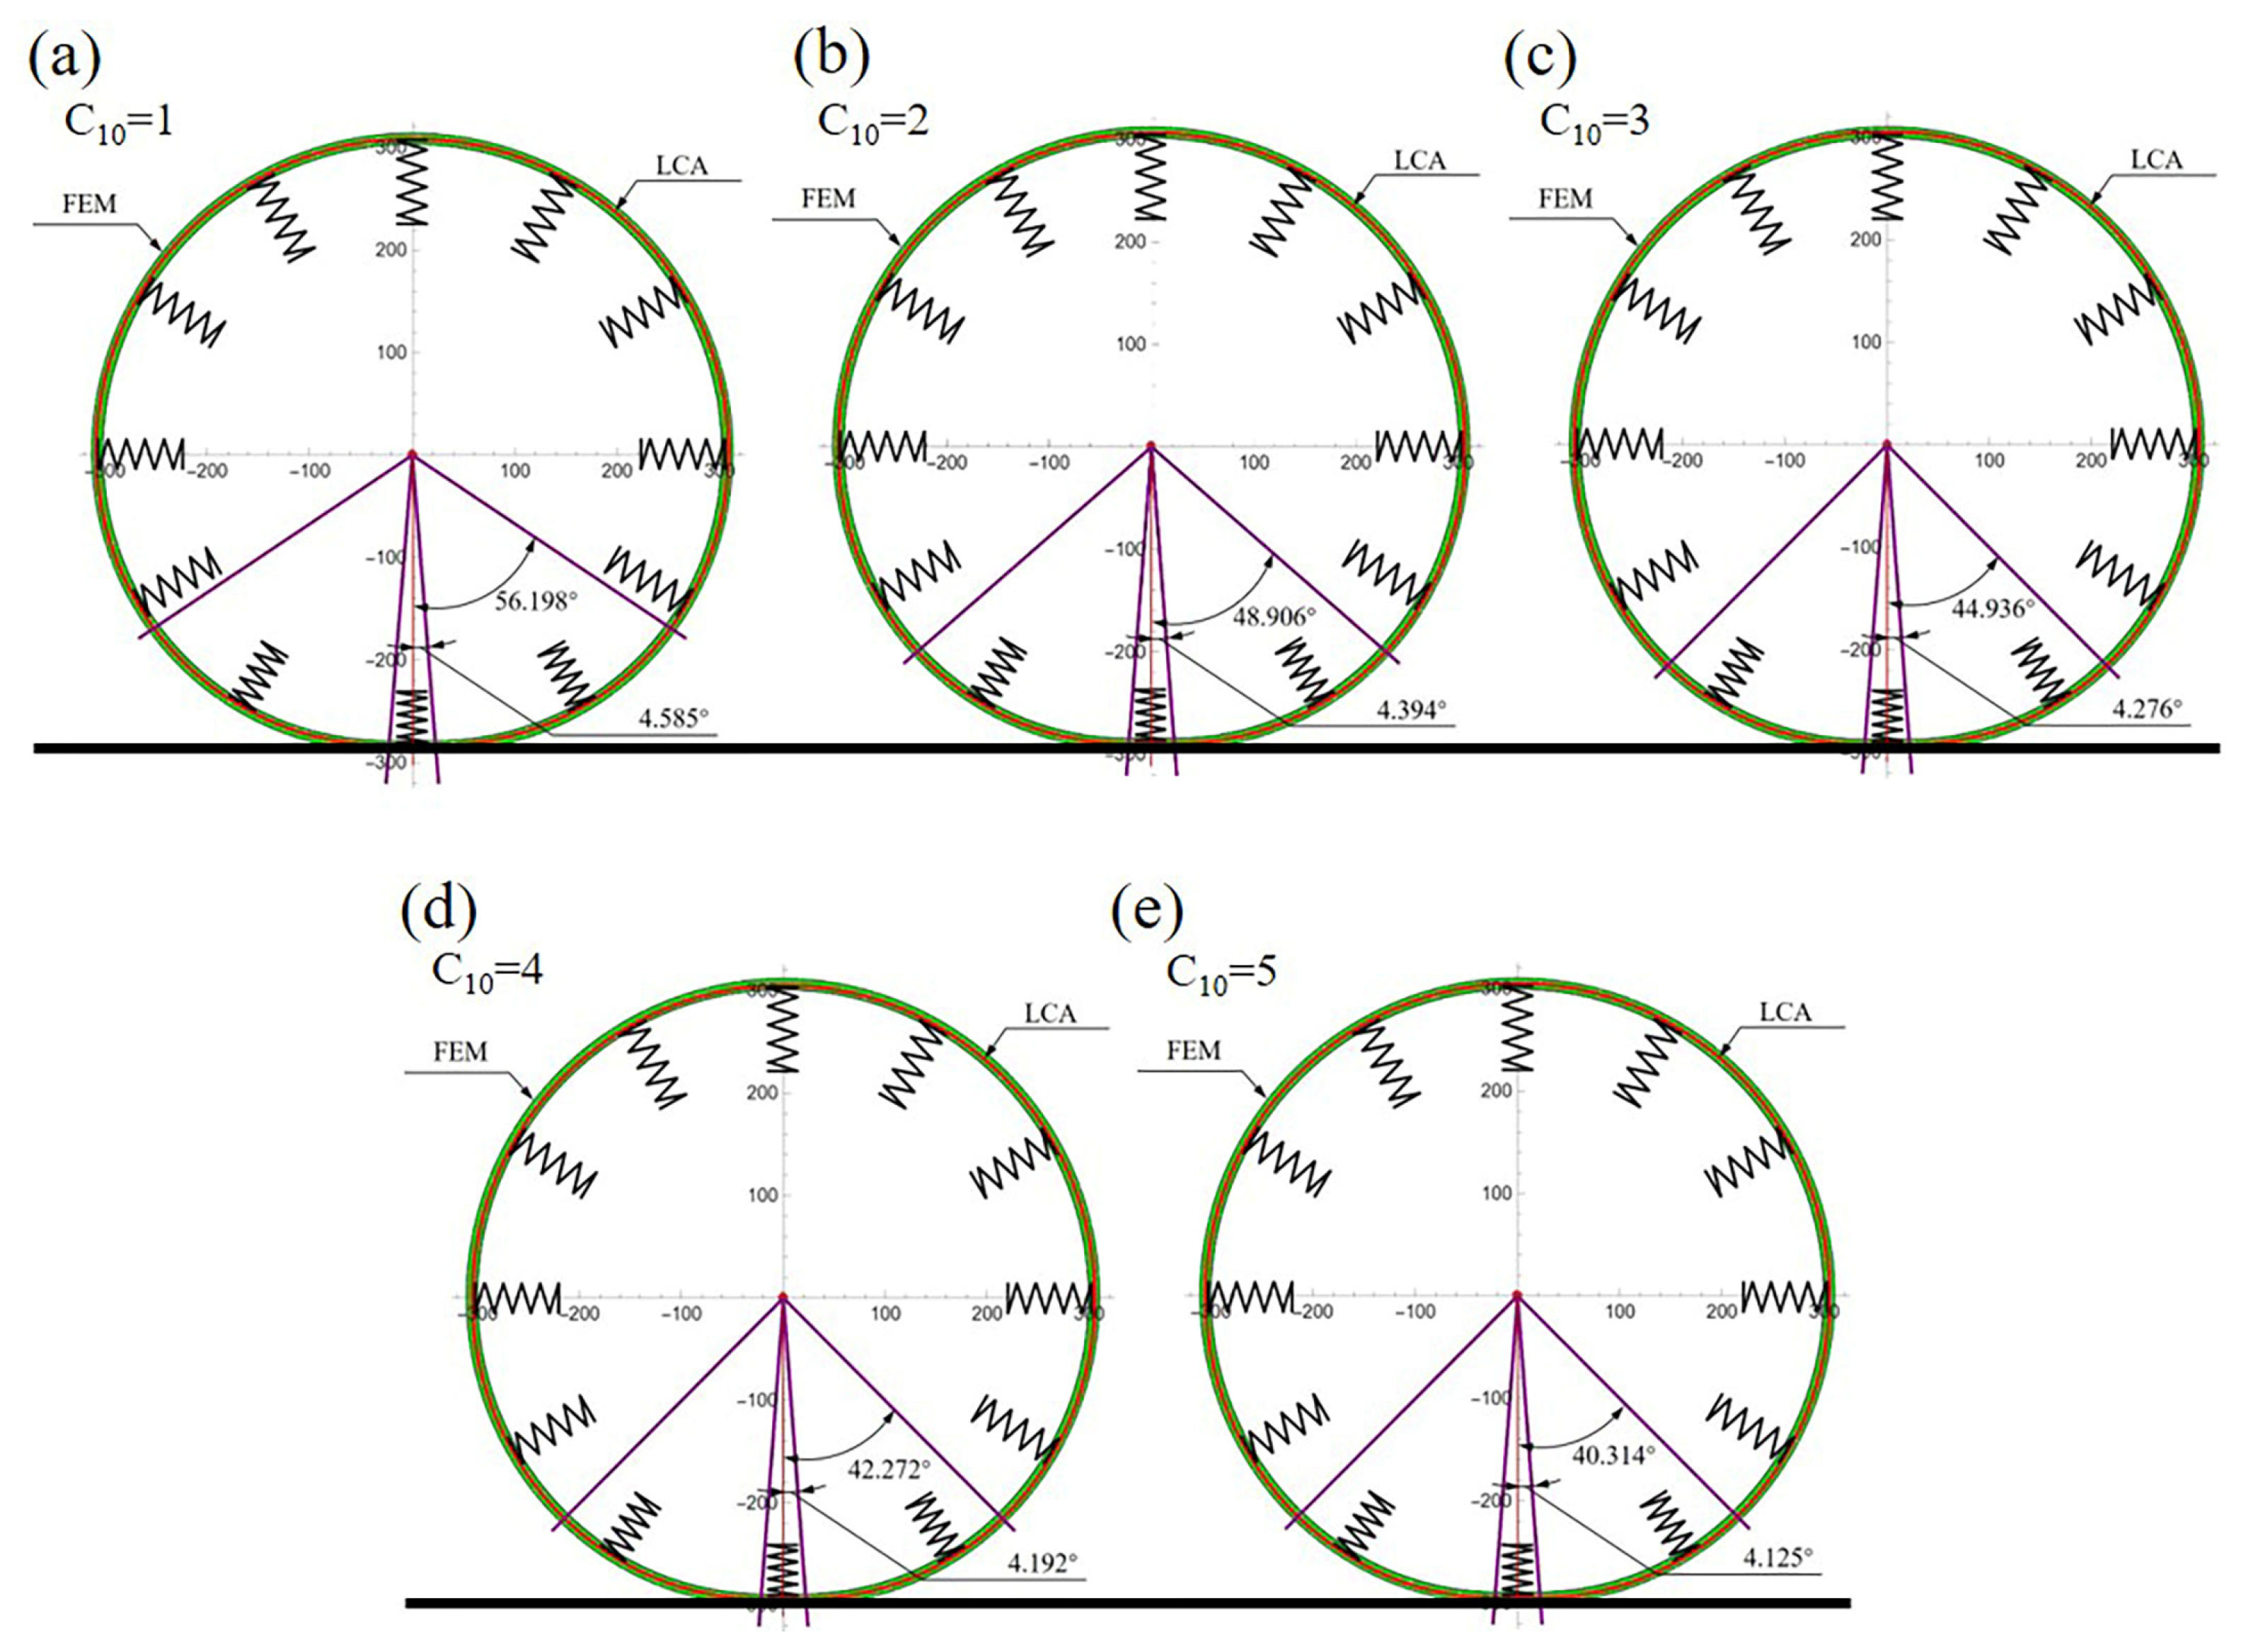
4.3. LCA Model Results
4.3.1. Determination of Spoke Stiffness
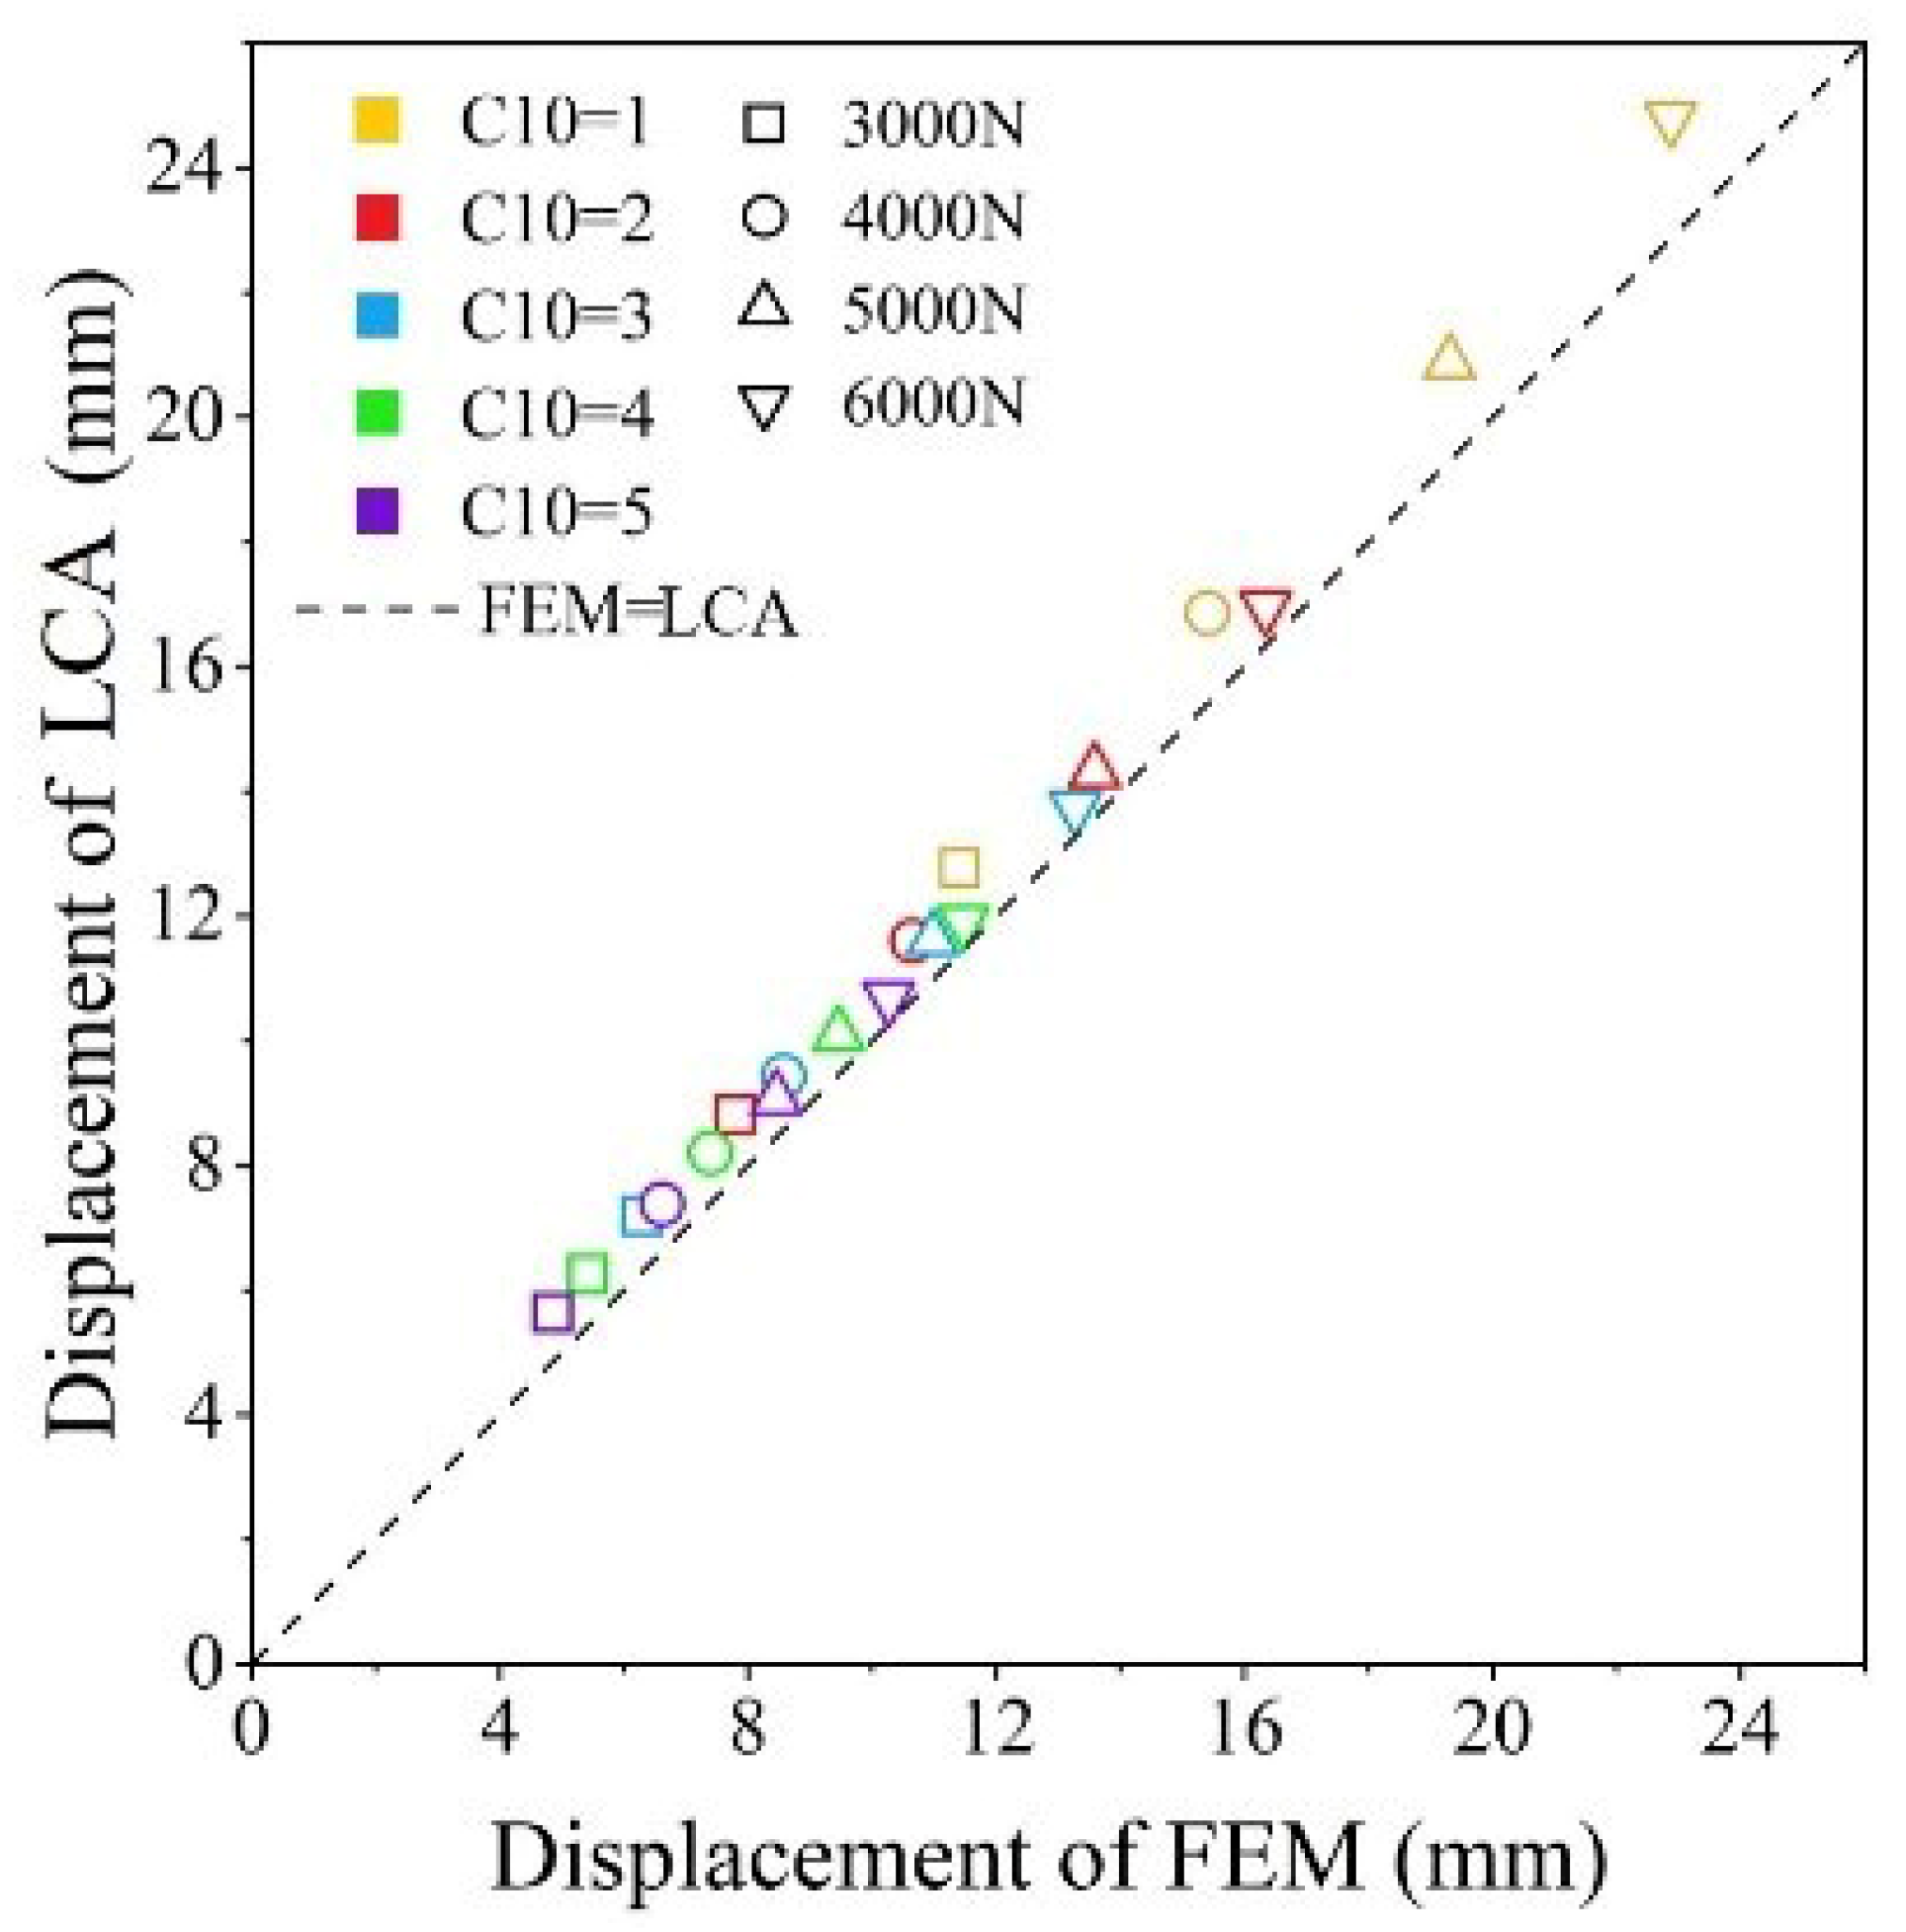
4.3.2. Validation
5. Conclusions
- Based on the experimental data, the parameters of the anisotropic constitutive model for CFRP and the neo-Hookean constitutive model for rubber were determined. A FEM for the Uptis NPT was established, proposing a deformation mechanism for the NPT-CS load-bearing characteristics composed of two deformation modes: bending–compression and bending–tension of the spokes;
- Using a response surface methodology to analyze the impact of the structural and material parameters of the NPT-CS on vertical stiffness, the comprehensive impact value of the spoke rubber constitutive parameter C10 was determined to be 319.83 N/mm based on the sensitivity analysis results, making it the most significant influencing factor;
- Building on the Timoshenko beam theory, approximate governing differential equations for the contact region, spoke compression region, and spoke tension region were proposed and solved. Through iterative methods, θt was determined, simplifying the compression and tension stiffness of the spokes. Finally, an LCA model for the Uptis NPT was established;
- The maximum errors of the LCA model compared with the FEM simulation results for the vertical stiffness values under loads of 3000, 4000, 5000, and 6000 N were 16%, 11.63%, 7.49%, and 8.44%, respectively. The deformation patterns of the spokes and shear bands were consistent with the FEM simulation results.
Author Contributions
Funding
Data Availability Statement
Acknowledgments
Conflicts of Interest
References
- Rhyne, T.B.; Cron, S.M. Development of a non-pneumatic wheel. Tire Sci. Technol. 2006, 34, 150–169. [Google Scholar] [CrossRef]
- Bezgam, S. Design and Analysis of Alternating Spoke Pair Concepts for a Non-Pneumatic Tire with Reduced Vibration at Highspeed Rolling. Ph.D. Dissertation, Clemson University, Clemson, SC, USA, 2009. [Google Scholar]
- Ju, J.; Kim, D.M. Flexible cellular solid spokes of a non-pneumatic tire. Compos. Struct. 2012, 94, 2285–2295. [Google Scholar] [CrossRef]
- Zhao, Y.Q.; Zang, L.G. Non-pneumatic mechanical elastic wheel natural dynamic characteristics and influencing factors. J. Cent. South Univ. 2015, 22, 1707–1715. [Google Scholar] [CrossRef]
- Kim, K.; Kim, D. Contact Pressure of Non-Pneumatic Tires with Auxetic Honeycomb Spoke. J. Aerosp. Syst. Eng. 2010, 4, 1–9. [Google Scholar]
- Michelin Uptis. Available online: https://michelinmedia.com/michelin-uptis/ (accessed on 10 April 2024).
- Jagadish, R. A Computational Investigation of Contact Pressure for a Non-Pnemautic Wheel with a Meta-Material Shear Band. Ph.D. Dissertation, Clemson University, Clemson, SC, USA, 2010. [Google Scholar]
- Gasmi, A.; Joseph, P.F. Closed-form solution of a shear deformable, extensional ring in contact between two rigid surfaces. Int. J. Solids Struct. 2011, 48, 843–853. [Google Scholar] [CrossRef]
- Gasmi, A.; Joseph, P.F. Contact solutions for a circular orthotropic beam accounting for transverse normal strain. Int. J. Eng. Sci. 2012, 55, 1–17. [Google Scholar] [CrossRef]
- Gasmi, A.; Joseph, P.F. Development of a two-dimensional model of a compliant non-pneumatic tire. Int. J. Solids Struct. 2012, 49, 1723–1740. [Google Scholar] [CrossRef]
- Liang, C.; Wei, W. Investigation on static grounding analysis model of non-pneumatic tire with nonlinear spokes. Aip Adv. 2021, 11, 015303. [Google Scholar] [CrossRef]
- Rugsaj, R.; Suvanjumrat, C. Finite element analysis of hyperelastic material model for non-pneumatic tire. Key Eng. Mater. 2018, 775, 554–559. [Google Scholar] [CrossRef]
- Rugsaj, R.; Suvanjumrat, C. Study of geometric effects on nonpneumatic tire spoke structures using finite element method. Mech. Based Des. Struct. Mach. 2022, 50, 2379–2399. [Google Scholar] [CrossRef]
- Jin, X.; Hou, C. Investigation on the static and dynamic behaviors of non-pneumatic tires with honeycomb spokes. Compos. Struct. 2018, 187, 27–35. [Google Scholar] [CrossRef]
- Ganniari-Papageorgiou, E.; Chatzistergos, P. The influence of the honeycomb design parameters on the mechanical behavior of non-pneumatic tires. Int. J. Appl. Mech. 2020, 12, 2050024. [Google Scholar] [CrossRef]
- Żmuda, M.; Jackowski, J.; Hryciów, Z. Numerical research of selected features of the non-pneumatic tire. In Proceedings of the 15th Conference on Computational Technologies in Engineering, Jora Wielka, Poland, 16–19 October 2018. [Google Scholar]
- Hryciów, Z.; Jackowski, J. The influence of non-pneumatic tyre structure on its operational properties. Int. J. Automot. Mech. Eng. 2020, 17, 8168–8178. [Google Scholar] [CrossRef]
- Liu, W.; Liu, S. Static Stiffness Properties of High Load Capacity Non-Pneumatic Tires with Different Tread Structures. Lubricants 2023, 11, 180. [Google Scholar] [CrossRef]
- Dhrangdhariya, P.; Maiti, S. Effect of spoke design and material nonlinearity on non-pneumatic tire stiffness and durability performance. arXiv 2021, arXiv:2103.03637. [Google Scholar] [CrossRef]
- Dhrangdhariya, P.; Maiti, S. Topological Optimization of Non-Pneumatic Unique Puncture-Proof Tire System (NPT-UPTIS) Spoke Design for Tire Performance; SAE International: Warrendale, PA, USA, 2023. [Google Scholar]
- Liang, X.; Fu, H. Study of composite load-bearing characteristics of the Uptis non-pneumatic tyre. Int. J. Veh. Syst. Model. Test. 2022, 16, 79–93. [Google Scholar] [CrossRef]
- Miles, K.C.; Cron, S.M. Reinforced Resilient Support for a Non-Pneumatic Tire. U.S. Patent 11,577,549, 14 February 2023. [Google Scholar]
- Kim, K.; Heo, H. Optimization of Nonpneumatic Tire with Hexagonal Lattice Spokes for Reducing Rolling Resistance; SAE International: Warrendale, PA, USA, 2015. [Google Scholar]
- Liu, X.; Xu, T. Multi-objective optimization of the geometry of a non-pneumatic tire for three-dimensional stiffness adaptation. Machines 2022, 10, 1183. [Google Scholar] [CrossRef]
- Vinson, J.R.; Sierakowski, R.L. The Behavior of Structures Composed of Composite Materials, 2nd ed.; Springer: New York, NY, USA, 2006; pp. 59–67. [Google Scholar]
- Liu, W.; Li, C. Influence of Spoke Parameters on Load Capacity of Non-Pneumatic Tires Using Orthogonal Study and Analysis of Variance. Int. J. Automot. Technol. 2024, 1, 13. [Google Scholar] [CrossRef]
- Wang, W.; Deng, T. Determination for material constants of rubber Mooney-Rivlin model. Spec. Purp. Rubber Prod. 2004, 25, 8–10. [Google Scholar]
- Michelin Partners DHL Express To Trial Michelin Uptis Puncture-Proof Tires on Singapore Roads in First-Ever Pilot. Available online: https://www.dhl.com/sg-en/home/press/press-archive/2023/michelin-partners-dhl-express-to-trial-michelin-uptis-puncture-proof-tires-on-singapore-roads-in-first-ever-pilot.html/ (accessed on 29 April 2024).


| Fiber Orientation Angle | Width (mm) | Length (mm) | Thickness (mm) | Reinforcement Piece Length (mm) | Reinforcement Piece Thickness (mm) | |
|---|---|---|---|---|---|---|
| Tensile | 0° | 15 | 250 | 0.9 | 56 | 1.5 |
| 90° | 25 | 175 | 2.1 | 25 | 1.5 | |
| Compression | 0° | 12 | 150 | 2.4 | 63.5 | 1.5 |
| 90° | 12 | 150 | 2.4 | 63.5 | 1.5 | |
| Shear | ±45° | 25 | 250 | 2.4 | 56 | 1.5 |
| E1 (MPa) | E2 (MPa) | E3 (MPa) | μ12 | μ13 | μ23 | G12 (MPa) | G13 (MPa) | G23 (MPa) |
|---|---|---|---|---|---|---|---|---|
| 128,000 | 8800 | 8800 | 0.357 | 0.357 | 0.35 | 3147 | 3147 | 2300 |
| Parameter | Outer Diameter (mm) | Tread Width (mm) | Rim Outer Diameter (mm) | Rim Width (mm) | Shear Band Thickness (mm) | Inner Steel Wire Layer Diameter (mm) | Outer Steel Wire Layer Diameter (mm) |
|---|---|---|---|---|---|---|---|
| Value | 646.8 | 215 | 431.8 | 165.1 | 14 | 601.5 | 626.5 |
| Part | Number | Mesh Type | Element Number |
|---|---|---|---|
| Reinforcement plate | 30 per spoke | S4R | 22 per spoke |
| Thread and Shear band | 1 | C3D8H/C3D6H | 33,480 |
| Inner Steel Wire | 1 | S4R | 4400 |
| Outer Steel Wire | 1 | S4R | 4400 |
| Spoke | 60 | C3D8H/C3D6H | 3612 per spoke |
| No. | S (mm) | T (mm) | A (°) | Stiffness (N/mm) | No. | S (mm) | T (mm) | A (°) | Stiffness (N/mm) | No. | S (mm) | T (mm) | A (°) | Stiffness (N/mm) |
|---|---|---|---|---|---|---|---|---|---|---|---|---|---|---|
| 1 | 10.00 | 1.20 | 0.00 | 297.81 | 22 | 15.00 | 1.20 | 0.00 | 266.61 | 43 | 20.00 | 1.20 | 0.00 | 241.27 |
| 2 | 10.00 | 1.20 | 15.00 | 296.61 | 23 | 15.00 | 1.20 | 15.00 | 265.51 | 44 | 20.00 | 1.20 | 15.00 | 240.31 |
| 3 | 10.00 | 1.20 | 30.00 | 293.63 | 24 | 15.00 | 1.20 | 30.00 | 262.83 | 45 | 20.00 | 1.20 | 30.00 | 237.96 |
| 4 | 10.00 | 1.20 | 45.00 | 283.46 | 25 | 15.00 | 1.20 | 45.00 | 253.80 | 46 | 20.00 | 1.20 | 45.00 | 230.20 |
| 5 | 10.00 | 1.20 | 60.00 | 267.83 | 26 | 15.00 | 1.20 | 60.00 | 240.47 | 47 | 20.00 | 1.20 | 60.00 | 219.05 |
| 6 | 10.00 | 1.20 | 75.00 | 264.51 | 27 | 15.00 | 1.20 | 75.00 | 237.70 | 48 | 20.00 | 1.20 | 75.00 | 216.80 |
| 7 | 10.00 | 1.20 | 90.00 | 264.99 | 28 | 15.00 | 1.20 | 90.00 | 238.11 | 49 | 20.00 | 1.20 | 90.00 | 217.14 |
| 8 | 10.00 | 1.80 | 0.00 | 300.21 | 29 | 15.00 | 1.80 | 0.00 | 268.78 | 50 | 20.00 | 1.80 | 0.00 | 243.15 |
| 9 | 10.00 | 1.80 | 15.00 | 299.93 | 30 | 15.00 | 1.80 | 15.00 | 268.51 | 51 | 20.00 | 1.80 | 15.00 | 242.92 |
| 10 | 10.00 | 1.80 | 30.00 | 298.83 | 31 | 15.00 | 1.80 | 30.00 | 267.49 | 52 | 20.00 | 1.80 | 30.00 | 242.03 |
| 11 | 10.00 | 1.80 | 45.00 | 294.67 | 32 | 15.00 | 1.80 | 45.00 | 263.73 | 53 | 20.00 | 1.80 | 45.00 | 238.72 |
| 12 | 10.00 | 1.80 | 60.00 | 288.93 | 33 | 15.00 | 1.80 | 60.00 | 258.58 | 54 | 20.00 | 1.80 | 60.00 | 234.27 |
| 13 | 10.00 | 1.80 | 75.00 | 288.06 | 34 | 15.00 | 1.80 | 75.00 | 257.80 | 55 | 20.00 | 1.80 | 75.00 | 233.61 |
| 14 | 10.00 | 1.80 | 90.00 | 288.33 | 35 | 15.00 | 1.80 | 90.00 | 258.05 | 56 | 20.00 | 1.80 | 90.00 | 233.83 |
| 15 | 10.00 | 2.40 | 0.00 | 300.85 | 36 | 15.00 | 2.40 | 0.00 | 269.35 | 57 | 20.00 | 2.40 | 0.00 | 243.66 |
| 16 | 10.00 | 2.40 | 15.00 | 300.74 | 37 | 15.00 | 2.40 | 15.00 | 269.24 | 58 | 20.00 | 2.40 | 15.00 | 243.56 |
| 17 | 10.00 | 2.40 | 30.00 | 300.19 | 38 | 15.00 | 2.40 | 30.00 | 268.74 | 59 | 20.00 | 2.40 | 30.00 | 243.11 |
| 18 | 10.00 | 2.40 | 45.00 | 298.07 | 39 | 15.00 | 2.40 | 45.00 | 266.77 | 60 | 20.00 | 2.40 | 45.00 | 241.40 |
| 19 | 10.00 | 2.40 | 60.00 | 295.59 | 40 | 15.00 | 2.40 | 60.00 | 264.55 | 61 | 20.00 | 2.40 | 60.00 | 239.43 |
| 20 | 10.00 | 2.40 | 75.00 | 295.38 | 41 | 15.00 | 2.40 | 75.00 | 264.35 | 62 | 20.00 | 2.40 | 75.00 | 239.27 |
| 21 | 10.00 | 2.40 | 90.00 | 295.53 | 42 | 15.00 | 2.40 | 90.00 | 264.49 | 63 | 20.00 | 2.40 | 90.00 | 239.39 |
| C0 | C1 | C2 | C3 | C4 | C5 | C6 | C7 | C8 | C9 | C10 |
|---|---|---|---|---|---|---|---|---|---|---|
| 338.85 | 43.79 | −0.34 | −8.64 | −10.62 | −0.01 | 0.11 | 0.26 | −0.36 | 0.01 | 9.52 |
| 9 | T-C | S-C | Stiffness (N/mm) | No. | T-C | S-C | Stiffness (N/mm) | No. | T-C | S-C | Stiffness (N/mm) |
|---|---|---|---|---|---|---|---|---|---|---|---|
| 1 | 4.00 | 1.00 | 237.23 | 6 | 4.50 | 1.00 | 248.32 | 11 | 5.00 | 1.00 | 258.92 |
| 2 | 4.00 | 2.00 | 336.85 | 7 | 4.50 | 2.00 | 352.68 | 12 | 5.00 | 2.00 | 367.84 |
| 3 | 4.00 | 3.00 | 415.30 | 8 | 4.50 | 3.00 | 434.94 | 13 | 5.00 | 3.00 | 455.43 |
| 4 | 4.00 | 4.00 | 480.74 | 9 | 4.50 | 4.00 | 502.99 | 14 | 5.00 | 4.00 | 528.43 |
| 5 | 4.00 | 5.00 | 536.71 | 10 | 4.50 | 5.00 | 561.66 | 15 | 5.00 | 5.00 | 591.18 |
| C0 | C1 | C2 | C3 | C4 | C5 | C6 |
|---|---|---|---|---|---|---|
| 112.96 | −12.55 | 109.10 | 2.98 | −16.32 | 8.22 | 0.98 |
| Space | Thickness | Angle | Tread-C10 | Spoke-C10 | |
|---|---|---|---|---|---|
| Gradients | 5.49 | 13.30 | 0.24 | 38.60 | 79.95 |
| Range | 10 | 1.2 | 90 | 1 | 4 |
| Comprehensive Impact Value (N/mm) | 54.93 | 15.97 | 21.91 | 38.60 | 319.83 |
| C10 = 1 | C10 = 2 | C10 = 3 | C10 = 4 | C10 = 5 | |
|---|---|---|---|---|---|
| Tension Stiffness (N/mm) | 30.2 | 58.4 | 84.7 | 109. | 132.57 |
| R2 | 0.9949 | 0.9948 | 0.9948 | 0.9947 | 0.9946 |
| Compression Stiffness (N/mm) | 13.26 | 25.36 | 36.38 | 46.58 | 56.04 |
| R2 | 0.9882 | 0.9877 | 0.9873 | 0.9869 | 0.9867 |
| k (N/mm2) | 0.95 | 1.83 | 2.66 | 3.43 | 4.16 |
| j (N/mm2) | 0.41 | 0.79 | 1.14 | 1.46 | 1.76 |
| S-C | 1 | 2 | 3 | 4 | 5 |
|---|---|---|---|---|---|
| Stiffness of FEM (N/mm) | 258.92 | 367.84 | 455.43 | 528.43 | 591.17 |
| θc (°) | 4.585 | 4.394 | 4.276 | 4.192 | 4.125 |
| θt (°) | 56.198 | 48.906 | 44.936 | 42.272 | 40.314 |
| Force of LCA (N) | 5000 | 5000 | 5000 | 5000 | 5000 |
| Displacement of LCA (mm) | 20.87 | 14.32 | 11.62 | 10.09 | 9.07 |
| Stiffness of LCA (N/mm) | 239.52 | 349.14 | 429.97 | 495.40 | 551.10 |
| Relative Error | 7.49% | 5.08% | 5.59% | 6.25% | 6.78% |
Disclaimer/Publisher’s Note: The statements, opinions and data contained in all publications are solely those of the individual author(s) and contributor(s) and not of MDPI and/or the editor(s). MDPI and/or the editor(s) disclaim responsibility for any injury to people or property resulting from any ideas, methods, instructions or products referred to in the content. |
© 2024 by the authors. Licensee MDPI, Basel, Switzerland. This article is an open access article distributed under the terms and conditions of the Creative Commons Attribution (CC BY) license (https://creativecommons.org/licenses/by/4.0/).
Share and Cite
Sun, M.; Liu, W.; Zhang, Q.; Chen, Y.; Jiang, J.; Liu, X. Study on the Load-Bearing Characteristics Analysis Model of Non-Pneumatic Tire with Composite Spokes. Machines 2024, 12, 358. https://doi.org/10.3390/machines12060358
Sun M, Liu W, Zhang Q, Chen Y, Jiang J, Liu X. Study on the Load-Bearing Characteristics Analysis Model of Non-Pneumatic Tire with Composite Spokes. Machines. 2024; 12(6):358. https://doi.org/10.3390/machines12060358
Chicago/Turabian StyleSun, Muyang, Weidong Liu, Qiushi Zhang, Yuxi Chen, Jianshan Jiang, and Xiaotong Liu. 2024. "Study on the Load-Bearing Characteristics Analysis Model of Non-Pneumatic Tire with Composite Spokes" Machines 12, no. 6: 358. https://doi.org/10.3390/machines12060358
APA StyleSun, M., Liu, W., Zhang, Q., Chen, Y., Jiang, J., & Liu, X. (2024). Study on the Load-Bearing Characteristics Analysis Model of Non-Pneumatic Tire with Composite Spokes. Machines, 12(6), 358. https://doi.org/10.3390/machines12060358