

Hydrodynamic Performance Study of a Reciprocating Plate Column Dirven by Electro-permanent Magnet Technology

 ,
,
Abstract
1. Introduction
2. Materials and Methods
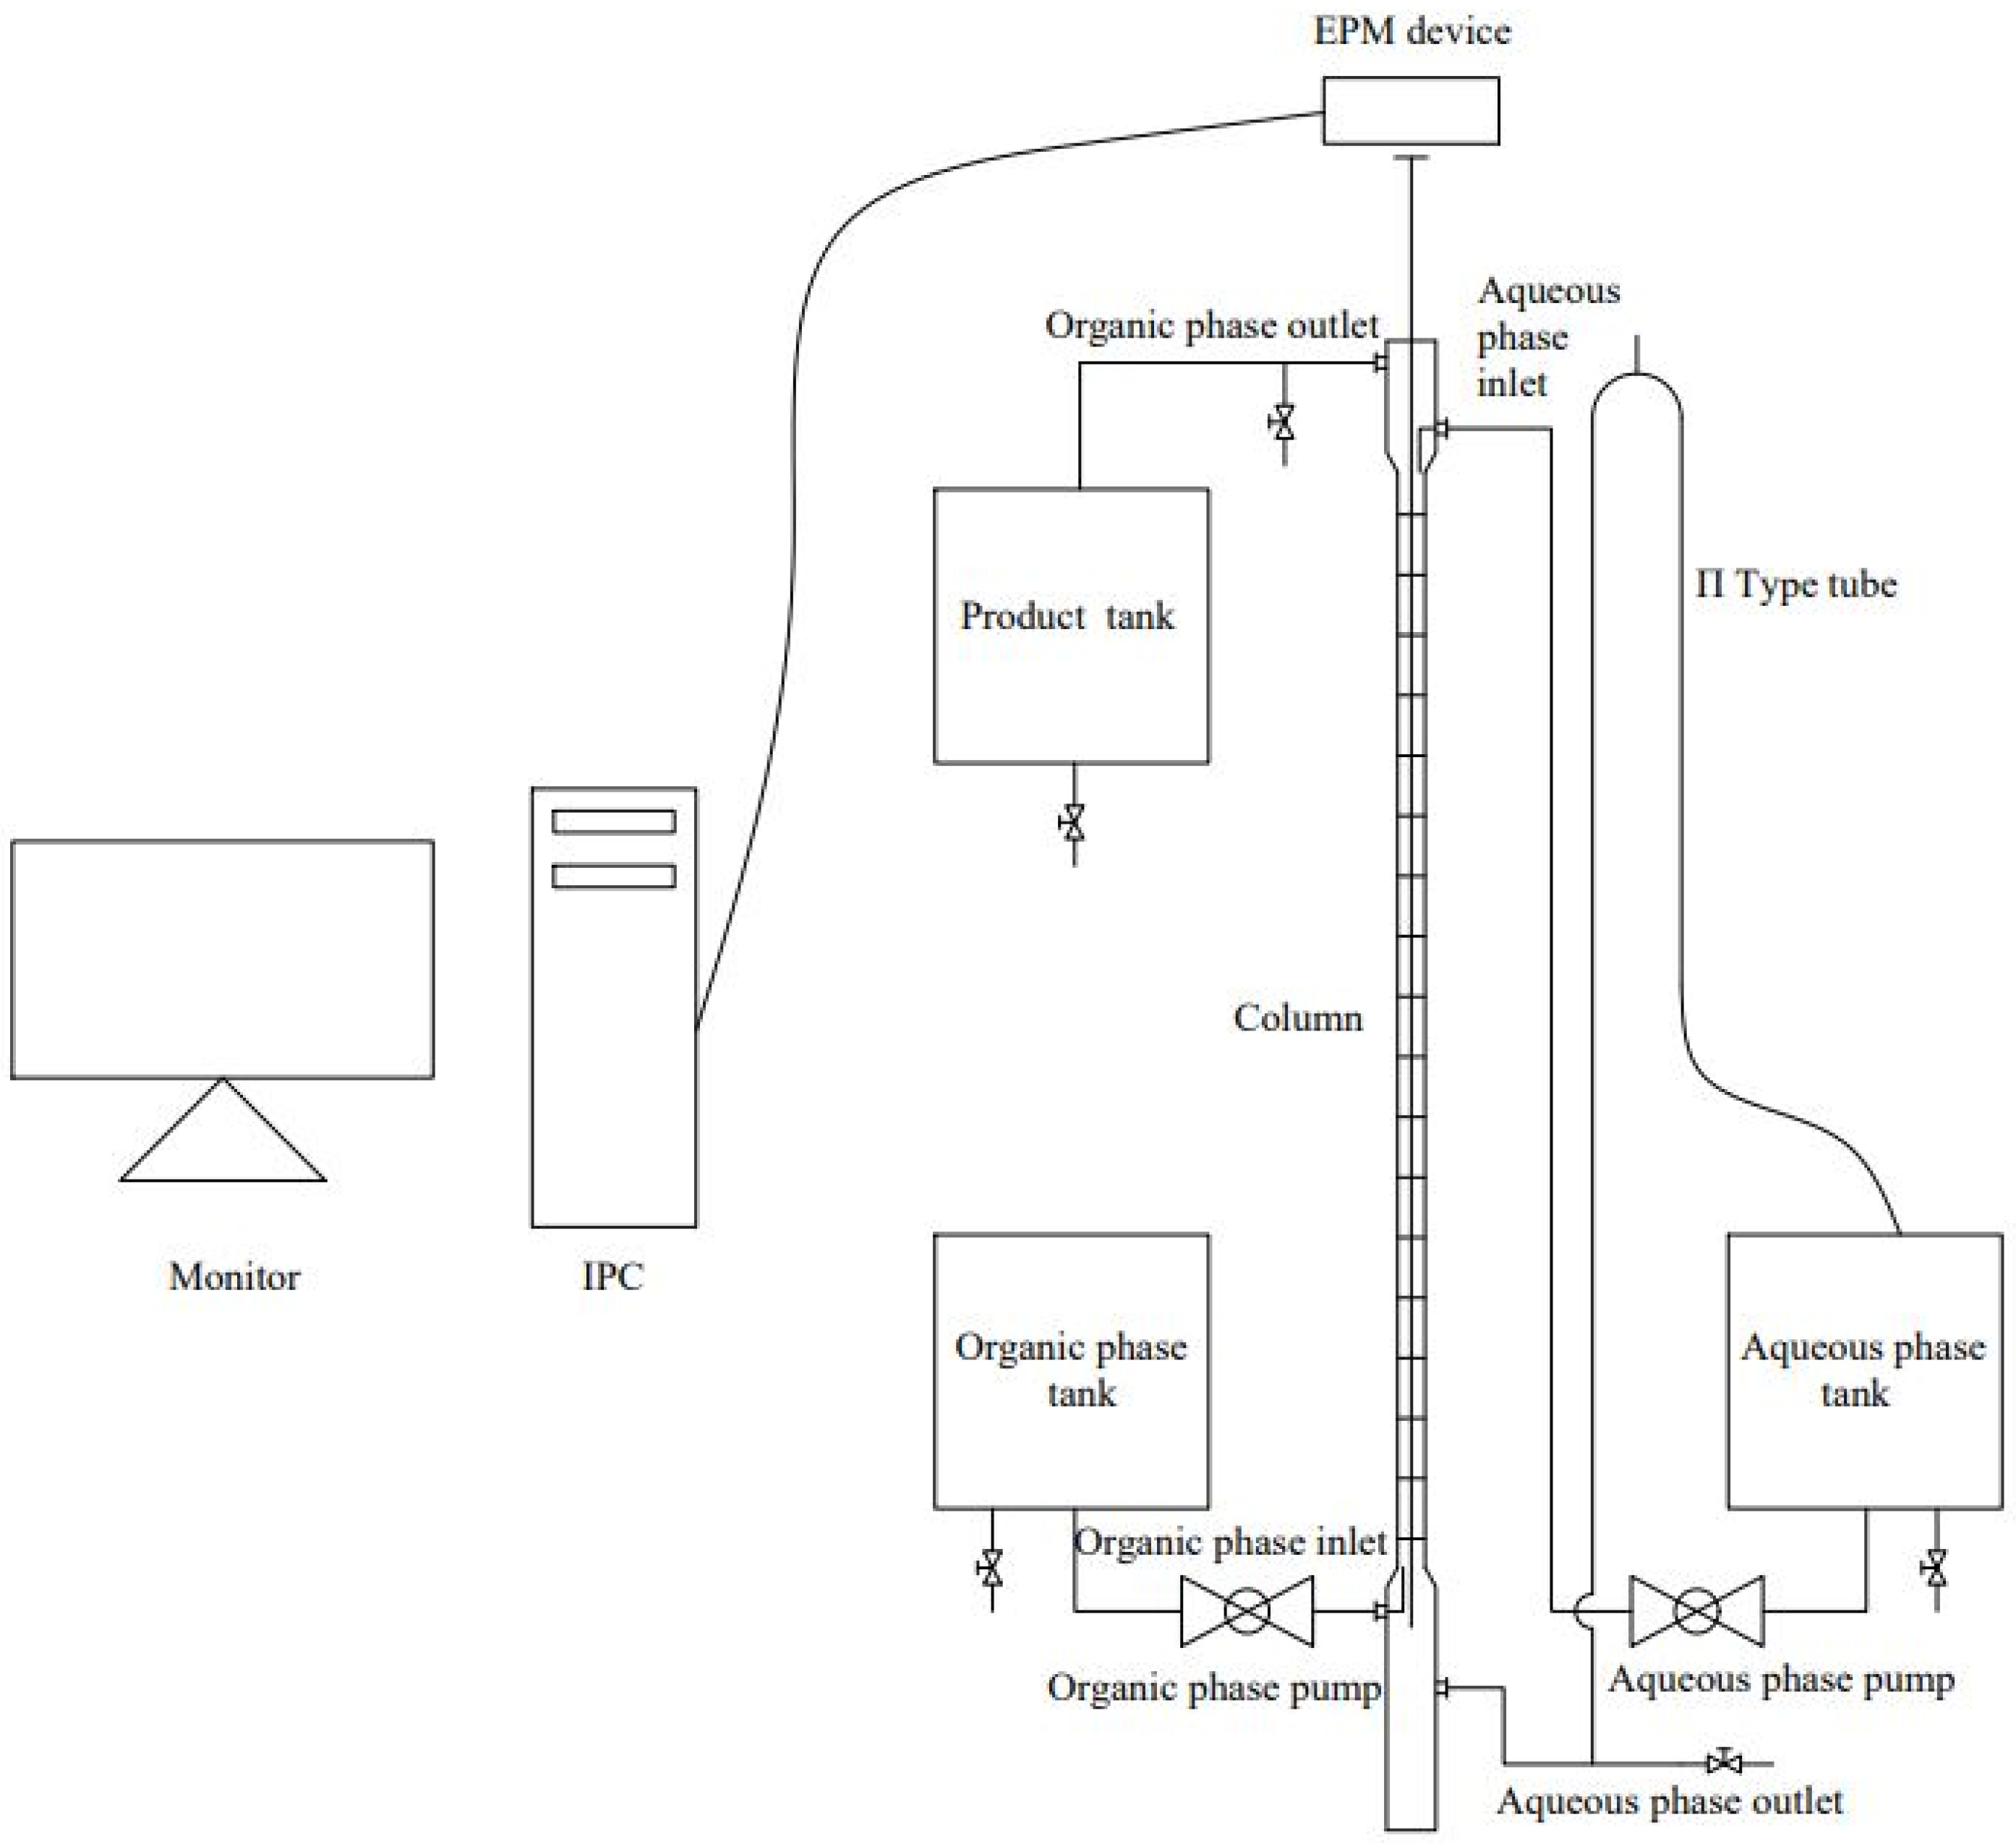
2.1. Design of EPM Reciprocating Plate Column
2.2. Materials
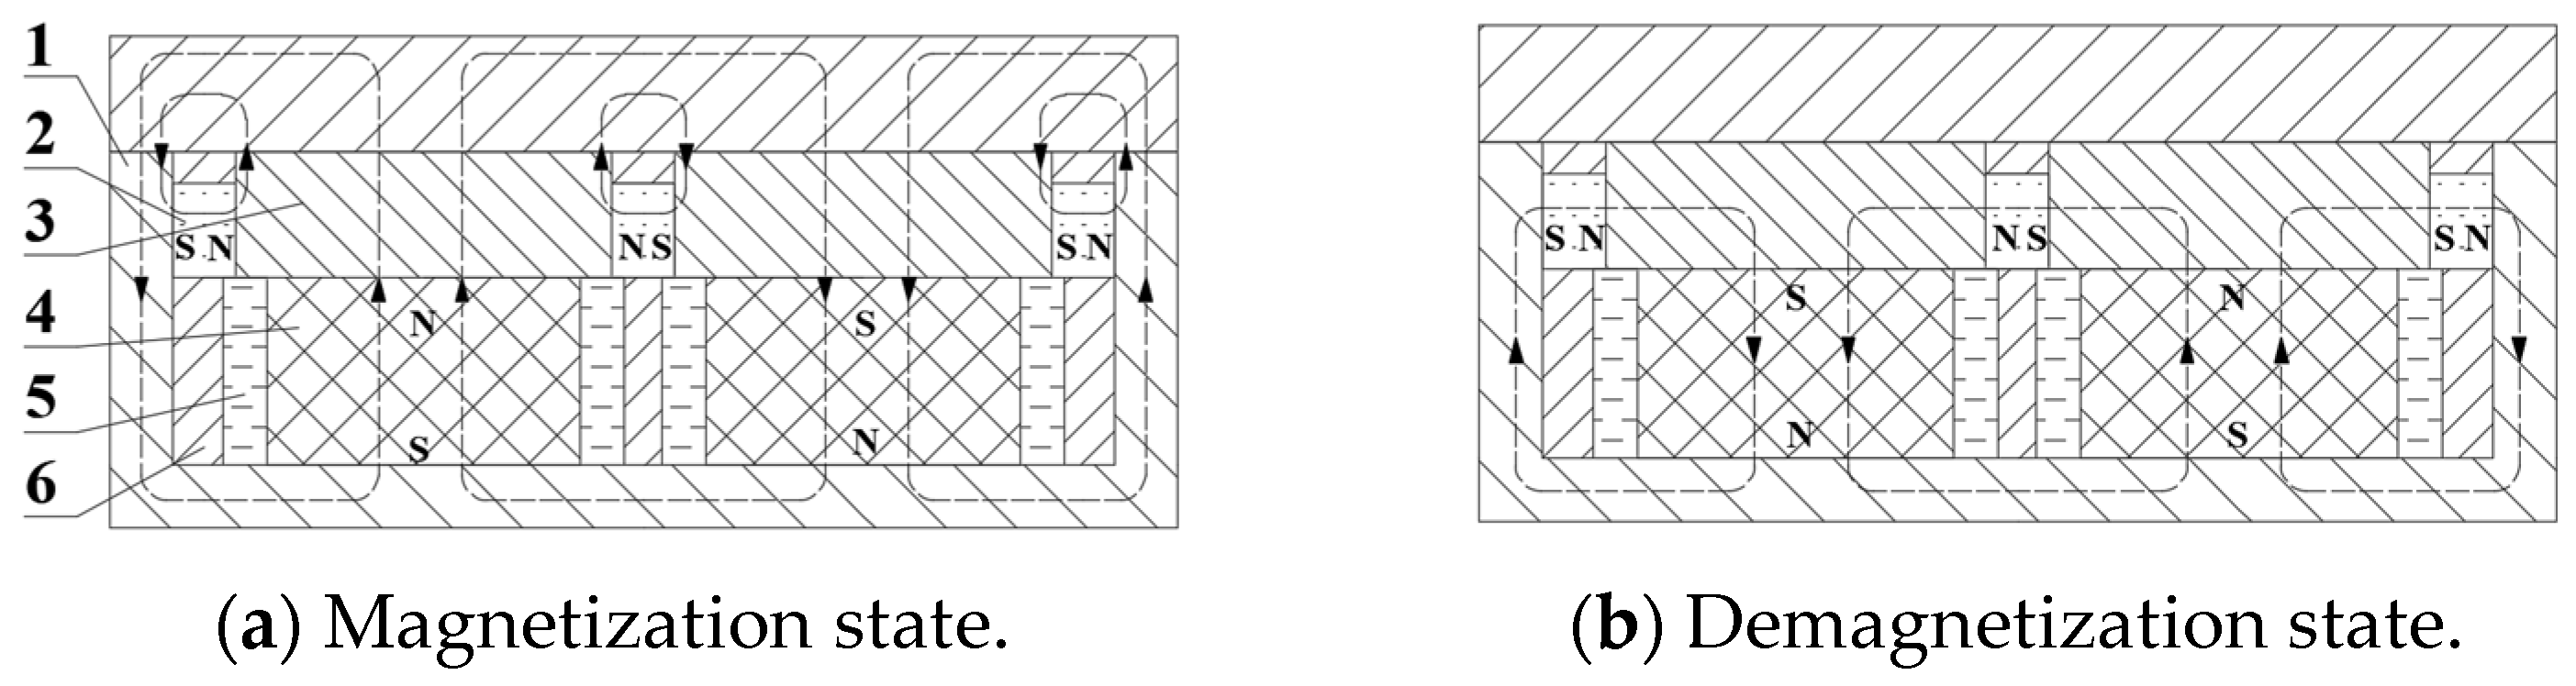
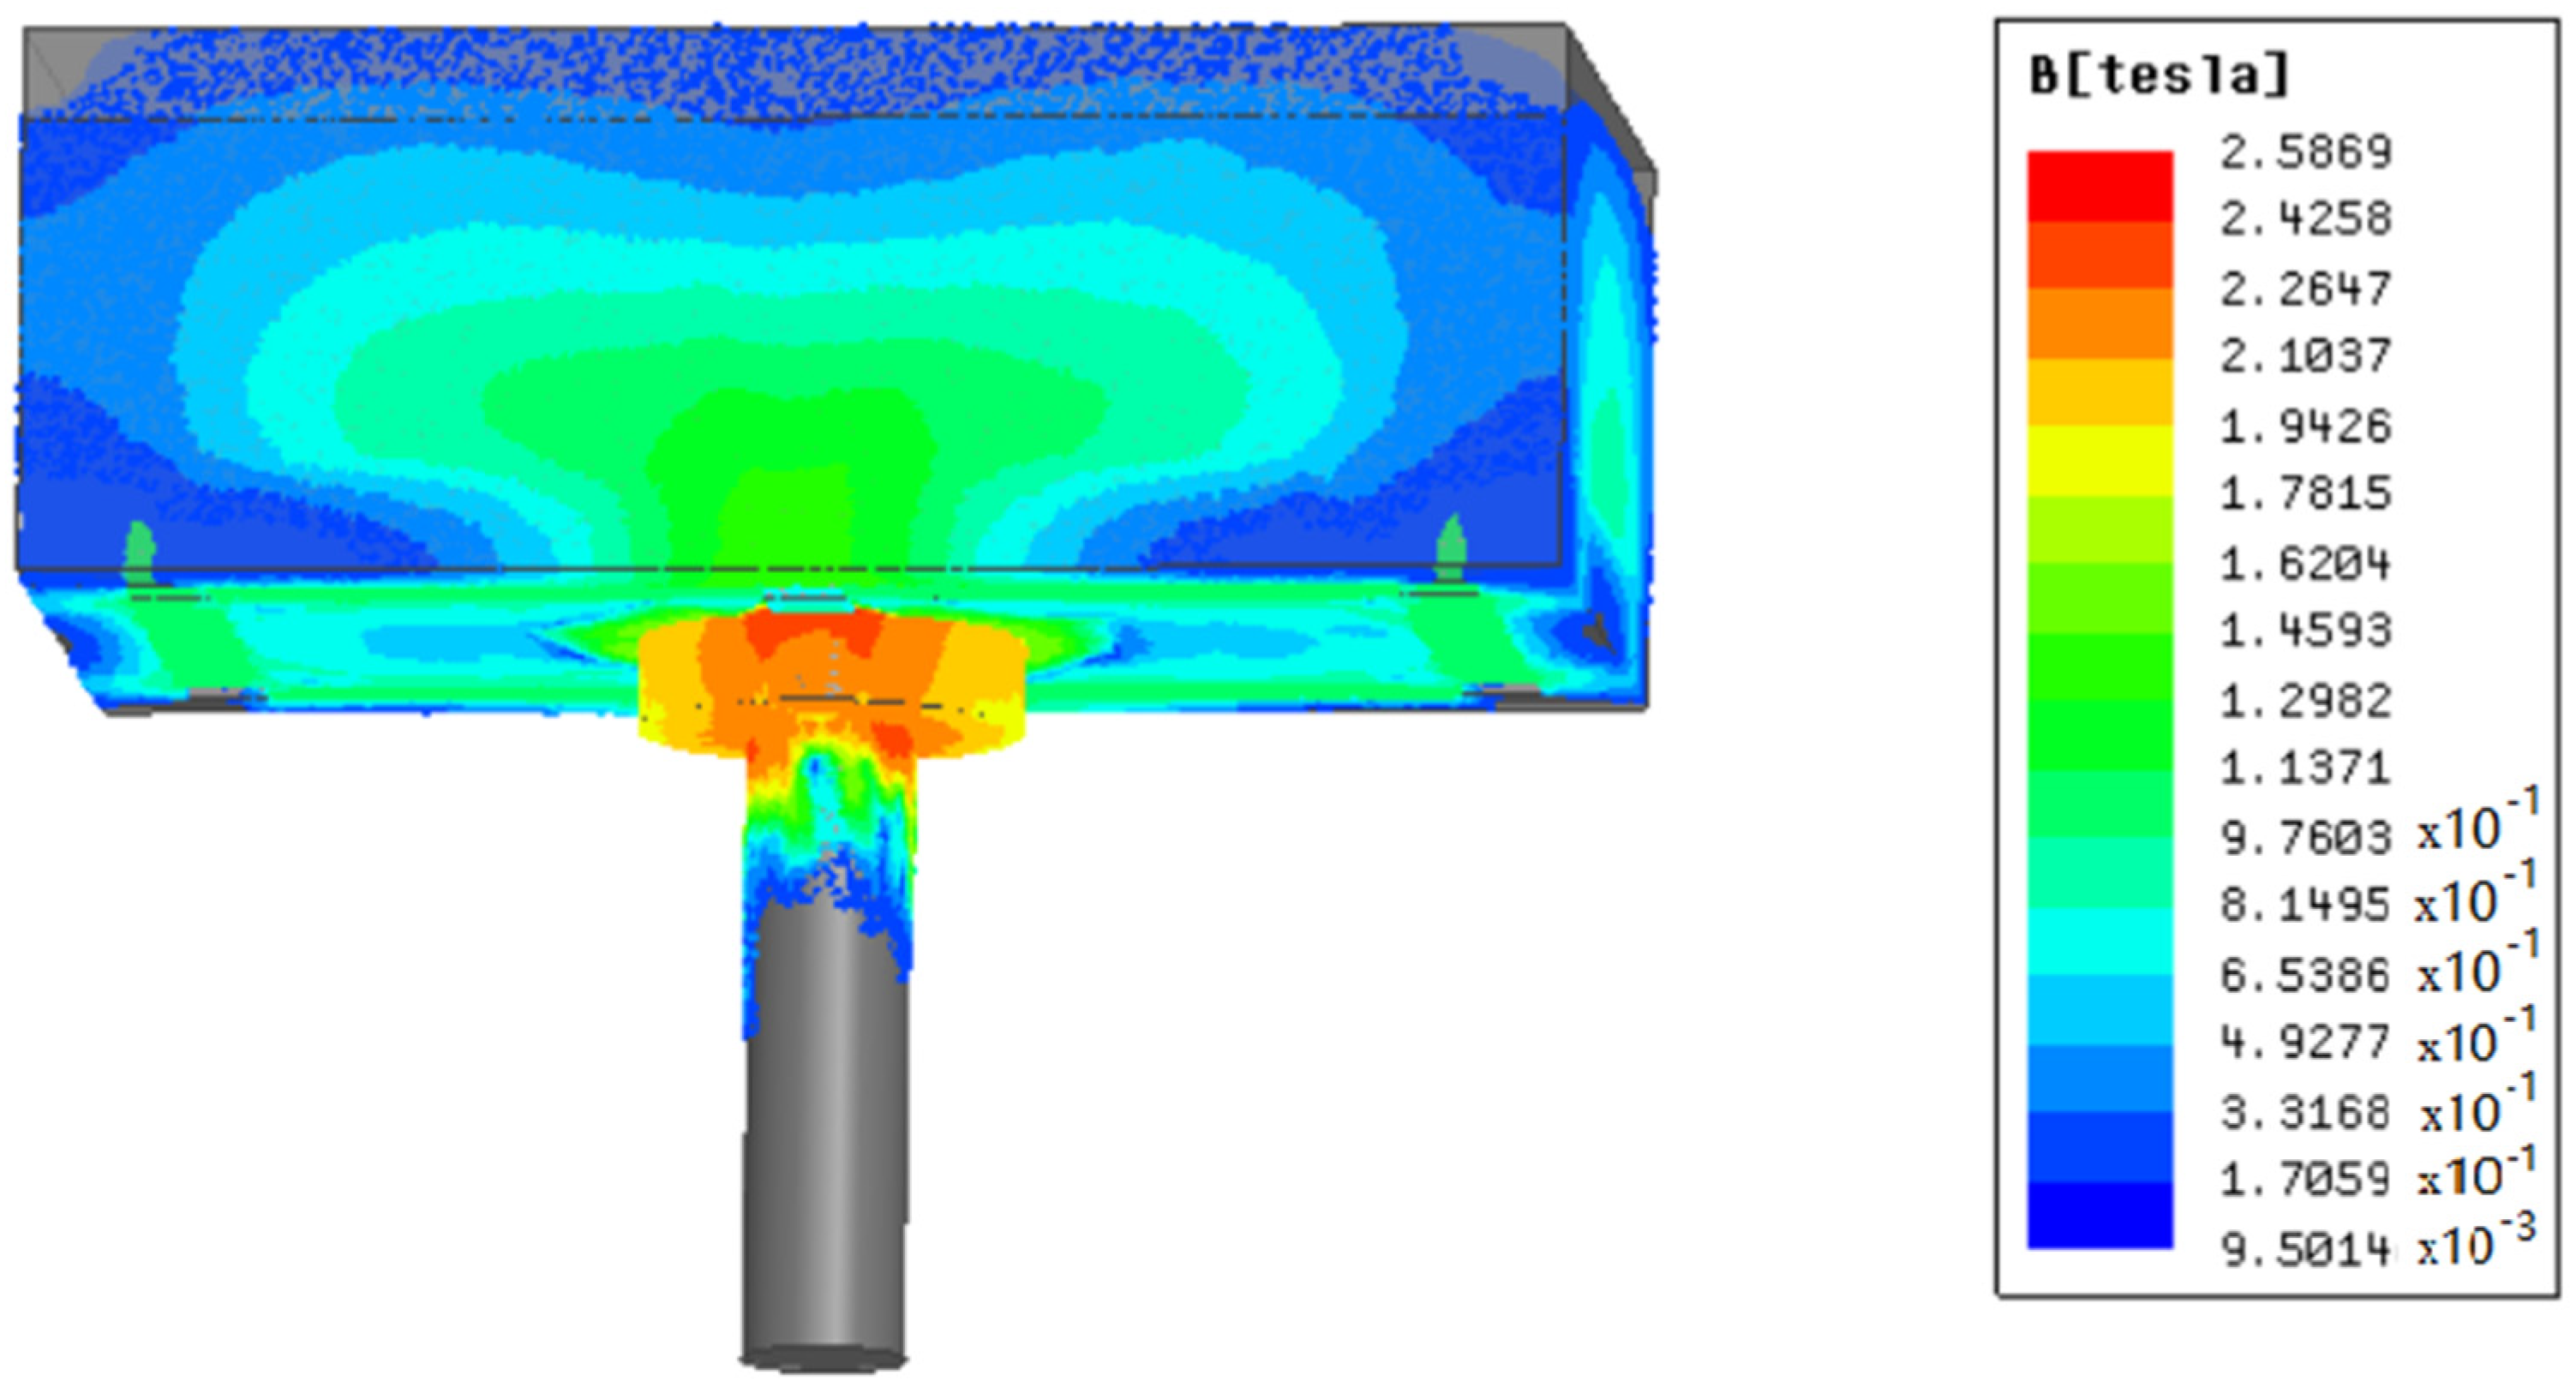
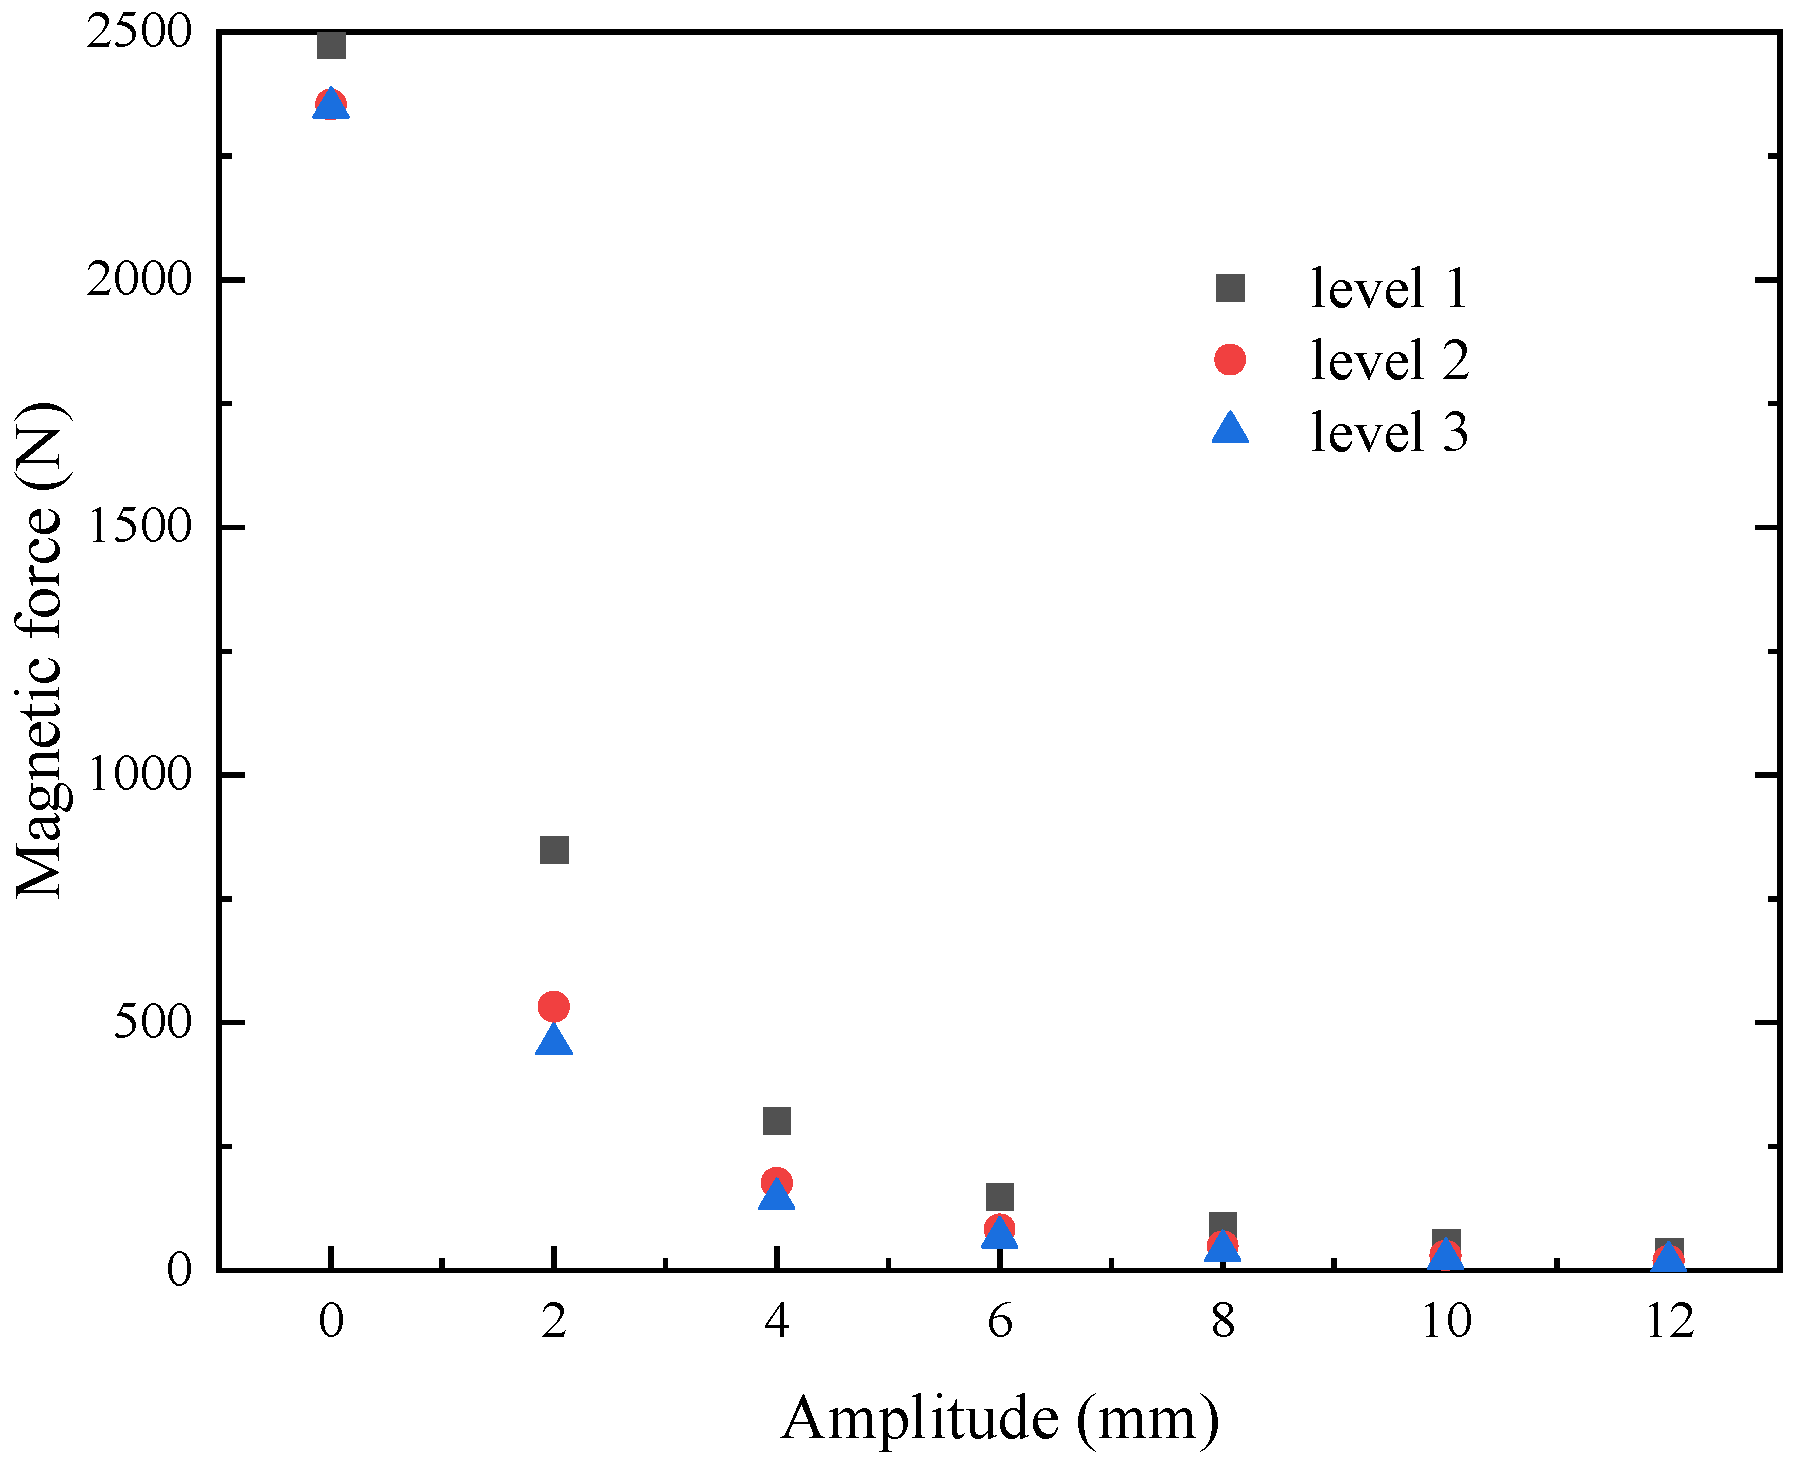
2.3. Design of Reciprocating Device
2.4. Measurement and Data Processing
- (a)
- Drop size
- (b)
- Dispersed phase holdup
- (c)
- Axial mixing
3. Results
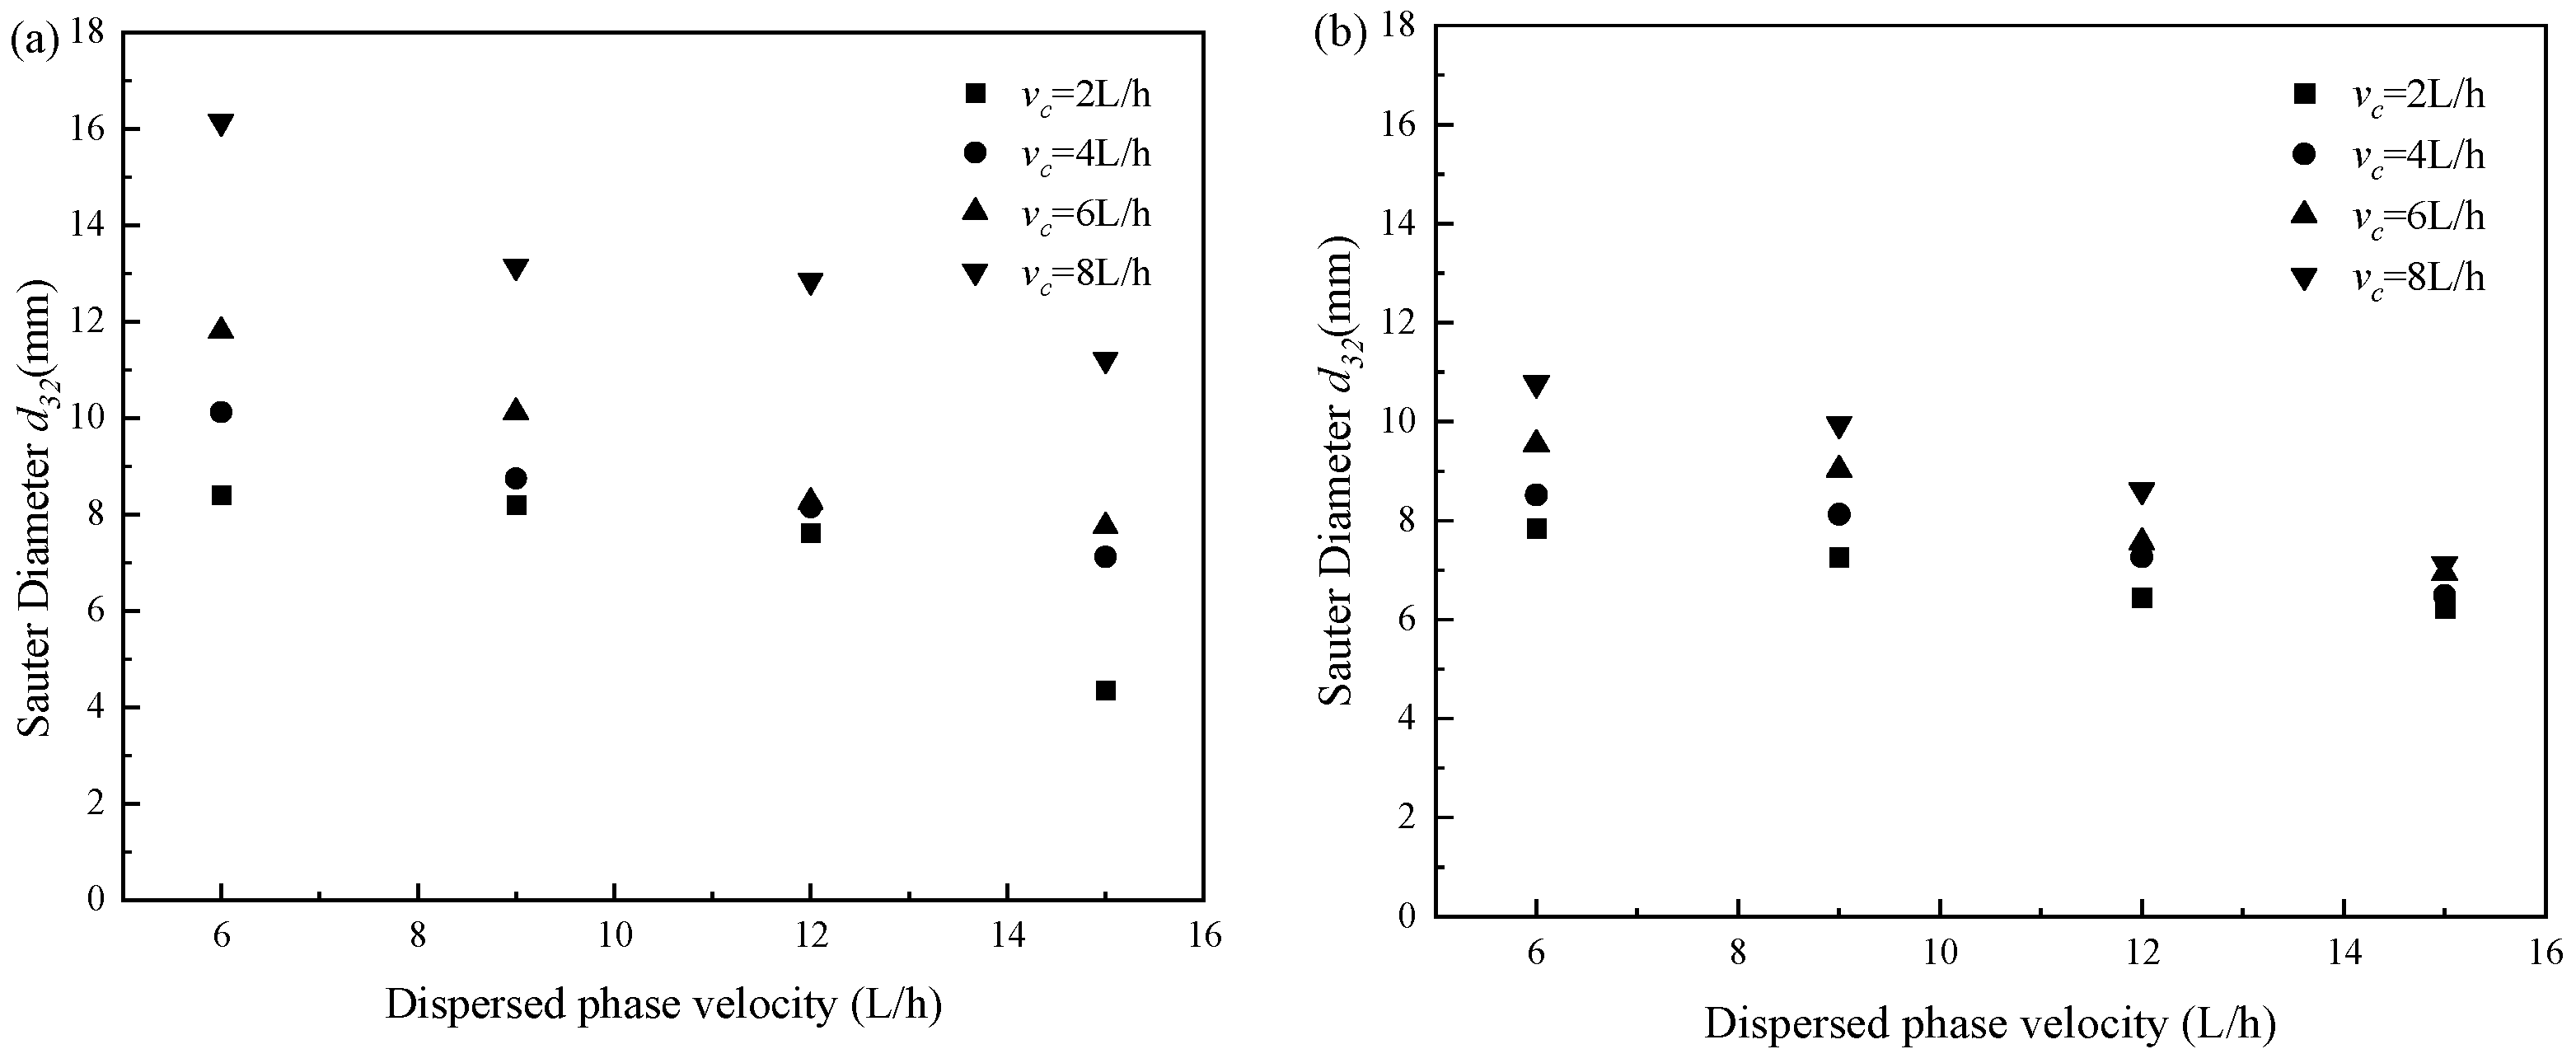
3.1. Drop Size
3.1.1. Effect of Dispersed Flow Velocity
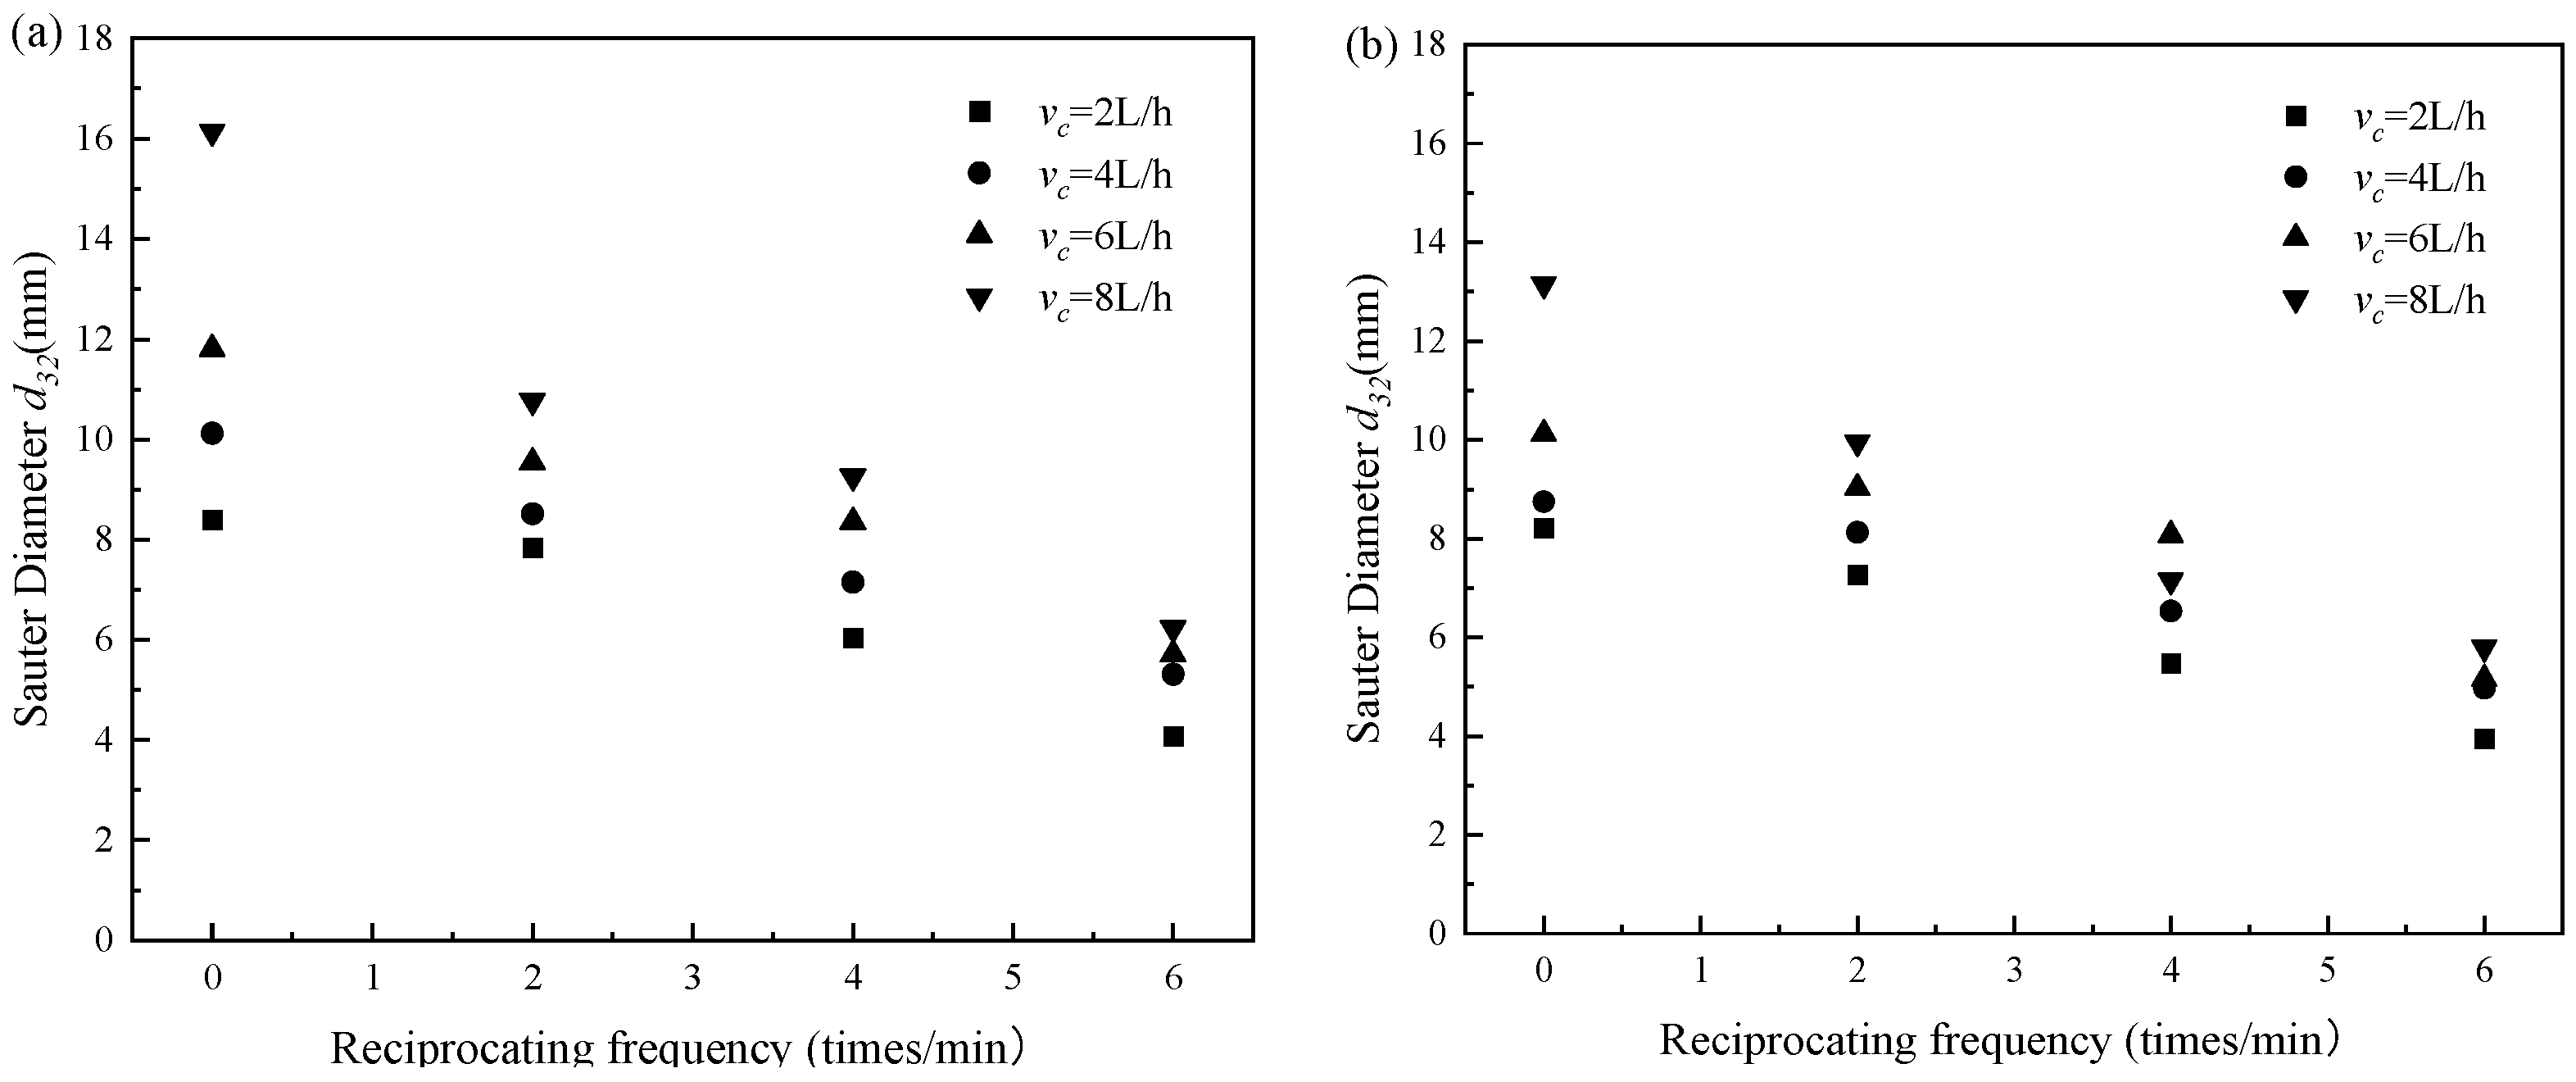
3.1.2. Effect of Reciprocating Frequency
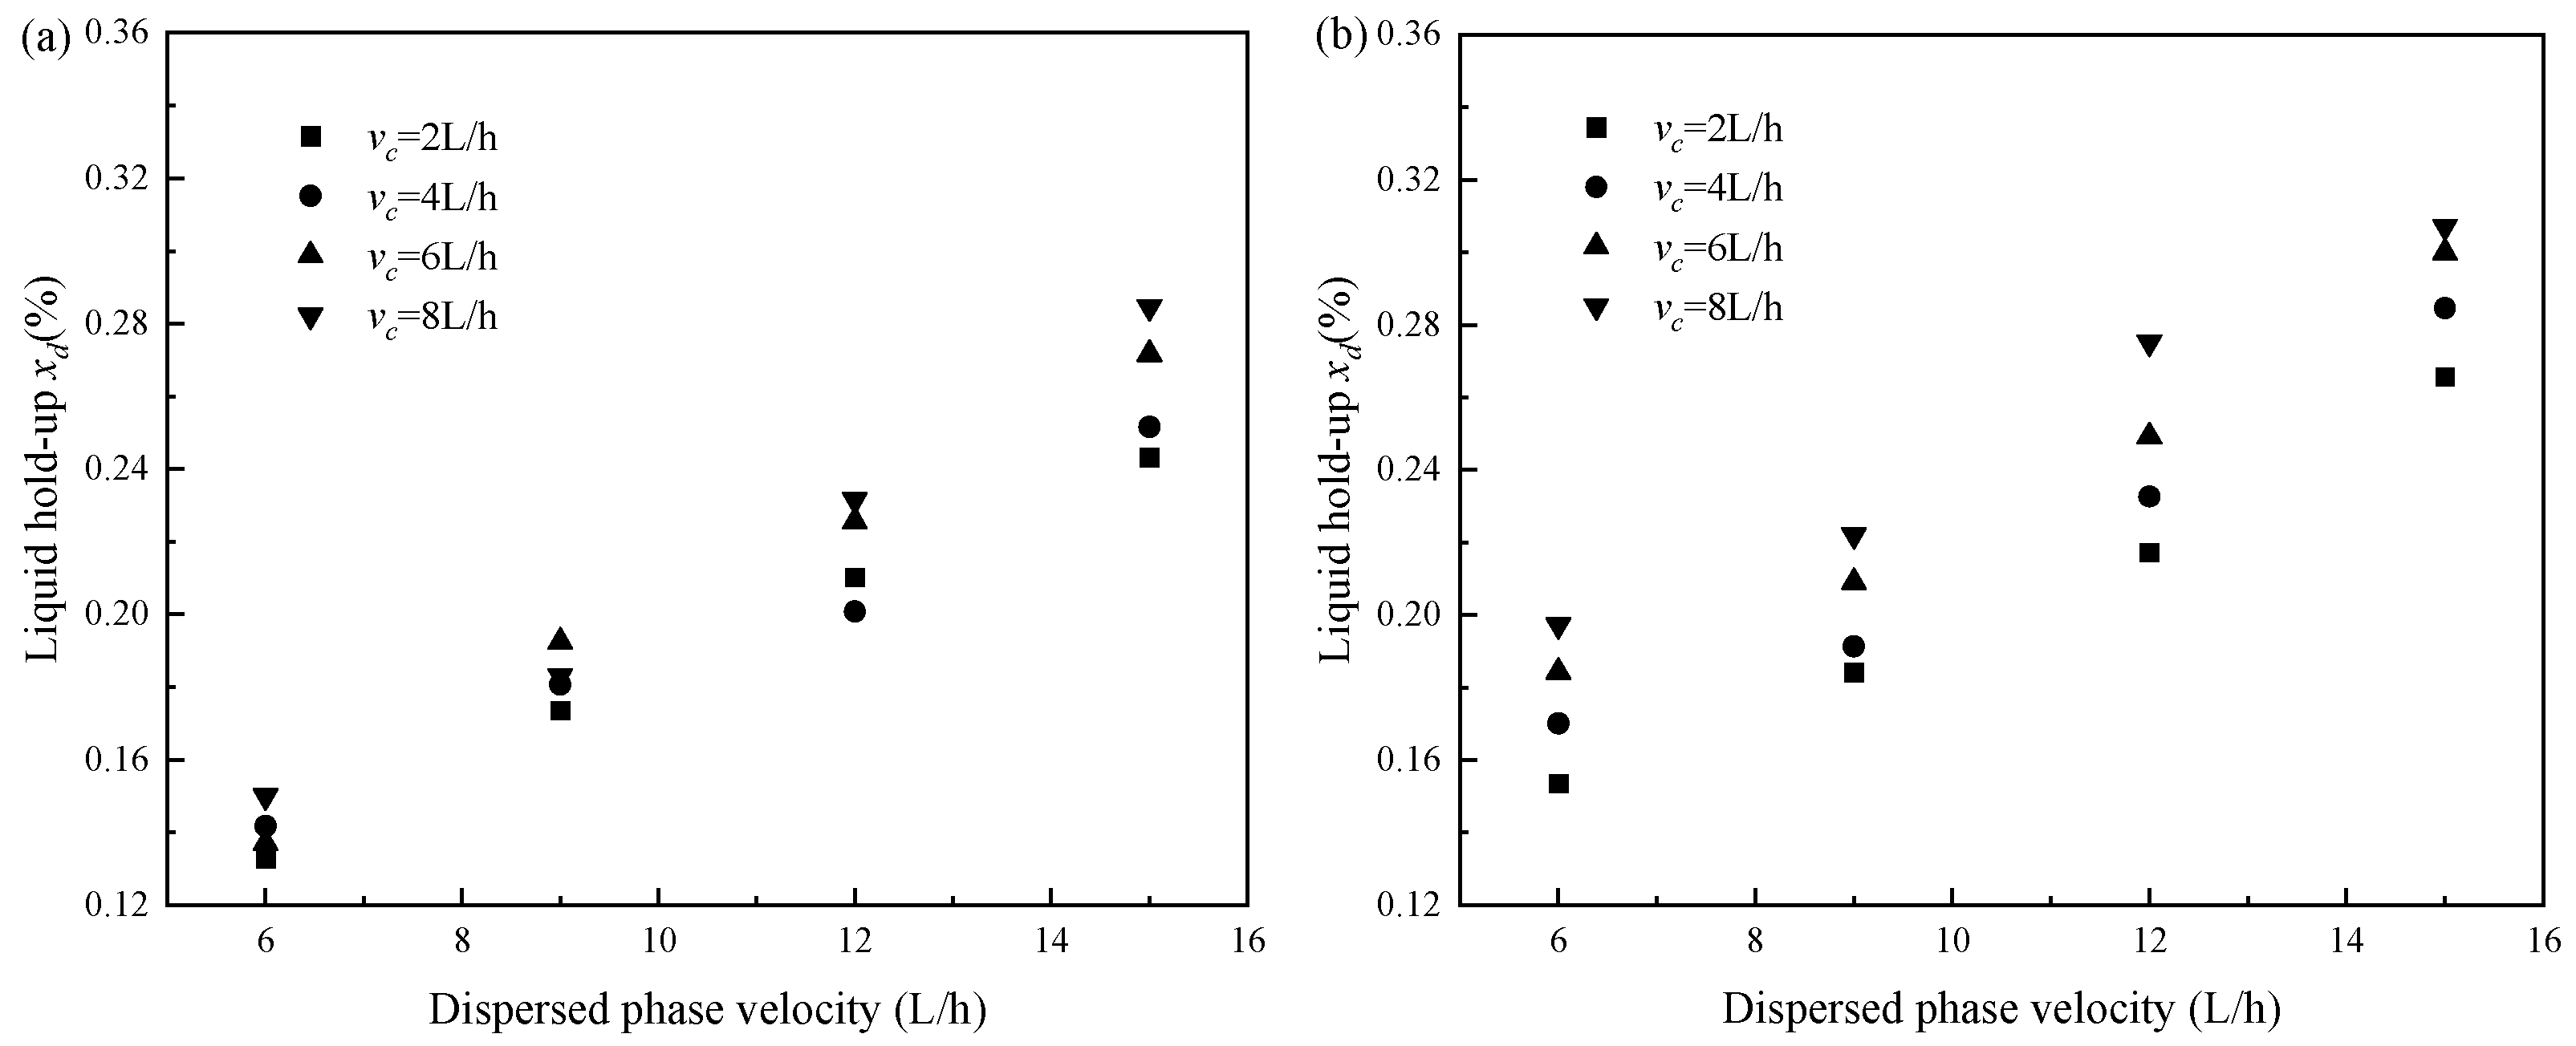
3.2. Dispersed Phase Holdup
3.2.1. Effect of Flow Velocity
3.2.2. Effect of Reciprocating Frequency
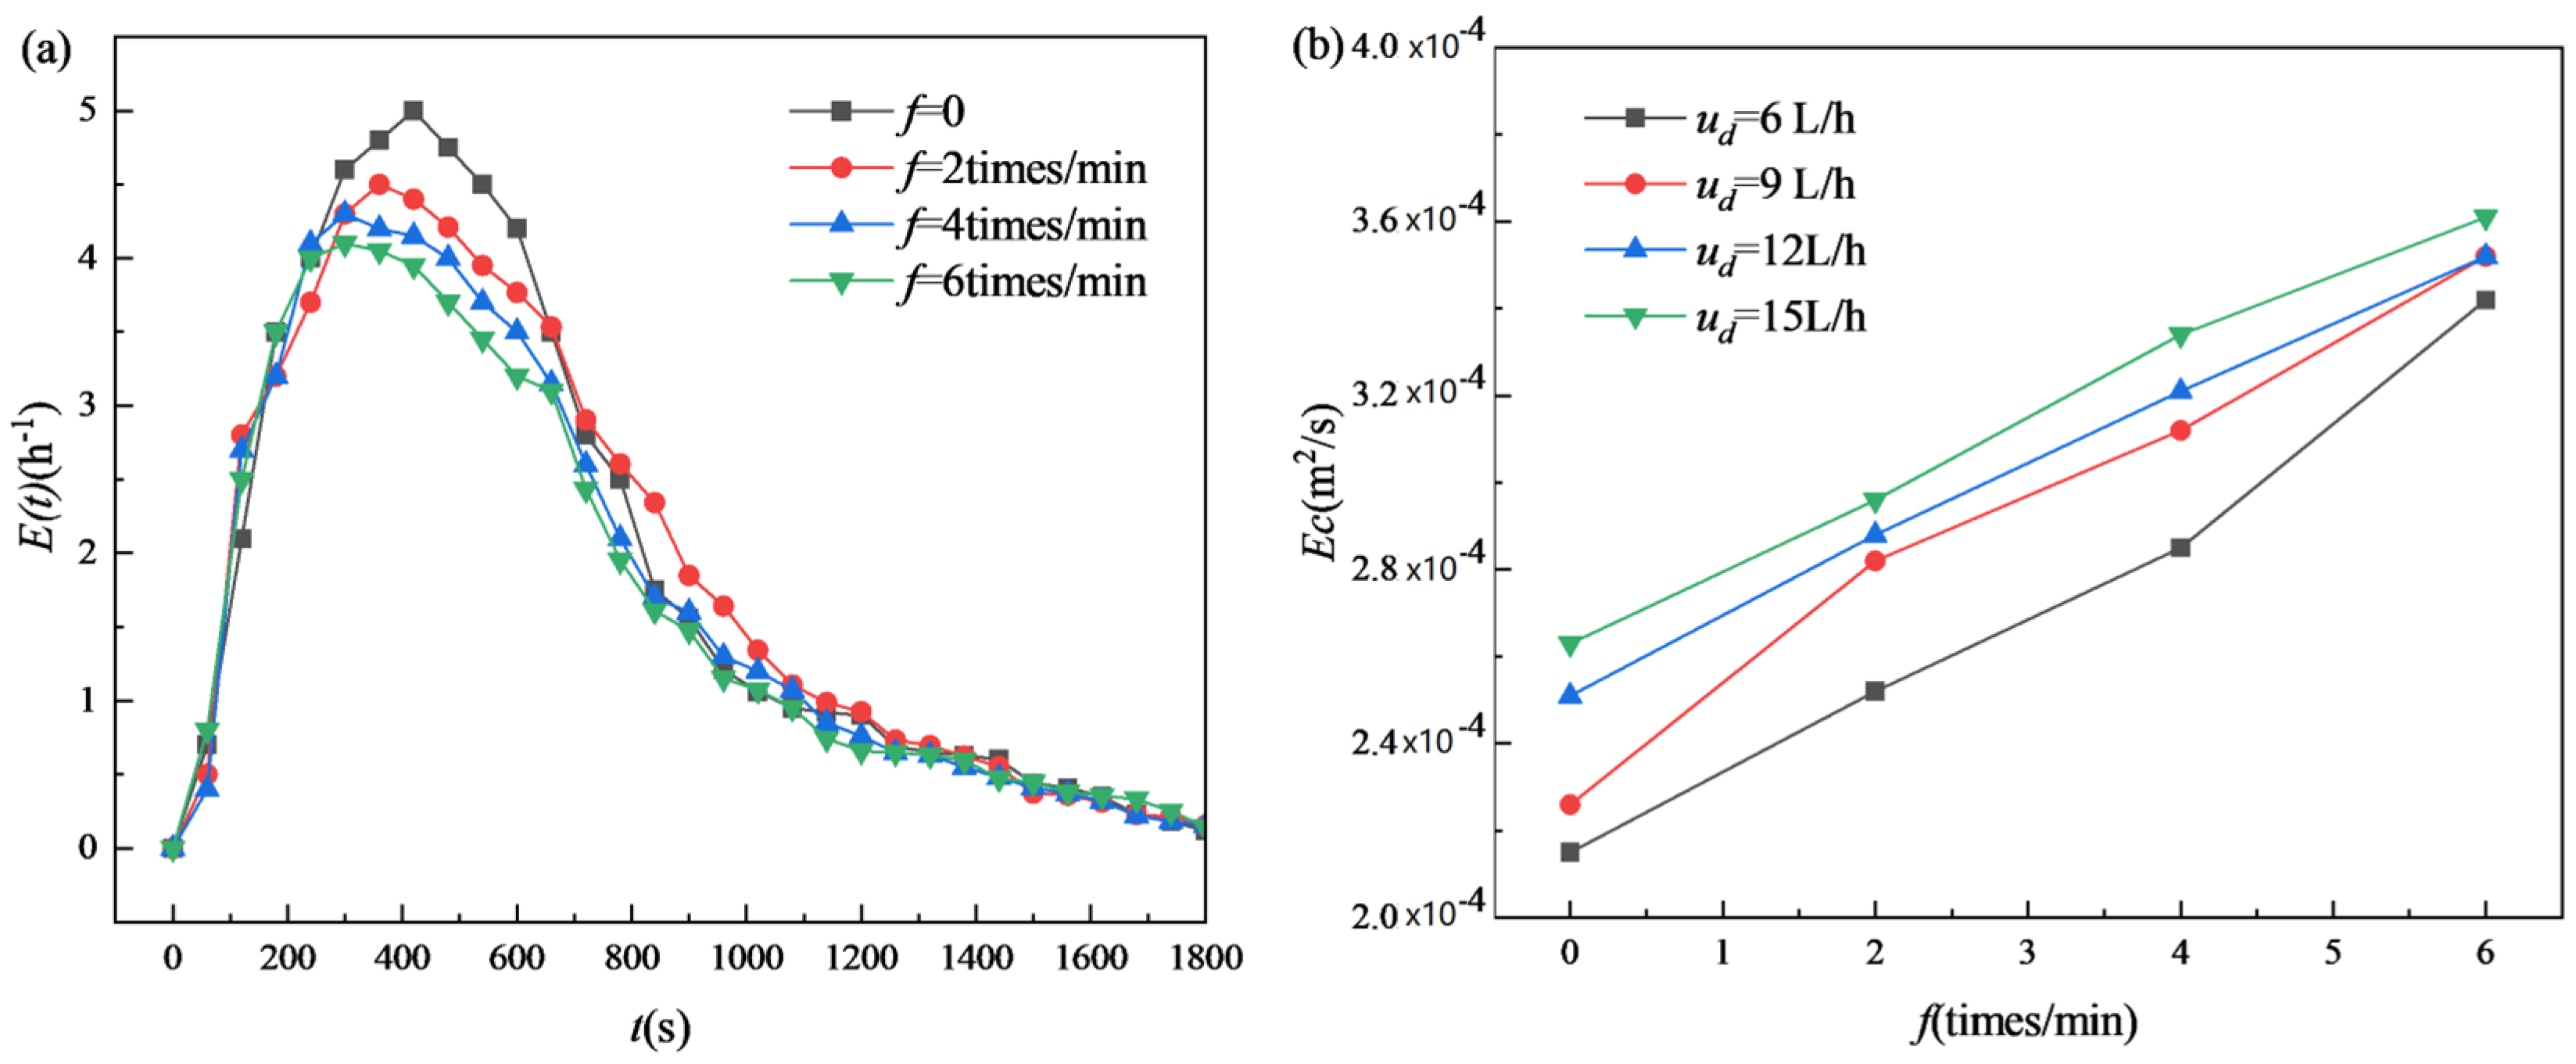
3.3. Axial Mixing
3.3.1. Effect of Reciprocating Frequency
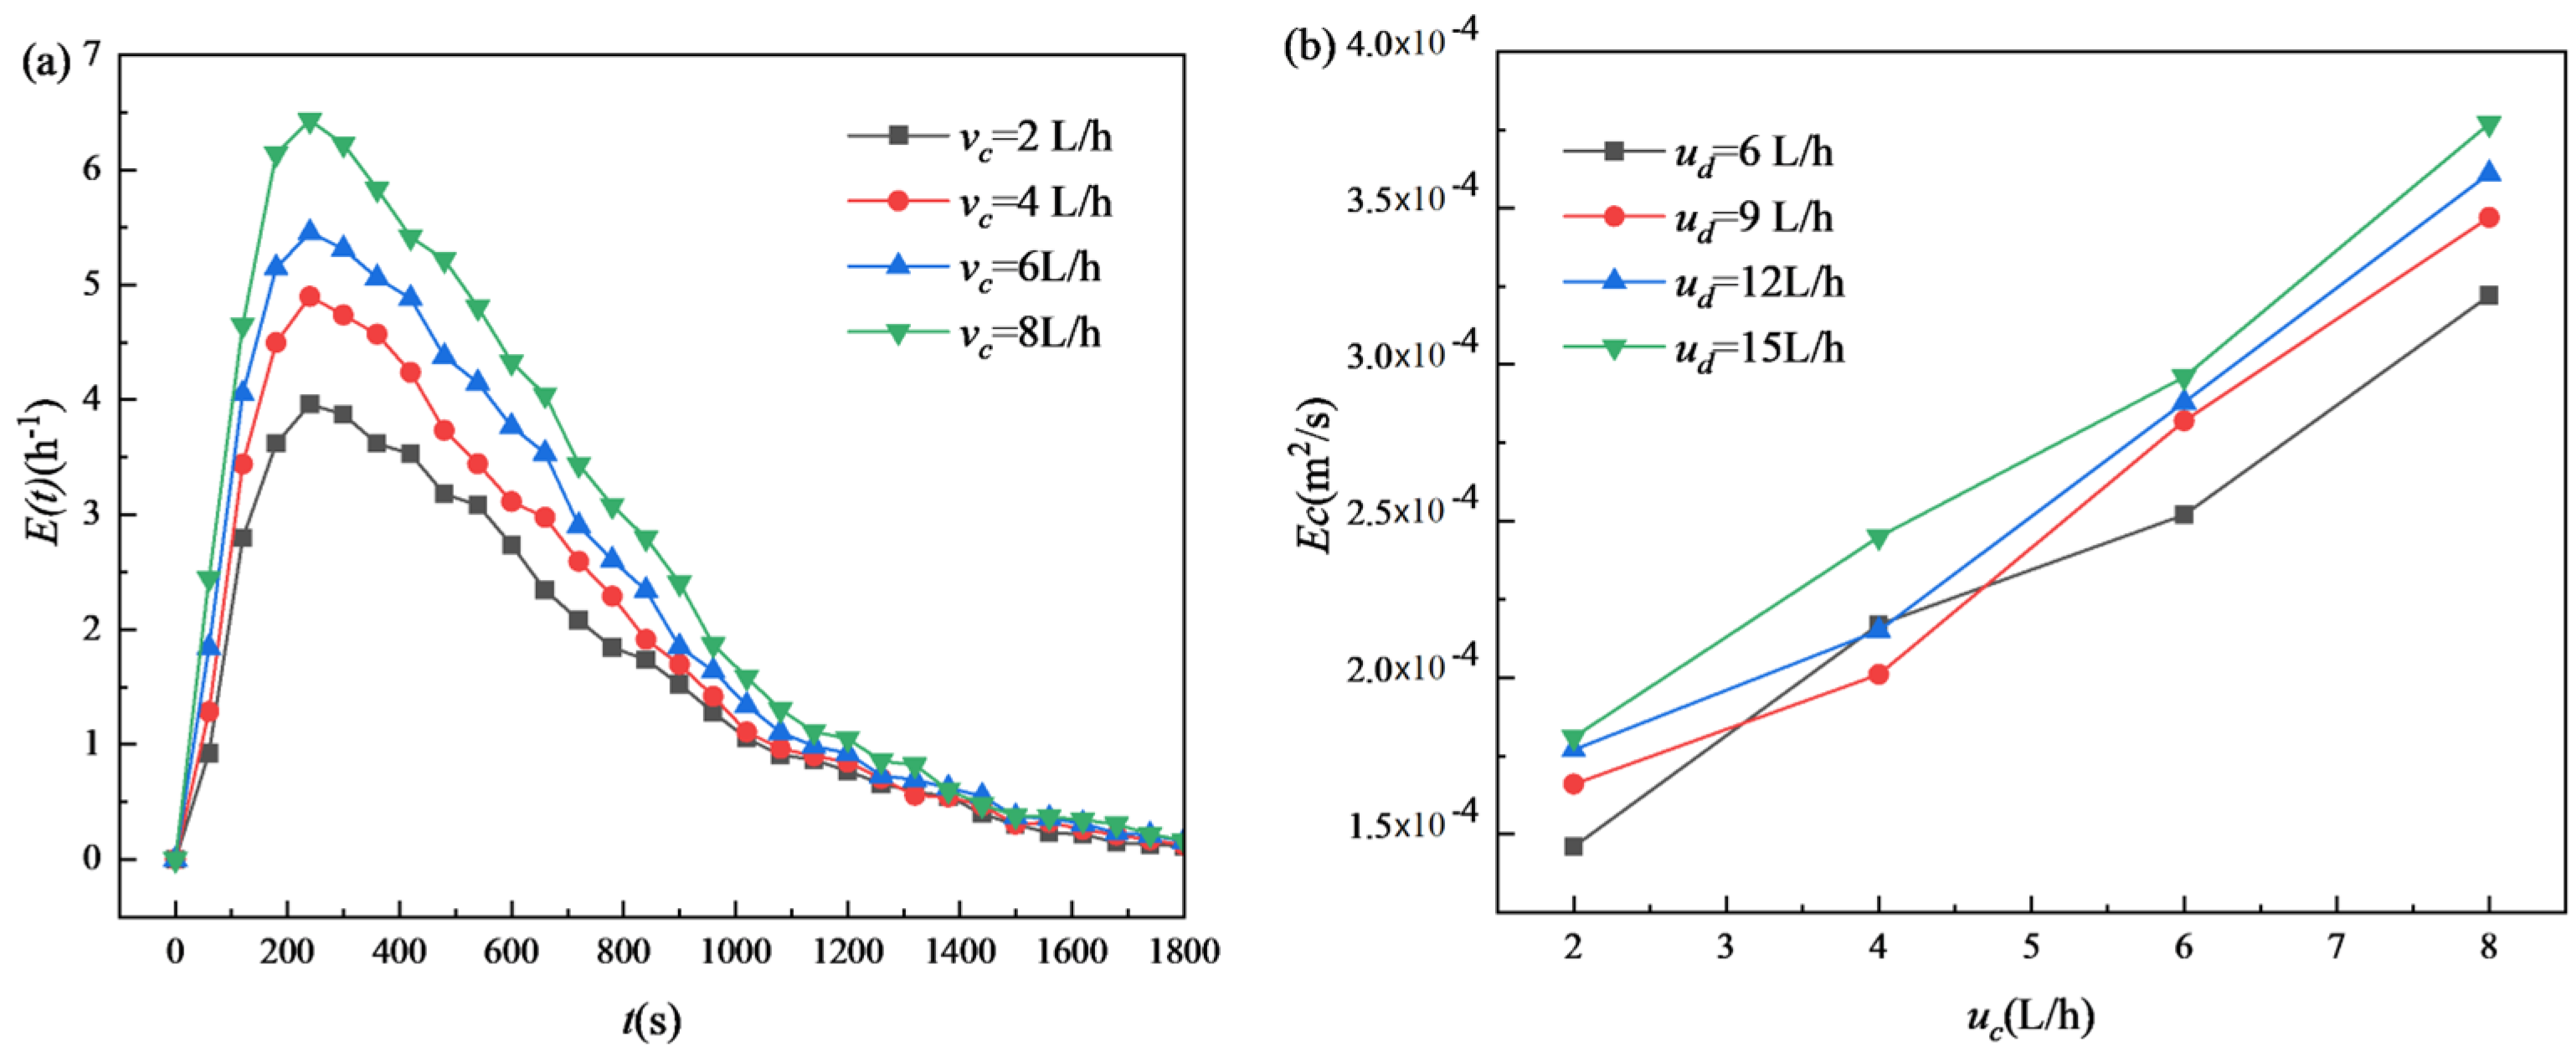
3.3.2. Effect of Continuous Phase
3.3.3. Effect of Dispersed Phase Velocity on Axial Mixing
4. Discussion
5. Conclusions
Author Contributions
Funding
Data Availability Statement
Acknowledgments
Conflicts of Interest
References
- Zhang, J.; Berry, J.D.; Mumford, K.A.; Harvie, D.J.; Fei, W.; Stevens, G.W.; Wang, Y. Single drop breakage in a reciprocating plate column. Chem. Eng. J. 2021, 415, 129049. [Google Scholar] [CrossRef]
- Stella, A.; Mensforth, K.H.; Bowser, T. Mass Transfer Performance in Karr Reciprocating Plate Extraction Columns. Ind. Eng. Chem. Res. 2008, 47, 3996–4007. [Google Scholar] [CrossRef]
- Fei, W. Progresses of study and application on extraction columns. CIESC J. 2013, 64, 44–51. [Google Scholar]
- Stella, A.; Pratt, H.C.; Mensforth, K.H.; Stevens, G.W.; Bowser, T. Backmixing in Karr Reciprocating-Plate Extraction Columns. Ind. Eng. Chem. Res. 2006, 45, 6555–6562. [Google Scholar] [CrossRef]
- Zhang, J.; Wang, Y.; Fei, W. A states-of-the-art review on research progresses and prospects of liquid-liquid extraction columns. CIESC J. 2021, 72, 6016–6029. [Google Scholar]
- Van Dijck, W. Tower with Internal Perforated Plate Suitable for Extracting Liquids by Treatment with other Liquids and for similar Concurrent Processes. U.S. Patent No. 2011186, 13 August 1935. [Google Scholar]
- Karr, A.E. Performance of a Reciprocating Plate Extraction Column. AIChE J. 1959, 5, 446–452. [Google Scholar] [CrossRef]
- Mohanty, S. Modeling of liquid-liquid extraction column: A review. ReV. Chem. Eng. 2000, 16, 199–248. [Google Scholar] [CrossRef]
- Smith, K.H.; Bowser, T.; Stevens, G.W. Performance and scale-up of Karr reciprocating plate Extraction Columns. Ind. Eng. Chem. Res. 2008, 47, 8368–8375. [Google Scholar] [CrossRef]
- Zhang, J.; Li, W.; Mumford, K.A.; Fei, W.; Stevens, G.W.; Wang, Y. Mass transfer study and combined model for a Karr column. Chem. Eng. Sci. 2022, 254, 117581. [Google Scholar] [CrossRef]
- Baird, M.H.I.; Lane, S.J. Drop size and holdup in a reciprocating plate extraction column. Chem. Eng. Sci. 1973, 28, 947–957. [Google Scholar] [CrossRef]
- Parthasarathy, P.; Sriniketan, G.; Srinivas, N.S.; Varma, Y.B.G. Axial mixing of continuous phase in reciprocating plate columns. Chem. Eng. Sci. 1984, 39, 987–995. [Google Scholar] [CrossRef]
- Bensalem, A.; Steiner, L.; Hartland, S. Effect of mass transfer on drop size in a Karr column. Chem. Eng. Process. Process Intensif. 1986, 20, 129–135. [Google Scholar] [CrossRef]
- Zhang, Y.; Li, L. Study on hoisting and handling steel plate by electromagneto chucks. J. Mach. Des. 2002, 19, 3–6. [Google Scholar]
- Ruiz-Calaforra, A.; Brächer, T.; Lauer, V.; Pirro, P.; Heinz, B.; Geilen, M.; Chumak, A.V.; Conca, A.; Leven, B.; Hillebrands, B. The Role of the Non-Magnetic Material in Spin Pumping and Magnetization Dynamics in NiFe and Co Fe B Multilayer Systems. J. Appl. Phys. 2015, 117, 10–281. [Google Scholar] [CrossRef]
- Billoni, O.V.; Urreta, S.E.; Fabietti, L.M.; Bertorello, H.R. Dependence of the Coercivity on the Grain Size in a Fe NdB/a+Fe Nanocrystalline Composite with Enhanced Remanence. J. Magn. Magn. Mater. 1998, 187, 371–380. [Google Scholar] [CrossRef]
- Cullity, B.D.; Graham, C.D. Introduction to Magnetic Materials; John Wiley and Sons Inc.: Hoboken, NJ, USA, 2009; pp. 44–85. [Google Scholar]
- Yuan, X.; Rong, H.; Zhou, X. Design idea of permanent magnet lifting sucker. Hoisting Conveying Mach. 2001, 7, 11–13. [Google Scholar]
- Zhang, H.S.; Qin, S.J.; Cao, L.Q.; Meng, L.Y.; Cheng, X.; Mao, Y. Deep drawing with radial segmental blank holder based on magnetic control. Sci. Sin. Technol. 2021, 51, 388–398. (In Chinese) [Google Scholar] [CrossRef]
- Chang, P.; Bao, X. New type of Ship Mooring Device Based on Electronically Controlled Permanent Magnetic Chuck. Navig. China 2015, 38, 18–21. [Google Scholar]
- Chang, X.; Yang, D.; Sun, K. Design and Optimization of Electropermanent Magnet Suckers in Horizontal Well Tractors. China Mech. Eng. 2019, 30, 1–5. [Google Scholar]
- Zhong, Y.; Liu, Y.; Zhang, S. Method Comparison for Determining the Concentration of Benzoic Acid in the Experiment of Water-Kerosene Extraction. Univ. Chem. 2019, 34, 66–72. [Google Scholar] [CrossRef]
- Wu, Y.; Vovers, J.; Lu, H.T.; Li, W.; Stevens, G.W.; Mumford, K.A. Investigation of the extraction of natural alkaloids in Karr reciprocating plate columns: Fluid dynamic study. Chem. Eng. Sci. 2022, 264, 118090. [Google Scholar] [CrossRef]
- Jackson, C.S.; Skaf, W.D. Implementing a KARR® extraction column in the unit operations lab. Educ. Chem. Eng. 2020, 32, 95–101. [Google Scholar] [CrossRef]


| Name | Symbol | Column |
|---|---|---|
| Column diameter | Dc | 35 mm |
| Effective column height | Hc | 1 m |
| Number of plates | N | 18 |
| Plate thickness | E | 1.5 mm |
| Plate material | - | Stainless steel |
| Perforation diameter | dh | 2 mm |
| Plate spacing | hc | 50 mm |
| Amplitude | A | 10 mm |
| Dispersed phase | d | kerosene |
| Continuous phase | c | deionized water |
| Dispersed phase density | ρd | 775 kg/m3 |
| Continuous phase density | ρc | 1000 kg/m3 |
| Dispersed phase viscosity | μc | 2.21 × 10⁻³ Pa·s |
| Continuous phase viscosity | μd | 8.94 × 10⁻⁴ Pa·s |
| Continuous Phase Velocity, vc (L/h) | Dispersed Phase Velocity, vd (L/h) | Reciprocating Frequency, f (times/min) |
|---|---|---|
| 2 | 6 | 0 |
| 4 | 9 | 2 |
| 6 | 12 | 4 |
| 8 | 15 | 6 |
| Phase | Material | Density (kg/m3) | Viscosity (mPa·s) | Interfacial Tension (mN/m) |
|---|---|---|---|---|
| Continuous phase | Water | 998.20 | 1.06 | 22 |
| Dispersed phase | Kerosene | 810.25 | 2.10 |
| Materials | Properties | ||
|---|---|---|---|
| Relative Permeability | Bulk Conductivity (Siemens/m) | Coercivity (kA/m) | |
| AlNiCo5 | B-H curve | 2.128 × 10⁶ | 52.5 |
| NbFeB | 1.10 | 6.25 × 10⁵ | 928 |
| Pure iron | 4000 | 1.03 × 10⁷ | 0 |
| Carbon steel | 9000 | 2.00 × 10⁶ | 0 |
| Air | 1 | / | / |
| Epoxy resin | 1 | / | / |
| Name | Parameters | Woking Time | Energy Consumption |
|---|---|---|---|
| Geared motor | 180 w | 30 min | 324 kJ |
| EPM chuck | 16 A, 10 A, 4.4 Ω | 30 min | 4.7 kJ |
Disclaimer/Publisher’s Note: The statements, opinions and data contained in all publications are solely those of the individual author(s) and contributor(s) and not of MDPI and/or the editor(s). MDPI and/or the editor(s) disclaim responsibility for any injury to people or property resulting from any ideas, methods, instructions or products referred to in the content. |
© 2024 by the authors. Licensee MDPI, Basel, Switzerland. This article is an open access article distributed under the terms and conditions of the Creative Commons Attribution (CC BY) license (https://creativecommons.org/licenses/by/4.0/).
Share and Cite
Guo, K.; Jiang, J.; Zhang, D.; Meng, L.; Zhang, Y.; Fan, X.; Zhang, H. Hydrodynamic Performance Study of a Reciprocating Plate Column Dirven by Electro-permanent Magnet Technology. Machines 2024, 12, 330. https://doi.org/10.3390/machines12050330
Guo K, Jiang J, Zhang D, Meng L, Zhang Y, Fan X, Zhang H. Hydrodynamic Performance Study of a Reciprocating Plate Column Dirven by Electro-permanent Magnet Technology. Machines. 2024; 12(5):330. https://doi.org/10.3390/machines12050330
Chicago/Turabian StyleGuo, Kai, Jianxu Jiang, Deqiang Zhang, Linyuan Meng, Yiran Zhang, Xiantao Fan, and Hongsheng Zhang. 2024. "Hydrodynamic Performance Study of a Reciprocating Plate Column Dirven by Electro-permanent Magnet Technology" Machines 12, no. 5: 330. https://doi.org/10.3390/machines12050330
APA StyleGuo, K., Jiang, J., Zhang, D., Meng, L., Zhang, Y., Fan, X., & Zhang, H. (2024). Hydrodynamic Performance Study of a Reciprocating Plate Column Dirven by Electro-permanent Magnet Technology. Machines, 12(5), 330. https://doi.org/10.3390/machines12050330