Article

An Analysis of the WPT Function for Pattern Optimization to Detect Defects in Bearings

by
Marta Zamorano
1,*,
María Jesús Gómez
2 and
Cristina Castejon
2
1
Higher Polytechnic School, Universidad Francisco de Vitoria, Crta. Pozuelo-Majadahonda Km 1800, Pozuelo de Alarcón, 28223 Madrid, Spain
2
Mechanical Engineering Department, Universidad Carlos III de Madrid, Avda. Universidad 30, 28911 Madrid, Spain
*
Author to whom correspondence should be addressed.
Machines 2024, 12(3), 207; https://doi.org/10.3390/machines12030207
Submission received: 5 February 2024 / Revised: 11 March 2024 / Accepted: 18 March 2024 / Published: 20 March 2024
(This article belongs to the Special Issue Condition Monitoring and Fault Diagnosis for Rotating Machinery)

Abstract

:
New trends in maintenance techniques are oriented to digitization and prognosis. The new electronic devices based on IoT (Internet of Things) technology among others that support the industry 4.0 paradigm let enhance the traditional condition monitoring techniques to better understand and predict the state of a machine in service. Related to maintenance applications, one of the important steps in condition monitoring tasks for fault diagnosis is the selection of the optimal pattern to provide accurate results (avoiding fault positives/negatives) with adequate computation time. When implementing this, the selection of optimal parameters and thresholds for setting alarms are important to detect problems in the machine before the failure occurs. Vibratory signals have been proved to be a good variable to determine their mechanical behavior. Nevertheless, parameters obtained from time domain measurements are not computationally efficient nor good patterns to compare different machine conditions. In this sense, tools that represent the frequency domain or time–frequency domain have been useful to detect defects in rotating elements such as bearings. In this work, defects in ball bearings are studied using wavelet packet transform. For this, a methodology will be developed for the optimal selection of the mother wavelet, incorporating intelligent classification systems, and using a medium Gaussian support vector machine model. In this way, it will be verified that the correct selection of this function influences both the results and the ease and reliability of detection. The results using the selected mother wavelet will be compared to those using Daubechies 6, since it is the mother wavelet that has been used in previous works and which was selected based on experience. For it, vibratory signals are obtained from a testbench with different bearing conditions: healthy bearings and defective bearings (inner and outer race).

1. Introduction

Nowadays, the performance of a good predictive maintenance procedure is one of the most important tasks in the industry, since it can avoid accidents and can maximize the life of components before they break, which significantly reduces costs and time, and maximizes production. The new challenges in maintenance are oriented to predictive maintenance, particularly in condition monitoring (CM), prognosis, and the digitalization of the full process of maintenance tasks (from the element to executive managers).
In order to implement a CM system to detect failures in mechanical elements, it is important to select and study a set of behavior patterns of the most common defects that may exist in a machine/element, since that pattern can be monitored during the machine’s operation, so the machine’s status is always known without us having to stop and disassemble it. Therefore, this was studied in some works, such as [1,2]. In the literature, there are some interesting works developed to take measures and to process them to extract representative patterns to evaluate the condition of rotatory elements. To carry this out, it is common to analyze the vibrations that are produced during the operation of the components, since it is possible to detect a wide variety of defects [3]. It is really important to detect defects before failure occurs, since the breakage of these components could cause catastrophic and irreversible failures [4]. In a machine, the first elements that usually fail are bearings; thus, their failure is critical. Rolling bearings are mechanical components commonly installed in shaft and axle supports. Their primary function is to transfer loads from moving to stationary machine parts, facilitating relative motion of rotating components. The most common cause of rolling bearing failure is wear. Operational conditions, aggressive environments, and temperature are some of the factors influencing wear [5,6,7]. This is why early detection of defects in these components is of vital importance.
To study the behavior of these components, the analysis of the envelope signal facilitates this study since it allows to obtain the fault frequencies in a clearer way and because low frequency modulating events are amplified and represented by more energy than in the original signal spectrum, which improves the interpretation of results. It is very common in the industry to apply methods based on the Hilbert transform (HT) to vibratory signals [5,6,7], since it is a way to estimate the amplitude modulation of that signal. Power spectral density (PSD) is also used [8]. Other studies apply variational mode decomposition (VMD) [9,10], and works like [11] combine the HT and wavelet transform (WT). Work [12] proposes a method based on WT and convolutional neural networks. Moreover, some studies use continuous wavelet transform (CWT) or discrete wavelet transform (DWT) [13], although there are several techniques to diagnose these defects [14]. Recent studies propose new methods to detect them [15]. Nevertheless, many works agree that the fault frequencies of a ball bearing are known and can be obtained using mathematical formulas that depend on the characteristics of the bearing [16,17,18] and the rotation frequency. When a ball bearing has a defect, a peak of high amplitude appears in the spectrum at the fault frequency.
Regardless of the processing technique and the type of signal used, it is common to try to analyze, from the frequency domain, the fault frequencies of bearing failure [16]. However, these frequencies do not appear clearly differentiated when real systems are monitored. This issue can be due to the frequency resolution, which divides the amplitude of the fault frequency into the closest frequencies. To avoid this, an analysis using the wavelet packet transform (WPT) is proposed in this work to know the energy of a range of frequency that includes the fault frequency. The energy of this packet should increase when a bearing has a defect and has been proved to be a good pattern to detect changes in the dynamical behavior of the system [19,20,21]. To sum up, tools that work in the frequency domain have a great disadvantage compared to other tools that work in the time and frequency domain. The first reason is that the time information is lost. Another reason is that the fault frequency may not exactly match with the represented frequencies due to the frequency resolution or noise.
However, although many works have traditionally used WPT and showed good results for diagnosing defects in bearings, even incorporating intelligent classification systems [22], the real challenge in applying this technique is to use a suitable mother wavelet for each case. Many works choose the best mother wavelet based on the experience of achieving good results with it. For example, similar works [19,20,21] used the Daubechies 6 mother wavelet for this reason. Other works focus on comparing several mother wavelets and choosing the one that offers the best results. For example, work [23] compared the results using Daubechies 1 to 4, obtaining similar results. Works like [24] proposed to select the mother wavelet based on finding a compromise between good results and computational cost. Work [25] determined that the Daubechies 44 function is the most similar to a measured vibration signal. Other works like [26] used Daubechies 2 and 10, and work [27] used Daubechies 2. In general, the Daubechies family seems to be the most common to perform a WPT analysis for bearing fault detection, but there is no fact that guarantees it, or any consensus on which is better for each case. Moreover, it was shown in a previous work [28] that the impulse generated in the signal due to the existence of a defect is visually very similar to the analyzed mother wavelet functions (Figure 1), and this is one of the reasons why many studies use these tools [29].
Therefore, in this work, a study of the optimal mother wavelet is carried out. To carry this out, a methodology that considers the success rate results of an intelligent classification system (using medium Gaussian SVM model), the computational cost, and the variation of results between healthy and defective conditions is proposed. The SVM proved to work well for bearing fault detection [30,31,32]. The results obtained using the selected mother wavelet are compared to the results using the Daubechies 6, which has been traditionally used in similar works [19,20,21]. Moreover, the decomposition level will also be analyzed.
This work aims to demonstrate that the correct selection of the mother wavelet influences both the results and the ease and reliability of detection. For which, the proposed methodology can yield the optimal function to detect defects in a clearer way and guarantees that the maintenance task is done in the most satisfactory way possible.

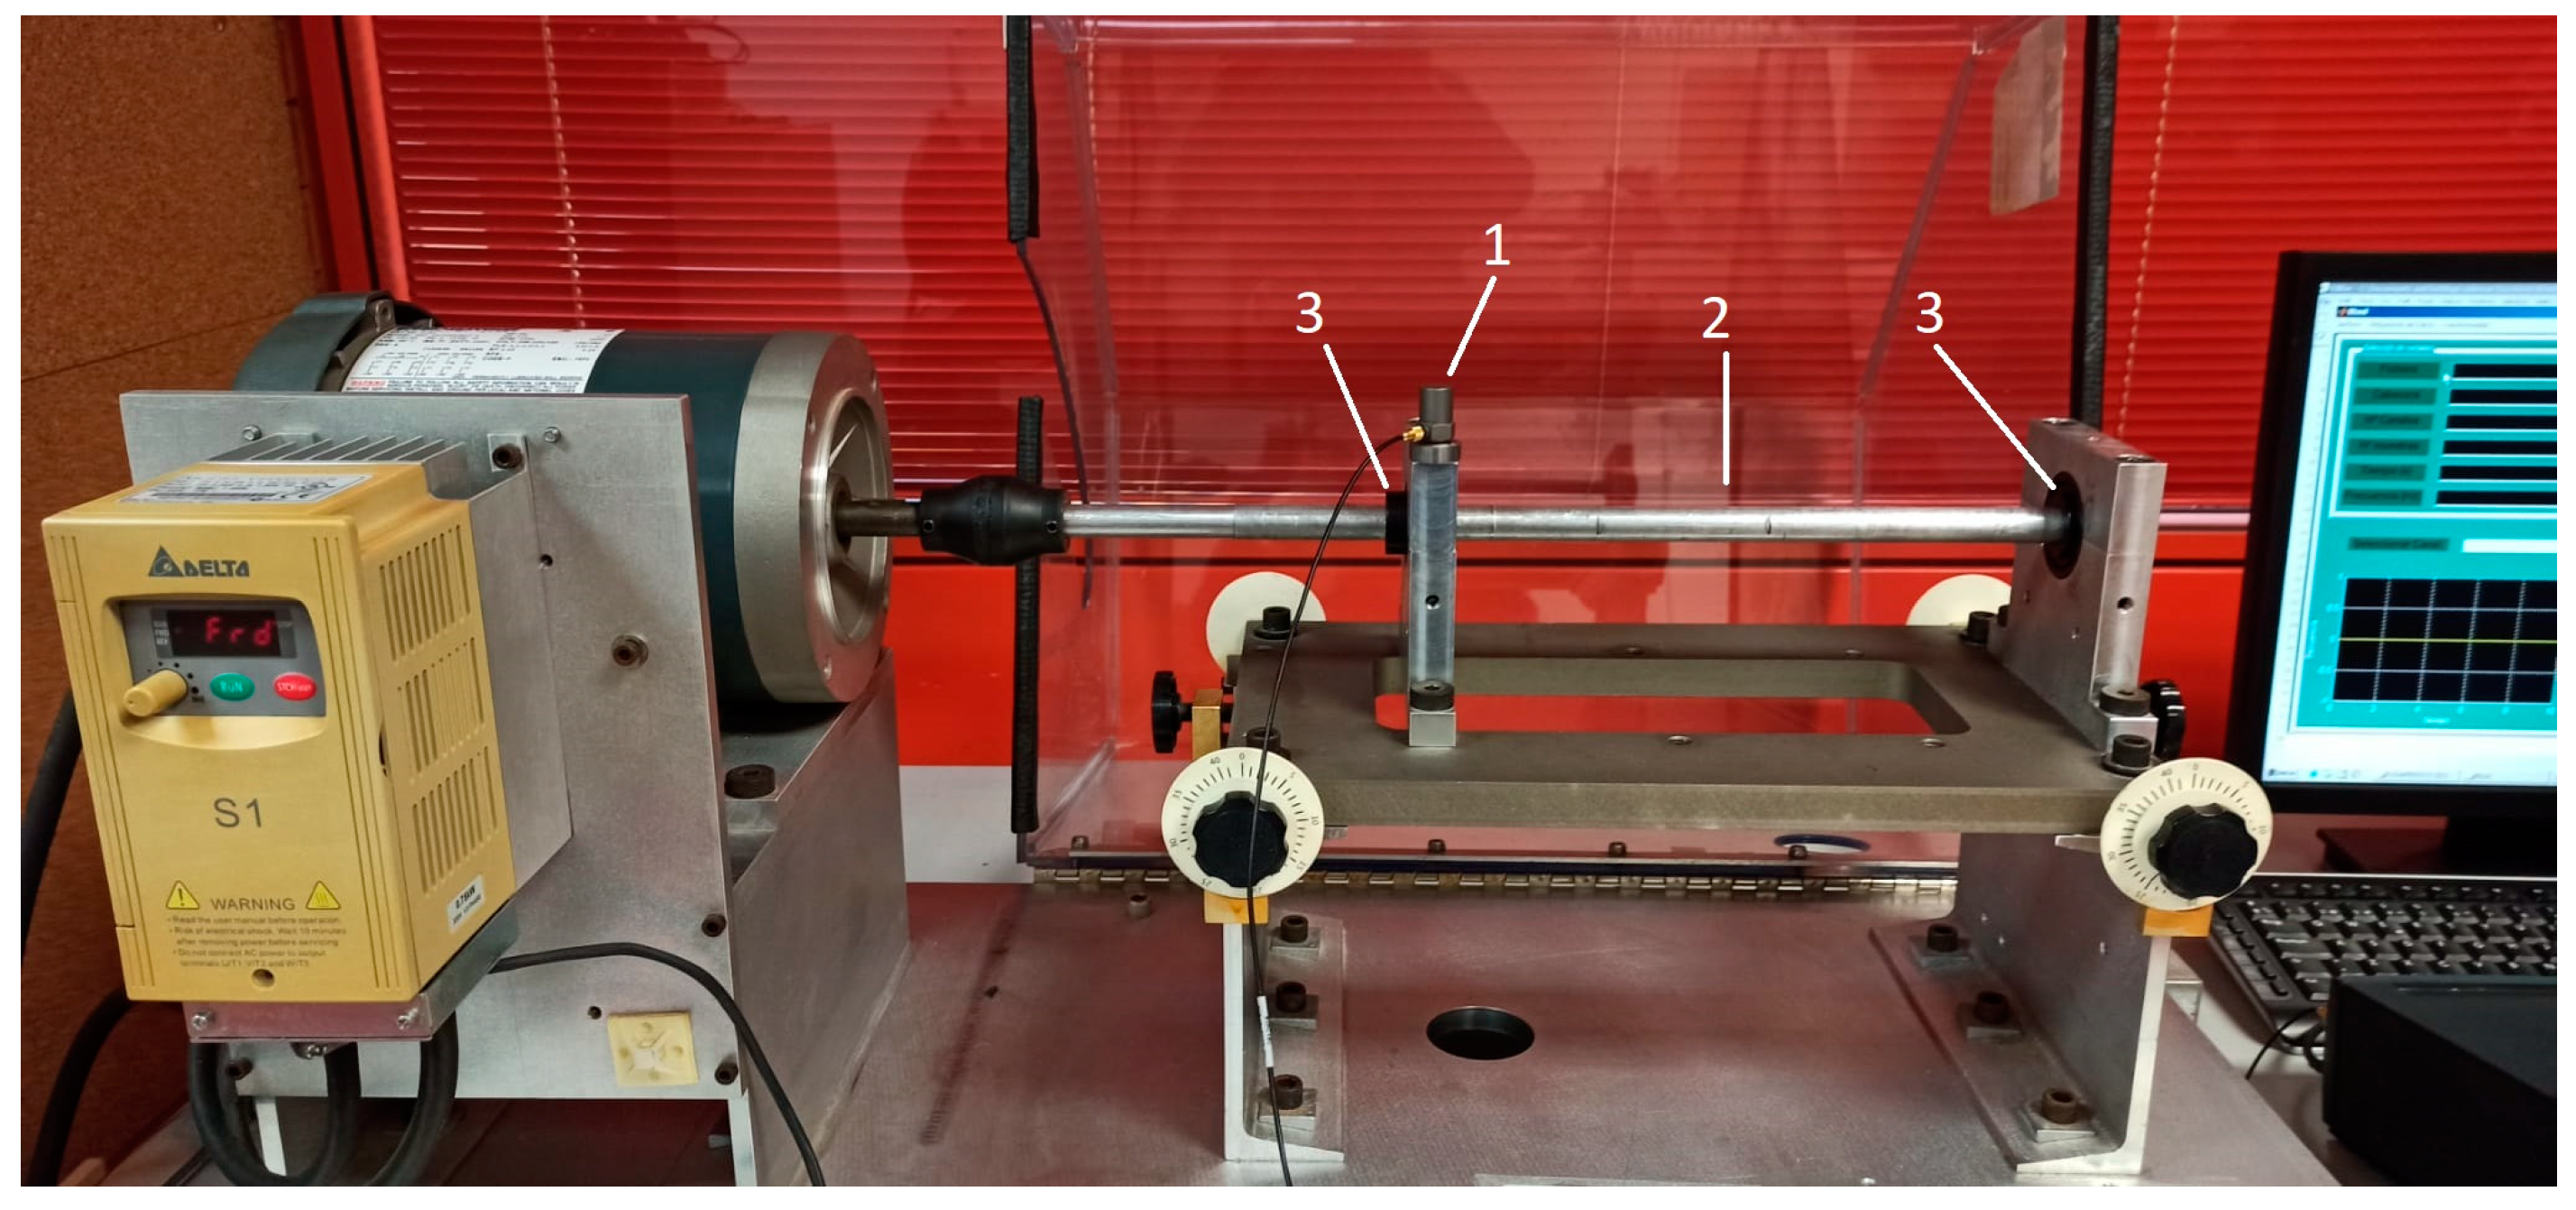
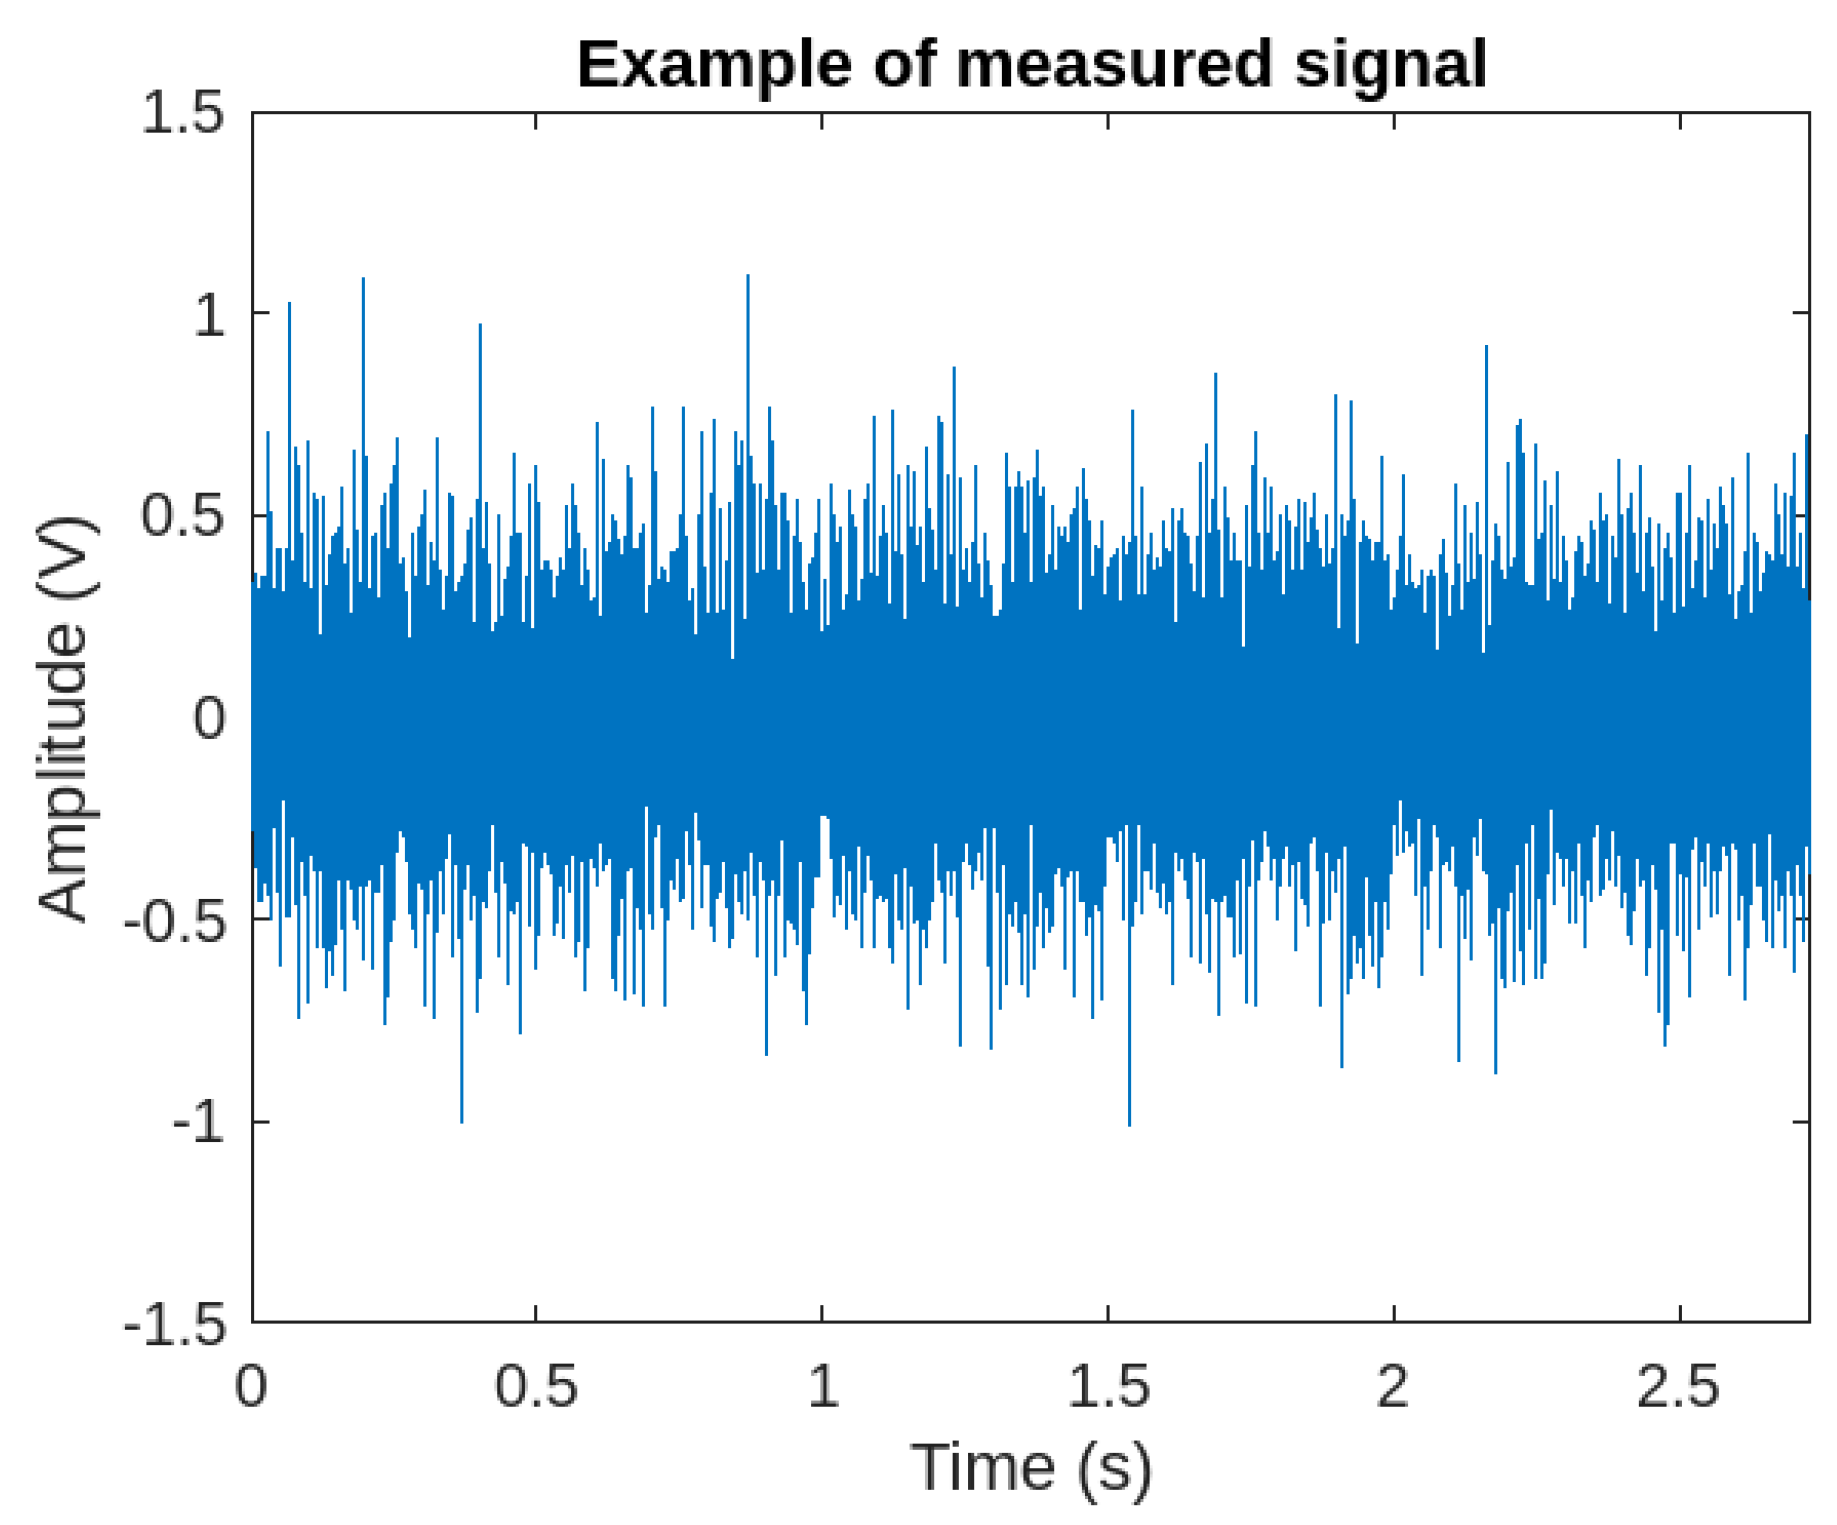
2. Experimental Measurements

A set of tests was performed on a machinery fault simulator (obtained from SpectraQuest Inc., Richmond, VA, USA) in which different fault types can be tested (Figure 2). The machine has two ball bearings (number 3 in Figure 2) and a shaft (number 2 in Figure 2). The energy is provided by a 750 W motor. Vibration signals are obtained thanks to an acquisition chain formed by an accelerometer (Brüel & Kjaer 4383) (number 1 in Figure 2), a Nexus signal conditioner (Brüel & Kjaer 2693), a data acquisition card (Keithley KUSB-3100), and a computer.
The tests carried out in the laboratory include different configurations (a bearing with inner-race defect, a bearing with outer-race defect, and a healthy bearing). Each type of defect was tested at 60 Hz. The type of the bearing was ER10K (Rexnord), and the characteristics are shown in Table 1. In this way, first, two healthy bearings were tested to have a healthy reference condition and in order to compare it with the defective condition. Afterwards, the bearing closest to the motor was replaced with a defective bearing in the inner race and the test was repeated. Finally, the same procedure was performed but for a defective bearing on the outer race. Regarding data acquisition, a sampling frequency of 6000 Hz was used. An example of a measured signal (outer-race defect) is represented in Figure 3.
Once the bearing characteristics are known, the fault frequencies (Table 2) can be calculated.
Here, fr is the rotation frequency of the shaft, n is the number of balls, d is the diameter of the ball, α is the contact angle, and D is the pitch diameter (distance between the centers of two opposite balls).
After the tests, a post-processing of the signals was required. For this, the software MATLAB R2022b was used. Specifically, the wavelet packet transform (WPT) was applied, and the MATLAB application ‘classification learner’ was used to perform an intelligent classification of the signals using a medium Gaussian support vector machine model.

3. Wavelet Packet Transform

The wavelet transform (WT) offers information both in time and frequency domain. To apply this tool, it is necessary to choose a function called mother wavelet Ψ s , τ t , which is described by Equation (1). This function is compared to the study signals by calculating the correlation coefficients which depend on the translation and scale of the wavelet function [33]. The CWT (continuous wavelet transform) is described by Equation (2), where the symbol ‘*’ symbolizes a complex conjugation
Ψ s , τ t = 1 s Ψ 1 τ s
C W T s , τ = 1 s x t ψ * t τ s d t
The DWT (discrete wavelet transform) allows the application of the WT discretely via filters [33]. The signal (with N samples and in the frequency domain f) is decomposed by a low-pass filter (obtaining approximation information (A)) and by a high-pass filter (obtaining the detail information (D)) (Figure 4).
The tool used in this work, the wavelet packet transform (WPT), is based on applying the DWT recursively up to a decomposition level k chosen by the user (Figure 5).
In this way, the analyzed frequency range is divided into packets (2k). W (k,j) represents the coefficients of the signal of each packet, with j being the position of the packet within the decomposition level (Equation (3)).
W   ( k , j ) = w 1 k , j , ,   w N k , j = w i k , j
Given the large number of coefficients that are obtained, it is common to calculate the energy of the packets E k , j (Equation (4)) to obtain clearer and more useful information for interpretation.
E k , j = i w i k , j 2
The methodology for mother wavelet selection is applied with a decomposition level of 9, obtaining 512 packets, but only those that include the fault frequencies are considered. Each packet represents a frequency band of 5.86 Hz.

4. Methodology for the Selection of the Mother Wavelet

Families Daubechies (db), Symlets (sym), and Coiflets (coif) were analyzed from 2 to 10 vanishing moments—order 2–10 for Daubechies and Symlets families, and order 1–5 for Coiflets family. This ensures that the analysis is performed under the same conditions for each family and it also guarantees an adequate computation time [28,34]. For each condition, for the inner-race and outer-race defects and mother wavelets, the following steps are followed:
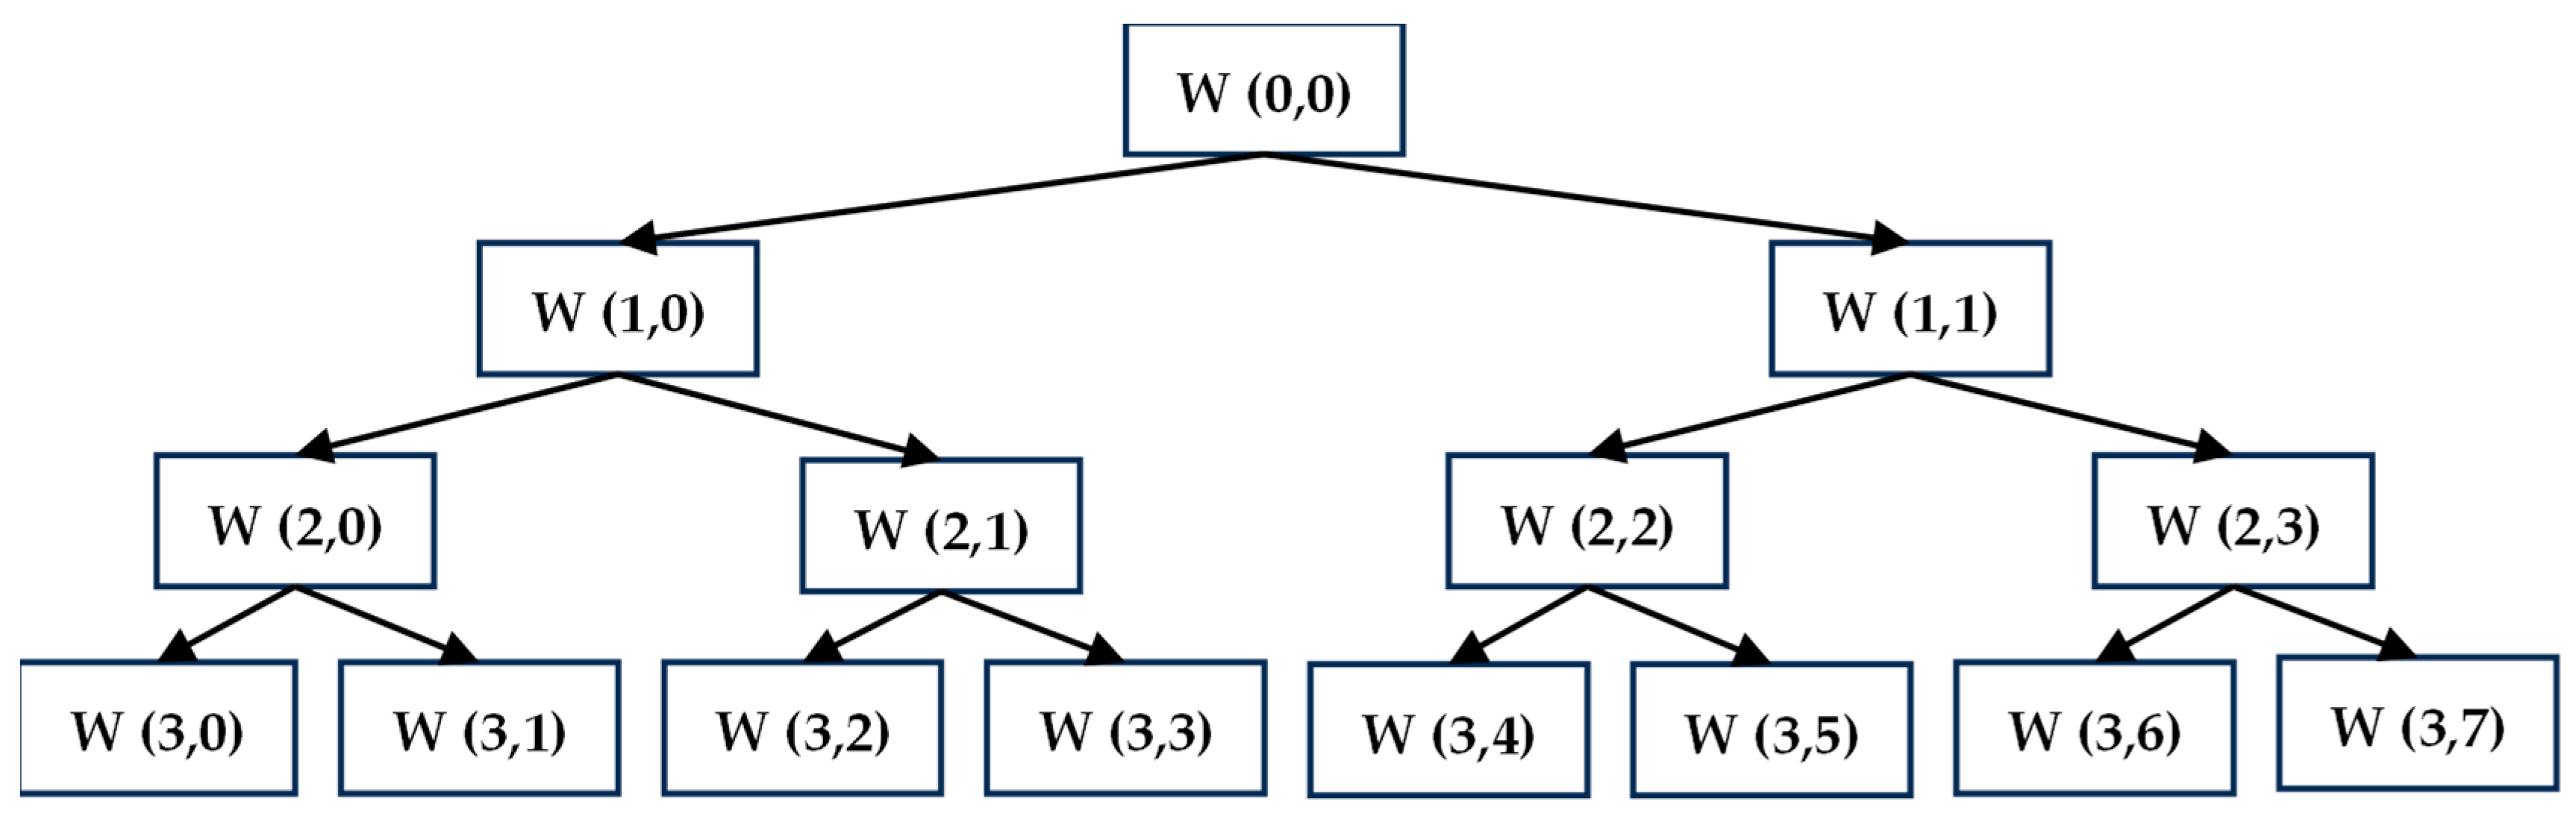
  • WPT decomposition: The WPT is applied with a decomposition level of 9 to ensure that there is a narrow band of frequencies that include the fault frequency for each case. This is applied for each mother wavelet and for all conditions tested.
  • Energy of the packets’ calculation is calculated using Equation (4), but only for the packet that includes the fault frequency for each case.
  • The energy variation ( E v ) calculation : The energy variation of the packet that includes the fault frequency is calculated with Equation (5), where the energy of the healthy condition ( E o ) and the energy of the defective condition E d are used. The larger variation, the better the results. It has been considered that an increase of 50% is a good value of energy increase for a correct detection of the defect; so, to be less restrictive, mother wavelets with an energy variation lower than 45% were discarded.
    E v = E d E o E o · 100
  • Reliability analysis: Energy values of the packet that include the fault frequency and that, by using each preselected mother wavelet, are entered into an intelligent classification system in which defective and healthy conditions are distinguished in two different classes; thus, the output would yield a value if an energy value belonged to the healthy or defective condition. This procedure will be performed for each defect (inner and outer race) separately. The model used for this is a medium Gaussian SVM, as SVM is proven to be fast, reliable, and very useful for these procedures [28]. Within the type of SVM, the medium Gaussian is the one that yields the highest success rate in this case. This was checked with a MATLAB® application called ‘classification learner’, where different models can be trained. This model was also selected in bearing works, such as [35]. The hyperplane that best separates the classes or conditions is calculated with a kernel function, in this case, medium Gaussian [36]. The model is trained with cross-validation, which protects against overfitting by partitioning the data set into folds (in this case, the maximum possible, 50), and estimates the accuracy on each fold. The mother wavelet with the highest success rate is selected, which means that data using that mother wavelet can be better separated in classes or conditions (healthy or defective), offering better defect detection ability.

5. Selection of the Mother Wavelet

First, the methodology will be applied to the inner-race defect data. Once the energy of the packet that includes the fault frequency is obtained for healthy and defective conditions, the energy variation (Ev) is calculated with Equation (5) for each mother wavelet. Those that meet the criterion of the 45% variation will be preselected.
For the chosen mother wavelets, the success rate of the reliability analysis using a medium Gaussian SVM model is calculated. The mother wavelet with the highest success rate is selected. This means that the results using that mother wavelet differentiates the healthy and defective conditions better.
In Table 3, the energy values and the classification results of the inner-race defect are shown for mother wavelets that meet the 45% criterion. The success rate is observed when conducting the reliability analysis for each one. The mother wavelet with the highest success rate is Daubechies 4, which is the optimal for the inner-race defect data. It is observed that the success rates are high; this is because it is known that the defect is not incipient, and it is well differentiated from the healthy condition.
Following the same steps as for the outer-race defect, the results of energy and success rate are shown in Table 4 for mother wavelets that meet the 45% criterion. The mother wavelet with the highest success rate is Symlet 6; thus, it is the optimal mother wavelet to detect the outer-race defect of a bearing.
However, with the intention of automating the maintenance process, it is more interesting to select a single mother wavelet for both defects. To do this, the mother wavelets that meet the 45% criterion in both types of defects are selected, that is, the common ones. Afterwards, the energy values of the packet that includes the fault frequency of each condition are introduced in a new intelligent classification system, using a medium Gaussian SVM model, and by differentiating the three conditions (healthy, inner-race defect, and outer-race defect). Afterwards, the one with the highest success rate is chosen (Table 5).
The selected mother wavelet is Daubechies 4 since it has the highest success rate when introducing both defects in the classification system.

6. Comparative Study

To show the importance of good selection, results using the selected mother wavelet (Daubechies 4) will be compared with Daubechies 6, which has been commonly used in previous works. In Figure 6a, the mean energy and standard deviation values of the packet corresponding to the fault frequency of an inner-race defect are shown. In Figure 6b, the same results are shown for an outer-race defect.
For the inner-race defect, it can be observed that the energy increase is a little larger using the db4 than the db6. Also, the standard deviation values are lower using db4. Moreover, the success rate of the reliability analysis using a medium Gaussian SVM model is 97% using db4 and 93% using db6, with which it is verified that the selected mother wavelet with the proposed methodology offers better results. The same is observed for the outer-race defect. The success rate for each defect, by applying the proposed methodology, is 71.5% using Daubechies 4 compared to 68% with the Daubechies 6, respectively. To sum up, although the energy increments are greater using the selected WM, the difference is small, but the standard deviation is clearly smaller.
If the success rates of the classification system used for the selection of the common mother wavelet for both defects are compared, Daubechies 4 offers an 80.3% and Daubechies 6 offers a 76.6% success rate.
Another comparison between both mother wavelets is also proposed, which is to perform an energy analysis of the entire signal, that is, of all packets and using different decomposition levels. In this way, it will also be possible to determine the optimal decomposition level for the detection of these defects by considering the entire frequency range. To do this, a linear SVM model is used, since it is based on calculating the line that separates the different conditions (healthy, inner-race, and outer-race defects), which makes it easier to determine a threshold to set alarms. In Figure 7, the success rates of each mother wavelet and for different decomposition levels are shown.
It is observed that, although for a decomposition level of 3, Daubechies 6 has higher success rate than Daubechies 4; however, for the other levels, Daubechies 4 is better. Moreover, the highest success rate is reached for a decomposition level of 5, which would be the optimal level to carry out a WPT analysis to detect bearing defects considering the energy of the entire signal.
In any case, Daubechies 4 shows better results than Daubechies 6; therefore, the methodology works, and the objective is fulfilled.

7. Discussion

In this work, a methodology to select the optimal mother wavelet to detect bearing defects (inner- and outer-race defects) was proposed. This methodology considered only the packet that included the fault frequency for each case, and the selection criteria were the energy variations between healthy and defective bearings, and the success rates of an intelligent classification system using medium Gaussian SVM and its computation time. In this way, in addition to the selection of the optimal mother wavelet for each case, the packets that include the fault frequencies are confirmed as good patterns for defect detection. The vibratory signals, obtained from a machinery fault simulator on which defective bearings were tested, were analyzed using WPT energy. This analysis was performed for three different mother wavelet families, Daubechies, Symlets, and Coiflets, for a decomposition level of 9 and at a 60 Hz rotating frequency.
First, the relative energy increase between healthy and defective conditions of the analyzed packet was checked. The mother wavelets that have shown a variation of less than 45% were discarded.
It was observed that a higher energy increase generally yields a higher classification system success rate, which is the last criterion. For this, a reliability analysis using a medium Gaussian SVM model was conducted to determine which mother wavelet offered the highest success rate, i.e., whether it differentiates the healthy or defective conditions better. If, in any case, there are several wavelets with the same success rate, the one that requires less computation time is chosen.
With all this, it was proved that a different mother wavelet was obtained for each type of defect. This reaffirms the importance of characterizing any type of defect to guarantee the most reliable monitoring. For the data set of the bearing with the inner-race defect, mother wavelet Symlet 6 was selected, while mother wavelet Daubechies 4 was obtained and for the outer-race defect.
However, as the real interest is to obtain a single mother wavelet for both defects, Daubechies 4 was selected, which met the criteria for both conditions. It was proven that better results are obtained with this mother wavelet than with the Daubechies 6, both in energy increase and in standard deviation as well as regarding the success rates of the classification system. This comparison was completed by only considering fault frequencies, so another comparison was made considering the energy of the entire signal in addition to the influence of the level of decomposition. To do this, the success rates were calculated with a medium Gaussian SVM model. In this way, it was determined that Daubechies 4 was also better and is the one with the highest success rate.
It should be noted that these results were obtained in tests carried out on a specific machine and with no incipient defects. What can be extrapolated to a real condition monitoring or maintenance task is the methodology to determine the most appropriate tools and parameters, and it is necessary to apply this methodology to characterize each machine with the most common defects.
The success rate obtained in the results (80.3% using Daubechies 4) may appear to be low, but it is still higher than those obtained with the function previously used (Daubechies 6), which is what was intended in this study. It should be emphasized that the importance of this study is not to detect defects with a high success rate of defect detection, but to demonstrate that using one function or another changes the results and could be a crucial issue when applying the methodology to more real machines and cases, where the maintenance task is of vital importance and should be definitely considered.

8. Conclusions

This work aimed to demonstrate that it is not only important to determine the correct tool for each case to process the signals, but it is even more important to determine the optimal parameters of these tools, since they can change for each case and condition of the machine or component used. This is why this proposed methodology should be applied and tested on different machines and with the most critical or most common defects.
In conclusion, with these results, it is possible to create an algorithm for the automatic detection of consistent failures. Selecting the mother wavelet that best differentiates a healthy from a defective condition for each case facilitates the diagnostic task, as the results are clearer.

Author Contributions

Conceptualization, M.Z.; methodology, M.Z.; software, M.Z.; validation, M.Z., M.J.G., and C.C.; formal analysis, M.Z.; investigation, M.Z.; resources, M.Z.; data curation, M.Z.; writing—original draft preparation, M.Z.; writing—review and editing, M.J.G. and C.C.; visualization, M.Z.; supervision, C.C.; project administration, C.C.; funding acquisition, C.C. All authors have read and agreed to the published version of the manuscript.

Funding

This research was funded by the MCIN/AEI/10.13039/501100011033, grant number MC4.0 PID2020-116984RB-C22.

Data Availability Statement

Data are contained within the article.

Acknowledgments

Authors would like to thank the Universidad Francisco de Vitoria for the help in publishing this article.

Conflicts of Interest

The authors declare no conflicts of interest. The funders had no role in the design of this study; in the collection, analyses, or interpretation of data; in the writing of the manuscript; or in the decision to publish the results.

References

  1. Hodge, V.J.; O’Keefe, S.; Weeks, M.; Moulds, A. Wireless Sensor Networks for Condition Monitoring in the Railway Industry: A Survey. IEEE Trans. Intell. Transp. Syst. 2015, 16, 1088–1106. [Google Scholar] [CrossRef]
  2. Sakib, N.; Wuest, T. Challenges and Opportunities of Condition-Based Predictive Maintenance: A Review. Procedia CIRP 2018, 78, 267–272. [Google Scholar] [CrossRef]
  3. Senapaty, G.; Rao, U.S. Vibration Based Condition Monitoring of Rotating Machinery. MATEC Web Conf. 2018, 144, 01021. [Google Scholar] [CrossRef]
  4. Vishwakarma, M.; Purohit, R.; Harshlata, V.; Rajput, P. Vibration Analysis & Condition Monitoring for Rotating Machines: A Review. Mater. Today Proc. 2017, 4, 2659–2664. [Google Scholar] [CrossRef]
  5. Wang, N.; Liu, X. Bearing Fault Diagnosis Method Based on Hilbert Envelope Demodulation Analysis. IOP Conf. Ser. Mater. Sci. Eng. 2018, 436, 012009. [Google Scholar] [CrossRef]
  6. Jin, S.; Lee, S.-K. Bearing Fault Detection Utilizing Group Delay and the Hilbert-Huang Transform. J. Mech. Sci. Technol. 2017, 31, 1089–1096. [Google Scholar] [CrossRef]
  7. Osman, S.; Wang, W. A Normalized Hilbert-Huang Transform Technique for Bearing Fault Detection. J. Vib. Control 2016, 22, 2771–2787. [Google Scholar] [CrossRef]
  8. Wescoat, E.; Mears, L.; Goodnough, J.; Sims, J. Frequency Energy Analysis in Detecting Rolling Bearing Faults. Procedia Manuf. 2020, 48, 980–991. [Google Scholar] [CrossRef]
  9. Liu, H.; Li, D.; Yuan, Y.; Zhang, S.; Zhao, H.; Deng, W. Fault Diagnosis for a Bearing Rolling Element Using Improved VMD and HT. Appl. Sci. 2019, 9, 1439. [Google Scholar] [CrossRef]
  10. Gu, J.; Peng, Y.; Lu, H.; Chang, X.; Cao, S.; Chen, G.; Cao, B. An Optimized Variational Mode Decomposition Method and Its Application in Vibration Signal Analysis of Bearings. Struct. Health Monit. 2022, 21, 2386–2407. [Google Scholar] [CrossRef]
  11. Kankar, P.K.; Sharma, S.C.; Harsha, S.P. Fault Diagnosis of Ball Bearings Using Continuous Wavelet Transform. Appl. Soft Comput. 2011, 11, 2300–2312. [Google Scholar] [CrossRef]
  12. Guo, J.; Liu, X.; Li, S.; Wang, Z. Bearing Intelligent Fault Diagnosis Based on Wavelet Transform and Convolutional Neural Network. Shock Vib. 2020, 2020, e6380486. [Google Scholar] [CrossRef]
  13. Patil, A.; Gaikwad, J.; Kulkarni, J. Bearing Fault Diagnosis Using Discrete Wavelet Transform and Artificial Neural Network. In Proceedings of the 2016 2nd International Conference on Applied and Theoretical Computing and Communication Technology (iCATccT), Bangalore, India, 21–23 July 2016; pp. 399–405. [Google Scholar]
  14. Nabhan, A.; Ghazaly, N.; Samy, A.; Mousa, M.O. Bearing Fault Detection Techniques—A Review. Turk. J. Eng. Sci. Technol. 2015, 3, 1–18. [Google Scholar]
  15. Wan, L.; Zhang, G.; Li, H.; Li, C. A Novel Bearing Fault Diagnosis Method Using Spark-Based Parallel ACO-K-Means Clustering Algorithm. IEEE Access 2021, 9, 28753–28768. [Google Scholar] [CrossRef]
  16. Saruhan, H.; Sandemir, S.; Çiçek, A.; Uygur, I. Vibration Analysis of Rolling Element Bearings Defects. J. Appl. Res. Technol. JART 2014, 12, 384–395. [Google Scholar] [CrossRef]
  17. Li, H.; Fu, L.; Zheng, H. Bearing Fault Diagnosis Based on Amplitude and Phase Map of Hermitian Wavelet Transform. J. Mech. Sci. Technol. 2011, 25, 2731–2740. [Google Scholar] [CrossRef]
  18. Graney, B.; Starry, K. Rolling Element Bearing Analysis. Mater. Eval. 2012, 70, 78–85. [Google Scholar]
  19. Castejón, C.; Lara, O.; GARCIA-PRADA, J.C. Automated Diagnosis of Rolling Bearings Using MRA and Neural Networks. Mech. Syst. Signal Process. 2010, 24, 289–299. [Google Scholar] [CrossRef]
  20. Hernández, A.; Castejón, C.; García-Prada, J.C.; Padrón, I.; Marichal, G.N. Wavelet Packets Transform Processing and Genetic Neuro-Fuzzy Classification to Detect Faulty Bearings. Adv. Mech. Eng. 2019, 11, 1687814019831185. [Google Scholar] [CrossRef]
  21. Gómez, M.J.; Castejón, C.; GARCIA-PRADA, J.C. Incipient Fault Detection in Bearings Through the Use of WPT Energy and Neural Networks. In Advances in Condition Monitoring of Machinery in Non-Stationary Operations; Springer: Berlin/Heidelberg, Germany, 2014; pp. 63–72. ISBN 978-3-642-39347-1. [Google Scholar]
  22. Xu, Y.; Xiu, S. A New and Effective Method of Bearing Fault Diagnosis Using Wavelet Packet Transform Combined with Support Vector Machine. J. Comput. 2011, 6, 2502–2509. [Google Scholar] [CrossRef]
  23. Xiong, S.; Zhou, H.; He, S.; Zhang, L.; Xia, Q.; Xuan, J.; Shi, T. A Novel End-To-End Fault Diagnosis Approach for Rolling Bearings by Integrating Wavelet Packet Transform into Convolutional Neural Network Structures. Sensors 2020, 20, 4965. [Google Scholar] [CrossRef] [PubMed]
  24. Nikolaou, N.G.; Antoniadis, I.A. Rolling Element Bearing Fault Diagnosis Using Wavelet Packets. NDT E Int. 2002, 35, 197–205. [Google Scholar] [CrossRef]
  25. Rafiee, J.; Rafiee, M.A.; Tse, P.W. Application of Mother Wavelet Functions for Automatic Gear and Bearing Fault Diagnosis. Expert Syst. Appl. 2010, 37, 4568–4579. [Google Scholar] [CrossRef]
  26. Lou, X.; Loparo, K.A. Bearing Fault Diagnosis Based on Wavelet Transform and Fuzzy Inference. Mech. Syst. Signal Process. 2004, 18, 1077–1095. [Google Scholar] [CrossRef]
  27. Purushotham, V.; Narayanan, S.; Prasad, S.A.N. Multi-Fault Diagnosis of Rolling Bearing Elements Using Wavelet Analysis and Hidden Markov Model Based Fault Recognition. NDT E Int. 2005, 38, 654–664. [Google Scholar] [CrossRef]
  28. Zamorano, M.; Gómez Garcia, M.J.; Castejón, C. Selection of a Mother Wavelet as Identification Pattern for the Detection of Cracks in Shafts. J. Vib. Control 2022, 28, 3152–3161. [Google Scholar] [CrossRef]
  29. Wai Keng, N.; Leong, M.; Hee, L.; Abdelrhman, A. Wavelet Analysis: Mother Wavelet Selection Methods. Appl. Mech. Mater. 2013, 393, 953–958. [Google Scholar]
  30. Ao, H.; Junsheng, C.; Jinde, Z.; Truong, T. Roller Bearing Fault Diagnosis Method Based on Chemical Reaction Optimization and Support Vector Machine. J. Comput. Civ. Eng. 2014, 29, 04014077. [Google Scholar] [CrossRef]
  31. Wang, H.; Yuan, L. Fault Diagnosis of Bearing Based on Improved Refined Composite Hierarchical Fuzzy Entropy and Least Squares Support Vector Machine. J. Vib. Eng. Technol. 2022, 10, 3025–3036. [Google Scholar] [CrossRef]
  32. Wang, M.; Wang, W.; Zeng, J.; Zhang, Y. An Integrated Method Based on Sparrow Search Algorithm Improved Variational Mode Decomposition and Support Vector Machine for Fault Diagnosis of Rolling Bearing. J. Vib. Eng. Technol. 2022, 10, 2893–2904. [Google Scholar] [CrossRef]
  33. Mallat, S. A Wavelet Tour of Signal Processing; Academic Press: Cambridge, MA, USA, 1999; ISBN 978-0-12-466606-1. [Google Scholar]
  34. Zamorano, M.; Gómez, M.J.; Castejón, C. Optimal Selection of the Mother Wavelet in WPT Analysis and Its Influence in Cracked Railway Axles Detection. Machines 2023, 11, 493. [Google Scholar] [CrossRef]
  35. Lin, S.-L. Application of Machine Learning to a Medium Gaussian Support Vector Machine in the Diagnosis of Motor Bearing Faults. Electronics 2021, 10, 2266. [Google Scholar] [CrossRef]
  36. Noble, W. What is a support vector machine? Nat. Biotechnol 2006, 24, 1565–1567. [Google Scholar] [CrossRef] [PubMed]
Figure 1. Example of mother wavelet (Daubechies 4).
Machines 12 00207 g001
Figure 2. Machine fault simulator.
Machines 12 00207 g002
Figure 3. Example of measured signal—outer-race defect (time domain).
Machines 12 00207 g003
Figure 4. DWT procedure, where A is the approximation information and D the detail information.
Machines 12 00207 g004
Figure 5. WPT decomposition process for a decomposition level of 3.
Machines 12 00207 g005
Figure 6. Comparison between db6 and db4: (a) inner-race defect; (b) outer-race defect.
Machines 12 00207 g006
Figure 7. Success rates using db4 and db6 for different decomposition levels.
Machines 12 00207 g007
Table 1. Characteristics of an ER10K bearing.
ParameterValue
Inside diameter (mm)15.875
External diameter (mm)46.990
Pitch diameter (mm)33.490
Number of balls8
Ball diameter (mm)7.940
Contact angle (°)0
Table 2. Fault frequencies for each bearing defect.
DefectEquationFault Frequency (Hz)
Inner-race f r n 2 1 + d D cos α 296.90
Outer-race f r n 2 1 d D cos α 183.10
Table 3. Results of the inner-race defect for mother wavelet selection.
Mother WaveletPacket Energy (Healthy)Packet Energy (Defective)Energy Variation (%)Success Rate
(Medium
Gaussian SVM)
Db20.439965690.8085379283.772947795.5
Db40.447660940.6609636347.64897
Db50.505468220.8543767469.026797594
Db70.714546831.0543643847.557071594.5
Coif10.447423140.8494059289.843984194
Coif20.476624130.6988713346.629446594
Coif50.702206911.0422349648.422773195.5
Sym20.439965690.8085379283.772947795.5
Sym100.605342820.9080263350.001998694.5
Table 4. Results of the outer-race defect for mother wavelet selection.
Mother WaveletPacket Energy (Healthy)Packet Energy (Defective)Energy Variation (%)Success Rate
(Medium Gaussian SVM)
Db20.491983270.78911560.394681971
Db30.508368190.8148611460.289561170
Db40.533720750.8550263160.201063171.5
Db60.597619030.9223426254.336218668
Db70.579779490.8540611347.307925368
Db80.602101360.9385025655.871190968.5
Db90.792251721.2122191153.009337669
Db101.345780022.2482404767.058540665.5
Coif10.60976711.1202251783.713611573
Coif20.477974770.775443462.235216873.5
Coif30.513824590.7585000347.61847671.5
Coif50.664201040.9892732248.941835875.5
Sym20.491983270.78911560.394681971
Sym30.508368190.8148611460.289561170
Sym40.455826530.7374573161.784638774.5
Sym60.432579760.6904359159.608927977
Sym70.441473110.6467736946.50352869
Sym80.424056940.6616241656.022480974.5
Sym90.435217220.6383132546.665439766
Sym100.425861680.6421337650.784582773
Table 5. Results of the classification system for the selection of the common MW for the two types of defects.
Mother WaveletSuccess Rate (Medium Gaussian SVM) (%)
Db277.6
Db480.3
Db767.2
Coif178.3
Coif276.3
Coif576.3
Sym276.6
Sym1065.6
Disclaimer/Publisher’s Note: The statements, opinions and data contained in all publications are solely those of the individual author(s) and contributor(s) and not of MDPI and/or the editor(s). MDPI and/or the editor(s) disclaim responsibility for any injury to people or property resulting from any ideas, methods, instructions or products referred to in the content.

