1. Introduction
The exploration of environments is a contemporary and highly relevant topic that has given rise to various lines of research from diverse perspectives. Examples include search and rescue robotics and sensory systems, which are closely intertwined due to the versatility and synergy between these domains. The field of exploration robotics has witnessed substantial growth in recent years, fuelled by the interest of research centers worldwide. One of the primary focuses of research lies in exploration missions and data collection to assess the state of an environment, particularly in hostile settings such as post-disaster scenarios. These environments are characterized by poor light conditions, irregular terrains, and the potential release of gases, as highlighted in the literature [
1,
2]. This latter emphasis is particularly noteworthy, given that gas concentrations can lead to explosions and pose significant hazards to exploration teams.
As of today, advancements in state-of-the-art technology primarily address the challenge of inspecting gas concentrations in environments using robotic platforms [
3,
4,
5]. These developments focus on various aspects, including the creation of fixed sensor systems [
6,
7,
8] and portable counterparts [
9,
10,
11], as well as the generation of informative gas concentration maps [
12,
13]. A topic that has gained considerable prominence involves olfactory systems in robotics, applied for different purposes ranging from navigation in environments [
14] to the identification of potential leaks in indoor settings, as described in the work by Widyantara et al. [
15]. Additionally, some studies endow bioinspired insect robots with olfactory instrumentation for tracking tasks [
16] or for the identification of chemical sources [
17]. These works have enabled the establishment of a historical foundation, serving as a starting point for the development of this study to propose a system that optimizes gas inspection in hostile environments using robotic platforms.
The main contribution of this work proposes a method for acquiring environmental gases using an artificial nose, a sensory system capable of sampling gas within a surrounding range by emulating the behaviour of a real nose, replicating the phases of inhalation and exhalation. This is achieved through a distributed system of air absorption using fans, channelling the air in a concentrated way toward an internal sensor for analysis. The implemented sensory system initiates from a preceding design phase that analyses the behaviour of particles around the sensory system through Computational Fluid Dynamics (CFD) analysis to enhance and maximize the quality of acquired samples from a given area. Subsequently, this information has been used to create concentration maps of the CO2 state in the environment. The artificial nose has been integrated into the Robot Operating System (ROS) on a quadrupedal robot to maximize environmental coverage, leveraging its locomotion capabilities in unstructured terrains.
To assess this proof of concept, a testing phase was conducted in an environment reconstructed according to the standards of the National Institute of Standards and Technology (NIST) [
18] during the XVI International Conference on Emergency and Disaster Safety at the University of Malaga. The study underwent a comparative phase against relevant developments in the state of the art, emphasizing its relevance, innovation, and primary contributions over current systems.
This document is structured as follows:
Section 2 provides a detailed overview of the materials and methods employed in the development, along with the implemented algorithms.
Section 3 elucidates the experiments conducted and presents the primary results obtained from this development. Finally,
Section 4 outlines the key conclusions drawn from this work.
2. Materials and Methods
2.1. Design and Implementation of the System
2.1.1. CFD Analysis of Designed System
The implemented system was developed based on a simulation-based foundation to validate the initial hypothetical framework of the artificial nose, primarily focusing on verifying functionality before actual implementation [
19,
20]. This functionality requirement seeks to verify air aspiration within a one-meter radius around the robot, aiming to maximize the samples captured during the inspection mission. This will be verified through a
Computational Fluid Dynamics (CFD in
Figure 1) analysis of the design CAD model for the sensory device, primarily focusing on confirming the capability to aspirate air particles within this surrounding radius.
The design requirements originate from the size and weight that must be integrated into the quadruped robot with a maximum payload of 5 kg. In this regard, this work propose placing the three sprayers around the main chassis to cover a radius around the robot. The CAD models of the design are available in the
Appendix A. The overall dimensions of the sensory system are 0.18, 0.17, and 0.23 [m], which are adapted to the surface of the robot’s torso.
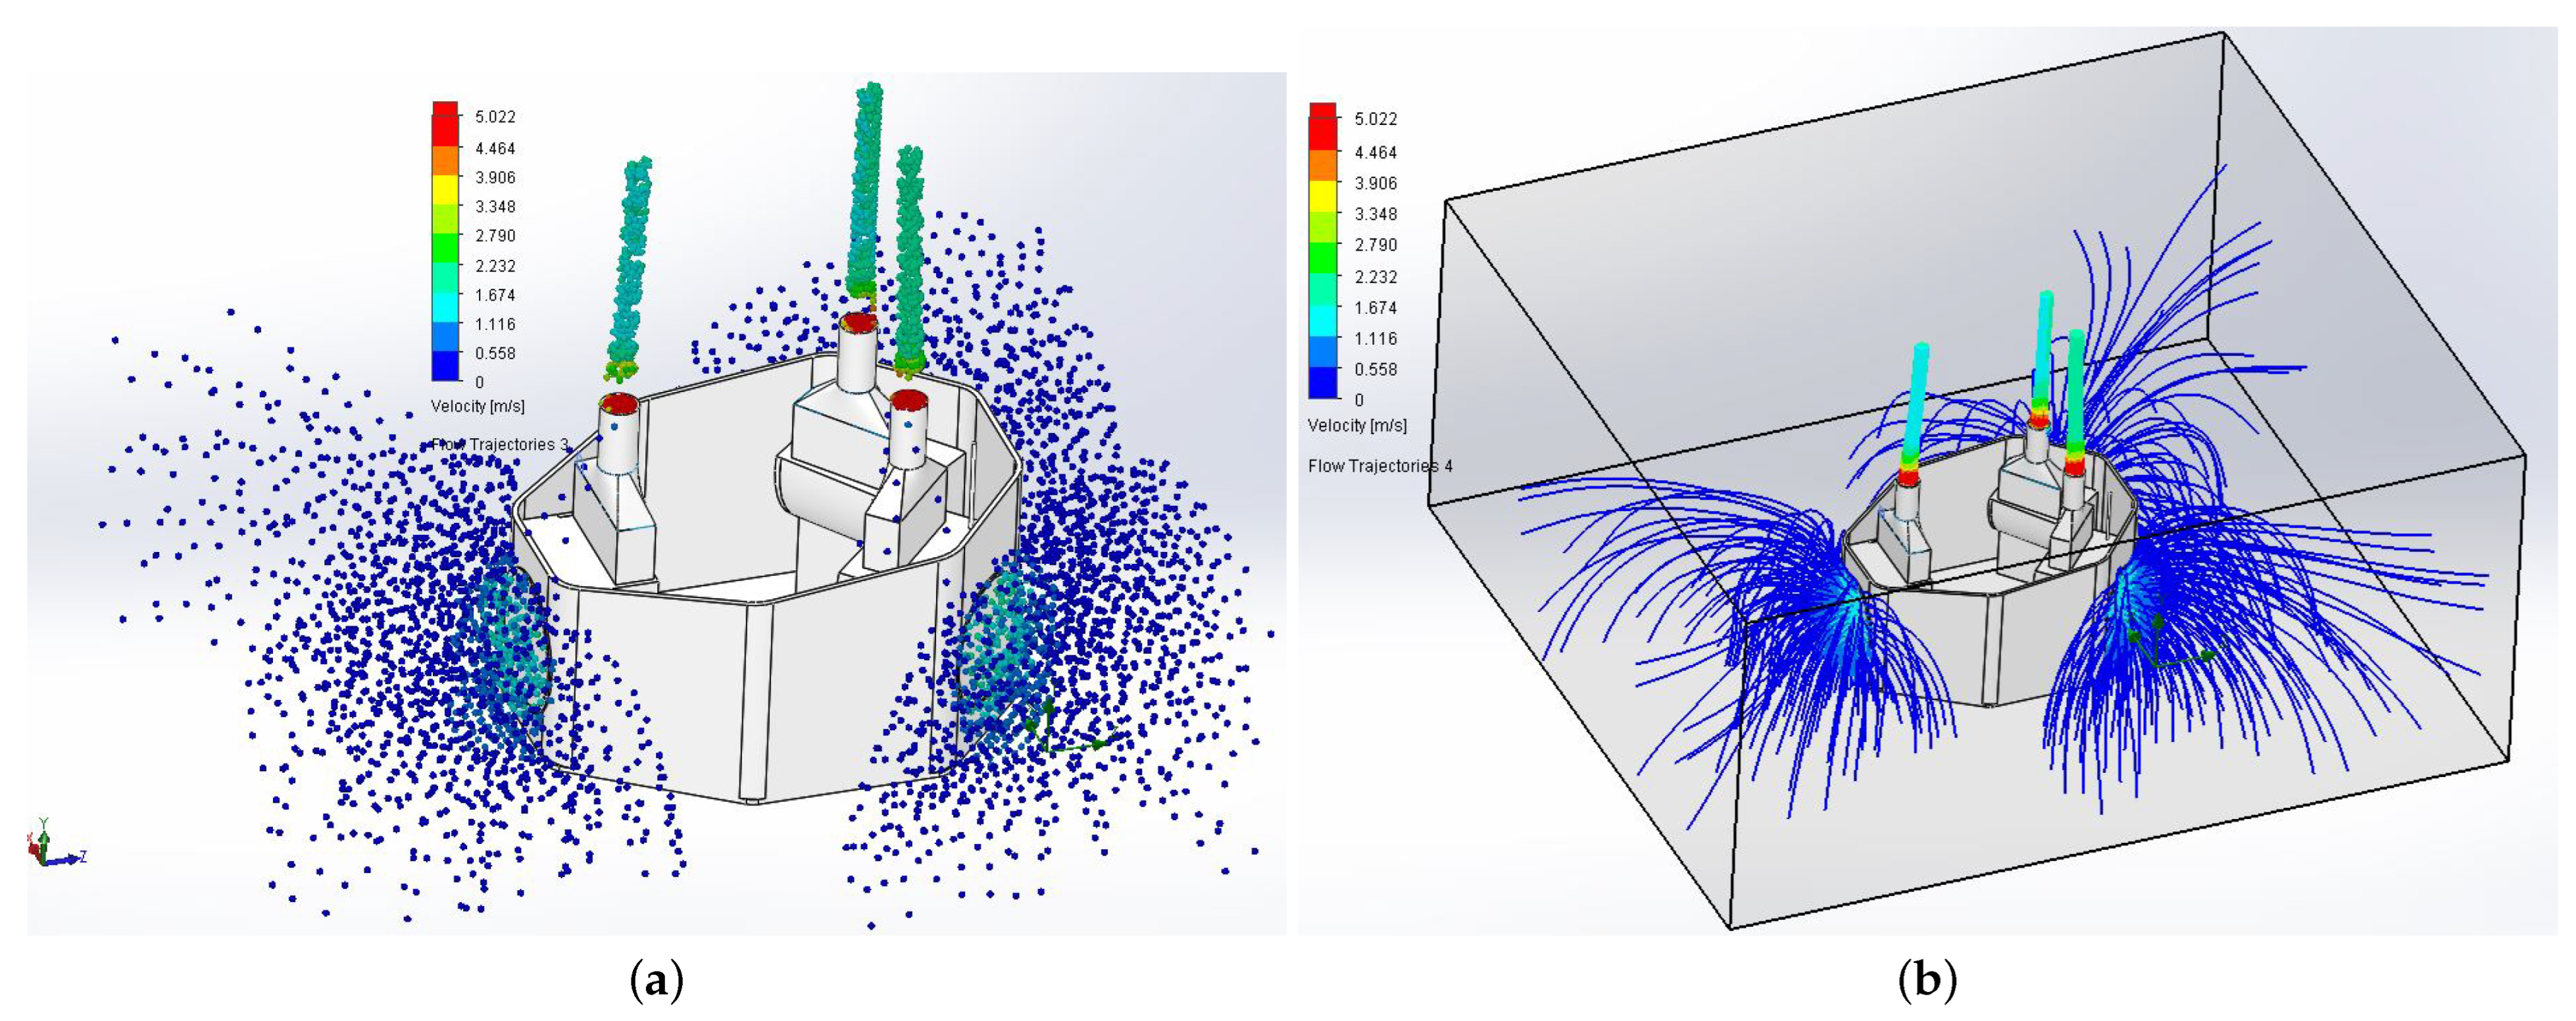
The developed model consists of three suction modules distributed at 120-degree intervals around the central axis of the system. Each module has an axial fan at the inlet, which draws in the surrounding air. The commercial axial fan model is the Ebm-papst 600 N (detailed in
Table 1). The datasheet provides a flow rate of 56 m
3/h, around which the Computational Fluid Dynamics (CFD) analysis is conducted to validate the initially proposed CAD model. The simulation is performed using Solidworks software with the Flow Simulation add-on. The simulation conditions involve an air environment, fine meshing, an inlet flow rate of 56 m
3/h, a computational domain of 1 × 1 × 0.5 m, 5 cm inlet diameter, 1 cm outlet diameter, and gravity activation during the simulation.
Figure 1a illustrates the result of the velocity simulation of particles for the inserted parameters. This simulation allows for the verification of the maximum and minimum velocities generated during the particle spraying process. There is a flow of particles from lower to higher air velocities towards the axial fans, with an average inlet velocity of 2.2 m/s and an outlet velocity of 4.4 m/s after completing the measurement.
Figure 1b displays the computational domain of the analysis, showcasing particle velocities through flow lines.
This confirms the initial hypothesis, establishing that the surrounding air within a one-meter diameter around the robot is susceptible to being drawn into the measurement system. While it is true that particles at the extremities may not be fully captured, those at a 50% distance are effectively drawn in. Hence, the sampling rate will be set for every 50 cm of the robot’s advancement.
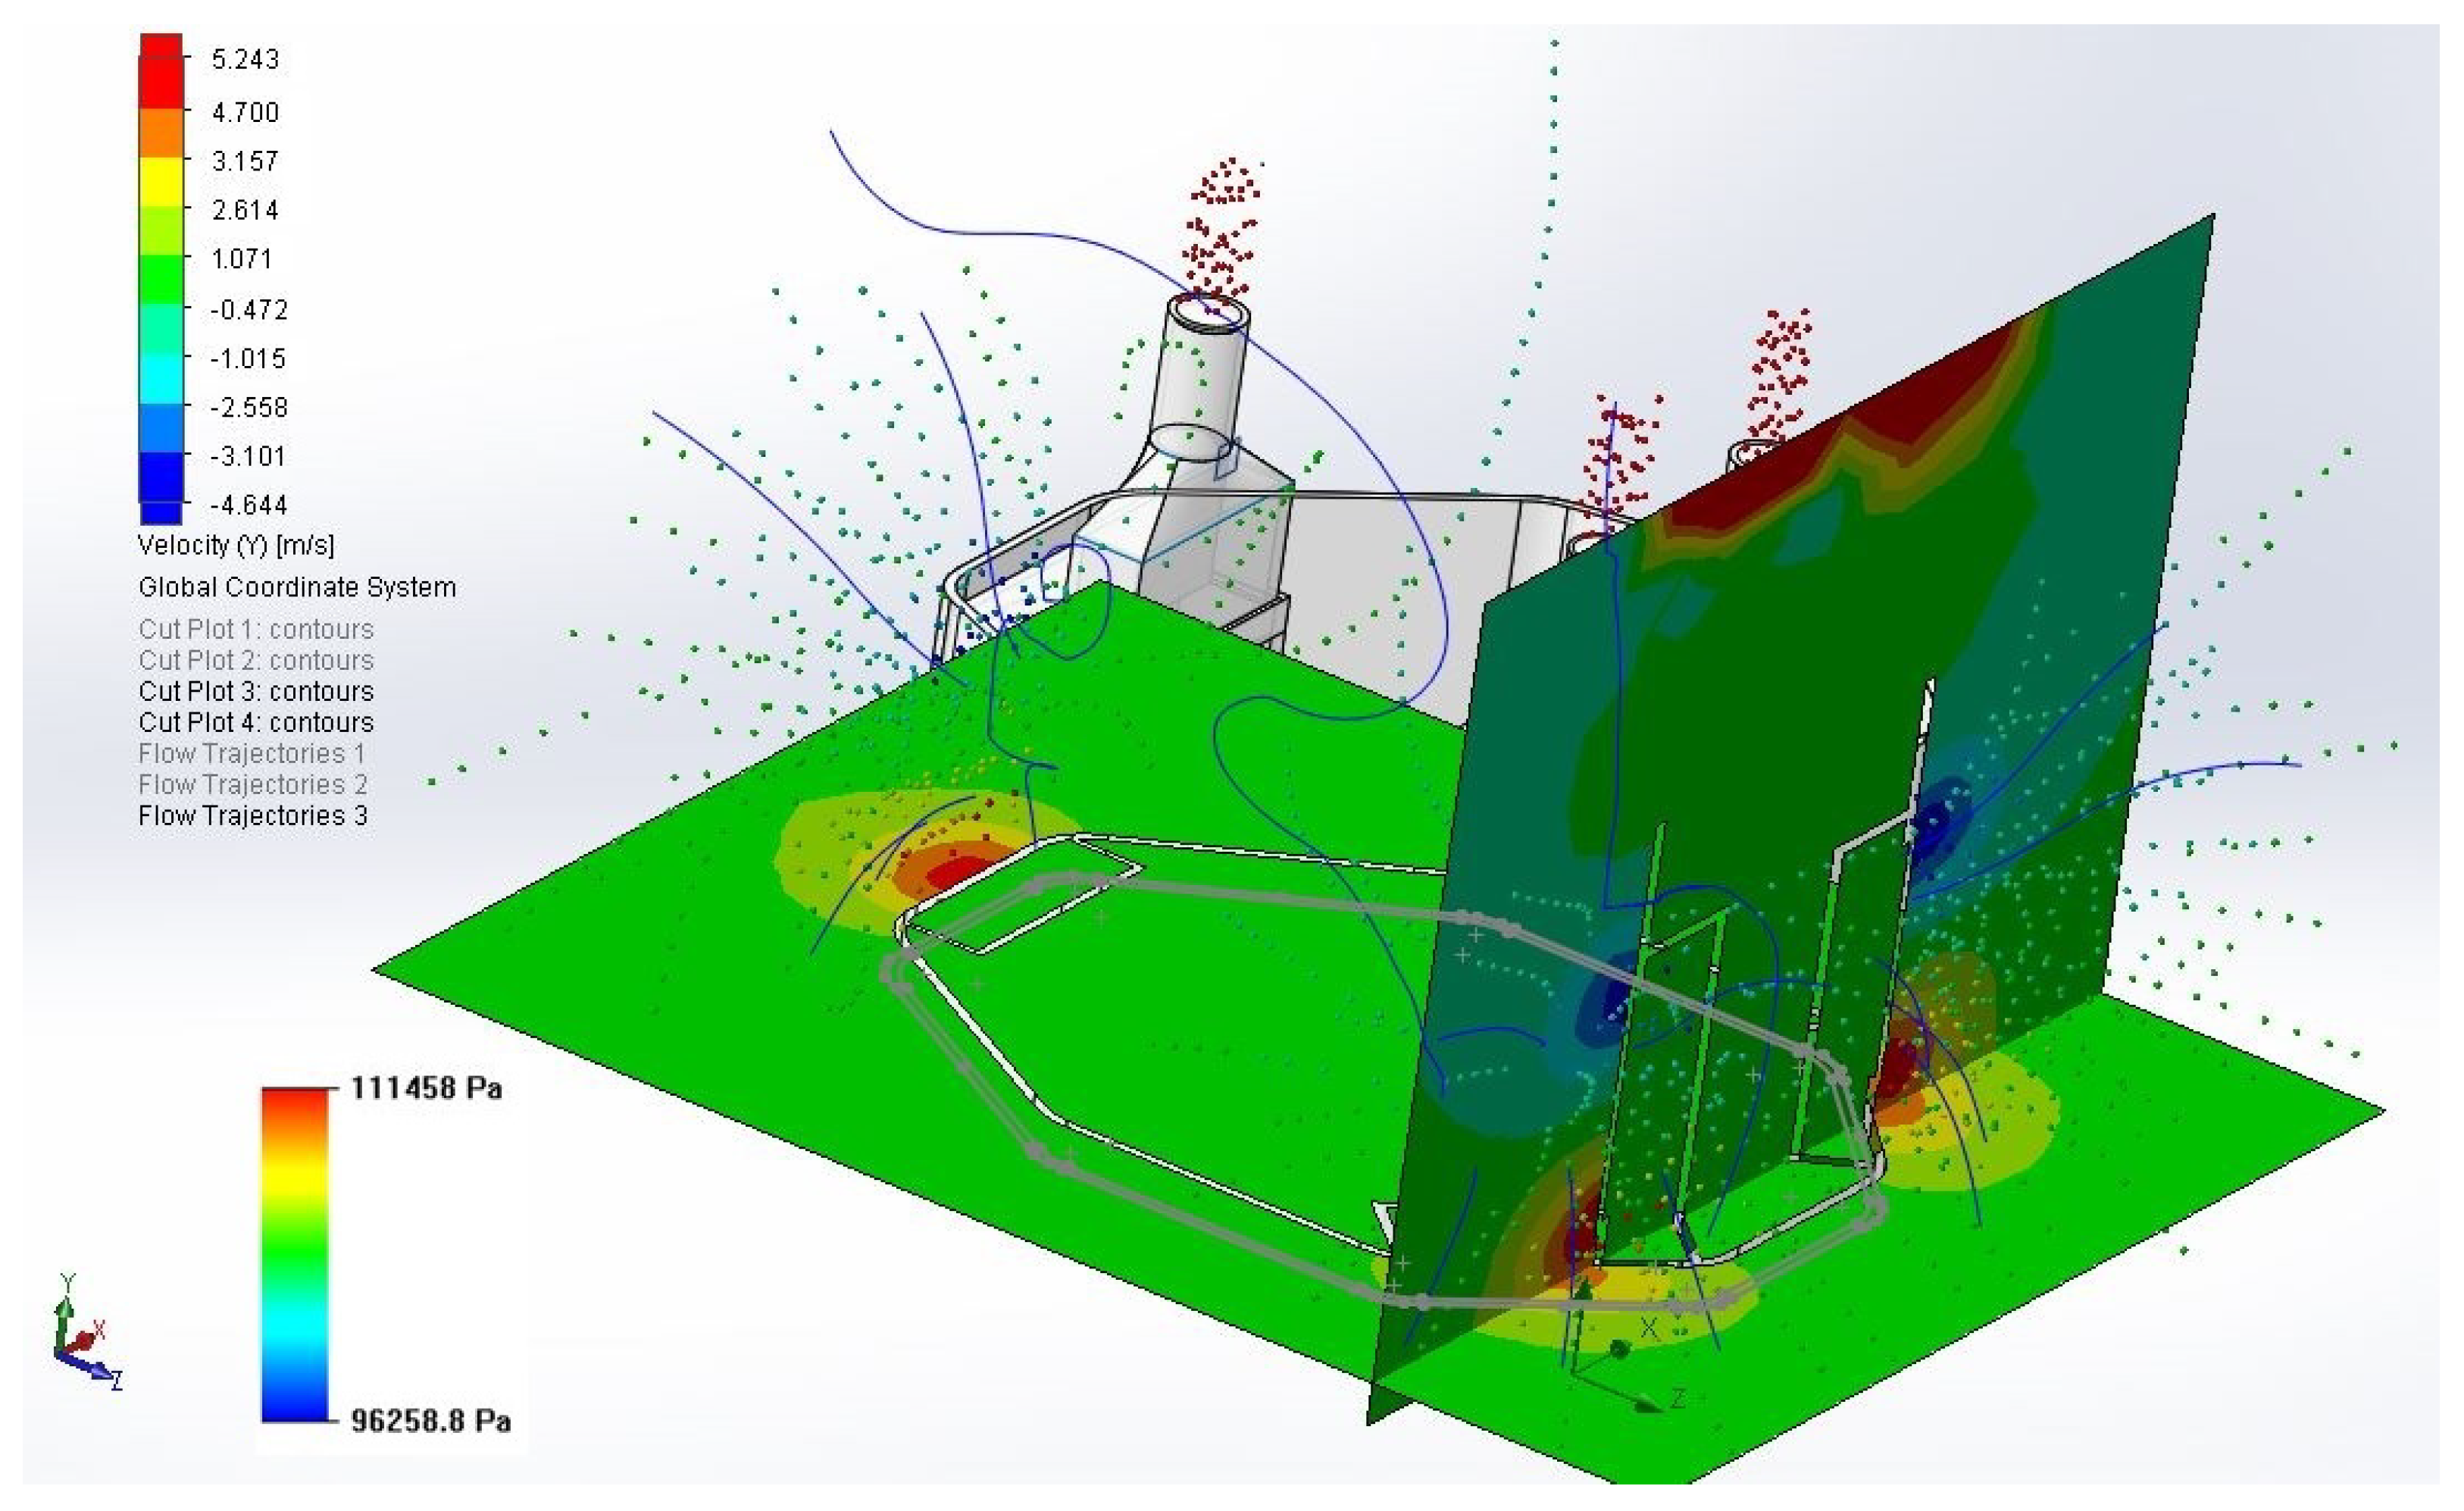
On the other hand,
Figure 2 presents the cross-sectional views in the XY and XZ planes, depicting the evolution of pressure for the areas where the air inlet and outlet of the artificial nose are located, along with the interaction of velocities generated. These pressure distributions reveal semicircular zones centred on the axis of both the suction and outlet, demonstrating the flow trend of particles towards the system. This justifies the distribution of the three sensory modules at an angular spacing of 120 degrees.
During the CAD design of the mechanism, tests were performed to reduce the residual effect of CO2 concentrations; thus, one of the major contributions of the proposal is the gas suction for multiple sources to reduce the impact of false measurements of individual sensors. It is important to clarify that the individual suction subsystems are isolated from the electronics internal box, as well as that the possible leaks are carried out by the fans.
2.1.2. Hardware Implementation
The implementation stage has necessitated a series of manufacturing processes, from constructing the case using 3D printing technology with PLA material for external covers and carbon fiber for the measurement sensors’ dispersion elements. The CAD models of the implemented sensory system are accessible in the repository detailed in
Appendix A.
Table 1 provides an overview of the components employed in implementing this development, offering a comprehensive list of elements crucial to the successful execution of the sensory system integration into the overall robotic structure.
According to the specifications of the module datasheet, the size (35 × 36 × 18 mm) and weight (8 g) of electronics are not significant, especially considering that the robot has a payload of up to 5 kg (the entire module weighs 1 kg). Likewise, the costs of the sensors are relatively low considering that these kinds of sensors already include all the electronics and conditioning of the sensors for measurement, as well as the I2C communication facility. The system is designed to maximise measurements through the distributed aspersion system in cases of robot unbalance due to irregularities in the terrain. Additionally, although there may be irregularities in the terrain that could compromise stability, the entire module has been positioned over the robot’s center of gravity to keep it as low as possible.
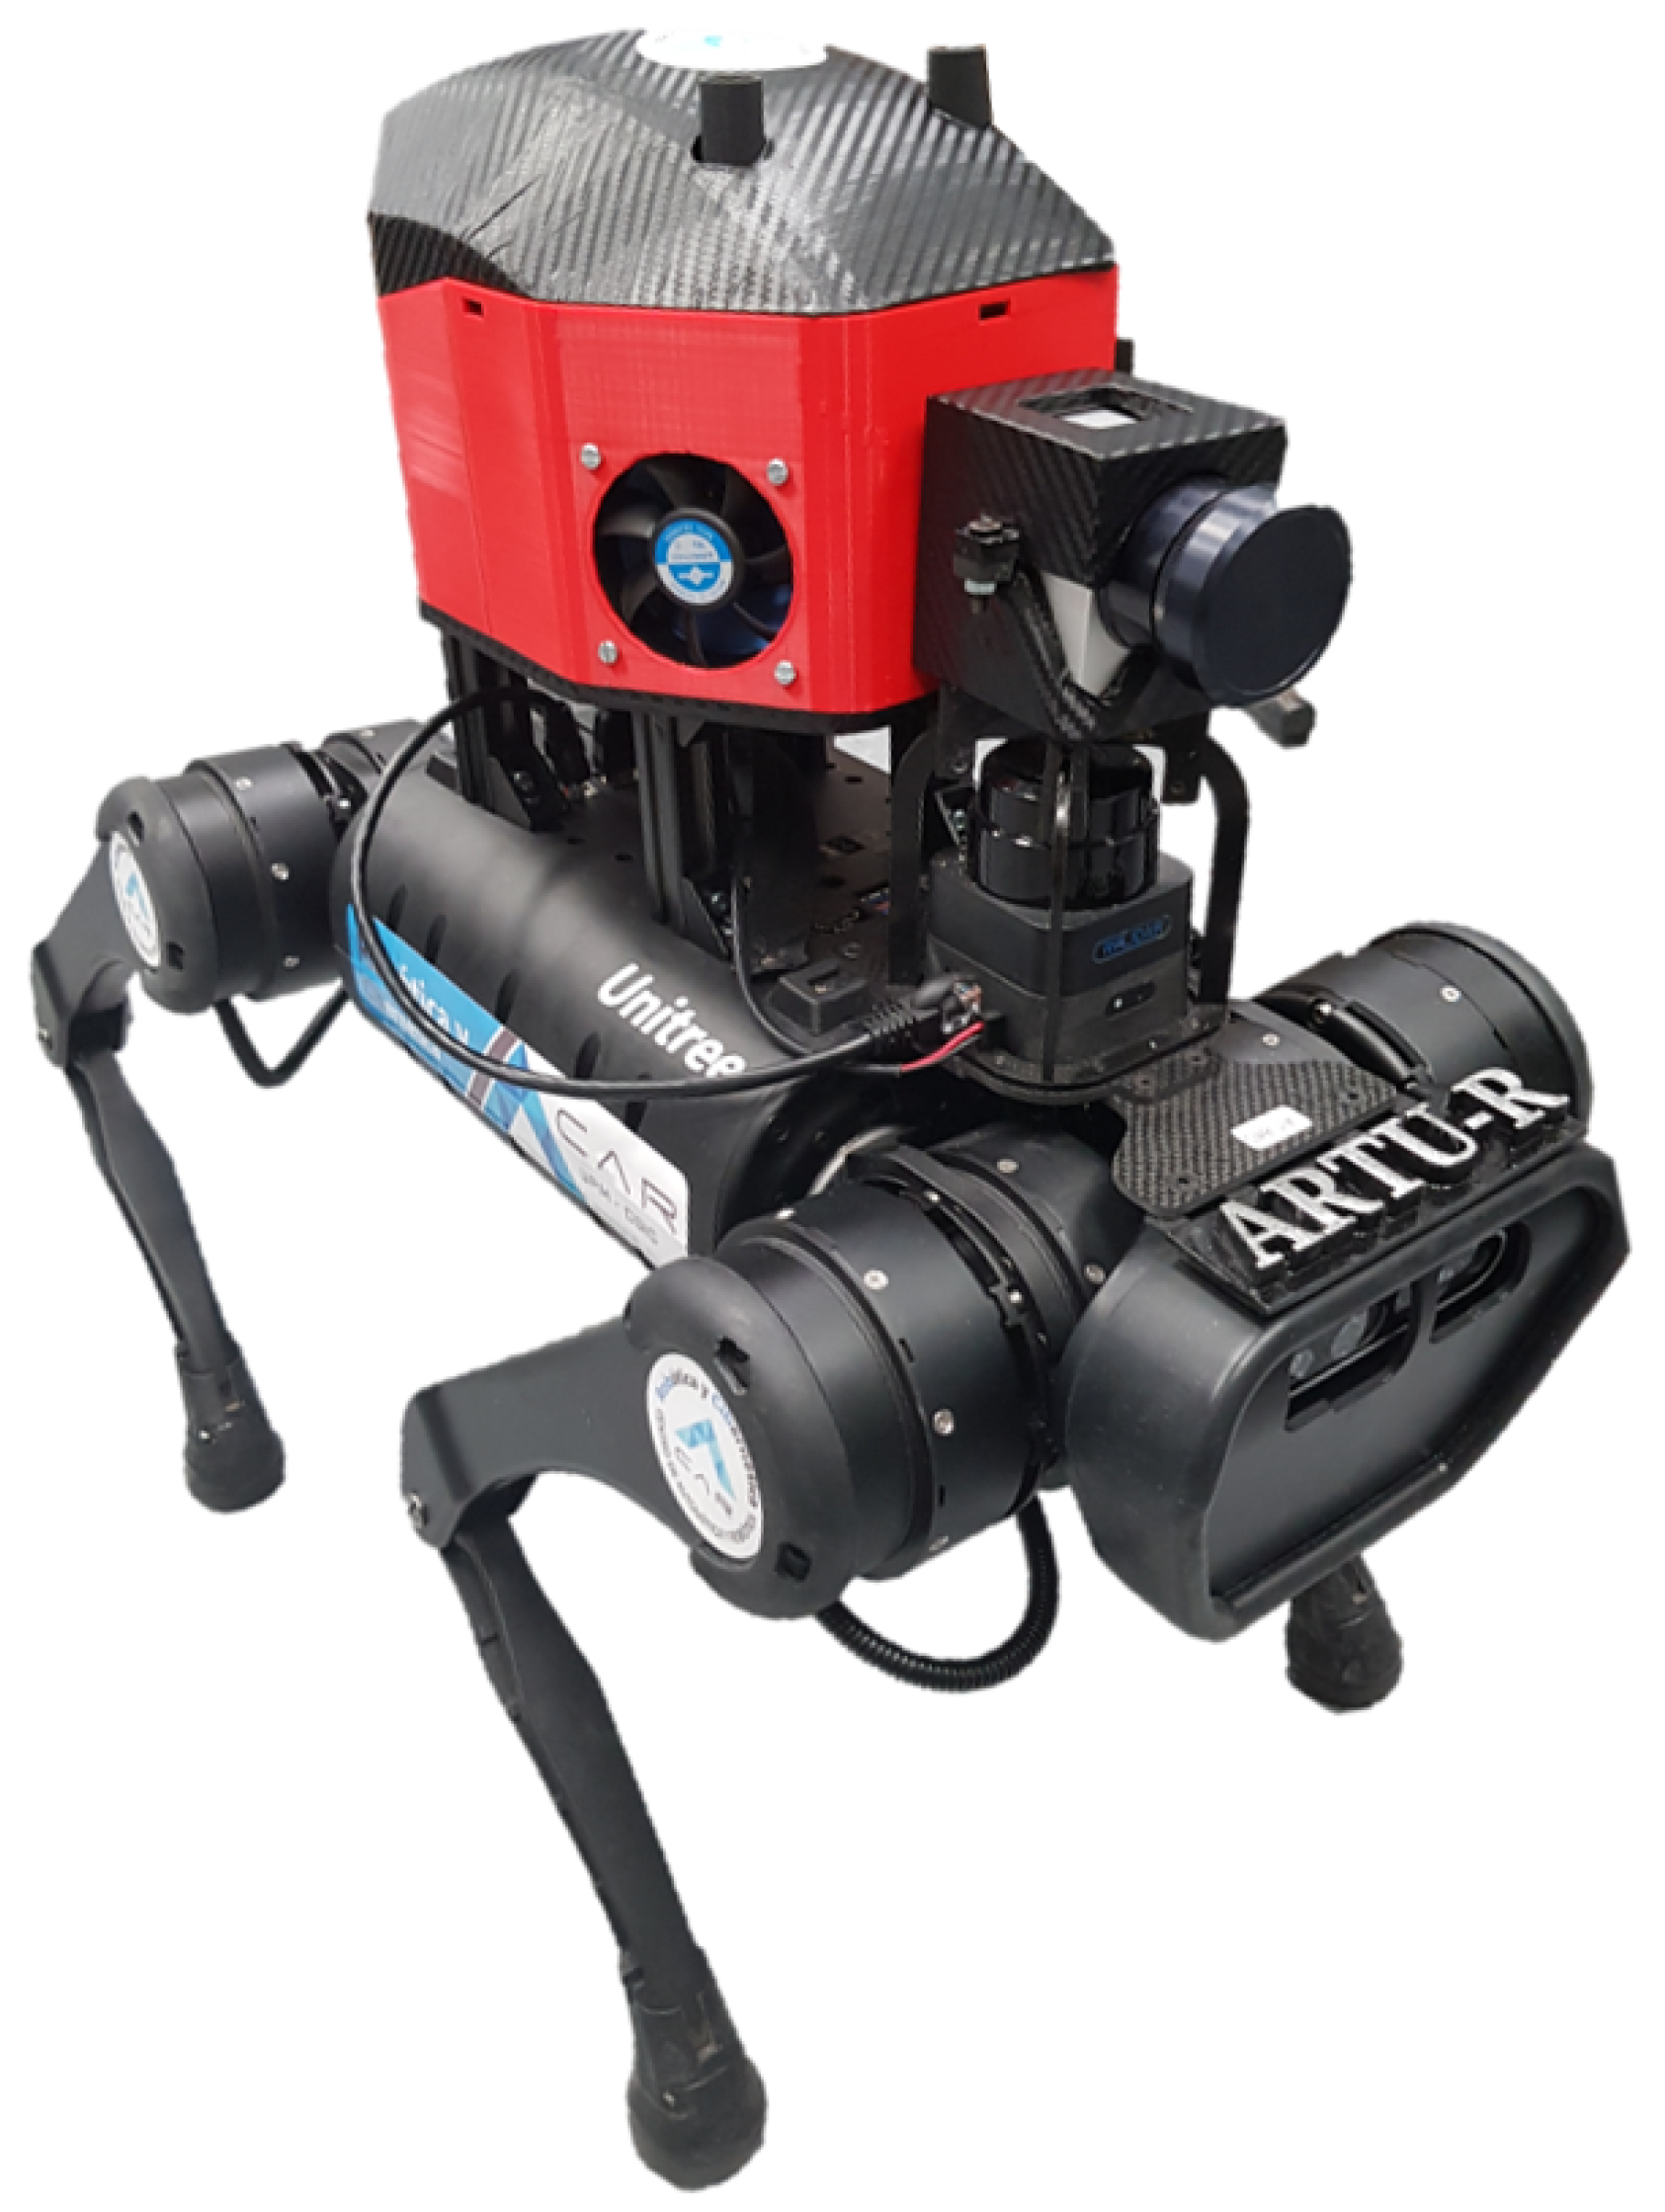
Figure 3a depicts one of the sealed spraying modules, highlighting the three components: (A) axial fan, (B) SGP30 sensor, and (C) outlet chamber for the analyzed air sample. This module is mechanically integrated into the overall structure, as detailed in
Figure 3b, illustrating the layer of electronic connections for the sensors and power systems towards the control and process management board.
Figure 3c shows an upper layer where the onboard computer (Jetson Xavier) is assembled for high-level process management and decision-making. Finally, a carbon fiber cover encloses the sensory system (
Figure 3d).
2.2. Robotic System Setup
The sensory system has been intricately integrated, both in terms of hardware and software, with the quadrupedal robot ARTU-R. This integration encompasses establishing power sources and the bidirectional flow of high-level control data between the sensory system and the central computer. The mechanical integration of the artificial nose into the quadrupedal robot is visually depicted in
Figure 4. This integration facilitates the interplay of the sensory apparatus with the robotic framework, enabling a synergistic fusion of sensory input and computational processing within the ARTU-R system.
Modular System Setup and Algorithms
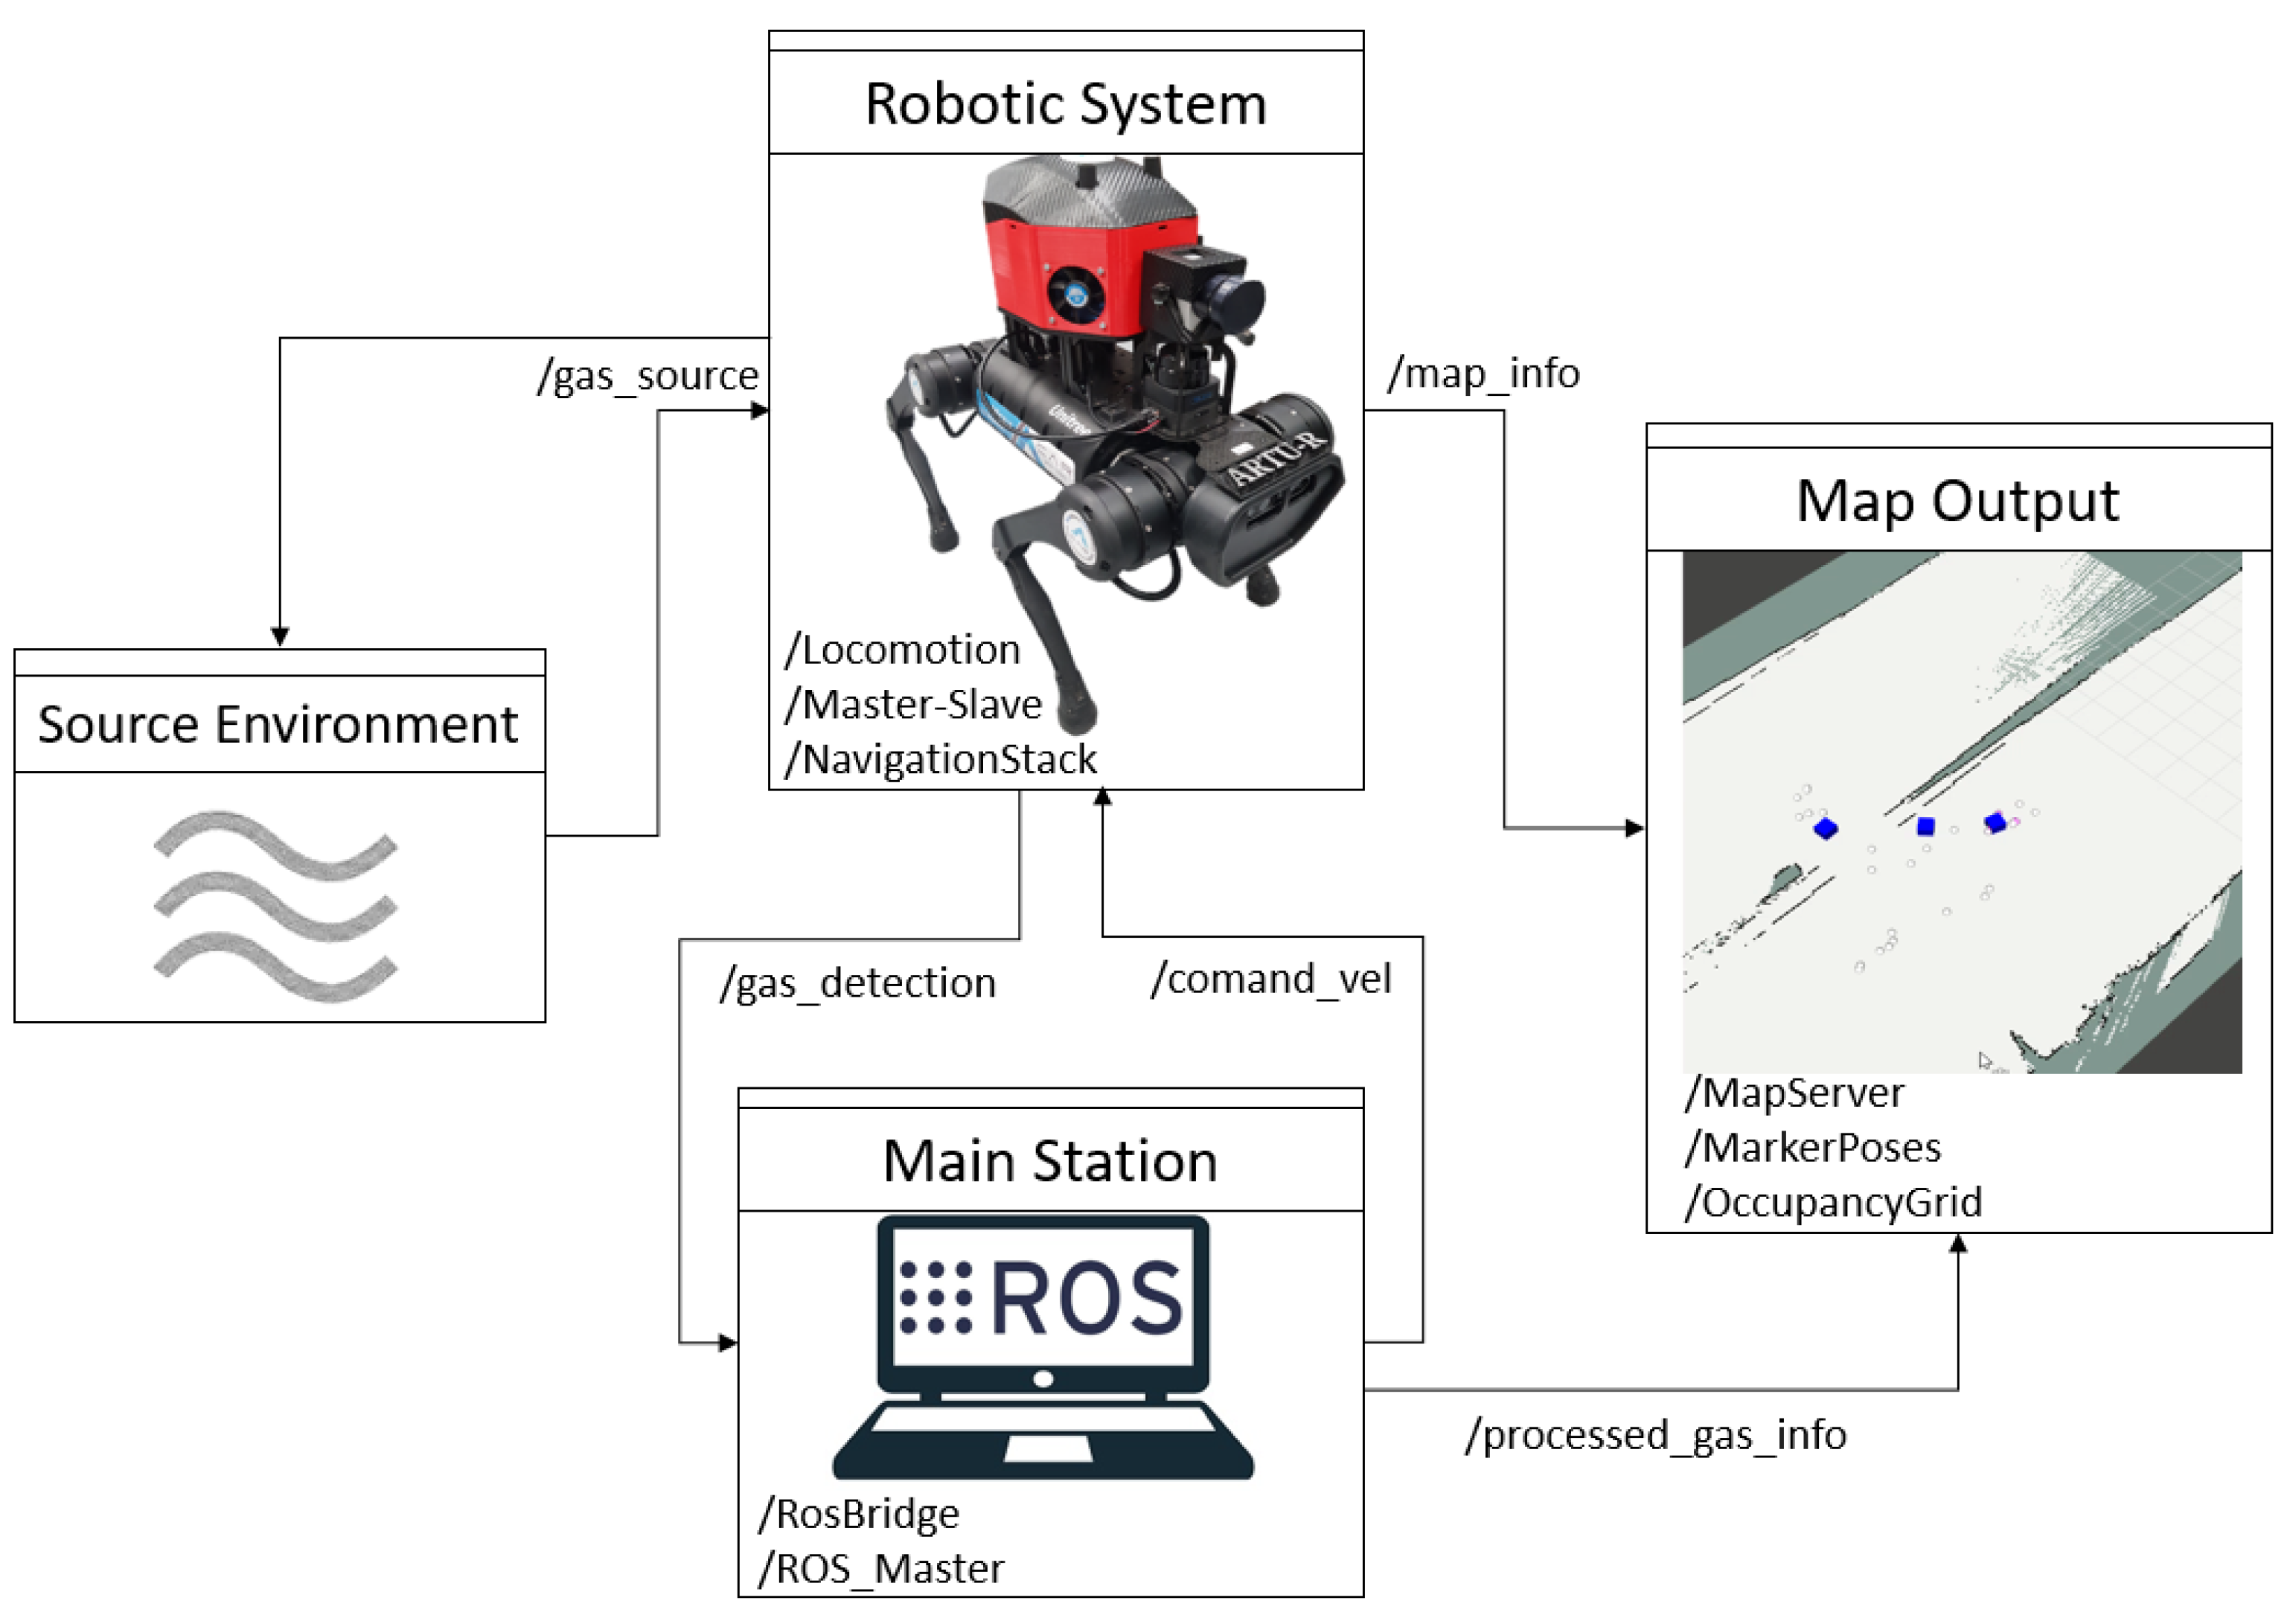
A modular architecture based on ROS has been developed for the functional implementation of the integral system, as described in
Figure 5. Two interdependent systems are primarily highlighted, both connected to a central system (Main Station) housed within the Jetson Xavier card on board the payload in the artificial nose. The Main Station is responsible for managing communications and sensor data acquisition, controlling the phases of the artificial nose for sample collection, and high-level process control for the robot’s mobility.
The second system is the quadruped robot, tasked with transporting the payload in the environment. It handles mapping processes using the lidar system, low-level gait pattern management, and the acquisition–transmission of visual data from thermal and RGB cameras. These visual data are utilized in the interface to provide a visual reference for the environmental state. The other two systems are related to mapping the CO2 concentration output, involving the generation of markers and gradients in the environment. Finally, there is the source environment, indicating where the air samples are taken and where they are returned.
The management of the entire system, as depicted in
Figure 5, is synthesized in Algorithm 1. This pseudocode encapsulates the primary tasks and functions executed during the mission’s operation. Of particular note is the periodic functionality for sampling, wherein the system performs periodic air sampling in the designated area. This involves activating and deactivating the artificial nose to facilitate the detection of CO
2, coupled with synthesis for generating a concentration map of the environmental gas.
| Algorithm 1 Gas Concentration Monitoring. |
- 1:
- 2:
- 3:
- 4:
- 5:
Thermal image - 6:
- 7:
- 8:
- 9:
function Global_Gas_Map() ▹ Gas Map Concentration - 10:
- 11:
generate - 12:
← - 13:
return - 14:
end function - 15:
while not do ▹ Main Loop - 16:
Robot Controller ← - 17:
for advance do - 18:
← time ▹ Air Data Acquisition - 19:
eval - 20:
if > then - 21:
← - 22:
end if - 23:
end for - 24:
if is then - 25:
mission ← end - 26:
end if - 27:
return - 28:
end while
|
Furthermore, the environmental exploration phase is meticulously conducted through controlled maneuvers. This involves the assignment of waypoints, defined by the operator, to guide the robot’s navigation within the environment. The systematic execution of these tasks ensures the comprehensive coverage and efficiency of the exploration process. The integration of these components in the described pseudocode exemplifies a coherent and systematic approach to the mission’s execution, emphasizing the precision and effectiveness of the implemented functionalities.
2.3. Field Tests
Test scenarios have been established to validate system performance through diverse exploration missions during the “XVI Jornadas Internacionales de la Universidad de Málaga sobre Seguridad, Emergencias y Catástrofes” in Malaga (36°43′2.0″ N–4°29′18.3″ W), focusing on outdoor environments that closely simulate post-disaster conditions. In these carefully delineated settings, various sources of CO
2 (smoke from burning paper) have been strategically positioned to emulate realistic scenarios. The experiments were conducted under summer conditions, with a humid environment resulting from water leaks through the walls. The tunnel had a floor composed of concrete with areas of mud and small water puddles. The approximate overall dimensions of the tunnel were 180 m in length by 7 m in width. Gas sources were strategically distributed, with higher concentrations at the tunnel’s center and one at its entrance. Notably, the field test was reconstructed as per the criteria set out by the National Institute of Standards and Technology (NIST) for the orange zone, characterized by moderate debris. This adherence to specified criteria enhances the rigor and relevance of the testing framework, ensuring that the system’s capabilities are evaluated under conditions representative of scenarios involving exploration in environments with moderate post-disaster debris.
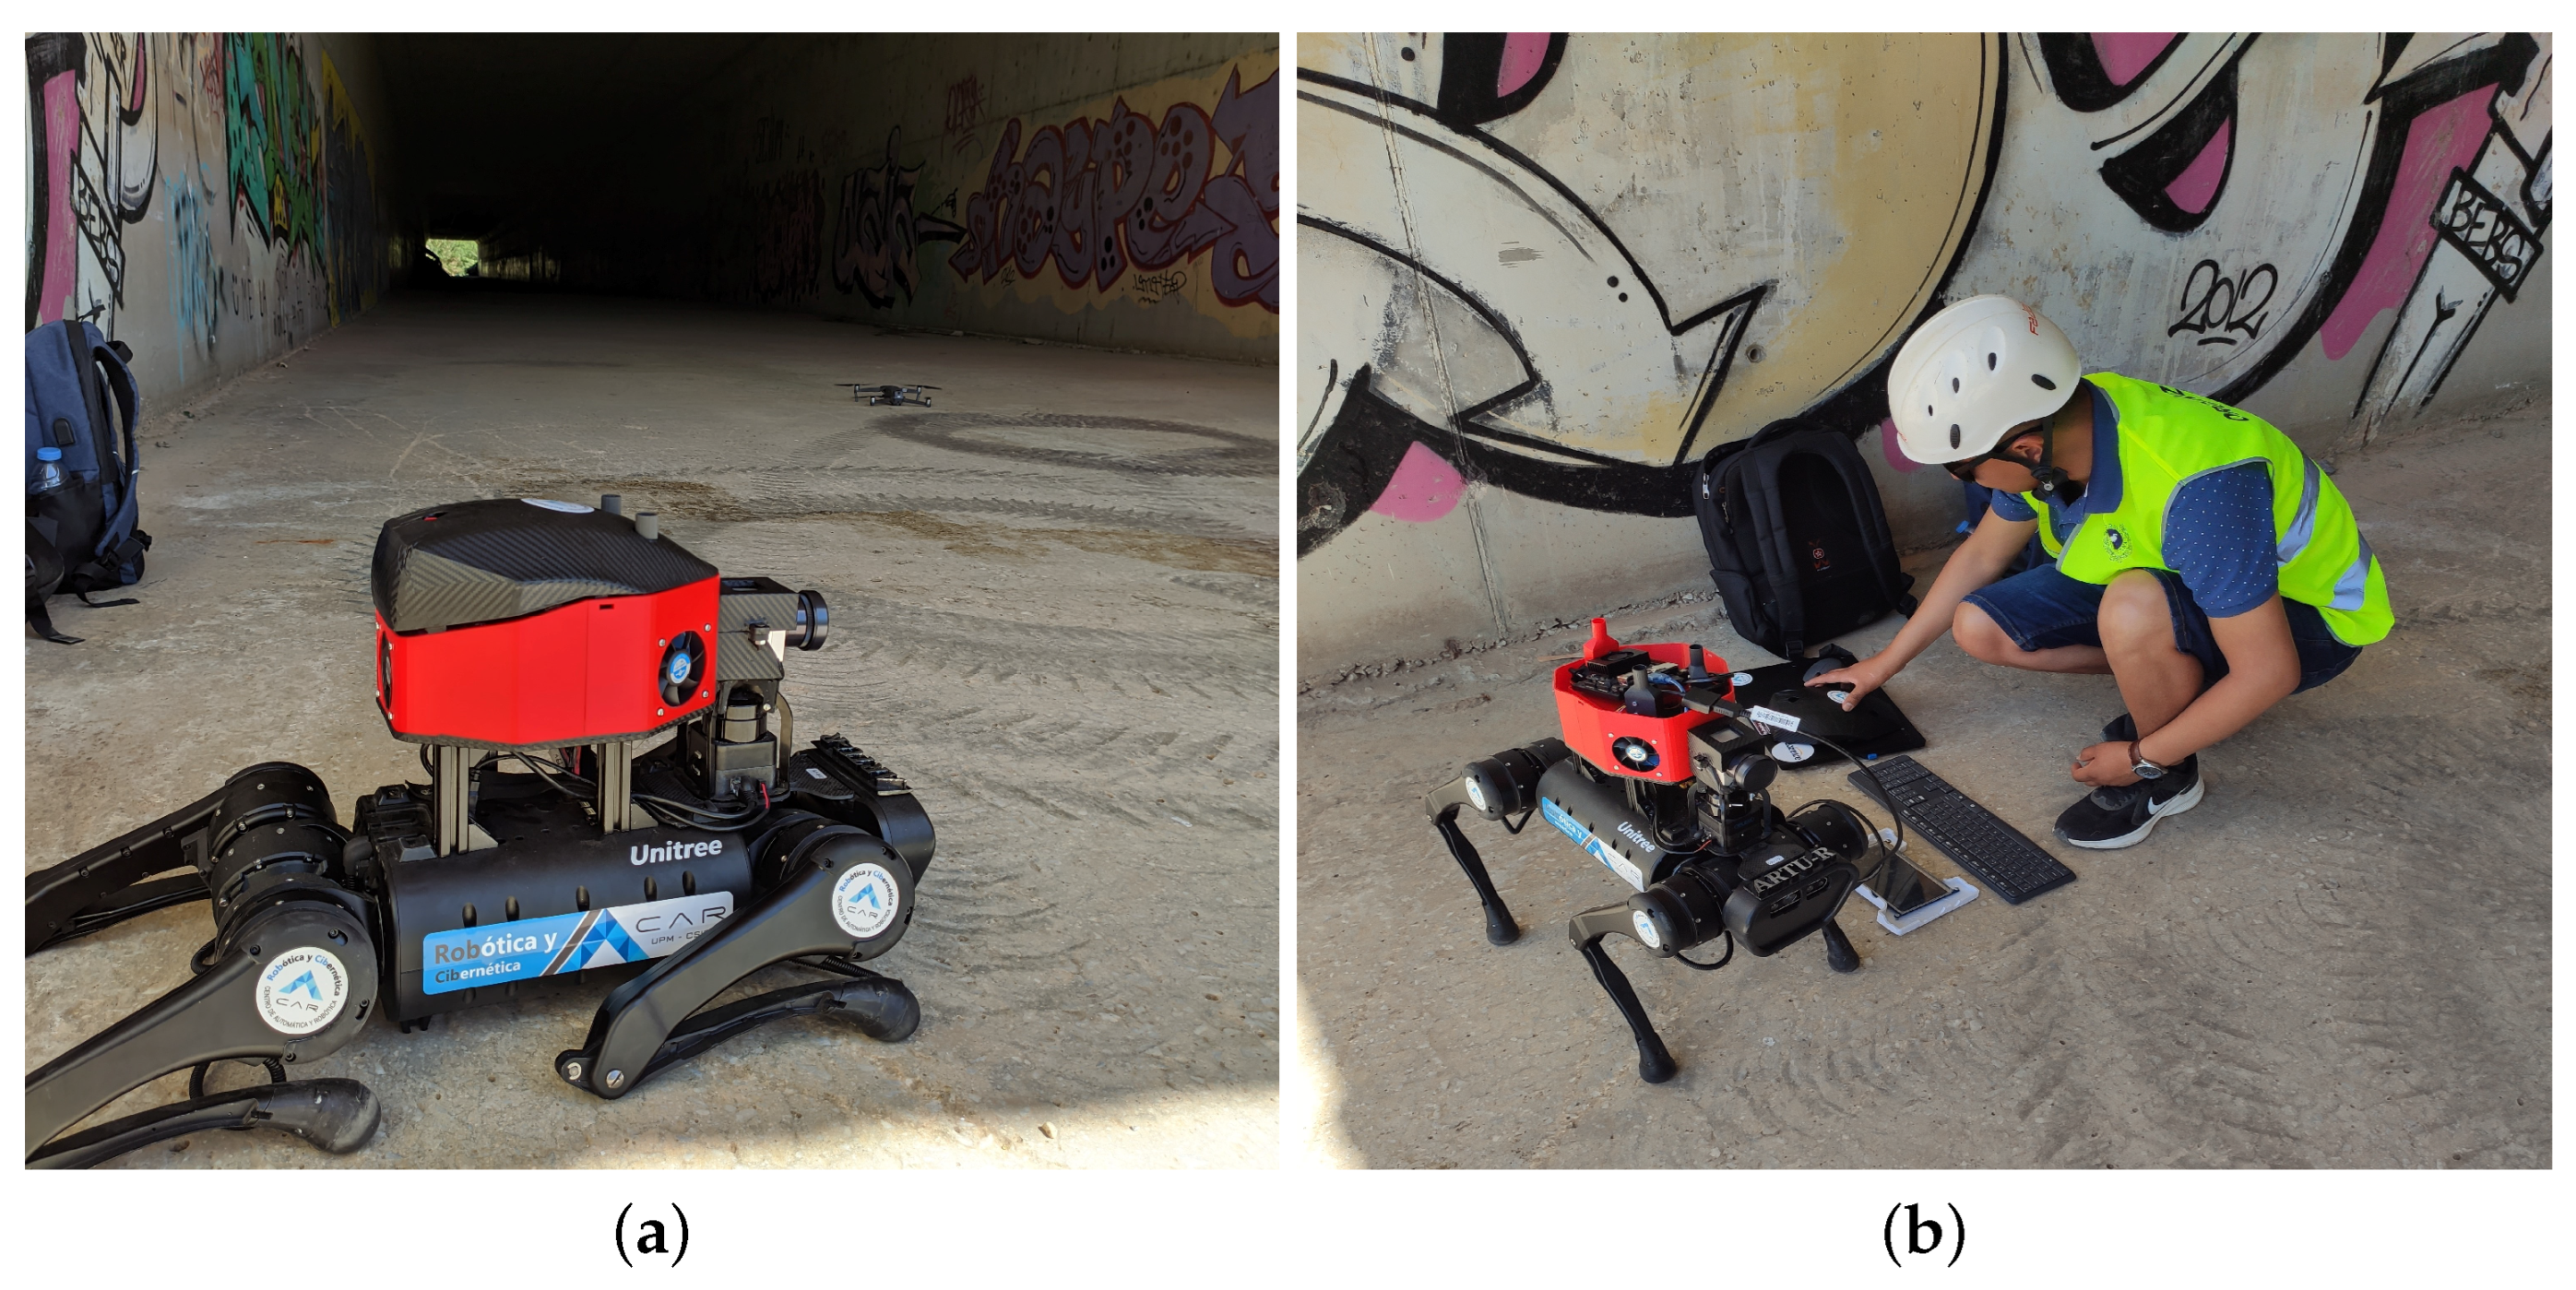
Figure 6 shows the different previous stages of the execution of the mission.
Laboratory tests were conducted on the CAR Arena Zona, located at Escuela Técnica Superior de Ingenieros Industriales de la Universidad Politécnica de Madrid (40°26′21.8″ N–3°41′17.3″ W), with an open area of 7 × 7 m. To mitigate potential hazards during the testing phase, the carbon dioxide (CO2) sources (smoke generated from the combustion of papers) were housed within metallic containers.
3. Results and Discussion
3.1. Environments Inspection Mission
The validation phase of the presented system involved analyzing a tunnel containing smoke sources, with a total of five repetitions and an additional five in laboratory conditions. This inspection procedure specifically entailed a comprehensive traversal from one end to the other, aimed at generating a concentration map of CO
2 within the environment. Further details regarding the testing phase are available for closer examination in the video provided in
Appendix B.
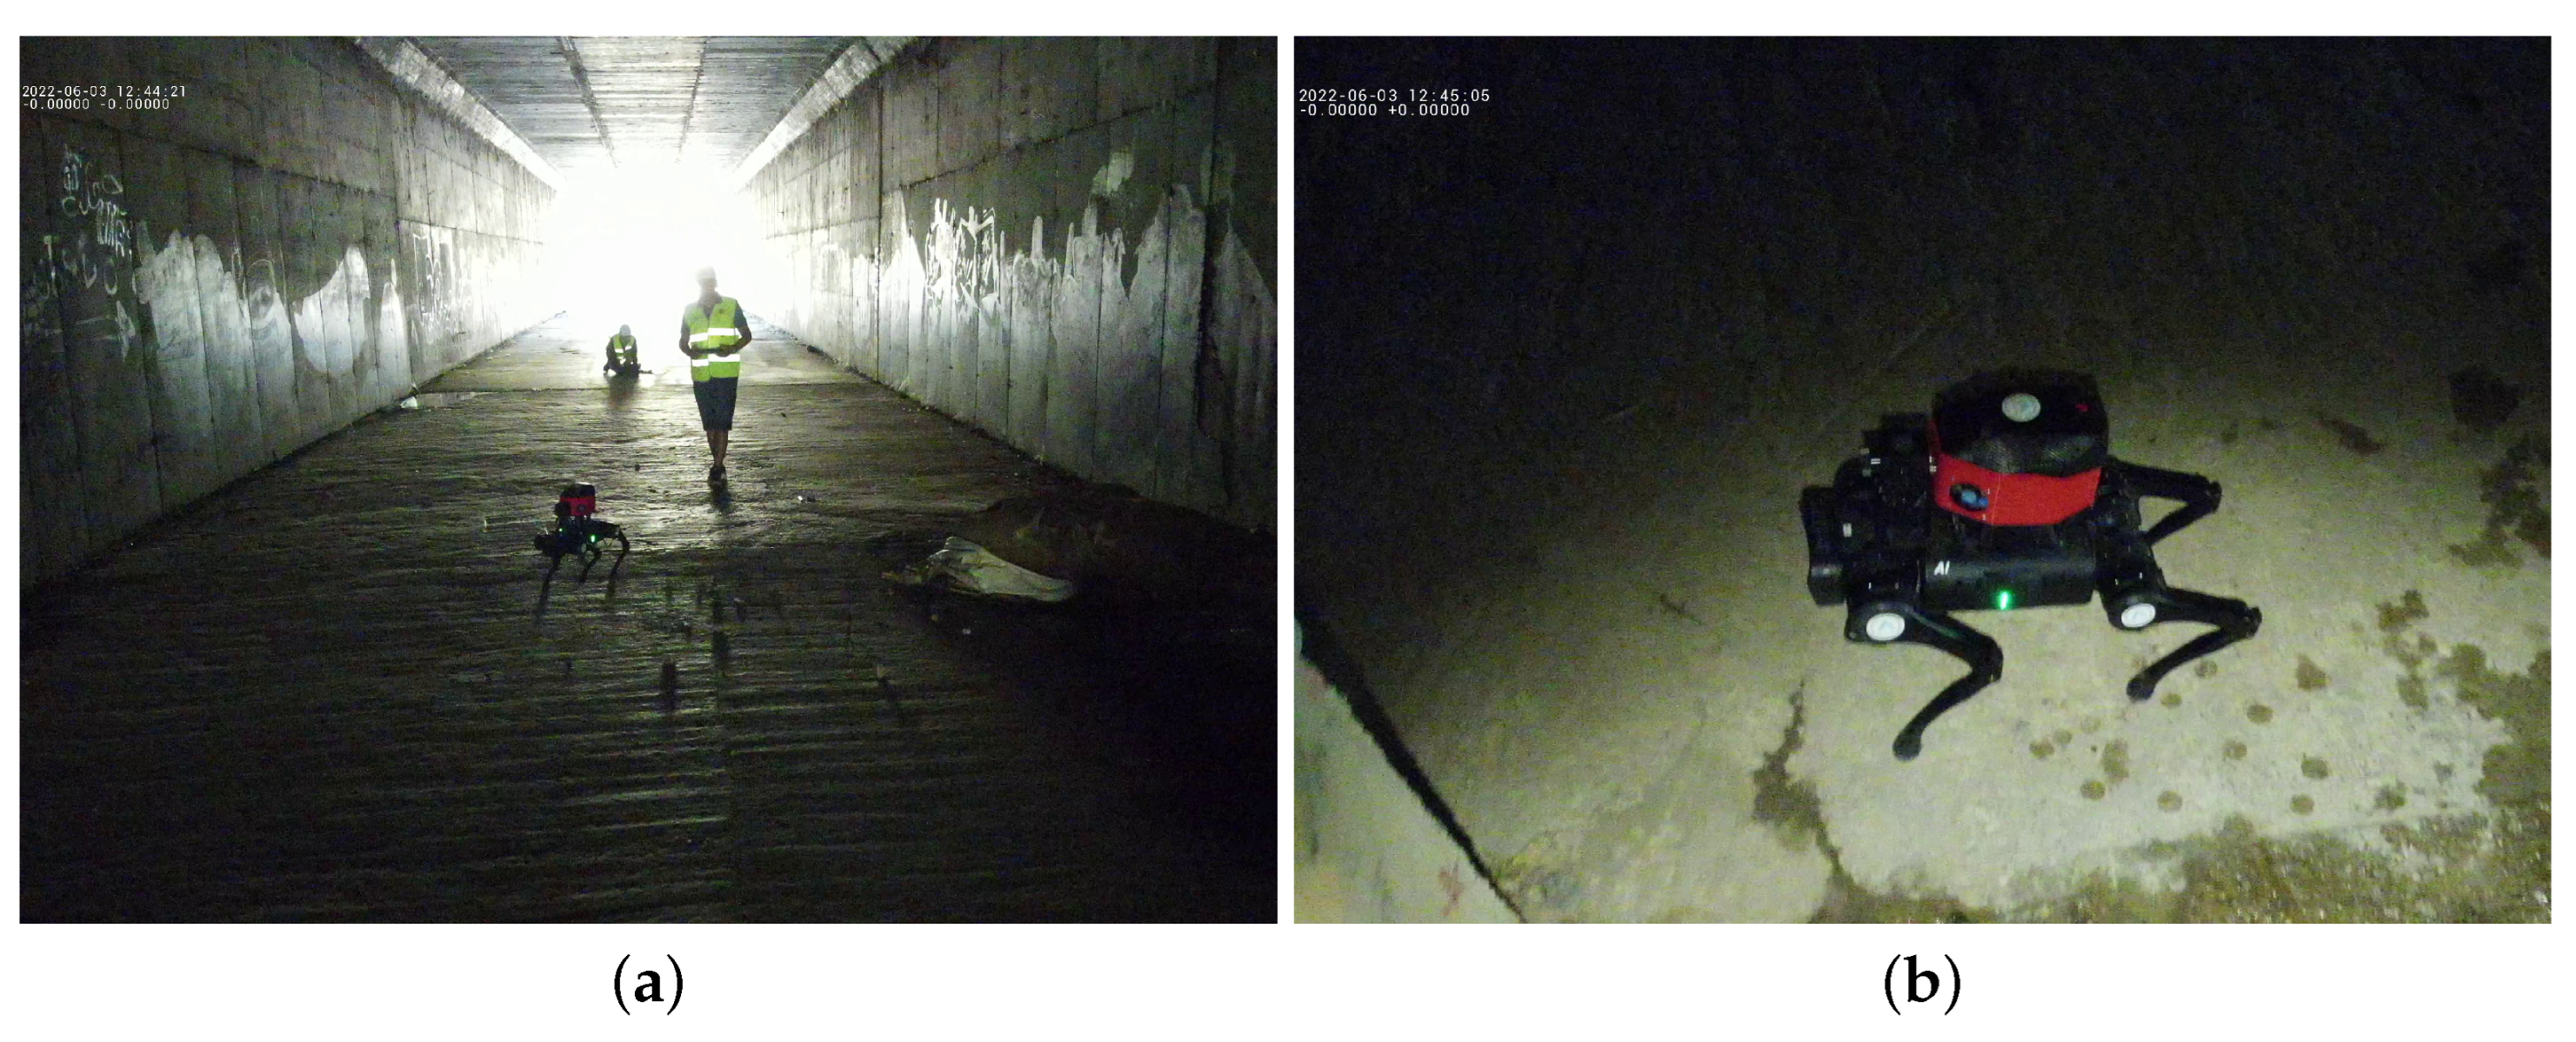
Figure 7a illustrates two first responders trailing the robot, with one of them assuming the role of mission guide through the remote interface. The robot facilitated data transmission from its central computer using a wireless network implemented within its system. Additionally,
Figure 7b offers a captured perspective from a drone within the tunnel, providing insights into the mission’s development.
3.2. Concentration Map Generated
CO
2 concentration mapping was achieved through the matplotlib libraries in Python. Using this method, the detection system systematically captures and stores environmental CO
2 measurements in an array during the progressive traversal of the robot, alongside the concurrent logging of their corresponding spatial coordinates. The resulting map undergoes dynamic real-time updates, presenting a dual visualization encompassing both gas concentration and cell occupancy maps. This visualization is seamlessly transmitted to a remote computing system facilitated by RVIZ. The deployment of markers within RVIZ highlights regions featuring heightened CO
2 detection levels. The comprehensive findings about CO
2 concentration maps and environmental maps within a tunnel setting exemplify
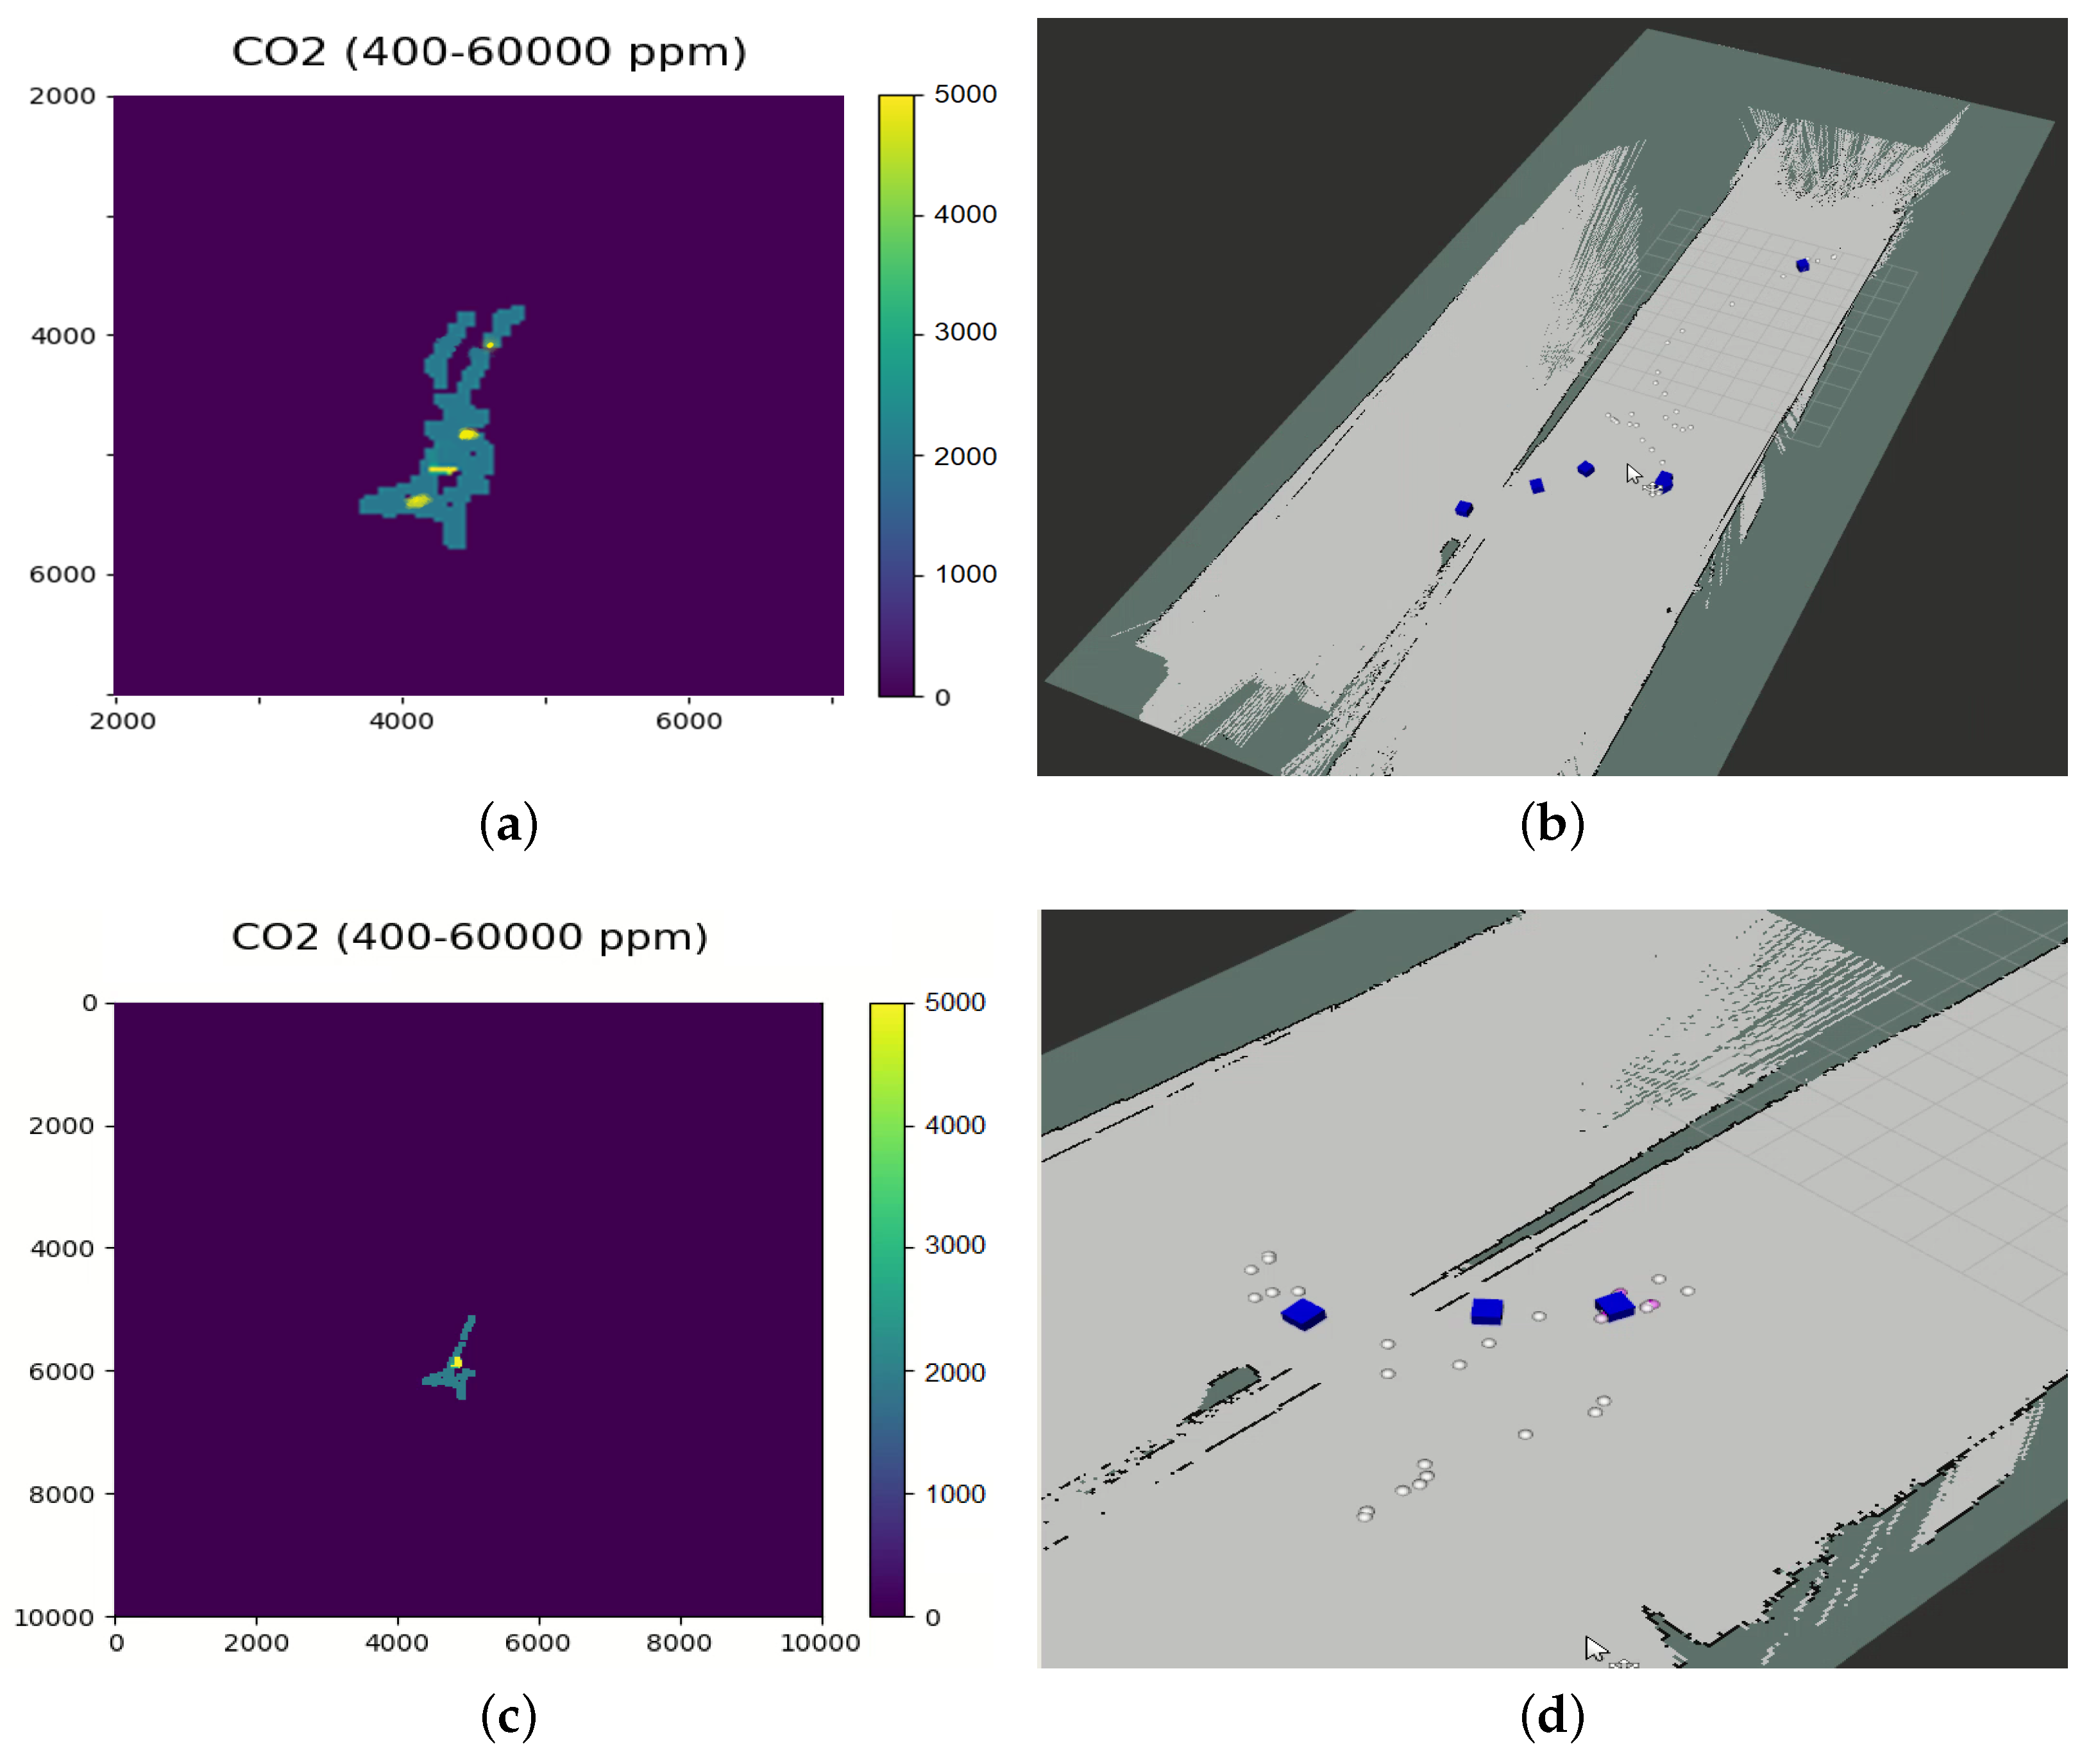
Figure 8, representing two strategically selected trials from the overall experimental series.
The initial trial results, depicted in
Figure 8a,b, elucidate the spatial distribution of CO
2 concentration throughout the explored zone. In the first scenario, the identification process reveals four primary CO
2 sources from the smoke generated during this testing phase. Georeferenced detections exhibit a high success rate. Additionally,
Figure 8b portrays the 2D map of the environment, featuring markers corresponding to the peaks of CO
2 concentrations (ppm > 5000). Although the system places five markers in this instance while detecting four concentration peaks, this discrepancy is attributed to the concentration map’s tendency to generate a gradient across the entire zone, effectively amalgamating two sources. However, the synthesis of identification aligns faithfully with reality.
Figure 8d presents the outcomes of another experimental trial, wherein three CO
2 sources have been precisely pinpointed.
Figure 8d successfully geolocates these sources with a high success rate on the 2D map. Meanwhile, the concentration map of the environment generalizes the three sources into a single dispersion gradient due to their proximity. Given these sources’ proximity, the maximum values of the detected peaks hover around 5000 ppm, with an average of 2000 ppm.
For the size of the map, a resolution of 100 pixels/meter for the displayed map is used, with a visible square marker of 20 × 20 pixels for each measurement. A 10,000 × 10,000 pixels map corresponds to 100 × 100 m with the origin at the center, with a scalable value according to the estimated exploring area.
The mean concentration of the sensors is normalized, and the concentration of CO
2 is shown in the green channel of an RGB-composed colour. To understand the risk that a high concentration of CO
2 produces in closed and open environments, the Spanish Regulation of Thermal Installations in Buildings (RITE) details four levels of air quality indoors [
21], which are detailed in
Table 2.
According to Spanish Normative NTP 549, of the Spanish National Institute of Safety and Hygiene at Work, a permitted established limit of 5000 ppm is allowed for outdoor environments, as the average for outdoor good quality air is around 300–400 ppm. It also details that the common values of CO
2 concentration during breathing are 30,000–40,000 ppm. Values higher than 30,000 ppm produce headaches, dizziness, drowsiness, and breathing problems [
22].
3.3. Evaluation Performance of the Artificial Nose
To verify the efficacy of the proposed method, particularly the efficiency of the artificial nostril for air aspiration to concentrate the maximum quantity towards the sensor and assess the measurement more reliably,
Table 3 displays the various tests conducted to evaluate the system. The initial five tests were performed under laboratory conditions. The latter five trials in the table were executed within the tunnel scenario.
The evaluation’s primary focus has been to accurately detect artificial sources distributed within the scenarios. Additionally, one of the most rigorous tests implemented to assess system functionality involves verifying the inhalation phase to obtain a more concentrated measurement of CO2 from the air. For this proposal, a measurement test was executed using both sensory systems to capture air and one of the sensors exposed to the outdoor environment, thereby evaluating the concentration of captured CO2 in parts per million (ppm). The results demonstrate a marked improvement in using the aspiration system compared to employing a sensor without aspiration, enhancing the sample quality by 61% compared to using an outdoor sensor. Furthermore, the accurate detection of CO2 sources was achieved with a success rate exceeding 92%.
3.4. Comparison with Related Works
Table 4 provides a comprehensive comparative analysis of the main current state-of-the-art works pertinent to the implemented method. This comparative assessment delves into an in-depth examination of the notable contributions made by the implemented approach in contrast to the most distinguished developments within the relevant research area. This analytical framework facilitates a nuanced understanding of the main contributions and advancements introduced by the implemented method, shedding light on its potential implications and significance in the broader scientific landscape.
The methodologies employed in the state-of-the-art related to algorithmic development, in conjunction with the work presented, reveal preceding stages of simulation in environments that emulate gas emission gradients to facilitate readings and map generation. Most implementations and studies do not undertake a prior efficiency study for placing gas sensors through Computational Fluid Dynamics (CFD) analyses.
It is essential to highlight, particularly in this comparative analysis, that the main works within the realm of the development and applicability of the proposed method, as represented in the state-of-the-art, lack systems enabling the acquisition and concentration of air from the surrounding environment within a specified radius. Most of these endeavours are confined to conducting singular point measurements of the air passing through the sensor at a given moment, resulting in pronounced measurement variability. This limitation necessitates arduous traversals to encompass more of the explored area.
Another salient point worthy of attention is that the systems implemented in
Table 4 lack a preliminary phase for designing and evaluating fluid dynamics concerning the payloads carried by the robots and their influence on the environment. This deficiency predominantly restricts these systems to a single sensor exposed at the front of the robot. This observation highlights the critical gap that the proposed method addresses, which incorporates a preliminary Computational Fluid Dynamics analysis for artificial nose design, ensuring optimal functionality and reliability in capturing environmental data within a defined range.
4. Conclusions
This paper presents a method for monitoring CO2 concentration in the environment by implementing a robotically instrumented artificial nose system. The system mimics the air intake of a quadruped mammal using aspersion mechanisms to generate more reliable measurements in the explored local zones. The key conclusions drawn from this development are as follows:
The design of the artificial nose, informed by Computational Fluid Dynamics analysis, has enabled the evaluation of the optimal range for air suction in the surrounding environment of the fifty-centimeter robot. This analysis ensures that the measured range generates high confidence in the captured results.
Sampling stages have been stablished for data collection (breathing, inhalation–exhalation) every 50 cm of robot traversal in the environment, optimizing the data capture and processing process. This approach minimizes the intrusion of environmental gas interactions.
The aspiration system has evidenced a substantial enhancement in measurement concentration, yielding more reliable readings by augmenting the parts per million (ppm) of CO2 by an average of 61% instead of conducting measurements solely with the sensor exposed to the environment. This improvement enables the omission of exhaustive exploration phases within the robot’s environment to acquire additional data, streamlining the traversal to a singular pass through the environment.
As demonstrated in the experimental testing phase in post-disaster environments, integrating the artificial nose as a payload on the quadruped robot resulted in a robotic system with high exploration capabilities in complex environments featuring unstructured terrain and poor lighting conditions. The system enriches environmental maps and identifies potential CO2 leaks.
The system can be applied for the early detection of live victims in contaminated scenarios, detecting the victim’s emitted CO2 that causes an anomaly in the measurements during a mission. Another application is in the pre-inspection in a post-disaster environment, advising human rescuers about hazardous zones with potential concentrations of toxic gases. In future works, one of the feasible enhancements is the reduction of the size of the system by implementing centrifugal fans and redistributing the location of the sensors in the sides of the torso of the quadruped. Aside from CO2, the sensor is capable of TVOC and ethanol measurements, which have the potential to be used for future research.
Author Contributions
Conceptualization, A.B., C.C.U., D.O. and J.d.C.; methodology, A.B. and C.C.U.; software, C.C.U. and D.O.; validation, C.C.U. and D.O.; formal analysis, C.C.U. and A.B.; investigation, C.C.U., A.B., D.O. and J.d.C.; resources, A.B. and J.d.C.; data curation, C.C.U. and D.O.; writing—original draft preparation, C.C.U., D.O. and J.d.C.; writing—review and editing, C.C.U., A.B. and D.O.; visualization, A.B. and J.d.C.; supervision, A.B. and J.d.C.; project administration, A.B. and J.d.C.; funding acquisition, A.B. and J.d.C. All authors have read and agreed to the published version of the manuscript.
Funding
This research has been possible thanks to the financing of TASAR (Team of Advanced Search And Rescue Robots), funded by “Proyectos de I+D+i del Ministerio de Ciencia, Innovacion y Universidades” (PID2019-105808RB-I00) and “Proyecto CollaborativE Search And Rescue robots 709 (CESAR)” (PID2022-142129OB-I00) founded by MCIN/AEI/10.13039/501100011033 and “ERDF A 710 way of making Europe”.
Data Availability Statement
Data are contained within the article.
Acknowledgments
We extend a special thanks to the colleagues at the LAENTIEC Laboratory at the University of Malaga who helped with some of the shots with the DJI Mavic drone.
Conflicts of Interest
The authors declare no conflicts of interest.
Abbreviations
The following abbreviations are used in this manuscript:
| ROS | Robot Operating System |
| CFD | Computational Fluid Dynamics |
| SAR | Search and Rescue |
| RVIZ | ROS Visualization |
| UGV | Unmanned Ground Vehicle |
| UAV | Unmanned Aerial Vehicle |
| CO2 | Carbon Dioxide |
| PPM | Particles Per Million |
| TASAR | Team of Advanced Search And Rescue Robots |
References
- Liu, Y.; Nejat, G. Robotic urban search and rescue: A survey from the control perspective. J. Intell. Robot. Syst. 2013, 72, 147–165. [Google Scholar] [CrossRef]
- Davids, A. Urban search and rescue robots: From tragedy to technology. IEEE Intell. Syst. 2002, 17, 81–83. [Google Scholar] [CrossRef]
- Yu, L.; Yang, E.; Ren, P.; Luo, C.; Dobie, G.; Gu, D.; Yan, X. Inspection Robots in Oil and Gas Industry: A Review of Current Solutions and Future Trends. In Proceedings of the 2019 25th International Conference on Automation and Computing (ICAC), Lancaster, UK, 5–7 September 2019; pp. 1–6. [Google Scholar] [CrossRef]
- Karkoub, M.; Bouhali, O.; Sheharyar, A. Gas Pipeline Inspection Using Autonomous Robots with Omni-Directional Cameras. IEEE Sens. J. 2021, 21, 15544–15553. [Google Scholar] [CrossRef]
- Roh, S.; Ryew, S.; Yang, J.; Choi, H. Actively steerable in-pipe inspection robots for underground urban gas pipelines. In Proceedings of the 2001 ICRA—IEEE International Conference on Robotics and Automation (Cat. No.01CH37164), Seoul, Republic of Korea, 21–26 May 2001; Volume 1, pp. 761–766. [Google Scholar] [CrossRef]
- Li, Z.; Yu, J.; Dong, D.; Yao, G.; Wei, G.; He, A.; Wu, H.; Zhu, H.; Huang, Z.; Tang, Z. E-nose based on a high-integrated and low-power metal oxide gas sensor array. Sens. Actuators B Chem. 2023, 380, 133289. [Google Scholar] [CrossRef]
- Su, Y.; Chen, S.; Liu, B.; Lu, H.; Luo, X.; Chen, C.; Li, W.; Long, Y.; Tai, H.; Xie, G.; et al. Maxwell displacement current induced wireless self-powered gas sensor array. Mater. Today Phys. 2023, 30, 100951. [Google Scholar] [CrossRef]
- Sunny, A.I.; Zhao, A.; Li, L.; Kanteh Sakiliba, S. Low-Cost IoT-Based Sensor System: A Case Study on Harsh Environmental Monitoring. Sensors 2021, 21, 214. [Google Scholar] [CrossRef] [PubMed]
- Sanger, J.B.; Sitanayah, L.; Ahmad, I. A Sensor-based Garbage Gas Detection System. In Proceedings of the 2021 IEEE 11th Annual Computing and Communication Workshop and Conference (CCWC), Las Vegas, NV, USA, 27–30 January 2021; pp. 1347–1353. [Google Scholar] [CrossRef]
- Chang, J.; Meng, H.; Li, C.; Gao, J.; Chen, S.; Hu, Q.; Li, H.; Feng, L. A wearable toxic gas-monitoring device based on triboelectric nanogenerator for self-powered aniline early warning. Adv. Mater. Technol. 2020, 5, 1901087. [Google Scholar] [CrossRef]
- van den Broek, J.; Abegg, S.; Pratsinis, S.E.; Güntner, A.T. Highly selective detection of methanol over ethanol by a handheld gas sensor. Nat. Commun. 2019, 10, 4220. [Google Scholar] [CrossRef]
- Emran, B.J.; Tannant, D.D.; Najjaran, H. Low-Altitude Aerial Methane Concentration Mapping. Remote Sens. 2017, 9, 823. [Google Scholar] [CrossRef]
- Francis, A.; Li, S.; Griffiths, C.; Sienz, J. Gas source localization and mapping with mobile robots: A review. J. Field Robot. 2022, 39, 1341–1373. [Google Scholar] [CrossRef]
- Rahardi, G.A.; Anam, K.; Chaidir, A.R.; Larasati, D.A. Navigation System for Olfactory Mobile Robot by Using Machine Vision System. In Proceedings of the 2021 IEEE 7th International Conference on Smart Instrumentation, Measurement and Applications (ICSIMA), Bandung, Indonesia, 23–25 August 2021; pp. 21–24. [Google Scholar] [CrossRef]
- Widyantara, H.; Rivai, M.; Purwanto, D. Gas Source Localization Using an Olfactory Mobile Robot Equipped with Wind Direction Sensor. In Proceedings of the 2018 International Conference on Computer Engineering, Network and Intelligent Multimedia (CENIM), Surabaya, Indonesia, 26–27 November 2018; pp. 66–70. [Google Scholar] [CrossRef]
- Horibe, J.; Ando, N.; Kanzaki, R. Insect Behavior as High-Sensitive Olfactory Sensor for Robotic Odor Tracking. In Biomimetic and Biohybrid Systems, Proceedings of the 8th International Conference, Living Machines 2019, Nara, Japan, 9–12 July 2019; Martinez-Hernandez, U., Vouloutsi, V., Mura, A., Mangan, M., Asada, M., Prescott, T.J., Verschure, P.F., Eds.; Springer International Publishing: Cham, Switzerland, 2019; pp. 183–192. [Google Scholar]
- Gaurav, K.; Kumar, A.; Kumar, R.; Bhondekar, A.P. Exploring Robot Behavior in Search of a Chemical Source. In Proceedings of the 2018 International Conference on Intelligent Autonomous Systems (ICoIAS), Singapore, 1–3 March 2018; pp. 146–149. [Google Scholar] [CrossRef]
- NIST. National Institute of Standards and Technology: Gaithersburg, MD, USA, 2022. Available online: https://www.nist.gov/ (accessed on 28 January 2024).
- Jiang, C.; Soh, Y.C.; Li, H. Sensor and CFD data fusion for airflow field estimation. Appl. Therm. Eng. 2016, 92, 149–161. [Google Scholar] [CrossRef]
- Löhner, R.; Camelli, F. Optimal placement of sensors for contaminant detection based on detailed 3D CFD simulations. Eng. Comput. 2005, 22, 260–273. [Google Scholar] [CrossRef]
- Órgano Ministerio de la Presidencia. Real Decreto 1027/2007, de 20 de Julio, Por el Que se Aprueba el Reglamento de Instalaciones Térmicas en los Edificios. 2022. Available online: https://noticias.juridicas.com/base_datos/Admin/rd1027-2007.html (accessed on 28 January 2024).
- Ministerio de Trabajo y Asuntos Sociales España. NTP 549: El Dióxido de Carbono en la Evaluación de la Calidad del Aire Interior. 2000. Available online: https://www.insst.es/documents/94886/327064/ntp_549.pdf/e9364a82-6f1b-4590-90e0-1d08b22e1074 (accessed on 28 January 2024).
- He, Y.; Cheng, L.; Pan, Y.; Li, Y.; Wang, D.; Zheng, H. Multi-sensory Olfactory Quadruped Robot for Odor Source Localization. In Proceedings of the 2022 IEEE International Conference on Cyborg and Bionic Systems (CBS), Wuhan, China, 24–26 March 2023; pp. 332–335. [Google Scholar] [CrossRef]
- Suárez, M.C.R.; Álvarez, S.N.; León-Rodríguez, H. Bio-Inspired Quadruped Robot for Detection Carbon Dioxide in the Air. Available online: https://clawar.org/wp-content/uploads/2020/08/CLAWAR_2018_paper_21.pdf (accessed on 28 January 2024).
- Xing, Y.; Vincent, T.A.; Fan, H.; Schaffernicht, E.; Hernandez Bennetts, V.; Lilienthal, A.J.; Cole, M.; Gardner, J.W. FireNose on Mobile Robot in Harsh Environments. IEEE Sens. J. 2019, 19, 12418–12431. [Google Scholar] [CrossRef]
- Cheng, L.; Xie, Z.; Qin, X.; Tang, D.; Li, L.; He, Y. A mobile sensing system for future gas mapping in confined space using an olfactory quadruped robot. Measurement 2023, 213, 112654. [Google Scholar] [CrossRef]
- Muñoz Martinez, C.J.; Castro Salguero, R.; Palomares, R.; Cornejo, J. Mechatronics Development of Terrestrial Mobile Robot for Exploring and Monitoring Environmental Parameters at Mine Analogue Sites using IoT Platform. In Proceedings of the 2020 IEEE XXVII International Conference on Electronics, Electrical Engineering and Computing (INTERCON), Lima, Peru, 3–5 September 2020; pp. 1–4. [Google Scholar] [CrossRef]
- Rossi, M.; Brunelli, D.; Adami, A.; Lorenzelli, L.; Menna, F.; Remondino, F. Gas-Drone: Portable gas sensing system on UAVs for gas leakage localization. In Proceedings of the 2014 IEEE SENSORS, Valencia, Spain, 2–5 November 2014; pp. 1431–1434. [Google Scholar] [CrossRef]
- Wei, G.; Gardner, J.W.; Cole, M.; Xing, Y. Multi-sensor module for a mobile robot operating in harsh environments. In Proceedings of the 2016 IEEE SENSORS, Orlando, FL, USA, 30 October–3 November 2016; pp. 1–3. [Google Scholar] [CrossRef]
- Wang, R.; Veloso, M.; Seshan, S. Active sensing data collection with autonomous mobile robots. In Proceedings of the 2016 IEEE International Conference on Robotics and Automation (ICRA), Stockholm, Sweden, 16–21 May 2016; pp. 2583–2588. [Google Scholar] [CrossRef]
- Roldán, J.J.; Joossen, G.; Sanz, D.; Del Cerro, J.; Barrientos, A. Mini-UAV Based Sensory System for Measuring Environmental Variables in Greenhouses. Sensors 2015, 15, 3334–3350. [Google Scholar] [CrossRef] [PubMed]
- Álvarez, S.N.; Rojas, M.C.; Rodriguez, H.L. Walking Robot Bio-inspired by Insect’s Locomotion for Carbon Dioxide Diagnostic Indexed in the Air. In Proceedings of the ICINCO (2), Porto, Portugal, 29–31 July 2018; pp. 490–496. [Google Scholar]
- Kanwar, M.; Agilandeeswari, L. IOT Based Fire Fighting Robot. In Proceedings of the 2018 7th International Conference on Reliability, Infocom Technologies and Optimization (Trends and Future Directions) (ICRITO), Orlando, FL, USA, 30 October–3 November 2018; pp. 718–723. [Google Scholar] [CrossRef]
- Jin, M.; Liu, S.; Schiavon, S.; Spanos, C. Automated mobile sensing: Towards high-granularity agile indoor environmental quality monitoring. Build. Environ. 2018, 127, 268–276. [Google Scholar] [CrossRef]
- Azzarelli, J.M.; Mirica, K.A.; Ravnsbæk, J.B.; Swager, T.M. Wireless gas detection with a smartphone via rf communication. Proc. Natl. Acad. Sci. USA 2014, 111, 18162–18166. [Google Scholar] [CrossRef] [PubMed]
- Yang, Y.; Liu, J.; Wang, W.; Cao, Y.; Li, H. Incorporating SLAM and mobile sensing for indoor CO2 monitoring and source position estimation. J. Clean. Prod. 2021, 291, 125780. [Google Scholar] [CrossRef]
- Evita, M.; Zakiyyatuddin, A.; Seno, S.; Kumalasari, R.; Lukado, H.; Djamal, M. Development of a robust mobile robot for volcano monitoring application. J. Phys. Conf. Ser. 2020, 1572, 012016. [Google Scholar] [CrossRef]
- Xing, Y.; Vincent, T.A.; Cole, M.; Gardner, J.W.; Fan, H.; Bennetts, V.H.; Schaffernicht, E.; Lilienthal, A.J. Mobile robot multi-sensor unit for unsupervised gas discrimination in uncontrolled environments. In Proceedings of the 2017 IEEE SENSORS, Glasgow, UK, 29 October–1 November 2017; pp. 1–3. [Google Scholar] [CrossRef]
- Neumann, P.P.; Kohlhoff, H.; Hüllmann, D.; Lilienthal, A.J.; Kluge, M. Bringing Mobile Robot Olfaction to the next dimension—UAV- based remote sensing of gas clouds and source localization. In Proceedings of the 2017 IEEE International Conference on Robotics and Automation (ICRA), Singapore, 29 May–3 June 2017; pp. 3910–3916. [Google Scholar] [CrossRef]
- Ojeda, P.; Monroy, J.; Gonzalez-Jimenez, J. A Simulation Framework for the Integration of Artificial Olfaction into Multi-Sensor Mobile Robots. Sensors 2021, 21, 2041. [Google Scholar] [CrossRef]
- Ojeda, P.; Monroy, J.; Gonzalez-Jimenez, J. VGR Dataset: A CFD-based Gas Dispersion Dataset for Mobile Robotic Olfaction. J. Intell. Robot. Syst. 2023, 109, 75. [Google Scholar] [CrossRef]
| Disclaimer/Publisher’s Note: The statements, opinions and data contained in all publications are solely those of the individual author(s) and contributor(s) and not of MDPI and/or the editor(s). MDPI and/or the editor(s) disclaim responsibility for any injury to people or property resulting from any ideas, methods, instructions or products referred to in the content. |
© 2024 by the authors. Licensee MDPI, Basel, Switzerland. This article is an open access article distributed under the terms and conditions of the Creative Commons Attribution (CC BY) license (https://creativecommons.org/licenses/by/4.0/).


